Abstract
To study the normal section crack resistance of pre-stressed steel-reinforced concrete simply supported composite beams, the specific parameters such as the component steel content, the reinforcement ratio of non-pre-stressed and pre-stressed bars, and the section size of simply supported beams, are designed with different sections and reinforcement. Given the relatively poor bond property between steel and concrete, by introducing the bond property reduction coefficient, the formula for calculating the average crack spacing of pre-stressed steel-concrete simply supported composite beams is modified. Through the analysis of test data, the influence coefficient of concrete self-elongation between cracks on crack width is obtained, and the formula for calculating average crack width reflecting the characteristics of pre-stressed steel-concrete simply supported composite beams is obtained. The value of the expansion coefficient considering the uneven distribution of cracks is obtained by the crack distribution curve and the formula for calculating the crack width of pre-stressed steel concrete composite beams is given. The actual average crack spacing of the 5 pre-stressed steel-concrete simply supported beams in this test is 106.04 mm, which is calculated according to the above formula. The average value of the ratio between the calculated value and the measured value is 0.916, the standard deviation is 0.059, and the coefficient of variation is 0.064. The average value of calculated and measured crack widths of the beams is 0.927, the standard deviation is 0.194, and the coefficient of variation is 0.209.
1. Introduction
Pre-stressed steel-reinforced concrete (PSRC) members have high bending strength and overall uniformity, which can greatly reduce the section size and weight of reinforced concrete beams and facilitate engineering applications in the case of large spans and large loads [1,2]. This type of component can provide sufficient safety in complex external environments while extending the service life of concrete structures and reducing the economic cost of structures during service. When applied in practical engineering, PSRC composite beam structure can withstand large plastic deformation, thus improving the dynamic performance, and seismic and impact resistance of the structure.
The engineering experiment research method is the most effective for the mechanical properties of a new building structure. The flexural property of the PSRC beam is the most basic mechanical property. Many researchers have carried out test research on the flexural performance of PSRC beam members. The formulas for calculating the load-carrying capacity and crack control of PSRC beams are obtained through experiments. Baek-II et al. [3] determined the load-carrying capacity of nine kinds of beams with different sections, studied their internal stress distribution, and compared to the test results, obtained the calculation method of the load-carrying capacity and cracks of PSRC beams. Singh et al. [4] simulated the bending properties and crack control of PSRC beams with different parameters and compared the experimental results to the simulation results, thus verifying the reliability of ABAQUS. Chen et al. [5] tested the flexural performance of PSRC beams with different reinforcement content through experiments. Based on the analysis of test data, a formula for calculating the load-carrying capacity of the PSRC beam is presented. Liu et al. [6] obtained the calculation method of the normal section bending capacity of PSRC beams by studying the flexural performance of PSRC beams. By comparing the experimental results to the calculated data, the rationality and accuracy of the calculation formula are further confirmed. Qiu et al. [7] designed a reinforced concrete beam with added fibers. By using different reinforcement ratios, fiber types, and fiber length-diameter ratios, the flexural properties of reinforced concrete beams are studied experimentally, and the calculation method for the flexural properties of reinforced concrete beams is presented.
At present, the formulas for calculating the bending capacity of PSRC beam structure in normal sections introduced in the relevant literature at home and abroad mainly include the hypothesis method of flat-section and the superposition method. The flat-section assumption method is based on the design method of reinforced concrete beams, which assumes that steel and concrete work together completely. The superposition method includes the simple superposition method and the general superposition method. The simple superposition method is to simply add the bending property of the steel inside the PSRC beam and the bending property of the reinforced concrete inside the PSRC beam. The general superposition law is different from the simple superposition method. Taking PSRC beam members as an example, for the given load value, according to the force balance equation, arbitrarily assign the load borne by the steel section and the reinforced concrete section and obtain the bending capacity of the corresponding steel section and the reinforced concrete section respectively. Under various load distribution ratios, the maximum value of the sum of the flexural load-carrying capacity of the steel section and the reinforced concrete section is the flexural load-carrying capacity of the PSRC beams under the load. Compared to the traditional concrete beam calculation method, this method is more reliable and accurate. Engineering practice has proved that the general superposition method for structural force calculation can greatly reduce the calculation workload [7].
Deng et al. [8] studied the stress of PSRC beams through experiments. It focuses on the reinforcement ratio of non-pre-stressed reinforcement and pre-stressed reinforcement, the reinforcement ratio of steel section, effective pre-stress, the height of pre-stressed reinforcement, the position of steel, and whether the pre-stressed reinforcement is bonded. The influence of these parameters on the load-carrying capacity and deflection of PSRC beams is studied by comparing the finite element software data to the test results. Rossi et al. [9] analyzed four kinds of steel with different mechanical properties through experimental research. The influence of section, unconstrained length, and reinforcement content on the load-carrying capacity of the member were studied. Nie et al. [10] analyzed the load-carrying capacity of PSRC continuous composite beams. Based on the theory of unbonded pre-stressed concrete structure, the calculation formula of unbonded pre-stressed concrete continuous beam under symmetric concentrated load was determined. The comparison between the calculated results and the experimental results shows that the model provides a good numerical simulation for the nonlinear behavior of pre-stressed continuous composite beams.
In recent years, the theoretical analyses of the load-carrying mechanism and mechanical properties of PSRC composite structure systems are few, and the research on crack control of PSRC structure and seismic performance of pre-stressed steel concrete structures is insufficient. Only a preliminary attempt has been made on the PSRC composite structure form, and there is no theoretical basis, analysis, and design method to guide engineering application, and no corresponding specification [11]. At present, although there is little research on PSRC beams, the research on steel-reinforced concrete composite beams without prestressing tendons has been relatively mature, which is an important basis for us to study the performance of PSRC composite beams in all aspects. Based on the experimental data of mechanical properties and crack analysis of PSRC composite beams, the traditional method is improved. By comparing it to the experimental data, the consistency of the test and calculation method for the crack of the PSRC composite beam is verified. In this paper, based on the test of PSRC simply supported composite beams, the deformation development is investigated, and the crack calculation formula of the beam is presented. The crack resistance parameters of PSRC composite beams mainly include concrete strength and performance, section size, effective pre-stress, bond strength between H-shaped steel and concrete, etc. It is found that there are many calculation theories of normal section load-carrying capacity of PSRC simply supported composite beams, but there is insufficient research on the control standards and checking methods of cracks and deformation. In this paper, the formula for calculating the crack of PSRC beams is verified by experiments, and the influence coefficients of the crack spacing and width of PSRC beams are given.
2. Materials and Methods
PSRC beams are poured with high-performance self-compacting concrete. Use a 60-litre capacity forced mixer. The main raw materials used for self-compacting concrete are 42.5 ordinary Portland cement, Natural medium sand, particle grading is zone I, fineness modulus is 3.0; Basalt gravel particle size 5–20 mm, continuous grading, the particle size of the gravel does not exceed 20 mm; Grade 1 fly ash produced by Heilongjiang Shuangda Power Equipment Group; Polyfusate superplasticizer produced by Beijing Xika Company. The quality mix ratio is shown in Table 1.

Table 1.
The main material composition of concrete.
The compressive strength of concrete cubes and prisms is obtained by pressing specimens on a universal test machine. The test pieces were made according to the technical specifications for the application of self-compacting concrete (T/CECS 203-2021) [12]. The dimensions of the cube specimen are 100 × 100 × 100 mm. The dimensions of the prismatic specimen are 100 × 100 × 300 mm.
The internal steel of the PSRC beam is made of H-shaped steel with steel grade Q235, HRB335 steel bar for longitudinal reinforcement, and HPB235 steel bar for stirrup. The yield strength, ultimate strength yield strain, and other physical and mechanical properties of steel bars and shapes are shown in Table 2.
Table 2.
The main material composition of concrete (N/mm2).
2.1. Design and Preparation of PSRC Beam Specimen
In this experiment, a total of 5 PSRC simply supported composite beams were made. The total length of each beam is 4.7 m, and the calculated span is 4.5 m. Three section sizes are used, respectively 210 × 280 mm, 235 × 410 mm, and 260 × 330 mm. The basic parameters of the beam are shown in Table 3. After the test beam pouring is completed, the prestress tension is carried out. The test beam is tensioned by the post-tensioning method and is a bonded pre-stressed member. The bundle shape of the strand is a parabola, and the anchor is a single-hole clip anchor. In the test, a manual jack with a sensor is used to stretch the pre-stressed tendons. After the tensioning is completed, the test beam is grouting.
Table 3.
List of basic parameters of the PSRC beams (mm).
The H-shaped steel in the PSRC beam is arranged in the center of a PSRC beam section. In addition, the shear section is equipped with a sufficient amount of truss reinforcement and stirrup to ensure that the slope section of the beam will not be damaged due to insufficient shear capacity during the test. The section, reinforcement, and structure details of the PSRC beams are shown in Figure 1.
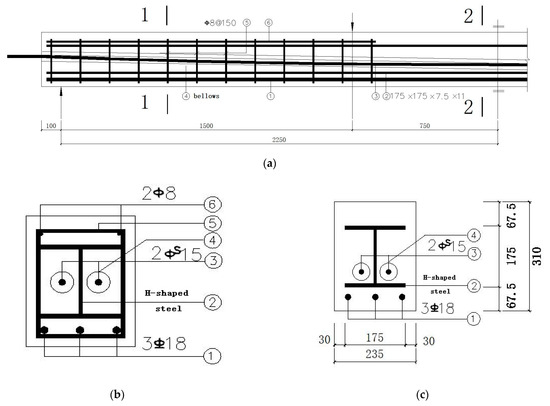
Figure 1.
PSRC test beam cross-section reinforcement diagram. (a) Reinforcement and construction details; (b) 1-1; (c) 2-2.
2.2. Experimental Loading
According to the content to be tested in the test, the rubber-based resistance strain gauge with the standard distance of 1 mm is arranged at the longitudinal steel bar and the H-shaped steel flange in the pure bend section of the PSRC beam. A paper-based resistance strain gauge with a standard distance of 120 mm is arranged on the upper surface of concrete in the pure bend section of the PSRC beam. Seven displacement sensors with a measuring range of 30 mm are arranged on one side of the compressed concrete in the pure bend section of the PSRC beam.
Before the formal loading, the load smaller than the theoretical load-carrying capacity of the PSRC beam and the calculated cracking load value are repeatedly applied step by step to check whether the loading equipment and instruments are working normally. After verifying that all devices are working properly, uninstall them and start loading them.
The PSRC test beam is loaded in a graded system, and each stage load is 10 percent of the ultimate load of the PSRC test beam. That is, the load increment of each stage under normal loading is determined to be 10 kN. After the load reaches 80 percent of the crack load estimate of the PSRC test beam, the load value of each stage is 2.5 kN. When the test beam cracks, the normal load is restored. When the load reaches 80 percent of the estimated yield load of the inner steel flange of the control section in the middle span of the PSRC test beam, the load increment of each stage is 2.5 kN. After confirming that the mid-span tension longitudinal bar has reached yield, normal loading is resumed. After loading to the ultimate load estimate of the test beam, the load increment of each stage is 2.5 kN. Then it is slowly loaded until the test beam is damaged. Each stage is loaded for one minute. During the loading process, the longitudinal tension bar, the upper and lower flange strain gauge, and displacement sensor data are collected under each load stage. After the crack of the test beam, the crack widths under different loads in the pure bend section and the main crack widths in the shear span section were read with the magnifiers 100 and 24 times. The development of each crack was recorded at the same time, and the crack distribution map was drawn on the test beam. After the test beam is damaged draw the crack distribution map to scale on the paper.
2.3. Experimental Process
Because of the three-point symmetric loading method adopted in this test, the bending moment of the beam in the mid-span pure bend section is the largest. The test equipment includes a bench, reaction frame, jack, resistance strain gauge, dial indicator, reading magnifier, etc. The PSRC beam is supported on a pedestal, and the load is applied through a jack. The mid-span deflection of the test beam is measured by a dial indicator, the crack spacing is measured by a ruler, and the crack width is measured by a reading magnifier. Load L-1 to L-5, respectively. This paper describes L-3 as an example. The north side of the PSRC test beam is the frontside, and the opposite south side is the backside. The load value refers to the load imposed by the two loading jacks respectively, that is, it does not include the PSRC test beam weight and the load equipment weight.
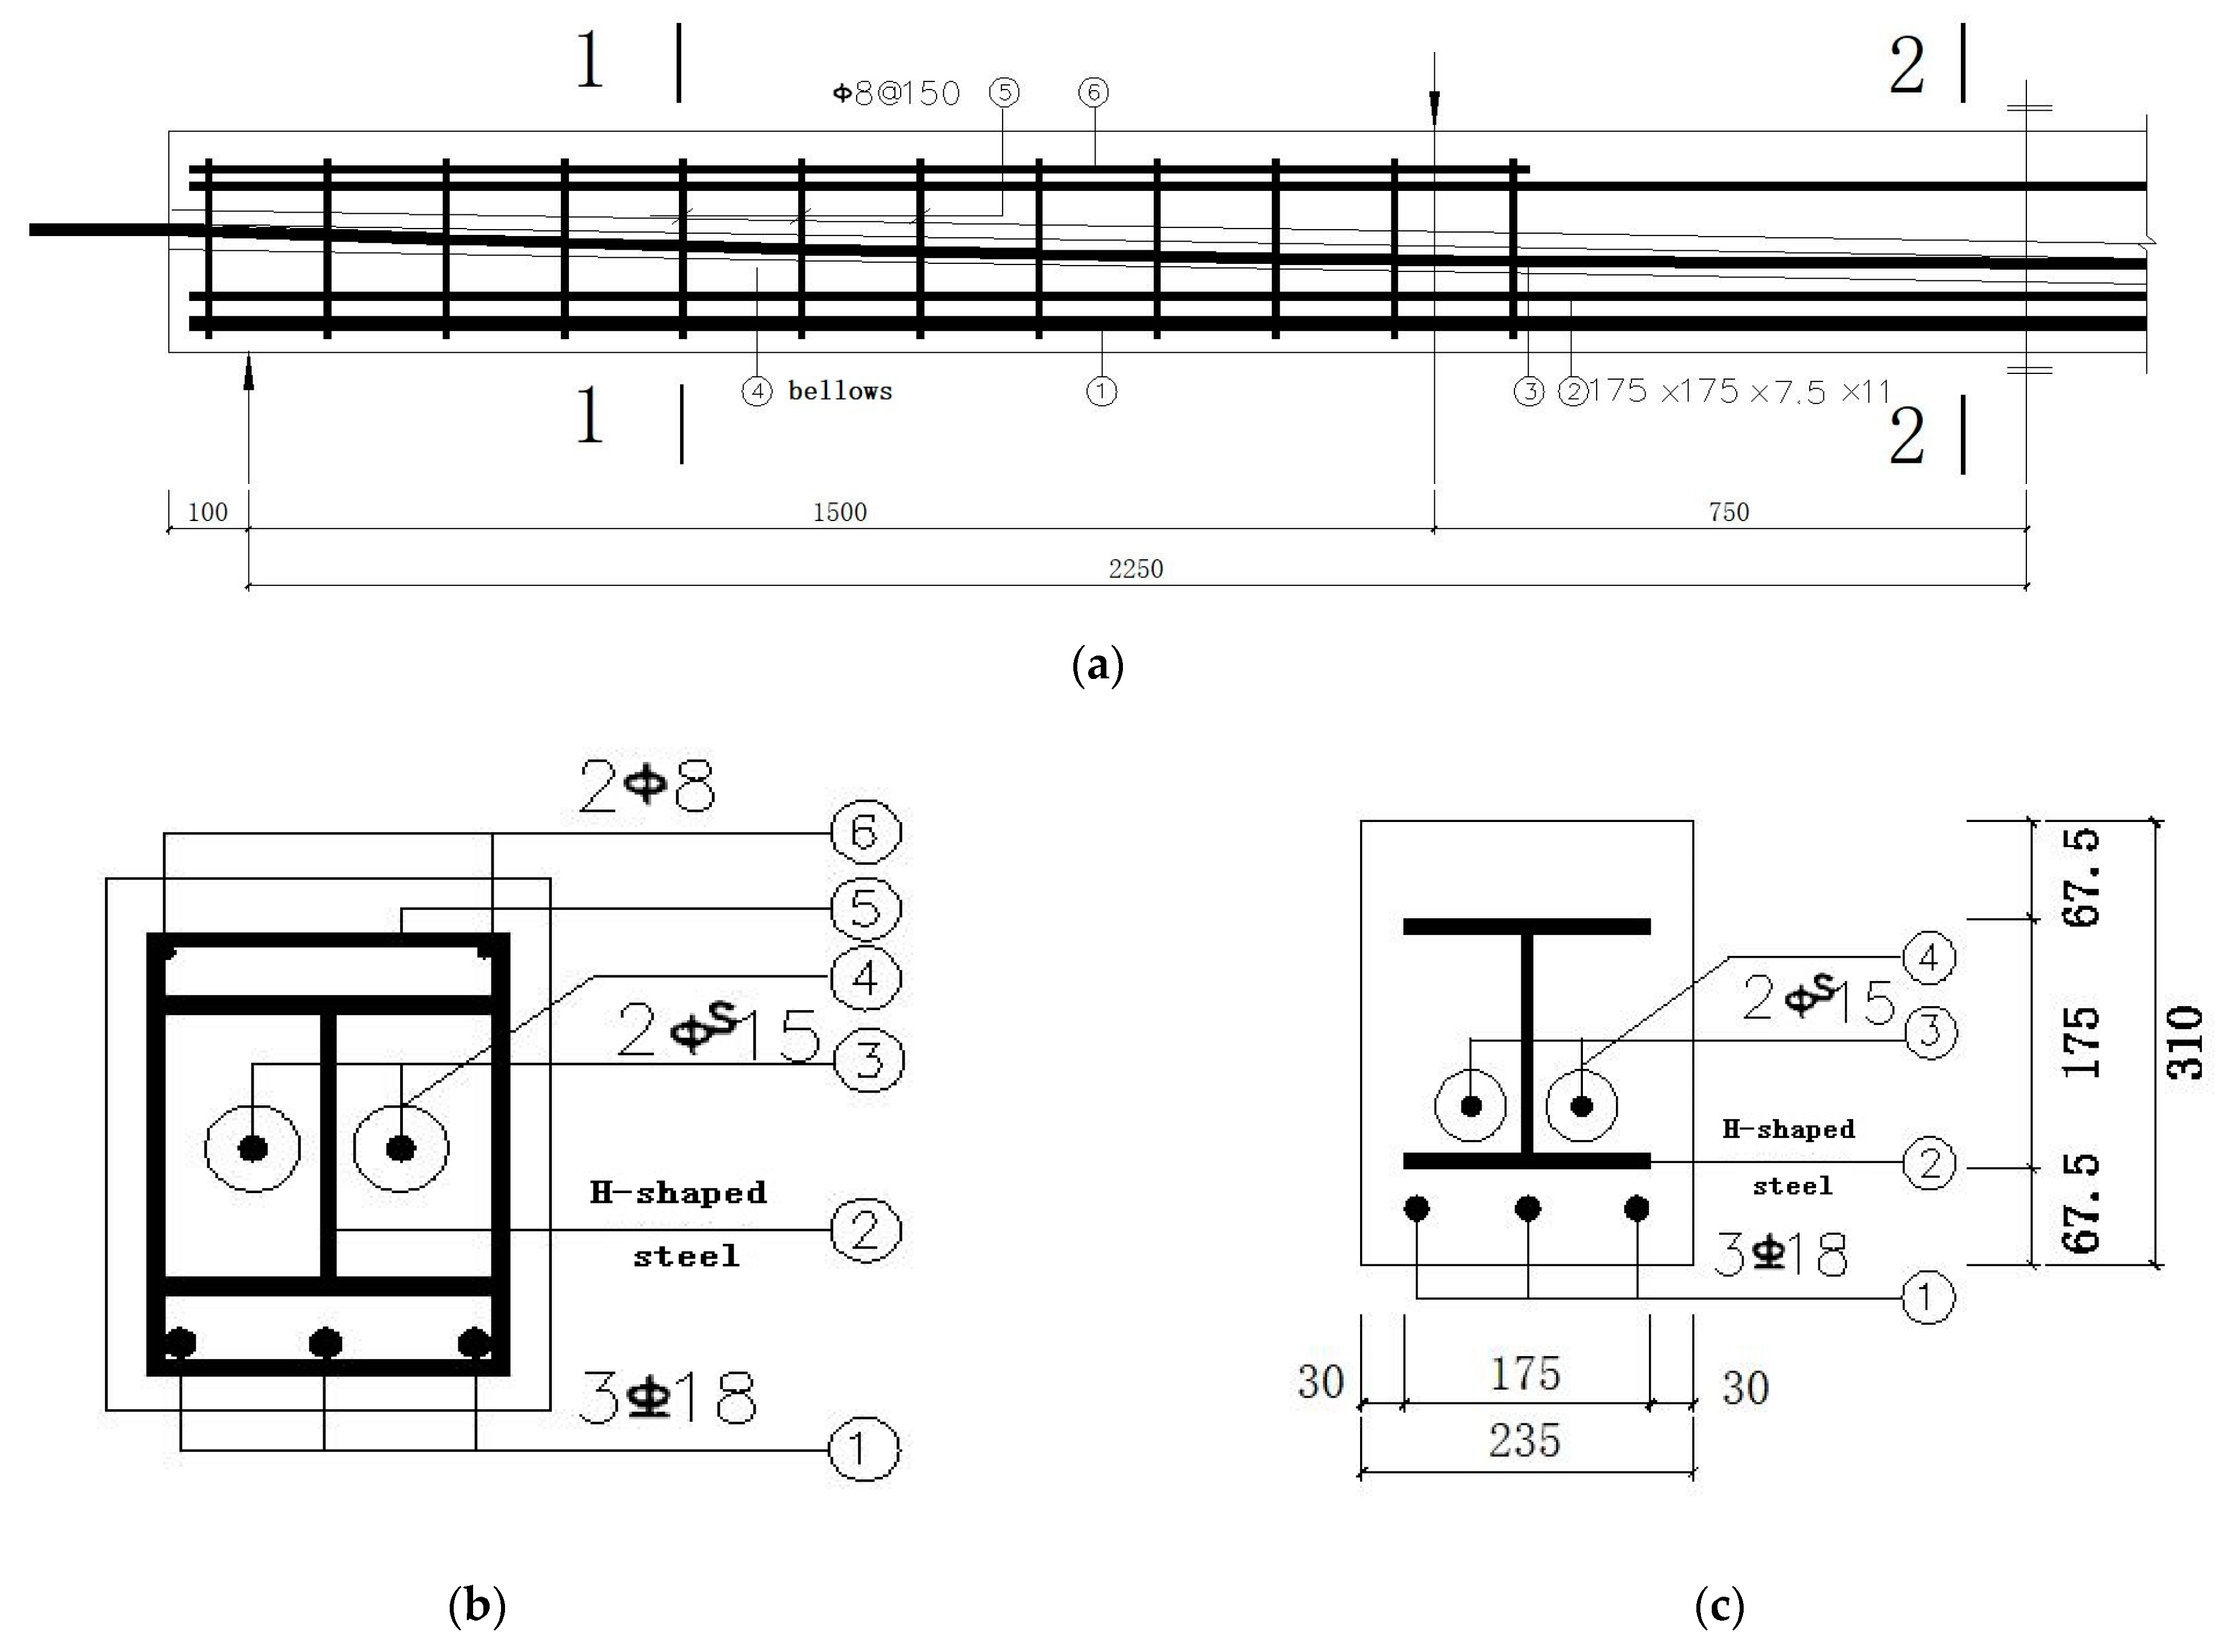
When the load reaches 7.5 kN, the first crack appears in the tension zone of the PSRC test beam span, the crack appears in the flexural-shear area, the crack appears in the anchor tool on the west side, and the inclined crack from the anchor plate to the grout hole on the east side. When the loading continues, the oblique crack on the east side of the beam back develops rapidly and reaches the beam end. When loading to 15 kN, horizontal cracks appear at the west end of the bellows on the back, and through cracks appear at the bottom of the PSRC test beam from the west loading point. With the continuous increase in load, new cracks appear. The number of north-south cracks in the pure bend section at the bottom of the PSRC test beam is increasing, but the growth of crack height is not obvious. When the load continues to increase and reaches 45 kN, all the cracks in the pure bend section of the PSRC test beam appear. Currently, the maximum crack width on the front of the beam is 0.09 mm and the maximum crack width on the back is 0.11 mm. When the load continues to increase and reaches 50 kN, the cracks in the front pure bend section reach the longitudinal reinforcement, the width of the cracks increases little, the load continues to increase, and cracks constantly appear. When the load is 60 KN, the distance between the through cracks in the pure bend section at the bottom of the beam is 100 mm. When the load is 85 kN, the lower flange of the mid-span control section steel enters yield, and the maximum crack width reaches 0.2 mm. When the load reaches 95 kN, the longitudinal bar of the mid-span control section enters yield. The main crack width in the pure bending section increases a little, and the maximum crack width is 0.24 mm. As the loading continues, the through cracks at the bottom of the beam in the flexural-shear section continue to increase, but the crack width does not increase significantly. When loading to 125 kN, the load increase is difficult and slow. Shortly after, a large chunk of concrete in the compression zone of the mid-span pure bend section was peeled off from the section, and the load decreased rapidly. At this point, the beam was damaged, and the loading was stopped. The loading process is shown in Figure 2. Figure 2a shows the concrete crushed in the pure bending section of the beam, and Figure 2b shows the general appearance when the beam reaches the limit state of normal section load-carrying capacity.
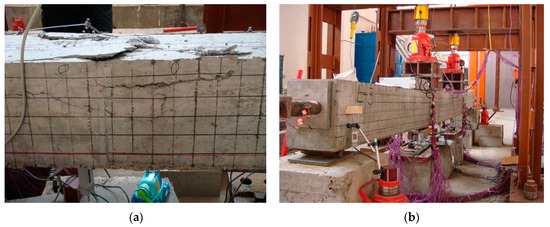
Figure 2.
PSRC test beam failure. (a) The concrete is crushed in the pure bend section of the beam; (b) The beam reaches the limit state of normal section load-carrying capacity.
2.3.1. Test Beam Cracks
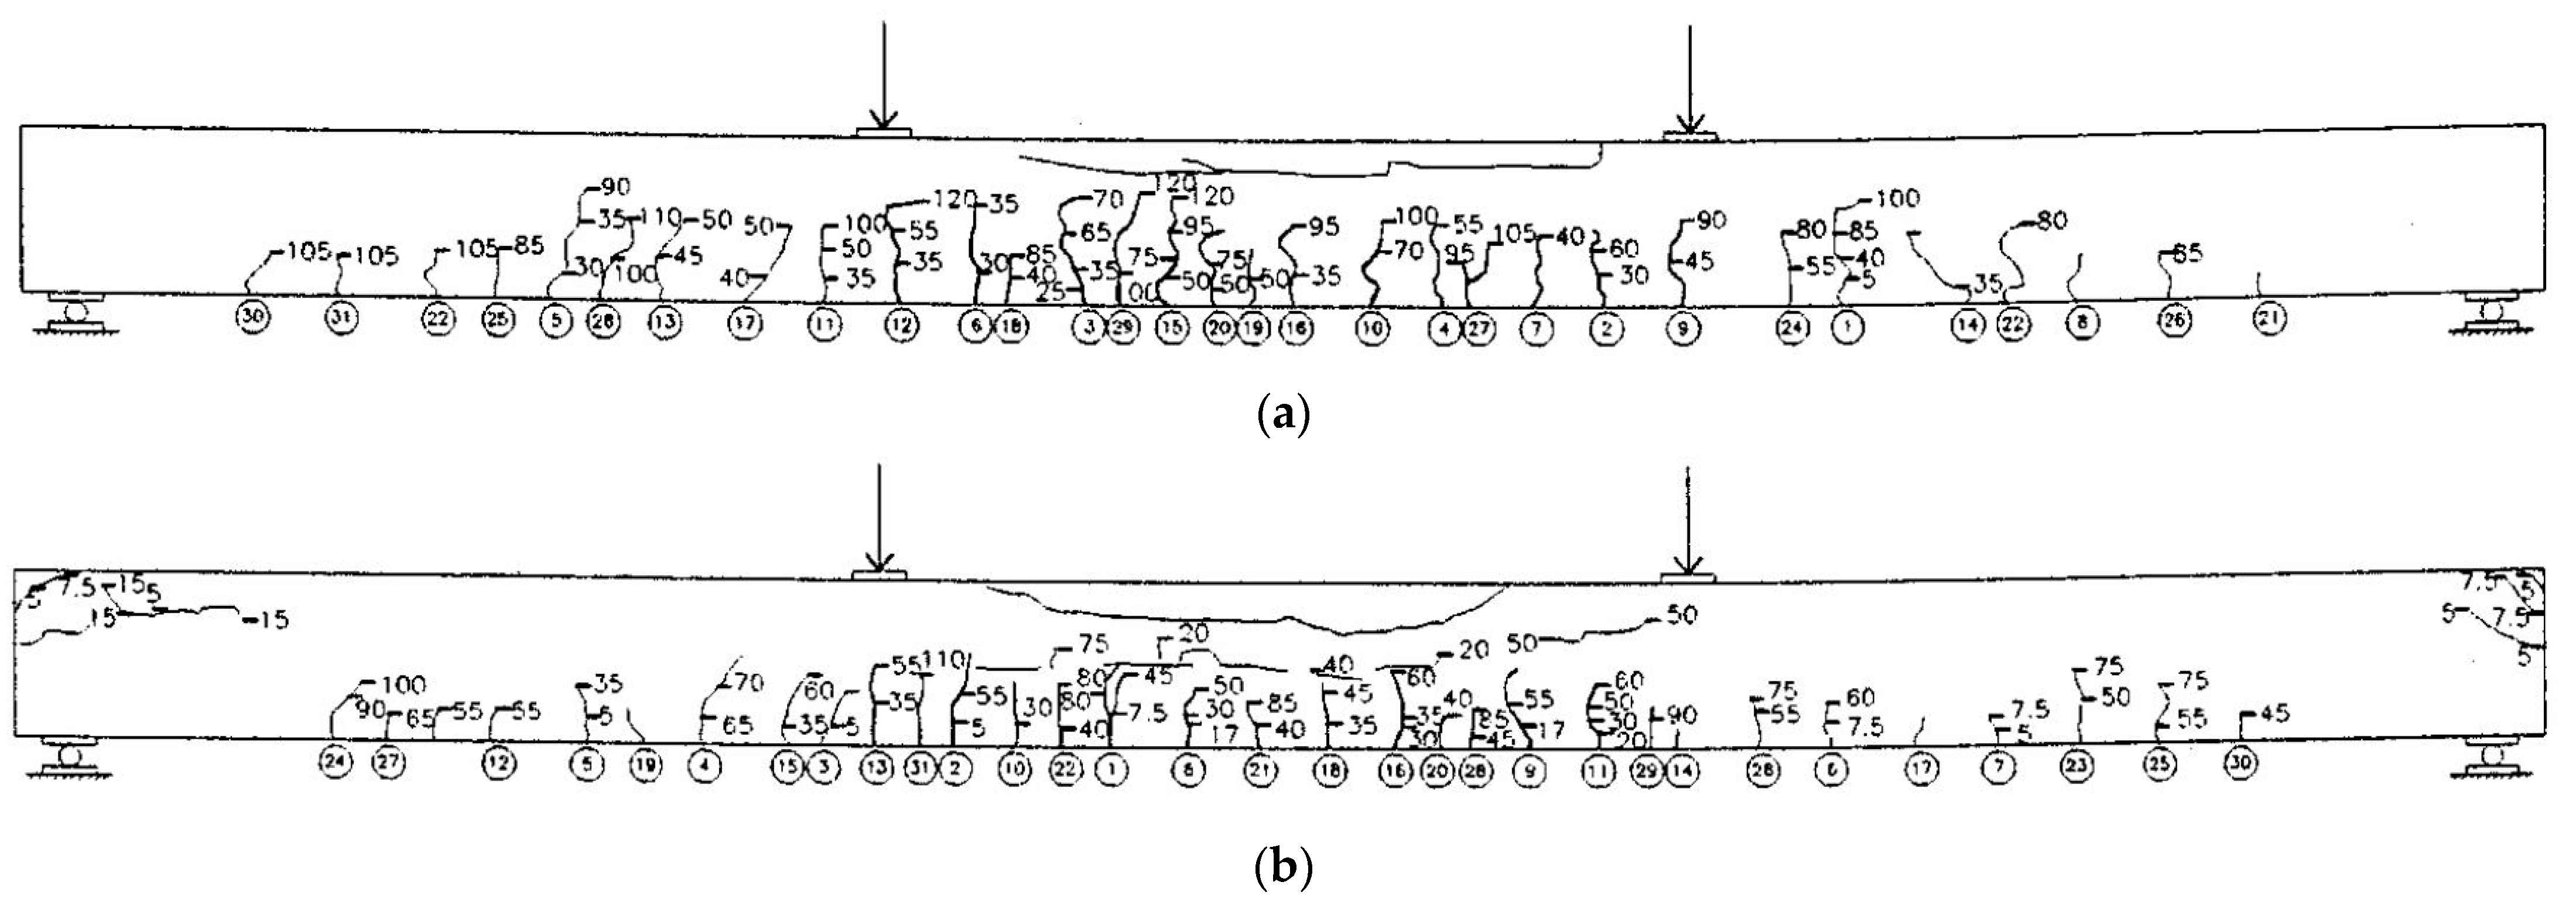
When the load of the PSRC test beam reaches the limit state of normal section load-carrying capacity, the maximum crack width of the PSRC test beam front is 0.6 mm and the maximum crack width of the PSRC test beam back is 0.7 mm. The frontal damage area is length 820 mm, height 85 mm, depth 110 mm; Back damage area: length 950 mm, height 50 mm, depth 108 mm. After unloading, the deflection deformation in the beam span recovers 30 mm. There are 15 cracks on the front of the pure bend section of the test beam with a distribution area length of 1450 mm, and 16 cracks on the back with a distribution area length of 1490 mm. The mid-span deflection of the PSRC test beam is 54.73 mm. Figure 3 shows the crack distribution of the PSRC test beam.

Figure 3.
Test results of the PSRC test beam crack distribution (a) Front of the beam; (b) Back of the beam.
It can be concluded from the above tests that the PSRC composite beams have good deformation recovery ability. Even if the concrete of the PSRC composite beams is crushed, the residual deformation after unloading the load is not large. The curves of the PSRC composite beams with the same section are similar, but for test beams with the same section under the same load, the deflection of beams with more longitudinal reinforcement is smaller because the bending stiffness of the section is larger. The test data of the average crack spacing of the PSRC test beam are shown in Table 4.
Table 4.
Tested data of average crack spacing of the PSRC test beam (mm).
The measured results of the average crack width of the PSRC test beam at the yield of the tension flange of the H-shaped steel are shown in Table 5.
Table 5.
The measured average crack width of the PSRC test beam.
According to the loading conditions of the PSRC test beam at the initial cracking stage and the failure stage, the cracking moment, and the ultimate bending moment of the PSRC test beam can be calculated respectively. The values of cracking load, yield load, and ultimate load of the PSRC test beam are shown in Table 6.
Table 6.
Measured values of loads of the PSRC test beam (kN).
2.3.2. Beam Mid-Span Deflection Curves
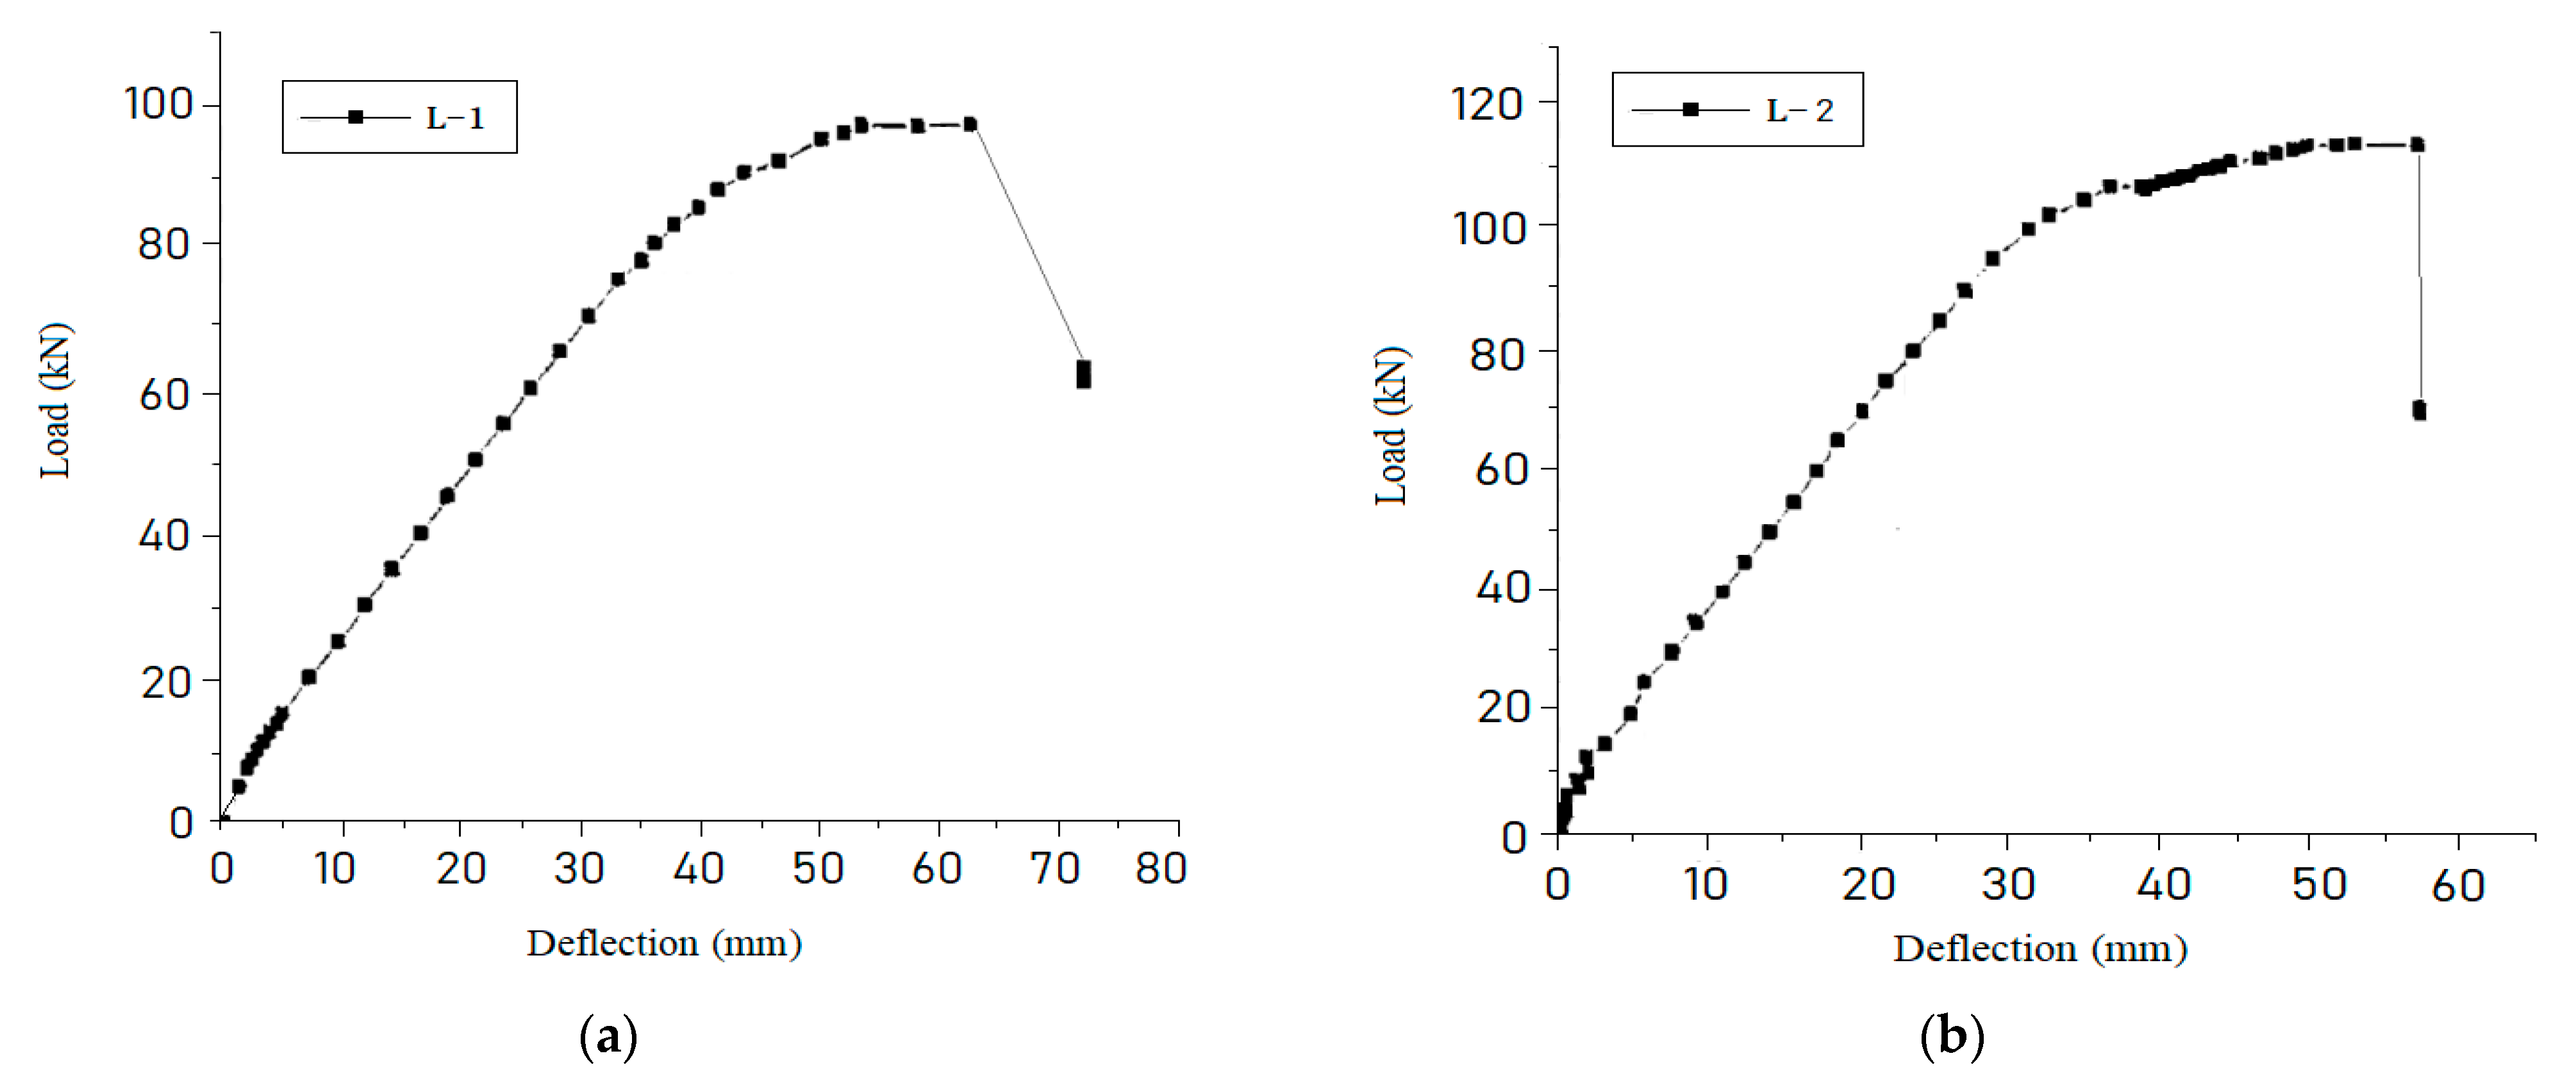
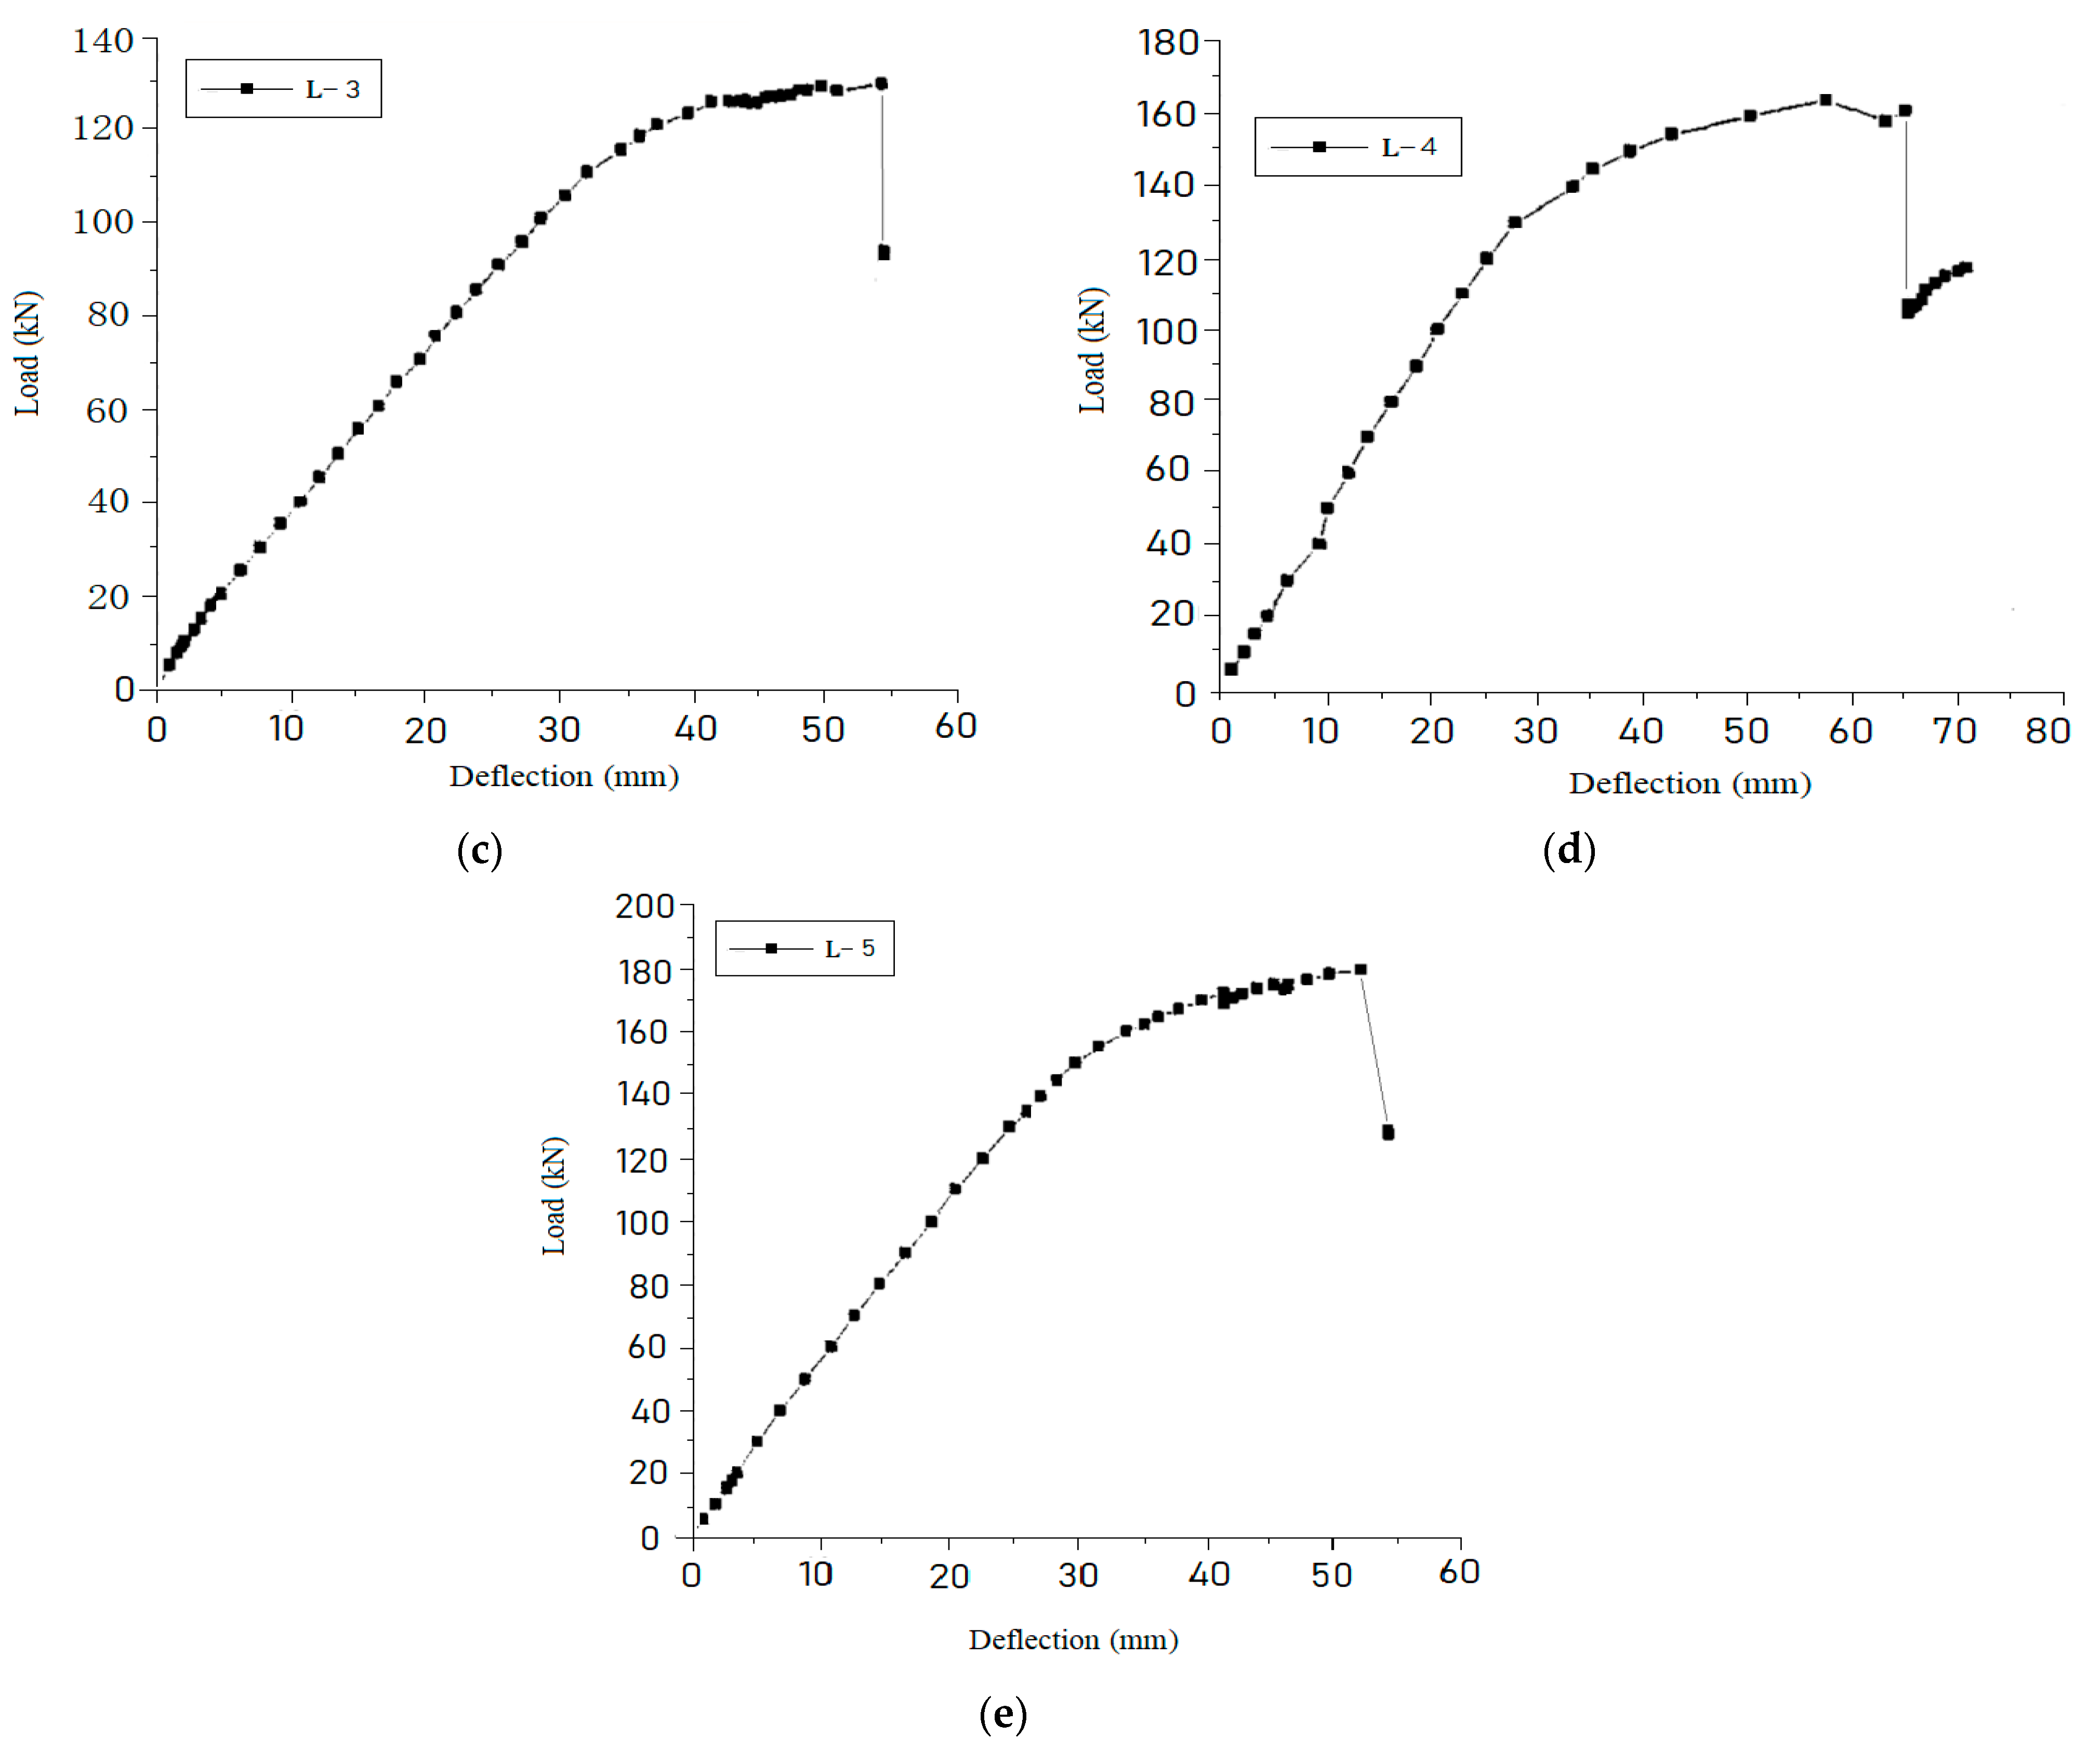
The mid-span deflection curves of the PSRC test beam under various loads can be obtained by computer acquisition of the data reflected by the displacement sensors arranged in the span of the PSRC test beam and the support, as shown in Figure 4.
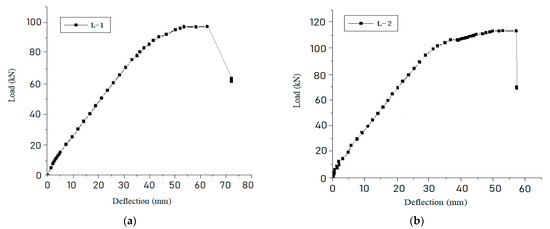
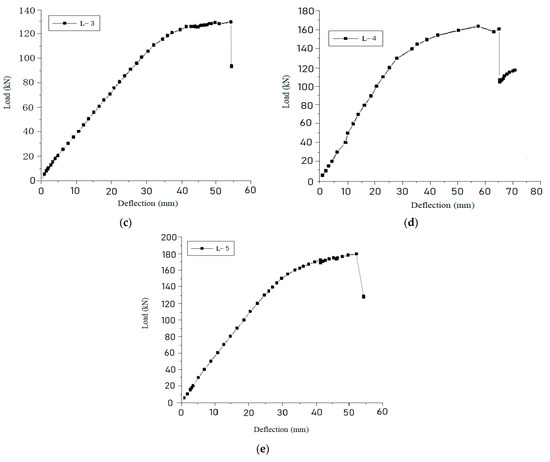
Figure 4.
Load and mid-span deflection curve of PSRC test beams. (a) L-1; (b) L-2; (c) L-3; (d) L-4; (e) L-5.
From the load-deflection curves of the PSRC simply supported composite beams shown in Figure 4, it can be seen that before the H-shaped steel and rebar yield, the mid-span deflection curve of the PSRC test beam load presents a linear trend, and the displacement increases rapidly after yielding. The tensile edge concrete cracking has little influence on the deflection curve of PSRC simply supported composite beams. This is because the pre-stress is applied, the crack development is small, and the flexural rigidity of the H-shaped steel is large, so the concrete cracking does not significantly reduce the flexural rigidity of the section. The load increase of reinforced concrete beams with proper reinforcement is very small when the tensile longitudinal beam yields beam failure. The PSRC simply supported composite beams experience a relatively large load range from the yield of the lower flange or the tensile longitudinal bar to the middle of the beam failure. This is mainly because the load borne by the H-shaped steel has been increasing from the lower flange yield to the beam failure.
The PSRC beam can bear a certain load even when the concrete in the compression is crushed. This is because the H-shaped steel has a certain stiffness and load-carrying capacity, and the pre-stress is applied in the beam. Due to the suppression effect of the applied prestress on the cracking of the PSRC test beam, the crack width of the PSRC test beam is small and the mid-span deflection is also small.
3. Calculation of Crack Width of PSRC Simply Supported Composite Beams
At present, in the Technical Regulations for Reinforced Concrete Composite Structures (JGJ 138-2001 GB) [13] issued by the Ministry of Construction of China, the calculation formula of the normal section load-carrying capacity of simply supported composite beams is based on the assumption of a plain section, and the assumption of the full section yield of the shaped steel. In the Design Regulations for Steel-reinforced Concrete Structures (YB9082-97) [14], the simple superposition method is used to calculate the bending capacity of the normal section of PSRC beams. It can be seen that the research on steel-reinforced concrete composite structures in China started late. Through experimental research and theoretical analysis, several calculation methods for the crack width of steel-reinforced concrete composite beams were proposed [15].
3.1. Calculation of Average Crack Spacing
Because the crack problem itself is very complicated, there are many influencing factors. In this paper, the average crack width and the average crack spacing of the five test beams before the tensile flange yield are obtained by analyzing the positive and negative cracks in the pure bend section of the five test beams with few experimental data at home and abroad. To be consistent with the expression form of Technical Regulations for steel-reinforced concrete Composite Structures and Code for Design of Concrete Structures [13,16], the average crack spacing of pre-stressed steel-reinforced concrete simply supported composite beams is still calculated according to Formula (1).
As the tension longitudinal bar is located below the tension flange of the shaped steel, according to domestic test data [14], the crack width at the horizontal part of the longitudinal tension reinforcement bar is generally higher than that at the lower flange of the shaped steel, so it is reasonable to take the crack width at the horizontal part of the longitudinal tension reinforcement bar as the checking object of the crack width. In the calculation formula of average crack spacing, it is reasonable to take the protective layer of the outermost tensile longitudinal bar as the concrete protective layer thickness.
Due to the existence of shaped steel, the average crack spacing of section steel-concrete beams is larger than that of the same section reinforced concrete beams. Therefore, the influence of the shaped steel on the equivalent diameter and effective reinforcement ratio of the tensile longitudinal bar should be reasonably considered in the formula of the average crack spacing. The coefficient before the term in the formula for calculating average crack spacing includes the ratio of longitudinal reinforcement to concrete bond stress. Therefore, the bond strength between steel and concrete should be considered when calculating the average crack spacing of steel-reinforced concrete beams. It can be seen that the main factors affecting the crack spacing of PSRC beams concrete include not only the thickness of the concrete protective layer but also the bond strength between the shaped steel and the concrete.
According to the literature [17], the bond strength between shaped steel and concrete is only 0.45 times that between circular steel bars and concrete. Many domestic scholars have done a lot of research on the bond strength of steel and concrete and reached their conclusions, but they agree with it. Here, we take the 0.45 × 0.7 = 0.315 reduction coefficient of bonding property between shaped steel and concrete and introduce it into the calculation formula of average crack spacing of steel-concrete composite beams. When considering the effective diameter of the tension flange part of the web of the shaped steel and the tension reinforcement, the calculation is considered according to the following Formulas (2) and (3).
The effective reinforcement ratio of the tension flange, part of the web, and the tension reinforcement is calculated according to the following Formula (4).
For the problem of how to consider the influence of the H-shaped steel web on beam cracks in the tensile area, refer to the literature [13]. However, since the PSRC test beams are all bonded post-tensioned pre-stressed beams, the tensile height of the H-shaped steel web can be reached to the bellows epithelium.
where
is the concrete protective layer thickness of the longitudinal tensile reinforcement;
is the effective diameter of the tension flange and partial web of H-shaped, as well as the tensioned non-pre-stressed reinforcement and pre-stressed reinforcement;
is the effective reinforcement ratio of the tension flange and partial web of the H-shaped steel and the tensioned non-pre-stressed reinforcement and pre-stressed reinforcement;
, , , is the section area of longitudinal tension non-pre-stressed steel bar, pre-stressed steel bar, H-shaped steel tension flange, and web;
is the sum of longitudinally tensioned non-pre-stressed bar, pre-stressed bar, H-shaped steel tension flange, and partial web perimeter;
, is the thickness of H-shaped steel flange and web;
is the influence coefficient of an H-shaped steel web;
is the number of longitudinally stretched steel bars of type ;
is the relative bond characteristic coefficient of the tensile bar. Deformed steel υ = 1.0, smooth steel υ = 0.7, steel strand υ = 0.4, bond coefficient between steel and concrete υ = 0.315;
is the H-shaped steel web height.
According to the above calculation formula for average crack spacing, the calculated values of the average crack spacing of the 5 simply supported composite beams in this test are compared to the measured values, as shown in Table 7.
Table 7.
Values of cracking load, yield load, and ultimate load of PSRC beams (mm).
The actual average crack spacing of 5 PSRC simply supported beams in this test is 106.04 mm, which is calculated according to the above formula of average crack spacing. The average ratio between the calculated value and the measured value is lcr,t/lcr,c, , and the standard deviation is , and the coefficient of variation is .
As can be seen from Table 7, the calculated average crack spacing of PSRC simply supported composite beams proposed in this paper is slightly smaller than the measured value. Compared to the load-carrying capacity calculation, fracture calculation has many influencing factors and greater discreteness, so it is often difficult to achieve high accuracy. The difference between the calculated value and the measured value is about 8%, and the dispersion is small. We believe that the formula is feasible. From the above factors, it can be seen that in bonded pre-stressed projects, the effect of grouting bellows on crack distribution is close to that of deformed steel bars with the same diameter, but it has little effect on the stress of cracked steel bars.
3.2. Calculation of Average Crack Width
The factors influencing the calculation of the average crack width of PSRC beams are mainly related to the performance of the beam concrete, such as the influence of the concrete elongation between cracks on the crack width. In addition, it is closely related to the performance of the shaped steel. According to the usual crack width calculation method [12,16], after determining the calculation formula of the crack spacing, the crack width of the component can be calculated according to the following formula:
where is the effect coefficient of concrete self-elongation between cracks on crack width; is the longitudinal stress value of H-shaped steel tension flange and part of the web.
Since the stress increment of the stress reinforcement is not large from pre-compression to depressurization, the stress of the reinforcement in the crack section is calculated according to the following formula:
where is the bending moment calculated according to the combination of load effects; is the effective height of the section; is effective pre-stress; is the distance from the pre-stressing point to the centroid of the section.
Since the stress increment from pre-compression to depressurization reinforcement is not large, the stress of reinforcement in the crack section is calculated according to Formula (6). To be consistent with the expression form of literature [12], the coefficient of the internal force arm is still taken as 0.87. For the strain non-uniformity coefficient of the steel bars of pre-stressed steel-concrete simply supported composite beams, the calculation formula is still referred to the literature [15], namely:
where is the non-uniform strain distribution coefficient of longitudinal tensile non-pre-stressed bars, pre-stressed bars, lower flange of the shaped steel, and part of the web between cracks; is the concrete axis standard tensile strength.
The influence coefficient of concrete self-elongation between cracks on crack width can be calculated by the following formula:
When , and are determined according to Formulas (8), (6) and (1) respectively, can be calculated by Formula (9) from the measured crack spacing and average crack width . For the calculation of the PSRC simply supported composite beams, the result is .
In summary, the short-term av average crack width of PSRC simply supported composite beams can be calculated as follows:
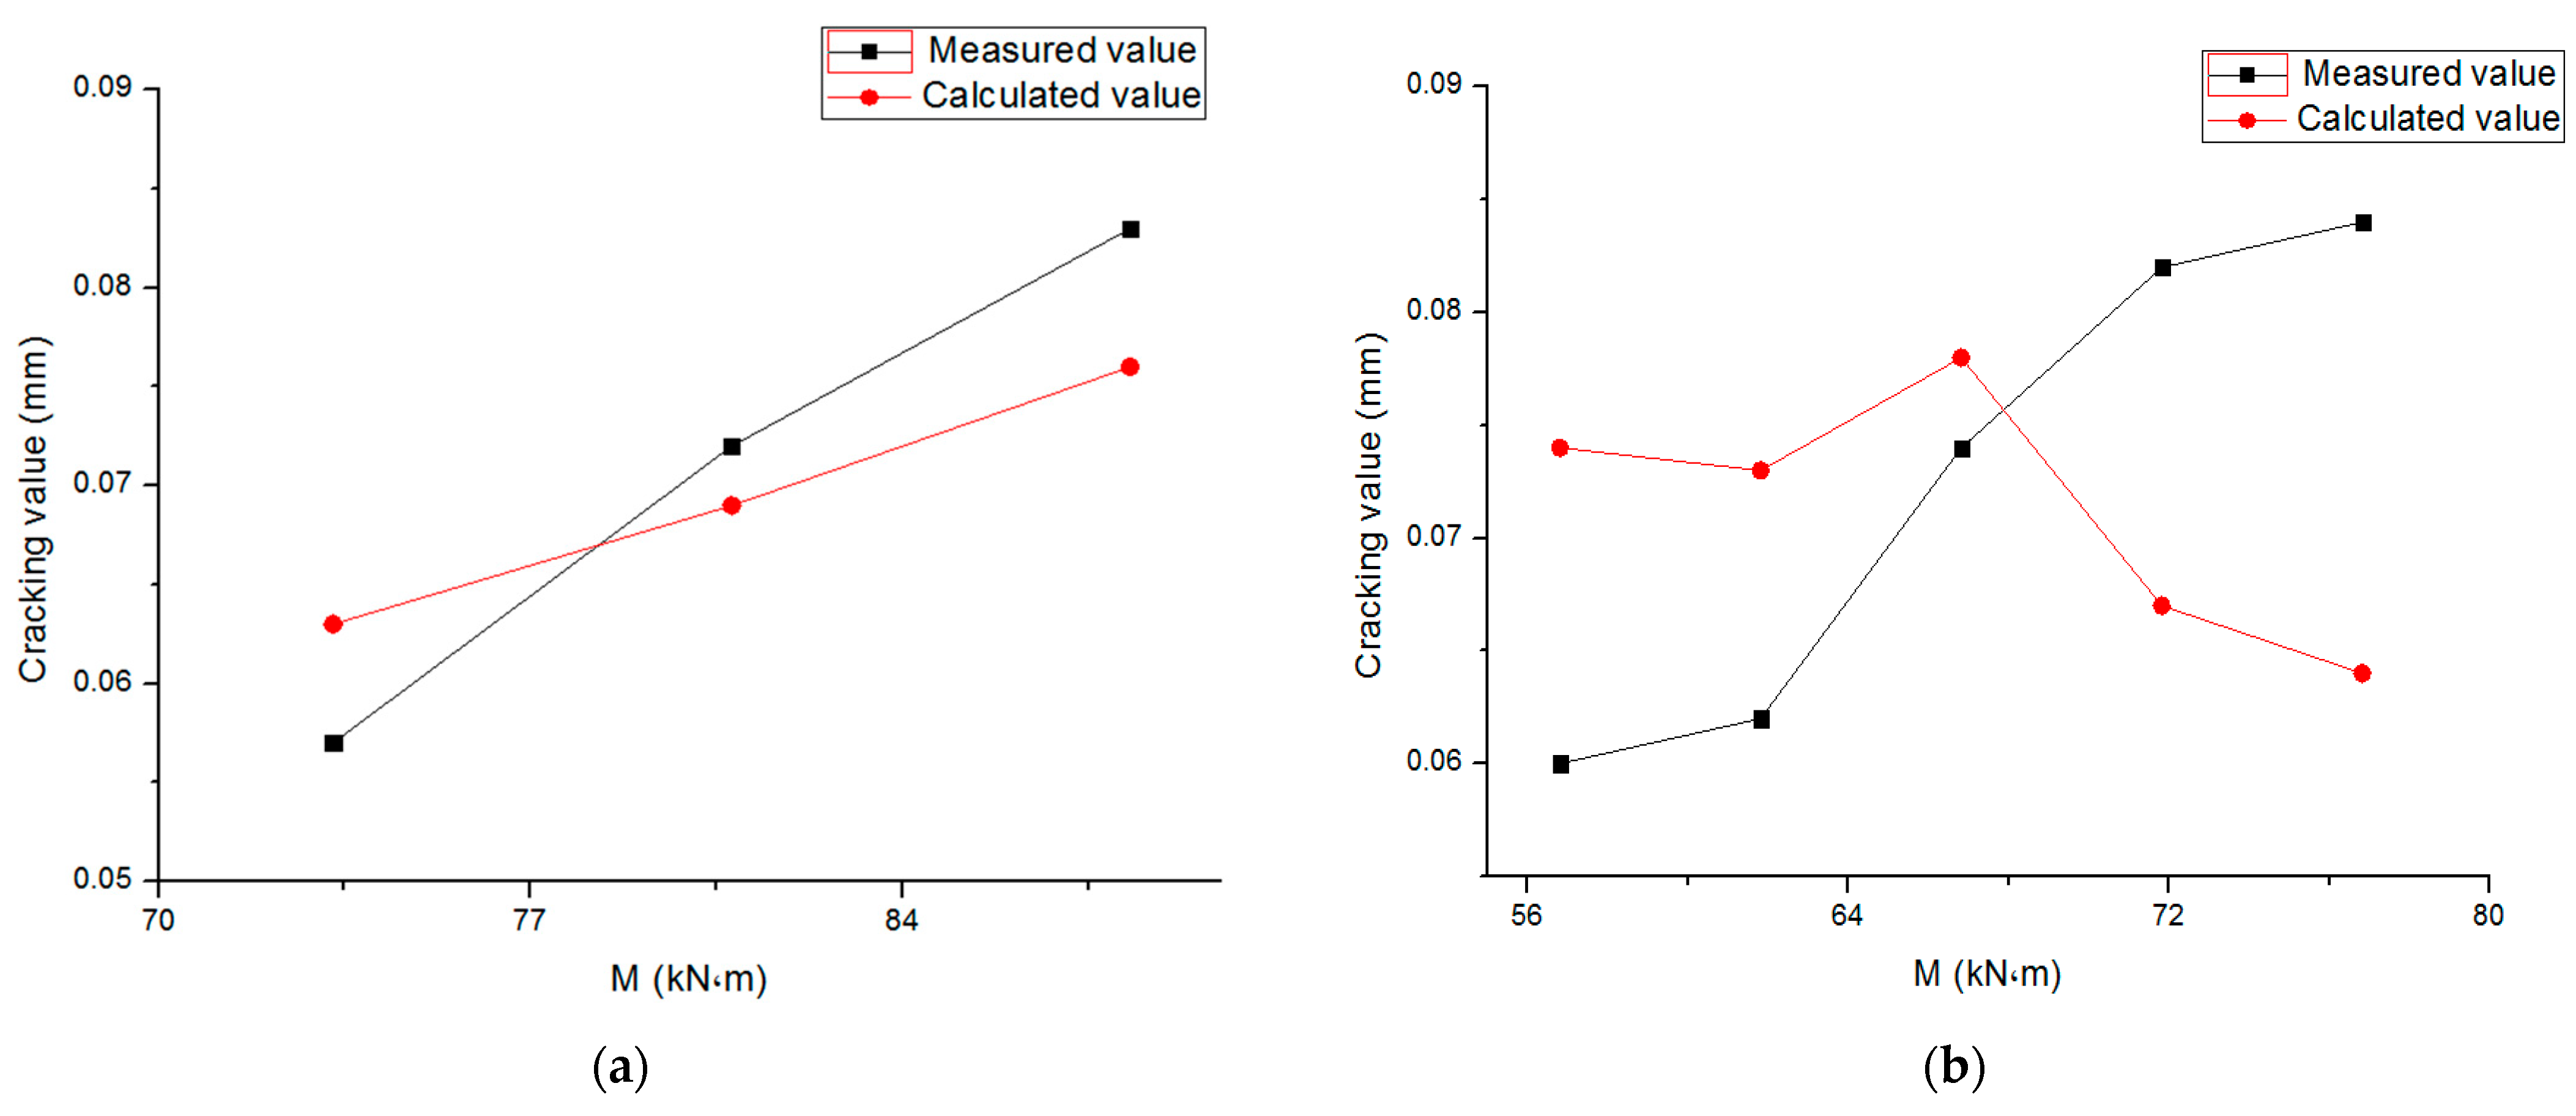
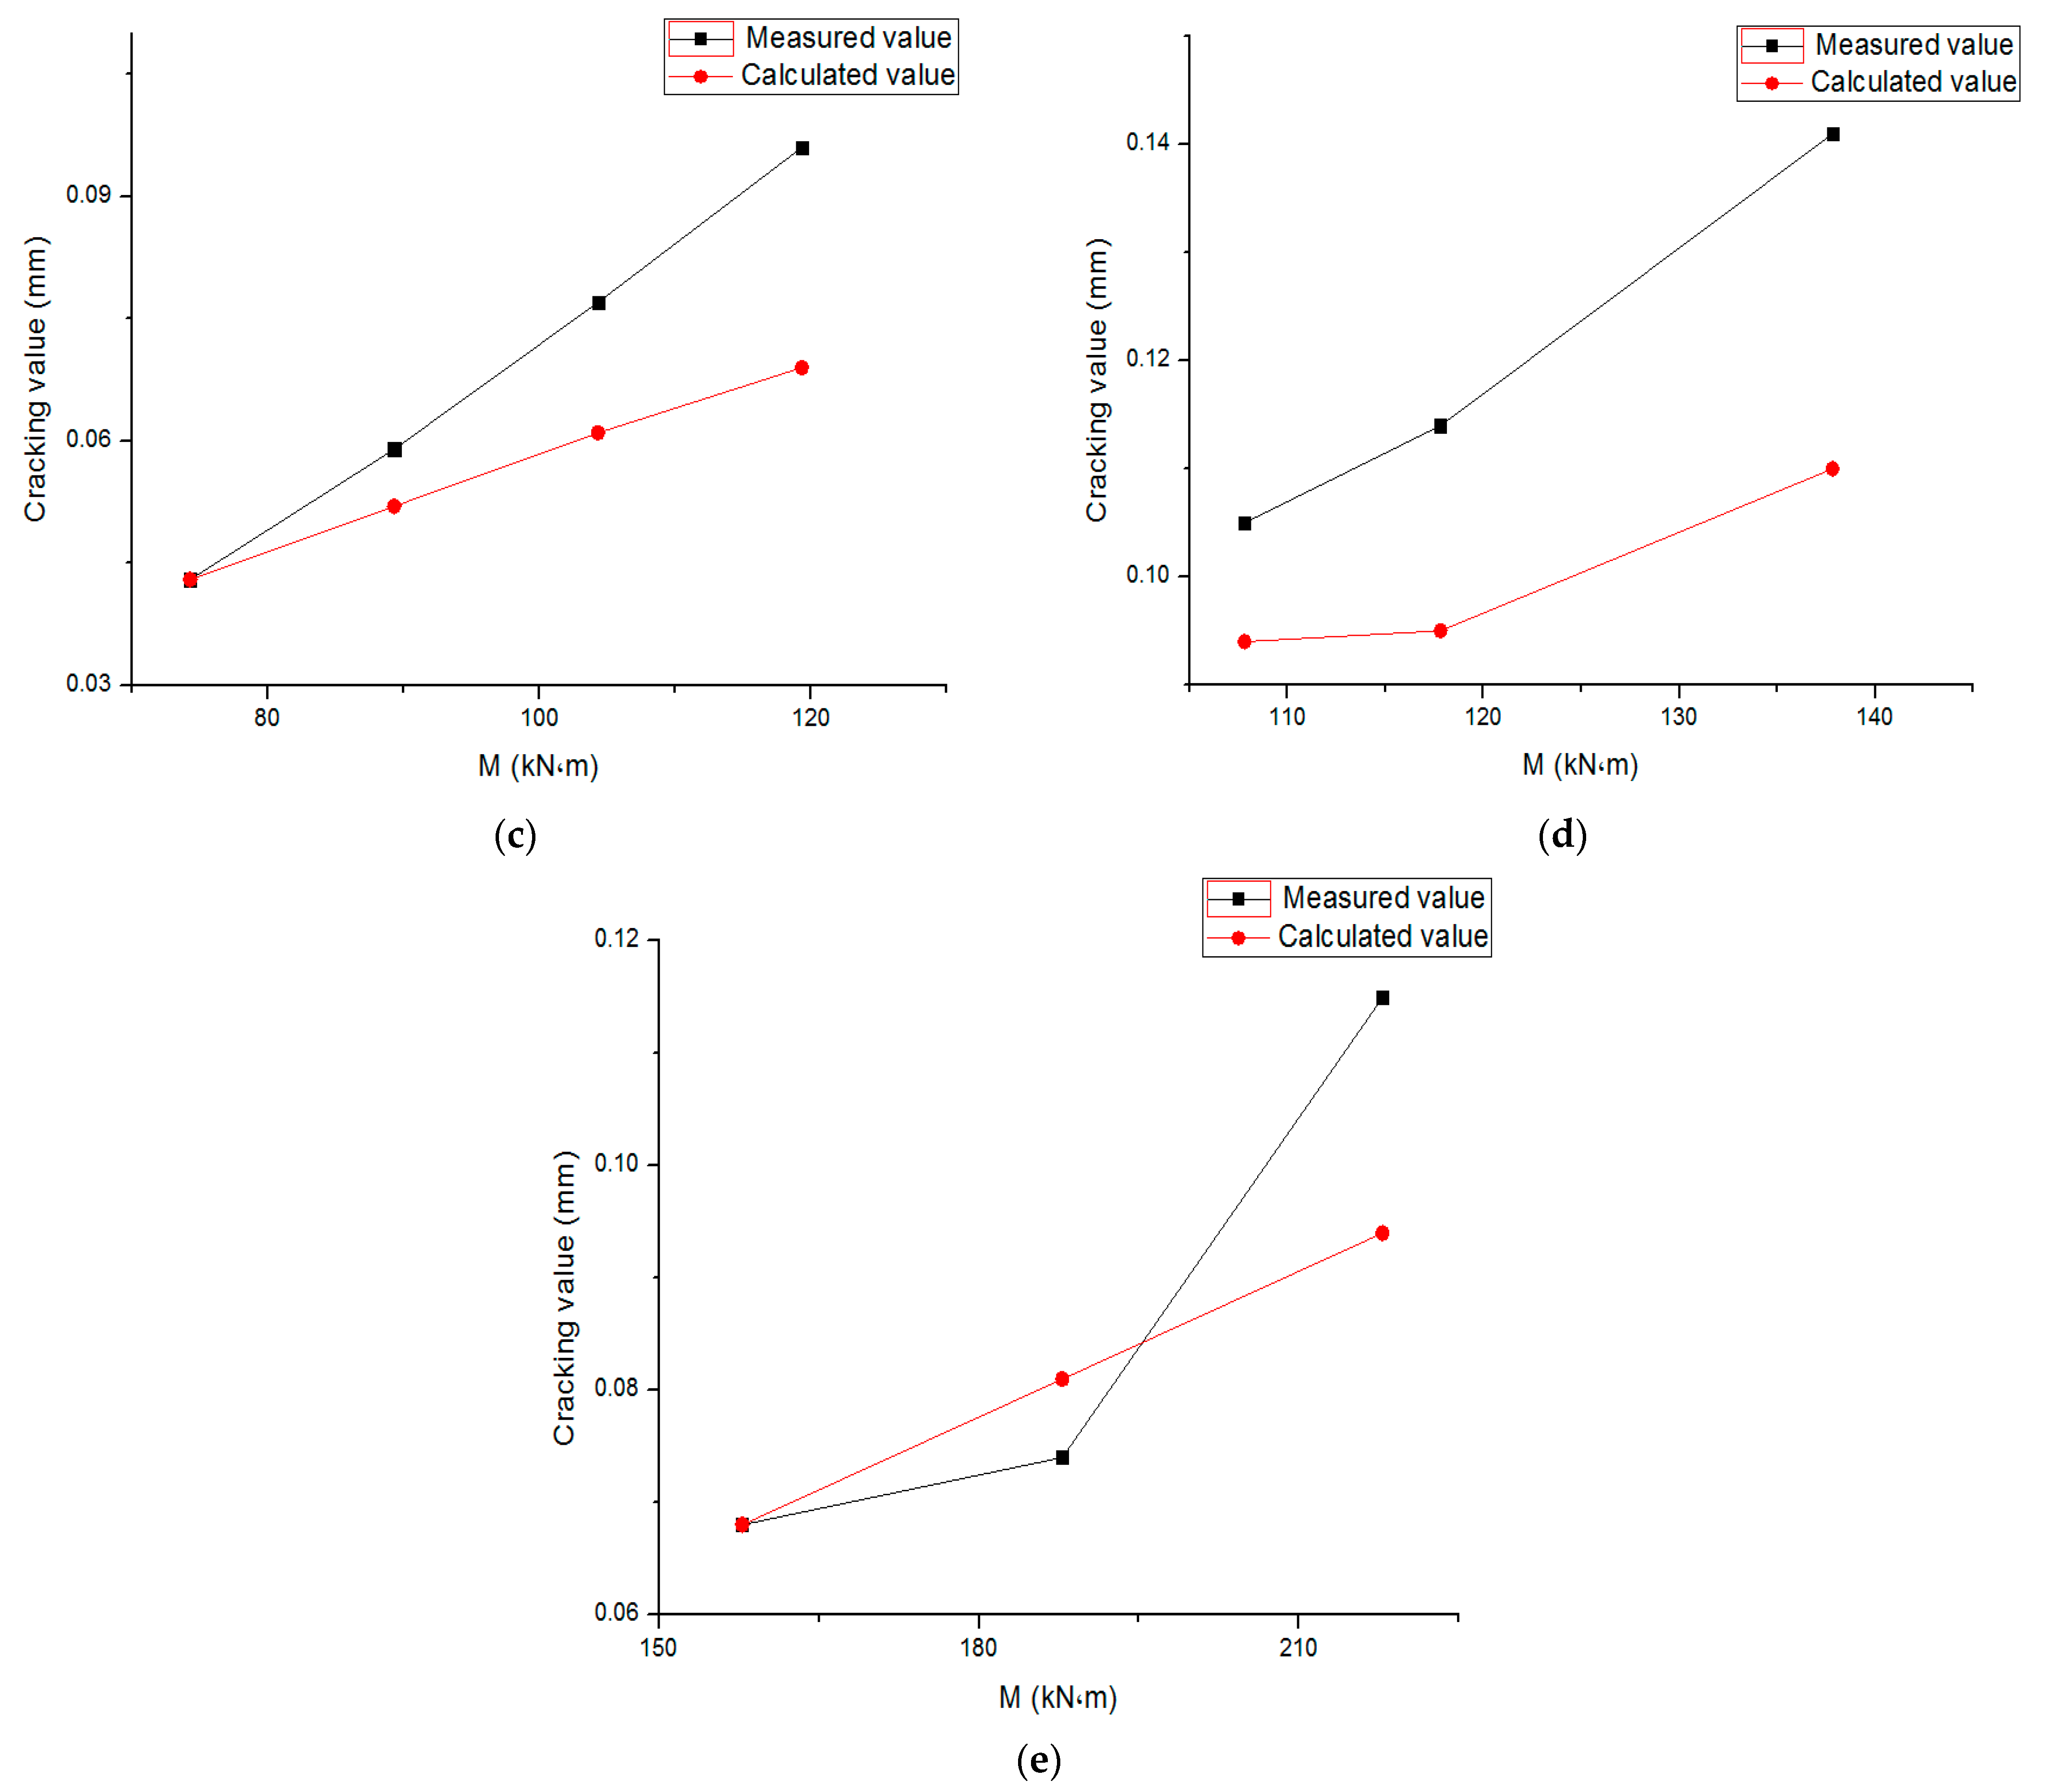
According to the above formula for calculating the average crack width, the calculated and measured values of the average crack width of the 5 PSRC beams before the tensile flange of the shaped steel yield are shown in Figure 5. The crack width values of the test beam were read with 100× and 24× reading magnifiers. The average value of crack widths under different loads in the pure bend section of the beam and the main crack widths in the shear span section are taken.
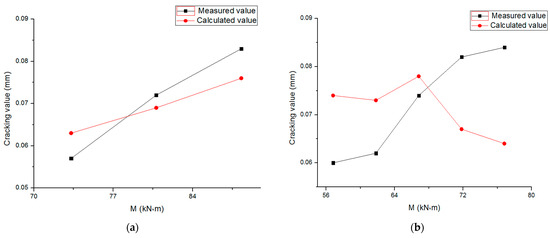
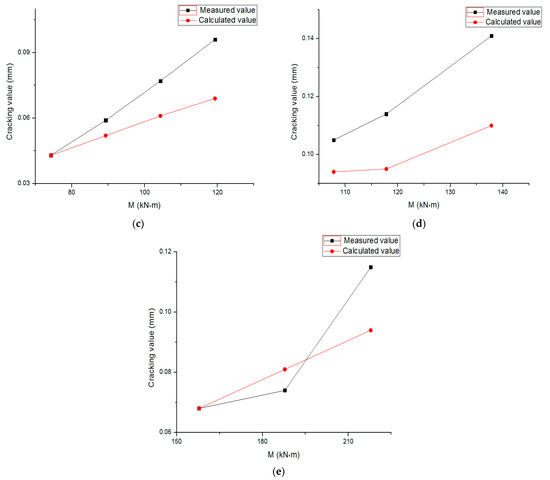
Figure 5.
Calculated and measured values of the average crack width of the test beam. (a) L-1; (b) L-2; (c) L-3; (d) L-4; (e) L-5.
It can be seen from Figure 5 that the average crack width of the 5 test beams presents a good linear correspondence between the calculated value and the measured value. According to the calculation results of the testing machine, the average value of the calculated value and the ratio of the measured value of the average crack width of the 5 test beams before the tensile flange yield are , the standard deviation is , and the coefficient of variation is .
Through the analysis of the test results, it is found that the concrete cracking of PSRC beams under tension edge has little effect on the trend of the deflection curve. Through the analysis of test data, formula fitting, and test results, it was found that the crack width of PSRC beams showed a good linear relationship with the load. The total calculated values are slightly smaller than the measured values, indicating that the formula can be improved by further accumulation of test data.
3.3. Calculation of Maximum Crack Width
Due to the non-uniformity of material quality and the randomness of cracks, the dispersion of crack spacing, and crack width is relatively large [18]. To obtain the maximum crack width can be determined by multiplying an expansion factor by the average crack width. The ratio between the crack width of each crack and the average crack width of the specimen under various loads was calculated from the 128 cracks in the pure bending section of the pre-stressed steel-concrete simply supported composite beam from the crack formation to the first-grade load before the tensile flange yield. Through fracture distribution fitting, the expansion coefficient reflecting uneven fracture distribution with a guaranteed rate can be calculated as 1.67. The maximum crack width should also be considered. Under the combination of long-term loading effects, the average strain of the tensile steel bar between cracks will continue to increase due to the stress relaxation and slip creep of the concrete in the tensile area, and the crack width will also increase due to the concrete shrinkage. Therefore, the short-term maximum crack width must be multiplied by the crack expansion coefficient of the long-term effect of the load. The same value 1.5 in the Code for Design of Concrete Structures can be adopted. In this way, the maximum crack width formula is obtained:
The significance of the crack propagation coefficient in determining the maximum crack width lies in the consideration of both the beam test value and the combination of long-term effects of load. The dual effects of short-term effects and long-term effects are considered. It can be seen from Formula (1) that the force characteristic coefficient of the component in the formula for calculating the maximum crack width of the pre-stressed steel-concrete composite beam is consistent with the value of the literature [13]. It shows that the application of prestress has little effect on the maximum crack width of pre-stressed steel-concrete composite beams.
Through the analysis of the research results of the crack width and crack spacing of the PSRC beams, the calculation method of the crack width and crack spacing of the PSRC beams should be further improved through a large number of experimental data. At the same time, it is necessary to improve the performance of concrete, improve the toughness of concrete materials, and increase the bond strength between the shaped steel and concrete by improving the concrete compactness, to improve the crack resistance of the PSRC beams.
4. Conclusions
Based on the PSRC simply supported composite beam test, the following conclusions are obtained through analysis, calculation, test data, and formula fitting.
The crack width and mid-span deflection of the PSRC beam are smaller because the pre-stressed beam can inhibit the cracking of the beam. The average ratio between the calculated value and the measured value is 0.916, the standard deviation is 0.059, and the coefficient of variation is 0.064.
The measured values of the average crack width of 5 PSRC beams are close to the calculated values and have a good linear relationship. The average value of calculated and measured crack widths of the PSRC beams is 0.927, the standard deviation is 0.194, and the coefficient of variation is 0.209.
The calculated average crack spacing of PSRC simply supported composite beams is slightly smaller than the measured value. The difference between the calculated fracture spacing and the measured value is about 8%, and the dispersion is small.
For PSRC composite beams, prestressing or not has little effect on the maximum crack width.
Because of the relatively poor bond property between the section steel and concrete, the formula for calculating the average crack spacing of the composite beam is modified by using the actual contact area between the section steel tension flange and concrete and introducing the bond property reduction factor.
Author Contributions
Conceptualization, D.W. and H.W.; methodology, D.W.; validation, D.W.; formal analysis, D.W. and C.L.; investigation, D.W. and H.W.; resources, D.W.; data curation, D.W. and R.W.; writing—original draft preparation, D.W.; writing—review and editing, D.W., R.W. and C.L.; visualization, D.W. and R.W.; supervision, D.W.; project administration, D.W.; funding acquisition, D.W. All authors have read and agreed to the published version of the manuscript.
Funding
This research was funded by the Heilongjiang Provincial Department of Education basic scientific research business special youth innovation project, grant number 145209212; The Innovative training program for students of Qiqihar University, grant number S202310232022.
Institutional Review Board Statement
Not applicable.
Informed Consent Statement
Not applicable.
Data Availability Statement
The data presented in this study are available on request from the corresponding author.
Conflicts of Interest
The authors declare no conflict of interest.
References
- Xue, J.; Briseghella, B.; Huang, F.; Nuti, C.; Tabatabai, H.; Chen, B. Review of ultra-high performance concrete and its application in bridge engineering. Constr. Build. Mater. 2020, 260, 119844. [Google Scholar] [CrossRef]
- Zhu, Y.; Zhang, Y.; Hussein, H.H.; Chen, G. Flexural strengthening of reinforced concrete beams or slabs using ultra-high performance concrete (UHPC): A state of the art review. Eng. Struct. 2020, 205, 110035. [Google Scholar] [CrossRef]
- Bae, B.; Choi, H.; Choi, C. Flexural Strength Evaluation of Reinforced Concrete Members with Ultra High Performance Concrete. Adv. Mater. Sci. Eng. 2016, 2016, 2815247. [Google Scholar] [CrossRef]
- Singh, M.; Sheikh, A.; Ali, M.M.; Visintin, P.; Griffith, M. Experimental and numerical study of the flexural behaviour of ultra-high performance fibre reinforced concrete beams. Constr. Build. Mater. 2017, 138, 12–25. [Google Scholar] [CrossRef]
- Chen, S.; Zhang, R.; Jia, L.-J.; Wang, J.-Y.; Hu, A.; Liang, X.; Yu, J.; Shi, Q.; Yang, I.-H.; Joh, C.; et al. Flexural behaviour of rebar-reinforced ultra-high-performance concrete beams. Mag. Concr. Res. 2018, 70, 997–1015. [Google Scholar] [CrossRef]
- Liu, C.; Zhang, Y.; Yao, Y.; Huang, Y. Calculation Method for Flexural Capacity of High Strain-hardening Ultra-high Performance Concrete T-beams. Struct. Concr. 2019, 20, 405–419. [Google Scholar] [CrossRef]
- Qiu, M.; Shao, X.; Wille, K.; Yan, B.; Wu, J. Experimental Investigation on Flexural Behavior of Reinforced Ultra High Performance Concrete Low-Profile T-Beams. Int. J. Concr. Struct. Mater. 2020, 14, 5. [Google Scholar] [CrossRef]
- Deng, N.; Deng, Y.; Duan, J.; Xue, W. Experimental and Numerical Study on the Flexural Behaviors of Unbonded pre-stressed I-Shaped Steel Encased in Ultra-High-Performance Concrete Beams. Buildings 2023, 13, 2901. [Google Scholar] [CrossRef]
- Rossi, A.; de Carvalho, A.S.; de Oliveira, V.M.; de Souza, A.S.C.; Martins, C.H. A Parametric Study on the LDB Strength of Steel-Concrete Composite Beams. Eng 2023, 4, 2226–2253. [Google Scholar] [CrossRef]
- Nie, J.; Tao, M.; Cai, C.; Li, S. Analytical and numerical modeling of pre-stressed continuous steel-concrete composite beams. J. Struct. Eng. 2011, 137, 1405–1418. [Google Scholar] [CrossRef]
- Jia, J.; Meng, G.; Zhu, W. Experimental study on flexural performance and load-carrying capacity analysis of pre-stressed steel ultra-high-strength concrete composite beams. J. Build. Struct. 2014, 35, 1–10. [Google Scholar]
- T/CECS 203-2021; Technical Specification for Application of Self-Compacting Concrete. Architecture and Building Press: Beijing, China, 2021.
- JGJ 138-2001; Technical Specification of Steel Concrete Composite Structure. Architecture and Building Press: Beijing, China, 2001.
- YB9082-2006; Technical Specification of Steel-Reinforced Concrete Structures. Architecture and Building Press: Beijing, China, 2006.
- Wu, D. Experimental Study on Normal Section Mechanical Performance of Pre-Stressed Built-in H-Beam with Simple Support of Concrete. Master’s Thesis, Northeast Forestry University, Harbin, China, 2009. [Google Scholar]
- GB 50010-2010; Chinese Standard for Design of Concrete Structures. Architecture and Building Press: Beijing, China, 2010.
- Johnson, R. Composite Structures of Steel and Concrete: Beams, Slabs, Columns, and Frames for Buildings, 3rd ed.; Blackwell Publishing Inc.: Oxford, UK, 2004. [Google Scholar]
- Wang, L.; Cheng, D.; Qu, E.; Zhang, D.; Lv, C. Calculation of Additional Internal Forces in Post-Tensioned pre-stressed Concrete Frame Columns Based on Equivalent Lateral Stiffness. Buildings 2022, 12, 644. [Google Scholar] [CrossRef]
Disclaimer/Publisher’s Note: The statements, opinions and data contained in all publications are solely those of the individual author(s) and contributor(s) and not of MDPI and/or the editor(s). MDPI and/or the editor(s) disclaim responsibility for any injury to people or property resulting from any ideas, methods, instructions or products referred to in the content. |
© 2024 by the authors. Licensee MDPI, Basel, Switzerland. This article is an open access article distributed under the terms and conditions of the Creative Commons Attribution (CC BY) license (https://creativecommons.org/licenses/by/4.0/).