Article

Methods for Selecting Design Alternatives through Integrated Analysis of Energy Performance of Buildings and the Physiological Responses of Occupants

1
School of Architecture, Kyungpook National University, 80, Daehak-ro, Buk-gu, Daegu 41566, Republic of Korea
2
Convergence Institute of Construction, Environmental and Energy Engineering, Kyungpook National University, Daegu 41566, Republic of Korea
3
Major of Architecture, Dong-Eui University, Busan 47340, Republic of Korea
4
A3 Architectural Laboratory, Kyungpook National University, Daegu 41566, Republic of Korea
*
Author to whom correspondence should be addressed.
Buildings 2024, 14(1), 237; https://doi.org/10.3390/buildings14010237
Submission received: 11 December 2023 / Revised: 26 December 2023 / Accepted: 10 January 2024 / Published: 15 January 2024
(This article belongs to the Section Building Energy, Physics, Environment, and Systems)

Abstract

:
We propose a technique that allows designers to develop energy-efficient buildings focused on occupants from the early design stage. The technique integrates the physiological responses of occupants and the energy performance of buildings. Among the architectural design elements, we considered the aspect ratio, ceiling height, and window-to-wall ratio as design variables and created 30 design alternatives for a single-occupancy room in a postpartum care center. These design alternatives were recreated in virtual reality, allowing 33 female participants to immerse themselves in the designed rooms. During the experiment, we collected electroencephalography (EEG) data from the participants. Furthermore, we used DesignBuilder to simulate 30 design alternatives and calculated the primary energy consumption per unit area for each alternative. By integrating the EEG data and energy performance analysis, we identified the design alternative among the 30 options that positively influenced the physiological responses of occupants while also being energy efficient. The selected alternative was designed with an aspect ratio of 1:1.6, a ceiling height of 2.3 m, and a window-to-wall ratio of 60%. This research represents a creative exploration that demonstrates how studies combining human physiological responses and architecture can evolve through integration with other subjects. Our findings provide a robust framework to explore the relationship between physiological responses and energy optimization for detailed architectural design elements.

1. Introduction

1.1. Research Background and Objectives

The increasing prominence of sustainability in architecture underlines the role of designers in creating energy-efficient buildings and providing beneficial indoor environments for occupants [1]. This is particularly important during the early design stages, wherein decisions made during the abstract concept phase transition into concrete design steps, significantly influencing the occupants and overall performance of the building [2]. Accordingly, exploring approaches to quantitatively (e.g., annual energy consumption, amount of sunshine, and cost) and qualitatively (e.g., social impact, spatial planning, and aesthetics) meet both aspects of architectural design at this stage can facilitate the identification of high-performance building design alternatives [1].
Various review articles have summarized strategies that enable designers to create high-performance buildings in the early design stage. These strategies are generally categorized into methods that improve building energy performance [3,4,5,6,7], those that offer solutions for enhancing the emotional responses of occupants, such as comfort and visual satisfaction [8,9,10], and research on tools that support the early design stage [11,12,13]. However, these design proposals often overlook the comfort of occupants. Hygh et al. [6] demonstrated that energy consumption increases proportionally with the window-to-wall ratio. In contrast, Kim et al. [14] found that spaces with low window-to-wall ratios induce elevated arousal responses in occupants. Therefore, considering the energy performance of buildings as well as the psychological and physiological responses of occupants is essential, as they can differ for the same design elements.
In this context, studies have holistically analyzed the energy performance of buildings and the emotional responses of occupants. Ashrafian et al. [15] evaluated both the energy performance and visual and thermal comfort of occupants to provide design decision guidelines for glass systems in educational facilities. According to their findings, window glass with a glazing ratio of 50% reduces the occupants’ need for artificial lighting by more than 15% and provides a more comfortable environment for building users. Boodi and colleagues [16] emphasized the need for a building energy management system (BEMS) to improve both energy performance of the buildings and occupant comfort. They also suggested that achieving and maintaining optimal indoor comfort may require more energy, thus highlighting the need for a proper balance between energy use and indoor comfort. Newton et al. [17] suggested applying smart building technologies to basic structures to improve building energy performance while supporting occupant comfort. Their study provided valuable foundational data for related research by presenting the relationship between the key components of occupant comfort and energy performance of buildings. Yeom et al. [18] used DesignBuilder and EnergyPlus to analyze the energy performance based on the optimal visible light transmittance (VLT) of semi-transparent photovoltaics (STPV). They also conducted virtual reality (VR) experiments to assess the psychological satisfaction of occupants, auditory and cognitive task performance, and task load. The significance of their study lies in presenting an innovative methodology that simultaneously considers energy performance and visual comfort to determine the optimal VLT. Seo et al. [19] analyzed the correlation between the solar heat gain coefficient (SHGC) that occupants experience and their preferences based on visibility and energy performance. They provided guidelines for developing an occupant-centric appropriate SHGC. Kim et al. [20] conducted emotional evaluations and energy performance analyses for office buildings. They suggested an optimal transmission rate for office windows that maximizes both visual comfort for the occupants and energy savings.
Recently, by reviewing related prior research, attempts have been made to explore both energy performance of buildings and the emotional responses of occupants. However, these attempts were mostly theoretical explorations based on existing methodologies, and the evaluation of occupant emotions was mainly conducted through self-report surveys [17,18,20,21]. Moreover, the variables used for energy performance analysis were limited to window and glass systems, showing a limitation in the scope [16,18,20]. Consequently, a comprehensive analysis of the essential elements that building designers need to consider in the early design stage is lacking.
This study aimed to overcome the limitations of previous studies by employing cutting-edge technologies such as VR, electroencephalography (EEG), and DesignBuilder to measure the emotional responses of occupants and analyze energy performance of buildings in various design alternatives. It is crucial for architects to recognize the emotional reactions of users to the proposed designs during the planning and early design processes. As building information modeling (BIM) and related technologies focus primarily on the physical elements of buildings, there is an urgent need for developing models that imply subjective preferences of decision makers. Complementing BIM technology is crucial, given that emotional evaluations of the proposed design alternatives by participants can form the basis for decision making [10].
Researchers have employed qualitative research methods, such as observation and interviews, to measure human emotions in the built environment. However, these methods often introduce unintended biases from the researchers, leading to imprecise responses to human emotional demands [22]. The scientific nature of architectural design can be validated using physiological indicators, which provide objective and truthful assessments, avoiding the ambiguity caused by subjective evaluations [23]. In particular, various studies [16,21,24,25] have employed EEG to explore the mechanism underlying the interaction between human subjective evaluation of spatial environments and the perceptual feedback provided by the body [26]. EEG captures electrical signals generated during various brain activities and translates them to numerical data using electrodes attached to the scalp [27]. EEG has been used with traditional questionnaires to analyze the psychological states of participants or the comfort assessment mechanisms in response to environmental changes [28]. Using EEG, Lu et al. [29] found that people feel comfortable when the average illuminance of the workspace is controlled to 300 lx. Choi et al. [30] identified the effects of indoor environment, such as temperature, odor stimulation, and noise, on the stress of occupants through EEG analysis. Li et al. [26] studied overall comfort in a combined environment using a subjective evaluation and EEG and found that the indoor environment considerably impacted the cortical activity of the brain. Guan et al. [31] evaluated the overall comfort of passengers using questionnaires and EEG through field tests in a high-speed rail environment and found that passengers exhibit distinctive neural signals in different comfort states. Peng et.al. [32] used EEG to investigate thermal discomfort and identified the pattern of changes in EEG data in response to thermal discomfort caused by heat or cold. Other studies have examined the EEG of participants in a VR environment, which allows for the rapid assembly of simulations for numerous spaces and related environmental factors, offering an immersive visual experience. Han et al. [33] implemented three environments, namely open nature, semi-open library, and closed underground space, through virtual space and analyzed the EEG data of research participants who experienced them. The results showed that the changes in building space environmental factors and human work efficiency are related to β rhythm. Using VR, designers and occupants can easily complete spatial evaluation and configuration optimization, which considerably shortens the design and review cycle. Accordingly, it is a highly useful technology for designers in the early design stage [26]. Additionally, integrated technology with EEG has proven to be highly useful for confirming the correlation between individual emotional responses and satisfaction with specific design features of the constructed environment in virtual reality. This technology facilitates the measurement of individual emotional responses in a controlled environment [34,35].
In this study, we propose a method that allows designers to directly select energy-efficient design alternatives centered on occupants from the early design stage. Our approach integrates the physiological responses of occupants and the energy performance of buildings.

1.2. Scope and Procedure of the Research

This study replicated a single module space (a single-occupancy postpartum care room) in VR. We analyzed the EEG responses of participants who experienced this space, in addition to evaluating the energy performance of this space using DesignBuilder. A single-occupancy postpartum care room is a space used by mothers to restore their physical and mental health; it is a representative space that requires a comfortable space design that can induce psychological and physiological stability. Additionally, in medical facilities, modular spaces occupy a considerable portion of the entire building, so a design with good energy performance is necessary. Based on our analysis, we set a range that satisfies both the energy performance of the building and the emotional responses of occupants and then selected design alternatives that excel in energy performance while also focusing on the physiological responses of occupants within this range. The study is divided into three major stages, as shown in Figure 1.
1.
VR-EEG experiment and data analysis stage
We created 30 design alternatives for single-occupancy postpartum care rooms, each with different architectural features, in the form of 360° 3D images. During the VR experience, we measured and collected EEG data from 33 female participants. We derived ratio of alpha waves to beta waves (RAB) indicator values, which can provide information on the arousal state of participants from the collected data. Using the Wilcoxon signed-rank test, we verified statistical differences in EEG indices before and after the VR experience. Based on the statistical analysis, we selected target EEG channels. After standardizing and calibrating the RAB indicator values of the selected channels, we identified the range of arousal levels.
2.
DesignBuilder simulation experiment and analysis stage
Using DesignBuilder, we performed simulations for 30 design alternatives and derived the annual primary energy consumption per unit area for each alternative. We examined the influence of each architectural design element on energy performance through a comparative analysis of the design alternatives. Using the elbow method, we derived the optimal K-value based on the annual per unit area primary energy consumption of all design alternatives. We then conducted K-means clustering analysis based on this K-value.
3.
Selection of design alternatives stage
Among the 30 design alternatives created with the combinations of architectural elements, we identified a group of design alternatives that showed relatively low arousal levels based on the EEG responses of participants. We also identified a group of design alternatives with relatively high energy performance based on the K-means clustering analysis of the annual per unit area primary energy consumption. After reviewing the two groups identified in the above-mentioned analysis, we selected the final design alternative that exceled in energy performance, based on the physiological responses of occupants.

2. Methods

2.1. Architectural Design Alternatives

2.1.1. Selection of Architectural Design Elements

The architectural design elements applied in the VR stimuli for measuring the physiological responses of participants and in the simulation for energy performance analysis are the aspect ratio, ceiling height, and window-to-wall ratio. These elements influence energy performance and the psychological and physiological responses of building occupants [6,9,17,36,37,38,39,40]. These elements can be considered fixed architectural design elements related to energy performance design. Prior to the main experiment, preliminary experiments were conducted using 72 design alternatives with three distinct aspect ratios (1:1, 1:1.6, and 1.6:1), four ceiling heights (2.3, 2.5, 2.7, and 2.9 m), and six window-to-wall ratios (0, 20, 40, 60, 80, and 100%). However, as the experiment duration increased, fatigue and drowsiness occurred. The specific types of architectural design elements selected for this study are shown in Figure 2.
The first element, aspect ratio, refers to the ratio of the width to the length of the floor plan in a single-occupancy postnatal care room. Understanding how a specific aspect ratio can influence occupants could serve as a useful reference for architects designing similar modular spaces under similar area conditions. Differences in energy performance have been identified based on the building shape and aspect ratio [5]. In this study, two aspect ratios—1:1.6 and 1.6:1—were set. The 1:1.6 ratio creates a room that appears to have more depth when viewed from the door of the single-occupancy room, while the 1.6:1 ratio creates a room that appears to be wider. The second element, ceiling height, refers to the distance from the finished floor to the finished ceiling. Ceiling height is one of the key factors for evaluating indoor environmental quality; variations in height serve as indicators of feelings of oppression or spaciousness in human psychology [41]. For the ceiling height element, three values—2.3, 2.7, and 3.0 m—were set. The third element, the window-to-wall ratio, was calculated using the following formula: Window Area (Wall Area + Window Area) × 100%. In this study, the following five window-to-wall ratios were set: 20, 40, 60, 80, and 100%.

2.1.2. Design Alternative Modeling

The design alternatives used in the VR-EEG experiment and energy performance analysis simulation were modeled using the combinations of specific types of architectural design elements selected previously (2 aspect ratios × 3 ceiling heights × 5 window-to-wall ratios), resulting in a total of 30 alternatives. The types of architectural design elements for each design alternative are specified in Table 1.
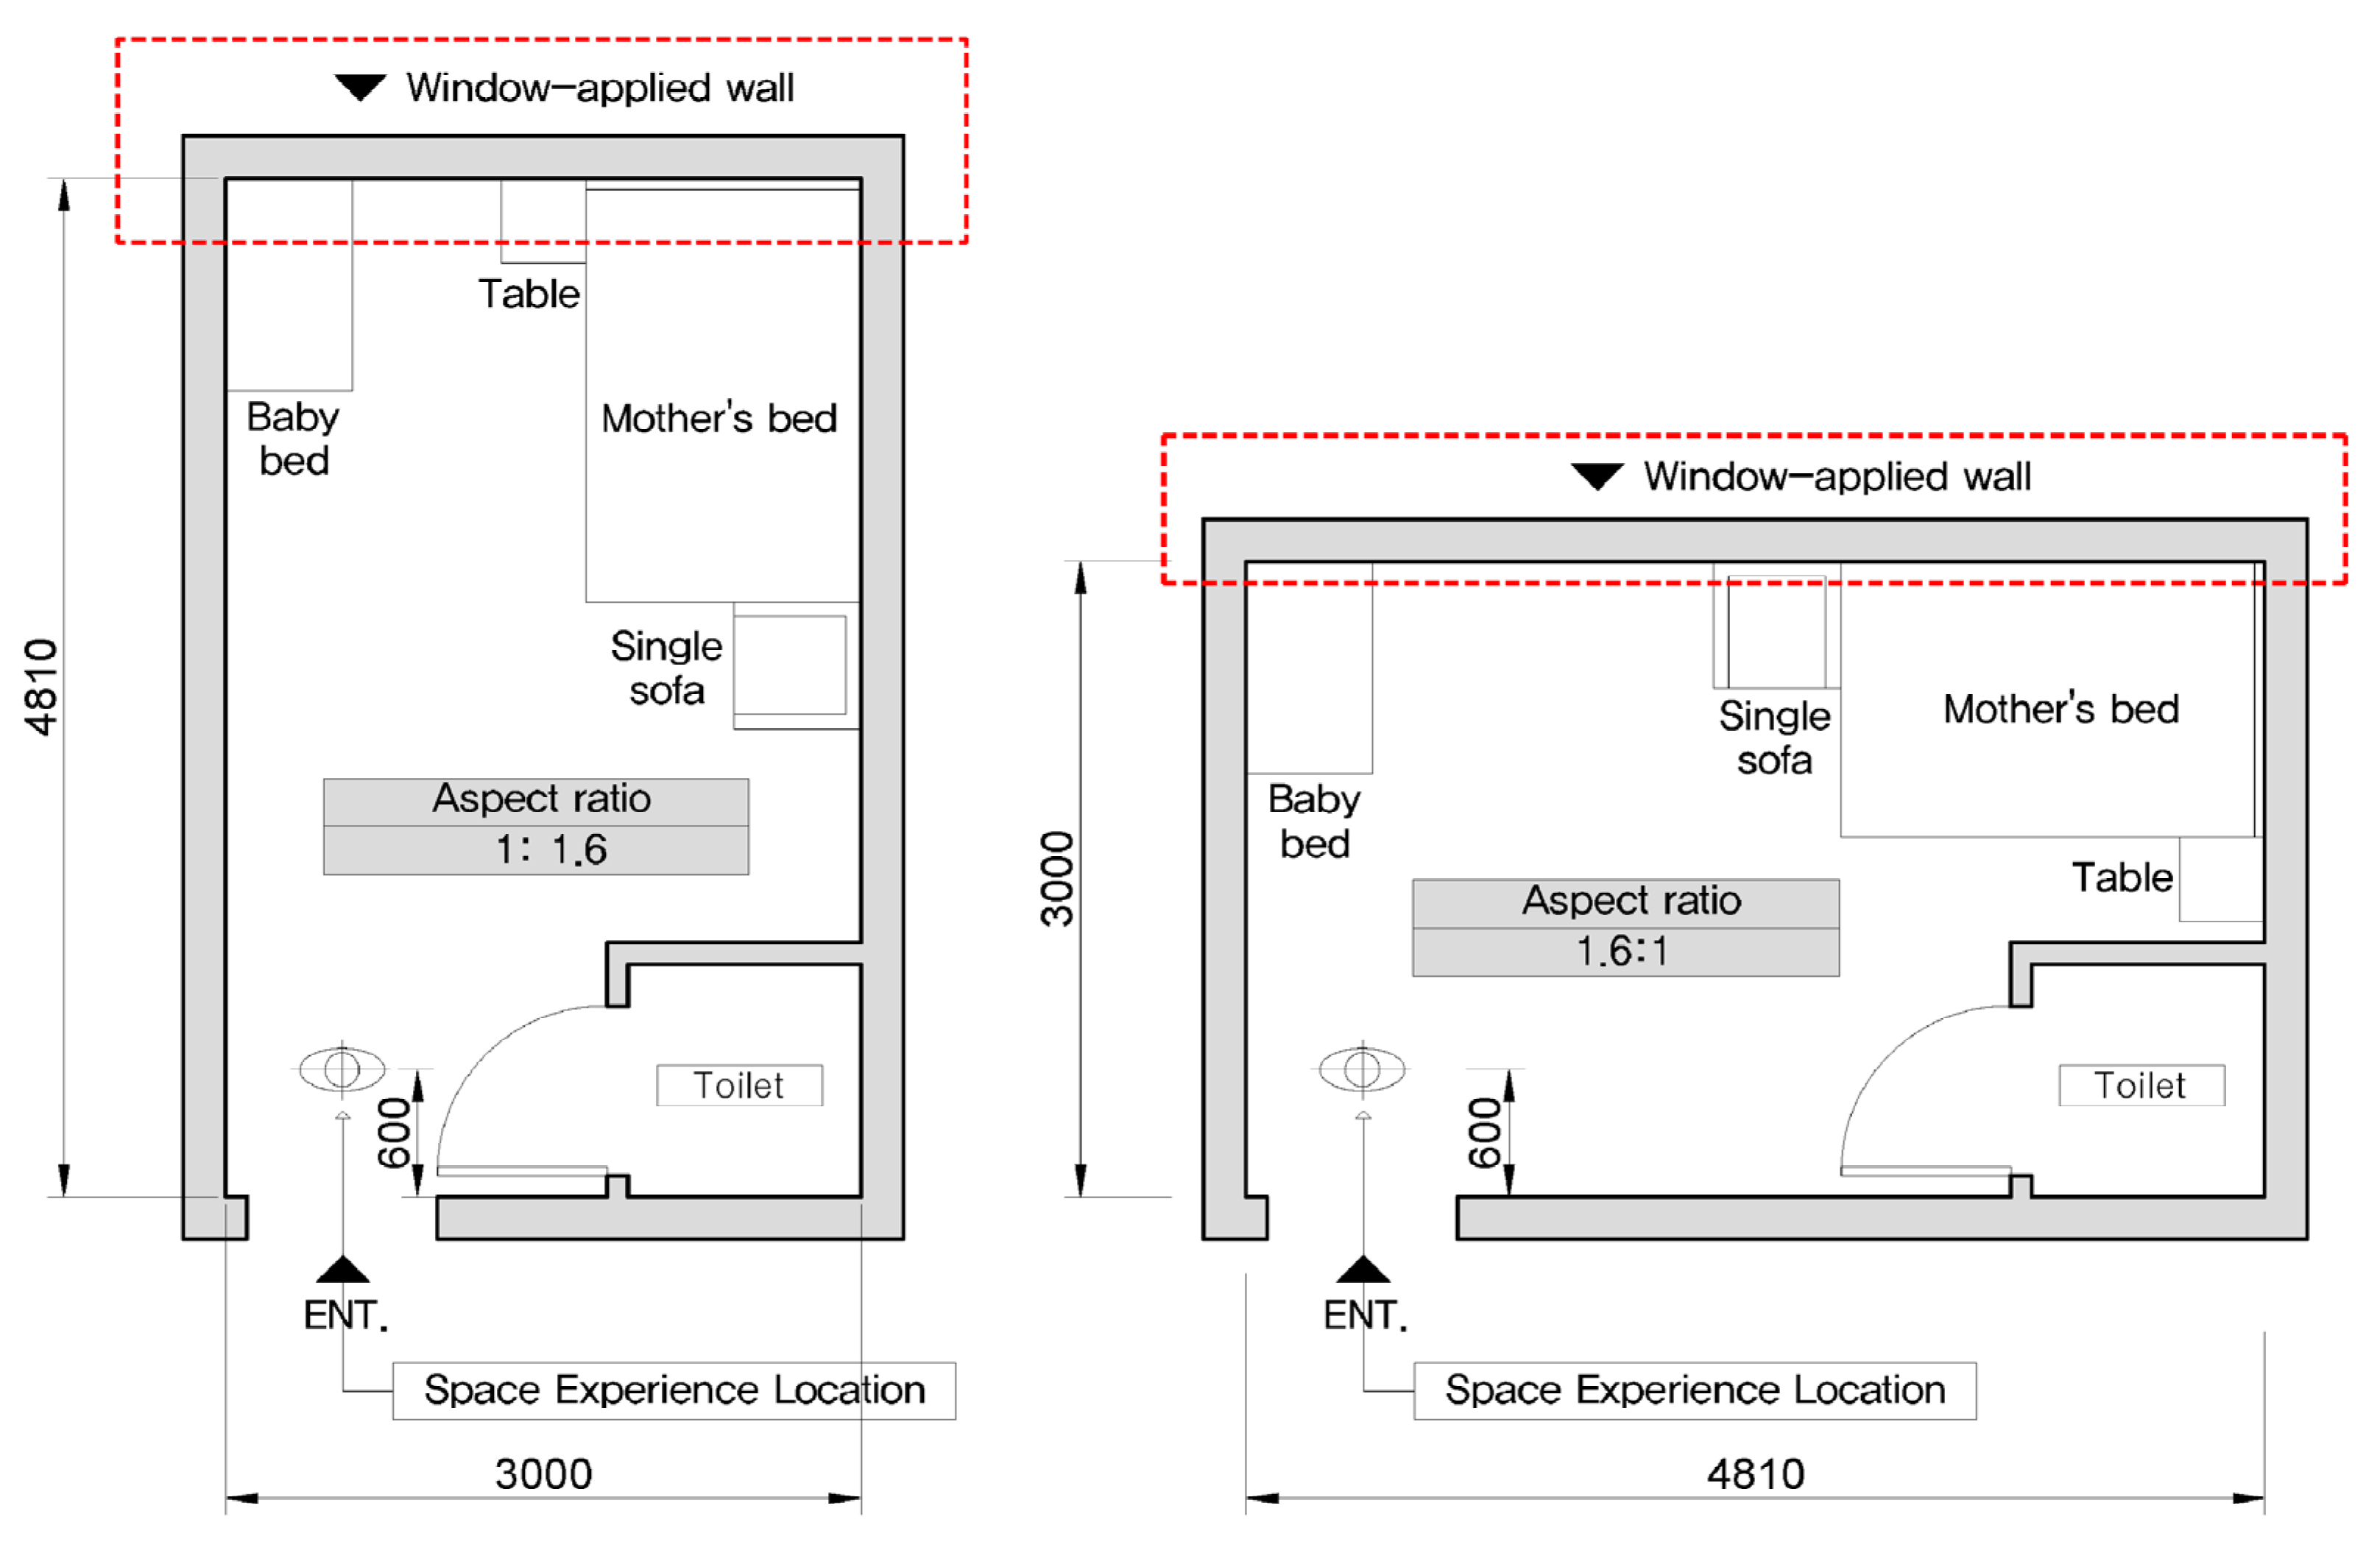
The stimuli for the VR-EEG experiment were created as basic 3D models using Revit Architecture. Material mapping, image viewpoints, and locations were then set in the Twinmotion program, producing a 360° 3D image. The internal area of the postpartum single-occupancy rooms of the care center, which were recreated in VR, was fixed at 13 m2 (excluding the bathroom area), based on single-occupancy room parameters in a postpartum care center in the Busan Metropolitan City. The windows were placed on the wall facing the user upon opening the door. The viewpoint and location were set by simulating the user’s perspective as if they were standing at the door and looking inside. This setting was confirmed in a preliminary experiment wherein we found that due to the small area of the room, the windows and walls were reproduced too close to each other when experiencing the VR space within the room, resulting in a poor sense of immersion.
The view outside the window was mapped using actual photos of the exterior scenery visible from the postpartum care center. Floor plans and representative images for the 30 design alternatives are shown in Figure 3 and Figure 4.

2.2. VR-EEG Experiment

2.2.1. Participants

Virtual reality experiments require the active consideration of factors that affect the sense of presence. Thus, to minimize the influence of experiential clues of the users, we ensured that the study participants in the VR-EEG experiment were women who had experience using single rooms at postpartum care centers [42,43,44].
We recruited 35 participants and, after preliminary interviews, excluded 2 who were taking cold medication; finally, the experiment was performed with the remaining 33 participants. The participants were required to meet the following criteria: had no history of neurological or psychiatric conditions, had normal blood pressure and no heart conditions, felt comfortable in enclosed spaces, were not taking medication for therapeutic purposes, had no sleep-related disorders, and did not wear glasses, as they could potentially interfere with VR simulation. Drug and caffeine intake was prohibited from the day before the experiment, and participants were instructed to get adequate rest. To exclude the interference of stress on the EEG responses of the participants, we conducted a stress self-assessment test using the Psychosocial Well-Being Index—Short Form (PWI-SF). Results showed that 25 out of 31 participants belonged to the potential stress group, whereas 6 belonged to the healthy group, indicating that the participants were relatively stress-free. We conducted an independent t-test to check for differences in background brainwaves between the potential stress group and the healthy group before applying the stimuli. Results showed that there were no significant differences between the groups in all electrode channels at a significance level of p < 0.05.

2.2.2. EEG Analysis Metrics

Among the various physiological reactions that can be measured using EEG, we focused on analyzing arousal responses, as they are crucial from the perspectives of mental stability and stress [43,45,46,47]. Based on the idea that changes in architectural design elements can induce arousal states in VR experiment participants [31,38], this study utilized the RAB metric to identify arousal responses. The RAB metric represents the relative ratio of the energy of alpha waves, which signify a stable state, to the energy of beta waves, which indicate an excited or aroused state. The RAB metric has been proven to distinguish arousal states [48,49]. Yi & Siti [49] verified that as stress increases, the ratio of alpha and beta waves shows a negative correlation and that the ratio of alpha and beta waves can distinguish EEG data characteristics for stress evaluation. Emanuel et al. [50] verified the correlation between individual cognitive performance and the thermal environment by measuring the changes in EEG signal amplitude (alpha and beta, alpha/beta) under uncomfortable environmental conditions related to the thermal environment. Sosiedka et al. [51] analyzed changes in the alpha/beta ratio in the emotional activation effect of olfactory stimulation, demonstrating that there are distinctive subjective emotional evaluations and brain patterns. Benjamin et al. [48] analyzed visual, auditory, and visual perception. In a memory retrieval task, they found that the alpha/beta ratio decreased as the stimulation of specific information increased. Weinstein et al. [52] stated that the relative increase in the beta to alpha ratio is reflected by increased arousal levels; additionally, Ramirez & Vamvakousis [53] stated that the beta/alpha ratio could be a reasonable indicator of individual arousal. The final RAB metric value used in this study is the value obtained by subtracting the pre-experience background RAB metric from the RAB metric measured after the VR experience (Figure 5).

2.2.3. Experimental Environment and Procedures

The experiment was conducted in a classroom at the Kyungpook National University from 29 October to 1 November 2020, between 10 a.m. and 4 p.m. Before the experiment, we ran Experiment Center 4.0 to load 30 pre-made stimuli, set their exposure times, and arranged tasks so that they could be presented to each experimental group.
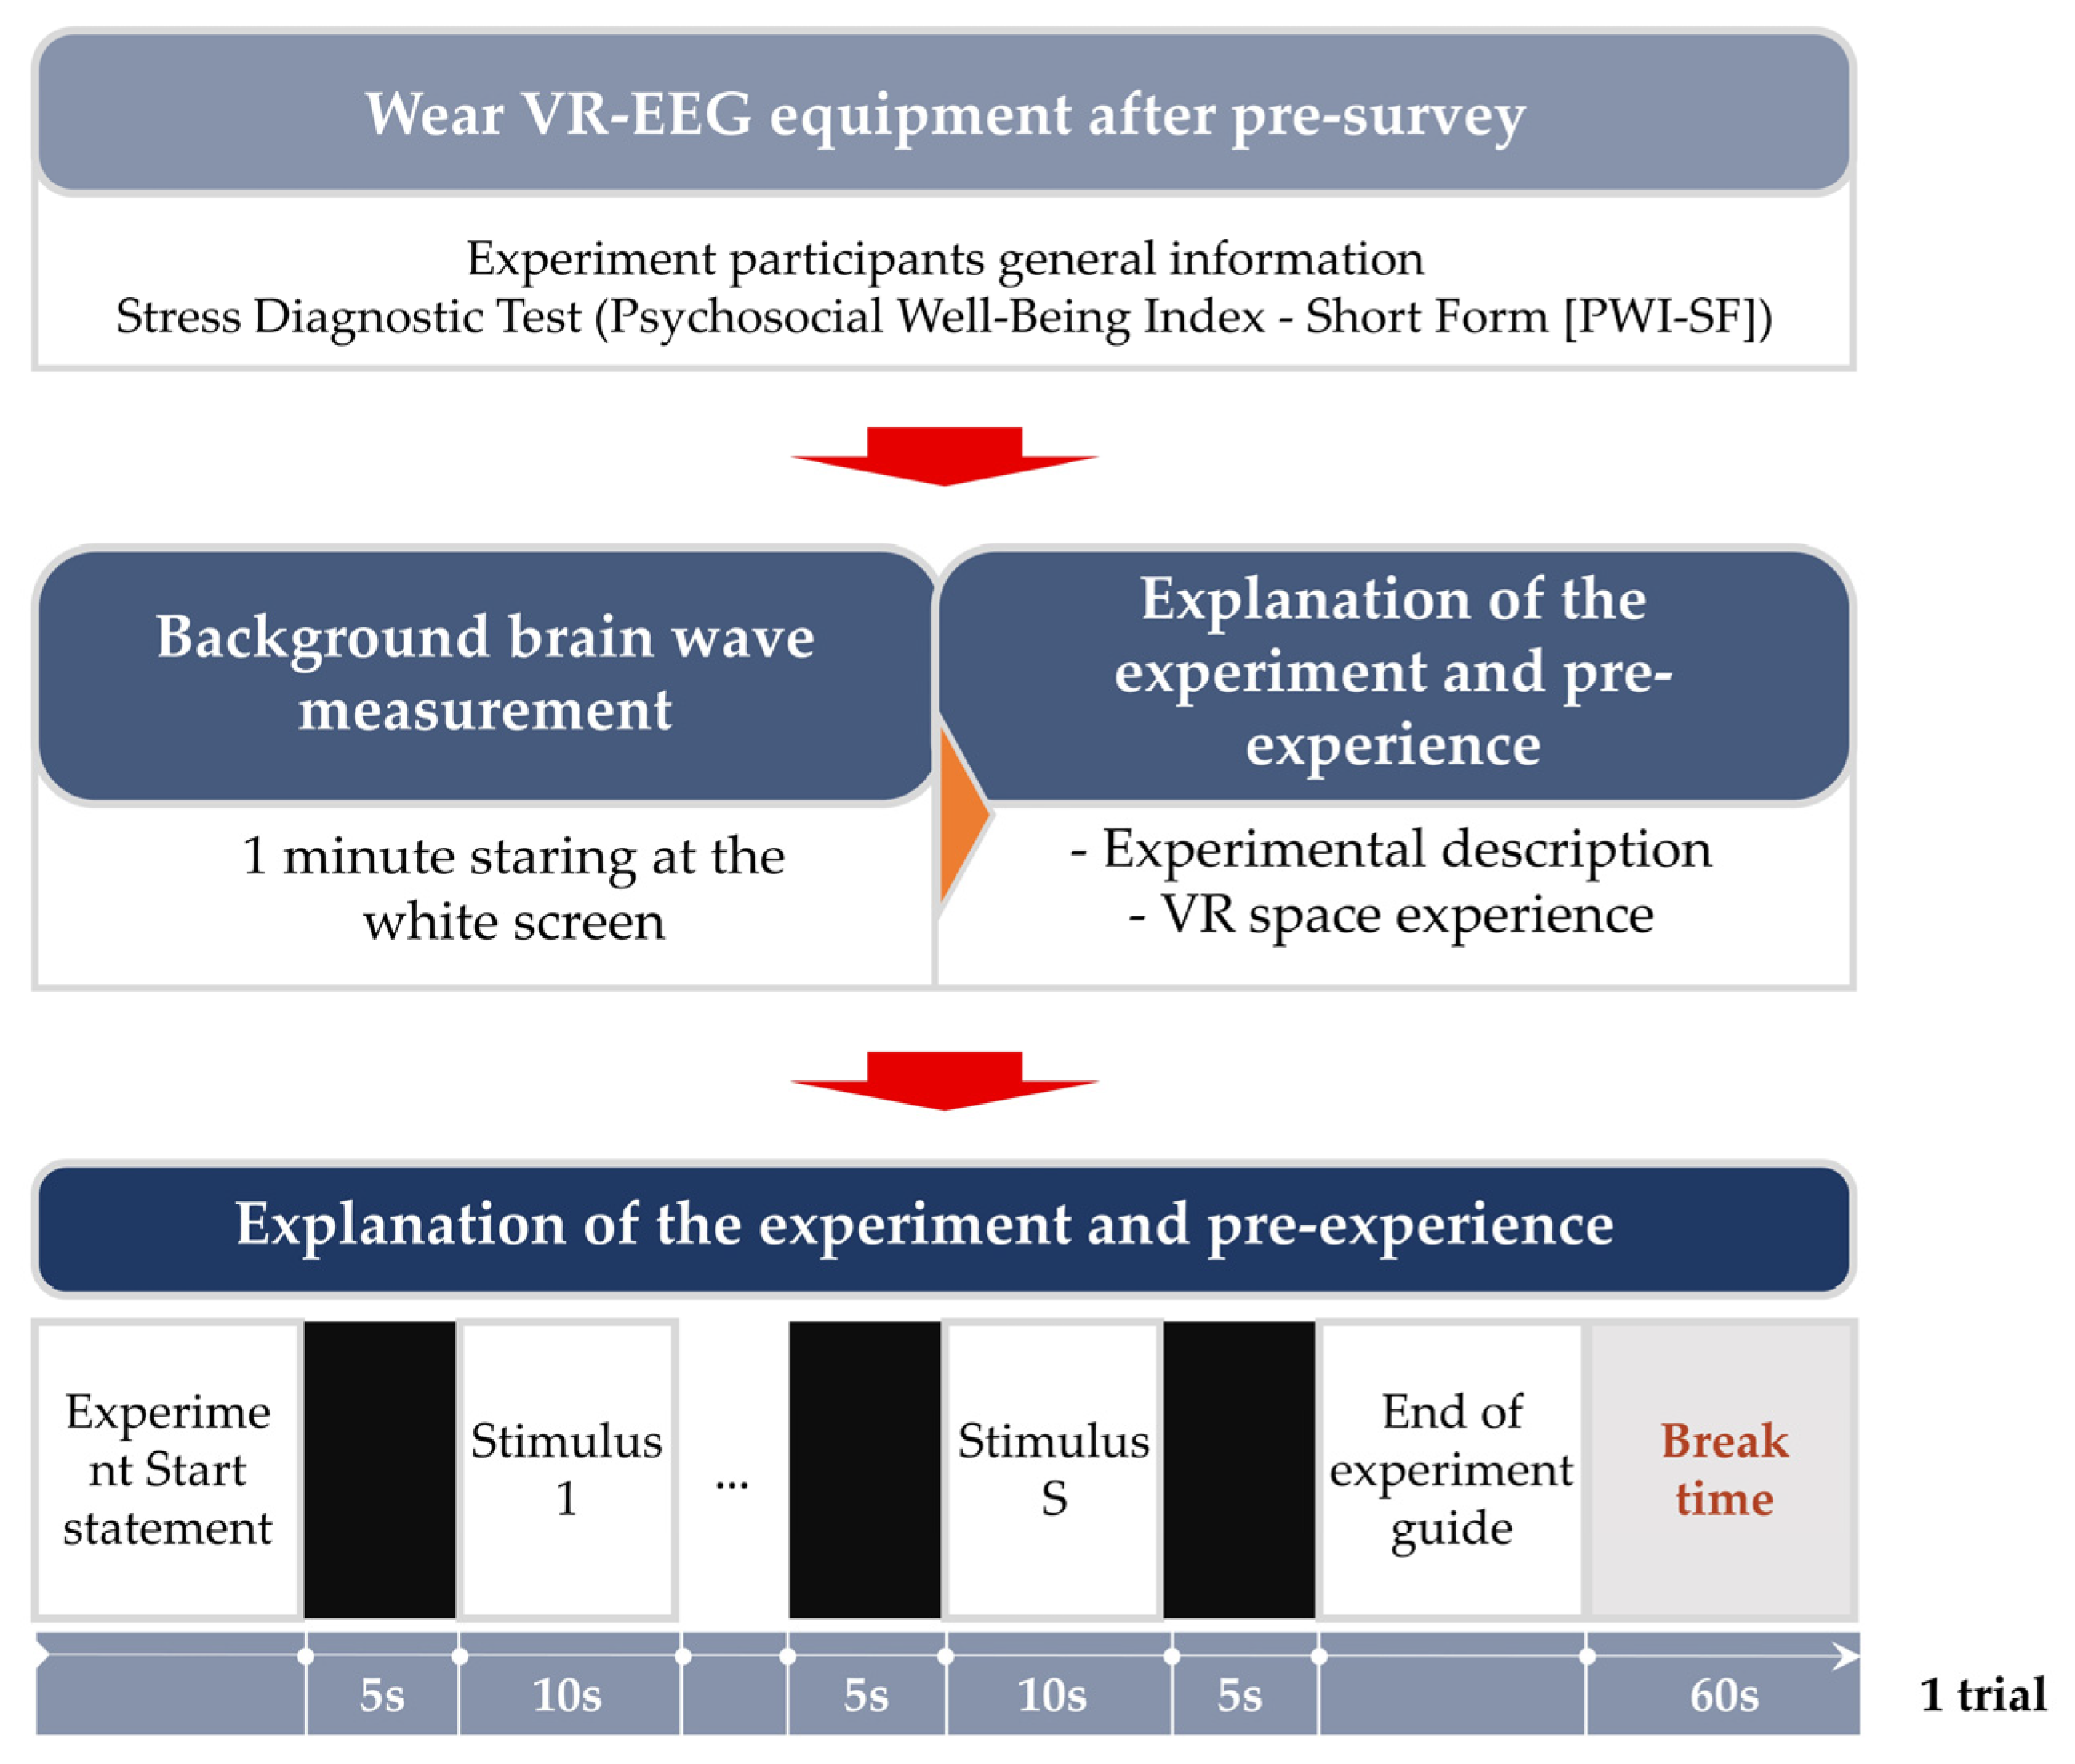
The participants filled out a questionnaire comprising general information and stress assessment forms before participating in the experiment. After taking sufficient rest, they sequentially wore the EEG and VR equipment. After adjusting each electrode to ensure proper contact with the scalp, we confirmed that the impedance of all electrodes had dropped to below 1 and initiated the experiment. We used the international 10/20 system to attach 19 EEG electrodes (Fp1, Fp2, Fz, F3, F7, F8, Cz, C3, C4, T3, T4, T5, T6, P3, P4, Pz, O1, and O2). The reference electrode was placed behind the right ear and the ground electrode behind the left ear. EEG measurements were conducted using the monopolar derivation method. First, we measured background brain waves for 1 min while the participant was in a relaxed state, looking at a white screen in VR with no stimuli. After explaining the experimental procedure, we allowed the participants to experience similar stimuli in VR to get accustomed to the VR stimuli. The 30 stimuli were divided into six blocks, and both the blocks and the stimuli within each block were presented in a random order. In this study, setting the exposure time per stimulus was a crucial aspect. Lee et al. [54] exposed the participants to photo stimuli for 10 s per stimulus and a black screen for 10 s between stimuli. Jing et al. [55] used photo expositions of 5 s and a black screen for 1 min between stimuli. Olszewska-Guizzo et al. [56] used photo expositions of a city for 10 s and a black screen for 2 s.
As such, the exposure time to brain wave stimulants varies between studies; if the experiment duration is prolonged, drowsiness occurs, making it impossible to accurately derive the brain wave changes caused by stimulation. Therefore, we conducted a preliminary experiment referring to the stimulus exposure time and the black screen exposure time between stimuli suggested in previous studies. Afterward, interviews were used to determine the appropriate exposure time to ensure that overall spatial exploration was well achieved without causing drowsiness in the participants.
Accordingly, the exposure to visual stimulus was set to 10 s, and the exposure to the black screen to minimize the effect between stimuli was set to 5 s. The experimental environment and the overall experimental procedure are shown in Figure 6 and Figure 7, respectively. During the experiment, participants experienced virtual reality by slowly moving their heads left and right as long as muscle movement did not cause interference. This behavior was confirmed in preliminary experiments to considerably improve immersion in space.

2.2.4. Experimental Tools

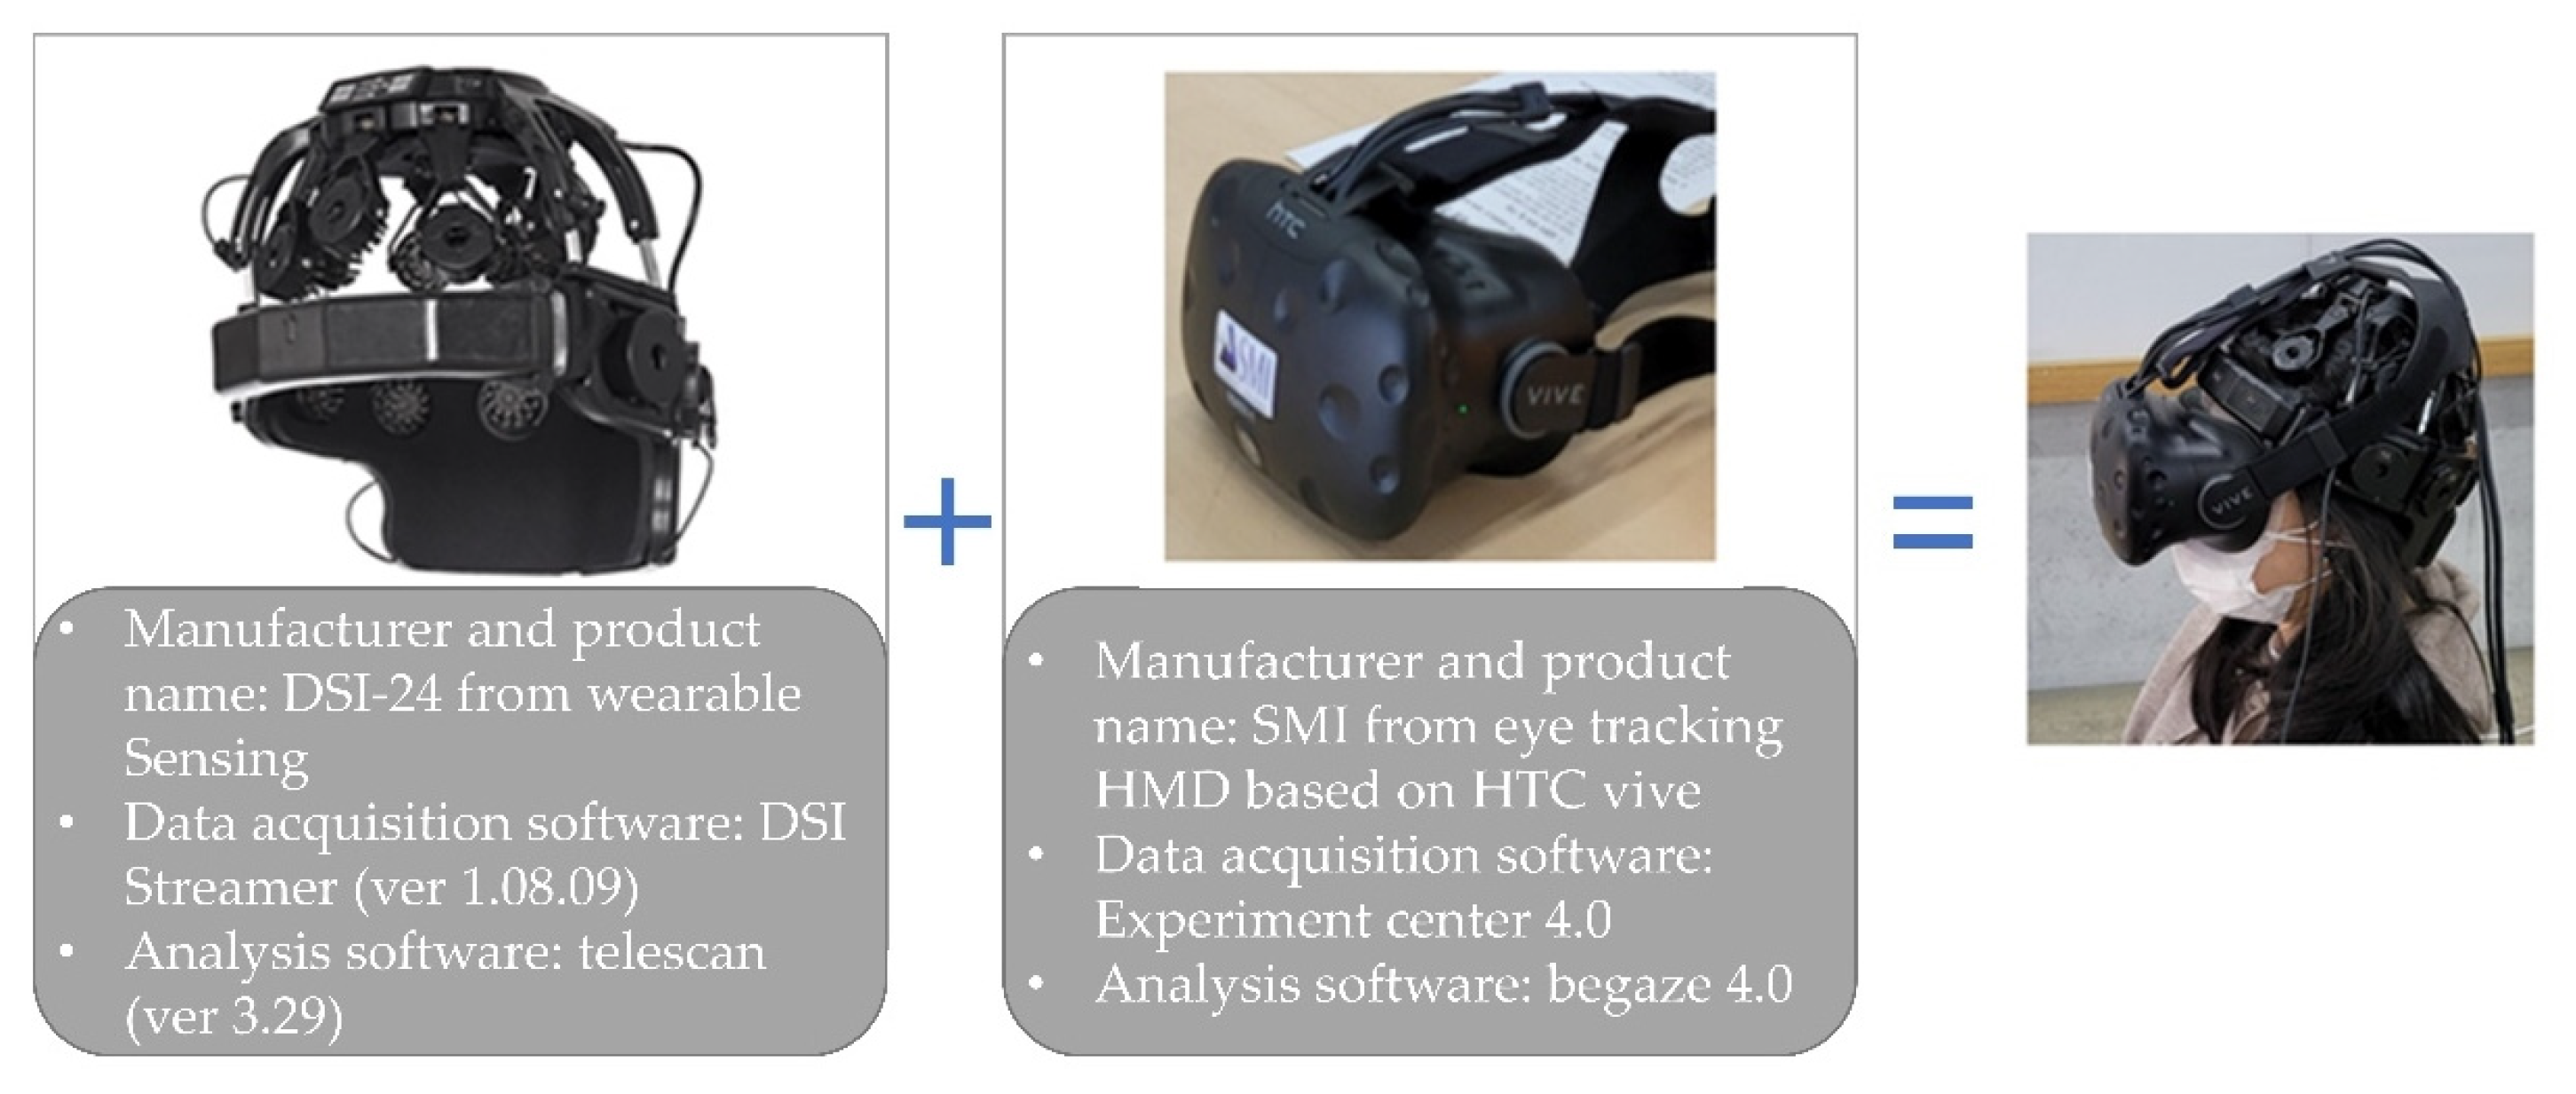
The VR equipment used in the experiment was an eye-tracking head-mounted display (HMD) based on the high-tech computer (HTC) Vive from SMI, and DSI-24, a 24-channel wireless and wired dry EEG measurement device, from Wearable Sensing (Figure 8).

2.2.5. Data Preprocessing and Statistical Analysis

This study utilized EEG data from the following eight regions of the brain: frontopolar (Fp1 and Fp2), frontal (F3 and F4), parietal (P3 and P4), and occipital (O1 and O2), collected from 19 channels. Of the 33 participants, data from 2 individuals with significant noise were excluded, leaving data from 31 participants for analysis. The collected raw EEG signals were acquired using the real-time data collection software DSI-streamer (Ver 2.3, Wearable Sensing, San Diego, CA, USA), and the exported CSV files were converted using the time-series analysis software TeleScan (Ver 3.2, Laxtha, Daejeon, Republic of Korea) for EEG data analysis. EEG signals from all 19 channels were sampled at a frequency of 300 Hz, converted using a 16-bit analog-to-digital (AD) converter, and stored on a computer with a passband frequency of 0.003–150 Hz.
EEG signals are feeble physiological electrical signals easily influenced by external factors and individual eye-blinking activity. To remove artifact noise mixed into the EEG signal, it is necessary to preprocess the EEG signal before analysis [31]. We manually observed data in the TeleScan program for significant abnormalities in the waveform due to body movement, facial muscle activity, and swallowing artifacts. Consequently, of 33 experiment participants, the data of 2 individuals with high noise were excluded. The EEG data of 31 people were filtered for eye movement and eye-blink artifacts via EOG-Artifact Filtering. The main logic of EOG-Artifact Filtering is the PCA filter. PCA analysis is applied to the EEG signal to decompose it into independent principal components with a correlation coefficient of ‘0’; the principal components corresponding to the eye movement component are excluded. It is a filtering technique that later restores the signal with the remaining main components [57].
The collected raw data were transformed into RAB indicator values through the fast Fourier transform (FFT) and coded into SPSS 18.0. For the RAB index value for each stimulus, the average value for 8 s was used in the analysis, excluding 1 s before and after each to remove the influence of the black screen in the 10 s measurement value. A Shapiro–Wilk test was conducted to verify data normality [58,59]. The test results indicated that the p-value for some of the EEG data was less than 0.05, failing to establish normality. Thus, non-parametric statistical analysis methods were applied to analyze the EEG data for this study.
To discern the impact of changes in architectural design elements on user relaxation arousal and stress response signals, we conducted the Wilcoxon signed-rank test, a non-parametric method for paired sample t-tests. The significance level was set at p < 0.05.

2.3. Energy Performance Simulation

2.3.1. DesignBuilder Software

DesignBuilder is an advanced modeling tool for simulating construction systems, including aspects such as architecture and heating/cooling systems [60]. It allows for the analysis of the energy performance of a building through various aspects of simulation, including lighting and energy systems [61].
DesignBuilder is based on the EnergyPlus building energy simulation program from the US Department of Energy. It includes Leadership in Energy and Environmental Design (LEED) and American Society of Heating, Refrigerating & Air Conditioning Engineers’ (ASHRAE) 90.1 data values (including location, weather, occupancy schedules, window types, mechanical ventilation, and water heating schedules). The software enables 3D model visualization and dynamic simulation of environmental conditions such as light, temperature, and CO2 [62]. DesignBuilder produces results consistent with the original EnergyPlus outcomes through envelope verification tests.

2.3.2. Evaluation of Model Input Conditions

To analyze energy performance, we created a single thermal zone model of a typical single-occupancy postnatal care room using DesignBuilder. Based on the shape factors of the model, we sought to analyze the annual primary energy consumption per unit area.
The simulation model for this study was a single-layer individual room. The model comprised a 3400 mm × 5200 mm-sized unit with a 300 mm thick exterior wall. Furthermore, it consisted of exterior walls, slabs, and windows, and the thermal performance of each component was set based on the EPI (Environmental Performance Index) for South Korea. The exterior walls and flooring were composed of concrete, insulation, and finishes, while the windows were made of high thermal performance low-E glass. Low-E glass was selected to meet the thermal transmittance requirements of regional building parts based on the energy-saving design standards of South Korea. Low-E glass is glass that is coated with a special metal film (generally silver) with high infrared reflectance inside regular glass, which improves the insulation performance of buildings. The windows were fitted only on the south-facing wall. The location of the model was set to Seoul, and climate data were sourced from TMY2 (Typical Meteorological Year) weather data of Seoul provided by Transient system simulation (TRNSYS). An overview of the applied model is shown in Table 2.

3. Analysis Results

3.1. Analysis of the EEG Responses of the Participants

3.1.1. Analysis of RAB Indicator Values for Design Alternatives

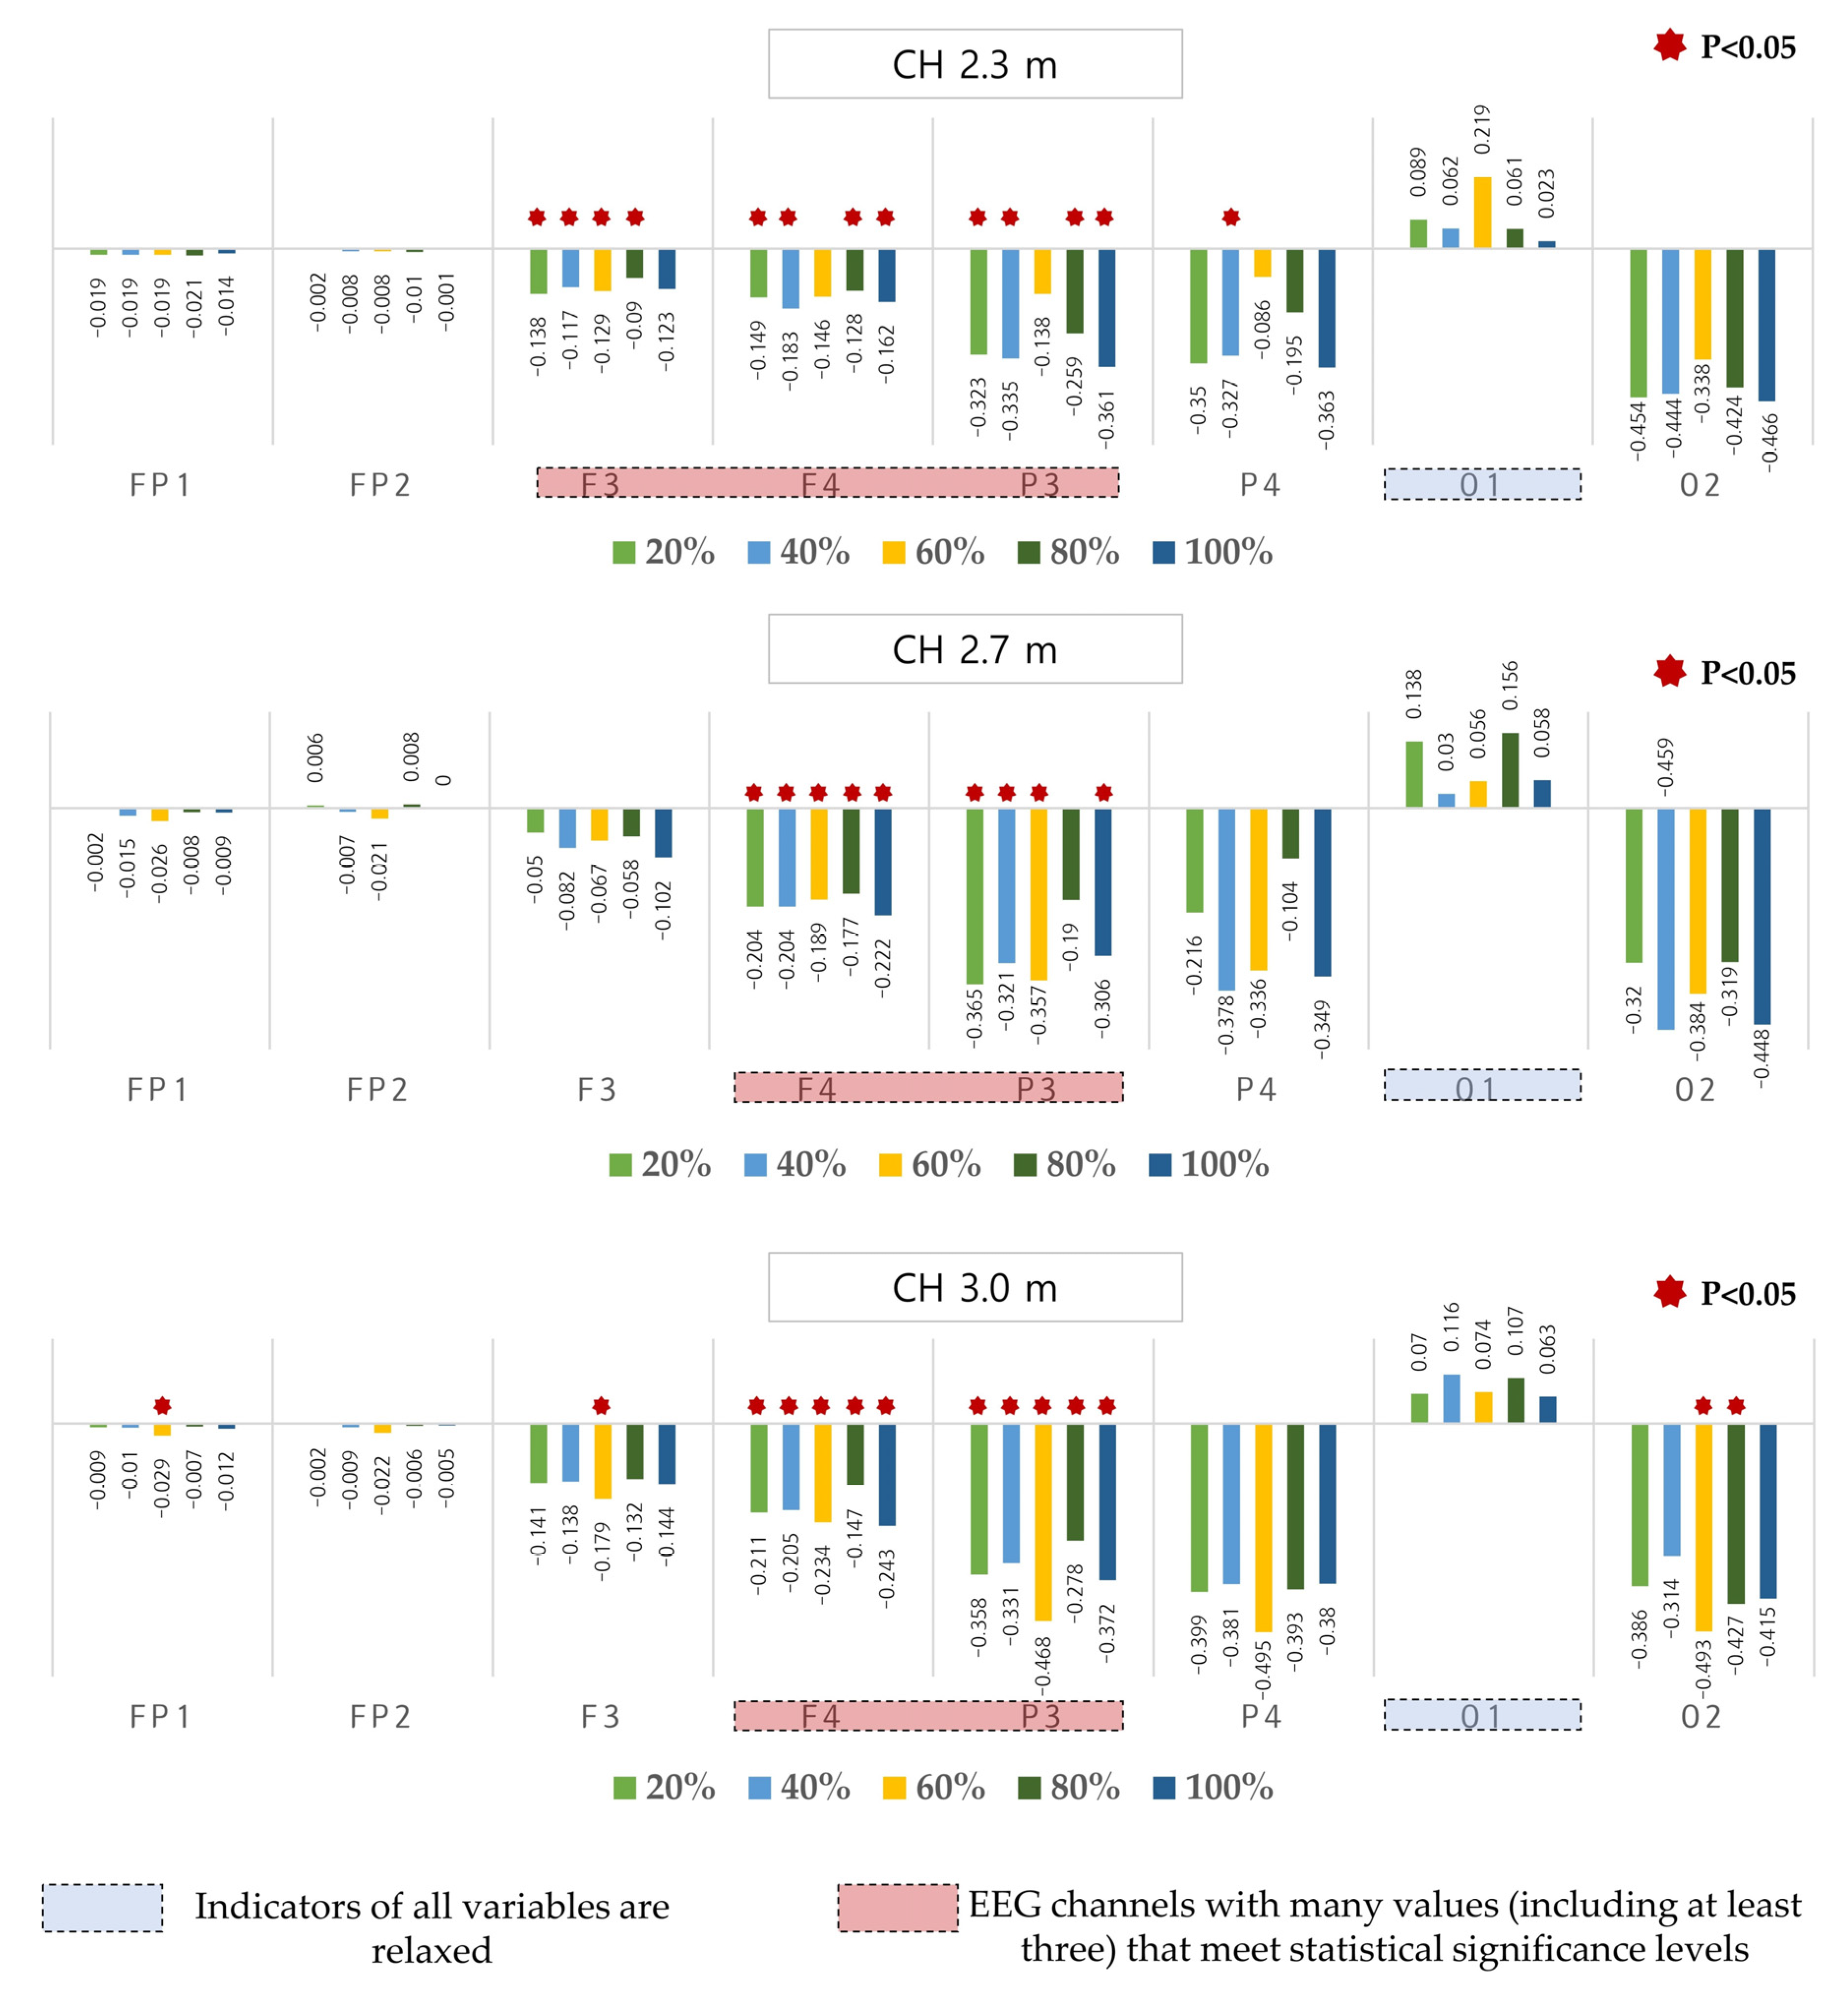
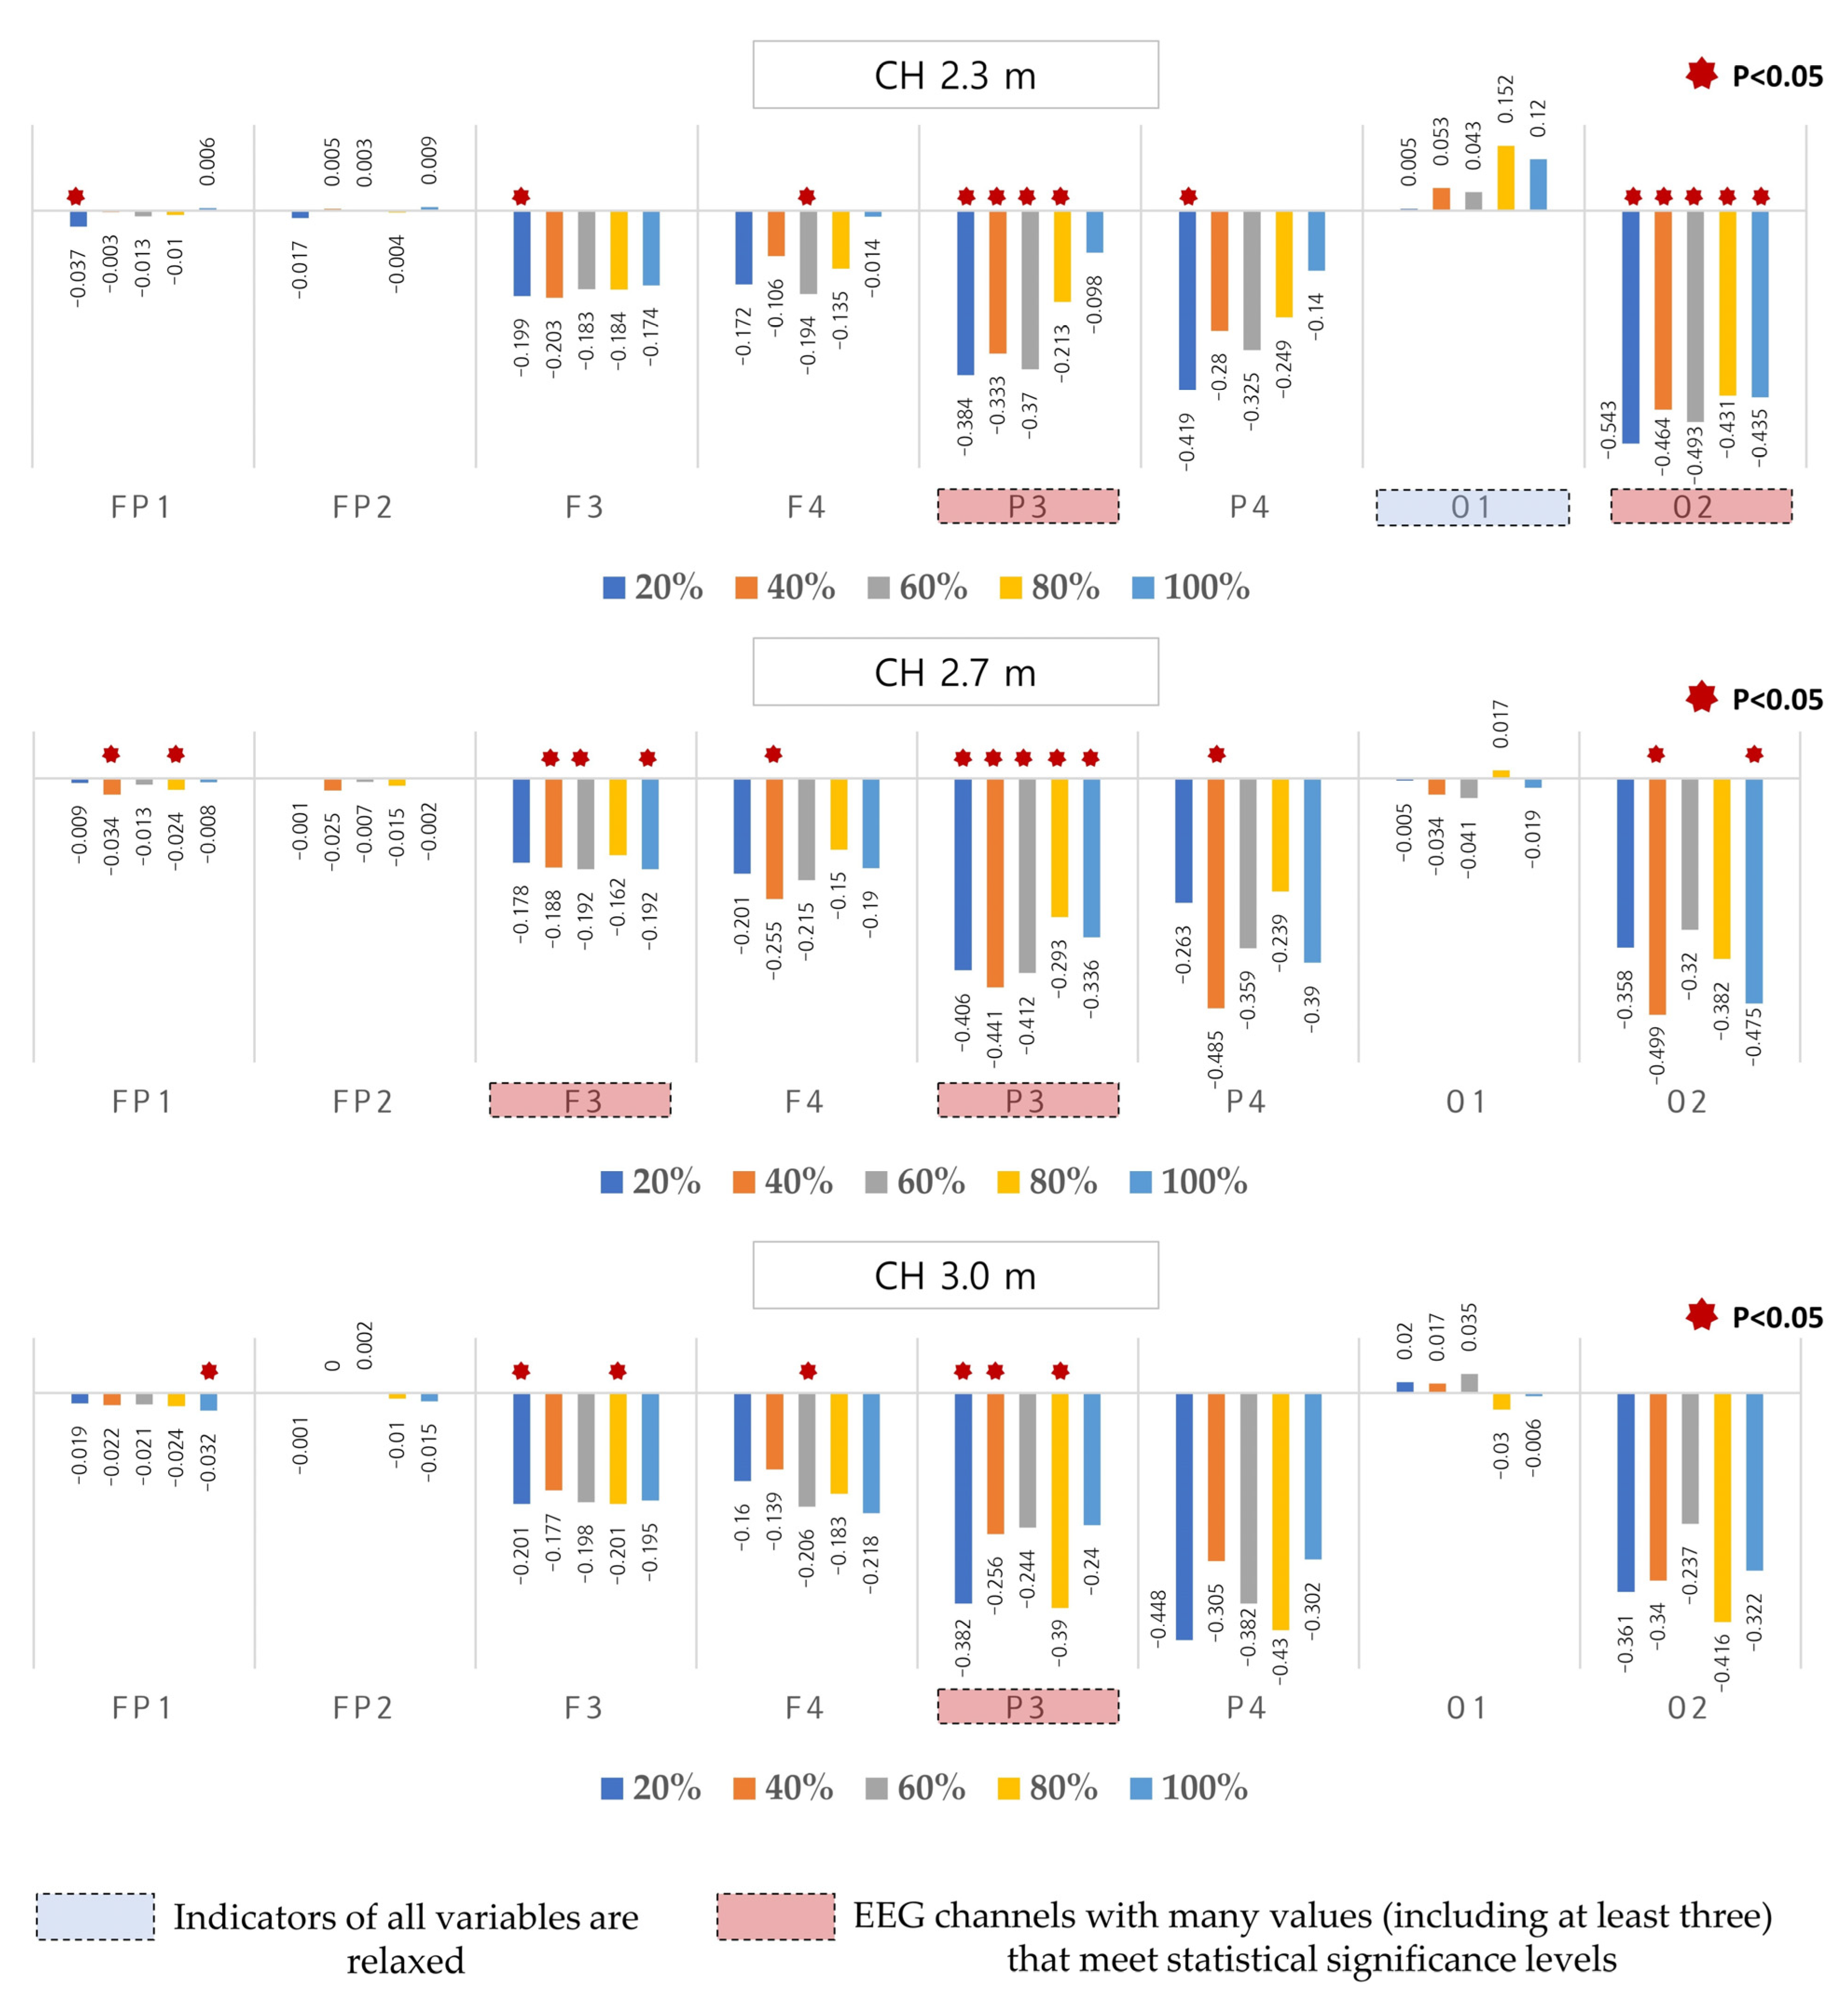
EEG responses to architectural design elements were organized around EEG channels showing statistically significant differences (p < 0.05). Figure 9 and Figure 10 show the graphs of statistical analysis results for RAB indicator values. Here, positive values for post-stimulus minus pre-stimulus indicate relaxation, while negative values indicate arousal.
Upon analyzing the difference in RAB indicators before and after the VR simulation with applied changes in architectural design elements, multiple EEG channels showed statistically significant differences for both the <1:1.6 type> and <1.6:1 type> aspect ratios, specifically in brain regions. In both designs, the RAB decreased after the stimulus, indicating an arousal response. The decrease was larger with the <1.6:1> aspect ratio than with <1:1.6>. RAB indicator values differed depending on the window-to-wall ratio; under the same window-to-wall ratio, values differed depending on the aspect ratio and ceiling height. Comparisons between designs with different ceiling height values revealed differences in the degree of change in RAB indicator values.
Although not statistically significant, in all combinations of the aspect ratio and ceiling height elements, the O1 channel in the left occipital lobe showed an increase in the RAB value, indicating relaxation. In summary, this analysis shows that the changes in architectural design elements statistically affect EEG arousal responses, underscoring the importance of considering the physiological responses of occupants in architectural space design.

3.1.2. Selection of EEG Analysis Channels

The channel that showed the most significant differences in RAB indicator values before and after the stimulus was identified as the P3 channel in the left parietal lobe. This suggests that while VR stimuli affect EEG parameters across the entire brain, there are specific brain regions involved in arousal responses.
These findings align with previous research indicating that the parietal lobe, responsible for somatic sensation, is influenced by thermal comfort and arousal levels [63]. Another study [64] claims that the central and surrounding channels in the parietal lobe should be the focus when examining arousal stimuli. Moreover, previous studies support the validity of using EEG data from the parietal channels to assess arousal responses to design alternatives in the early stages of architectural planning, particularly in the context of gradual changes in architectural features activating the parietal region [65,66,67].

3.1.3. Setting Arousal Level Ranges

Since the means, standard deviations, and other statistical parameters of indicator values for each combination of architectural design element stimuli vary, these values must be standardized to determine their importance based on how far they deviate from the mean or median and the distribution tendencies of data. Standardization, a data transformation method that changes the distribution or properties of data, was divided in this study into the mean correction stage and the standard deviation correction stage for RAB indicator values. The detailed procedure is shown in Figure 11. Through this process, the mean and standard deviation of the indicator values are equally corrected, thus enabling comparisons and observations on how far data deviate from the mean or median.
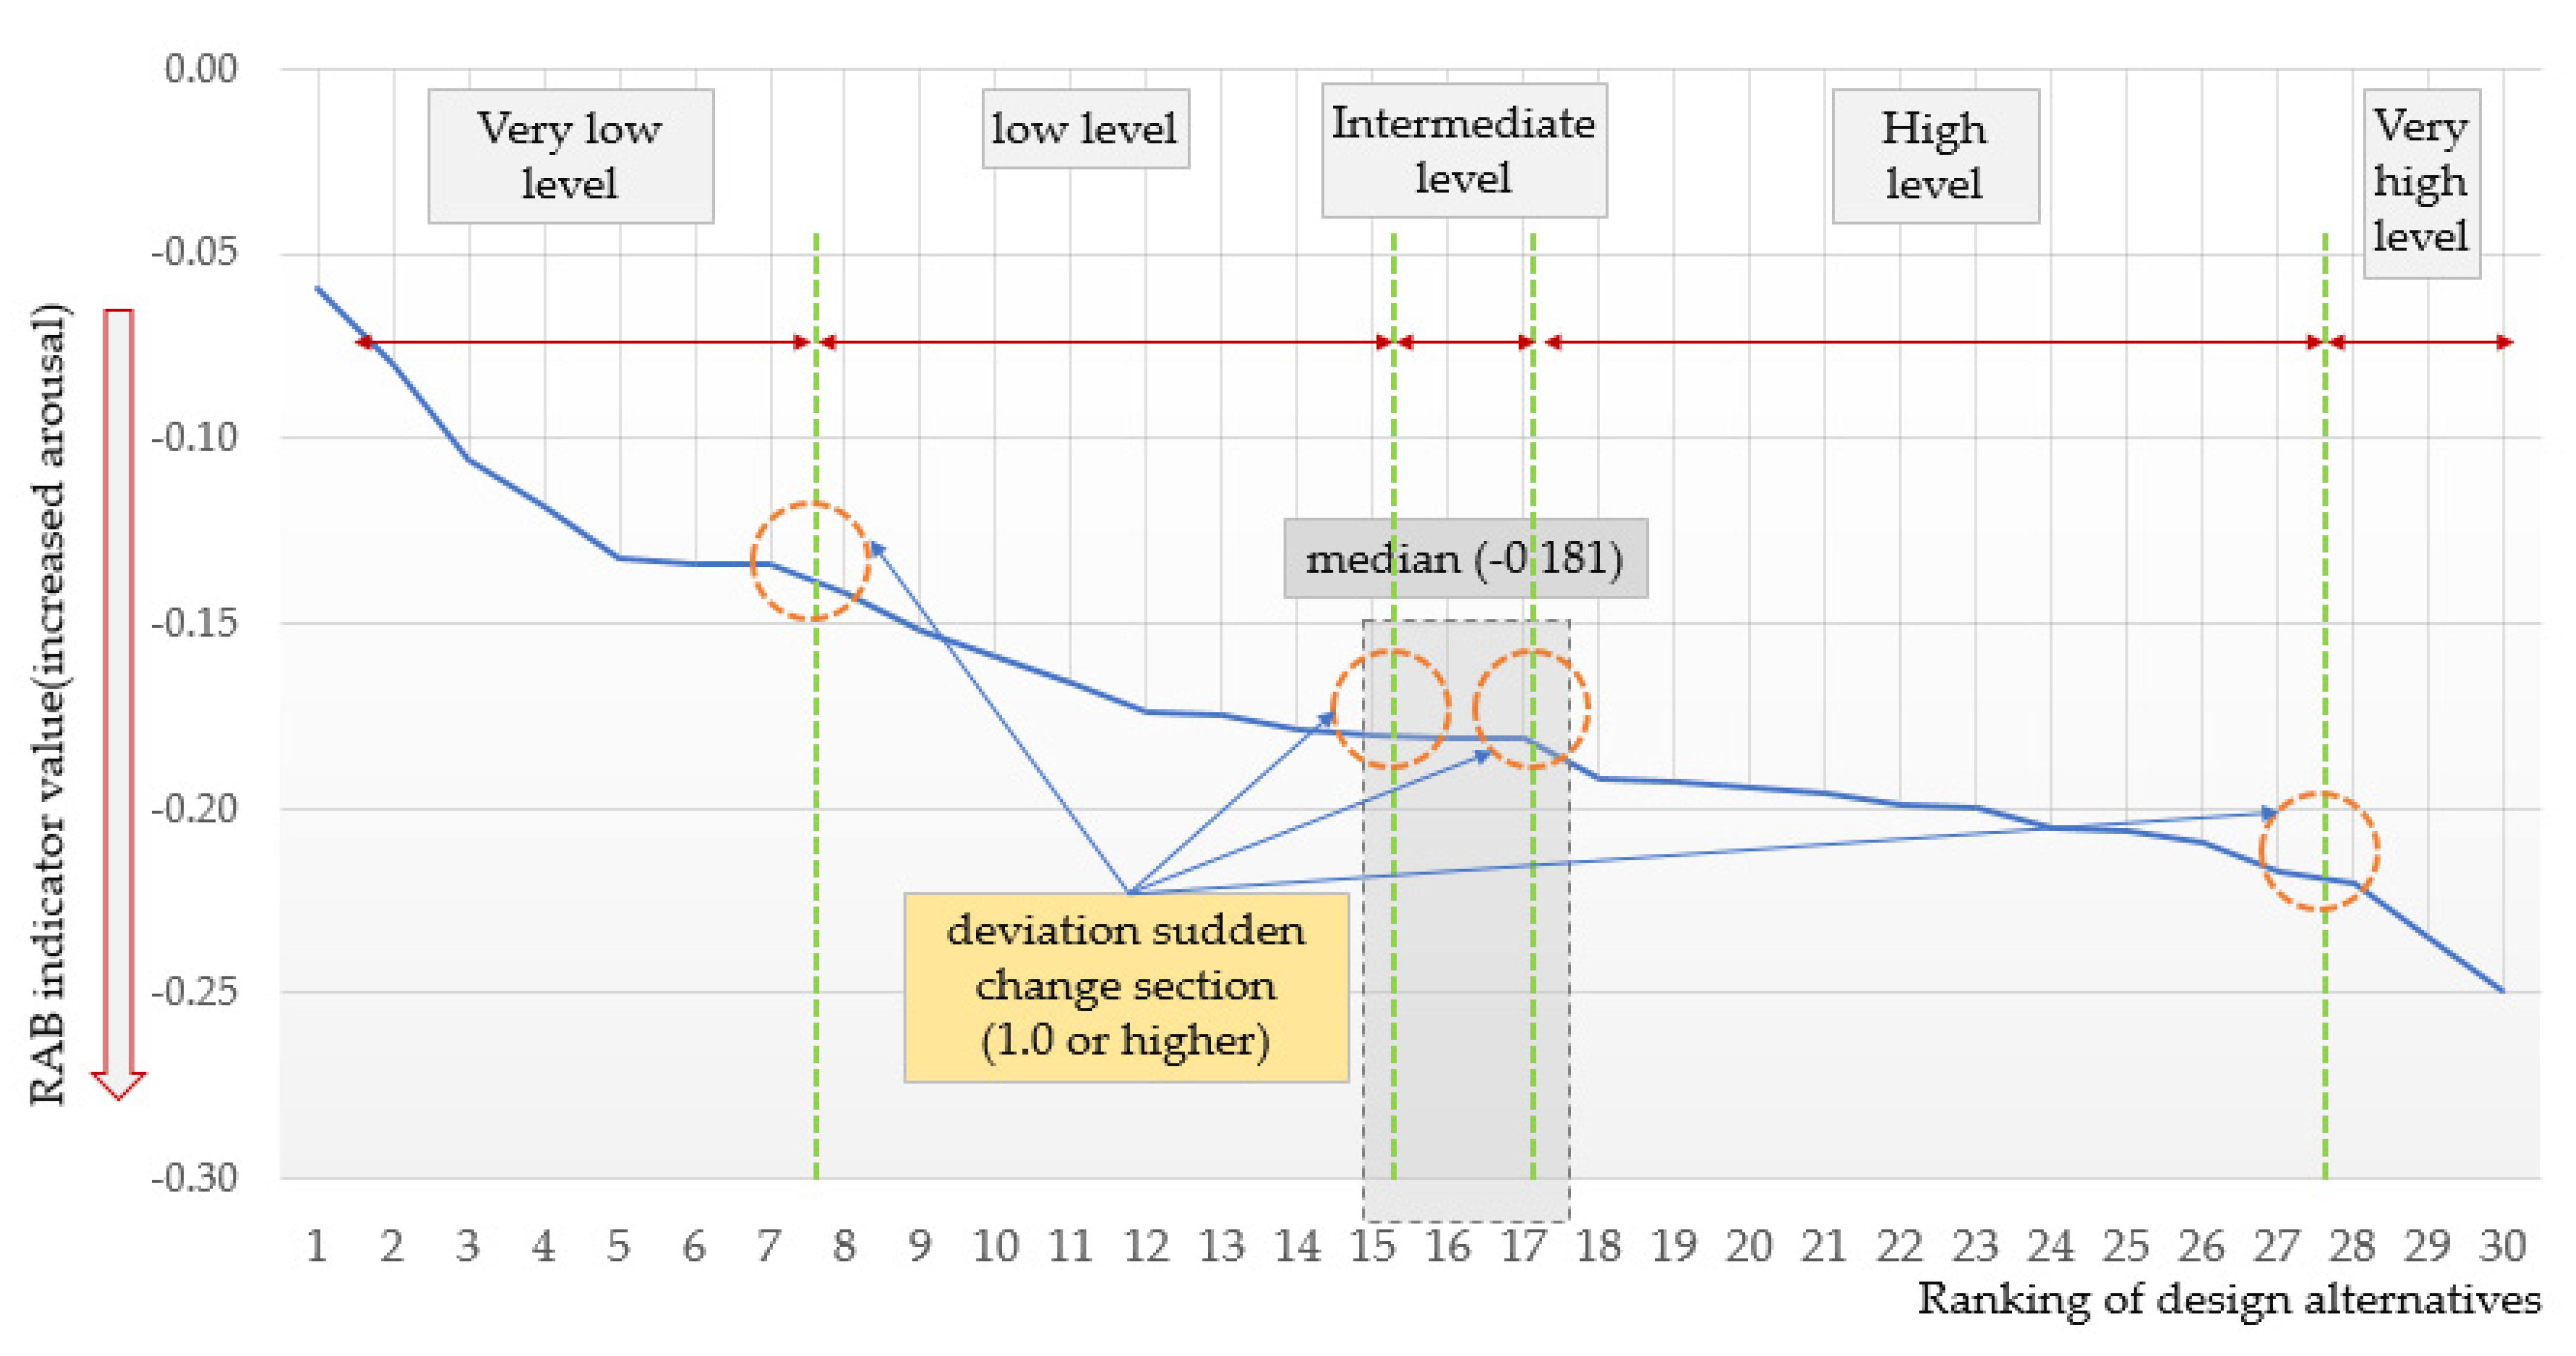
Meanwhile, the lack of standardized databases or criteria for assessing the level of arousal responses based on EEG data means that experimental data must be used to derive the ranges for EEG indicator values. The most important consideration when establishing this range is that the EEG indicator values for the 30 VR stimuli must be interpreted in relative terms to be meaningful. The RAB indicator value for a stimulus formed from the combination of aspect ratio, ceiling height, and window-to-wall ratio cannot be judged as high or low on its own; it can only be considered high or low relative to the values for other stimuli. Therefore, in this study, the range for arousal levels was determined by calculating the median of the RAB indicator values and using the deviation rate from the median to focus on areas with rapid change; the detailed procedure was as follows.
First, after correcting the mean and standard deviation, individual indicator values were sorted in order of magnitude, and the median was calculated. The reason for using the median instead of the mean as a representative value was that the mean may not be representative due to outliers. Furthermore, because the relative interpretation of all 30 stimuli is important, examining the deviation rate through the median is more appropriate. Since there were cases where the sorted individual indicator values had the same rank, ranks were assigned to the entire set of indicator values; the median value of the data with an even number of total data was calculated based on the formula (n/2 or (n/2) + 1). The median value of the RAB index calculated using this formula was (−0.181).
Second, to examine the extent to which each indicator value deviates from the median, we calculated the deviation rate as ((indicator value − median) × 100) and derived the rapid change areas by calculating the gaps between each deviation rate. Upon examining the gaps between the deviation rates, we confirmed that for the RAB indicators, when the gap is 1.0 or greater, the indicator value rapidly increases or decreases.
Third, we graphed all the indicator values and applied the above-derived criteria for gaps between deviation rates to distinguish the segments. Both indicators were divided into five segments (Figure 12). A summary of the relative ranges for arousal levels derived in this manner and the criteria based on deviation rates is shown in Table 3. This range was utilized to identify a group of design alternatives among the 30, where arousal levels appeared relatively low, based on the EEG responses of the participants.

3.2. Results of Energy Performance Analysis

3.2.1. Analysis of Primary Energy Consumption per Unit Area

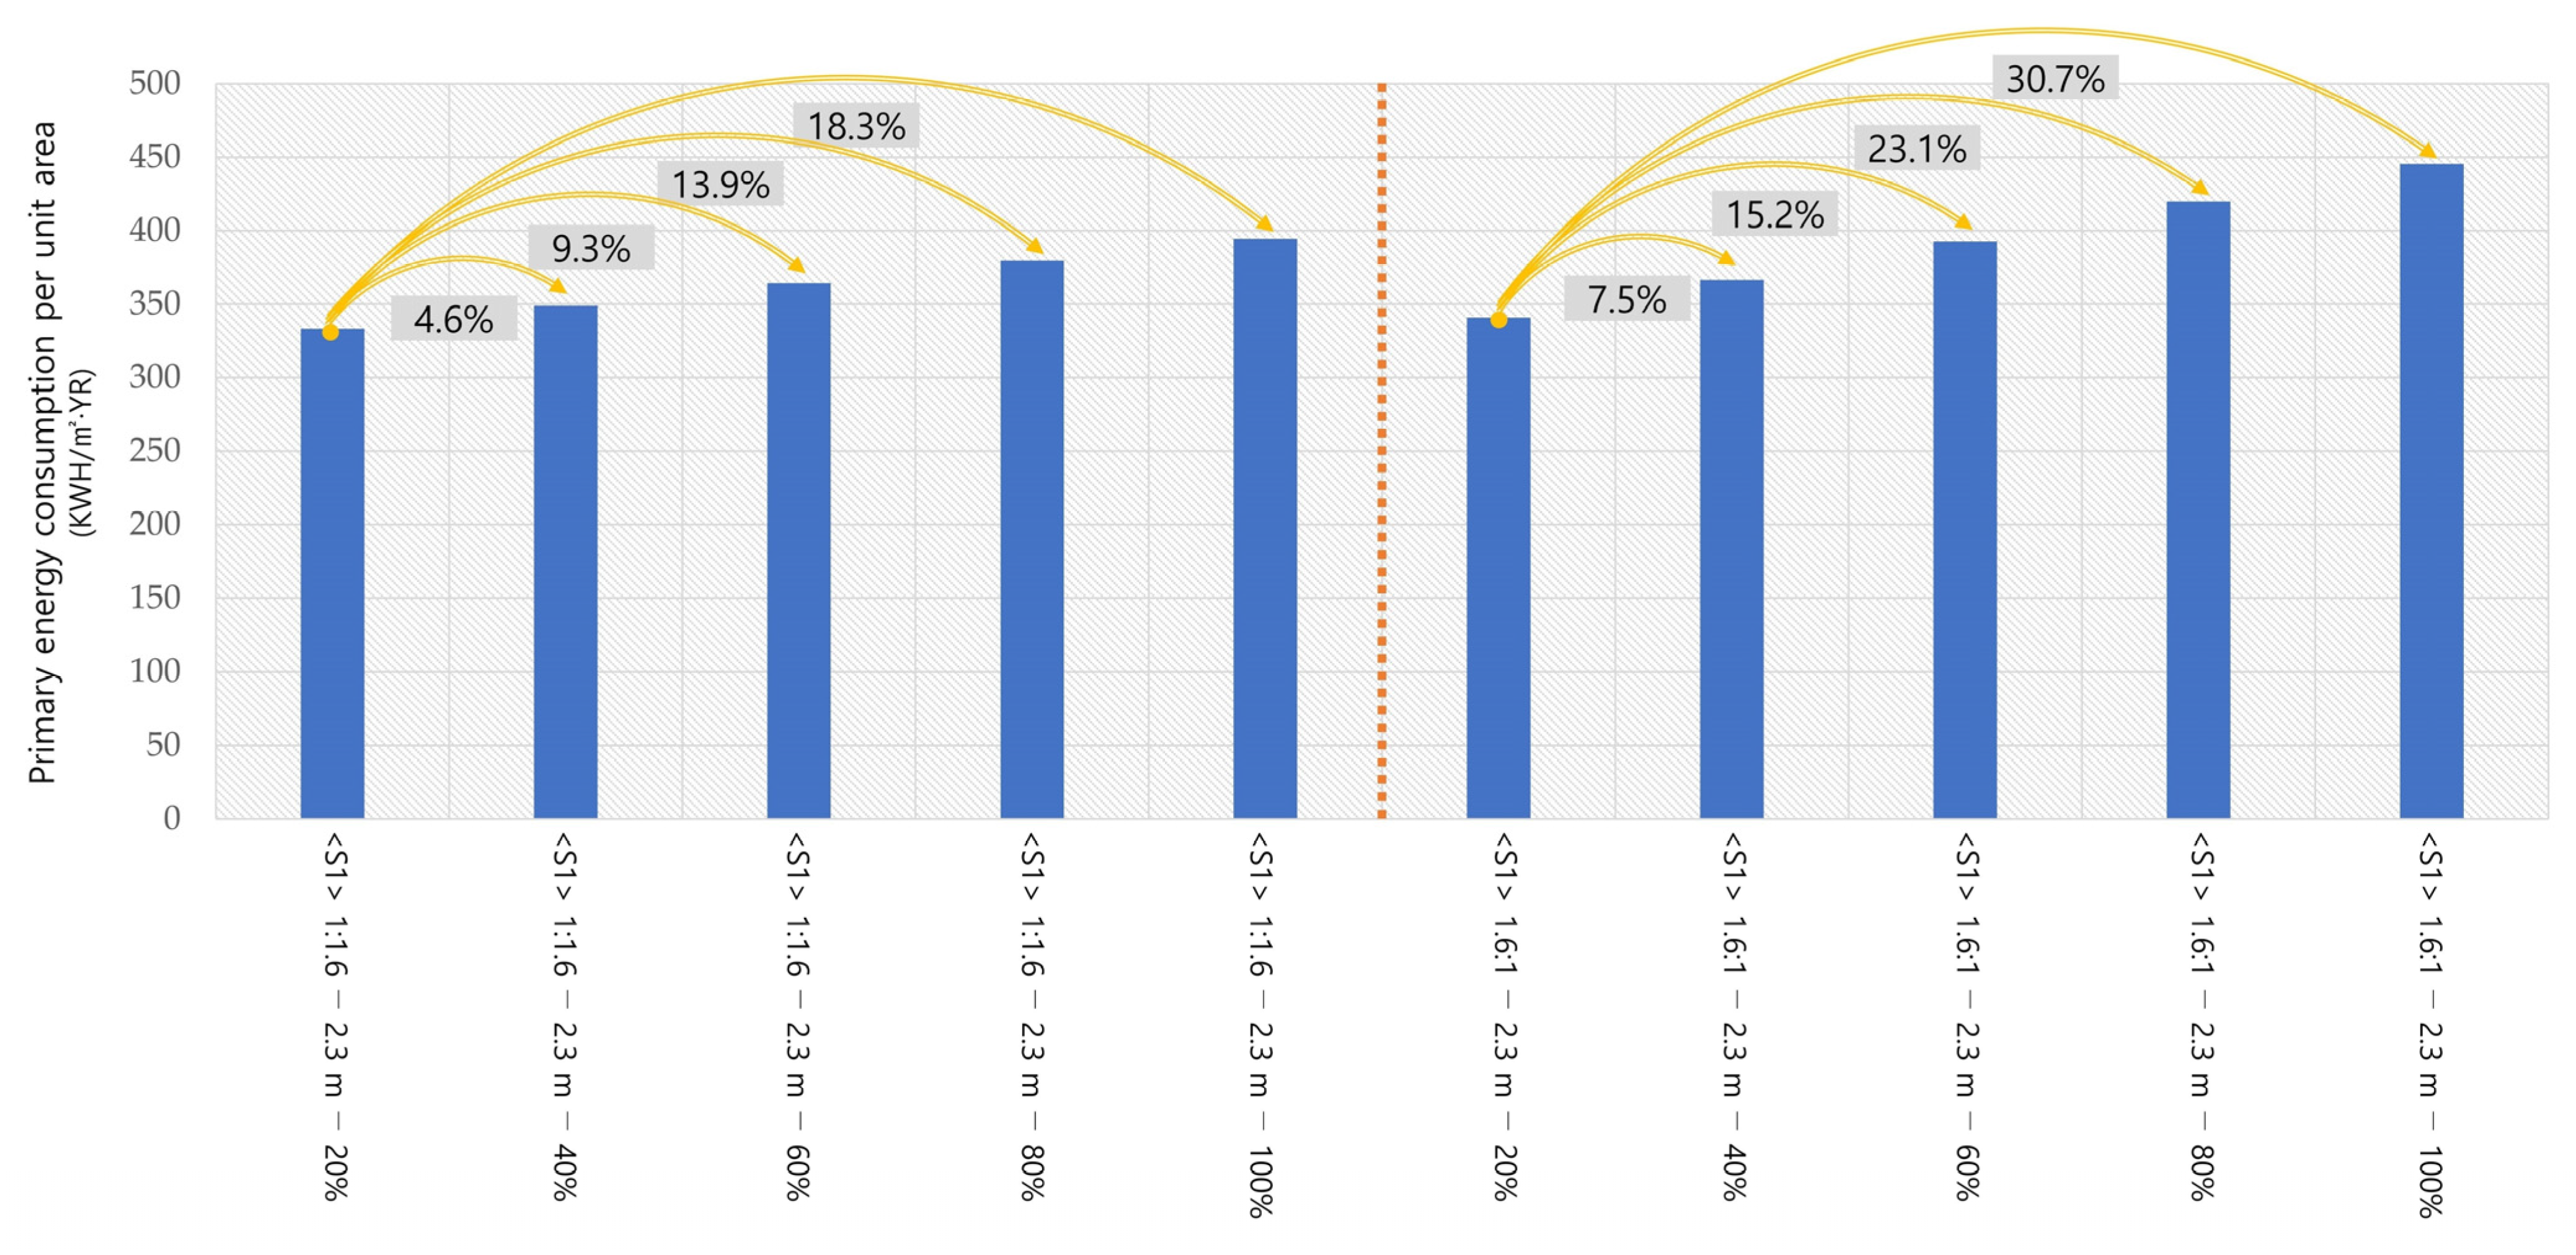
Using DesignBuilder, we conducted simulations for the 30 design alternatives created from the combinations of architectural elements and derived the annual primary energy consumption per unit area for each of the 30 alternatives. We found that the primary energy consumption varied depending on the combination of aspect ratio, ceiling height, and window-to-wall ratio. Specifically, when comparing design alternatives with different aspect ratios but the same ceiling height and window-to-wall ratio (Figure 13), we found that the primary energy consumption generally increased more in the <1.6:1 type> than in the <1:1.6 type>. In other words, when the area is the same, the <1:1.6 type> aspect ratio is more advantageous in terms of energy performance. Moreover, the difference in primary energy consumption between the two types of aspect ratio became more pronounced as the window area increased.
Upon analyzing the energy performance differences based on the window-to-wall ratio type while keeping the aspect ratio and ceiling height the same (Figure 14), we found that the design alternative with the lowest window-to-wall ratio <20% type> exhibited the best energy performance. As the window-to-wall ratio increased, the primary energy consumption also increased; the <1.6:1 type> showed a greater increase in primary energy consumption than the <1:1.6 type> as the window-to-wall ratio increased.
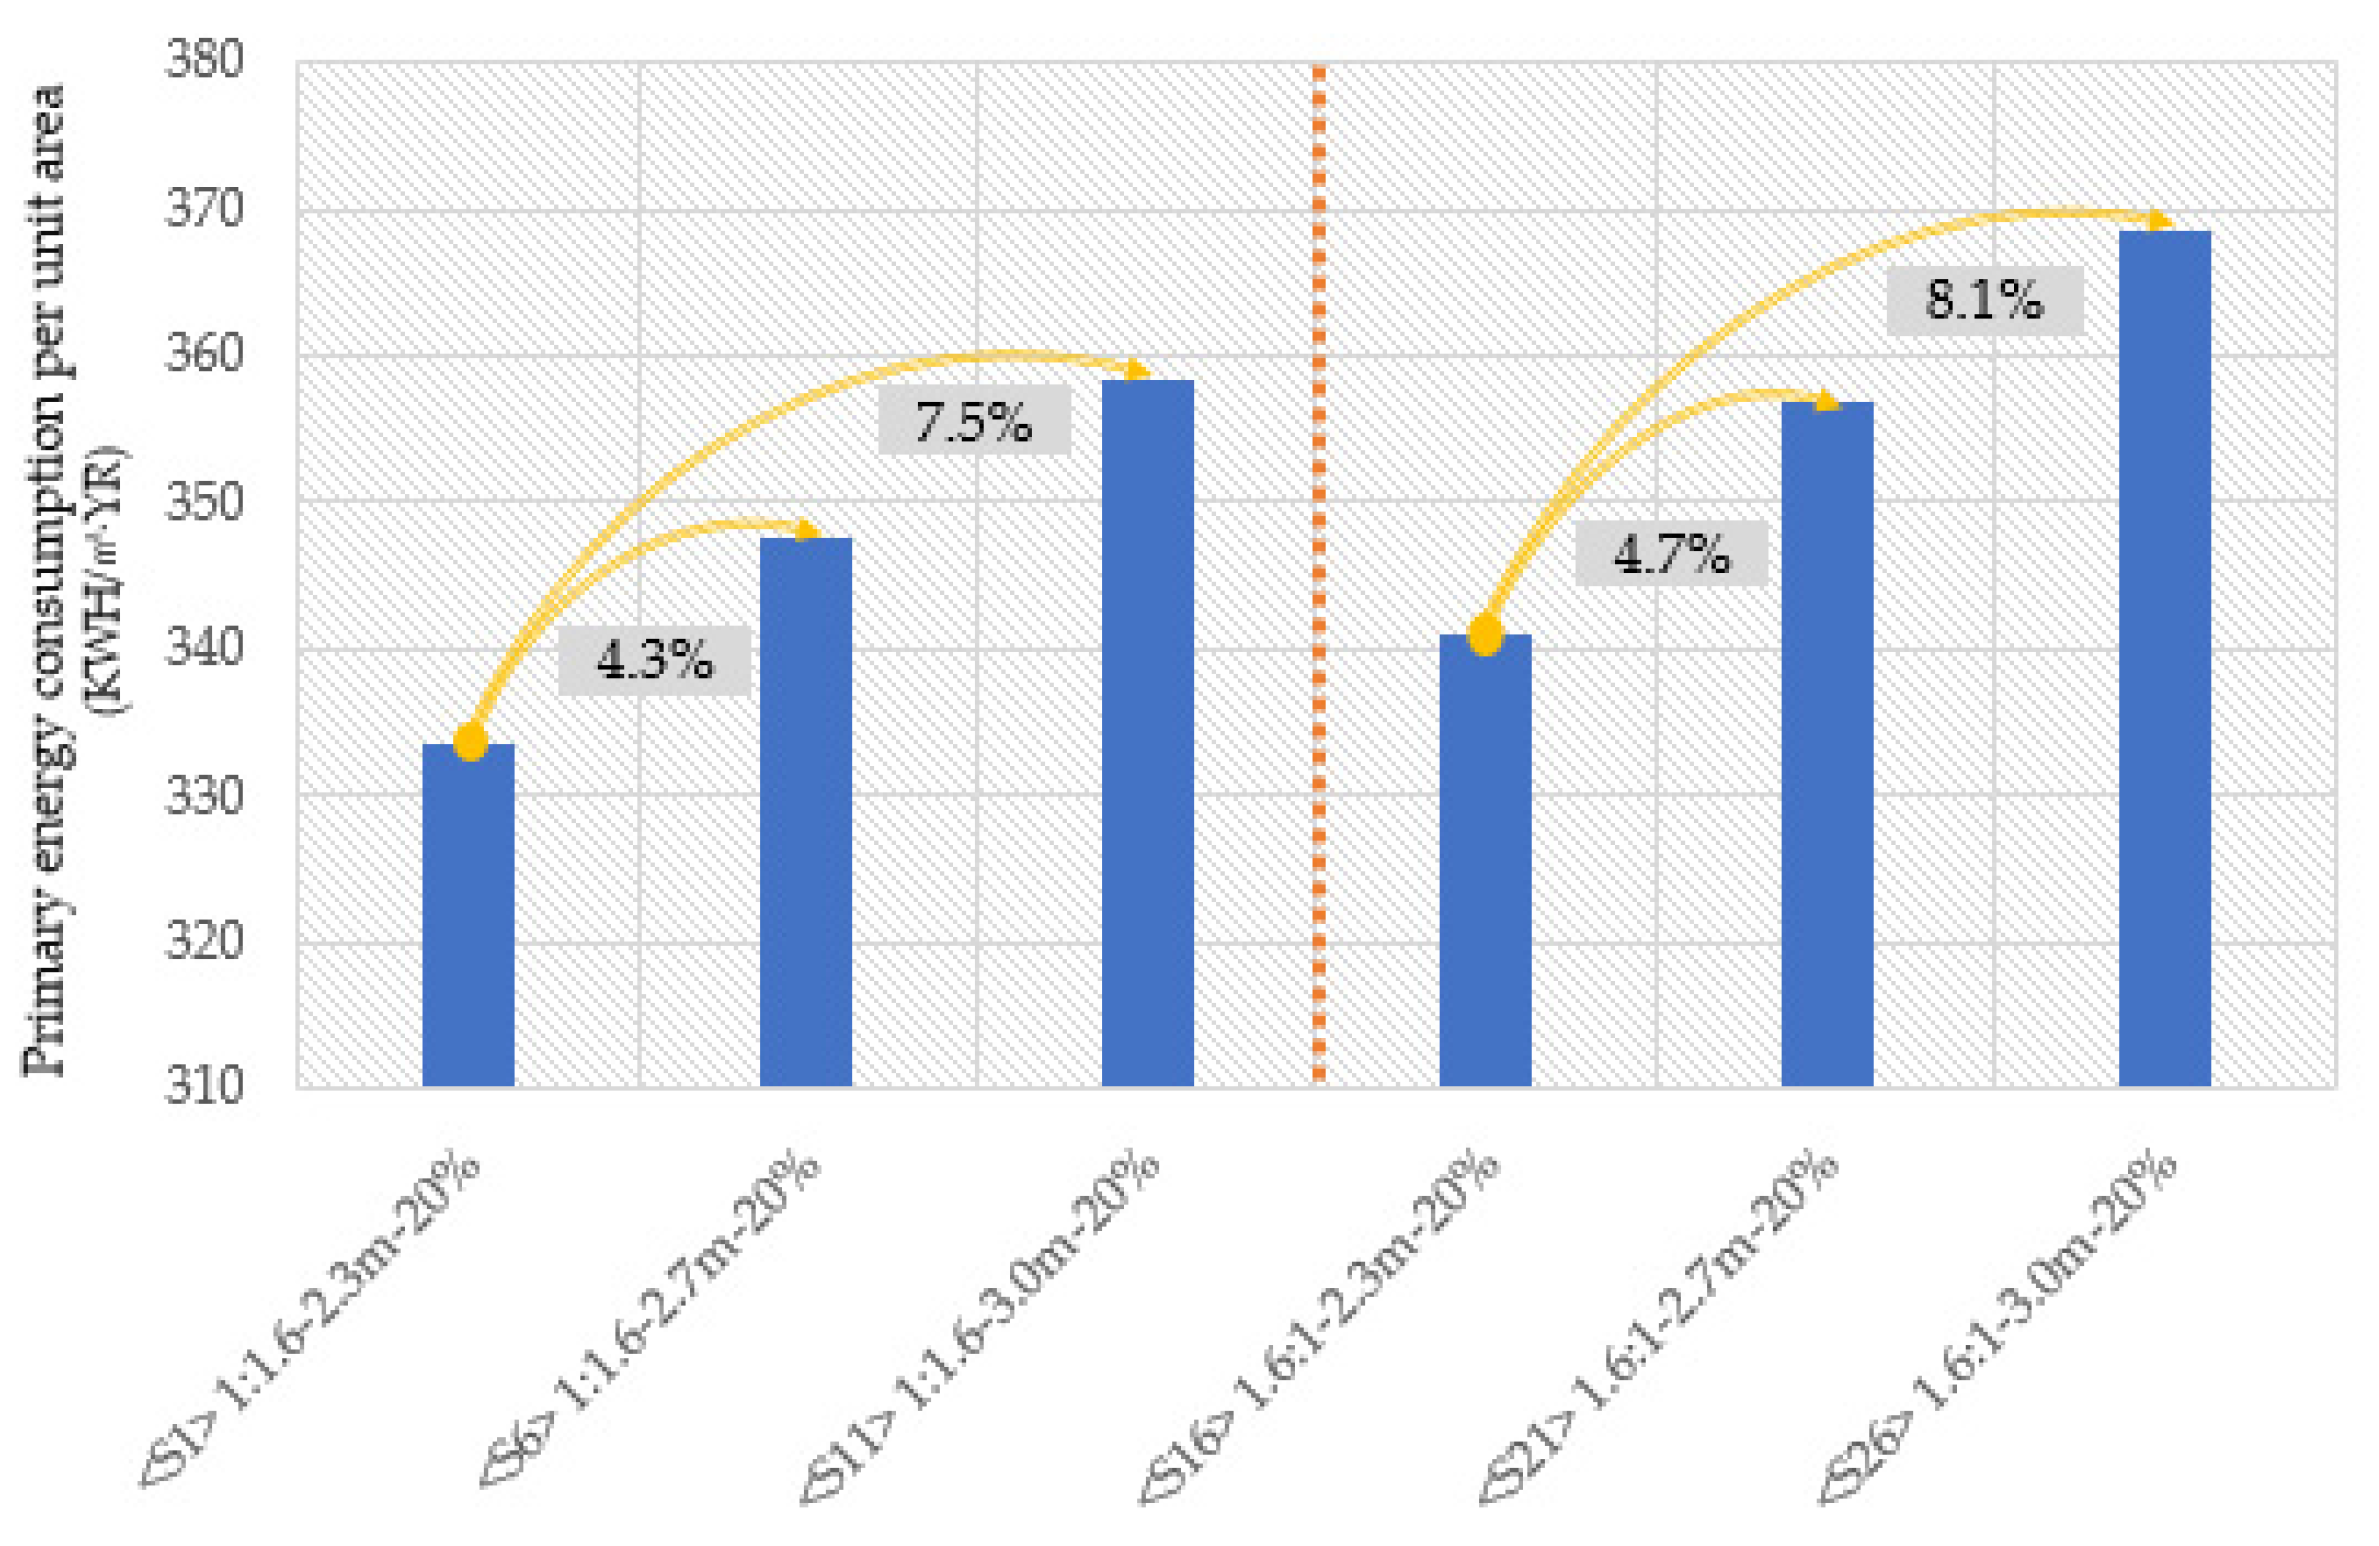
When comparing design alternatives with different ceiling heights but the same aspect ratio and window-to-wall ratio (Figure 15), we found that the energy performance increased proportionally as the ceiling height increased. The increase was not significantly influenced by the aspect ratio type. In summary, after analyzing energy performance, we found that the architectural design elements significantly affected the energy performance. The window-to-wall ratio had the greatest impact on energy performance across all design alternatives. Specifically, the design alternative with the smallest window-to-wall ratio exhibited the best energy performance, regardless of the aspect ratio and ceiling height types.

3.2.2. K-Means Clustering Analysis

We conducted a cluster analysis of the primary energy consumption per unit area for the 30 design alternatives using machine learning-based K-means clustering through the R (Version 4.2.1) cluster package. The most critical aspect to consider during K-means clustering analysis is the selection of the K-value (number of clusters). The clustering outcome and the interpretation of the data differ depending on how the K-value is selected. In this study, we applied the elbow method. The elbow method uses the sum of squared errors to represent the rate of decrease in data variance errors as the K-value increases. As the K-value grows, the error in data variance decreases. In this method, the rate of decrease in variance error slows, and the K-value is chosen at the point where the error is minimized [68].
After applying the elbow method to the primary energy consumption per unit area data for the 30 design alternatives, we found that the rate of decrease in the slope became gentler after K = 3 (Figure 16). After conducting the K-means clustering analysis with the applied K-value, the results were divided into groups 1, 2, and 3. The mean and standard deviation of the primary energy consumption per unit area for each group are shown in Table 4. Design alternatives belonging to group 1 can be considered to include options with superior energy performance compared to other groups.

3.3. Selection of Design Alternatives

After standardizing and adjusting the RAB indicator values derived from EEG data, we identified a group of design alternatives that showed relatively low arousal levels among the 30 options. Additionally, through the K-means clustering analysis results, we identified a group of design alternatives with low primary energy consumption per unit area. Upon reviewing the design alternative groups that were ultimately identified through the aforementioned analyses, the design alternative S3 (aspect ratio of 1:1.6, ceiling height of 2.3, and window-to-wall ratio of 60%) was selected, as it exhibited superior energy performance while minimally inducing occupant arousal (Figure 17).

4. Discussion

The primary motivation for conducting this study was to investigate whether buildings with excellent energy performance can also have a positive impact on their occupants. Clarifying this point of discussion and providing designers with options that consider both aspects during the early design stage will considerably influence the design paradigm of sustainable buildings.
The findings clarified that design alternatives with good energy performance do not necessarily have a positive impact on the arousal response of occupants. Nevertheless, the results differed slightly from those of previous studies. For instance, some studies [69] that measured individual arousal responses to key architectural parameters (distance between side walls, ceiling height, and windowsill height) in VR found that the experience of spatial changes in VR influences the psychological response of an individual primarily through self-reporting evaluation results. In contrast, this study explored the impact of architectural design elements on the arousal responses of participants more objectively and scientifically through the use of EEG.
Moreover, the present study supports the findings of the studies reporting that changes in the aspect ratio, ceiling height, and window-to-wall ratio influence the psychological satisfaction and arousal responses of participants [16,70] as well as those of the studies showing that changes in architectural design elements can induce arousal states in VR experiment participants [38,65].
Additionally, when compared to prior studies that analyzed EEG responses to single architectural design elements [71,72] and those that focused on EEG responses to the form of architectural spaces [34,73], this study holds significance in that it analyzed the integrated EEG responses to design alternatives created through combinations of architectural elements. This could be extremely useful for designers when creating architectural spaces in the future.
Meanwhile, preceding studies analyzing the energy performance of architectural elements [34,74,75,76,77] explored ways to increase the energy efficiency of buildings by analyzing various factors, such as building form, orientation, envelope characteristics, and window-to-wall ratio, but had some shortcomings, as they omitted the occupant perspective from their analyses when discussing building sustainability. While some prior studies considered both energy performance and occupant emotional responses [17,18,20,21], their scope was limited to self-reported questionnaires on psychological satisfaction and comfort. The present study expanded the traditionally limited scope of research by analyzing both the architectural design elements and emotional responses.
This study holds significance in that it proposed techniques for integrated analysis of EEG responses and primary energy consumption per unit area and offered a method for selecting design alternatives that not only have superior energy performance but can also induce positive physiological responses.

Limitations and Future Research

This study has some limitations. The study participants were exclusively women. As the responses to architectural spaces in VR environments may be mediated by gender, future studies should conduct additional experiments targeting men [78,79]. Additionally, emotional responses are subjective behaviors influenced by cultural and experiential factors. Therefore, approaches should be explored to consider individual differences in the selection of design alternatives [80].
As mentioned previously, the exposure time per stimulus was 10 s, considering preliminary participant interviews, and that exposure time was set within a range that excluded drowsiness. Furthermore, in their study analyzing EEG responses to ceiling height and space residence time, Youm et al. [81] found that the duration wherein significant changes in alpha waves were observed was approximately 5 s in the beginning, and the effect of stimulation increased along with the exposure time. Our results confirmed that offset. Although the exposure time per stimulus was set considering previous results and the preliminary experiments, a sufficiently long spatial exploration in various locations should be conducted. Lastly, the EEG indicators that affect occupant comfort were limited to RAB indicators. It is necessary to use various EEG indicators for analysis to identify further the impact of physical elements of space on EEG responses. We plan to conduct follow-up research to consider individual characteristics and explore strategies that take into account the physiological responses of occupants and the energy performance of buildings.

5. Conclusions

In the early stages of a building design, the designer’s decisions have a significant impact on both the energy performance of the building and the well-being of its occupants. In this regard, we proposed a technique that would allow designers to develop high-performance buildings centered on occupants during the early design stages. This approach integrates the physiological responses of occupants and the energy performance of buildings. Focusing on the architectural design elements, such as the aspect ratio, ceiling height, and window-to-wall ratio, we created 30 design alternatives for single-occupancy rooms in postnatal care centers and analyzed both EEG responses of the participants and energy performance of the building for these alternatives.
Upon integrating the analysis results of both EEG responses and energy performance, the design alternative with the aspect ratio of 1:1.6, ceiling height of 2.3 m, and window-to-wall ratio of 60% was found to having excellent performance in both categories.
Although this study presents the results of experiments on design alternatives for single-occupancy rooms in postnatal care rooms, our findings can be applied to a wide range of buildings by reviewing various design elements in relation to the physiological responses of residents and the energy performance of the buildings.
Furthermore, considering the importance of reducing global energy consumption to minimize climate change, our approach can be beneficial when designing buildings that consider both residents and optimized energy consumption. The results obtained through prior experience with the experimental building and individual characteristics, such as gender differences, could provide a robust framework for offering optimized solutions for residents within the budgetary constraints of energy-efficient buildings.

Author Contributions

Conceptualization, S.K. and K.L.; Methodology, S.K. and K.L.; Formal Analysis, S.K. and J.R.; Investigation, S.K. and J.R.; Data Processing and Data Analysis, S.K. and J.R.; Writing—Original Draft Preparation, S.K.; Writing—Review and Editing, J.R., Y.L. and H.P.; Visualization, S.K.; Project Administration, K.L. All authors have read and agreed to the published version of the manuscript.

Funding

This work was supported by the National Research Foundation of Korea (NRF), South Korea grant funded by the Korea government (MSIT; No. RS-2023-00213909).

Data Availability Statement

Data are contained within the article.

Acknowledgments

This research was supported by Basic Science Research Program through the National Research Foundation of Korea (NRF) funded by the Ministry of Education (No. 2021R1A6A3A01086574). This work was supported by the National Research Foundation of Korea (NRF) grant funded by the Korea government (MSIT) (No. NRF-2022R1C1C2007215). This work was supported by the National Research Foundation of Korea (NRF), South Korea grant funded by the Korea government (MSIT; No. RS-2023-00213909).

Conflicts of Interest

The authors declare no conflicts of interest.

Abbreviations

ADAnalog-to-digital
ASHRAEAmerican Society of Heating, Refrigerating & Air Conditioning Engineers
BEMSBuilding energy management system
BIMBuilding information modeling
EEGElectroencephalography
FFTFast Fourier transform
HMDHead-mounted display
HTCHigh-tech computer
LEEDLeadership in Energy and Environmental Design
PWI-SFPsychosocial Well-Being Index—Short Form
RABRatio of alpha waves to beta waves
SHGCSolar heat gain coefficient
STPVSemi-transparent photovoltaics
TMYTypical meteorological year
TRNSYSTransient system simulation
VLTVisible light transmittance
VRVirtual reality

References

  1. Negendahl, K. Building performance simulation in the early design stage: An introduction to integrated dynamic models. Autom. Constr. 2015, 54, 39–53. [Google Scholar] [CrossRef]
  2. Petersen, S.; Svendsen, S. Method and simulation program informed decisions in the early stages of building design. Energy Build. 2010, 42, 1113–1119. [Google Scholar] [CrossRef]
  3. Elbeltagi, E.; Wefki, H.; Abdrabou, S.; Dawood, M.; Ramzy, A. Visualized strategy for predicting buildings energy consumption during early design stage using parametric analysis. J. Build. Eng. 2017, 13, 127–136. [Google Scholar] [CrossRef]
  4. Schlueter, A.; Thesseling, F. Building information model based energy/exergy performance assessment in early design stages. Autom. Constr. 2009, 18, 153–163. [Google Scholar] [CrossRef]
  5. Lee, K.; Choo, S. A hierarchy of architectural design elements for energy saving of tower buildings in Korea using green BIM simulation. Adv. Civ. Eng. 2018, 2018, 7139196. [Google Scholar] [CrossRef]
  6. Hygh, J.S.; DeCarolis, J.F.; Hill, D.B.; Ranji Ranjithan, S.R. Multivariate regression as an energy assessment tool in early building design. Build. Environ. 2012, 57, 165–175. [Google Scholar] [CrossRef]
  7. Méndez Echenagucia, T.M.; Capozzoli, A.; Cascone, Y.; Sassone, M. The early design stage of a building envelope: Multi-objective search through heating, cooling and lighting energy performance analysis. Appl. Energy 2015, 154, 577–591. [Google Scholar] [CrossRef]
  8. Kim, S.; Lee, K.; Choo, S. Plans to construct a VR-EEG Based on the healing space visual perception element optimization model. J. Archit. Inst. Korea 2022, 38, 77–88. [Google Scholar]
  9. Chang, S.; Jun, H. Hybrid deep-learning model to recognise emotional responses of users towards architectural design alternatives. J. Asian Arch. Build. Eng. 2019, 18, 381–391. [Google Scholar] [CrossRef]
  10. Hong, T.; Lee, M.; Yeom, S.; Jeong, K. Occupant responses on satisfaction with window size in physical and virtual built environments. Build. Environ. 2019, 166, 106409. [Google Scholar] [CrossRef]
  11. Jusselme, T.; Rey, E.; Andersen, M. Surveying the environmental life-cycle performance assessments: Practice and context at early building design stages. Sustain. Cities Soc. 2020, 52, 101879. [Google Scholar] [CrossRef]
  12. Purup, P.B.; Petersen, S. Research framework for development of building performance simulation tools for early design stages. Autom. Constr. 2020, 109, 102966. [Google Scholar] [CrossRef]
  13. Pollock, M.; Roderick, Y.; McEwan, D.; Wheatley, C. Building simulation as an assisting tool in designing an energy efficient building: A case study. In Proceedings of the Building Simulation 2009: 11th Conference of IBPSA, Glasgow, UK, 27–30 July 2009. [Google Scholar]
  14. Kim, S.; Park, H.; Choo, S. Effects of changes to architectural elements on human relaxation-arousal responses: Based on VR and EEG. Int. J. Environ. Res. Public Health 2021, 18, 4305. [Google Scholar] [CrossRef]
  15. Ashrafian, T.; Moazzen, N. The impact of glazing ratio and window configuration on occupants’ comfort and energy demand: The case study of a school building in Eskisehir. Turkey. Sustain. Cities Soc. 2019, 47, 101483. [Google Scholar] [CrossRef]
  16. Boodi, A.; Beddiar, K.; Benamour, M.; Amirat, Y.; Benbouzid, M. Intelligent systems for building energy and occupant comfort optimization: A state of the art review and recommendations. Energies 2018, 11, 2604. [Google Scholar] [CrossRef]
  17. Newton, S.; Shirazi, A.; Christensen, P. Defining and demonstrating a smart technology configuration to improve energy performance and occupant comfort in existing buildings: A conceptual framework. Int. J. Build. Pathol. Adapt. 2023, 41, 182–200. [Google Scholar] [CrossRef]
  18. Yeom, S.; An, J.; Hong, T.; Kim, S. Determining the optimal visible light transmittance of semi-transparent photovoltaic considering energy performance and occupants’ satisfaction. Build. Environ. 2023, 231, 110042. [Google Scholar] [CrossRef]
  19. Seo, H.; Kang, E.; Kim, B. A correlation analysis of solar heat gain coefficient (SHGC) and residents’ preferences in visibility and energy performance. J. Archit. Inst. Korea 2011, 27, 259–268. [Google Scholar]
  20. Kim, B.; Kim, J.; Lim, O. Optimal Windows Transmittance by Energy Performance Analysis and Subjective Evaluation in office building. J. Korean Sol. Energy Soc. 2004, 24, 73–84. [Google Scholar]
  21. Lee, J.; Lee, J.; Kim, T.W.; Koo, C. EEG-based circumplex model of affect for identifying interindividual differences in thermal comfort. J. Manag. Eng. 2022, 38, 04022034. [Google Scholar] [CrossRef]
  22. Zamani, M.; Kheirollahi, M.; Asghari Ebrahim Absd, M.J.; Rezaee, H.; Vafaee, F. Evaluating the Impact of Architectural Space on Human Emotions Using Biometrics Data. Creat. City Des. 2022, 5, 65–80. [Google Scholar]
  23. Li, J.; Wu, W.; Jin, Y.; Zhao, R.; Bian, W. Research on environmental comfort and cognitive performance based on EEG plus VR plus LEC evaluation method in underground space. Build. Environ. 2021, 198, 107886. [Google Scholar] [CrossRef]
  24. Zheng, H.; Pan, L.; Li, T. Research on indoor thermal sensation variation and cross-subject recognition based on electroencephalogram signals. J. Build. Eng. 2023, 76, 107305. [Google Scholar] [CrossRef]
  25. Chang, S.; Dong, W.; Jun, H. Use of electroencephalogram and long short-term memory networks to recognize design preferences of users toward architectural design alternatives. J. Comput. Des. Eng. 2020, 7, 551–562. [Google Scholar] [CrossRef]
  26. Li, J.; Jin, Y.; Lu, S.; Wu, W.; Wang, P. Building environment information and human perceptual feedback collected through a combined virtual reality (VR) and electroencephalogram (EEG) method. Energy Build. 2020, 224, 110259. [Google Scholar] [CrossRef]
  27. Schomer, D.L.; Da Silva, F.L. Niedermeyer’s Electroencephalography: Basic Principles, Clinical Applications, and Related Fields; Lippincott Williams & Wilkins: Philadelphia, PA, USA, 2012. [Google Scholar]
  28. Kim, Y.; Han, J.; Chun, C. Evaluation of comfort in subway stations via electroencephalography measurements in field experiments. Build. Environ. 2020, 183, 107130. [Google Scholar] [CrossRef]
  29. Lu, M.; Hu, S.; Mao, Z.; Liang, P.; Xin, S.; Guan, H. Research on work efficiency and light comfort based on EEG evaluation method. Build. Environ. 2020, 183, 107122. [Google Scholar] [CrossRef]
  30. Choi, Y.; Kim, M.; Chun, C. Measurement of occupants’ stress based on electroencephalograms (EEG) in twelve combined environments. Build. Environ. 2015, 88, 65–72. [Google Scholar] [CrossRef]
  31. Guan, H.; Hu, S.; Lu, M.; He, M.; Zhang, X.; Liu, G. Analysis of human electroencephalogram features in different indoor environments. Build. Environ. 2020, 186, 107328. [Google Scholar] [CrossRef]
  32. Peng, Y.; Lin, Y.; Fan, C.; Xu, Q.; Xu, D.; Yi, S.; Wang, K. Passenger overall comfort in high-speed railway environments based on EEG: Assessment and degradation mechanism. Build. Environ. 2022, 210, 108711. [Google Scholar] [CrossRef]
  33. Han, J.; Chun, C. Differences between EEG during thermal discomfort and thermal displeasure. Build. Environ. 2021, 204, 108220. [Google Scholar] [CrossRef]
  34. Banaei, M.; Hatami, J.; Yazdanfar, A.; Gramann, K. Walking through architectural spaces: The impact of interior forms on human brain dynamics. Front. Hum. Neurosci. 2017, 11, 477. [Google Scholar] [CrossRef] [PubMed]
  35. Suhaimi, N.; Mountstephens, J.; Teo, J. A dataset for emotion recognition using virtual reality and EEG (DER-VREEG): Emotional state classification using low-cost wearable VR-EEG headsets. Big Data Cogn. Comput. 2022, 6, 16. [Google Scholar] [CrossRef]
  36. Musa, M.A.; Salisu, A.S.; Tukur, R.B.; Stanley, A.A.M. Assessment of passive indoor environmental comfort on midrise office buildings in tropical wet and dry climate of Nigeria. AARCHES J. 2018, 1, 27–38. [Google Scholar]
  37. Ulrich, R.S. View through a window may influence recovery from surger. Science 1984, 224, 420–421. [Google Scholar] [CrossRef]
  38. Matusiak, B. The impact of window form on the size impression of the room—Full-scale studies. Archit. Sci. Rev. 2006, 49, 43–51. [Google Scholar] [CrossRef]
  39. Subklew, F. Architecture and Perceived Control: Role of Architectural Elements in Consumers Perception of Retail Environments. Master’s Thesis, University of Twente, Enschede, The Netherlands, 2009. [Google Scholar]
  40. Stamps, A.E.; Krishnan, V.V. Spaciousness and boundary roughness. Environ. Behav. 2006, 38, 841–872. [Google Scholar] [CrossRef]
  41. Bae, D. A study on the proper ceiling height of living space in apartment housing. J. Korea Inst. Spat. Des. 2019, 14, 143–152. [Google Scholar]
  42. Madden, J.; Pandita, S.; Schuldt, J.P.; Kim, B.; Won, A.S.; Holmes, N.G. Ready student one: Exploring the predictors of student learning in virtual reality. PLoS ONE 2020, 15, e0229788. [Google Scholar] [CrossRef]
  43. Asim, F.; Chani, P.S.; Shree, V.; Rai, S. Restoring the mind: A neuropsychological investigation of university campus built environment aspects for student well-being. Build. Environ. 2023, 244, 110810. [Google Scholar] [CrossRef]
  44. Sagnier, C.; Loup-Escande, E.; Valléry, G. Effects of gender and prior experience in immersive user experience with virtual reality. In Advances in Usability and User Experience: Proceedings of the AHFE 2019 International Conferences on Usability & User Experience, and Human Factors and Assistive Technology, Washington, DC, USA, 24–28 July 2019; Springer International Publishing: Washington, DC, USA, 2019; Volume 10, pp. 305–314. [Google Scholar] [CrossRef]
  45. Zeng, X.; Luo, P.; Wang, T.; Wang, H.; Shen, X. Screening visual environment impact factors and the restorative effect of four visual environment components in large-space alternative care facilities. Build. Environ. 2023, 235, 110221. [Google Scholar] [CrossRef] [PubMed]
  46. Law-Bo-Kang, E.M.M.A. ATLAS OF COLORS Colors for Better Therapeutic Environments. Master’s Thesis, Chalmers University of Technology, Gothenburg, Sweden, 2023. [Google Scholar]
  47. Vatsal, R.; Mishra, S.; Thareja, R.; Chakrabarty, M.; Sharma, O.; Shukla, J. An analysis of physiological and psychological responses in virtual reality and flat screen gaming. arXiv 2023, arXiv:2306.09690. [Google Scholar]
  48. Benjamin, J.G.; Stephen, D.M.; Karen, J.M.; João, J.; Ian, C.; Maria, W.; Hanslmayr, S. Alpha/beta power decreases track the fidelity of stimulus-specific information. eLife 2019, 8, e49562. [Google Scholar]
  49. Yi, W.; Siti, A. Electroencephalogram (EEG) stress analysis on alpha/beta ratio and theta/beta ratio. Indones. J. Electr. Eng. Comput. Sci. 2020, 12, 175–182. [Google Scholar]
  50. Tiago-Costa, E.; Quelhas-Costa, E.; Santos-Baptista, J. Changes in EEG amplitude (Alpha and Beta waves) with Thermal environment. Dyna 2016, 83, 87–93. [Google Scholar] [CrossRef]
  51. Sosiedka, I.; Tukaiev, S.; Zima, I. Poster Communications: EEG ratio markers for the effect of emotional valence of olfactory stimuli. Physiol. Proc. Physiol. Soc. 2014, 31, PCB063. [Google Scholar]
  52. Weinstein, S.; Weinstein, C.; Drozdenko, R. Brain wave analysis. An electroencephalographic technique used for evaluating the communications-effect of advertising. Psychol. Mark. 1984, 1, 17–42. [Google Scholar] [CrossRef]
  53. Ramirez, R.; Vamvakousis, Z. Detecting emotion from EEG signals using the emotive epoc device. In International Conference on Brain Informatics, Macau, China, 4–7 December 2012; Springer: Berlin/Heidelberg, Germany, 2012; pp. 175–184. [Google Scholar] [CrossRef]
  54. Lee, Y.H.; Park, C.W.; Kim, J.J. Effects of visual stimulus with forest scenery types on psychological and physiological status of human. J. Korean Soc. People Plants Environ. 2014, 17, 65–71. [Google Scholar] [CrossRef]
  55. Jing, P.; Bo, Y.; Xu, Z.; Hong, L. Correlation Properties Applied Detrended Fluctuation Analysis Method for Cue-induced EEG in Drug Dependence. In Proceedings of the 2012 International Conference on Computer Science and Electronics Engineering, Hangzhou, China, 23–25 March 2012; IEEE: New York, NY, USA; Volume 1, pp. 446–450. [CrossRef]
  56. Olszewska-Guizzo, A.; Escoffier, N.; Chan, J.; Puay Yok, T. Window view and the brain: Effects of floor level and green cover on the alpha and beta rhythms in a passive exposure eeg experiment. Int. J. Environ. Res. Public Health 2018, 15, 2358. [Google Scholar] [CrossRef]
  57. Kim, N.; Gero, J.S. Neurophysiological Responses to Biophilic Design: A Pilot Experiment Using VR and EEG. In Proceedings of the International Conference on-Design Computing and Cognition 2022, Glasgow, UK, 2–6 July 2022; Springer International Publishing: Cham, Switzerland; pp. 235–253.
  58. Ouzir, M.; Lamrani, H.C.; Bradley, R.L.; El Moudden, I. Neuromarketing and decision-making: Classification of consumer preferences based on changes analysis in the EEG signal of brain regions. Biomed. Signal Process. Control. 2024, 87, 105469. [Google Scholar] [CrossRef]
  59. Mir, M.; Nasirzadeh, F.; Bereznicki, H.; Enticott, P.; Lee, S. Investigating the effects of different levels and types of construction noise on emotions using EEG data. Build. Environ. 2022, 225, 109619. [Google Scholar] [CrossRef]
  60. Help of Design-Builder Software. 2016. Available online: www.designbuilder.co.uk (accessed on 1 January 2024).
  61. Choudhary, S. Analysis of energy conservation of an institutional building using Design Builder software. Int. J. Recent Adv. Mech. Eng. 2015, 4, 133–139. [Google Scholar] [CrossRef]
  62. Kim, J.; Yu, J.; Kim, J.; Kim, J. Energy performance analysis of green-remodeling for public buildings under 500 m2. J. Korean Sol. Energy 2022, 42, 87–101. [Google Scholar] [CrossRef]
  63. Gwak, J.; Shino, M.; Kamata, M. Interaction between thermal comfort and Arousal level of drivers in relation to the changes in indoor temperature. Int. J. Automot. Eng. 2018, 9, 86–91. [Google Scholar] [CrossRef] [PubMed]
  64. Martínez-Rodrigo, A.; García-Martínez, B.; Alcaraz, R.; Pastor, J.M.A. Fernández-Caballero, EEG mapping for arousal level quantification using dynamic quadratic entropy. In Proceedings of the Ambient Intelligence-Software and Applications–7th International Symposium on Ambient Intelligence (ISAmI 2016), Sevilla, Spain, 1–3 June 2016; Springer International Publishing: Berlin/Heidelberg, Germany, 2016; pp. 207–214. [Google Scholar] [CrossRef]
  65. Jelić, A.; Tieri, G.; De Matteis, F.; Babiloni, F.; Vecchiato, G. The enactive approach to architectural experience: A neurophysiological perspective on embodiment, motivation, and affordances. Front. Psychol. 2016, 7, 481. [Google Scholar] [CrossRef] [PubMed]
  66. Kravitz, D.J.; Saleem, K.S.; Baker, C.I.; Mishkin, M. A new neural framework for visuospatial processing. Nat. Rev. Neurosci. 2011, 12, 217–230. [Google Scholar] [CrossRef] [PubMed]
  67. Vecchiato, G.; Jelic, A.; Tieri, G.; Maglione, A.G.; De Matteis, F.; Babiloni, F. Neurophysiological correlates of embodiment and motivational factors during the perception of virtual architectural environments. Cogn. Process. 2015, 1 (Suppl. S16), 425–429. [Google Scholar] [CrossRef]
  68. Syakur, M.A.; Khotimah, B.K.; Rochman, E.M.S.; Satoto, B.D. Integration k-means clustering method and elbow method for identification of the best customer profile cluster. IOP Conf. Series Mater. Sci. Eng. 2018, 336, 012017. [Google Scholar] [CrossRef]
  69. Presti, P.; Ruzzon, D.; Avanzini, P.; Caruana, F.; Rizzolatti, G.; Vecchiato, G. Measuring arousal and valence generated by the dynamic experience of architectural forms in virtual environments. Sci. Rep. 2022, 12, 13376. [Google Scholar] [CrossRef]
  70. Yeom, S.; Kim, H.; Hong, T.; Park, H.S.; Lee, D.E. An integrated psychological score for occupants based on their perception and emotional response according to the windows’ outdoor view size. Build. Environ. 2020, 180, 107019. [Google Scholar] [CrossRef]
  71. Erkan, İ. Examining wayfinding behaviours in architectural spaces using brain imaging with electroencephalography (EEG). Arch. Sci. Rev. 2018, 61, 410–428. [Google Scholar] [CrossRef]
  72. Kim, S.; Lee, K.; Choo, S. Analysis of EEG relaxation-arousal reaction to the window-to-wall ratio of individual rooms of A postpartum Care Center using EEG-VR. J. Archit. Inst. Korea 2021, 37, 63–74. [Google Scholar]
  73. Shemesh, A.; Talmon, R.; Karp, O.; Amir, I.; Bar, M.; Grobman, Y.J. Affective response to architecture–investigating human reaction to spaces with different geometry. Archit. Sci. Rev. 2017, 60, 116–125. [Google Scholar] [CrossRef]
  74. Parasonis, J.; Keizikas, A.; Kalibatiene, D. The relationship between the shape of a building and its energy performance. Archit. Eng. Des. Manag. 2012, 8, 246–256. [Google Scholar] [CrossRef]
  75. Xue, P.; Li, Q.; Xie, J.; Zhao, M.; Liu, J. Optimization of window-to-wall ratio with sunshades in China low latitude region considering daylighting and energy saving requirements. Appl. Energy 2019, 233–234, 62–70. [Google Scholar] [CrossRef]
  76. Košir, M.; Gostiša, T. Kristl, Ž. Influence of architectural building envelope characteristics on energy performance in Central European climatic conditions. J. Build. Eng. 2018, 15, 278–288. [Google Scholar] [CrossRef]
  77. Fallahtafti, R.; Mahdavinejad, M. Optimisation of building shape and orientation for better energy efficient architecture. Int. J. Energy Sect. Manag. 2015, 9, 593–618. [Google Scholar] [CrossRef]
  78. Khaleghimoghaddam, N. A neurological examination of gender differences in architectural perception. Archit. Sci. Rev. 2023, 1–10. [Google Scholar] [CrossRef]
  79. Wirawan, I.M.A.; Wardoyo, R.; Lelono, D. The challenges of emotion recognition methods based on electroencephalogram signals: A literature review. Int. J. Electr. Comput. Eng. 2022, 12, 1508. [Google Scholar] [CrossRef]
  80. Yuan, L.; Kong, F.; Luo, Y.; Zeng, S.; Lan, J.; You, X. Gender differences in large-scale and small-scale spatial ability: A systematic review based on behavioral and neuroimaging research. Front. Behav. Neurosci. 2019, 13, 128. [Google Scholar] [CrossRef]
  81. Youm, S.H.; Lee, J.Y.; Choi, Y.R. A study on stimulation of ceiling height and duration of stay using VR & EEG. J. Archit. Inst. Korea 2021, 37, 35–42. [Google Scholar]
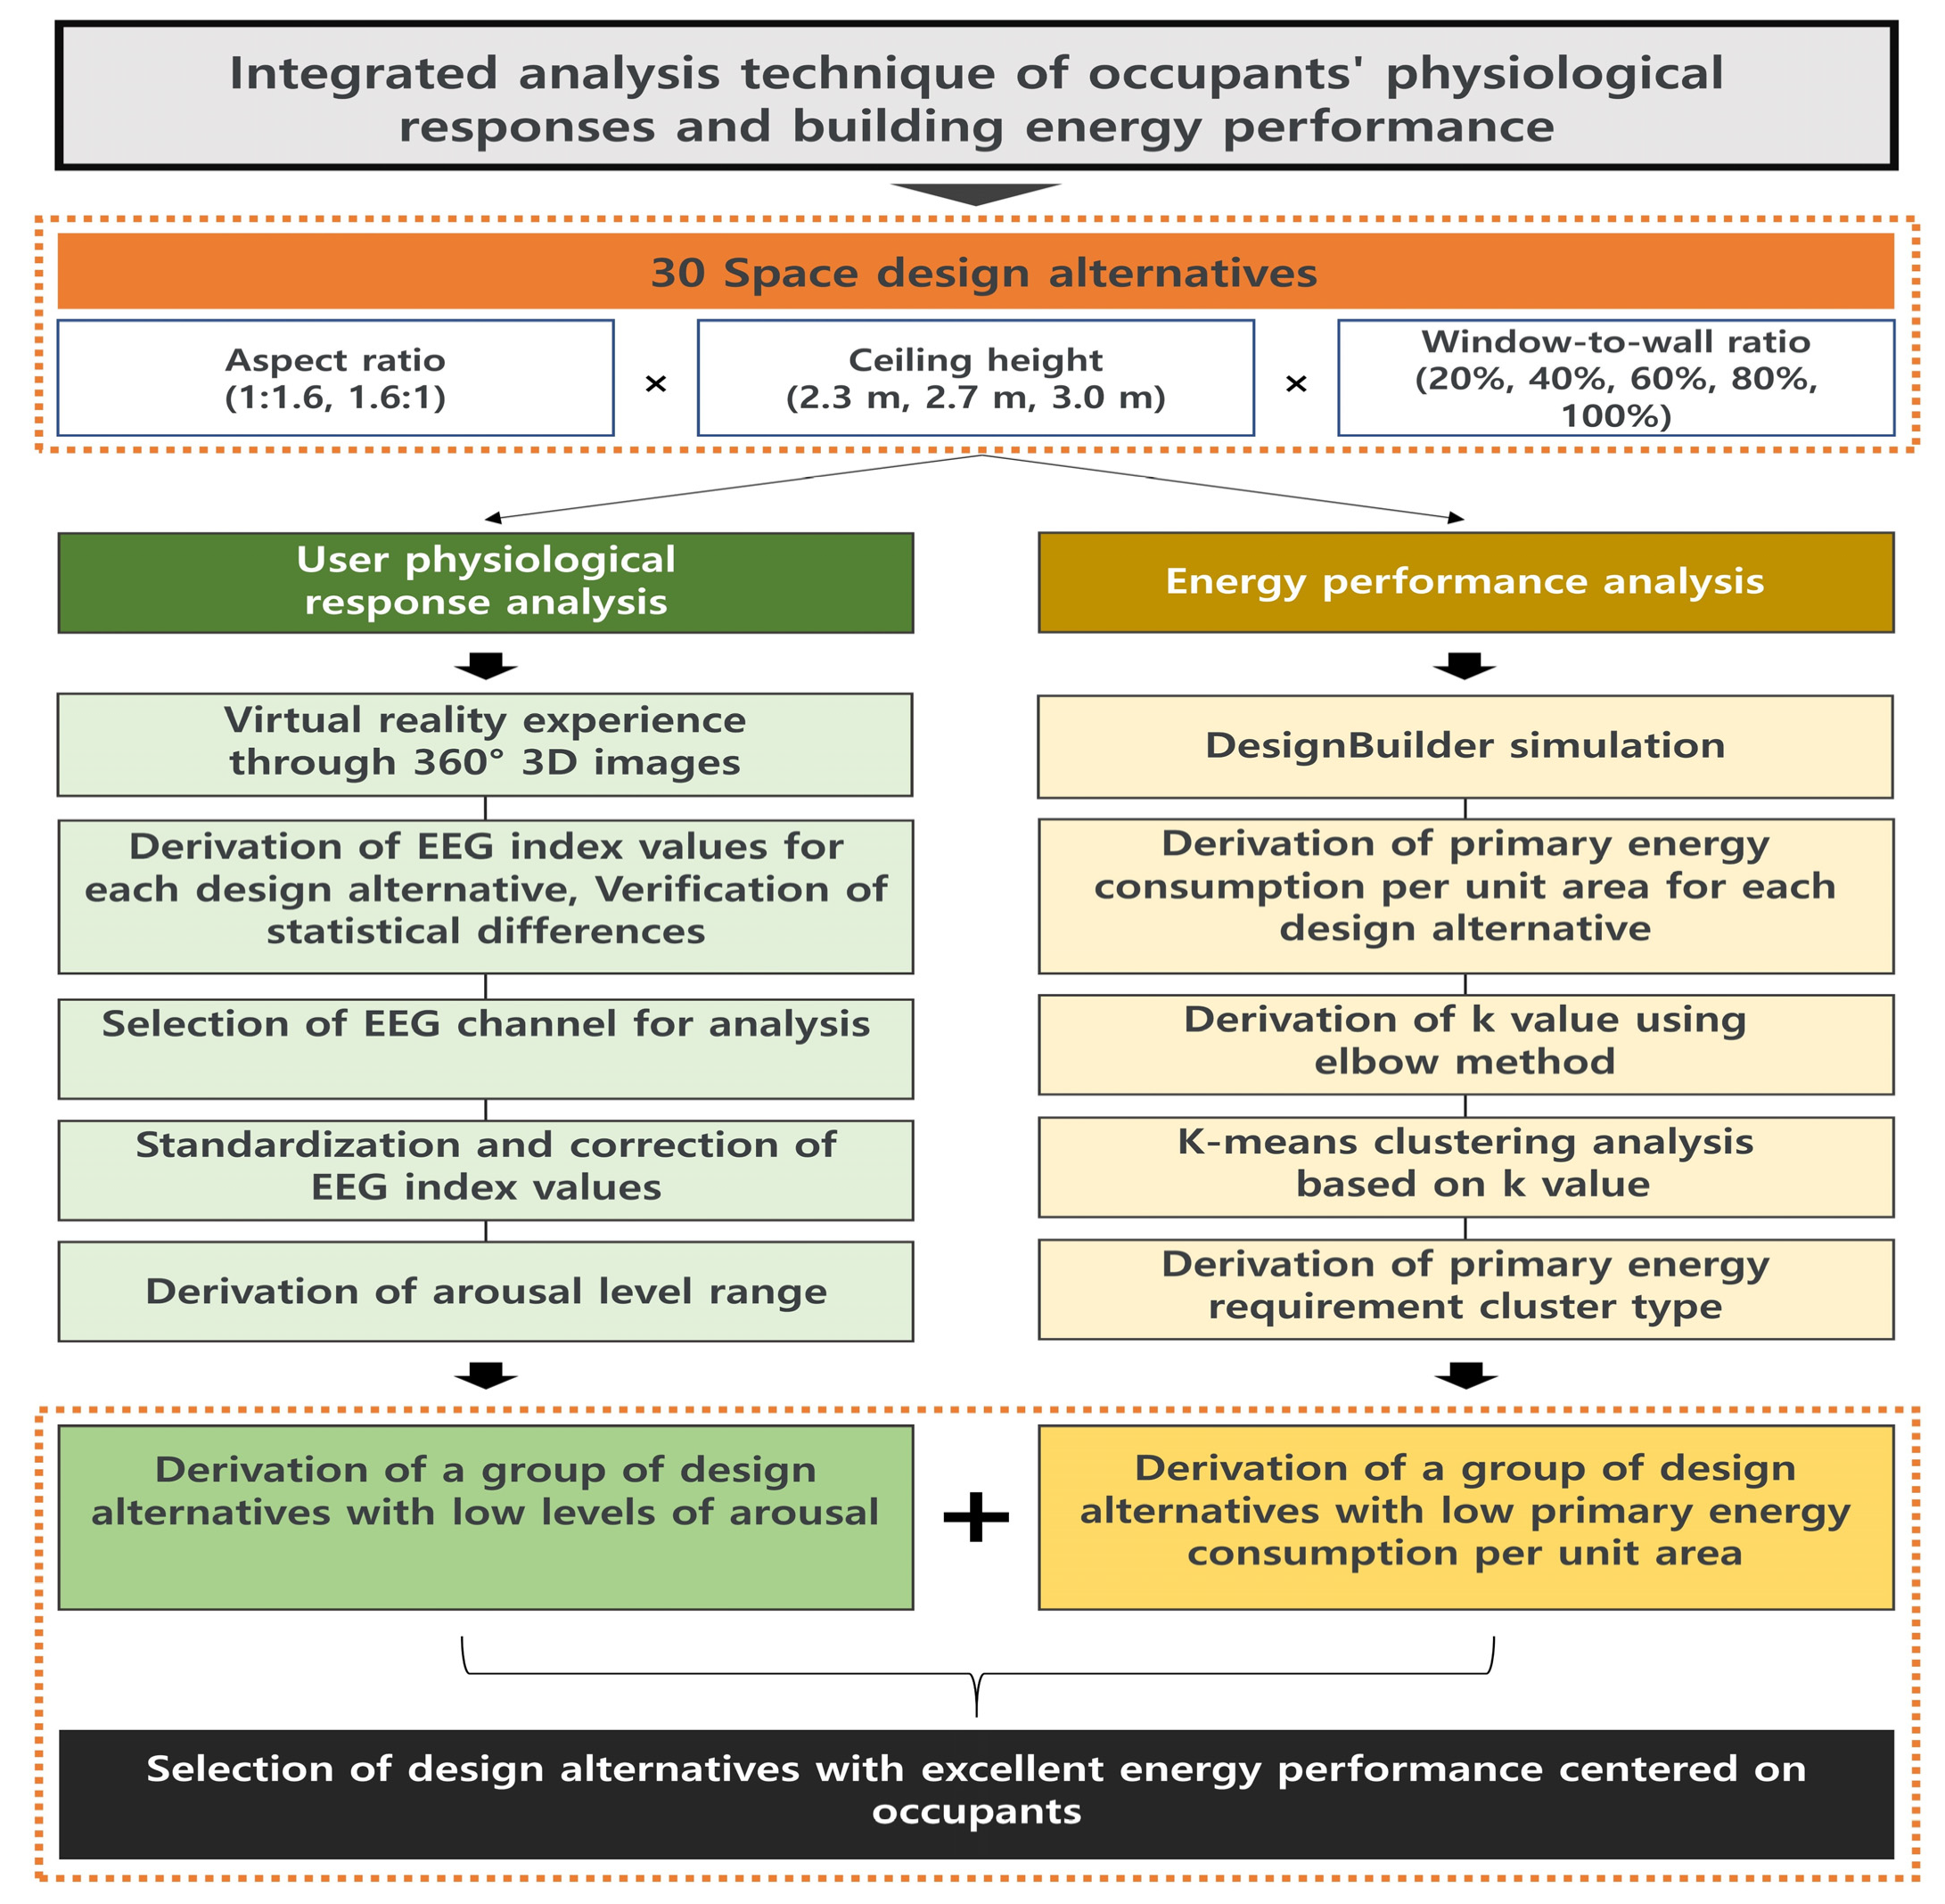
Figure 1. Research procedures and methods.
Buildings 14 00237 g001
Figure 2. Architectural design elements and the details of chosen parameters.
Buildings 14 00237 g002
Figure 3. Floor plan of the space reproduced in VR.
Buildings 14 00237 g003
Figure 4. Example of a 360° 3D image in VR space. (A) An aspect ratio of 1:1.6, a ceiling height of 2.3 m, and a window-to-wall ratio of 20% were used. (B) An aspect ratio of 1.6:1, a ceiling height of 3.0 m, and a window-to-wall ratio of 80% were used.
Buildings 14 00237 g004
Figure 5. RAB indicator derivation formula and interpretation.
Buildings 14 00237 g005
Figure 6. Experimental environment.
Buildings 14 00237 g006
Figure 7. Experimental procedure.
Buildings 14 00237 g007
Figure 8. VR reproduction equipment and EEG measurement tools.
Buildings 14 00237 g008
Figure 9. Verification of differences in RAB indicator values (aspect ratio: 1:1.6).
Buildings 14 00237 g009
Figure 10. Verification of differences in RAB indicator values (aspect ratio 1.6:1 type).
Buildings 14 00237 g010
Figure 11. Standardization and calibration procedure for indicators.
Buildings 14 00237 g011
Figure 12. Arousal level setting range for design alternatives.
Buildings 14 00237 g012
Figure 13. Comparison of primary energy consumption per unit area of designs with changing aspect ratios (arrow means increase).
Buildings 14 00237 g013
Figure 14. Comparison of primary energy consumption per unit area by the window-to-wall element.
Buildings 14 00237 g014
Figure 15. Comparison of primary energy consumption per unit area by the ceiling height element.
Buildings 14 00237 g015
Figure 16. Elbow method for optimal K-value and mean and standard deviation of each cluster.
Buildings 14 00237 g016
Figure 17. Selection of design alternatives.
Buildings 14 00237 g017
Table 1. Floor plan of the space reproduced in VR.
Experimental GroupBlock 1Block 2 Block 6
Stimulus no.S1S2S3S4S5S6S7S8S9S10S26S27S28S29S30
Aspect ratio1:1.61:1.61:1.61:1.61:1.61:1.61:1.61:1.61:1.61:1.61.6:11.6:11.6:11.6:11.6:1
Ceiling height (m)2.32.32.32.32.32.72.72.72.72.73.03.03.03.03.0
Window-to-wall ratio (%)204060801002040608010020406080100
Table 2. Summary of model inputs.
Input CategoryInput Values
Location siteSeoul
dimensionUnit room: 3.4 × 5.2 × 4.0 m
ConstructionU-ValueWall0.24 W/m2-K
Slab1.52 W/m2-K
Window1.50 W/m2-K
Indoor
Condition
TemperatureHeating20 °C
Cooling22 °C
Occupancy density0.0588 people/m2
Metabolic factor0.85
Power density3.58 W/m2
Light300 lux
Operation ScheduleWeekdays0:00–24:00 h
Weekends0:00–24:00 h
Table 3. Rankings of design alternatives according to arousal levels.
RankingStimulus No.Architectural Design ElementsStandardized RAB Indicator ValueMedianDeviation RateArousal Level
Aspect RatioCeiling Height (m)Window-to-Wall Ratio (%)
1201.6:12.3100−0.059−0.18112.2Very low level
231:1.62.360−0.080−0.18110.1
391:1.62.780−0.106−0.1817.5
4191.6:12.380−0.118−0.1816.3
5301.6:13.0100−0.132−0.1814.9
6271.6:13.040−0.134−0.1814.7
6281.6:13.060−0.134−0.1814.7
741:1.62.380−0.142−0.1813.9
8141:1.63.080−0.152−0.1812.9Low level
9241.6:12.780−0.159−0.1812.2
10101:1.62.7100−0.166−0.1811.5
1171:1.62.740−0.174−0.1810.7
1211:1.62.320−0.175−0.1810.6
13121:1.63.040−0.179−0.1810.2
14171.6:12.340−0.180−0.1810.1
1521:1.62.340%−0.181−0.1810Intermediate
level
15251.6:12.7100%−0.181−0.1810
1681:1.62.760%−0.192−0.181−1.1High level
17111:1.63.020%−0.193−0.181−1.2
1851:1.62.3100%−0.194−0.181−1.3
1961:1.62.720%−0.196−0.181−1.5
20181.6:12.360%−0.199−0.181−1.8
21151:1.63.0100%−0.200−0.181−1.9
22261.6:13.020%−0.205−0.181−2.4
23161.6:12.320%−0.206−0.181−2.5
24291.6:13.080%−0.209−0.181−2.8
25211.6:12.720%−0.217−0.181−3.6
26231.6:12.760%−0.220−0.181−3.9
27221.6:12.740%−0.235−0.181−5.4Very high level
28131:1.63.060%−0.249−0.181−6.8
The deviation rate is applied to the overall index value based on the median value.
Table 4. Rankings of design alternatives according to clustering analysis.
RankingStimulus No.Architectural Design ElementsPrimary Energy Consumption per Unit AreaCluster
Aspect RatioCeiling Height (m)Window-to-Wall Ratio (%)
111:1.62.320333.38061
2161.6:12.320340.8252
361:1.62.720347.5869
421:1.62.340348.8503
5211.6:12.720356.751
6111:1.63.020358.2649
731:1.62.360364.228
871:1.62.740365.5719
9171.6:12.340366.4862
10261.6:13.02368.5466
11121:1.63.040378.14583
1241:1.62.380379.7582
1381:1.62.760383.4911
14221.6:12.740386.6479
15181.6:12.360392.7244
1651:1.62.3100394.5489
17131:1.63.060397.9597
18271.6:13.040401.5976
1991:1.62.780401.6113
20231.6:12.760417.3301
21141:1.63.080418.0263
22101:1.62.7100418.9126
23191.6:12.380419.6733
24281.6:13.060435.57122
25151:1.63.0100437.198
26201.6:12.3100445.4888
27241.6:12.780448.7792
28291.6:13.080470.3499
29251.6:12.7100478.9056
30301.6:13.0100503.6237
Disclaimer/Publisher’s Note: The statements, opinions and data contained in all publications are solely those of the individual author(s) and contributor(s) and not of MDPI and/or the editor(s). MDPI and/or the editor(s) disclaim responsibility for any injury to people or property resulting from any ideas, methods, instructions or products referred to in the content.