Article

Numerical Study of Thermal Efficiency in Light-Gauge Steel Panels Designed with Varying Insulation Ratios

by
Dilanka Chandrasiri
1,
Perampalam Gatheeshgar
1,*,
Hadi Monsef Ahmadi
2 and
Lenganji Simwanda
3
1
School of Computing, Engineering and Digital Technologies, Teesside University, Middlesbrough TS1 3BX, UK
2
Department of Civil Engineering, Niccolò Cusano University, Via Don Carlo Gnocchi 3, 00166 Rome, Italy
3
Department of Civil Engineering, University of South Africa, Johannesburg 2001, South Africa
*
Author to whom correspondence should be addressed.
Buildings 2024, 14(1), 300; https://doi.org/10.3390/buildings14010300
Submission received: 15 November 2023 / Revised: 29 December 2023 / Accepted: 6 January 2024 / Published: 22 January 2024
(This article belongs to the Special Issue Fire and Energy Performance of Buildings)

Abstract

:
In the construction domain, there is a growing emphasis on sustainability, resource efficiency, and energy optimisation. Light-gauge steel panels (LGSPs) stand out for their inherent advantages including lightweight construction and energy efficiency. However, the effective management of thermal efficiency, particularly addressing thermal bridges, is crucial. This paper conducts a detailed numerical investigation into the thermal performance of LGSPs, examining varied insulation ratios. Thermal finite element (FE) models were initially developed using the THERM software and validated against code predictions and results available in the literature. A comprehensive parametric study explored different insulation ratios, insulation materials, and wall thicknesses, discovering their impact on thermal transmittance (U-value). Key findings revealed that U-value correlated with insulation material conductivity, with E-PLA insulation exhibiting the lowest values, and increasing wall thickness resulted in decreased U-values. It was found that a strategic use of insulation yielded a U-value reduction of over 65%. New simplified design approaches were developed, featuring insulation ratios linked to accurate U-value predictions for LGSP configurations. The new design approaches were found to provide more accurate and consistent U-value predictions. Moreover, optimum insulation ratios for new builds and existing building extensions were found to be around 0.9 and 0.7 for 275 mm and 325 mm thick walls, respectively. These proposed energy-efficient solutions, facilitated through advanced design, are well-aligned with net-zero construction objectives.

1. Introduction

In the field of construction, the prominent focus on sustainable practices, resource efficiency, and the optimisation of energy consumption has become a critical concern. The drive for this is not only rooted in environmental awareness but also in the economic rationale for resource conservation and cost reduction throughout the construction and demolition processes. Moreover, addressing thermal energy consumption poses a significant challenge in the design and construction of both conventional and modular infrastructures [1,2,3], due to its central role in environmental impact and operational expenses [4].
Among the diverse range of construction options available, light-gauge steel panels (LGSPs) have garnered considerable attention for their unique set of advantages. A typical LGSP consists of steel studs, gypsum plasterboard panels, cavity insulation, and mechanical fasteners [5,6]. The classification methods, framing techniques, and testing requirements may be adhered to as specified in the standards [7]. LGSPs offers advantages such as a lightweight nature, an ease of erection, superior structural performance, fire resistance, energy efficiency, and sustainability [8,9,10,11,12,13]. These benefits make it a popular choice in various building applications, including commercial, industrial, and residential buildings. LGSPs also offer the advantage of on-site assembly, free from the detrimental effects of moisture, thereby streamlining construction timelines and enhancing overall project cost-efficiency [14]. However, despite these compelling advantages, LGSPs are not without their drawbacks. One important issue is how well they insulate against heat loss, especially when it comes to thermal bridges. This can significantly affect energy efficiency, which is determined by factors like the wall’s inner and outer surfaces and the insulation thickness [15]. Neglecting to address the thermal bridge effects of LGSPs can have profound consequences, significantly reducing the energy efficiency of steel structures, amplifying operational energy consumption, and incurring consequential costs [16]. Therefore, considering different materials of thermal insulation, including thickness and cavity width of the wall, is one of the most effective strategies for reducing U-value and advancing energy conservation in buildings [17,18].
The thermal efficiency of LGSPs has been the focus of several previous investigations [10,18,19,20,21,22]. In order to enhance the energy efficiency of wall panels by mitigating the thermal bridge effect and reducing U-values, numerous strategies have been proposed in the literature and extensively examined through both numerical simulations and experimental investigations. These strategies include using less-conductive insulation materials and thermal breaks [18], vacuum insulation panels [21], introducing several narrow staggered slots on the steel web of the frames [23,24], and modifying the suitable cross-section shape of the steel profile to minimize the contact area between the steel frames and the sheathing panel [25]. The use of staggered slotted perforation has been gaining attention as an effective solution to improve thermal efficiency despite a lowered structural load-carrying capacity [2,26,27].
Lohmann and Santos [28] conducted an investigation on Trombe wall thermal behaviour and energy efficiency. The results showed that the Trombe wall device could significantly improve the thermal behaviour of an LGSP compartment and reduce heating energy consumption if it was adequately designed and controlled to mitigate night-time heat losses. Roque and Santos [16] conducted a numerical study on the effectiveness of the position of the insulation in the facade walls. Their findings revealed significant variations in thermal performance depending on the insulation layer’s positioning. Gervásio et al. [29] illustrated that it was feasible to make substantial enhancements in the thermal efficiency of residential buildings by optimizing the distribution of insulation materials throughout the building envelope. In a review study conducted by Omer [30] focusing on insulation thickness, the numerical findings revealed that as the insulation thickness increased, the expected outcome of reduced heating and cooling energy demands per square metre of the wall was observed. Specifically, with 0.02 m of insulation, there was a remarkable 50% reduction in the annual total heat transfer, and this reduction further dropped to less than 20% with the installation of 0.10 m of insulation. Soares et al. [31] provided a comprehensive review investigation of the primary techniques employed to assess the overall thermal transmittance and thermal performance of nonuniform and moderately uniform building components such as walls, windows, and construction elements utilizing innovative materials. Roque et al. [32] provided numerical evidence that the optimal method for enhancing the thermal performance of light steel-frame structures is the installation of a continuous insulation layer on the exterior of the steel frame. This approach, aligning with warm construction principles, was empirically established as the most effective means of achieving superior thermal and fire behaviour [33] in light steel-frame construction. Sun et al. [34] proposed an innovative design for LGSPs, featuring various panels and layers, including a nonmetallic broken bridge layer and agricultural waste straw, to enhance the structural integrity and performance. Through experimentation, they determined that this innovative construction significantly reduced heat loss due to the broken bridge layer and the air gap between the steel frame and the sheathing panel. These research investigations highlight the importance of wall configurations, insulation materials, and experimental or numerical approaches in enhancing the thermal performance and predicting the thermal transmittance of light-gauge steel walls. However, there is limited research [35] performed to investigate the influence of the insulation ratio (the ratio between insulation thickness and cavity width) on the thermal performance of LGSPs. Therefore, this research aims to address a critical knowledge gap in the thermal efficiency of LGSPs and aims to provide valuable insights for optimising insulation strategies during the design phase.
In this research, the thermal performance of LGSPs in two different wall configurations, with thicknesses of 275 mm and 325 mm, is examined through thermal finite element modelling. These models are validated using comparisons with ISO 10211 [36] test cases and prior studies conducted by Santos et al. [37]. The primary objective of this study is to conduct an extensive analysis, examining the influence of several key factors on the thermal performance of LGSPs. These factors include the ratio of insulation layer thickness to air cavity width (ranging from 0.2 to 1.0 in 0.2 intervals), the choice of insulation material (including options such as stone wool, E-PLA, mineral wool, rock wool, and glass fibre), and variations in total wall thickness (at 275 mm and 325 mm). Finally, a design methodology has been formulated to estimate the U-values of cold-formed steel-framed wall panels with various insulation ratios, facilitating a more straightforward approach to U-value estimation.

2. Materials and Methods

2.1. General

This section offers an in-depth exploration of numerical simulations applied to LGSPs for the assessment of thermal efficiency. It provides a concise overview of governing equations linked to thermal conductance, elaborates on finite element modelling, outlines validation techniques, and introduces parametric studies.

2.2. Numerical Simulation and Governing Equations

It is valuable to explore certain theoretical correlations among parameters associated with the thermal conductance of building materials, forming the basis for the subsequent implementation of numerical studies. ISO 6946 [38] prescribes methods to estimate the thermal resistance of a building element with homogeneous and/or inhomogeneous layers. The thermal transmittance (U-value) is determined by taking the reciprocal of the total thermal resistance ( R t o t ), as presented in Equation (1).
U = 1 R t o t
When a building element is formed by n number of homogeneous layers, and the heat flow is perpendicular to the layers, the heat flow transfer is one-dimensional. In this instance, the total thermal resistance R t o t can be determined as shown in Equation (2), where R s i is the internal surface resistance, R s e is the external surface resistance, and R j is the thermal resistance of each homogeneous layer. According to ISO 6946 [38], R s i and R s e can be considered as 0.13 and 0.04 m 2 K / W , respectively.
R t o t = R s i + j = 1 n R j + R s e
When estimating the thermal resistance of building elements comprising homogeneous and inhomogeneous layers, such as LGSPs investigated in this study, ISO 6946 [38] recommends a simplified method to estimate the total thermal resistance R t o t . Santos et al. [39] assessed this method to estimate the thermal transmittance of LGSPs. The total thermal resistance R t o t is calculated by combining the parallel path and isothermal planes methods. The method stated in ISO 6946 [38] is only valid for elements that have layers that are either homogeneous and inhomogeneous, and may include air layers that are no more than 0.3 m thick as well as metal fastenings. If the ratio of the upper limit of thermal resistance to the lower limit of thermal resistance is greater than 1.5, then the method cannot be used. Similarly, if there is metal bridging the insulation, then the method cannot be applied. Further, specific limitations of using this method are detailed in ISO 6946 [38].
The upper limit of the total thermal resistance is estimated considering a one-dimensional heat transfer across the building element surfaces, using the parallel path option. The expression for the upper limit is shown in Equation (3), where R t o t ; u p p e r represents the upper limit of the total thermal resistance (in m 2 K / W ). The parameters R t o t ; a , R t o t ; b , R t o t ; c , ……, R t o t ; q represent the total thermal resistances from environment to environment for each section, calculated in accordance with Equation (2), and the parameters f a , f b ,   f c , ……, f q denote the fractional areas of each section.
1 R t o t ; u p p e r = f a R t o t ; a + f b R t o t ; b + f c R t o t ; c + + f q R t o t ; q
The lower limit of the total thermal resistance is estimated by assuming all planes parallel to the surfaces of the element are isothermal surfaces. Hence, the isothermal planes option is used. The first stage in estimating the lower limit of the total thermal resistance involves determining the equivalent thermal resistance ( R j ) for thermally inhomogeneous layers. The expression to estimate the equivalent thermal resistance is given in Equation (4). Here, R j denotes the equivalent thermal resistance (in m 2 K / W ), and the parameters R a j , R b j , R c j , ……, R q j represent the thermal resistance for each thermally inhomogeneous layer for each section. The parameters f a , f b ,   f c , ……, f q denote the fractional areas of each section. Then, the lower limit of the total thermal resistance is estimated using Equation (2).
1 R j = f a R a j + f b R b j + f c R c j + + f q R q j
As recommended by ISO 6946 [38], the total thermal resistance of a building element is estimated by simply taking the average of total upper and total lower thermal resistances, as given in Equation (5).
R t o t = R t o t ; u p p e r + R t o t ; l o w e r 2

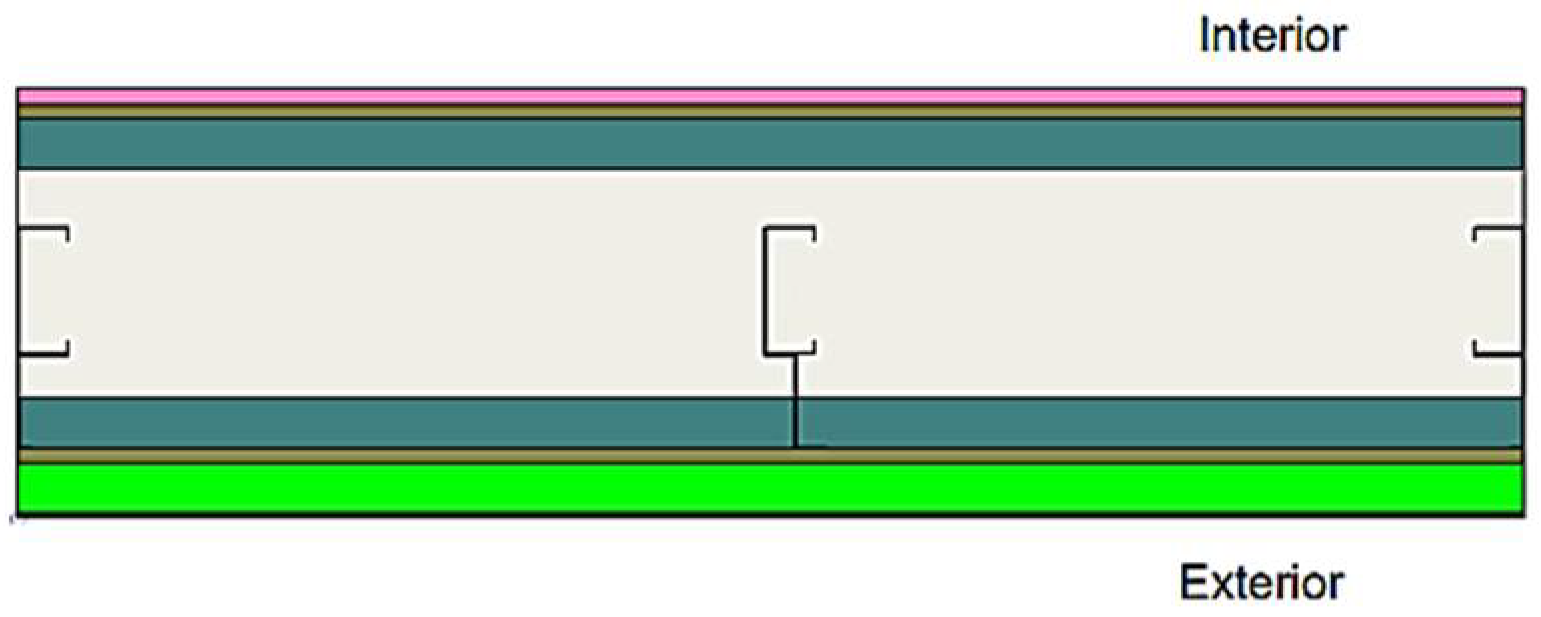
2.3. Numerical Finite Element Modelling

2.3.1. General

For the numerical analysis of the LGSPs, the THERM 7.8 modelling software [40] was used in this study. This software provides 2D conductive heat transfer analyses to model and simulate the behaviour of heat transfer through components of buildings. A typical LGSP configuration considered in this study is depicted in Figure 1. Similar configurations with varying parameters were considered in the parametric study. More details of the configurations and varying parameters are described in Section 2.5.

2.3.2. Thermal Conductivity Properties

Defining the material properties of each wall component in the THERM 7.8 software [40] for the considered wall is a prerequisite before incorporating them into the model. Thermal conductivities for boards, insulations, steel, and air were obtained from the literature and assigned as follows: Finish ETICS coat (λ = 0.75 W/m·K) [4], EPS or ETICS insulation (λ = 0.04 W/m·K) [4], OSB (λ = 0.13 W/m·K) [4], stone wool (λ = 0.034 W/m·K) [4], expanded polylactic acid (EPLA) (λ = 0.03 W/m·K) [41,42], mineral wool (λ = 0.035 W/m·K) [32], rock wool (λ = 0.037 W/m·K) [16], glass fibre (λ = 0.04 W/m·K) [42], steel frames with cross sections such as C100 × 40 × 10 × 1, U75 × 40 × 10 × 1, and Z75 × 25 × 1 (λ = 50 W/m·K) [4], and plasterboard (λ = 0.25 W/m·K) [4]. When considering horizontal heat flow, the thermal conductivity of air (λair) is dependent on the thickness of the air layer (d) and its thermal resistance (R), as defined by a ratio of thickness divided by thermal resistance in accordance with ISO 6946 [38]. Consequently, the thermal conductivity for each specific thickness of the air layer was determined by calculating the corresponding thermal resistance values as recommended by ISO 6946 [38].

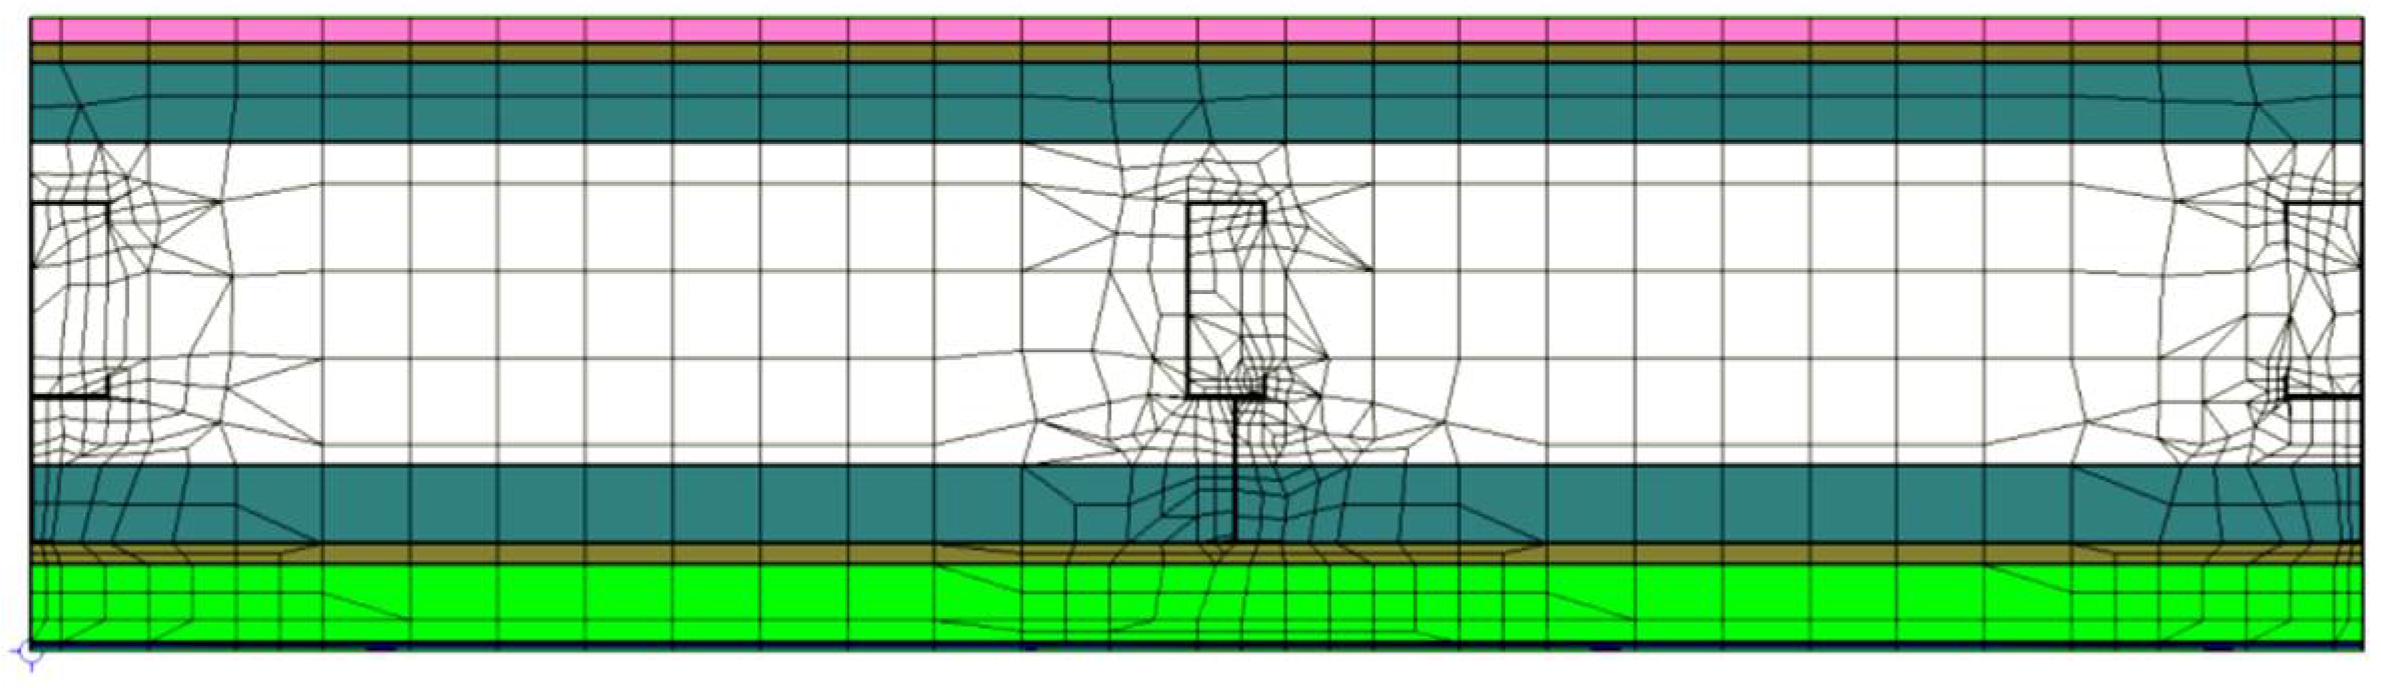
2.3.3. Boundary Conditions and Meshing

The internal and external surface temperatures were configured at 20 °C and 0 °C, respectively, in accordance with ISO 6946 [38]. This standard prescribes the internal and external film coefficients as 7.69 W/m2K and 25 W/m2K. The remaining boundaries were designated as adiabatic surfaces, ensuring no heat transfer. Similar boundary conditions have been employed in the thermal modelling of LGSPs and 3D-printed concrete structures [16,35,37,42]. For mesh control, the Quad Tree Mesh Parameter was set to 6, while the maximum number of iterations and the maximum allowable percentage of error in energy were both defined as 5 and 10%, respectively. Figure 2 shows the default meshed wall configuration as generated by the THERM 7.8 software [40].

2.4. Validation of Thermal Finite Element Models

2.4.1. General

The heat transfer modelling techniques incorporated in the THERM 7.8 software [40] were subjected to validation using established reference test cases from ISO 10211 [36] and comparisons with U-value findings in the literature related to LGSPs. ISO 10211 [36] comprises four standard test cases for validating calculation methods, and in this research, test case 1 and test case 2 were applied to validate the 2D models. Furthermore, thermal models were compared with the thermal analysis results reported by Santos et al. [37] for different LGSP configurations.

2.4.2. Test Case 1 by ISO 10211 [36]

Test case 1 represents surface temperatures at 28 points of half of a square column (see Figure 3). It suggests using them for the validation of a model, with the difference between the temperatures suggested by ISO 10211 [36] and the temperatures calculated by the numerical model using THERM 7.8 [40] not exceeding 0.1 °C. Accordingly, half of a 400 mm × 200 mm square column was modelled using THERM 7.8 [40]. The boundary conditions were set to AB = 20 °C, BC = CD = 0 °C, and AD as adiabatic surface. The thermal conductivity of the material was set to 0.1 W/mK. The obtained temperatures at 28 nodes from the software analysis was compared with the temperatures given in ISO 10211 [36]. Table 1 shows the temperature comparisons. The comparisons indicated that the closest alignment between the results from the THERM 7.8 software [40] and the ISO 10211 [36] solutions was attained with less than 0.1 °C difference.

2.4.3. Test Case 2 by ISO 10211 [36]

As an additional method of validation, ISO 10211 [36] recommends a different test case, which involves a wall section comprising layers filled with various materials, as depicted in Figure 4. The layers, numbered 1 to 4, were filled with concrete, wood, insulation, and aluminium, respectively. The thermal conductivities of each material are outlined in Table 2. Additionally, for each wall component denoted as AB, AC, CD, CF, EM, GJ, IM, and FG-KJ, the thickness measured 500, 6, 15, 5, 40, 1.5, 1.5, and 1.5 mm, respectively. Boundary conditions were established at 0 °C and 20 °C on surfaces AB and HI, respectively. Surface film coefficients for these surfaces were adopted as per ISO 10211 [36] recommendations, set at 16.67 W/m2K and 9.09 W/m2K. The temperature profile obtained from the THERM 7.8 software [40] is illustrated in Figure 4.
According to ISO 10211 [36], temperature values derived from the validated method (i.e., THERM 7.8 [40] in this study) should exhibit a difference of no more than 0.1 °C from ISO solutions. Table 3 compares the temperature solutions obtained from THERM 7.8 [40] and given in ISO 10211 [36]. The comparison results demonstrate that the THERM software [24] achieved the closest agreement with ISO temperature solutions, with a difference of less than 0.1 °C. Furthermore, the heat flow rate obtained from the model was 9.538 W/m, which closely aligned with the ISO 10211 [36] recommendation of 9.5 W/m.

2.4.4. LGSPs by Santos et al. [37]

Santos et al. [37] conducted a comprehensive investigation into the thermal behaviour of various interior and exterior LGSPs. Their research explored the effects on U-values based on different insulation materials and varying thicknesses. Thermal models were developed and the results were compared against the results reported in Santos et al. [37]. The validation process included both interior and exterior wall configurations.
An interior wall was constructed with two 12.5 mm thick gypsum plasterboards on each side of the wall, a steel stud (C90 × 90 × 0.6), and a 90 mm thick cavity that was fully filled with mineral-wool batt insulation. This configuration was modelled as a reference interior wall, setting the total thickness of the wall at 140 mm, as illustrated in Figure 5. Steel studs were set in intervals of 600 mm. Thermal conductivity values as reported in Santos et al. [37] were used for the modelling. The effects of fixing bolts (e.g., metallic self-drilling screws) were neglected in the simulation as their number was reduced, and the overall U-value was affected insignificantly, due to its reduced punctual thermal bridge effect.
Sixteen models of interior LGSPs were developed and those included varying parameters of thickness of steel (series I1), the clearance between steel frames (series I2), the thickness of thermal break (TB) strips (series I3), the material of TB strips (series I4), and the sheathing panel material (series I5). It is important to note that the thermal conductivity values for the thermal breaks used in the series 4 model, as indicated in Santos et al. [37], were 0.122 W/mK for recycled rubber (Acoustic MS-R1), 0.037 W/mK for extruded polystyrene insulation, and 0.015 W/mK for the cold-break-strip aerogel.
As mentioned above, all parameters were incorporated, and U-values were calculated using THERM 7.8 [40] for interior LGSPs. The ratios of simulation results to those reported in Santos et al. [37] for all the considered interior LGSPs are presented in Table 4. The comparison revealed that THERM 7.8 [40] provided the closest agreement with U-values reported in Santos et al. [37], with a mean simulation-to-Santos et al. [37] ratio (USantos et al. [37]/UTHERM) very close to unity and a coefficient of variation (COV) value of 0.007.
Compared to interior LGSPs, exterior LGSPs comprised additional thermal insulation layers, including expanded polystyrene (EPS) and an external thermal insulation composite system (ETICS) applied to the outer surface. These layers were incorporated to effectively manage the substantial temperature fluctuations, a common requirement for facade applications. The modelling utilized thermal conductivity values as presented in Santos et al. [37]. Figure 6 provides a visual representation of the exterior wall’s cross section used in the analyses.
Nineteen models of exterior LGSPs were developed and those included varying parameters of thickness of steel (series E1), the clearance between steel frames (series E2), the thickness of thermal break (TB) strips (series E3), the material of TB strips (series E4), the sheathing panel material (series E5), and the thickness of EPS and ETICS (series E6). As described above, all parameters were incorporated, and U-values were calculated using THERM 7.8 [40] for exterior LGSPs. Table 5 displays the ratios of simulation results for all the exterior LGSPs under consideration to the values reported in Santos et al. [37]. The analysis indicated that THERM 7.8 [40] demonstrated the highest level of agreement with the U-values reported in Santos et al. [37], with a mean simulation-to-Santos et al. [37] ratio (USantos et al. [37]/UTHERM) very close to 1 and a COV of 0.005.
To conclude, the developed thermal FE models could accurately simulate the thermal efficiency and U-values of LGSPs and were considered suitable for performing a parametric study.

2.5. Parametric Study

2.5.1. General

The primary objective of this parametric study was to determine the impact of insulation materials, their thicknesses, and the overall wall width on the thermal performance of the LGSPs. The goal was to identify optimal design solutions using effective insulation materials to enhance the wall’s thermal performance. In total, 52 models were developed and analysed using THERM 7.8 [40]. The LGSP configuration and varying parameters are discussed herein.

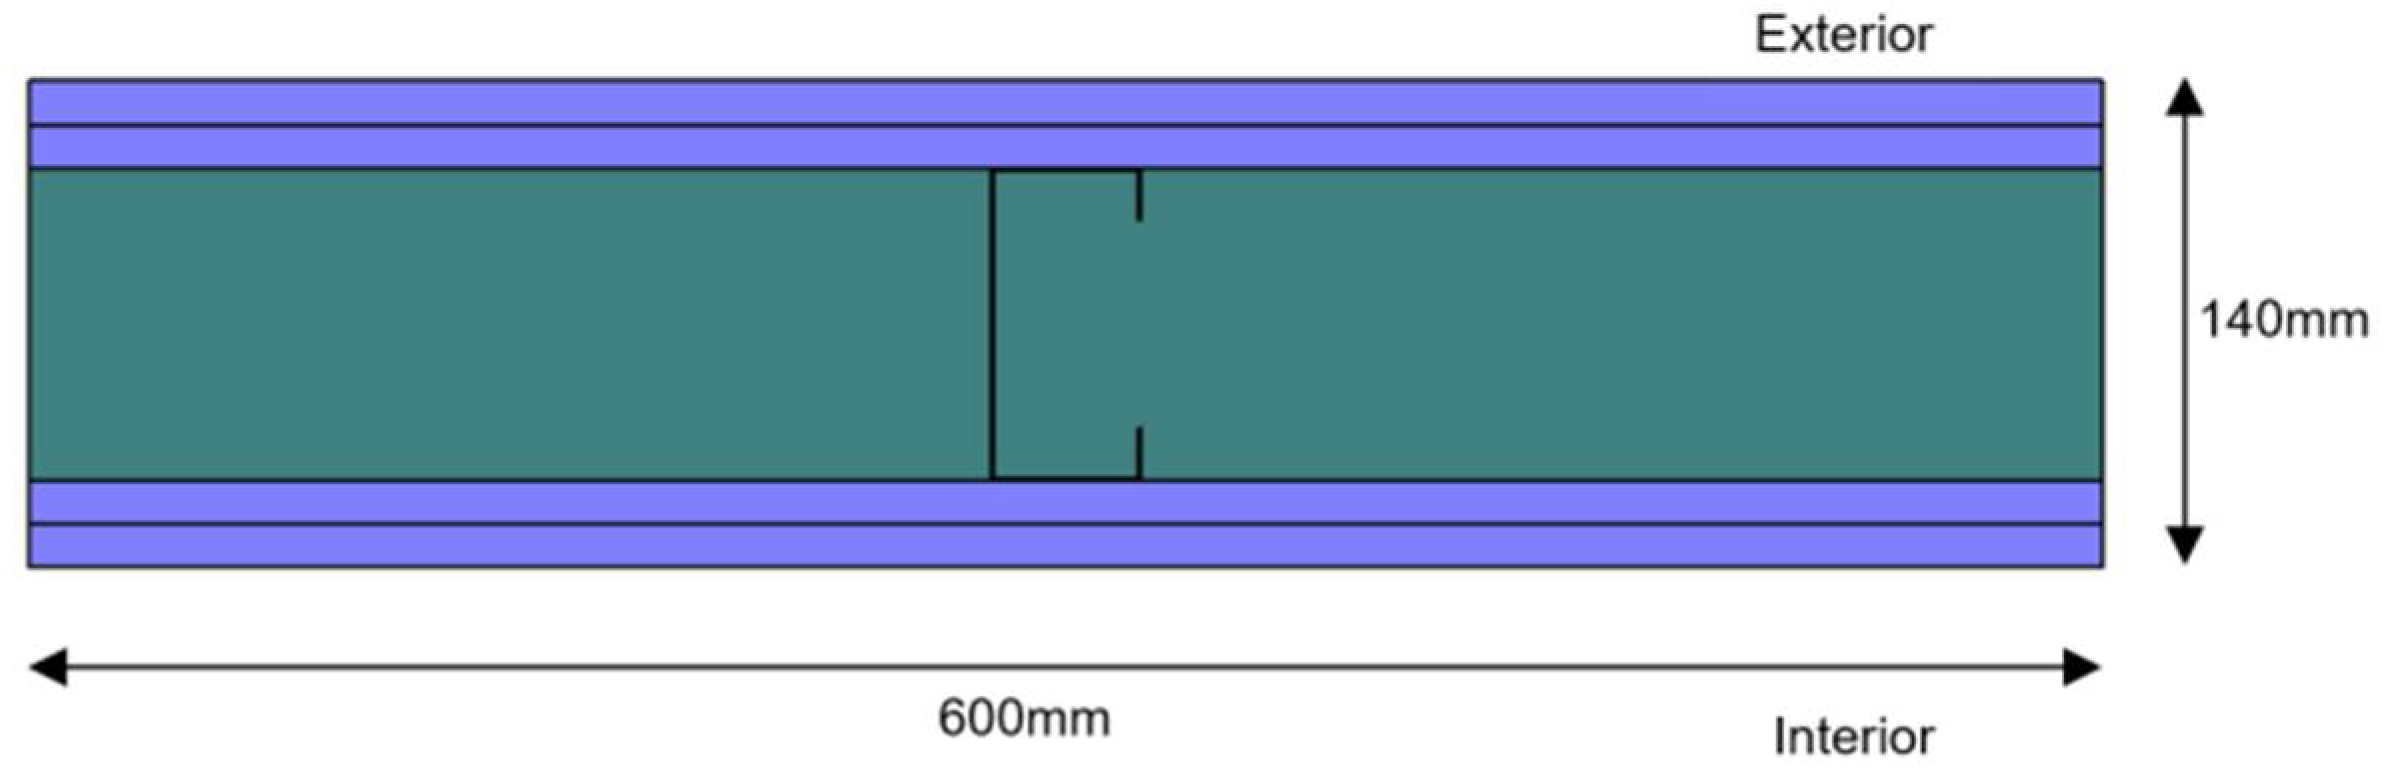
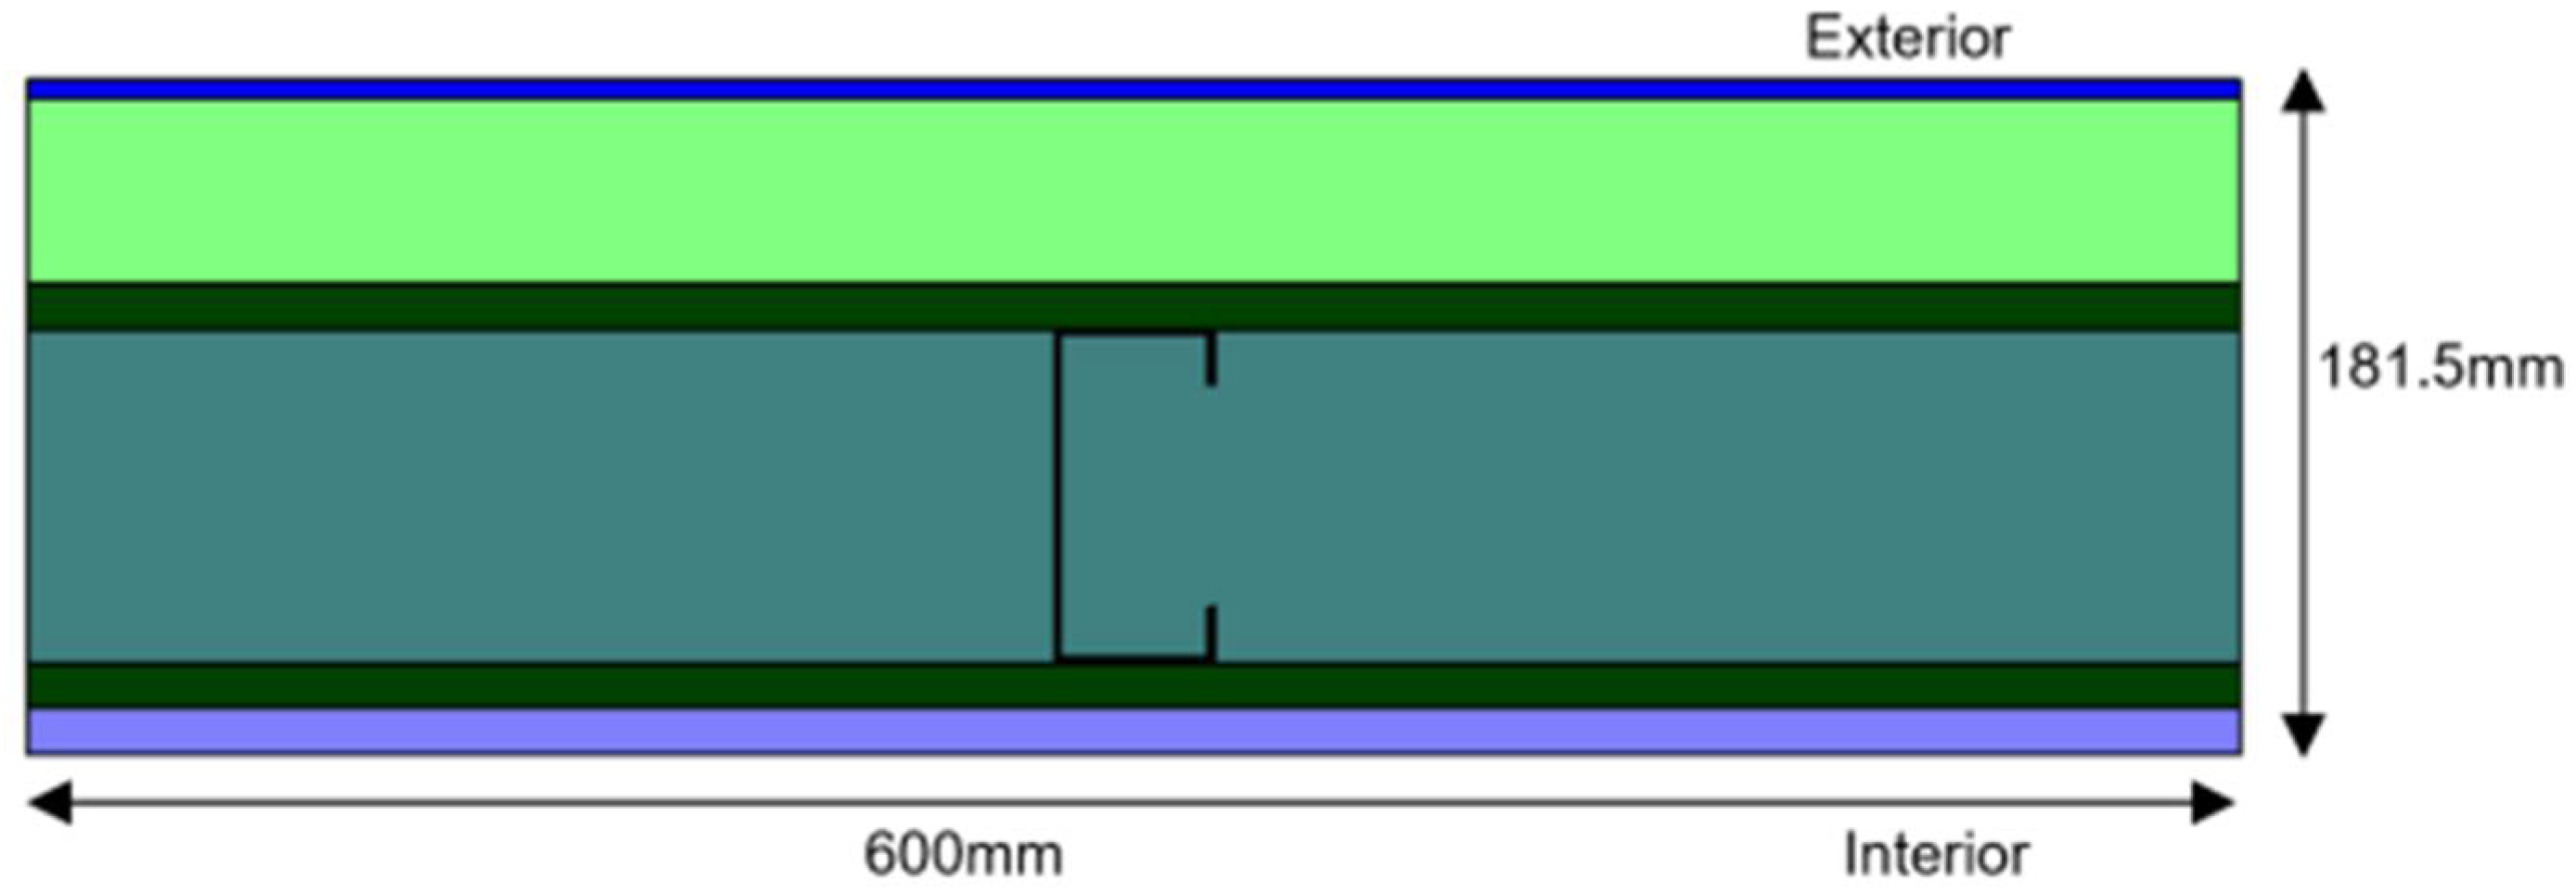
2.5.2. Computational Specimens

The thermal transmittance values (U-values) of LGSP walls were examined with two different wall configurations, each with varying total thicknesses: 275 mm and 325 mm. The schematic shape of the considered wall is illustrated in Figure 7. The impact of insulation material thickness was determined by varying it in relation to the h/H ratio, where “h” represents the thickness of the insulation material, and “H” denotes the total cavity width. The insulation materials included five different types: stone wool, mineral wool, rock wool, E-PLA, and fibreglass. The h/H ratio for both wall thicknesses (275 mm and 325 mm) varied for each wall and was set to 0, 0.2, 0.4, 0.6, 0.8, and 1. The outline of the parametric study is presented in Table 6.
It is important to note that each wall was denoted as C y , z x in the parametric study, where x, y, and z represent the h/H ratio, total thickness of the wall, and the name of the insulation material, respectively. This nomenclature was applied to both walls with thicknesses of 275 mm and 325 mm in the fully filled air configuration, which were designated as C 275 ,   a i r 0 and C 325 ,   a i r 0 , respectively.

3. Results and Discussion

3.1. Walls with a Thickness of 275 mm

The thermal transmittance values (U-values) for each model with a wall thickness of 275 mm, along with the percentage decrease in U-value compared to that of an uninsulated wall filled with air, are presented in Table 7.
The results primarily demonstrate that increasing the thickness of the insulation layer significantly reduces the U-value of the wall and increases the percentage reduction in U-value compared to an uninsulated wall with only an air cavity. The highest U-value, which was 0.641 W/m2K, was observed in the wall with no insulation and an air-filled cavity, while the lowest U-value, 0.179 W/m2K, was achieved in fully insulated walls (using E-PLA). The results indicate that as the ratio of insulation material thickness to cavity width increases, the reduction in U-value gradually increases, ranging from 36% to 72%. Another parameter assessed in this analysis was the influence of the insulation material on the U-value of the wall. For each thickness ratio, E-PLA provided the lowest U-value, while glass fibre resulted in the highest U-value.
When considering the combined effect of thickness ratio and insulation material type, the highest reduction in U-value compared to the wall with only air was 72.07%, achieved by walls fully insulated with E-PLA, whereas the lowest reduction was 36.66%, observed in walls filled with 20% of glass fibre. Regardless of the insulation material used, the U-value ranged from 0.363 W/m2K to 0.179 W/m2K, with reductions varying from 36% to 43% for a 0.2 h/H ratio, 51% to 57% for a 0.4 h/H ratio, 59% to 65% for a 0.6 h/H ratio, 64% to 69% for a 0.8 h/H ratio, and 66% to 72% for fully insulated walls.

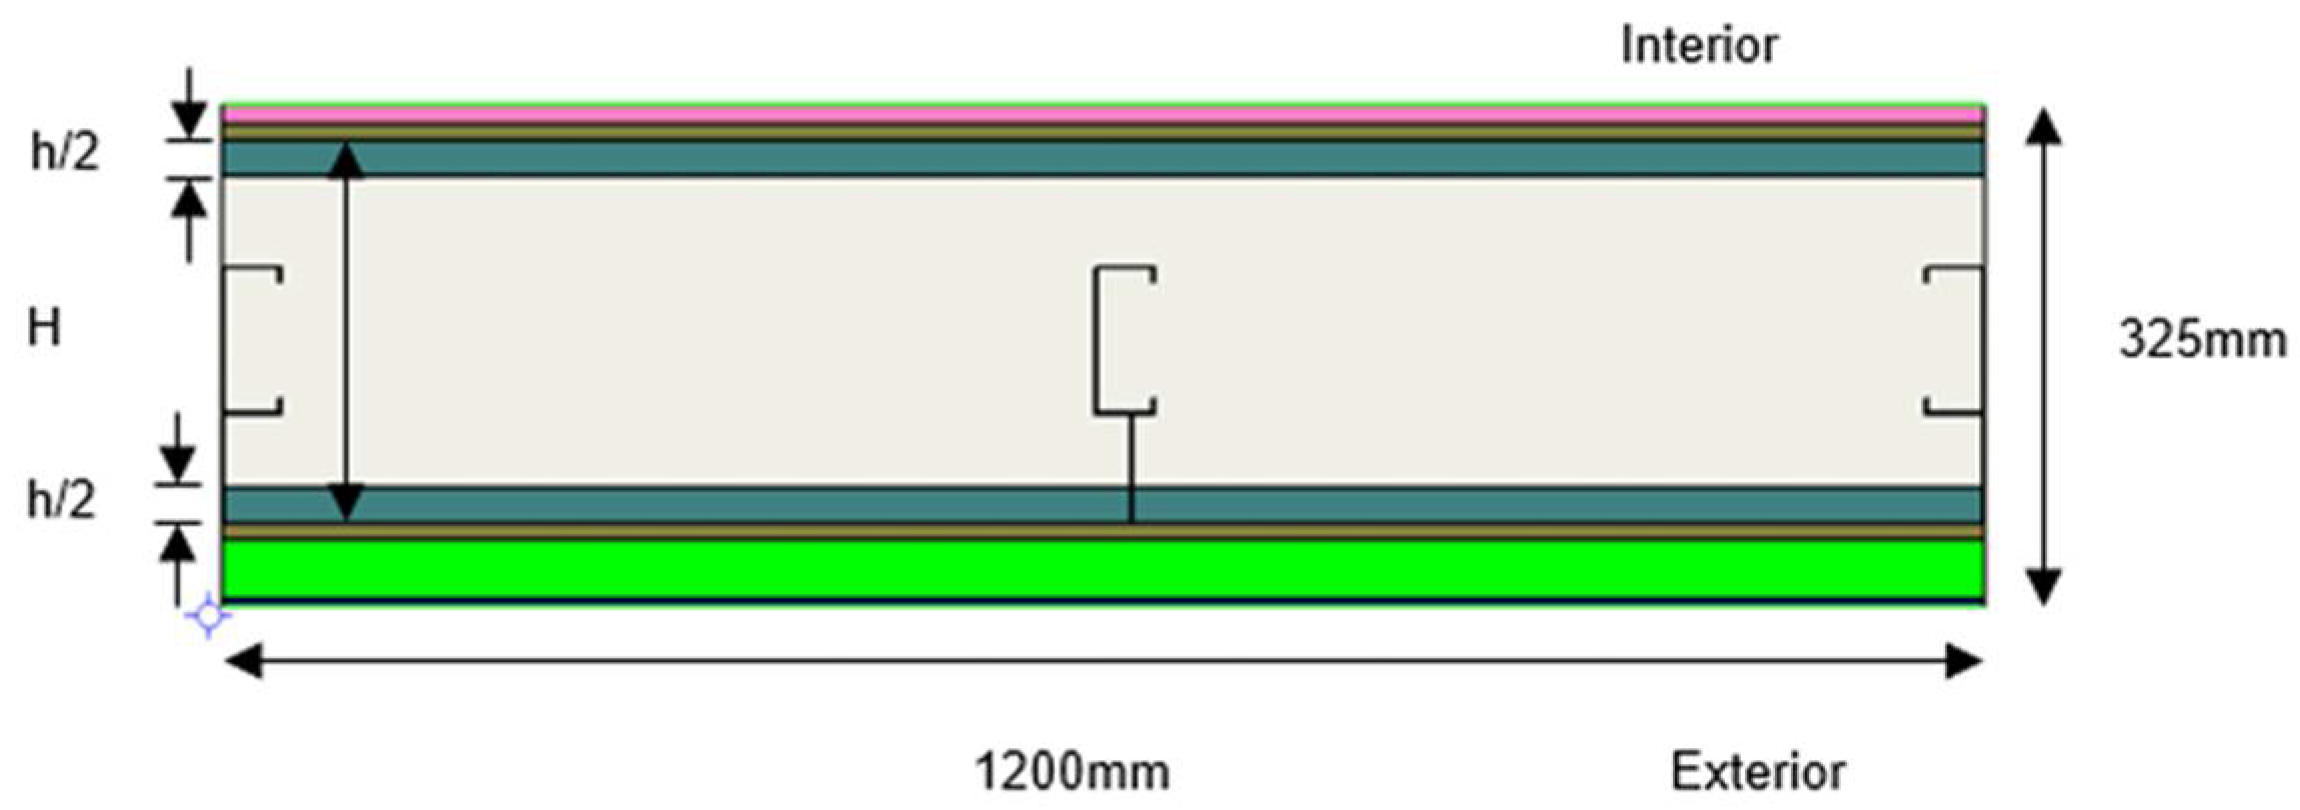
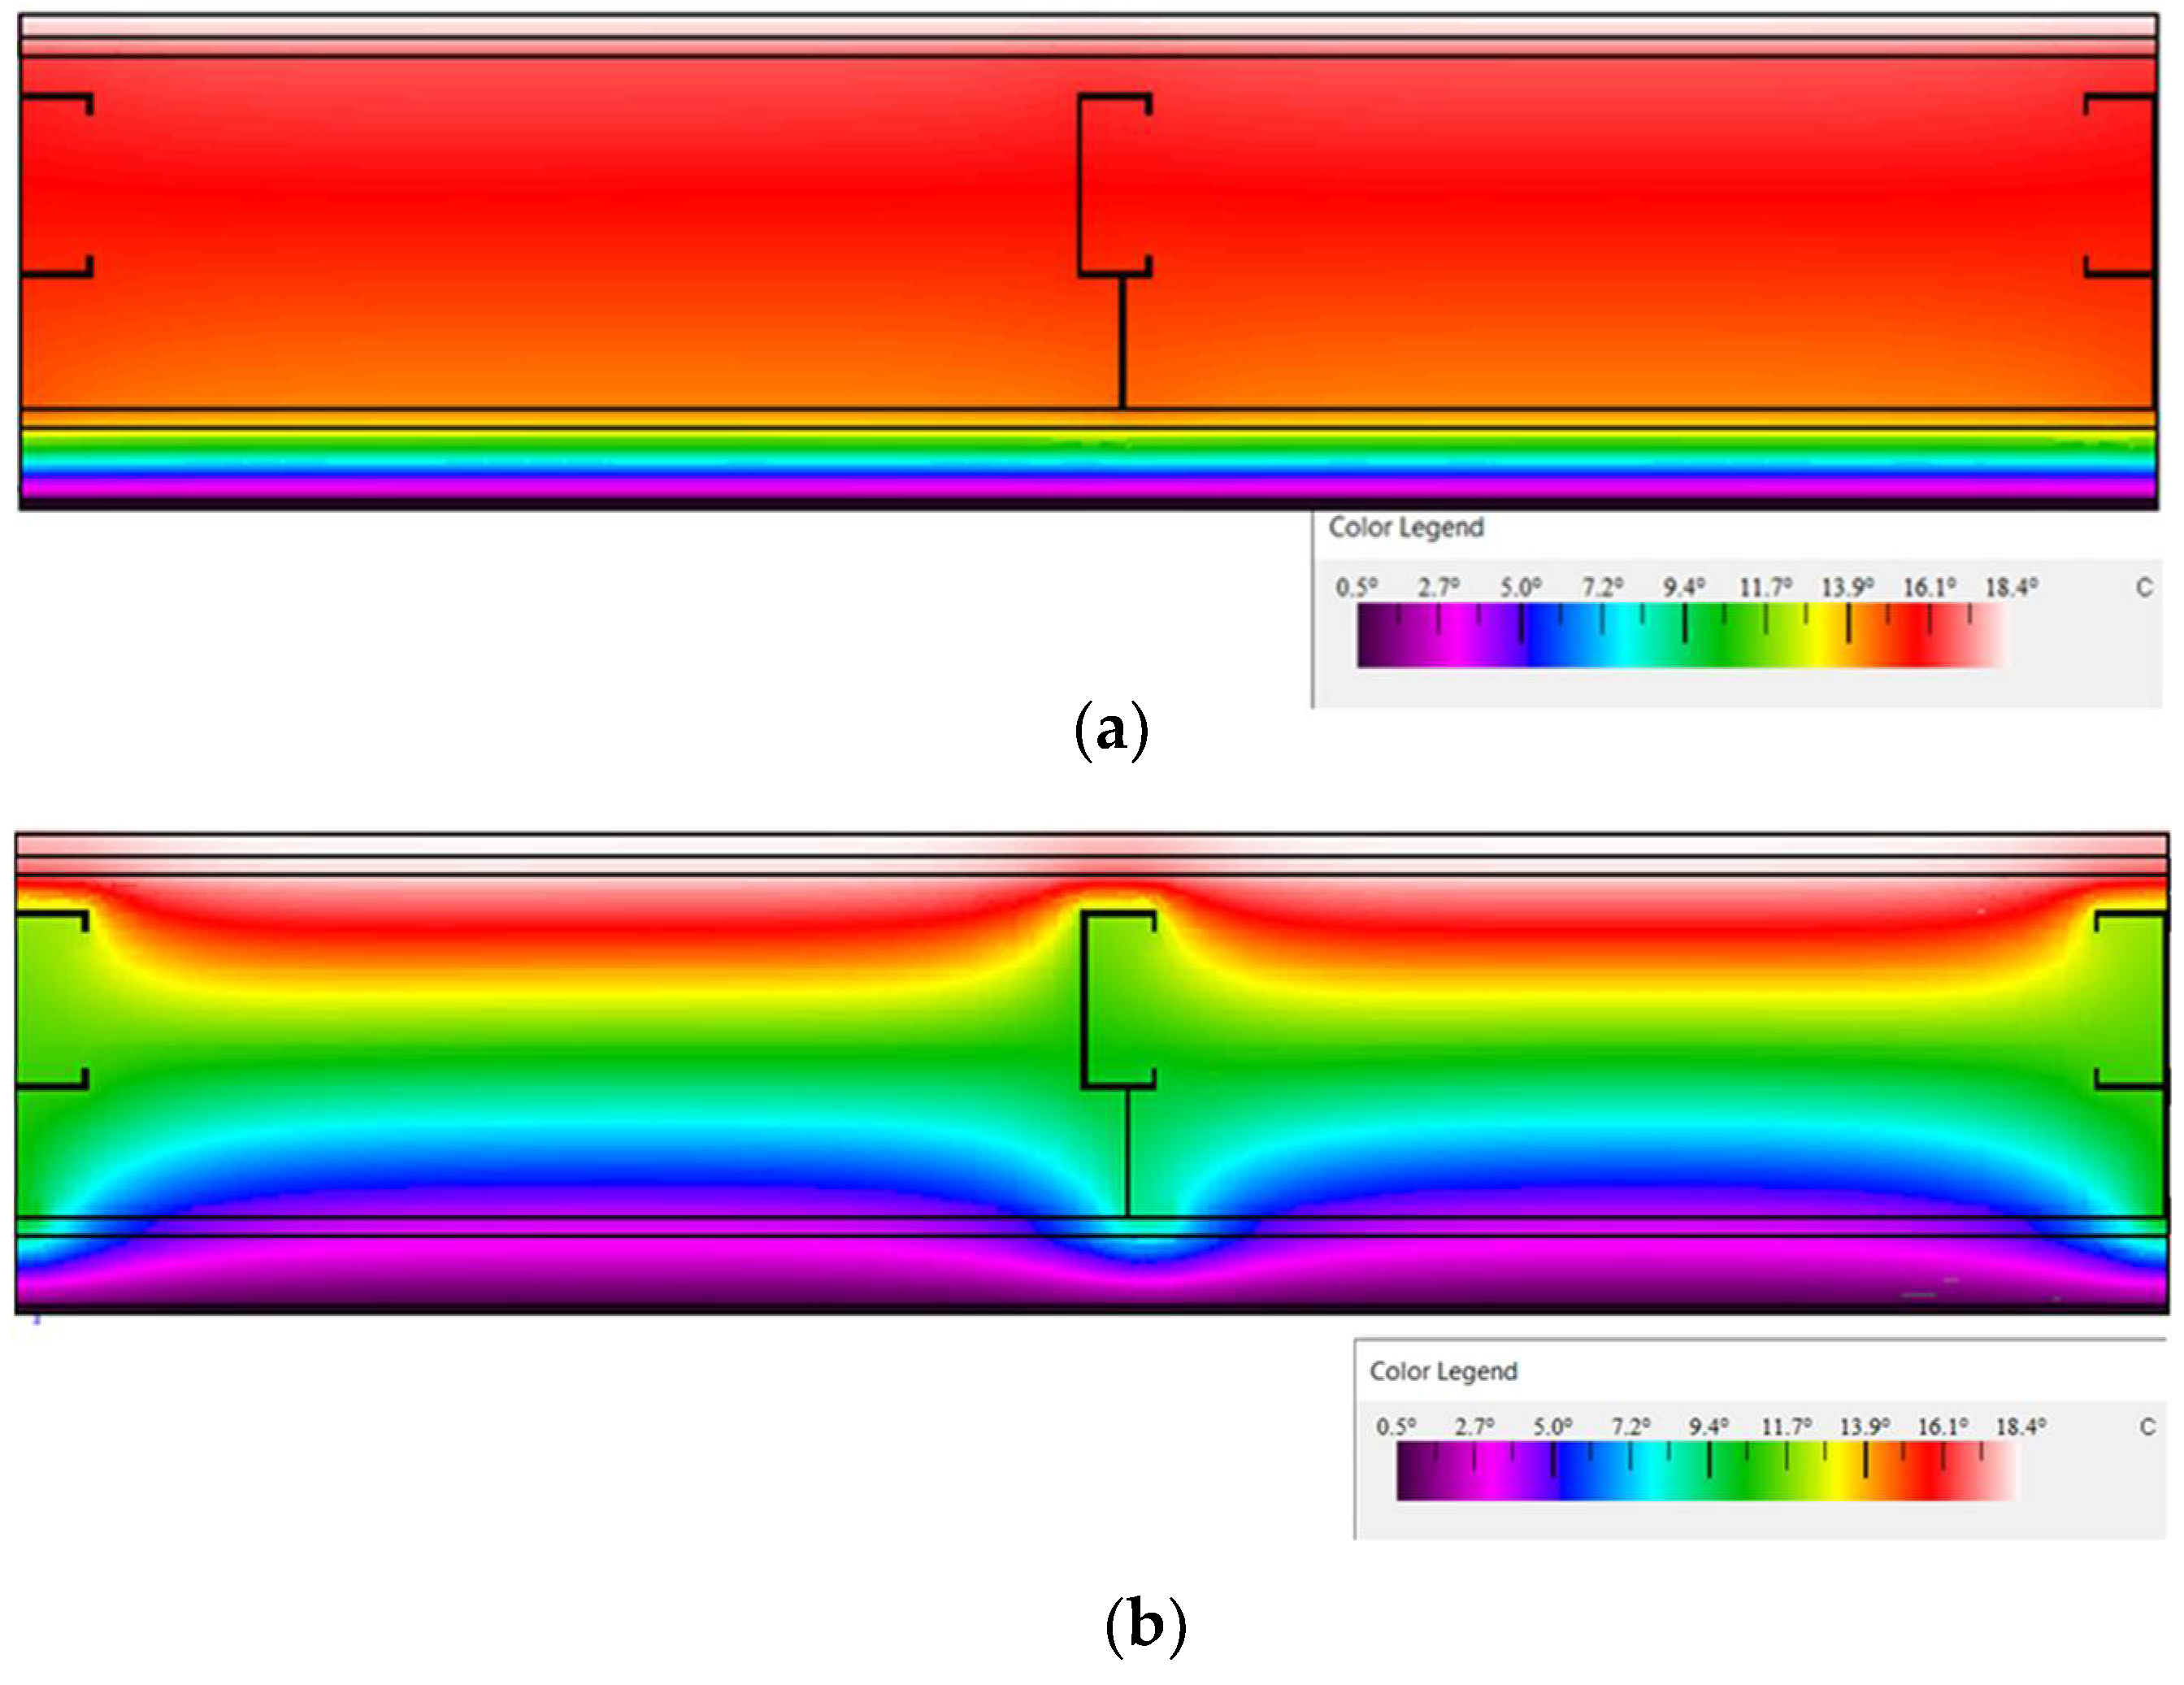
3.2. Walls with a Thickness of 325 mm

In Table 8, the U-values were assessed for each model with a 325 mm wall thickness, as well as the corresponding percentage reduction in U-value compared to an uninsulated wall with an air-filled cavity. Similar to the walls with a thickness of 275 mm, an increase in the insulation layer thickness resulted in a significant decrease in U-values and an increase in the percentage of U-value reduction when compared to the reference wall without insulation. The reference wall, filled only with air, exhibited the highest U-value at 0.638 W/m2K, while the lowest U-value of 0.134 W/m2K was achieved by the wall fully insulated with E-PLA.
For different h/H ratios, the U-value fell within the range of 41% to 79%, and it was inversely proportional to the h/H ratio. Additionally, the influence of the type of insulation material on the U-value was evaluated for the walls with a thickness of 325 mm. Like the walls with a 275 mm thickness, E-PLA resulted in the lowest U-value at 0.134 W/m2K, while glass fibre provided the highest U-value, at 0.329 W/m2K, second only to the reference wall fully filled with air.
When considering the overall effect of applying insulation materials while varying the h/H ratio, the highest percentage reduction in U-value compared to the reference wall was 79.0%, achieved by the wall fully insulated with E-PLA, while the lowest reduction was 41.39%, observed in the wall with 20% of glass fibre. The U-value ranged from 0.372 W/m2K to 0.150 W/m2K for all five insulation materials. The reduction in U-value varied from 41% to 48% for walls with a thickness ratio of 0.2, 57% to 64% for 0.4 h/H, 66% to 71% for 0.6 h/H, 71% to 76% for 0.8 h/H, and 74% to 79% for fully insulated walls.

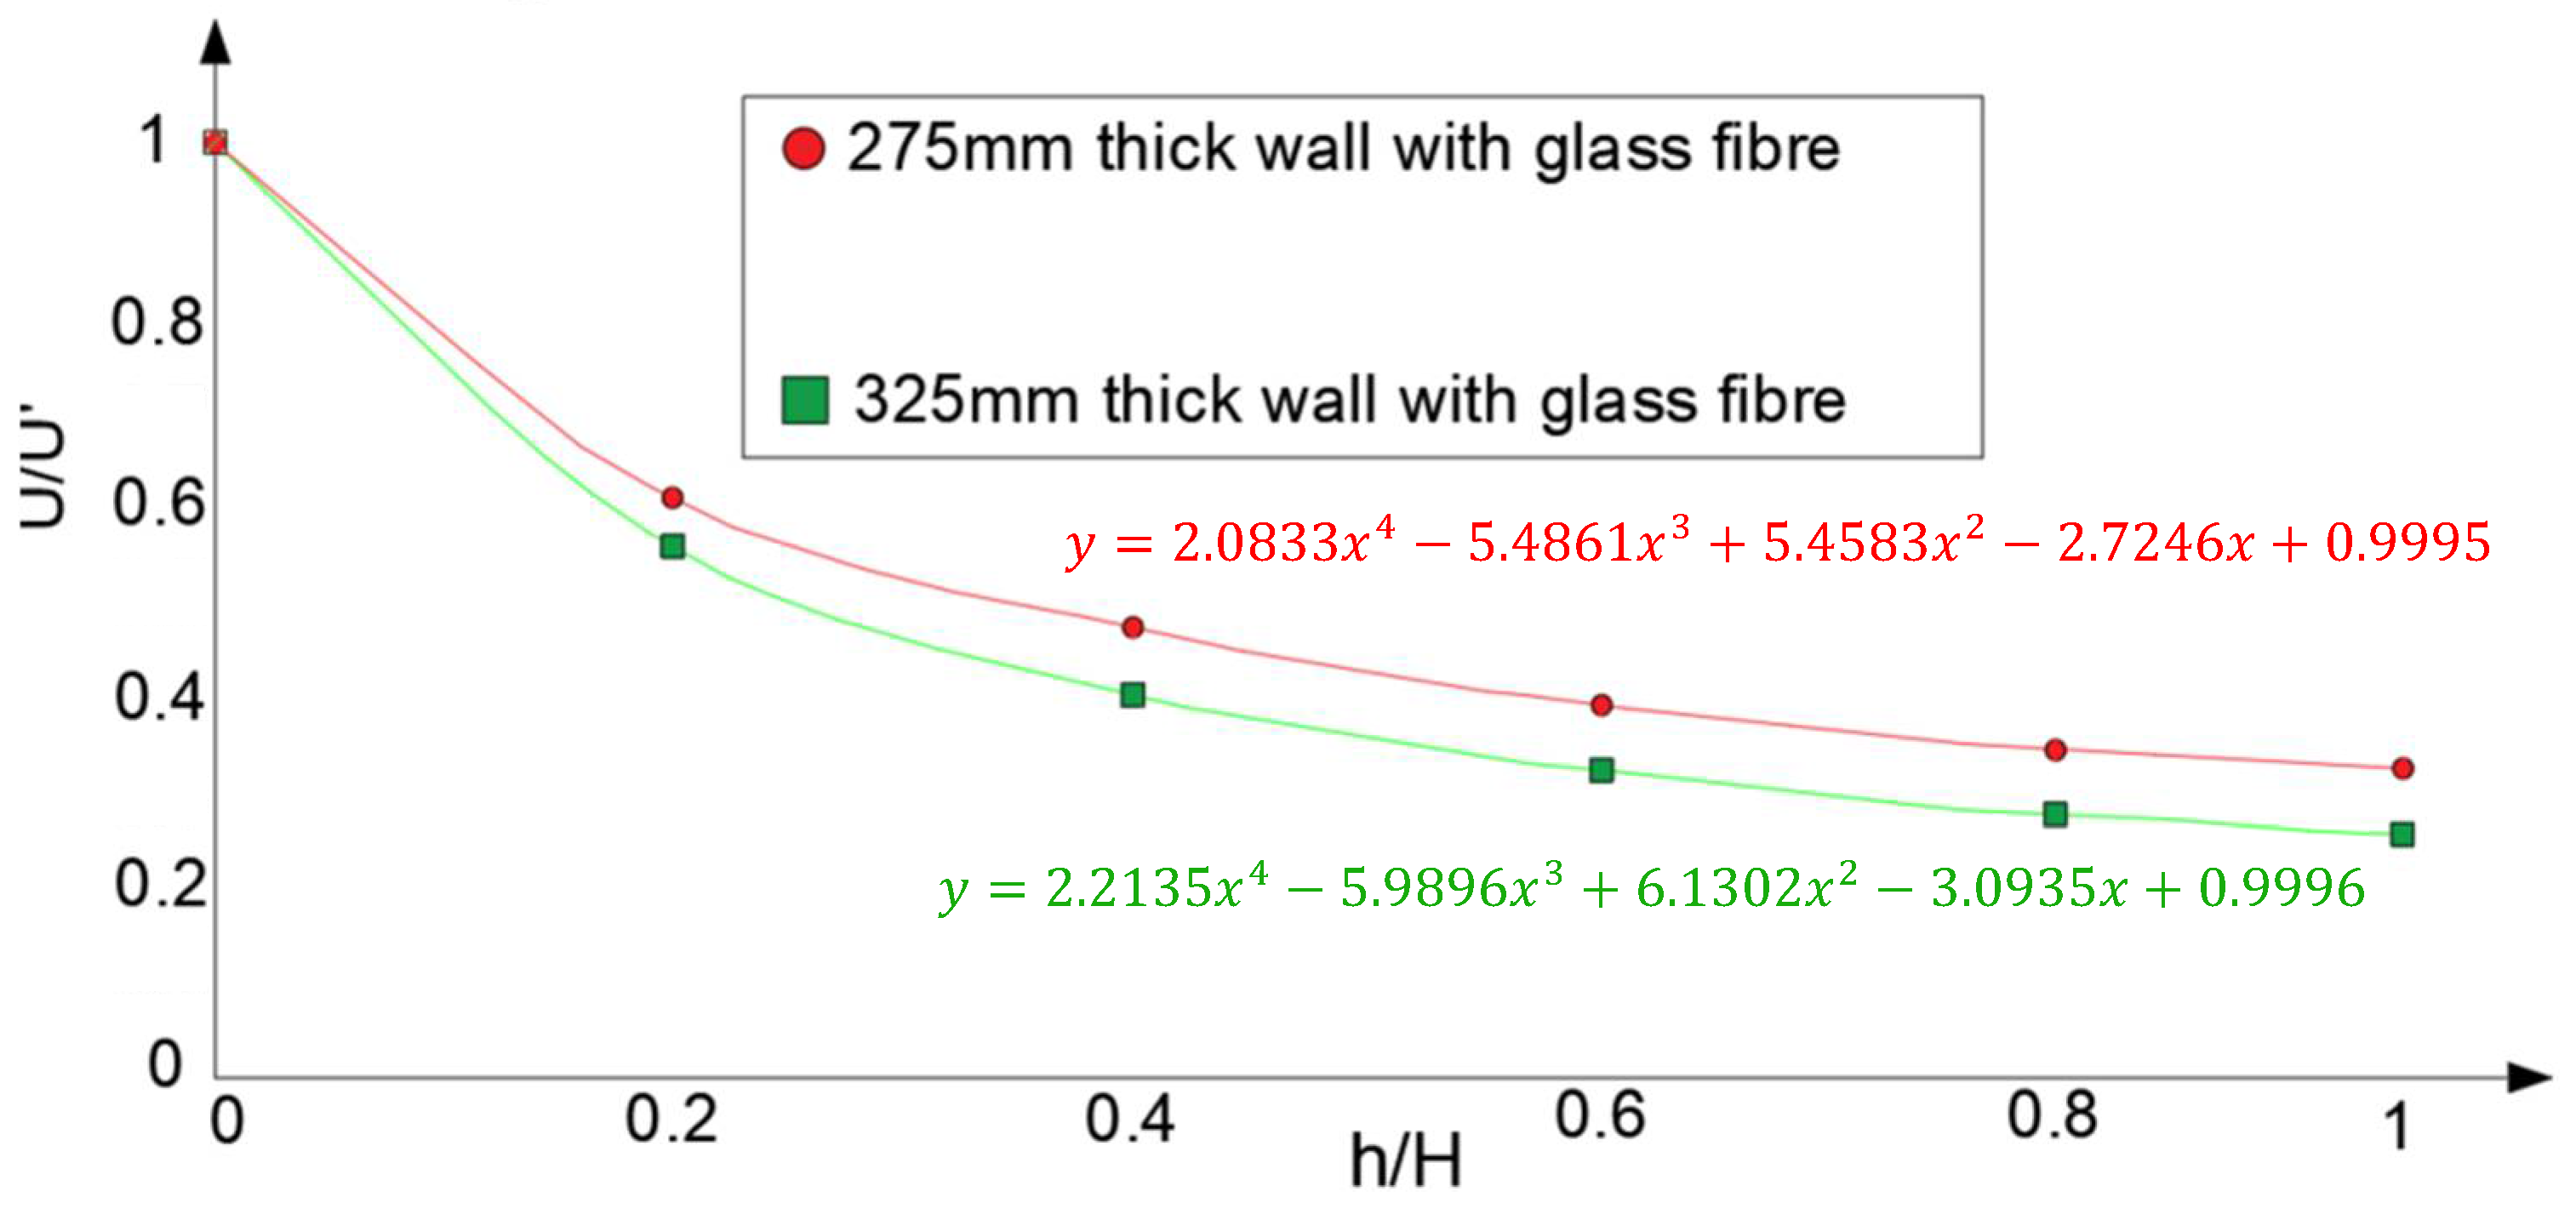
3.3. Comparison between Walls with Thicknesses of 275 mm and 325 mm

The U-values for both wall configurations were separately analysed and compared in the previous subsections. To provide a more concise summary, it can be concluded that the changes in reduction percentages with respect to h/H ratios exhibited a similar behaviour for both wall thicknesses. Notably, as the wall thickness increased, the reduction percentage also increased. For instance, Figure 8 provides a visual comparison of results for both walls using glass-fibre insulation material, highlighting this observation. Likewise, in Figure 9, the temperature distributions and heat flux distributions for an instance along both 275 mm thick walls, one fully insulated with glass fibres and the other without any insulation material, were compared. This comparison illustrates the influence of the insulation material on the thermal transmission of an LGSP wall.

3.4. Comparison of LGSP Results with 3D-Printed Concrete Panels

Recently, Ravula and Gatheeshgar [42] investigated the thermal-energy performance of 3D-printed concrete wall panels with varying insulation ratios. Their study included 100 mm and 200 mm 3D-printed wall thicknesses infilled with mineral wool, rock wool, glass fibre, and E-PLA, with insulation ratios ranging from 0 to 1.0. Table 9 compares the U-value reductions obtained for the 3D-printed concrete wall panels with glass-fibre insulation against the results obtained from this study for LGSPs. The comparison revealed that the results for 3D-printed concrete followed a similar trend. However, it was observed that the magnitude of the U-value reduction was higher for 3D-printed concrete walls despite the lower thickness of the wall. This difference was mainly governed by the wall configuration and the different materials used in LGSPs and 3D-printed concrete walls.

4. Design Approach

4.1. General

The parametric study results from previous sections reveal that the U-value of LGSPs is mainly governed by insulation type and insulation ratios. Adopting a simplified design approach would be beneficial to capture these effects. Hence, a new design approach is presented in this section with the aim of estimating the U-value of LGSPs with varying insulation ratios more accurately. In addition, the optimum insulation thickness required to meet the target U-values for different types of walls is estimated.

4.2. Design Equations

The U-value estimation according to the ISO design method [38] for LGSPs with varying insulation ratios becomes complex due to inhomogeneous layer arrangements. Therefore, it is beneficial to propose equations to estimate the U-value based on the comprehensive parametric study results with different insulation ratios. To achieve this, a ratio (U/U’) was established where U’ represents the U-value obtained from the reference wall, which was the wall filled with air (no cavity insulation). Parametric results were graphed to identify potential correlations between the data. For instance, Figure 10 illustrates equations for walls insulated with glass-fibre material, featuring thicknesses of 275 mm and 325 mm. It is observed that there is a clear relationship between the insulation ratio (h/H) and U-values. A fourth-order polynomial equation was found to be a suitable representation of that correlation. These proposed simplified design approaches provide a more straightforward method for estimating U-values for LGSP walls, reducing complexity while maintaining accuracy. A similar design methodology was proposed in a previous study for 3D-printed concrete panels with varying insulation ratios [42].
Equations were formulated based on the established correlation to predict the thermal transmittance values (U-values) of LGSP walls with different insulation ratios. In this context, the term U/U’ denotes the reduction factor, with U representing the thermal transmittance, and U’ denotes the reference thermal transmittance for LGSP wall panels with no insulation. These methodologies were applied to all computational specimens and achieved the same structure of formulations. Therefore, the general equation for all computational specimens can be suggested as Equation (6).
U U = a h H 4 b h H 3 + c h H 2 d h H + e
where a, b, c, d, and e are coefficients as outlined in Table 10. U’ was defined as 0.641 W/m2K for 275 mm thick walls and 0.638 W/m2K for 325 mm thick walls. The proposed unified equation can serve as a valuable tool for designers to predict the U-values of LGSP walls with different insulation infills.

4.3. Optimum Thickness of Insulation Material

The updated UK building regulations [43] introduce minimum target U-values for various building elements, including domestic walls. This 2021 edition incorporates amendments from 2023, applicable in England. The recommended U-values for domestic walls are presented in Table 11. As per the revised UK building regulations [43], the optimal h/H ratio was computed for each wall thickness and insulation material. The resulting h/H ratios for each wall are presented in Table 12.
As shown in Table 12, “Cavity Insulation” generally exhibits lower h/H values compared to other configurations, emphasizing the importance of selecting the right insulation material for the intended use. On the other hand, Table 12 illustrates how the choice of insulation material influences thermal resistance. For example, mineral wool, rock wool and glass fibre exhibit higher h/H values, for the wall thickness equal to 325 mm, to meet the recommended U-values for domestic walls. Likewise, increasing the insulation thickness, h, typically enhances thermal resistance. The difference in h/H values between 275 mm and 325 mm thickness variations is particularly evident, demonstrating the importance of insulation thickness in improving thermal performance. Finally, this comparative analysis of wall insulation configurations takes into account key factors, including insulation material, insulation thickness, h, and total wall thickness. It equips decision-makers, including builders, architects, and homeowners, with valuable insights for making informed choices that enhance both energy efficiency and comfort in construction projects. The h/H ratio within this analysis serves as a valuable reference, aligning with building regulations and accommodating variations in wall thickness to optimise thermal resistance. It acts as a practical guide for creating spaces that strike the perfect balance between energy conservation and occupant well-being.

5. Conclusions

In this study, a comprehensive analysis of the thermal behaviour and thermal transmittance (U-value) of light-gauge steel panels (LGSPs) with different insulation ratios was conducted. The analysis was carried out using 2D finite element models implemented in THERM [40]. These models were validated through a comparison with ISO 10211 test cases [36], and previous research conducted by Santos et al. [37]. The parametric study included different insulation options (stone wool, E-PLA, mineral wool, rock wool, and fibreglass) and insulation ratios (0, 0.2, 0.4, 0.6, 0.8, and 1.0) to broaden the range of thermal transmittance data on LGSP walls. The results were compared with the U-value of the reference wall for each thickness, i.e., the wall with no cavity insulation. Based on the results, the following conclusions were drawn:
  • Increasing the insulation layer thickness led to a decrease in the U-value of the wall.
  • The U-value of LGSP walls is directly associated with the thermal conductivity of the insulation material, with a lower thermal conductivity resulting in lower U-values.
  • Walls fully insulated with E-PLA exhibited the lowest U-values for both 275 mm and 325 mm thicknesses.
  • As wall thickness increased, U-values decreased, with 325 mm thick walls showing lower U-values for each h/H ratio compared to 275 mm thick walls.
  • Utilizing 80% of insulation materials for 275 mm thick walls and 60% for 325 mm thick walls achieved more than a 65% reduction in U-values compared to walls with no cavity insulation.
  • A simplified and unified equation was developed to predict the U-values for LGSP walls with varying insulation ratios.
  • The optimum h/H ratios for new builds and existing building extensions were found to be around 0.9 and 0.7 for 275 mm and 325 mm thick walls, respectively, with stone wool and E-PLA being the only materials that met the standard U-values for 275 mm thick walls. For internal and external insulation and cavity insulations, the optimum ratios were 0.3 and 0.05 for both wall thicknesses.
The exploration of different insulation ratios aims to provide designers with valuable insights into the thermal performance of LGSPs. This knowledge will empower designers to meet their target U-values for buildings, ultimately resulting in decreased energy usage and reduced heating and cooling expenses. In summary, the findings hold significant relevance for the design and construction of energy-efficient buildings, particularly those incorporating LGSPs.

Author Contributions

Conceptualization, P.G. and D.C.; methodology, D.C.; software, D.C.; validation, D.C.; formal analysis, D.C.; investigation, D.C. data curation, D.C. and H.M.A.; writing—original draft preparation, D.C. and H.M.A.; writing—review and editing, P.G. and L.S.; visualization, L.S. and H.M.A.; supervision, P.G.; project administration, P.G. All authors have read and agreed to the published version of the manuscript.

Funding

This research received no external funding.

Data Availability Statement

Data are contained within the article.

Acknowledgments

This work was supported by Teesside University in terms of technical and research facilities.

Conflicts of Interest

The authors declare no conflicts of interest.

References

  1. Gatheeshgar, P.; Poologanathan, K.; Gunalan, S.; Shyha, I.; Sherlock, P.; Rajanayagam, H.; Nagaratnam, B. Development of affordable steel-framed modular buildings for emergency situations (COVID-19). Structures 2021, 31, 862–875. [Google Scholar] [CrossRef]
  2. Gatheeshgar, P.; Poologanathan, K.; Gunalan, S.; Tsavdaridis, K.D.; Nagaratnam, B.; Iacovidou, E. Optimised cold-formed steel beams in modular building applications. J. Build. Eng. 2020, 32, 101607. [Google Scholar] [CrossRef]
  3. Tadeu, A.; Simões, I.; Simões, N.; Prata, J. Simulation of dynamic linear thermal bridges using a boundary element method model in the frequency domain. Energy Build. 2011, 43, 3685–3695. [Google Scholar] [CrossRef]
  4. Santos, P.; Martins, C.; Simões da Silva, L. Thermal performance of lightweight steel-framed construction systems. Metall. Res. Technol. 2014, 111, 329–338. [Google Scholar] [CrossRef]
  5. Lawson, R.M. ED011—Light Steel Residential Buildings; Steel Construction Institute: Ascot, UK, 2012. [Google Scholar]
  6. P402; Light Steel Framing in Residential Construction. Steel Construction Institute: Ascot, UK, 2015.
  7. BS EN 520:2004+A1:2009; Gypsum Plasterboards—Definitions, Requirements and Test Methods. European Committee for Standardization: Brussels, Belgium, 2009.
  8. Santos, P.; Gonçalves, M.; Martins, C.; Soares, N.; Costa, J.J. Thermal transmittance of lightweight steel framed walls: Experimental versus numerical and analytical approaches. J. Build. Eng. 2019, 25, 100776. [Google Scholar] [CrossRef]
  9. Lee, D.-Y.; Cho, B.-H.; Jung, D.-I.; Lee, J.-S.; Lee, K.-W. Experimental Study on the Cyclic Behavior of Integrated Panels for Cold-Formed Steel Shear Wall System. Appl. Sci. 2020, 10, 1649. [Google Scholar] [CrossRef]
  10. Liang, H.; Roy, K.; Fang, Z.; Lim, J.B.P. A Critical Review on Optimization of Cold-Formed Steel Members for Better Structural and Thermal Performances. Buildings 2022, 12, 34. [Google Scholar] [CrossRef]
  11. Gunalan, S.; Kolarkar, P.; Mahendran, M. Experimental study of load bearing cold-formed steel wall systems under fire conditions. Thin-Walled Struct. 2013, 65, 72–92. [Google Scholar] [CrossRef]
  12. Gatheeshgar, P.; Poologanathan, K.; Thamboo, J.; Roy, K.; Rossi, B.; Molkens, T.; Perera, D.; Navaratnam, S. On the fire behaviour of modular floors designed with optimised cold-formed steel joists. Structures 2021, 30, 1071–1085. [Google Scholar] [CrossRef]
  13. Usefi, N.; Sharafi, P.; Mortazavi, M.; Ronagh, H.; Samali, B. Structural performance and sustainability assessment of hybrid-cold formed modular steel frame. J. Build. Eng. 2021, 34, 101895. [Google Scholar] [CrossRef]
  14. Zalewski, L.; Lassue, S.; Rousse, D.; Boukhalfa, K. Experimental and numerical characterization of thermal bridges in prefabricated building walls. Energy Convers. Manag. 2010, 51, 2869–2877. [Google Scholar] [CrossRef]
  15. Martins, C.; Santos, P.; da Silva, L.S. Lightweight steel-framed thermal bridges mitigation strategies: A parametric study. J. Build. Phys. 2015, 39, 342–372. [Google Scholar] [CrossRef]
  16. Roque, E.; Santos, P. The Effectiveness of Thermal Insulation in Lightweight Steel-Framed Walls with Respect to Its Position. Buildings 2017, 7, 13. [Google Scholar] [CrossRef]
  17. Jan Kosny, J.E.C. Thermal evaluation of several configurations of insulation and structural materials for some metal stud walls. Energy Build. 1995, 22, 157–163. [Google Scholar] [CrossRef]
  18. Santos, P.; Mateus, D. Experimental assessment of thermal break strips performance in load-bearing and non-load-bearing LSF walls. J. Build. Eng. 2020, 32, 101693. [Google Scholar] [CrossRef]
  19. Liu, C.; Mao, X.; He, L.; Chen, X.; Yang, Y.; Yuan, J. A new demountable light-gauge steel framed wall: Flexural behavior, thermal performance and life cycle assessment. J. Build. Eng. 2022, 47, 103856. [Google Scholar] [CrossRef]
  20. Al-Radhi, Y.; Roy, K.; Liang, H.; Ghosh, K.; Clifton, G.C.; Lim, J.B.P. Thermal performance of different construction materials used in New Zealand dwellings comparatively to international practice—A systematic literature review. J. Build. Eng. 2023, 72, 106346. [Google Scholar] [CrossRef]
  21. Rajanayagam, H.; Upasiri, I.; Poologanathan, K.; Gatheeshgar, P.; Sherlock, P.; Konthesingha, C.; Nagaratnam, B.; Perera, D. Thermal Performance of LSF Wall Systems with Vacuum Insulation Panels. Buildings 2021, 11, 621. [Google Scholar] [CrossRef]
  22. Kapoor, D.R.; Peterman, K.D. Quantification and prediction of the thermal performance of cold-formed steel wall assemblies. Structures 2021, 30, 305–315. [Google Scholar] [CrossRef]
  23. Lupan, L.M.; Manea, D.L.; Moga, L.M. Improving Thermal Performance of the Wall Panels Using Slotted Steel Stud Framing. Procedia Technol. 2016, 22, 351–357. [Google Scholar] [CrossRef]
  24. Yang, Z.; Sun, L.; Nan, B.; Wei, S. Thermal Performance of Slotted Light Steel-Framed Composite Wall. Energies 2023, 16, 2482. [Google Scholar] [CrossRef]
  25. Santos, P.; Poologanathan, K. The Importance of Stud Flanges Size and Shape on the Thermal Performance of Lightweight Steel Framed Walls. Sustainability 2021, 13, 3970. [Google Scholar] [CrossRef]
  26. Gatheeshgar, P.; Alsanat, H.; Poologanathan, K.; Gunalan, S.; Degtyareva, N.; Wanniarachchi, S.; Fareed, I. Web crippling of slotted perforated Cold-Formed Steel channels under EOF load case: Simulation and design. J. Build. Eng. 2021, 44, 103306. [Google Scholar] [CrossRef]
  27. Gatheeshgar, P.; Alsanat, H.; Poologanathan, K.; Gunalan, S.; Degtyareva, N.; Hajirasouliha, I. Web crippling behaviour of slotted perforated cold-formed steel channels: IOF load case. J. Constr. Steel Res. 2022, 188, 106974. [Google Scholar] [CrossRef]
  28. Lohmann, V.; Santos, P. Trombe Wall Thermal Behavior and Energy Efficiency of a Light Steel Frame Compartment: Experimental and Numerical Assessments. Energies 2020, 13, 2744. [Google Scholar] [CrossRef]
  29. Gervásio, H.; Santos, P.; da Silva, L.S.; Lopes, A.M.G. Influence of thermal insulation on the energy balance for cold-formed buildings. Adv. Steel Constr. 2010, 6, 742–766. [Google Scholar]
  30. Kaynakli, O. A review of the economical and optimum thermal insulation thickness for building applications. Renew. Sustain. Energy Rev. 2012, 16, 415–425. [Google Scholar] [CrossRef]
  31. Soares, N.; Martins, C.; Gonçalves, M.; Santos, P.; da Silva, L.S.; Costa, J.J. Laboratory and in-situ non-destructive methods to evaluate the thermal transmittance and behavior of walls, windows, and construction elements with innovative materials: A review. Energy Build. 2019, 182, 88–110. [Google Scholar] [CrossRef]
  32. Roque, E.; Santos, P.; Pereira, A.C. Thermal and sound insulation of lightweight steel-framed façade walls. Sci. Technol. Built Environ. 2018, 25, 156–176. [Google Scholar] [CrossRef]
  33. Perera, D.; Poologanathan, K.; Gillie, M.; Gatheeshgar, P.; Sherlock, P.; Nanayakkara, S.M.A.; Konthesingha, K.M.C. Fire performance of cold, warm and hybrid LSF wall panels using numerical studies. Thin-Walled Struct. 2020, 157, 107109. [Google Scholar] [CrossRef]
  34. Sun, K.; Zheng, C.; Wang, X. Thermal performance and thermal transmittance prediction of novel light-gauge steel-framed straw walls. J. Build. Eng. 2023, 67, 105973. [Google Scholar] [CrossRef]
  35. Perera, D.; Upasiri, I.R.; Poologanathan, K.; Gatheeshgar, P.; Sherlock, P.; Hewavitharana, T.; Suntharalingam, T. Energy performance of fire rated LSF walls under UK climate conditions. J. Build. Eng. 2021, 44, 103293. [Google Scholar] [CrossRef]
  36. ISO 10211; Thermal Bridges in Building Construction—Heat Flows and Surface Temperatures—Detailed Calculations. International Organization for Standardization: Geneva, Switzerland, 2017.
  37. Santos, P.; Lemes, G.; Mateus, D. Thermal Transmittance of Internal Partition and External Facade LSF Walls: A Parametric Study. Energies 2019, 12, 2671. [Google Scholar] [CrossRef]
  38. ISO 6946; Building Components and Building Elements—Thermal Resistance and Thermal Transmittance—Calculation Methods. International Organization for Standardization: Geneva, Switzerland, 2017.
  39. Santos, P.; Lemes, G.; Mateus, D. Analytical Methods to Estimate the Thermal Transmittance of LSF Walls: Calculation Procedures Review and Accuracy Comparison. Energies 2020, 13, 840. [Google Scholar] [CrossRef]
  40. THERM. Software Version 7.8. Available online: https://windows.lbl.gov/tools/therm/software-download (accessed on 3 March 2023).
  41. Alkhalidi, A.; Hatuqay, D. Energy efficient 3D printed buildings: Material and techniques selection worldwide study. J. Build. Eng. 2020, 30, 101286. [Google Scholar] [CrossRef]
  42. Ravula, R.; Gatheeshgar, P. On the thermal-energy performance of 3D printed concrete wall panels designed with varying insulation ratios. J. Build. Eng. 2023, 77, 107374. [Google Scholar] [CrossRef]
  43. HM Government. The Building Regulations 2010. In Conservation of Fuel and Power: Approved Document L. Available online: https://assets.publishing.service.gov.uk/media/63d8edbde90e0773d8af2c98/Approved_Document_L__Conservation_of_fuel_and_power__Volume_2_Buildings_other_than_dwellings__2021_edition_incorporating_2023_amendments.pdf (accessed on 3 March 2023).
Figure 1. Configuration of an LGSP considered.
Buildings 14 00300 g001
Figure 2. Meshing scheme of a LGSP.
Buildings 14 00300 g002
Figure 3. (a) Test case 1 model and (b) temperature profile obtained from THERM.
Buildings 14 00300 g003
Figure 4. (a) Test case 2 wall section [36] and (b) temperature profile obtained from THERM.
Buildings 14 00300 g004
Figure 5. Configuration of the interior light steel-frame wall.
Buildings 14 00300 g005
Figure 6. Configuration of the exterior light steel-frame wall.
Buildings 14 00300 g006
Figure 7. Cross section of the LGSP wall with a total thickness of 325 mm.
Buildings 14 00300 g007
Figure 8. Comparison of U-value reduction against h/H ratio for both walls insulated with glass-fibre insulation.
Buildings 14 00300 g008
Figure 9. Comparison of temperature distributions (a) for 275 mm thick walls without insulation material and (b) fully insulated with glass fibres.
Buildings 14 00300 g009
Figure 10. Polynomial equations for different U-value ratios calculated for both walls (275 mm and 325 mm) with the same insulation material (glass fibre).
Buildings 14 00300 g010
Table 1. Comparison of analytical temperature solutions at each grid point obtained from ISO 10211 [36] and THERM 7.8.
Grid No.Temperature (°C)Grid No.Temperature (°C)Grid No.Temperature (°C)Grid No.Temperature (°C)
TISOTTHERMTISOTTHERMTISOTTHERMTISOTTHERM
19.79.7213.413.4314.714.7415.115.1
55.35.368.68.6710.310.3810.810.8
93.23.2105.65.6117.07.0127.57.5
132.02.0143.63.6154.74.7165.05.0
171.31.3182.32.3193.03.0203.23.2
210.70.7221.41.4231.81.8241.91.9
250.30.3260.60.6270.80.8280.90.9
Table 2. Thermal conductivities of materials in the wall [36].
Layer NumberMaterialThermal Conductivity (W/mK)
1Concrete1.15
2Wood0.12
3Insulation0.029
4Aluminium230
Table 3. Comparison of temperature at the nodes in the wall according to ISO 10211 [36].
NodeTemperature Suggested by ISO 10211 (°C)Temperature Obtained by THERM (°C)
A7.17.1
B0.80.8
C7.97.9
D6.36.3
E0.80.8
F16.416.4
G16.316.3
H16.816.8
I18.318.3
Table 4. Comparison of U-values predicted from THERM 7.8 and Santos et al. [37] for interior LGSPs.
ModelEvaluated ParameterUTHERMUSantos et al. [37]USantos et al. [37]/UTHERM
Reference model0.4570.4490.98
I1Thickness of steel studs (mm)
1.00.4840.4740.98
1.20.4950.4820.97
1.50.5050.4910.97
I2Clearance between steel studs (mm)
3000.5870.5800.99
4000.5250.5150.98
8000.4320.4200.97
I3Thickness of aerogel strips (mm)
2.50.4210.4150.99
5.00.3980.3920.98
10.00.3810.3740.98
I4Material of thermal break strips with 10 mm
Acoustic (recycled rubber)0.4300.4210.98
Extruded polystyrene0.4020.3960.99
Cold break strip (aerogel)0.3810.3740.98
I5Sheathing panel materials
GPB + OSB0.4220.4190.99
OSB + OSB0.4050.3970.98
GPB + XPS0.3410.3380.99
Mean0.98
COV0.007
Table 5. Comparison of U-values predicted from THERM 7.8 and Santos et al. [37] for exterior LGSPs.
ModelEvaluated ParameterUTHERMUSantos et al. [37]USantos et al. [37]/UTHERM
Reference model0.2810.2760.98
E1Thickness of steel studs (mm)
0.60.2720.2670.98
1.00.2750.2720.99
1.20.2790.2740.98
E2Clearance between steel studs (mm)
3000.3310.3230.98
4000.3050.2990.98
8000.2690.2630.98
E3Thickness of aerogel strips (mm)
2.50.2650.2630.99
5.00.2590.2560.99
10.00.2530.2480.98
E4Material of thermal break strips with 10 (mm)
Acoustic (recycled rubber)0.2690.2650.99
Extruded polystyrene0.2590.2560.99
Cold break strip (aerogel)0.2530.2480.98
E5Sheathing panel materials
GPB + OSB0.2860.2820.99
OSB + OSB0.2770.2710.98
GPB + XPS0.2610.2560.98
E6Thickness of EPS 7 ETICS 8 (mm)
0.00.4990.4940.99
300.3310.3270.99
800.2270.2230.98
Mean0.98
COV0.005
Table 6. Outline of the parametric study.
Wall ThicknessInsulation Ratio (h/H)Insulation TypeNumber of Models
275 mm
and
325 mm
0Air layer
Stone wool
E-PLA
Mineral wool
Rock wool
Glass Fibre
2
0.210
0.410
0.610
0.810
1.010
Total52
Table 7. Results of insulated walls and uninsulated wall with a thickness of 275 mm.
h/HWall
Configuration
Insulation Layer Thickness (mm)Insulation MaterialU-Value (W/m2k)Percentage of
Decrease in
U-Value (%)
0 C 275 , a i r 0 -Air0.641-
0.2 C 275 , S t o n e 0.2 39.2Stone wool0.38240.41
C 275 , E P L A 0.2 E-PLA0.36343.37
C 275 , M i n e r a l 0.2 Mineral wool0.38739.63
C 275 , R o c k 0.2 Rock wool0.39538.38
C 275 , F i b e r 0.2 Glass fibre0.40636.66
0.4 C 275 , S t o n e 0.4 78.2Stone wool0.28855.07
C 275 , E P L A 0.4 E-PLA0.27057.88
C 275 , M i n e r a l 0.4 Mineral wool0.29254.45
C 275 , R o c k 0.4 Rock wool0.30053.20
C 275 , F i b e r 0.4 Glass fibre0.31251.33
0.6 C 275 , S t o n e 0.6 117.6Stone wool0.23962.71
C 275 , E P L A 0.6 E-PLA0.22265.37
C 275 , M i n e r a l 0.6 Mineral wool0.24362.09
C 275 , R o c k 0.6 Rock wool0.25061.00
C 275 , F i b e r 0.6 Glass fibre0.26159.28
0.8 C 275 , S t o n e 0.8 156.8Stone wool0.21067.24
C 275 , E P L A 0.8 E-PLA0.19569.58
C 275 , M i n e r a l 0.8 Mineral wool0.21366.77
C 275 , R o c k 0.8 Rock wool0.22065.68
C 275 , F i b e r 0.8 Glass fibre0.23064.12
1.0 C 275 , S t o n e 1.0 196.0Stone wool0.19369.89
C 275 , E P L A 1.0 E-PLA0.17972.07
C 275 , M i n e r a l 1.0 Mineral wool0.19769.27
C 275 , R o c k 1.0 Rock wool0.20468.17
C 275 , F i b e r 1.0 Glass fibre0.21366.77
Table 8. Results of insulated walls and uninsulated wall with a thickness of 325 mm.
h/HWall
Configuration
Insulation Layer Thickness (mm)Insulation MaterialU-Value (W/m2k)Percentage of
Decrease in
U-Value
0 C 325 , a i r 0 -Air0.638-
0.2 C 325 , S t o n e 0.2 49.2Stone wool0.34845.45
C 325 , E P L A 0.2 E-PLA0.32948.43
C 325 , M i n e r a l 0.2 Mineral wool0.35244.83
C 325 , R o c k 0.2 Rock wool0.36143.42
C 325 , F i b e r 0.2 Glass fibre0.37241.69
0.4 C 325 , S t o n e 0.4 98.4Stone wool0.24661.44
C 325 , E P L A 0.4 E-PLA0.22964.11
C 325 , M i n e r a l 0.4 Mineral wool0.25060.82
C 325 , R o c k 0.4 Rock wool0.25859.56
C 325 , F i b e r 0.4 Glass fibre0.26957.84
0.6 C 325 , S t o n e 0.6 147.6Stone wool0.19469.59
C 325 , E P L A 0.6 E-PLA0.17971.94
C 325 , M i n e r a l 0.6 Mineral wool0.19769.12
C 325 , R o c k 0.6 Rock wool0.20468.03
C 325 , F i b e r 0.6 Glass fibre0.21466.46
0.8 C 325 , S t o n e 0.8 196.8Stone wool0.16474.29
C 325 , E P L A 0.8 E-PLA0.15176.33
C 325 , M i n e r a l 0.8 Mineral wool0.16773.82
C 325 , R o c k 0.8 Rock wool0.17372.88
C 325 , F i b e r 0.8 Glass fibre0.18371.32
1.0 C 325 , S t o n e 1.0 246.0Stone wool0.14776.96
C 325 , E P L A 1.0 E-PLA0.13479.00
C 325 , M i n e r a l 1.0 Mineral wool0.15076.49
C 325 , R o c k 1.0 Rock wool0.15675.55
C 325 , F i b e r 1.0 Glass fibre0.16574.14
Table 9. Comparison of LGSP results with 3D-printed concrete wall panels for similar insulation ratios (glass fibre).
h/HDecrease in U-Value (%)
LGSPs (This Study)3D-Printed Concrete Walls [42]
275 mm Wall325 mm Wall100 mm Wall200 mm Wall
0.237424353
0.451586068
0.659666376
0.864717281
1.067747583
Table 10. Coefficients a, b, c, d, and e for Equation (1).
Wall ThicknessInsulation Materialabcde
275 mmStone wool1.95315.39935.66152.91410.9994
E-PLA2.73447.12386.93583.26570.9997
Mineral wool2.60426.64356.36113.01060.9994
Rock wool2.08335.46305.48612.78580.9997
Glass fibre2.08335.48615.45832.72460.9995
325 mmStone wool2.34376.37736.56603.30070.9991
E-PLA2.73447.40167.47703.59870.9992
Mineral wool2.73447.14707.03303.37950.9996
Rock wool2.08335.76396.06253.14150.9998
Glass fibre2.21355.98966.13023.09350.9996
Table 11. Target thermal U-values for domestic walls [43].
Type of WallRecommended U-Value for Domestic Walls
New build0.18 W/m2K
Existing building extension0.18 W/m2K
Existing building refurbishment0.30 W/m2K, for internal or external insulation
0.55 W/m2K, for cavity insulation
Table 12. Optimum h/H ratios for different insulation materials.
InsulationStone WoolE-PLAMineral WoolRock WoolGlass Fibre
Thickness (mm)275325275325275325275325275325
New build10.70.90.62-0.71-0.75-0.82
Existing building extension10.70.90.62-0.71-0.75-0.82
Internal or external
insulation
0.350.270.310.240.370.270.40.30.440.31
Cavity
insulation
0.050.050.050.040.050.040.050.050.060.05
Disclaimer/Publisher’s Note: The statements, opinions and data contained in all publications are solely those of the individual author(s) and contributor(s) and not of MDPI and/or the editor(s). MDPI and/or the editor(s) disclaim responsibility for any injury to people or property resulting from any ideas, methods, instructions or products referred to in the content.

