Abstract
The temperature stress caused by the large temperature difference is the main factor causing harmful cracks in large-volume concrete. The introduction of admixtures is beneficial to reduce the temperature difference inside and outside the large-volume concrete. This study investigated the mechanism of how citric acid-modified chitosan (CAMC) affects the hydration heat release process and hydration products of composite cementitious materials. Through methods such as hydration heat, X-ray diffraction (XRD), mercury intrusion porosimetry (MIP), scanning electron microscopy (SEM), and nuclear magnetic resonance (NMR), the mechanism of how CAMC controls the hydration heat release process and hydration products of composite cementitious materials was revealed. The results show that the addition of CAMC delayed the hydration process of cementitious materials without affecting the type of hydration products but affected the content of each phase of hydration products. As the hydration process proceeded, the total porosity of all samples decreased, the volume of large pores decreased, and the volume of small pores increased. As the content of CAMC increased, the pore diameter of the hardened paste gradually became smaller, the proportion of large pores decreased, and the later hydration microstructure became more dense. The increase in CAMC dosage resulted in a decrease in the peak intensity of Q2 in the paste, indicating that Al atoms in Q2 (1Al) existed in the form of Alcoordination, which proves that CAMC reduced its hydration degree and delayed cement hydration.
1. Introduction
Concrete, as a porous composite material, is widely used worldwide due to its convenient material selection, excellent mechanical properties, and strong durability [1,2,3,4,5]. Concrete has become an indispensable building material for the construction of major military and civil infrastructure projects. However, in large volume concrete structures, due to the large volume of the structure, a significant proportion of cement content is essential. In the early construction process, cement releases a large amount of hydration heat due to hydration reactions, leading to a rapid increase in the internal temperature of concrete. Due to the large volume of poured concrete, this heat cannot be dissipated in a timely manner. On the contrary, when the concrete surface comes into contact with the external environment, it dissipates heat quickly. Therefore, the internal and external thermal expansion of mass concrete are uneven, resulting in huge temperature stress. When the temperature stress exceeds the ultimate tensile strength of concrete, the cracks caused are called temperature cracks [6]. The cracking problem caused by temperature stress in large-volume concrete structures is quite common, accounting for about 80% of engineering structural cracks, seriously affecting the durability of concrete, leading to early retirement of buildings, causing huge losses to economic construction, and greatly increasing maintenance costs. Therefore, how to reasonably and effectively reduce the hydration heat of large-volume concrete is of great engineering significance for large buildings.
Ismail et al. [7] studied the effect of vinyl acetate wastewater (generated during the coating production process) on the initial setting time and hydration heat of concrete. The results showed that adding vinyl acetate wastewater to concrete can not only delay the setting time of concrete but also reduce the total temperature rise of concrete. Khil et al. [8] studied the application of phase change materials (PCM) in mass concrete mixtures and believed that the impact of PCM on the strength of mass concrete can be ignored. The use of PCM can effectively reduce adiabatic temperature rise and temperature stress. Choi et al. [9] evaluated the feasibility of phase change materials (PCM) in suppressing the hydration heat of large-volume concrete through experimental tests (micro conductivity, simplified adiabatic temperature rise, heating, and compressive strength tests). The experimental results showed that PCM has good latent heat characteristics, which help to prevent volume changes and microcracks caused by thermal stress in large-volume concrete. Organic additives can affect the nucleation mechanism of C-S-H in mass concrete, thereby regulating the hydration heat of mass concrete in a reasonable manner [10,11]. Chitosan and its derivatives have been introduced as a new type of admixture into concrete materials due to their excellent hydrophilicity and biocompatibility. Wang et al. [12] modified chitosan by citric acid and found that the modified chitosan can regulate the exothermic process in the cement hydration process. However, the influence of modified chitosan on the hydration process and formation mechanism of hydration products of cementitious materials in large-volume concrete still deserves further research.
Therefore, this study focuses on the cement fly ash slag cementitious material system as the main composite cementitious material and systematically studies the influence of modified chitosan on the hydration process and formation mechanism of hydration products of the composite cementitious material.
2. Materials and Methods
2.1. Materials
The cementitious material is P•II 52.5 Portland cement (PC), and the auxiliary cementitious materials are special-grade fly ash (FA) and S95-grade blast furnace granulated slag (GGBS). The specific chemical composition, mineral composition, and particle size distribution are shown in Table 1 and Figure 1, respectively. The main physical parameters of Portland cement are shown in Table 2. The low-temperature rising polymer used in the experiment is citric acid-modified chitosan (CAMC), and the modification method refers to the literature [12,13,14].

Table 1.
Chemical and mineral compositions of cementitious materials (wt%) [12].
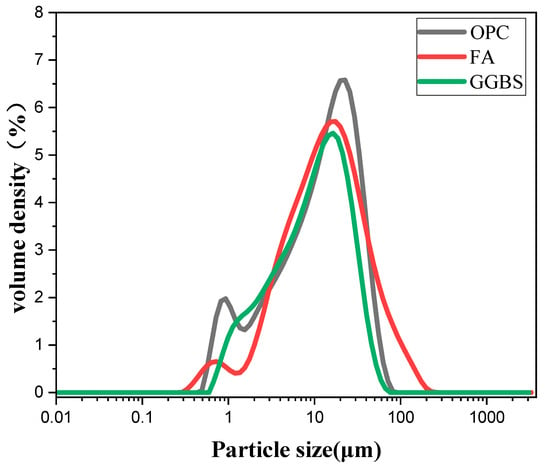
Figure 1.
Particle size distribution of cementing material.
Table 2.
Physical properties of Portland cement.
2.2. Specimen Preparation
The experimental coordination is shown in Table 3. The clean slurry mixer is used for mixing. Firstly, cement, fly ash, mineral powder, and CAMC are added to the mixer for dry mixing for 2 min. Then, wet mix for 3 min to achieve good workability of the material. After the sample is formed, it is molded and demolded after 1 d of standard curing. After demolding the specimen, transfer it to a standard curing room (temperature (20 ± 1 °C), relative humidity ≥ 95%) for curing.
Table 3.
Hydration heat mix ratio of composite cementitious materials with different contents of low-temperature liter polymer (kg/m3).
2.3. Tests for Property Evaluation
2.3.1. Heat of Hydration
The experiment used an isothermal calorimeter produced by New Castle DE in the United States to measure the heat release rate and heat release of the composite cementitious material after 120 h of hydration. In this article, deionized water is used as a comparison sample, with a test temperature of 20 °C and a temperature-controlled room as the test environment to ensure the stability of the reference line during instrument calibration. Moreover, after the cementitious material is evenly mixed with water, it is immediately placed in the channel of an isothermal calorimeter, and the hydration heat release rate and total heat release of the composite cementitious material can be continuously measured.
2.3.2. Phase Analysis
Crush the sample cured to a fixed age and soak it in alcohol for 3 days to terminate hydration. Dry the sample at 60 °C, grind it into powder, and pass it through a 200-mesh sieve. The D8-ADVANCED Diffractometer of Germany Bruker company (Saarbrucken, Germany) was used for testing. The tube voltage was 40 kv, the tube current was 40 mA, the Cu was the target, the scanning range was 5°~80°, the scanning speed was 2°/min, and the step size was 0.02°.
The internal standard method is used for diffraction for quantitative testing. Corundum was selected as a standard sample, and Topas 3-C software was used for analysis [12]. Before conducting the test, mix 0.5 g of corundum and 2 g of sample powder in a centrifuge tube for 5 min and then place them on a rotary table for 2 h to ensure uniform mixing.
2.3.3. MIP
The IV9510 mercury porosimeter (Mike Instruments, GA, USA) is used to test the internal pore structure of hardened specimens. The high pressure of the equipment can reach 60,000 psi, and the theoretically measurable minimum aperture is 3.2 nm. To save mercury solution and improve the accuracy of the results, crushed samples that have terminated hydration and been fully dried should be filled with the expansion bottle as much as possible.
2.3.4. SEM
The scanning electron microscope is an FEI 3D field emission environment scanning electron microscope produced by FEI Company (Hillsborough, OR, USA), which is used to observe the microscopic morphology of the sample. Scanning the sample using a focused electron beam (energy level order of keV) with a resolution of 3 nm~6 nm. When observing the microstructure of the hydration sample, cut off the middle part of the hydration sample and crush it. After the hydration is terminated with alcohol, dry it at 65 °C and select a flat drying sample to spray gold for observation.
2.3.5. NMR
The Bruker AVANCE III 400 WB superconducting nuclear magnetic resonance spectrometer was used to test the 29Si and 27Al nuclear magnetic resonance spectra of powder samples. In the experiment, a 4 mm zirconia rotor was used for testing, and the resonant frequencies of 29Si and 27Al were 79.51 and 104.29 MHz, respectively. For the 29Si device, the magic angle rotation rate is 8 kHz, and the pulse width is 4.0 μs, with a cycle delay time of 10 s. Tetramethylsilane (TMS) was used as a reference standard. For 27Al, the magic angle rotation rate is 10 kHz, and the pulse width is 1.5 μs, with a cycle delay time of 2 s, using 1.0 mol/L Al(NO3)3 as the reference sample.
3. Result and Discussion
3.1. Heat of Hydration
The heat release rate curve and cumulative water accumulation heat release curve of CAMC with different dosages on composite cementitious materials with curing age are shown in Figure 2. It can be seen that the addition of CAMC has a significant impact on the hydration heat release rate of the composite cementitious system. With the increase of CAMC dosage, both the first and second hydration heat release peaks of the slurry exhibit a delayed phenomenon, and the peak intensity significantly decreases. Compared to the CA1 sample, the maximum heat release rate at the first exothermic peak of the CA3 sample decreased by about 40%. Moreover, the maximum exothermic peak of the CA3 sample was delayed by about 13 h compared to the CA1 sample, which significantly prolonged the induction period. It indicates that the introduction of CAMC can delay the hydration process of cement particles and significantly reduce the heat release rate of slurry hydration, which is of great significance for the hydration reaction of cementitious materials in large-volume concrete. Figure 2b shows that in the early stage of slurry hydration, CAMC can reduce the accumulated heat release of the slurry, which is related to its delay in cement hydration. However, the impact of CAMC on the total heat release of the slurry is relatively small, which may depend on the amount of CAMC added. In summary, the introduction of CAMC into cement slurry reduces the hydration rate of cement without affecting the total heat release of the slurry, preventing a large accumulation of hydration heat, which is beneficial for reducing the temperature stress and cracking risk of concrete.
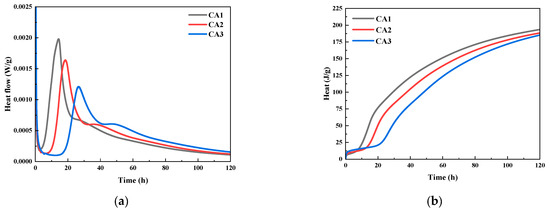
Figure 2.
Effect of CAMC on hydration heat of composite cementitious materials: (a) heat flow; (b) cumulative heat release.
3.2. Phase Analysis
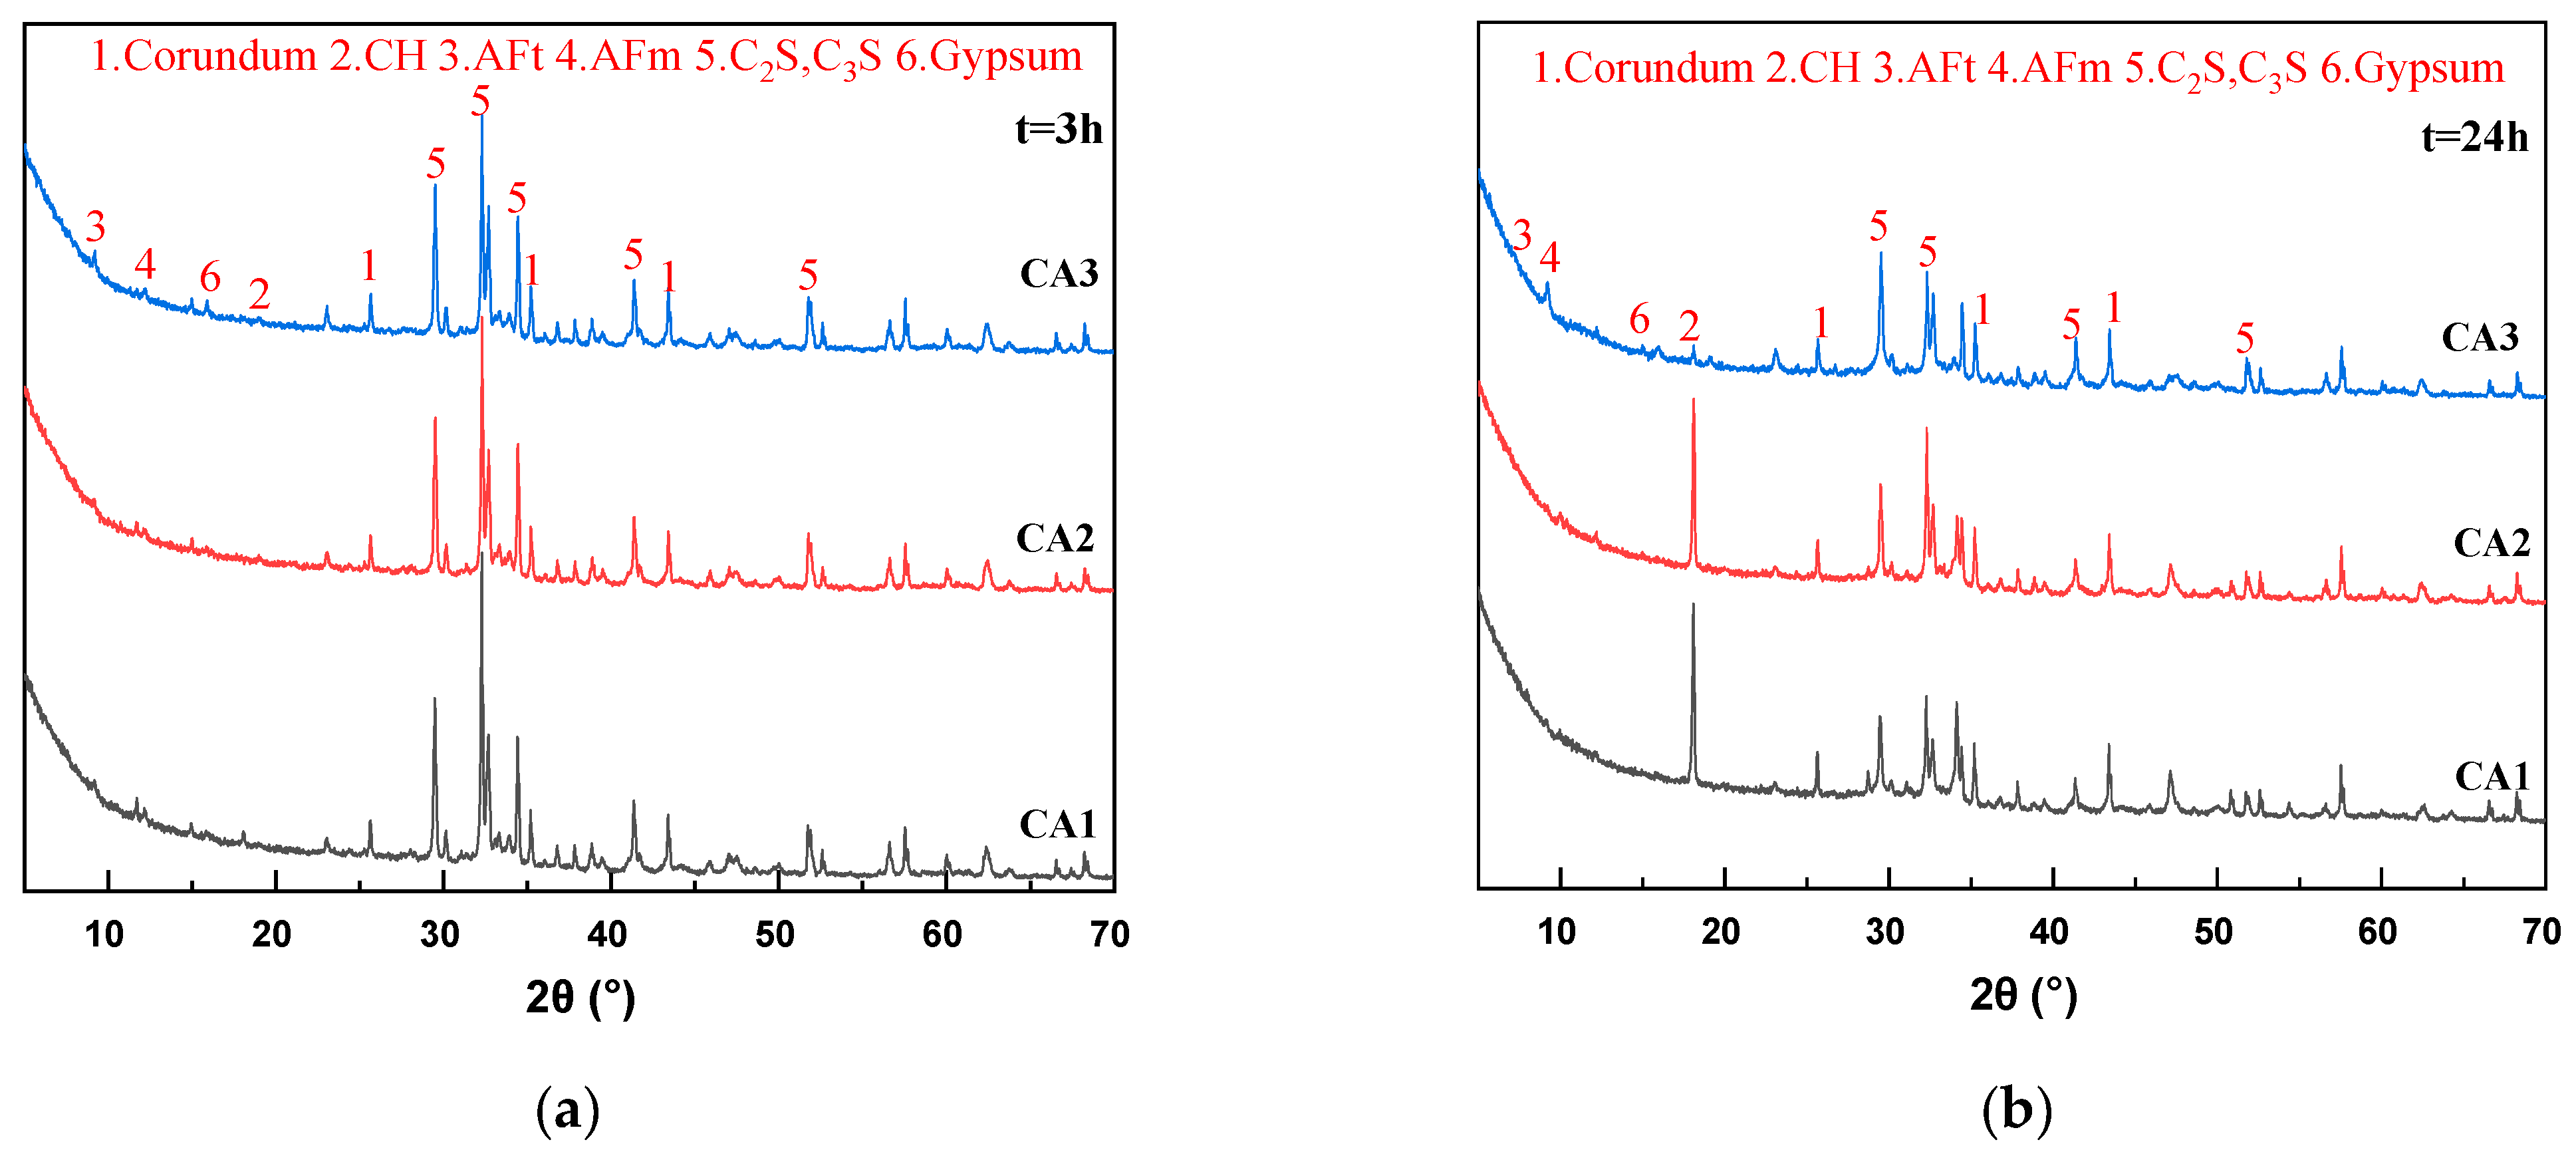
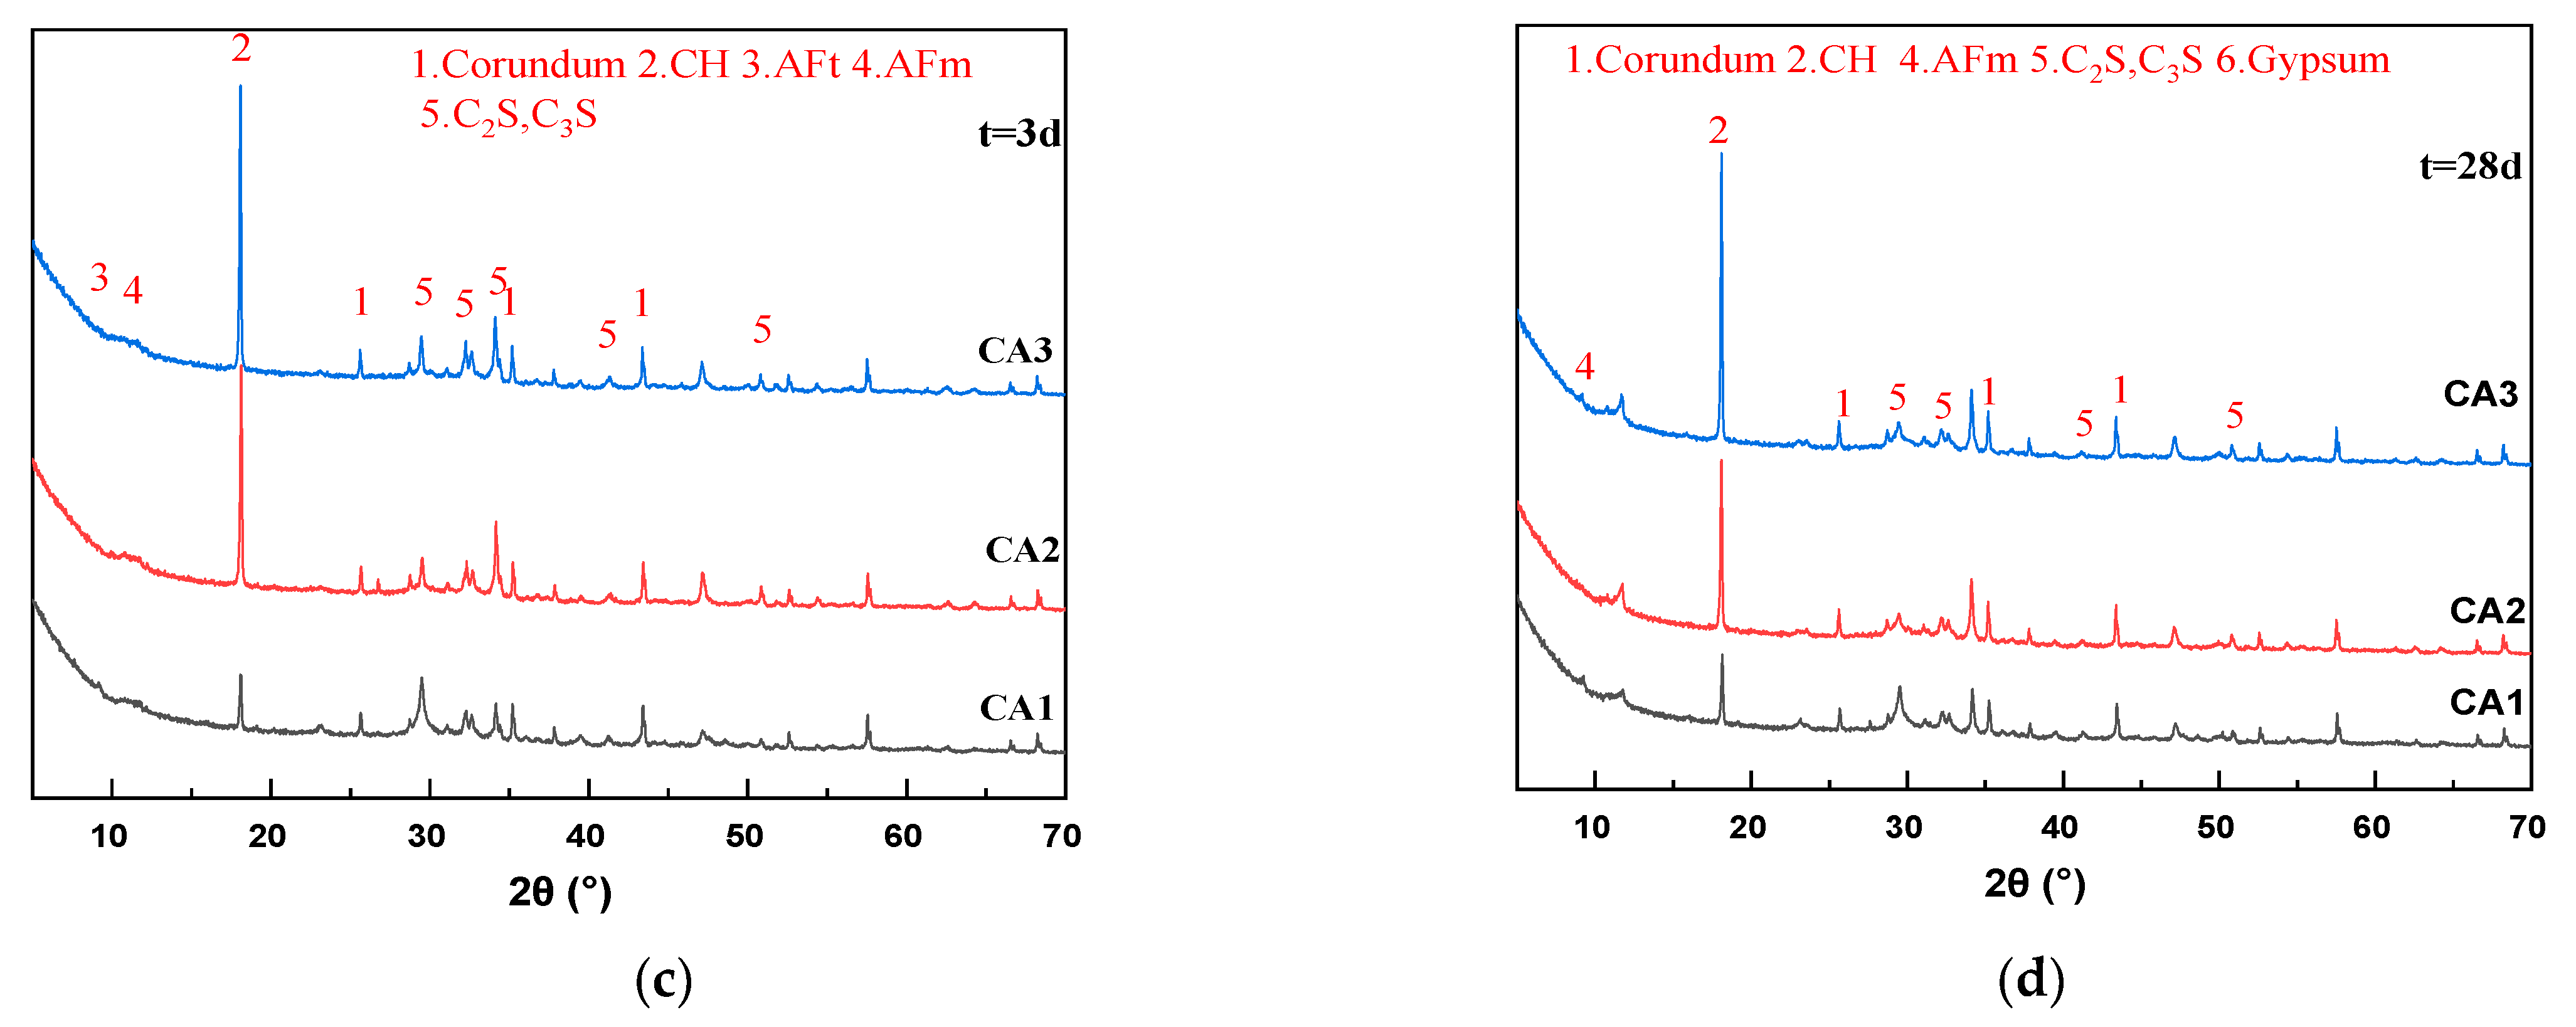
The XRD spectra of samples were measured at different ages to dynamically track the hydration products of composite cementitious materials. The test results are shown in Figure 3.
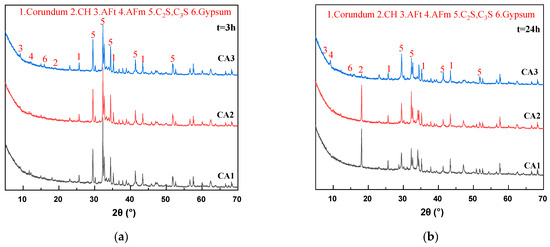
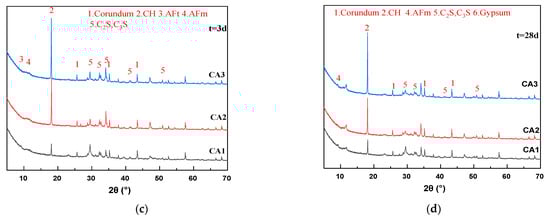
Figure 3.
XRD patterns of sample at different ages. (a) 3 h; (b) 24 h; (c) 3 d; (d) 28 d.
Figure 3a–c shows that with the increase of hydration age from 3 h to 3 d, the peak values of C2S and C3S of all samples gradually decrease, and the peak values of calcium hydroxide (CH) gradually increase, which is the inevitable result of hydration of cementitious materials. It can be seen from Figure 3a that the peak intensity of the CH characteristic peak (18.1°) of all samples at 3 h is very weak and almost unobservable on the graph. After 24 h of hydration, a significant CH peak appeared in the CA2 sample, and the peak intensity was close to that of the CA1 sample. The CH characteristic peak intensity of the CA3 sample was still extremely low. Therefore, the introduction of CAMC significantly delayed the formation time of CH. It can be seen from Figure 3c that the CH characteristic peaks of all samples are very obvious. As the CAMC dosage increases from 0.1% to 0.3%, the CH peak intensity gradually increases. However, the strength of C2S and C3S peaks decreased, because the hydration rate of the CA1 sample was the least inhibited, and the generated CH participated in the reaction to generate hydration products such as C-S-H gel. As the curing age increases, the CH characteristic peaks of all samples show a gradual upward trend. This is consistent with the phenomenon in the hydration heat release rate curve of the slurry in Figure 3a (after about 40 h of hydration, the higher the CAMC content, the faster the hydration heat release rate of the slurry), indicating that CAMC mainly plays a role in delaying cement hydration in the early stage, and then C2S and C3S delayed by CAMC begin to hydrate. Therefore, there is a phenomenon that the CH content of hydration products increases with the increase of CAMC dosage during the 3–28 d age period, while the characteristic peaks of other products are less affected by CAMC dosage. In the XRD spectrum at 28 d, the characteristic peak positions of each group of slurries are almost the same, and the intensities of CH, C2S, C3S, AFm, and other peaks are also equivalent. This further proves that CAMC only delays cement hydration in the early stage of hydration, to some extent delaying the dissolution of C3S, and has little impact on the total amount of hydration products. CAMC has a porous structure that makes it easier to adsorb on the surface of cement particles, thereby delaying the cement hydration process.
3.3. Degree of Hydration Reaction
Based on the XRD data, the effect of CAMC on the reaction degree of cement clinker (C3S, C2S, C3A, C4AF) was studied. Usually, the reaction degree of cement clinker can be calculated based on the following equation.
where represents the content of C3S, C2S, C3A, and C4AF at different ages, while represents the mass fraction of C3S, C2S, C3A, and C4AF in the un-hydrated clinker.
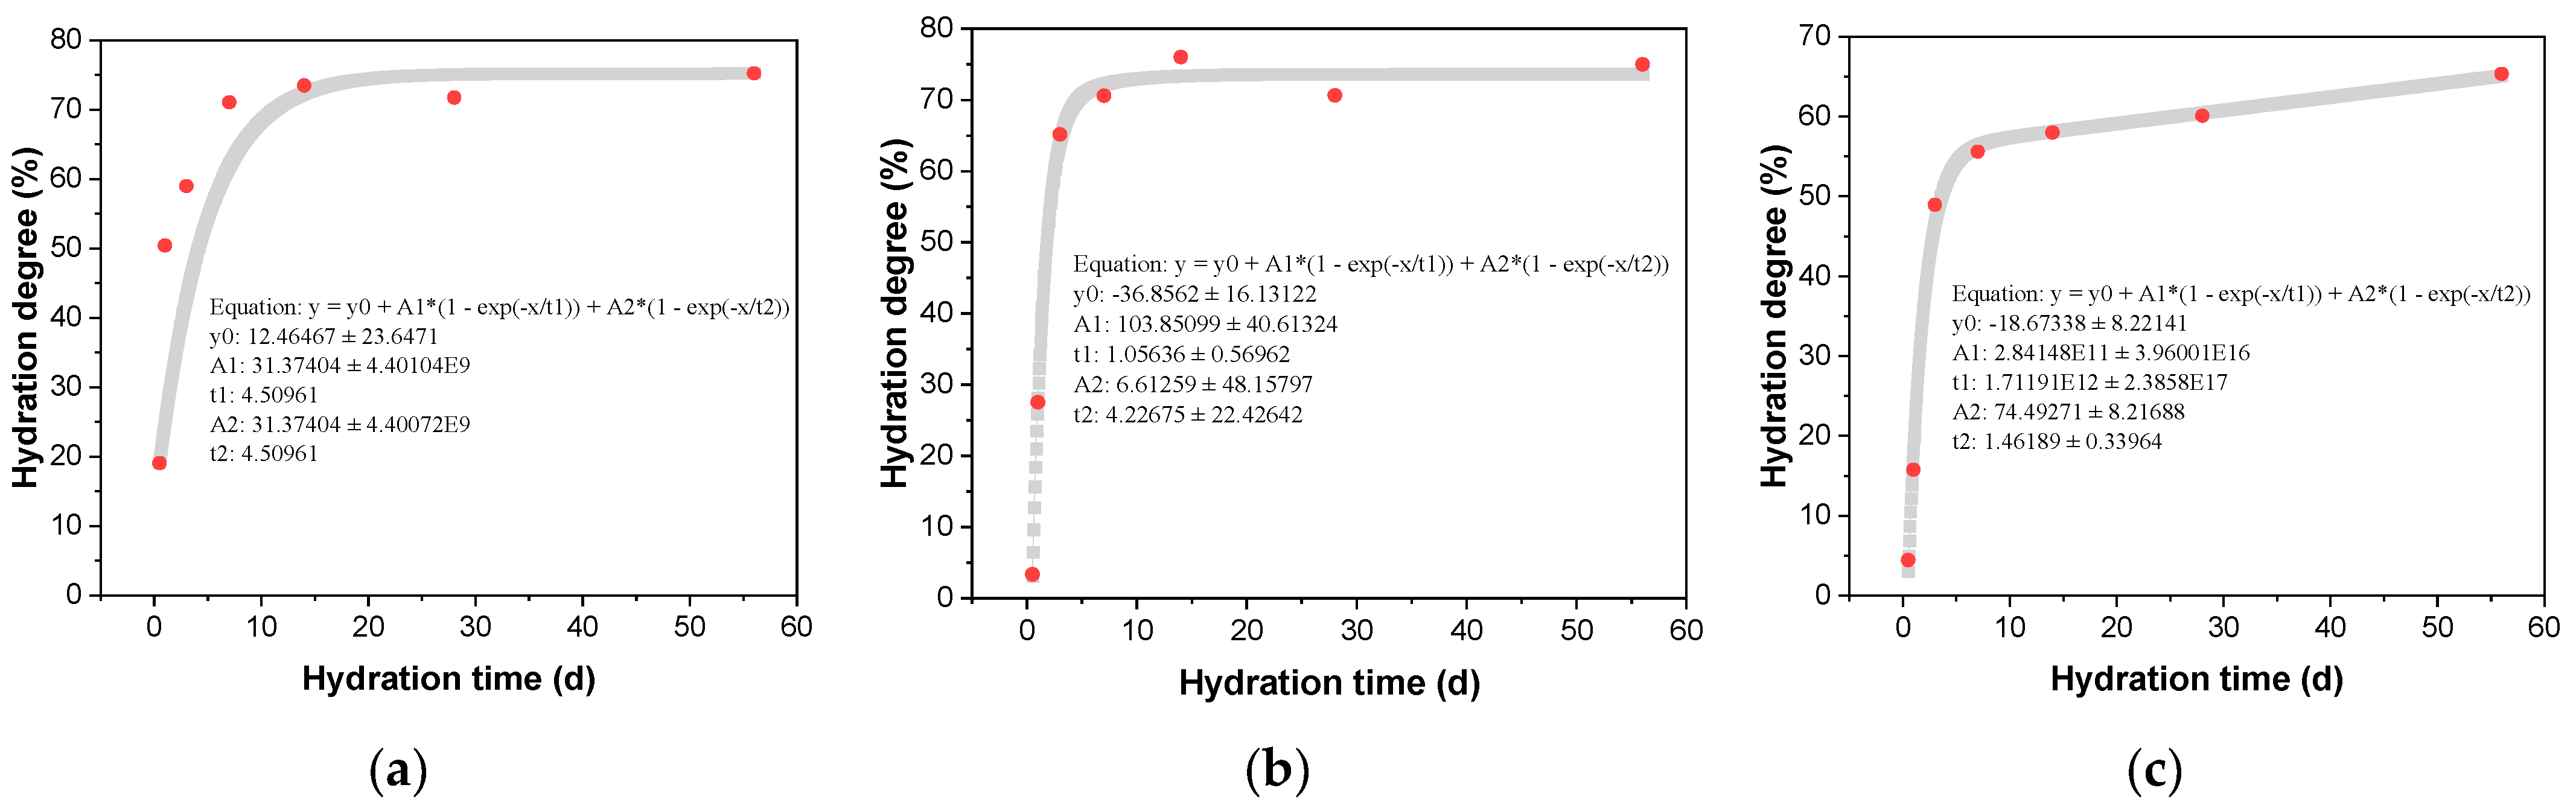
The influence of different amounts of CAMC on the degree of clinker hydration reaction is shown in Table 4. With the increase of CAMC content, the overall hydration rate of cement slows down and the degree of hydration reaction decreases. When the CAMC content is 0.1%, the degree of hydration reaction of cement at 0.5 d, 1 d, 3 d, 28 d, and 56 d is 19.05%, 50.41%, 59.01%, 71.06%, 73.49%, and 75.74%, respectively. When the addition of CAMC is 0.2%, the degree of cement hydration decreases to 3.32% and 27.51% at 0.5 d and 1 d, respectively. With the continuous progress of hydration reaction, the hydration degree of cement mixed with 0.1% CAMC remains the same at 3 d. However, the addition of 0.3% CAMC significantly reduced the hydration degree of cement. Compared to the CA1 sample, the hydration degree of the CA3 sample decreased by 68.7%, 21.7%, and 16.2% at 1 d, 7 d, and 56 d, respectively. By fitting the reaction degree of different clinker, the long-term reaction rate of cement hydration can be predicted based on the obtained curve. The fitting curves of different amounts of CAMC on the reaction degree of cement clinker are shown in Figure 4. By comparing the growth trend of the fitted curve, it can be seen that although adding 0.3% CAMC inhibits cement hydration in the early stage, the degree of reaction in the system will gradually increase with the increase of age.
Table 4.
Pore structure of specimens with different CAMC contents.
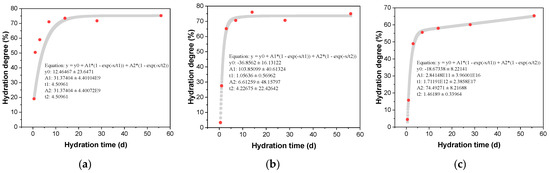
Figure 4.
Effect of CAMC on hydration degree of cement clinker. (a) CA1; (b) CA2; (c) CA3.
3.4. Changes in Content of Clinker Phase and Hydration Products
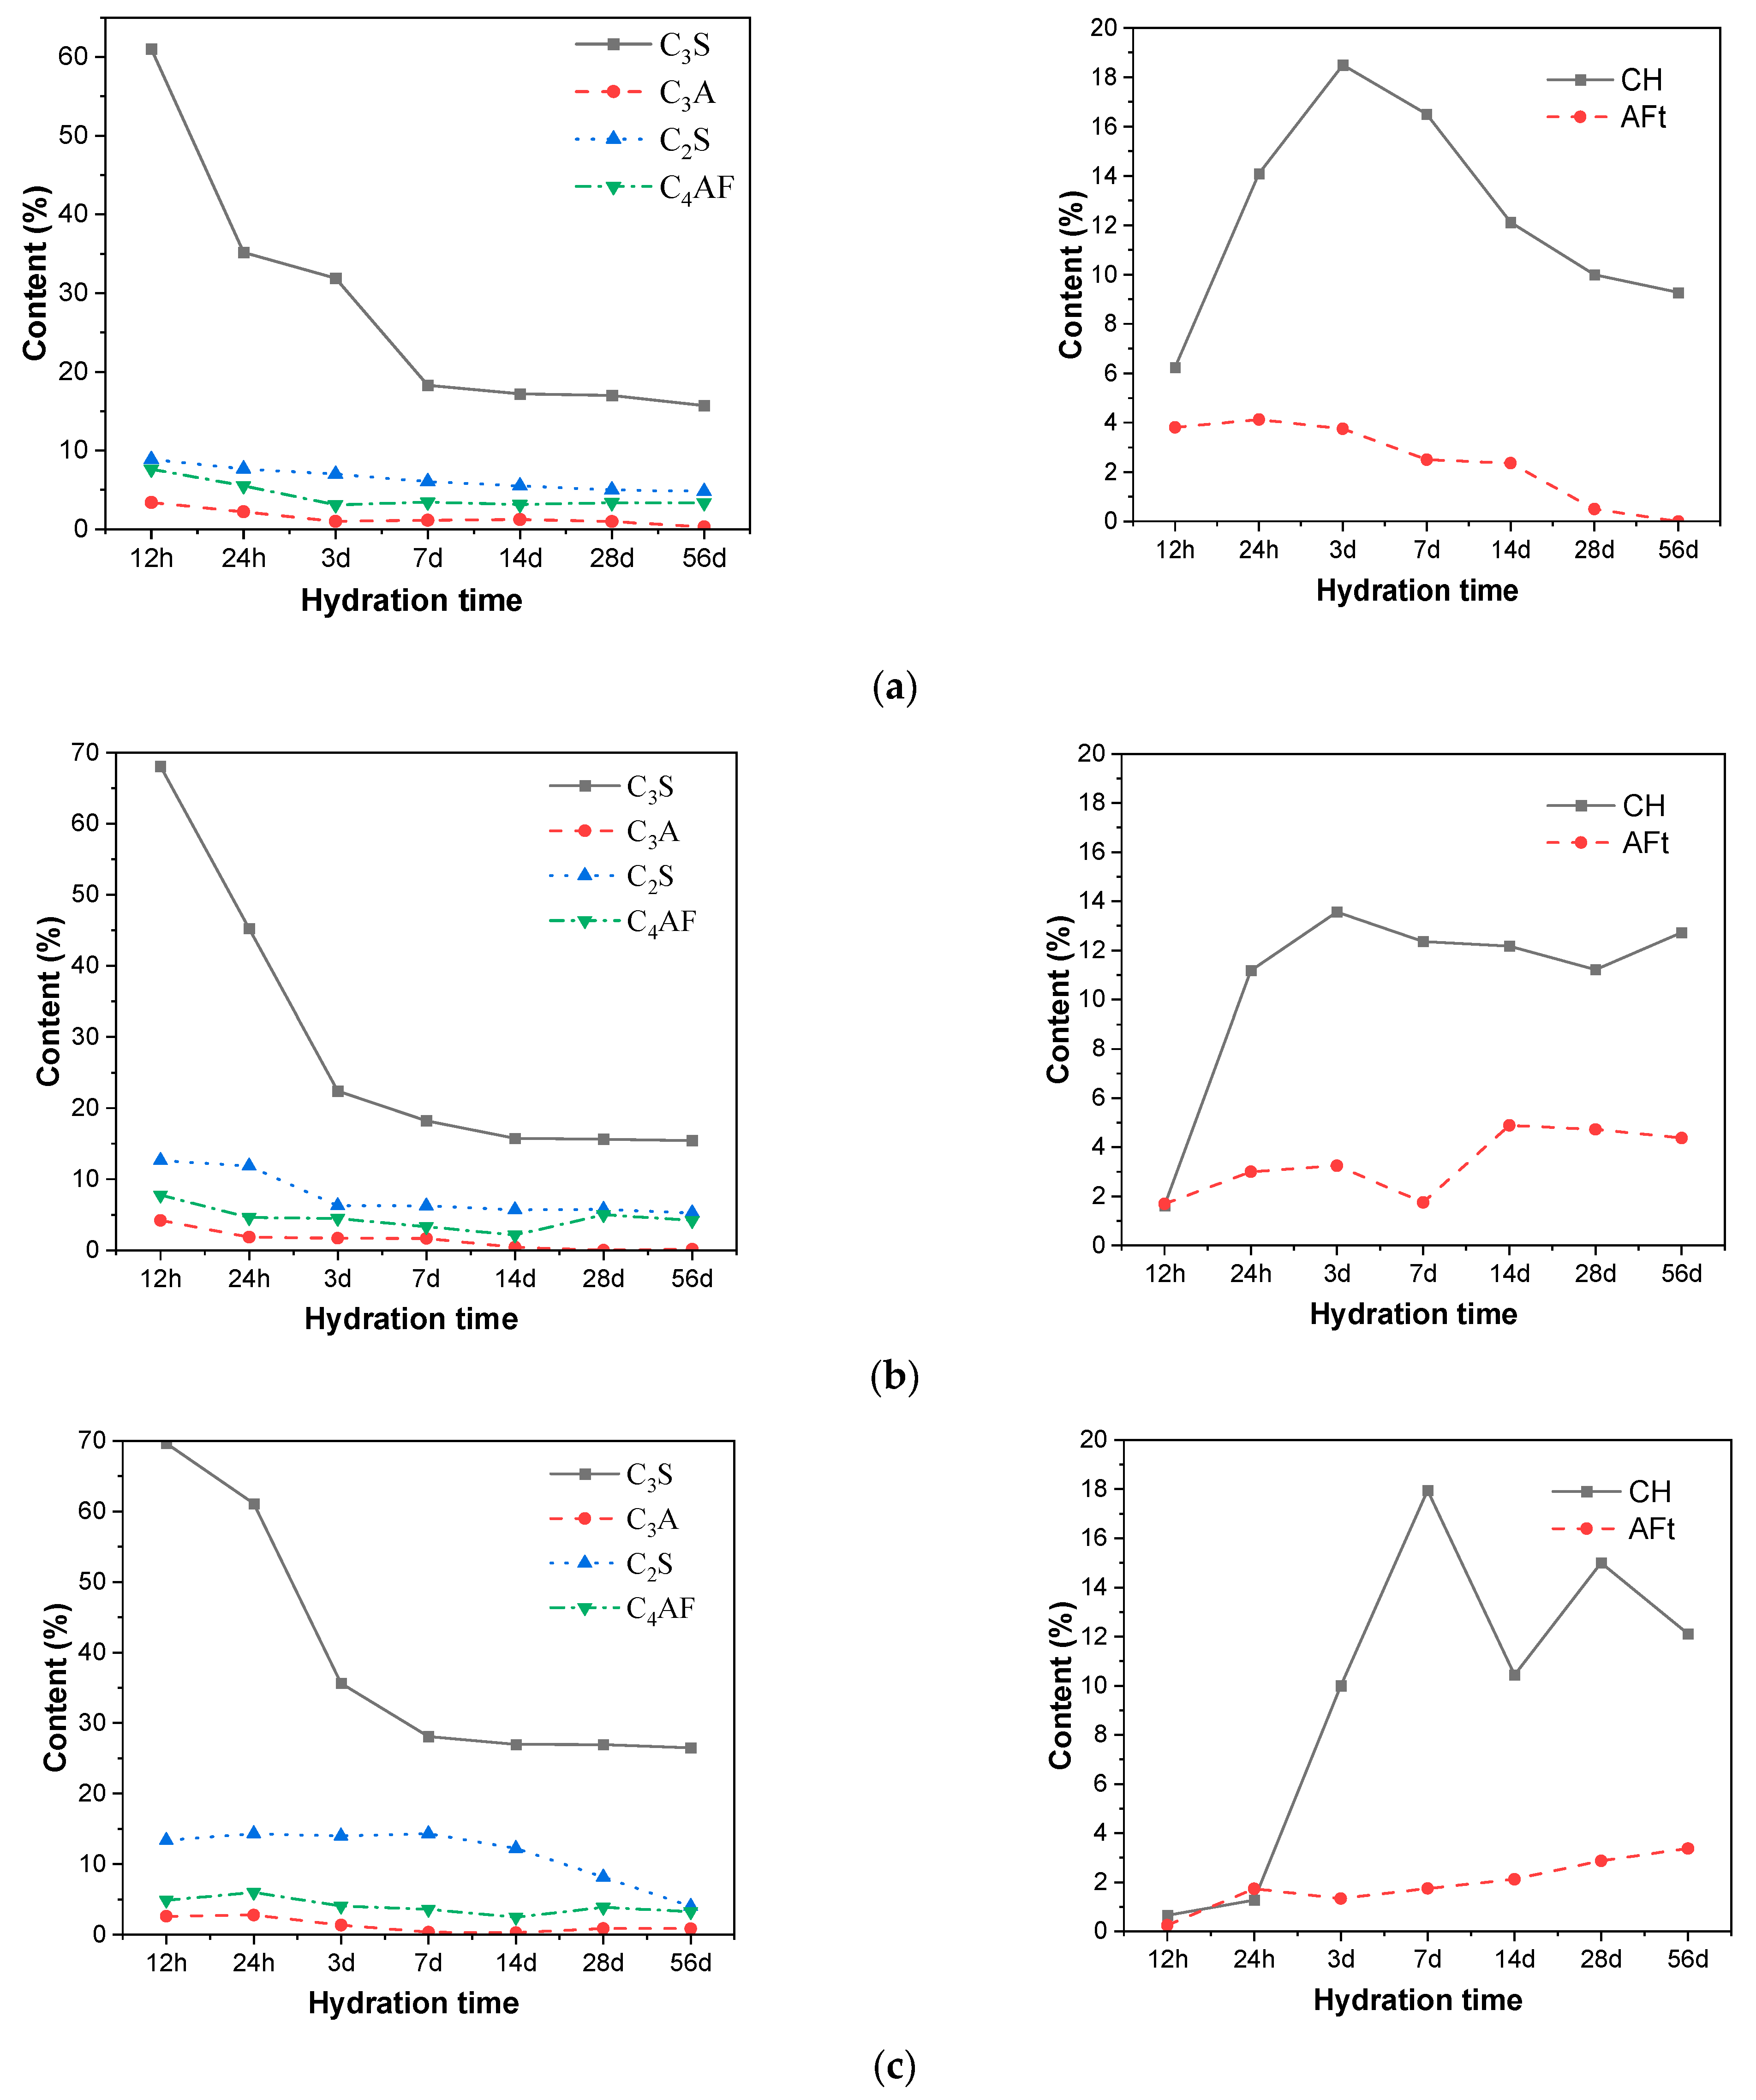
The changes in the content of various clinker phases (C3S, C2S, C3A, C4AF), CH, and AFt in cement were characterized by the XRD internal standard method, and the influence of different amounts of CAMC on the phase evolution of cement was obtained, as shown in Figure 5. As the content of CAMC increases, the degree of reaction between C3S and C2S decreases, but the reaction of C2S is not affected by the content of CAMC. The degree of C3S reaction is also less affected by changes in CAMC content (the reaction degree of CA1 and CA2 samples at the same age is almost the same). Therefore, the retarding effect of CAMC is mainly on the silicon phase, while the hydration process of the aluminum phase is not affected by CAMC. This fact provides support for revealing the retarding effect of CAMC on cement. Furthermore, the mechanism of action of CAMC and CaSO4 in cement retarding is different.
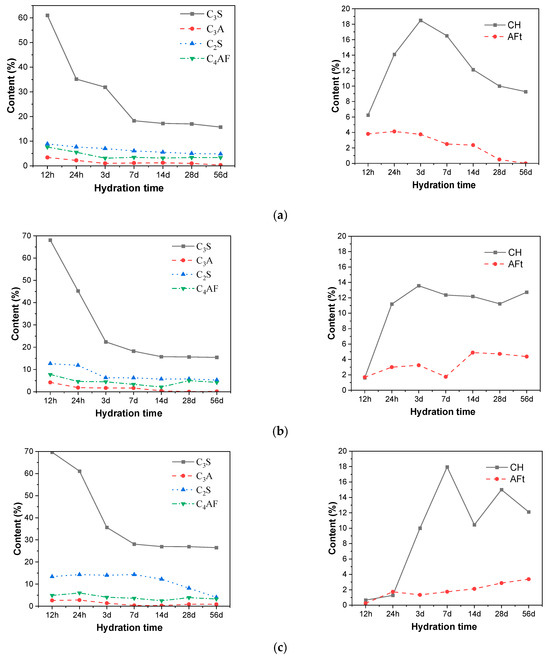
Figure 5.
Changes in clinker phase and hydration content of different contents of CAMC slurries. (a) CA1; (b) CA2; (c) CA3.
According to the content of CH and AFt, it can be seen that when 0.1%, CAMC is added to cement-based materials, and the CH content shows a trend of first increasing and then decreasing. This is because the content of hydration products increases with the early hydration process. However, with hydration, volcanic ash reaction occurs between fly ash and slag and CH, and CH content is consumed. As the amount of CAMC increases, the early content of CH decreases, which is caused by the retarding effect of CAMC. However, in the later stage, the CH content does not further decrease but fluctuates with hydration, while the content of fly ash and slag remain unchanged. Therefore, it has been proven that the CH content in the hydration system increases in the later stage. According to the comprehensive hydration degree of clinker, the addition of CAMC has a certain promoting effect on the hydration degree of cement in the later stage.
3.5. MIP
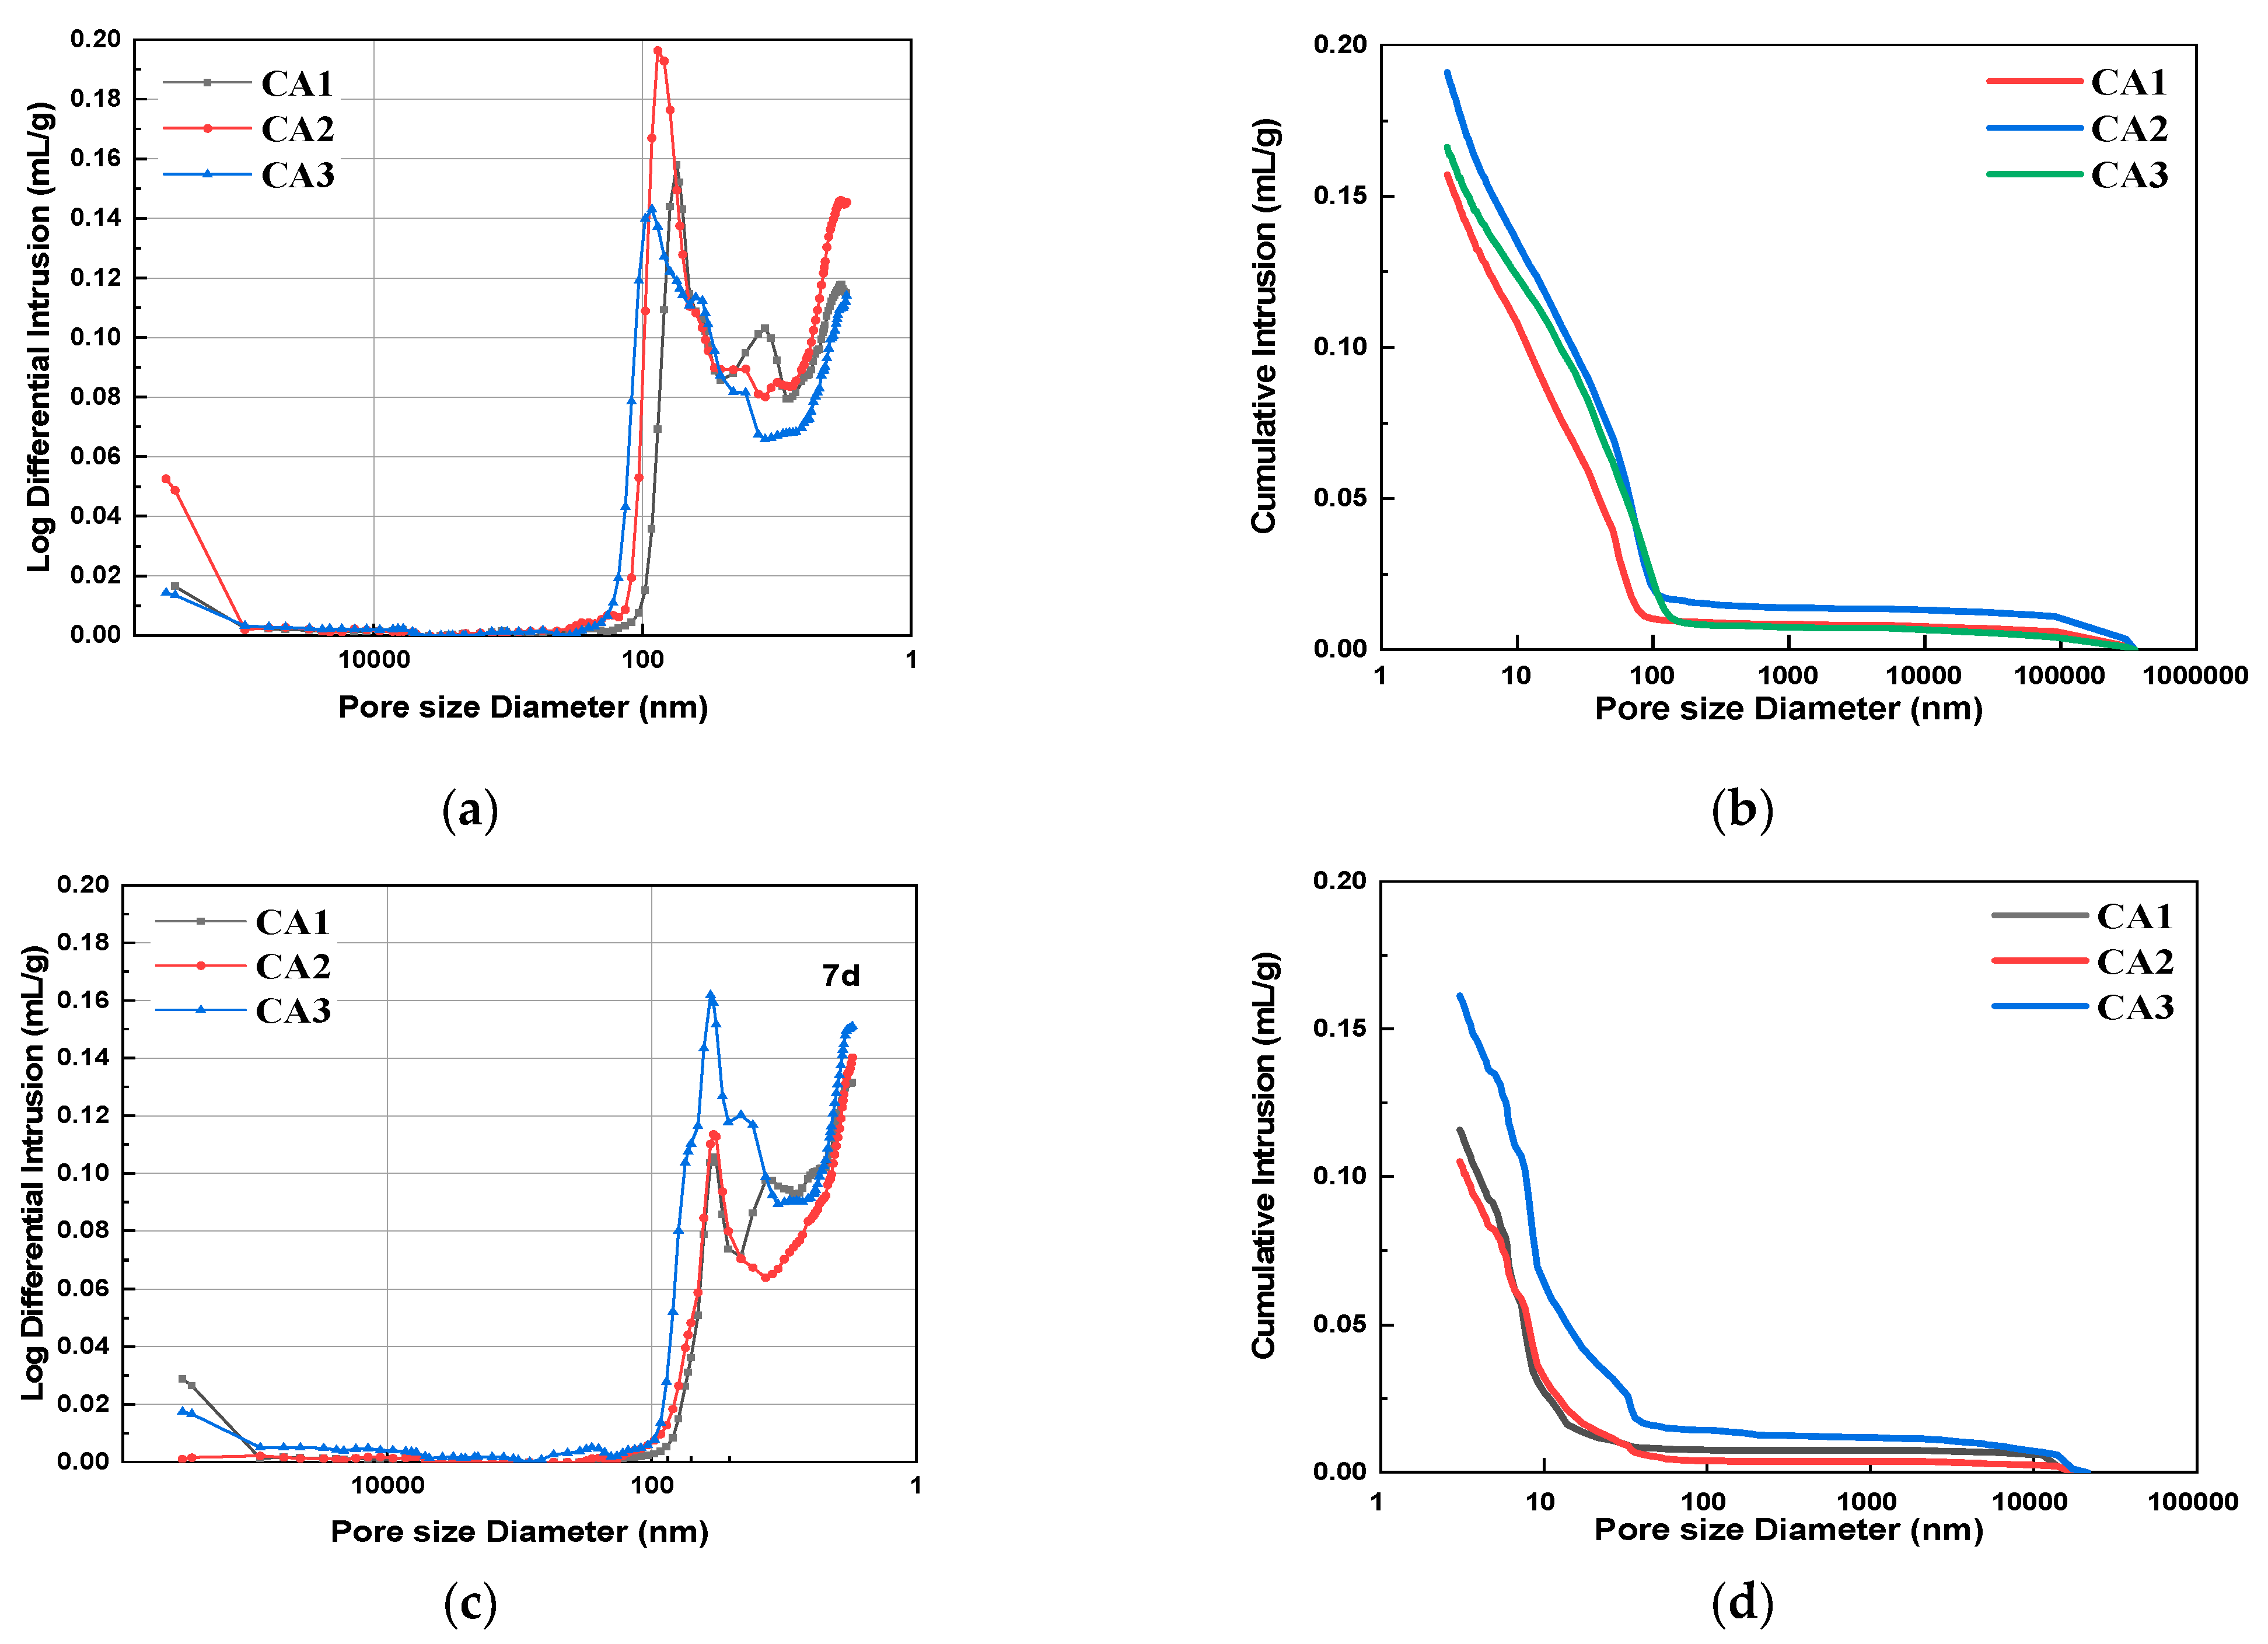
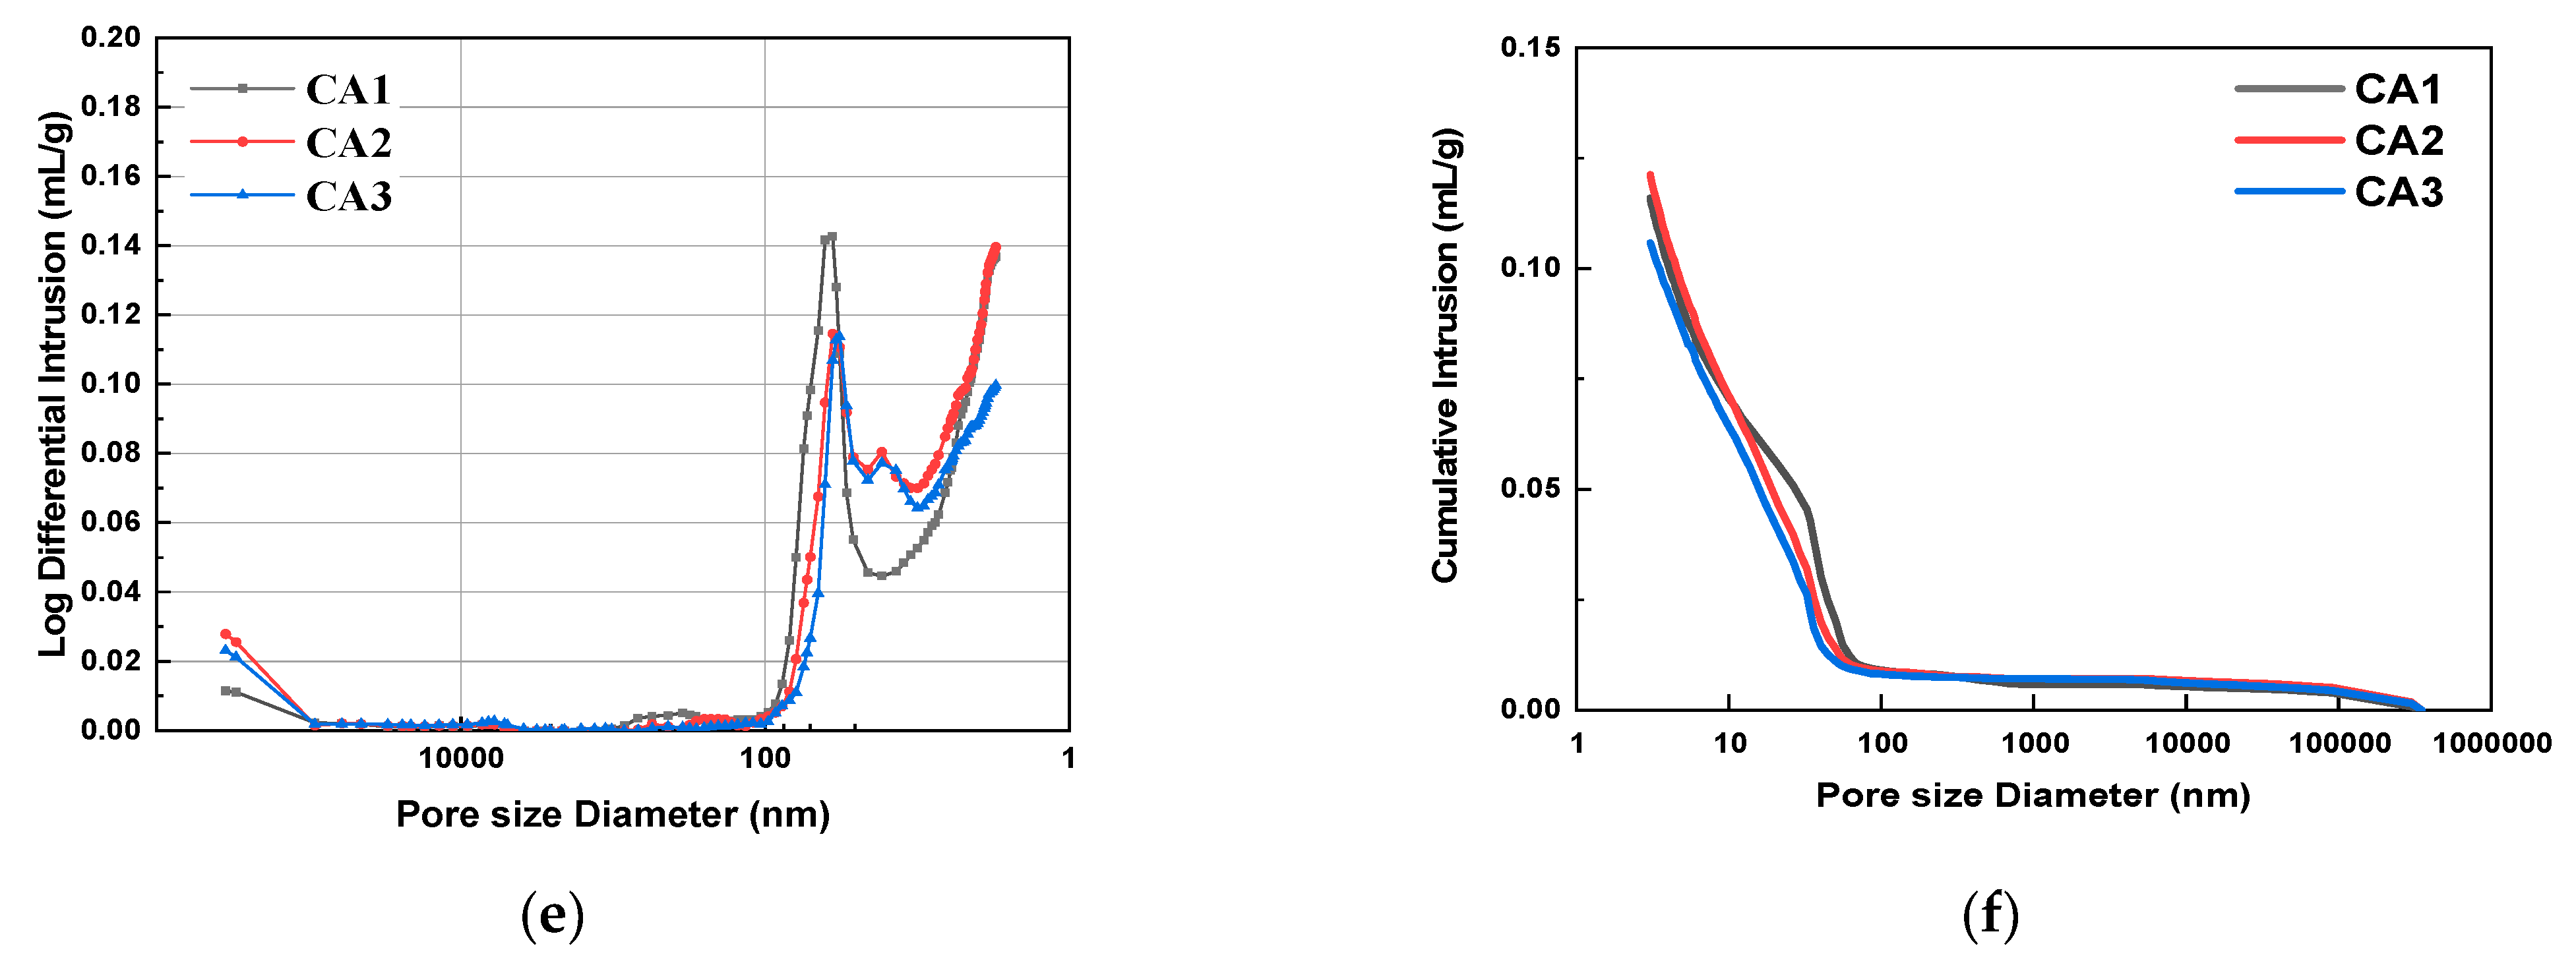
Figure 6 shows the pore size distribution and integration curves of samples with different CAMC dosages after 3 d, 7 d, and 28 d of curing. It can be seen from Figure 6a,c,e that as the degree of hydration increases, the overall pore distribution curve shifts to the right, indicating a decrease in the volume of large pores and an increase in the volume of small pores. The pore structure characteristics of samples with different CAMC dosages at 3, 7, and 28 days of curing are summarized in Table 4. As the hydration age increases from 3 days to 28 days, the porosity of the CA1 sample decreases from 25.06% to 19.25%, the CA2 sample decreases from 29.42% to 20.97%, and the CA3 sample decreases from 26.31% to 18.33%, all of which demonstrate the gradual improvement of the pore structure of the hardened slurry. Early cement paste has delayed hydration, more pores, and a loose structure, which to some extent affect the pore size distribution of the cement slurry. However, as the hydration time increases, the pore structure gradually becomes denser, the total pore volume and the volume of many harmful pores gradually decrease, while the volume of harmless pores gradually increases. The structural defects caused by CAMC in the early stage will be compensated for in the later stage of hydration. Moreover, when the harmful and multi-harmful pores of the CA2 sample reach a maximum value of 3 d, and when the harmful and multi-harmful pores of the CA3 sample reach a maximum value of 7 d, but when the harmful and multi-harmful pores of the CA1 sample reach a maximum value of 28 d, this corresponds to the fact that CAMC can delay cement hydration and the delaying effect increases with the increase of CAMC content.
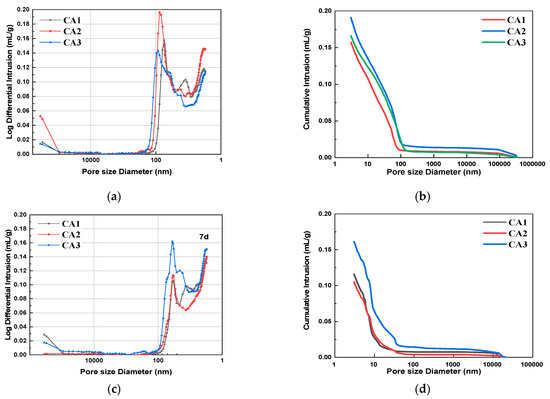
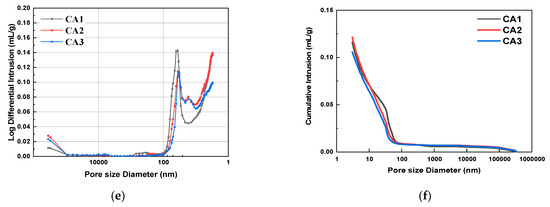
Figure 6.
Differential pore size distribution and cumulative porosity of specimens with different CAMC contents at 3 d, 7 d, and 28 d. (a) Differential pore size distribution at 3 d; (b) cumulative porosity at 3 d; (c) differential pore size distribution at 7 d; (d) cumulative porosity at 7 d; (e) differential pore size distribution at 28 d; (f) cumulative porosity at 28 d.
3.6. SEM
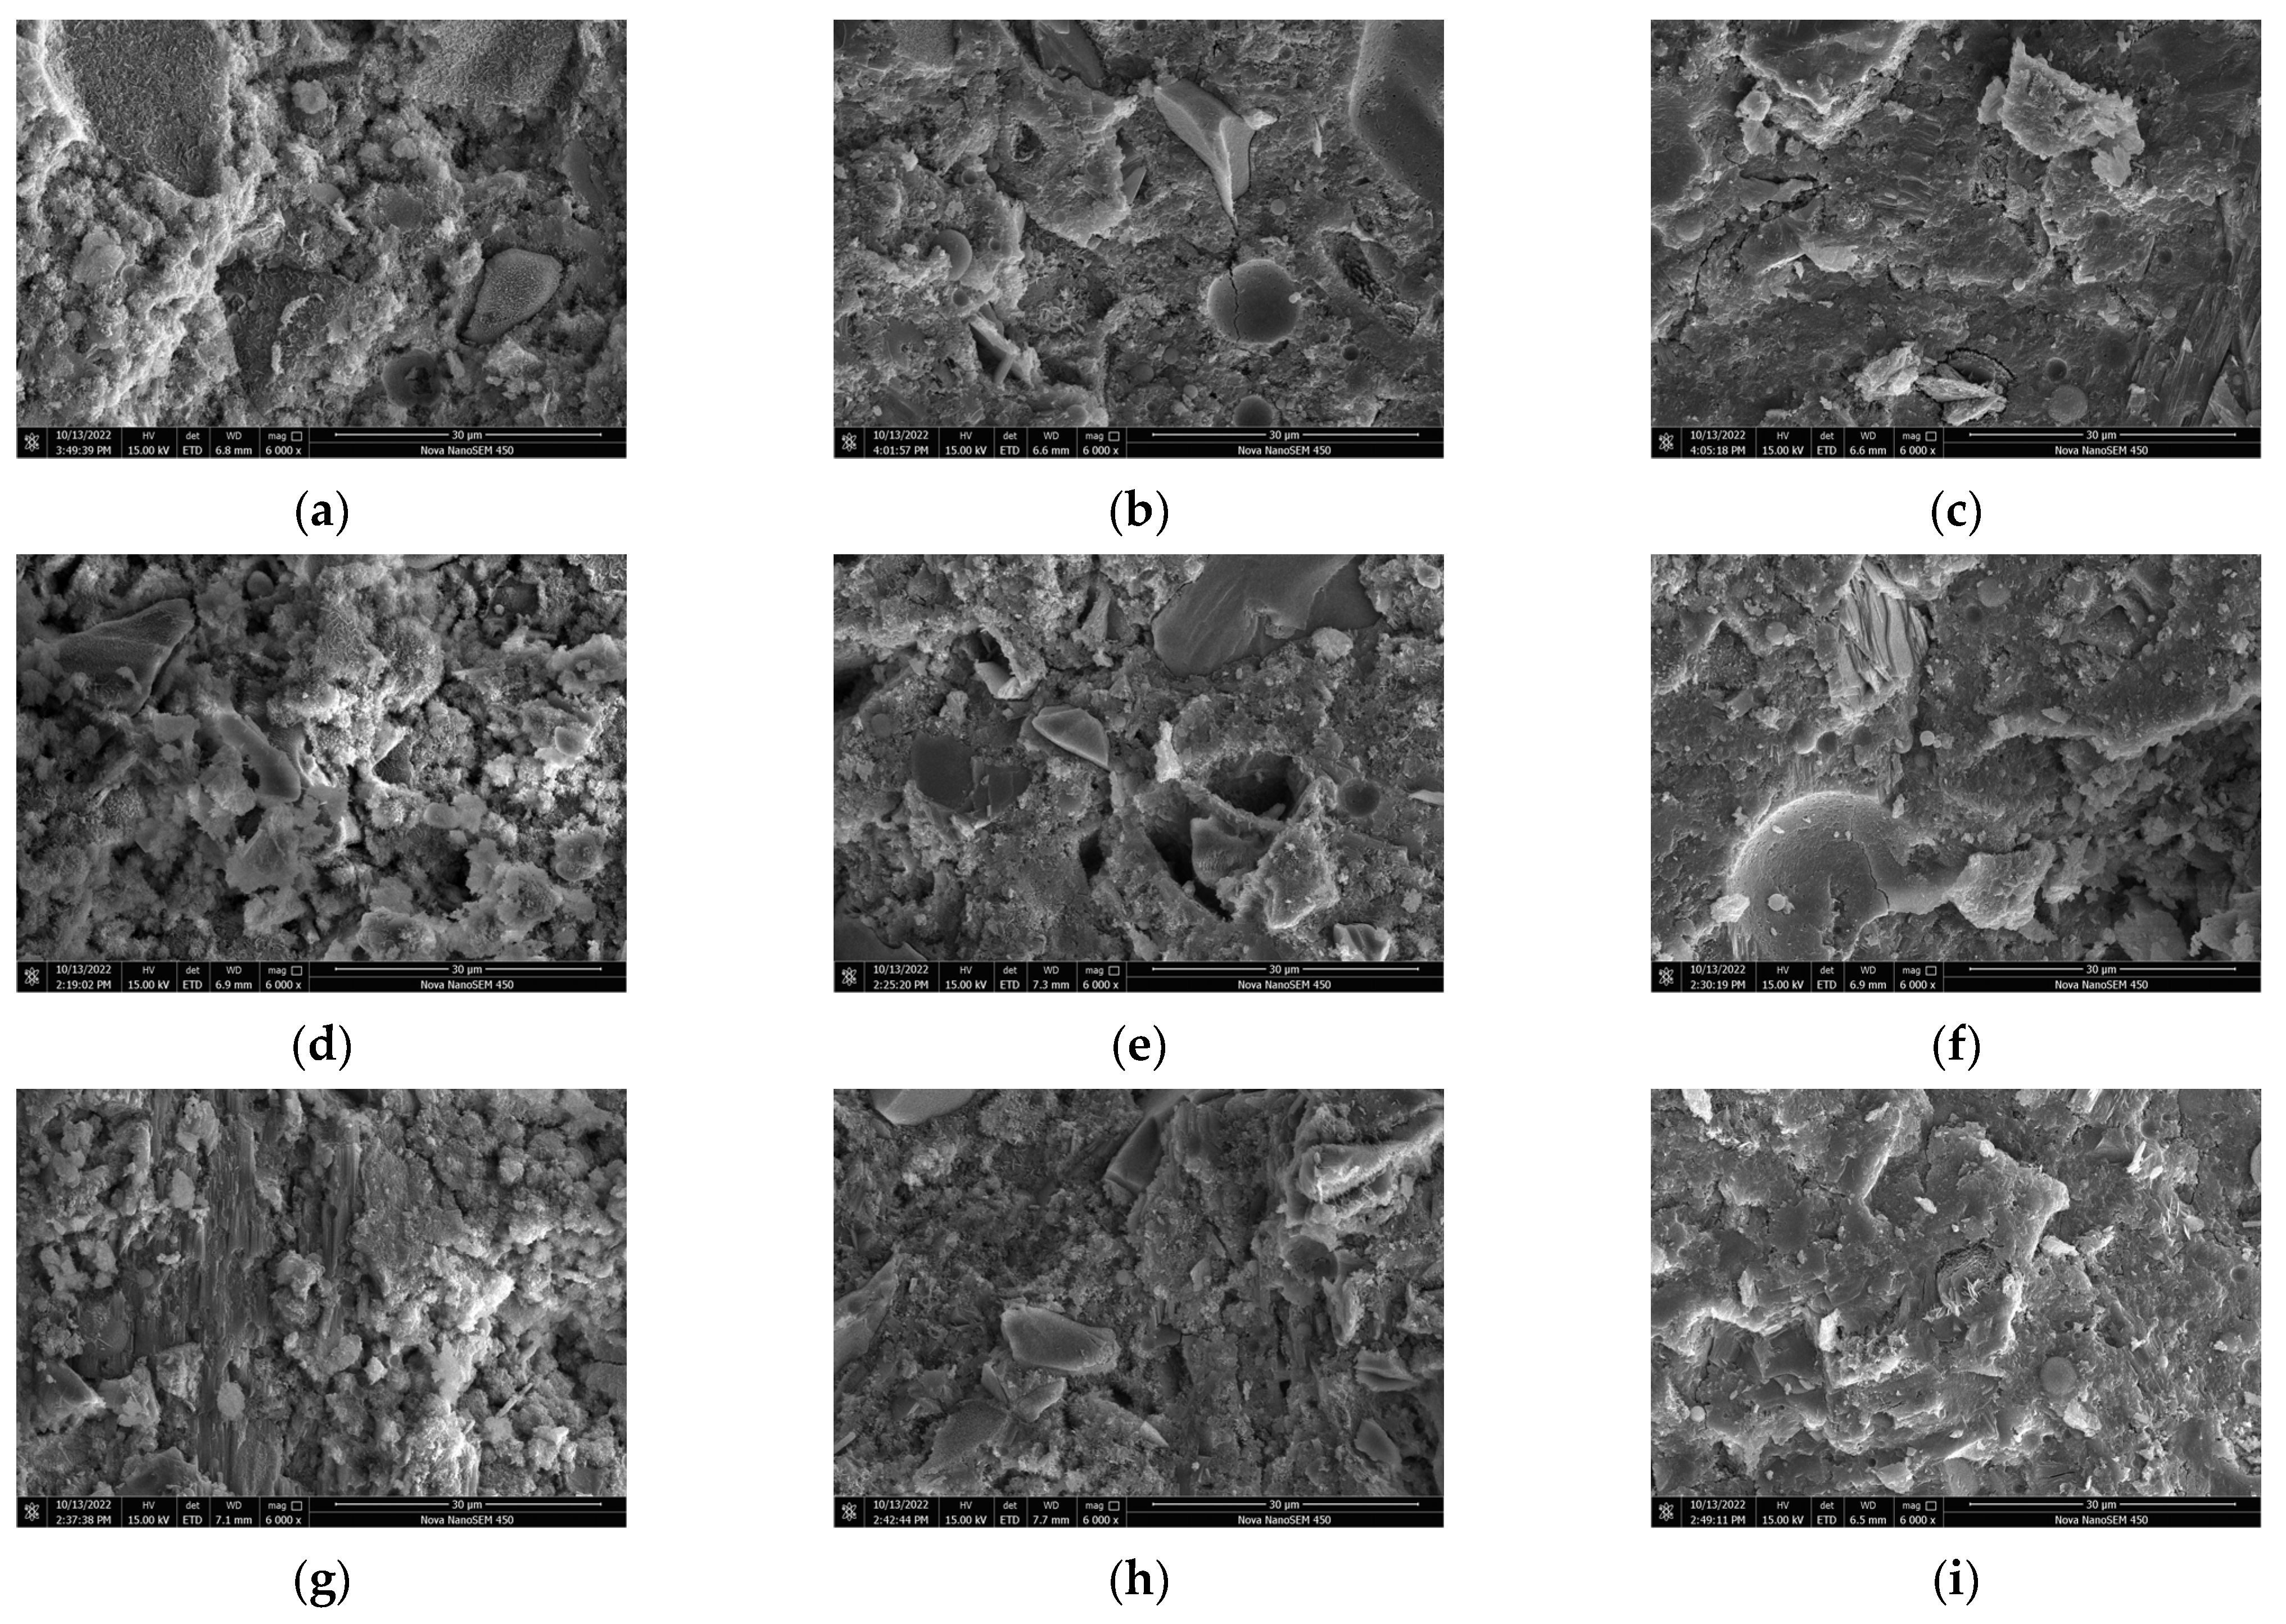
Figure 7 shows the microstructure of samples with different CAMC dosages at different hydration ages. It can be observed from Figure 7 that at 3 d, more needle-like products, namely C-S-H, appeared in the hydration products of the CA1 sample, and the morphology distribution of the hydration products was more uniform compared to the CA3 sample, and the product structure was more dense. With the increase of CAMC dosage, the hydration effect of cement slurry is weakened, the generation of hydration products decreases, and the number of un-hydrated particles increases, covering the surface of the cement. The more CAMC is added, the more loose the product structure becomes. At the same time, the addition of CAMC significantly delays the generation of C-S-H. At 3 d, there are a large number of un-hydrated fly ash particles in all samples, and there are still many pores. The hydration product CH is less, and the structure is not dense enough. The hydration product of the CA1 sample contains more interlaced network C-S-H gel, the pores are relatively small, and the hydration product of clusters is the most. At 7 d, the introduction of CAMC resulted in the generation of many new clustered hydration products in the sample. Through analysis, it was found that this was due to the addition of CAMC, which transformed the single needle-like loose C-S-H grouting into a flocculent form. In pure water slurry, the direction of the C-S-H needle is usually disordered. The addition of CAMC can delay cement hydration, and the more the amount added, the better the delay effect, and the more the growth rate of needle-like C-S is inhibited. At 28 d, due to the change of nucleation and growth kinetics, C-S-H gel was wrapped by a large number of hydration products. In the later stage of hydration, the delayed hydration effect of CAMC almost disappears. At this time, the degree of cement hydration is high, the porosity is low, the structure is dense, and the microstructure of all samples is relatively consistent. Only a small number of large pores and scattered incomplete hydration of fly ash particles exist.

Figure 7.
SEM of specimens with different CAMC contents at 3 d, 7 d, and 28 d. (a) CA1 at 3 d; (b) CA2 at 3 d; (c) CA3 at 3 d; (d) CA1 at 7 d; (e) CA2 at 7 d; (f) CA3 at 7 d; (g) CA1 at 28 d; (h) CA2 at 28 d; (i) CA3 at 28 d.
3.7. NMR
In order to further study the influence of CAMC content on the microstructure of hydration products of composite cementitious materials, the structure of C-S-H gel in the sample at 28 d hydration age was characterized by nuclear magnetic resonance (NMR).
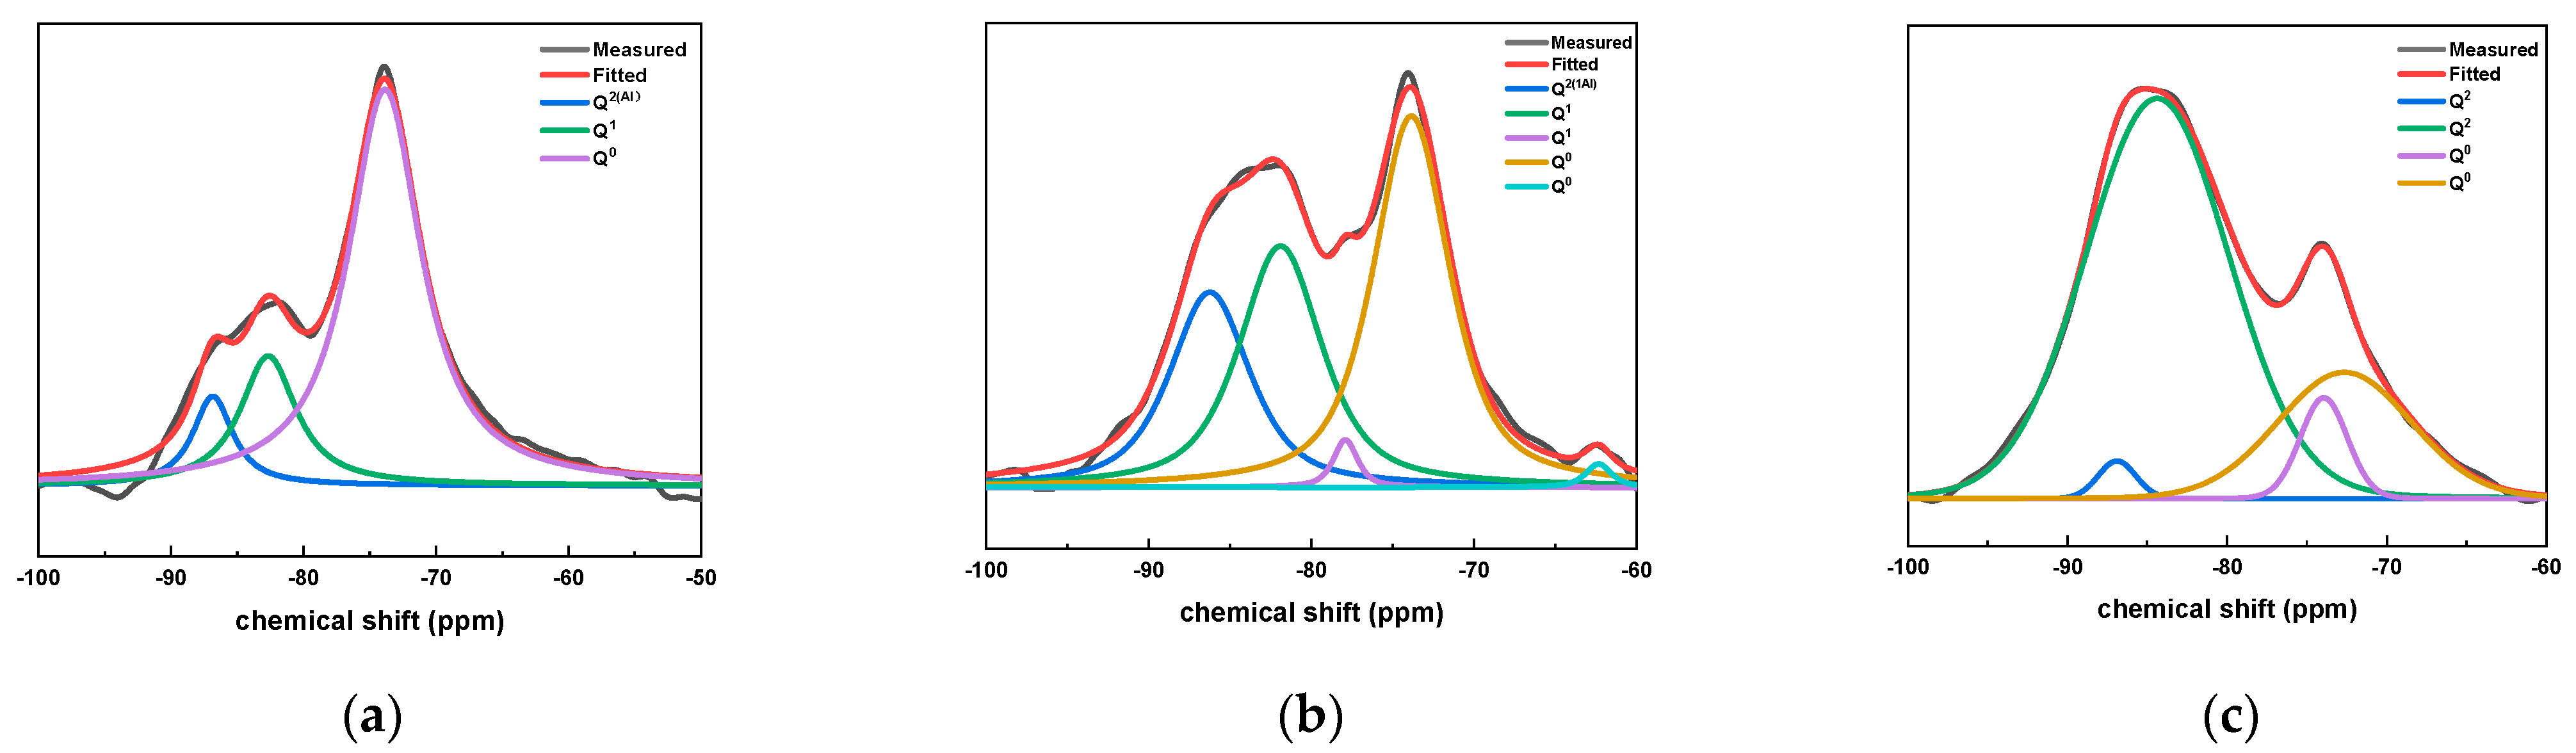
Figure 8 shows the fitting results of 29Si NMR peaks for samples with different CAMC contents at 28 d. It can be seen from Figure 8 that the sample doped with CAMC mainly contains three peaks: Q0, Q1, and Q2. With the increase of CAMC content, the Q2 peak strength increased significantly and the Q0 unit peak strength decreased significantly, which indicated that a large amount of long-chain dimer C-S-H gel was formed in the late hydration period of the composite cementitious system, and the Q0 peak strength decreased significantly, which indicated that the slurry had a high degree of hydration. Furthermore, in the CA3 sample, no Q1 was detected, indicating a low degree of hydration. The values of I(Q1)/I(Q2) in all samples decrease with the increase of CAMC content, indicating that the degree of polymerization of silica tetrahedral structure gradually decreases, confirming that CAMC can delay cement hydration in the early stage of hydration.
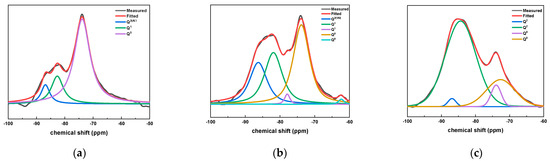
Figure 8.
29Si NMR peak fitting results of specimens with different CAMC contents at 28 d. (a) CA1; (b) CA2; (c) CA3.
Furthermore, the peak area I(Qn) can be integrated according to the correlation peak intensity of the 29Si NMR peak fitting of the sample, and the chemical structure of the C-S-H gel can be calculated accordingly. The calculation formula is shown in Table 5.
Table 5.
C-S-H gel chemical structure parameter calculation formula [15,16].
According to the formula in Table 5, the hydration degrees of CA1, CA2, and CA3 samples at 28 d were calculated to be 73.5%, 76.1%, and 58.7%, respectively. This also confirms that CAMC can reduce the cement hydration rate, and within a certain range, the higher its content, the better the effect of delaying cement hydration.
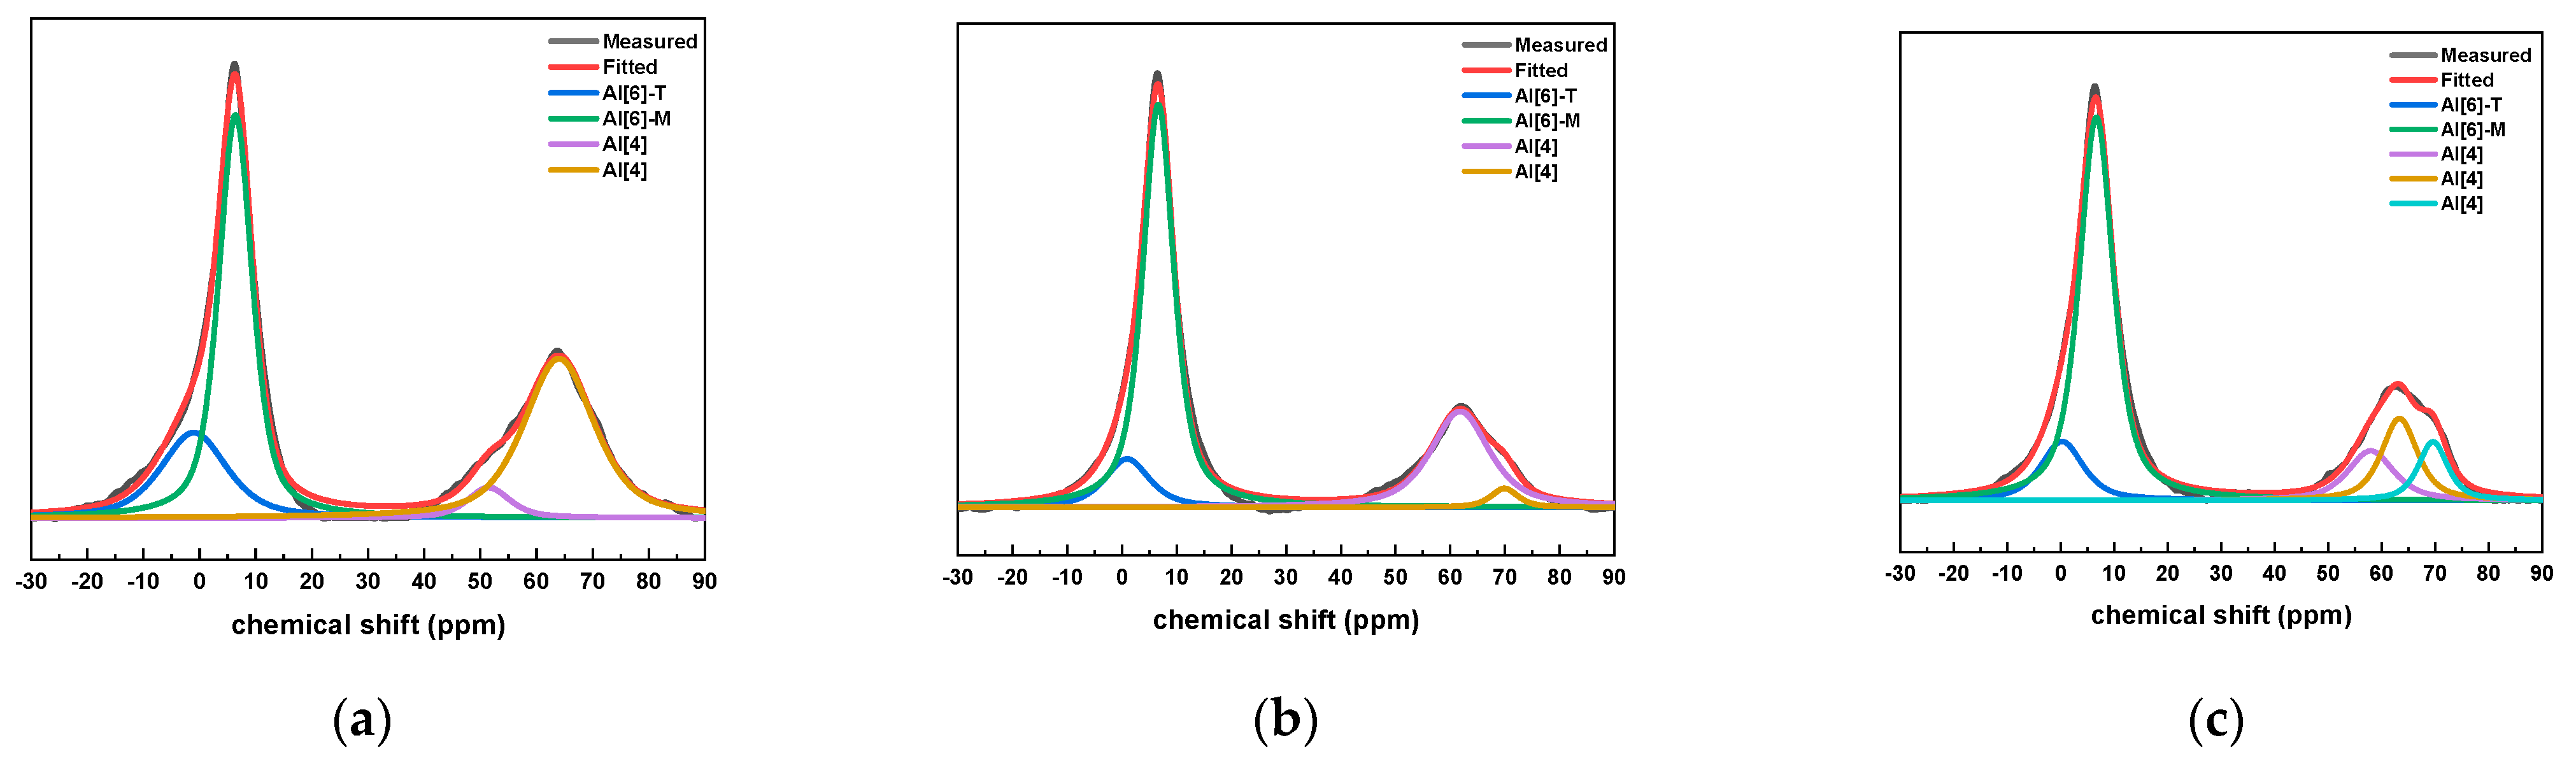
The 27Al NMR fitting results of the slurry with different CAMC dosages at 28 days of age are shown in Figure 9. It was found that the Al phase in all samples mainly consists of four coordinated and six coordinated structures. All samples have an obvious spectral peak near the chemical shift of 0 ppm. In addition, there is a clear peak near 6.6 ppm in each group, which is Al [6]-M in AFm, but there is no Al [6]-E in AFt, indicating that AFt has completely transformed into AFm. At the age of 28 days, each group of samples has an obvious formant at the chemical shift of 69 ppm, which corresponds to four coordinated aluminum. The Alenvironment is often similar to the low polymerized C-(A)-S-H gel, and the peak strength of Alis is also decreasing with the increase of CAMC content. This proves that the aluminum atom of Q2 (1Al) exists in the form of Alcoordination in the sample, and the substitution rate of Al in the silica tetrahedron decreases with increasing CAMC content.
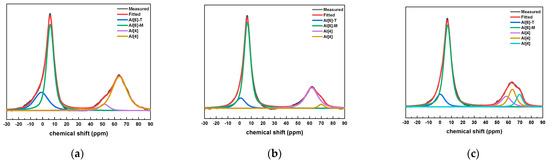
Figure 9.
27Al NMR peak fitting results of specimens with different CAMC contents at 28 d. (a) CA1; (b) CA2; (c) CA3.
4. Conclusions
This article investigates the influence of low-temperature rise polymer CAMC on the hydration of composite cementitious material systems, revealing the regulatory mechanism of CAMC on them. Firstly, the effect of low-temperature rise polymers on the heat release during the hydration process of composite cementitious materials was studied through hydration heat. Then, based on the XRD data calculation of the hydration degree of cement clinker, a detailed analysis was conducted on the hydration product phase. Finally, the pore structure and microstructure of composite cementitious materials with different dosages of CAMC were characterized using micro testing methods such as MIP, SEM, and NMR. The conclusion is summarized as follows:
- (1)
- The addition of CAMC can delay the hydration process of cementitious materials. With the increase of CAMC dosage, the first and second hydration exothermic peaks of the slurry are delayed and the peak intensity is significantly reduced. The first exothermic peak of the CA3 sample decreased by about 40% compared to the maximum exothermic rate of the CA1 sample, and the maximum exothermic peak appeared after a delay of about 13 h, indicating that CAMC can delay the hydration of cement and significantly reduce the hydration heat release rate of the slurry, and the higher the content within a certain range, the better the effect.
- (2)
- CAMC has no effect on the type of hydration products but has a slight impact on the content of each phase of the hydration products. In the early stage of hydration, with the increase of CAMC content, the characteristic peak of CH appears delayed in time and its intensity decreases. At the age of 3 d, as the CAMC dosage increases from 0.1% to 0.3%, the CH peak intensity also gradually increases, while the C2S and C3S peak intensity decreases. In the XRD spectrum at 28 d, the peak positions of all samples are almost the same, and the intensities of CH, C2S, C3S, AFm, and other peaks are also equivalent.
- (3)
- Based on the degree of hydration reaction of cement clinker and the changes in various components and CH and AFt contents, it can be seen that with the increase of CAMC dosage, the overall hydration rate of cement slows down and the degree of hydration reaction decreases. This effect is particularly evident in the early stages of hydration. The retarding effect of CAMC mainly acts on the silicon phase, which can reduce the CH content in the system in the early stage of hydration and delay cement hydration.
- (4)
- As hydration progresses, the total porosity of each group of slurries decreases, and the volume of large pores decreases while the volume of small pores increases. In the early stage of hydration, the smaller the amount of CAMC added, the denser the structure of the hydration product. CAMC can make C-S-H gel form floccules, it can inhibit the formation of needle-like C-S-H in the early stage of hydration, and the delayed hydration effect of CAMC almost disappears in the late stage of hydration. As the content of CAMC increases, the pore size of the hardened slurry gradually refines, the proportion of large pores decreases, and the hydration microstructure becomes denser in the later stage.
- (5)
- With the increase of CAMC dosage, the strength of the Q2 peak in the slurry will decrease and the aluminum atom of Q2 (1Al) exists in the form of Alcoordination in the sample. CAMC can reduce its hydration degree and delay cement hydration.
Author Contributions
Conceptualization, L.W. and Z.Q.; methodology, J.W.; validation, G.S., H.W. and K.L.; formal analysis, X.D.; data curation, F.W.; funding acquisition, J.J. All authors have read and agreed to the published version of the manuscript.
Funding
The authors greatly acknowledge the National Science Fund for Distinguished Young Scholars, China (51925903), the General Program of the National Natural Science Foundation of China (52350004) the State Key Laboratory of High-Performance Civil Engineering Materials (2020CEM001) and the Science and Technology Research Project of China Railway (2020YY240610, K2020G033).
Data Availability Statement
The data presented in this study are available on request from the corresponding author. The data are not publicly available due to privacy.
Conflicts of Interest
Author Kai Liu was employed by the company Jiangsu China Construction Ready Mixed Concrete Co., Ltd. The remaining authors declare that the research was conducted in the absence of any commercial or financial relationships that could be construed as a potential conflict of interest.
References
- Peschard, A.; Govin, A.; Grosseau, P.; Guilhot, B.; Guyonnet, R. Effect of polysaccharides on the hydration of cement paste at early ages. Cem. Concr. Res. 2004, 34, 2153–2158. [Google Scholar] [CrossRef]
- Yang, Z.; Gao, Y.; Mu, S.; Chang, H.; Sun, W.; Jiang, J. Improving the chloride binding capacity of cement paste by adding nano-Al2O3. Constr. Build. Mater. 2019, 195, 415–422. [Google Scholar] [CrossRef]
- Pourchez, J.; Ruot, B.; Debayle, J.; Pourchez, E.; Grosseau, P. Some aspects of cellulose ethers influence on water transport and porous structure of cement-based materials. Cem. Concr. Res. 2010, 40, 242–252. [Google Scholar] [CrossRef]
- Patural, L.; Marchal, P.; Govin, A.; Grosseau, P.; Ruot, B.; Devès, O. Cellulose ethers influence on water retention and consistency in cement-based mortars. Cem. Concr. Res. 2011, 41, 46–55. [Google Scholar] [CrossRef]
- Hou, P.; Cai, Y.; Cheng, X.; Zhang, X.; Zhou, Z.; Ye, Z.; Zhang, L.; Li, W.; Shah, S.P. Effects of the hydration reactivity of ultrafine magnesium oxide on cement-based materials. Mag. Concr. Res. 2017, 69, 1135–1145. [Google Scholar] [CrossRef]
- Azenha, M.; Lameiras, R.; De Sousa, C.; Barros, J. Application of air cooled pipes for reduction of early age cracking risk in a massive RC wall. Eng. Struct. 2014, 62–63, 148–163. [Google Scholar] [CrossRef]
- Ismail, M.; Noruzman, A.H.; Bhutta, M.A.R.; Yusuf, T.O.; Ogiri, I.H. Effect of vinyl acetate effluent in reducing heat of hydration of concrete. KSCE J. Civ. Eng. 2016, 20, 145–151. [Google Scholar] [CrossRef]
- Khil, B.S.; Jang, S.J.; Choi, W.C.; Yun], H.D. Effect of barium-based phase change material (PCM) to control the heat of hydration on the mechanical properties of mass concrete. Thermochim. Acta 2015, 613, 100–107. [Google Scholar]
- Won-Chang, C.; Bae-Soo, K.; Young-Seok, C.; Qi-Bo, L.; Hyun-Do, Y. Feasibility of Using Phase Change Materials to Control the Heat of Hydration in Massive Concrete Structures. Sci. World J. 2014, 2014, 781393. [Google Scholar]
- Alkhraisat, M.H.; Rueda, C.; Jerez, L.B.; MariñO, F.T.; Torres, J.; Gbureck, U.; Cabarcos, E.L. Effect of silica gel on the cohesion, properties and biological performance of brushite cement. Acta Biomater. 2010, 6, 257–265. [Google Scholar] [CrossRef] [PubMed]
- Pan, Z.H.; Cai, H.P.; Jiang, P.P.; Fan, Q.Y. Properties of a calcium phosphate cement synergistically reinforced by chitosan fiber and gelatin. J. Polym. Res. 2006, 13, 323–327. [Google Scholar] [CrossRef]
- Wang, L.; Ju, S.; Wang, L.; Wang, F.; Sui, S.; Yang, Z.; Liu, Z.; Chu, H.; Jiang, J. Effect of citric acid-modified chitosan on the hydration and microstructure of Portland cement paste. J. Sustain. Cem.-Based Mater. 2023, 12, 83–96. [Google Scholar] [CrossRef]
- Wang, L.; Wang, F.; Sui, S.; Ju, S.; Qin, Z.; Su, W.; Jiang, J. Adsorption capacity and mechanism of citric acid-modified chitosan on the cement particle surface. J. Sustain. Cem.-Based Mater. 2023, 12, 893–906. [Google Scholar] [CrossRef]
- Wang, L.; Zhang, Y.; Guo, L.; Wang, F.; Ju, S.; Sui, S.; Liu, Z.; Chu, H.; Jiang, J. Effect of citric-acid-modified chitosan (CAMC) on hydration kinetics of tricalcium silicate (C3S). J. Mater. Res. Technol. 2022, 21, 3604–3616. [Google Scholar] [CrossRef]
- Richardson, I.; Groves, G. The structure of the calcium silicate hydrate phases present in hardened pastes of white Portland cement/blast-furnace slag blends. J. Mater. Sci. 1997, 32, 4793–4802. [Google Scholar] [CrossRef]
- Andersen, M.D.; Jakobsen, H.J.; Skibsted, J. Characterization of white Portland cement hydration and the CSH structure in the presence of sodium aluminate by 27Al and 29Si MAS NMR spectroscopy. Cem. Concr. Res. 2004, 34, 857–868. [Google Scholar] [CrossRef]


Disclaimer/Publisher’s Note: The statements, opinions and data contained in all publications are solely those of the individual author(s) and contributor(s) and not of MDPI and/or the editor(s). MDPI and/or the editor(s) disclaim responsibility for any injury to people or property resulting from any ideas, methods, instructions or products referred to in the content. |
© 2023 by the authors. Licensee MDPI, Basel, Switzerland. This article is an open access article distributed under the terms and conditions of the Creative Commons Attribution (CC BY) license (https://creativecommons.org/licenses/by/4.0/).