

Carbon and Greenhouse Gas Emissions from Electricity Consumption in European Union Buildings

 ,
,  ,
, 

Abstract
:1. Introduction
2. Methods
3. Results
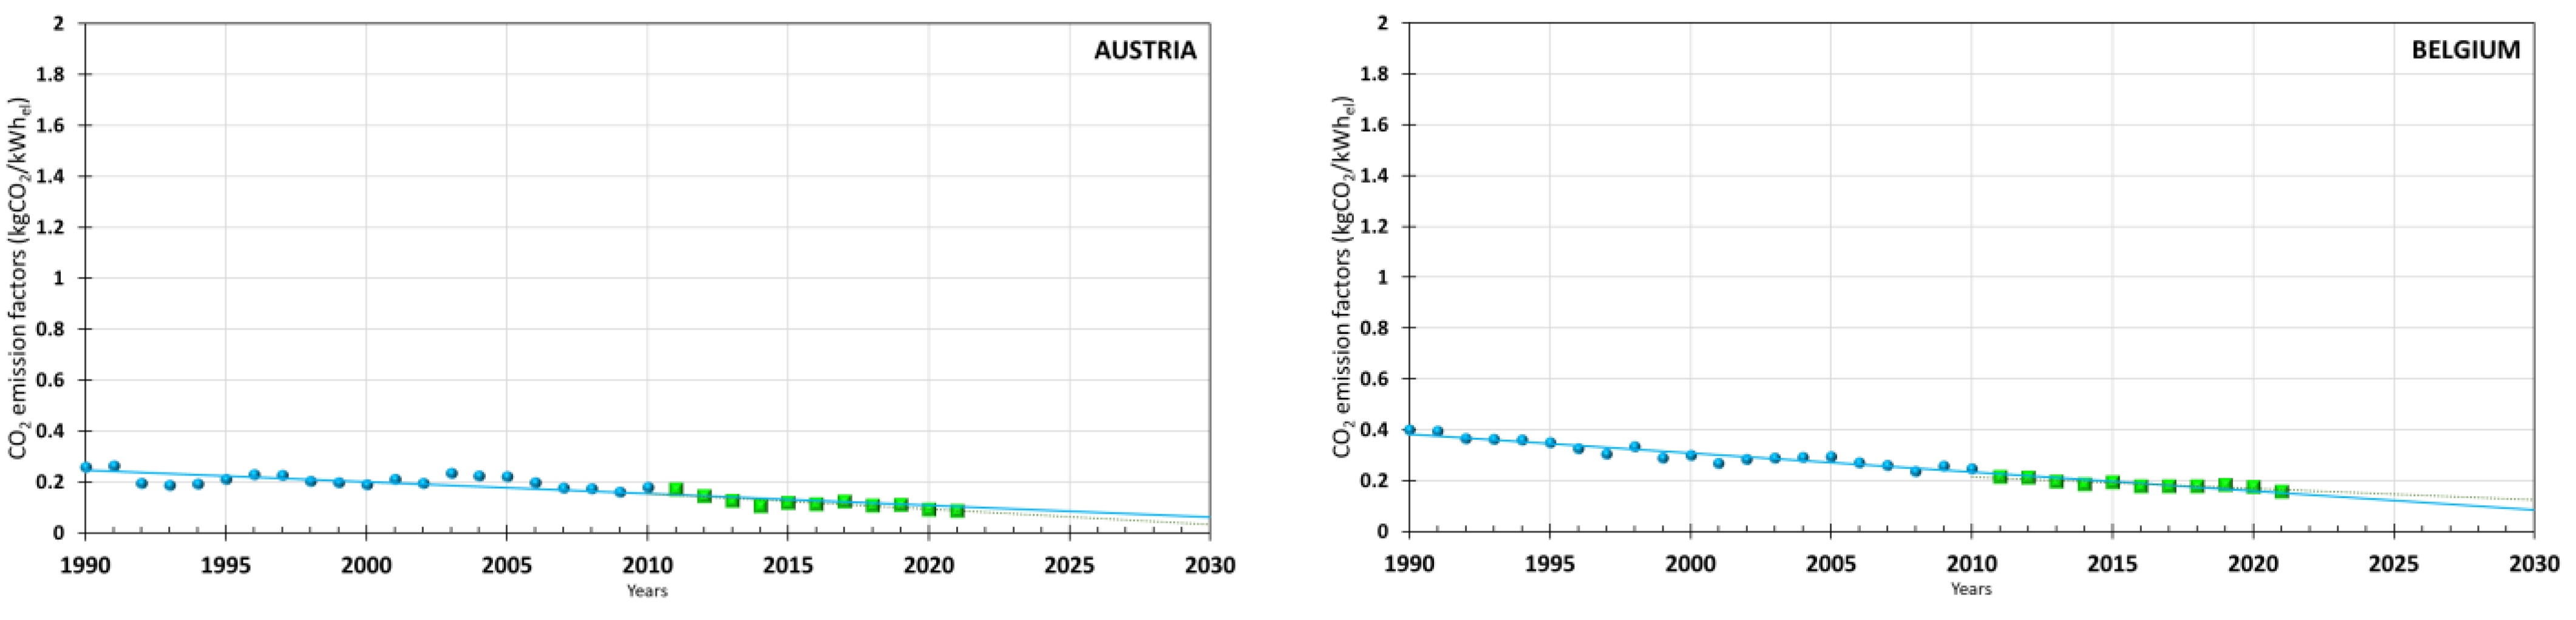
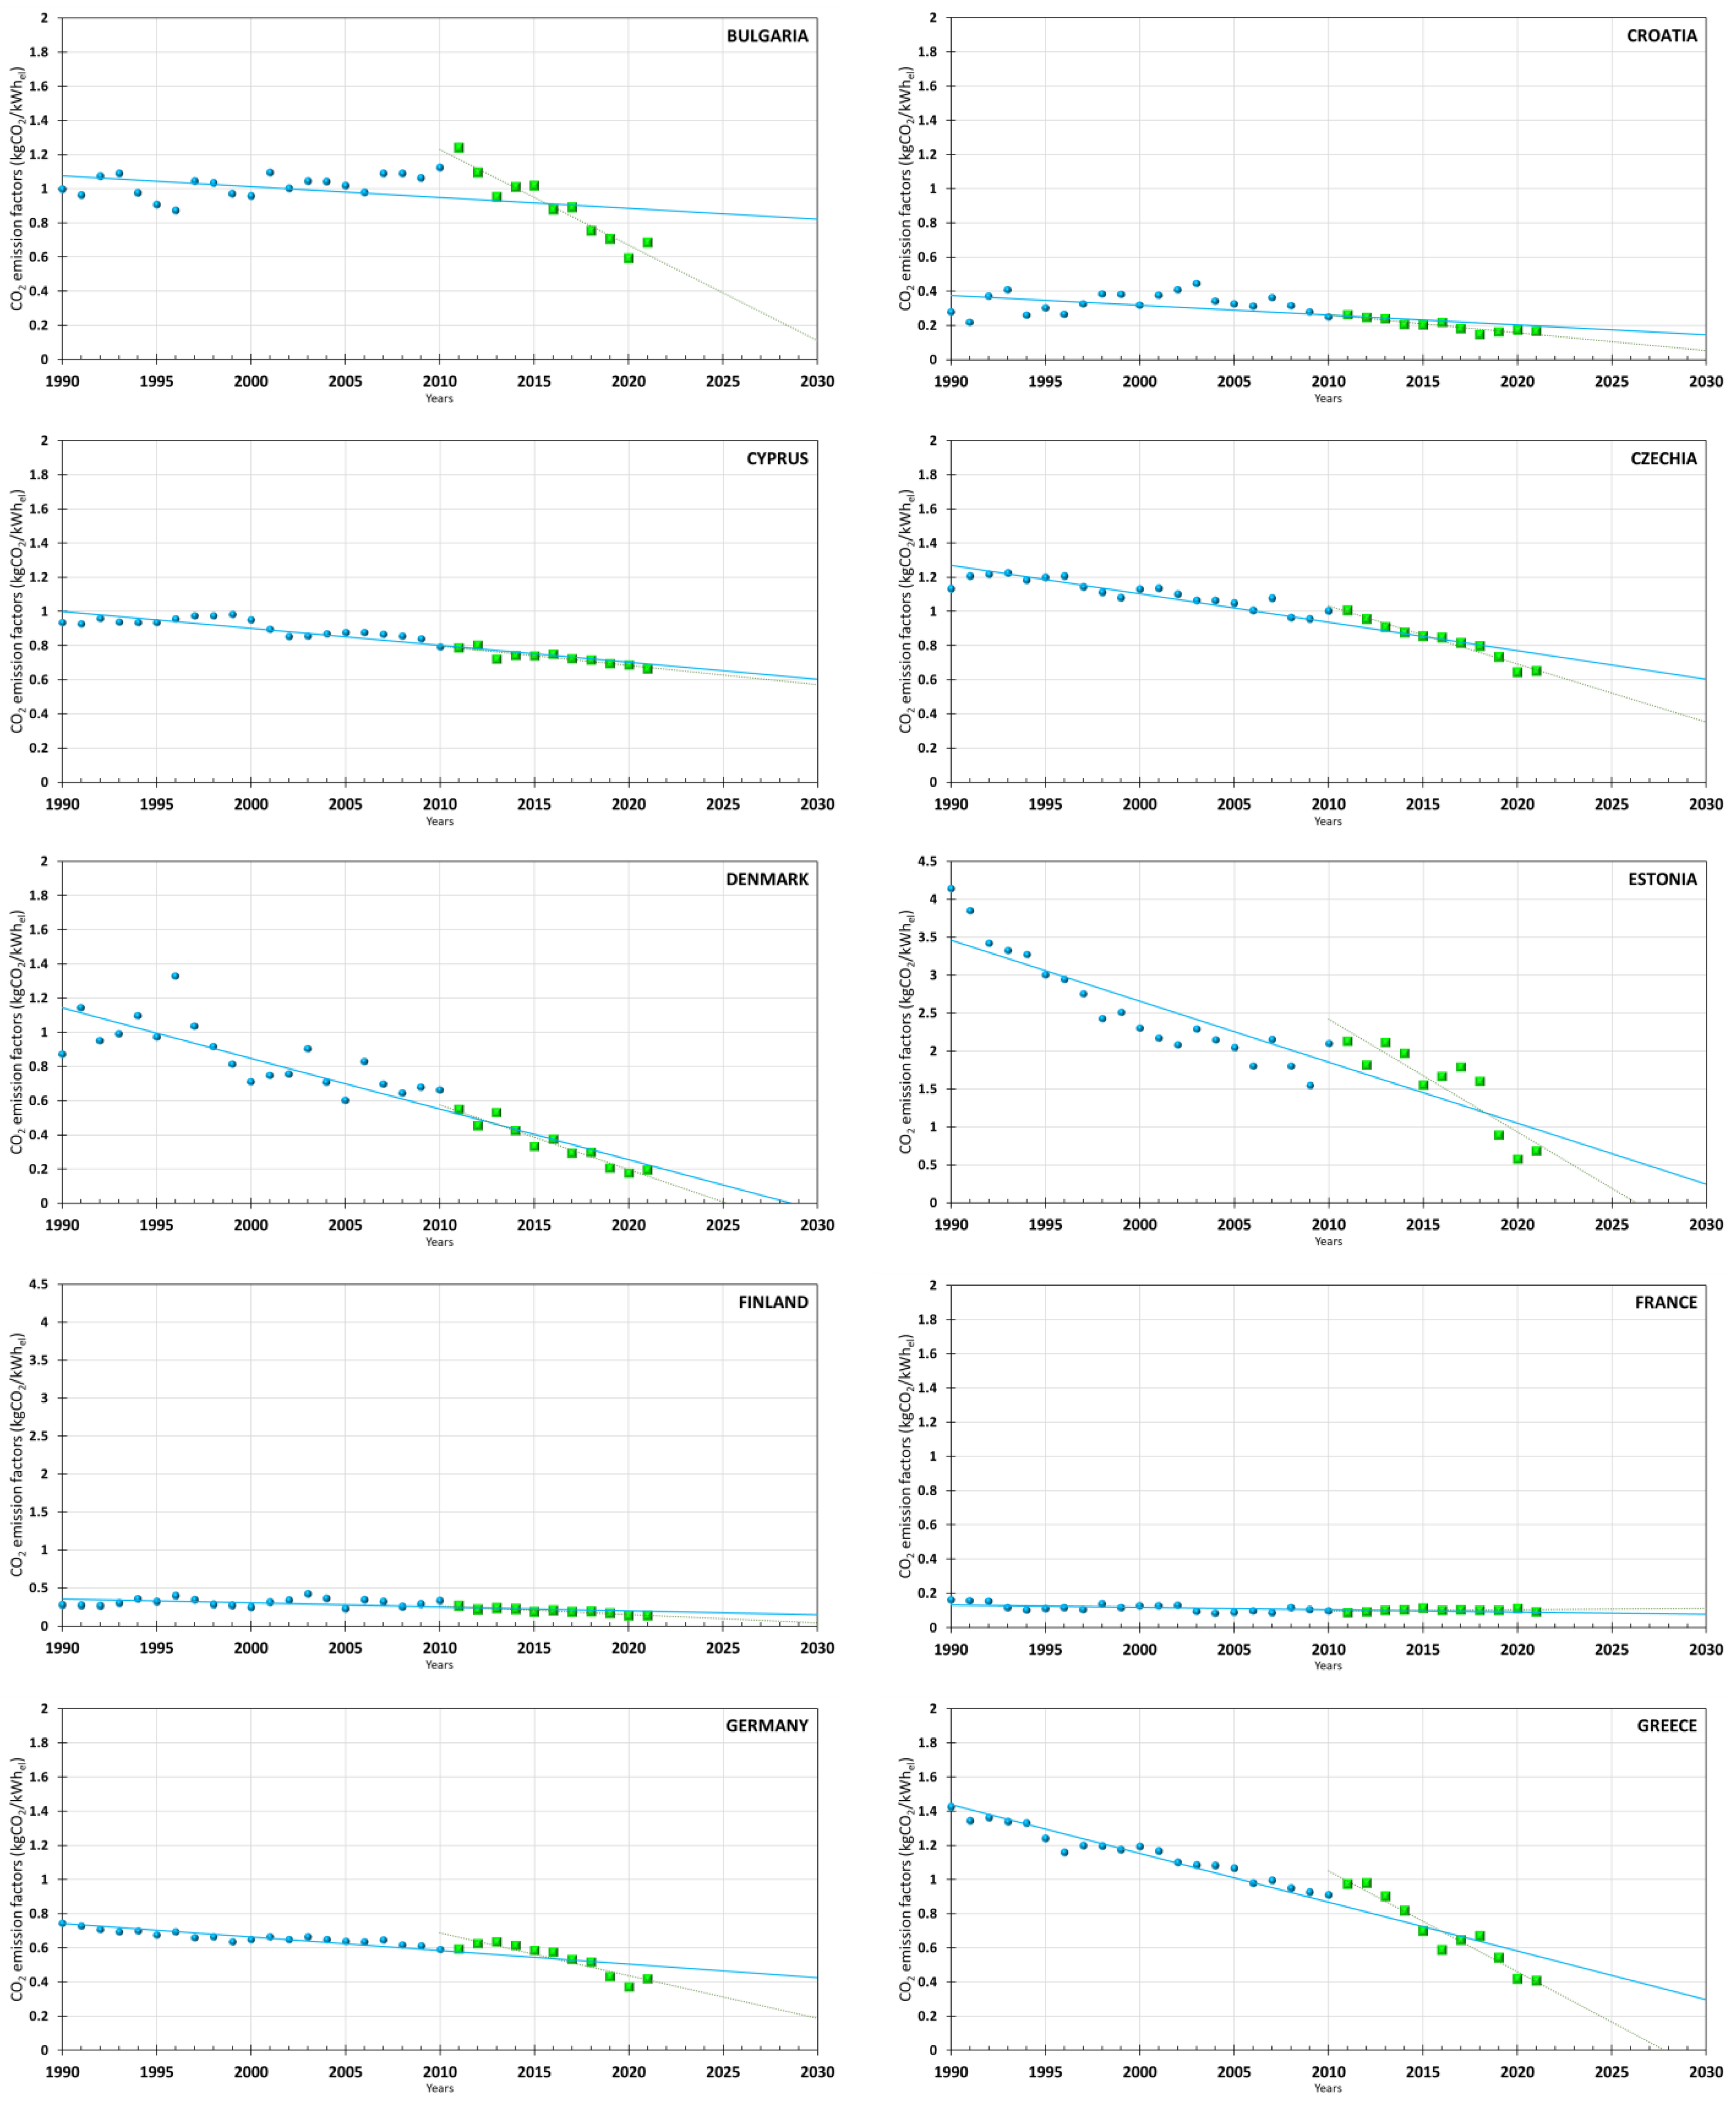
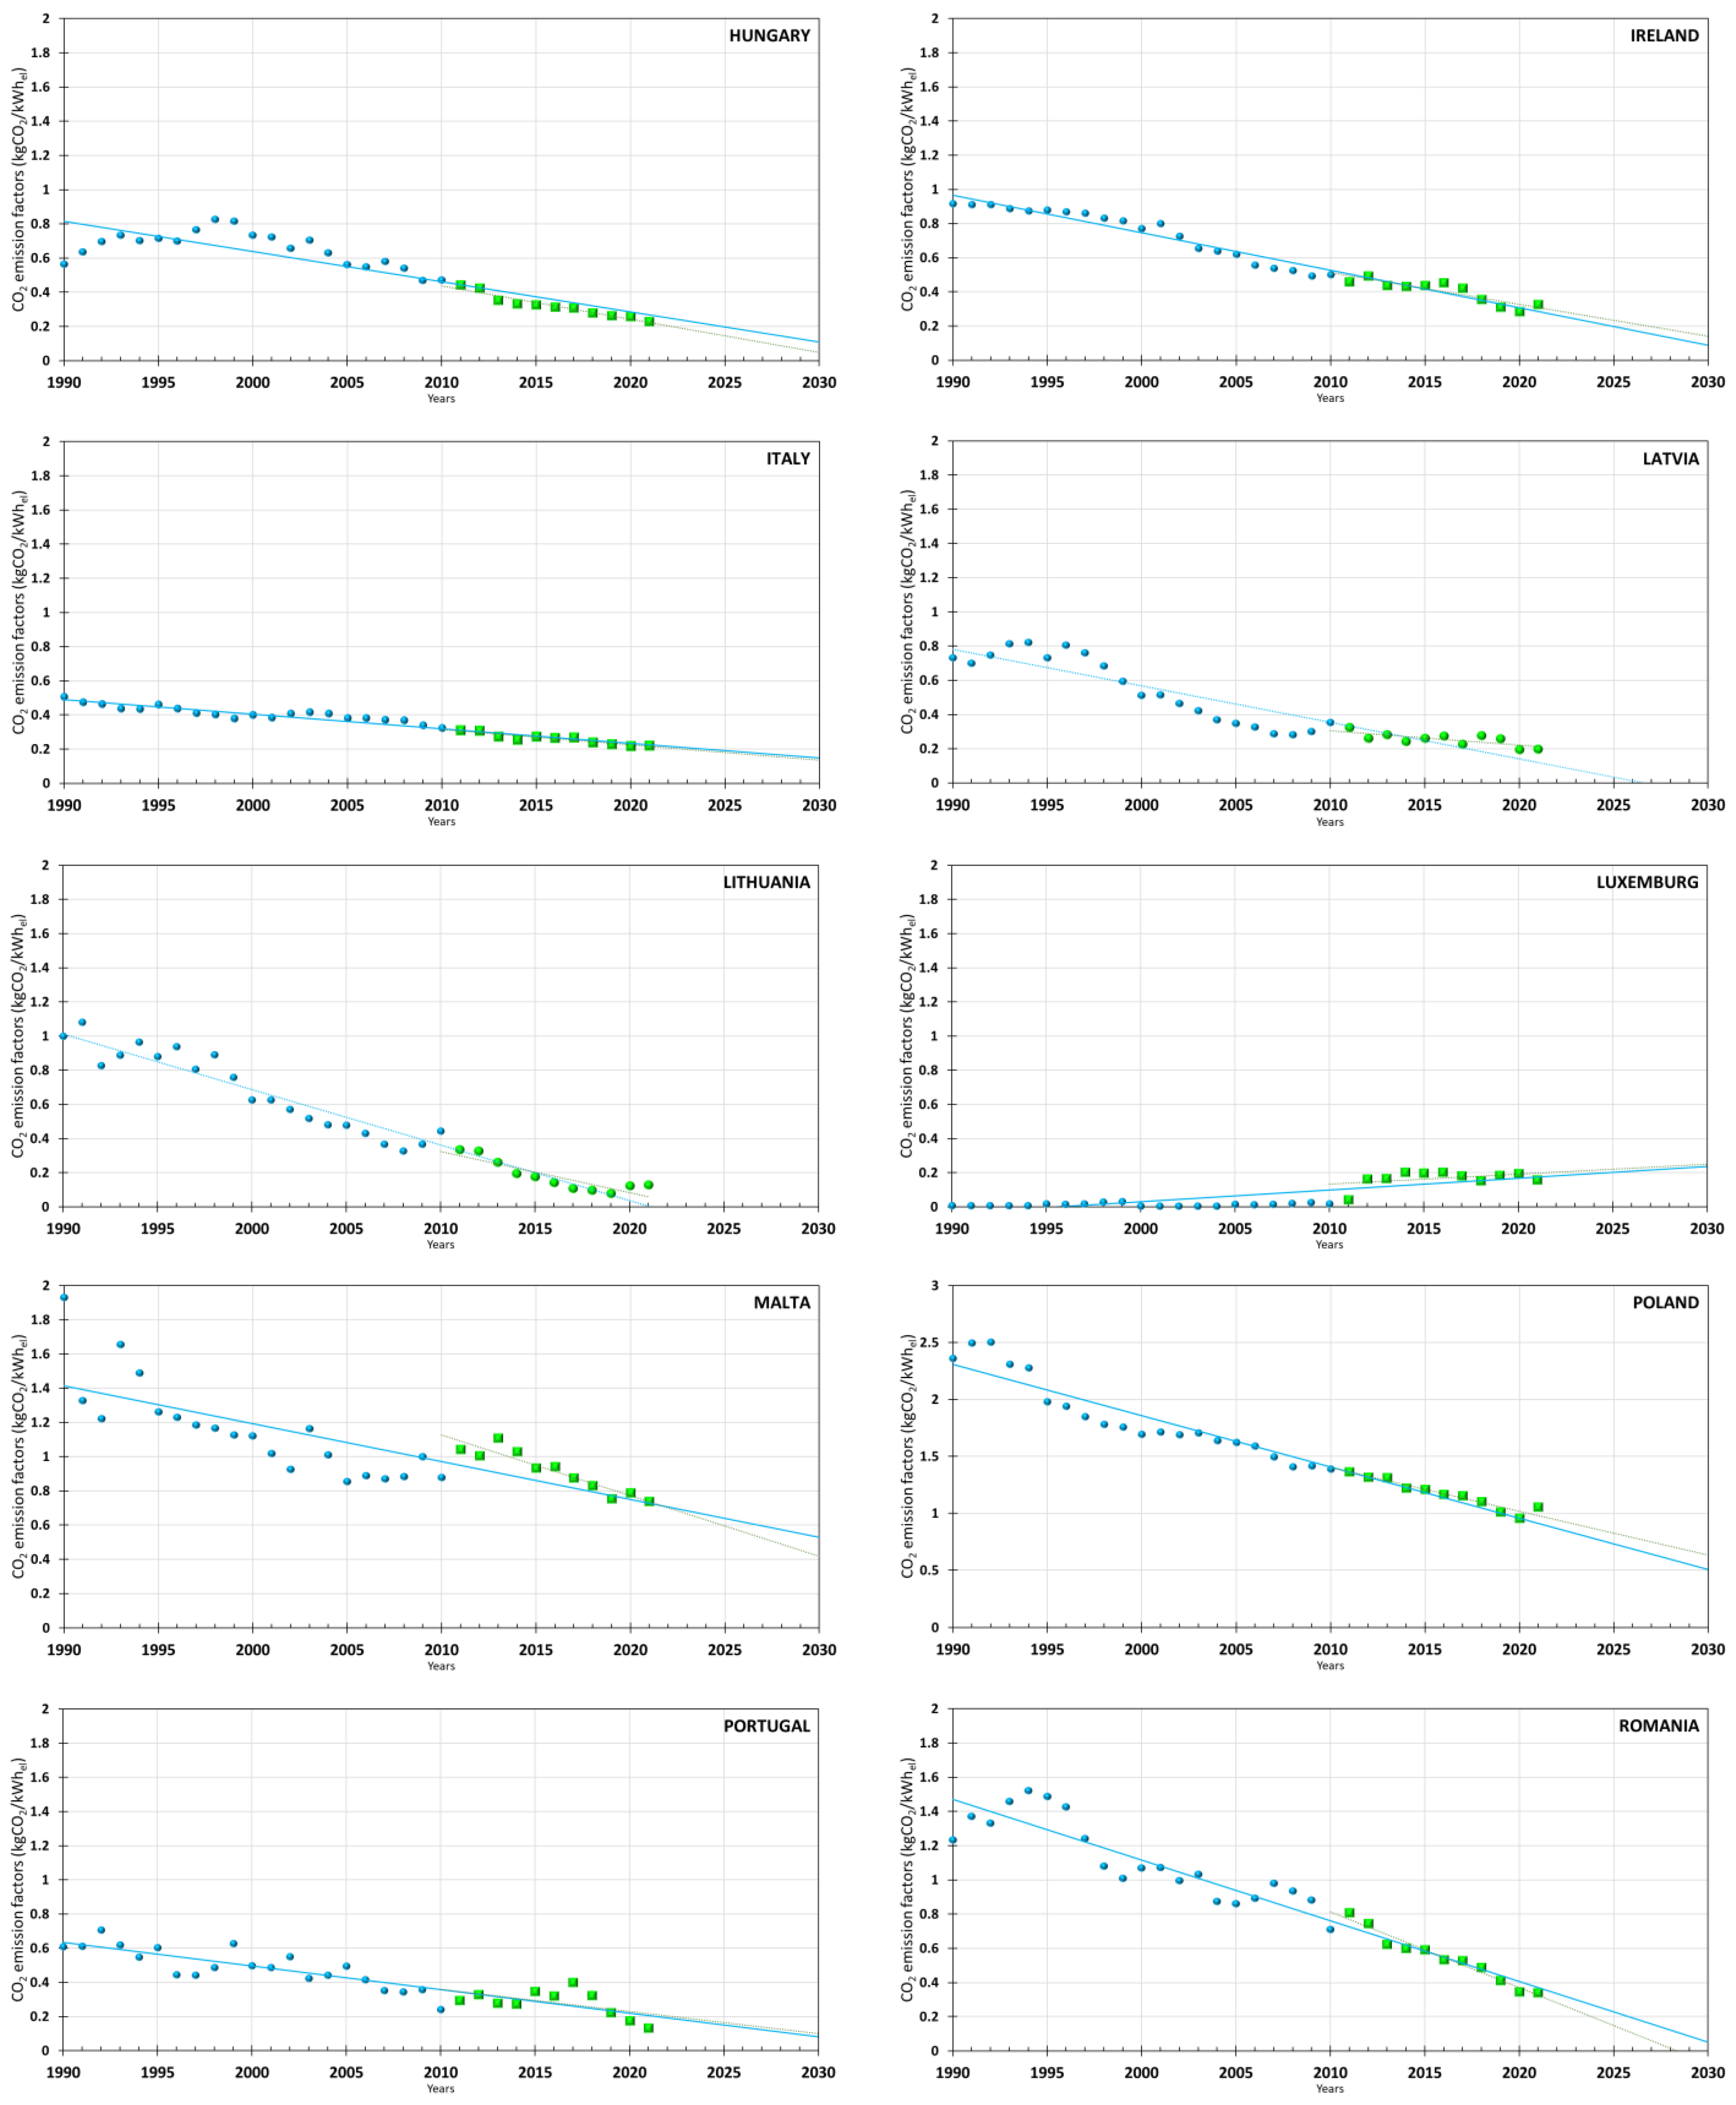
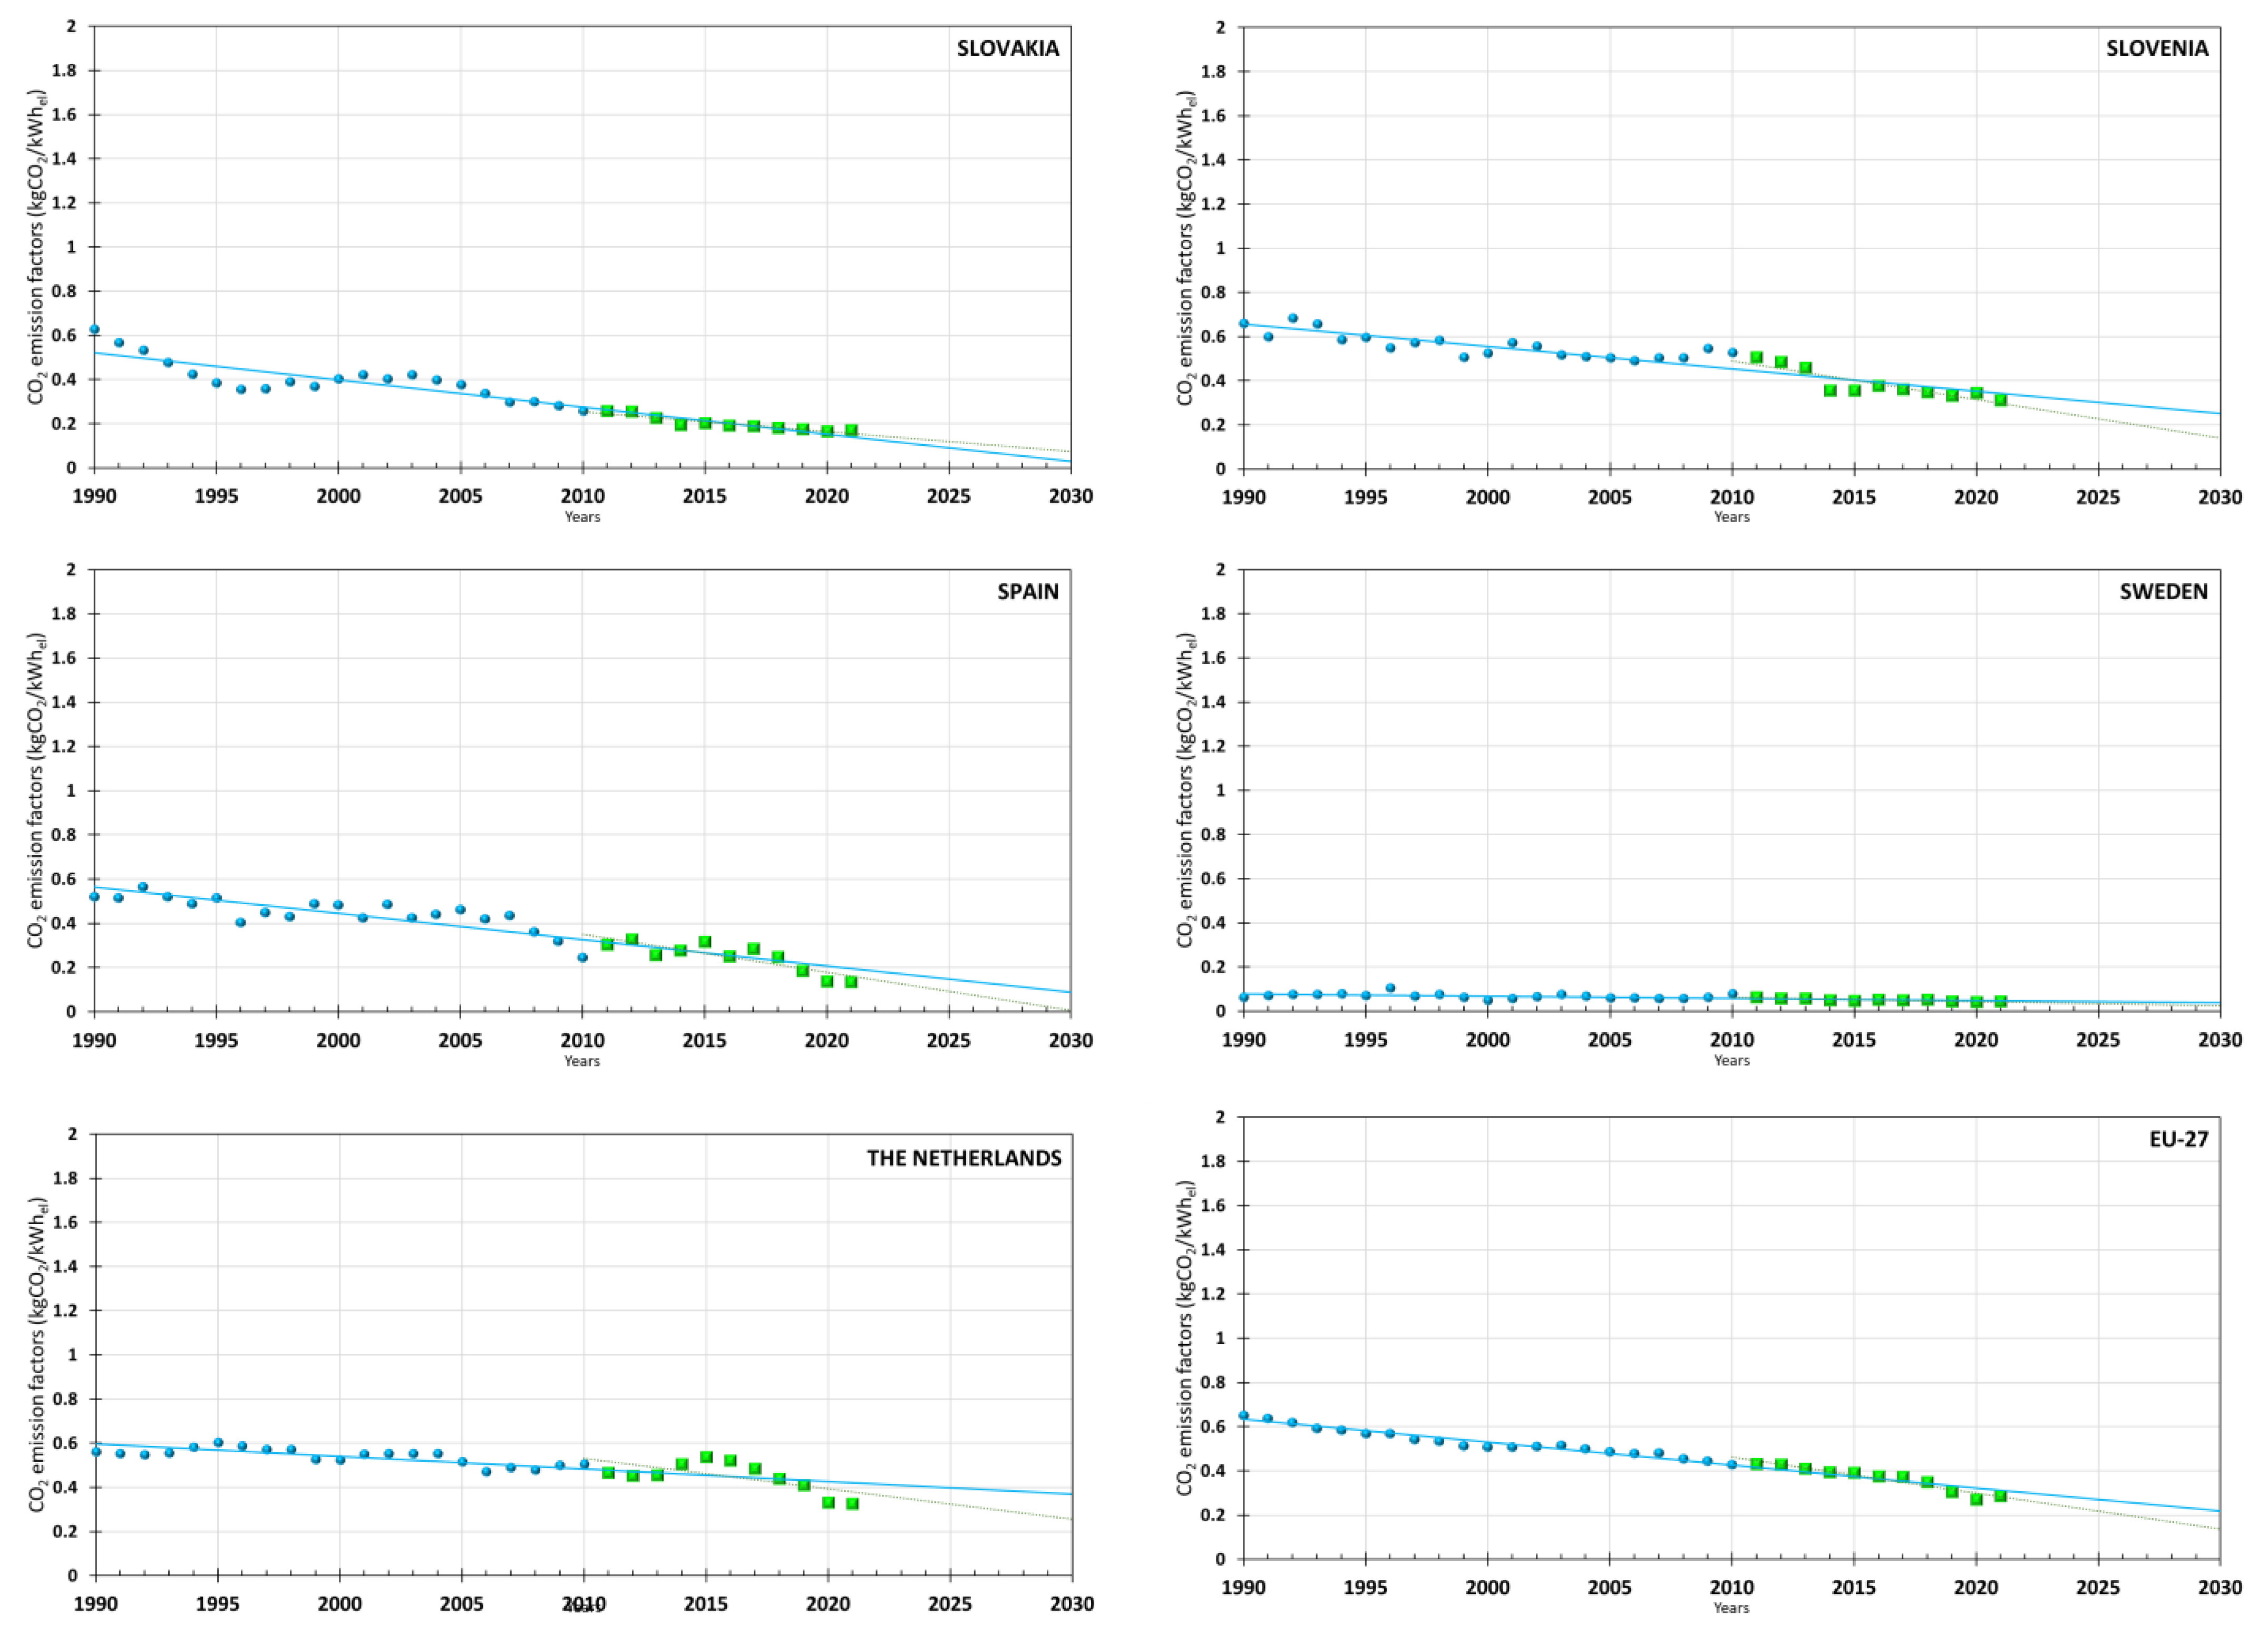
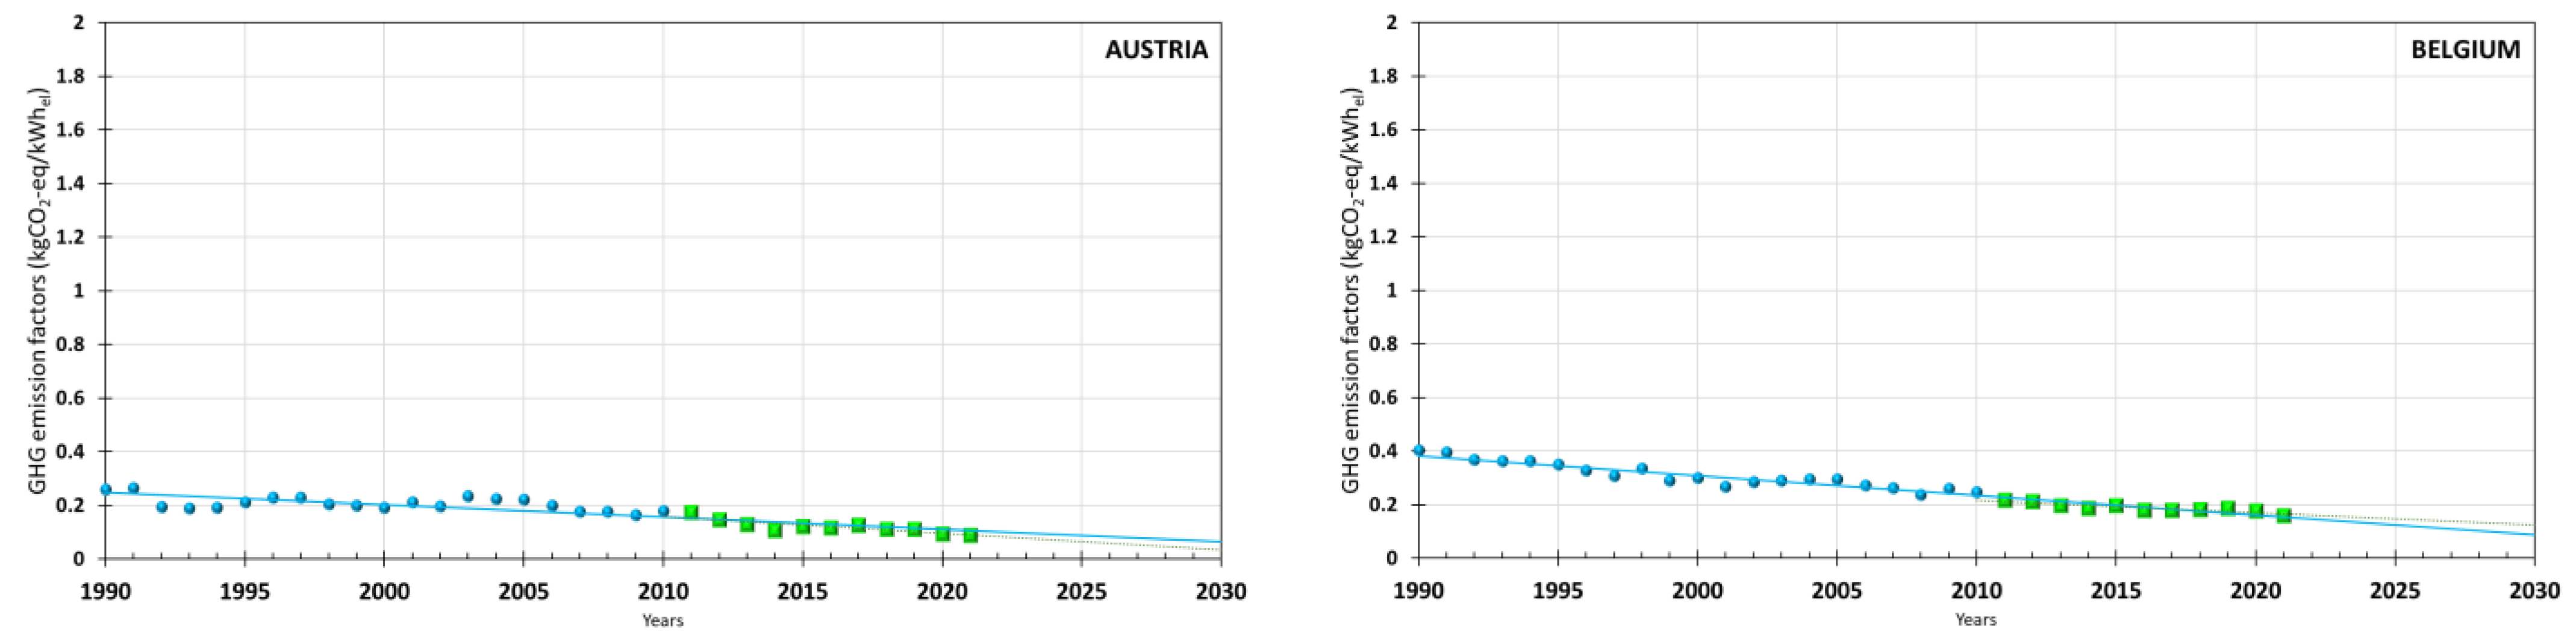
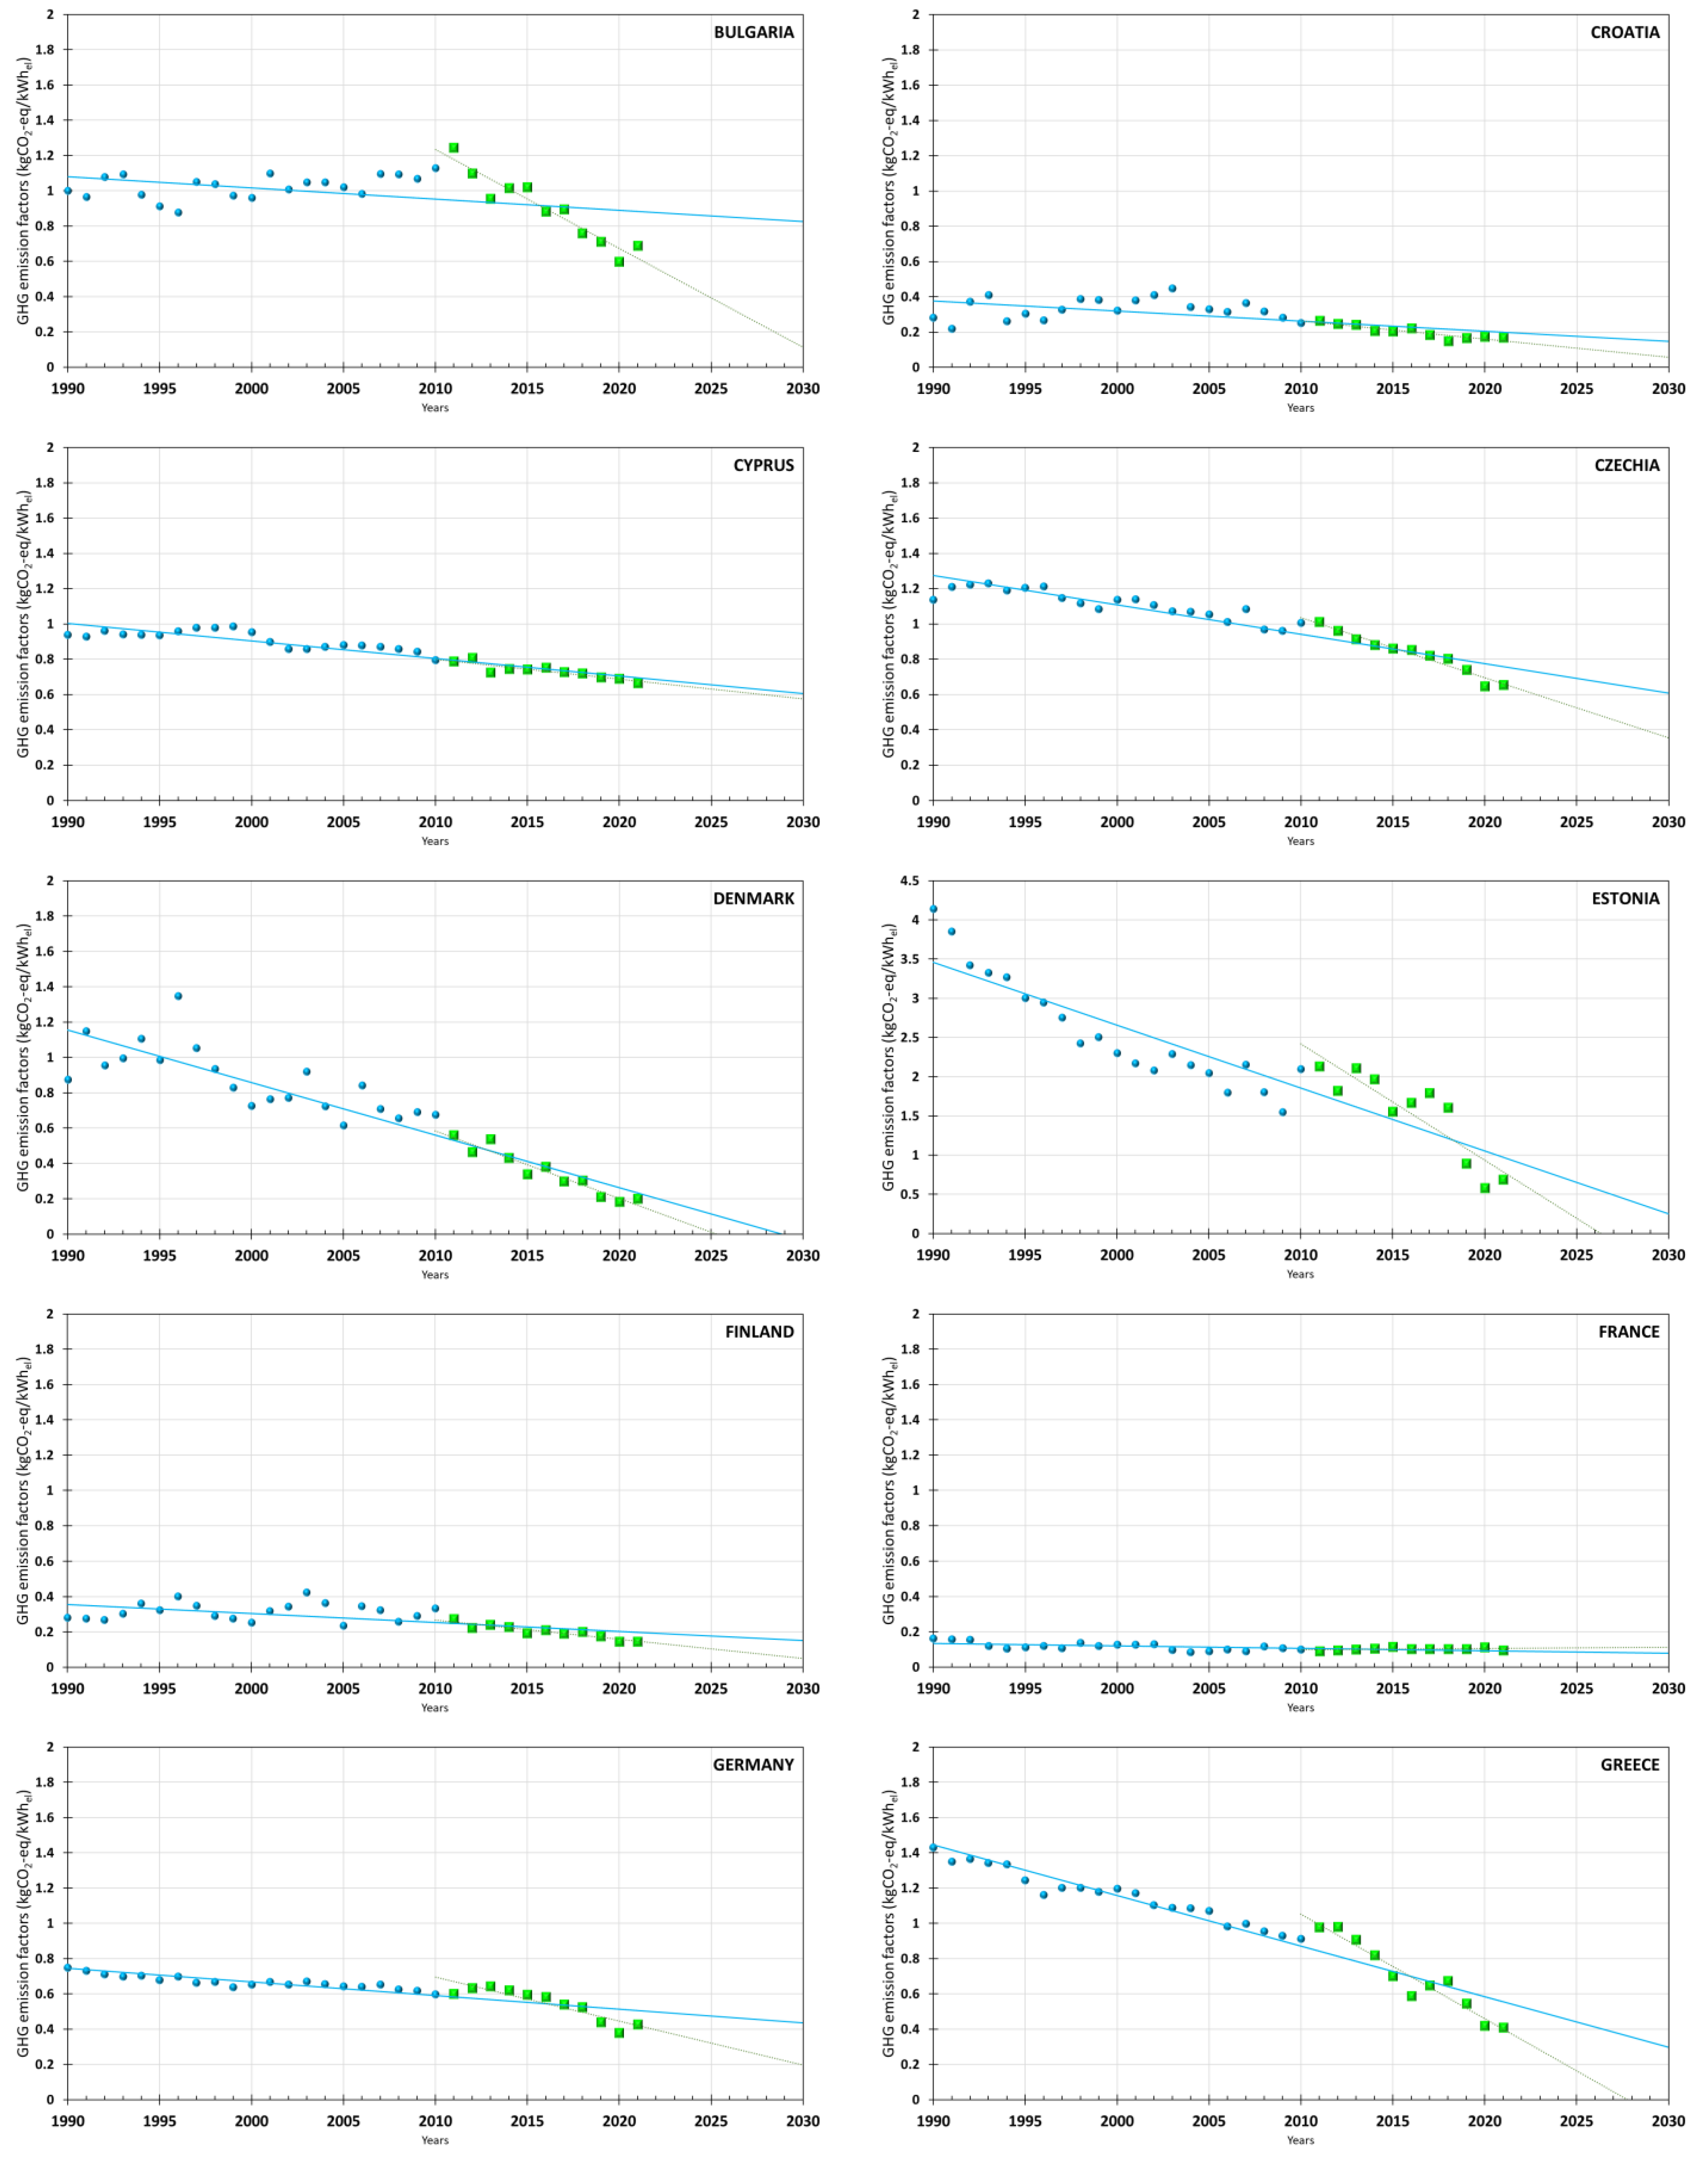
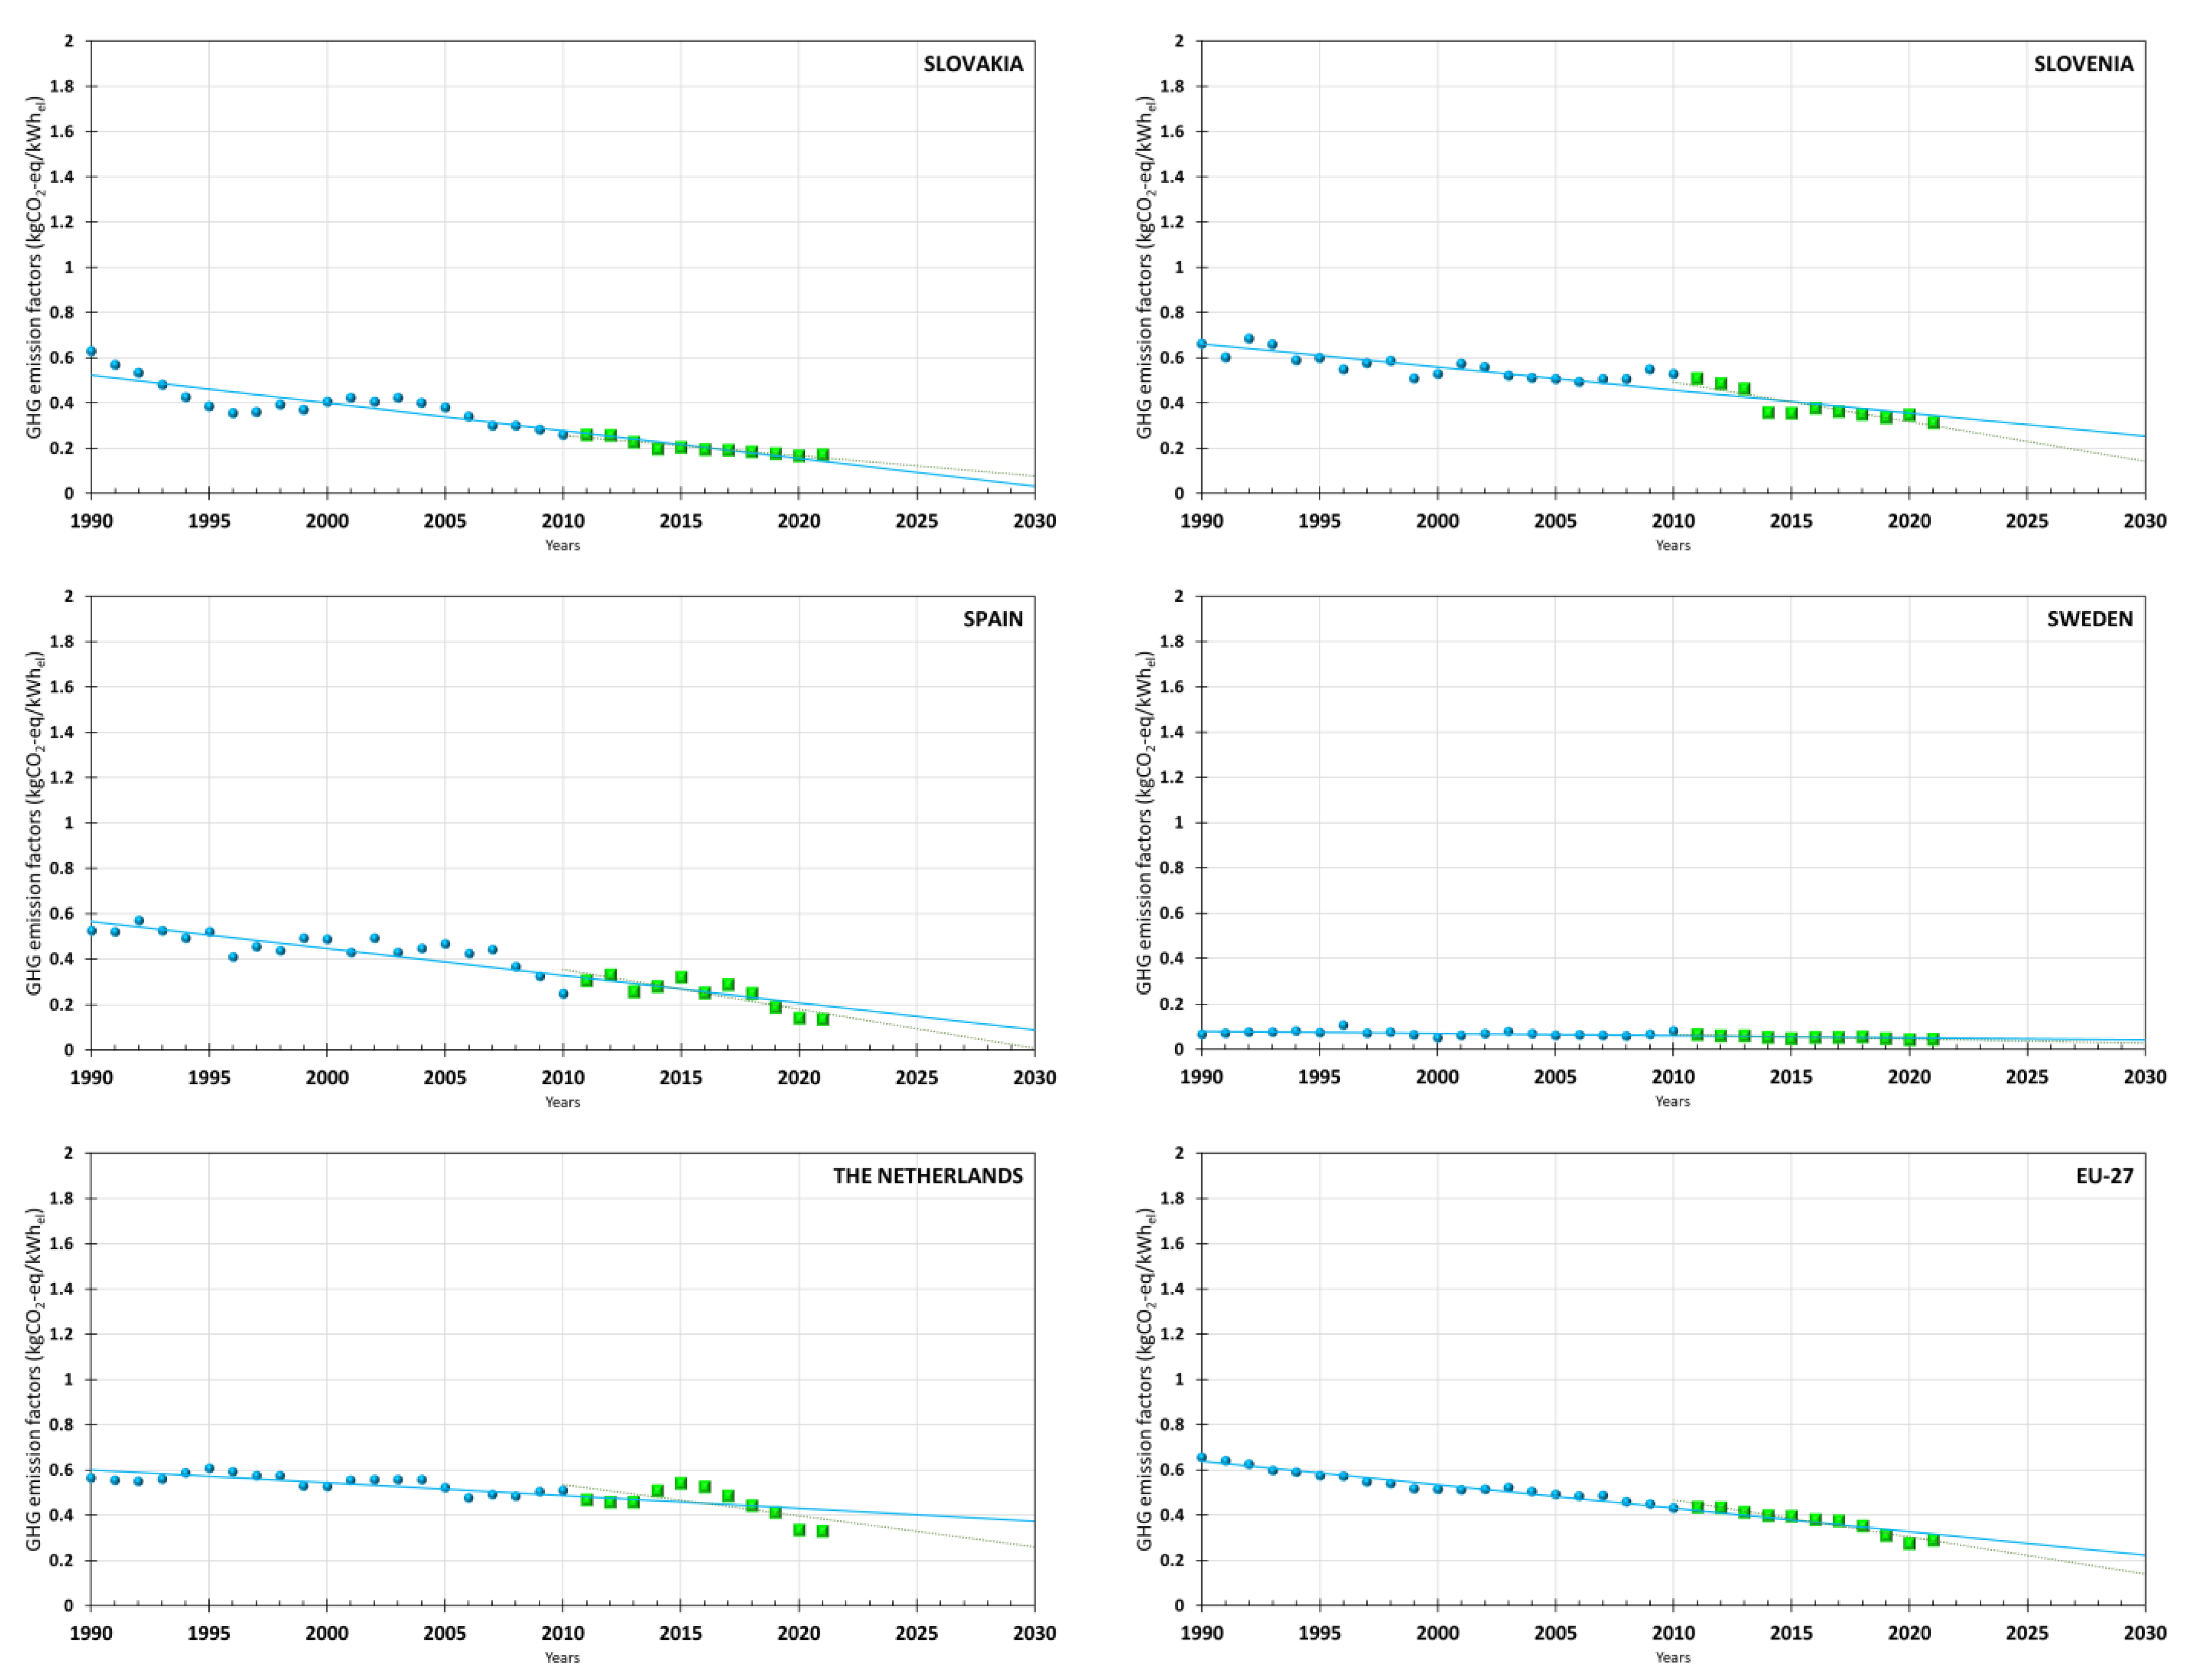
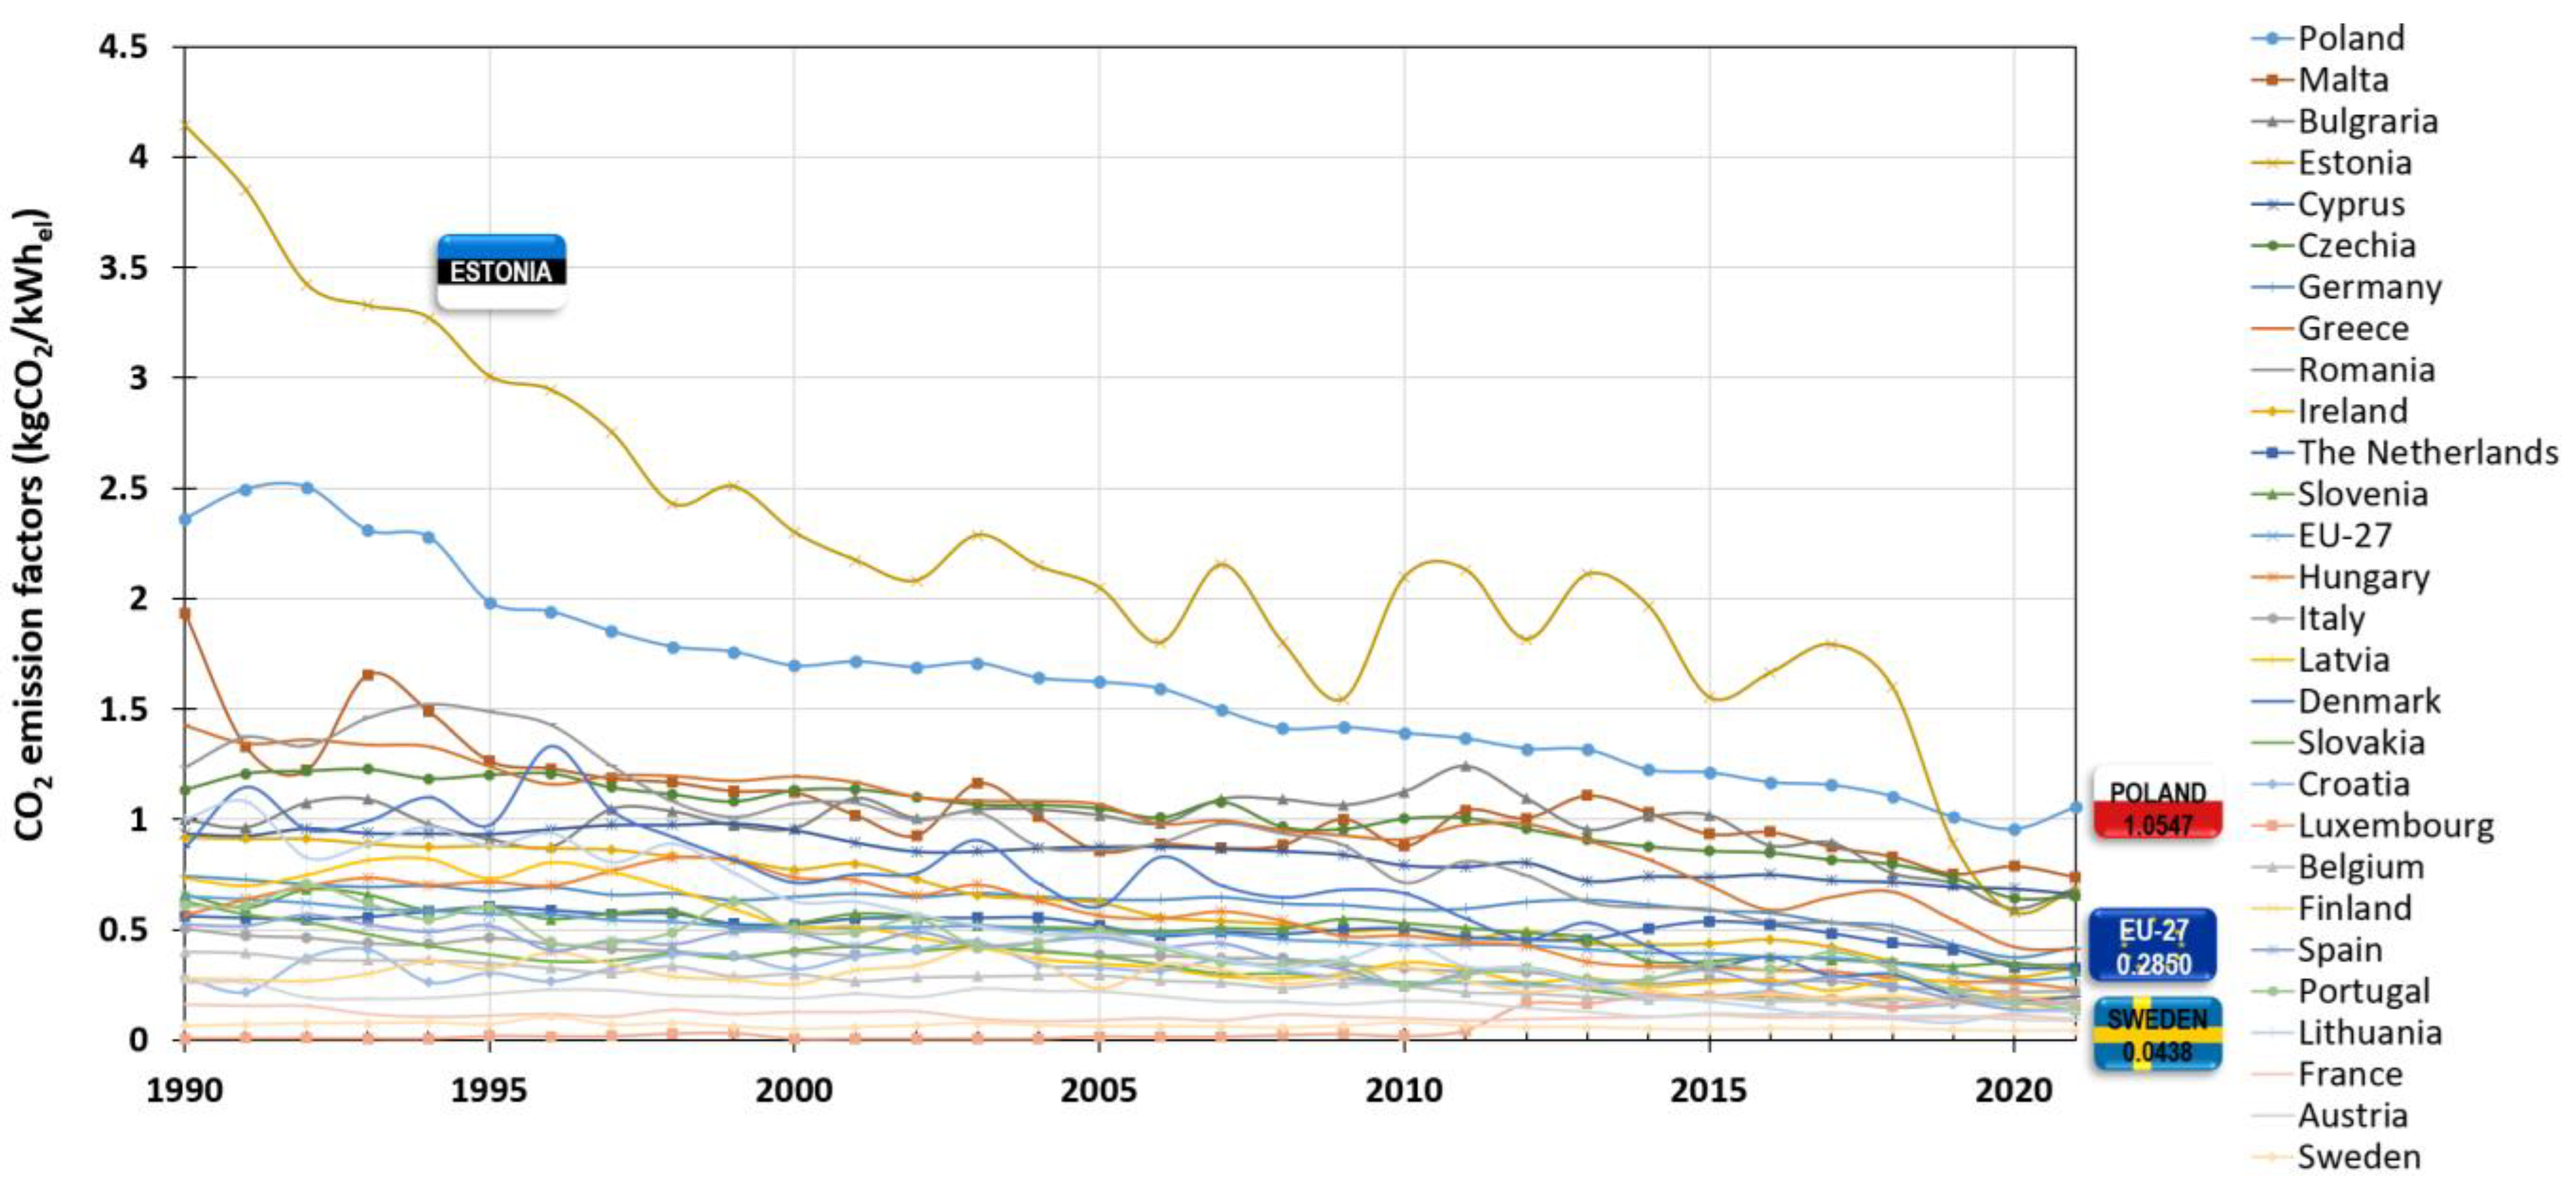
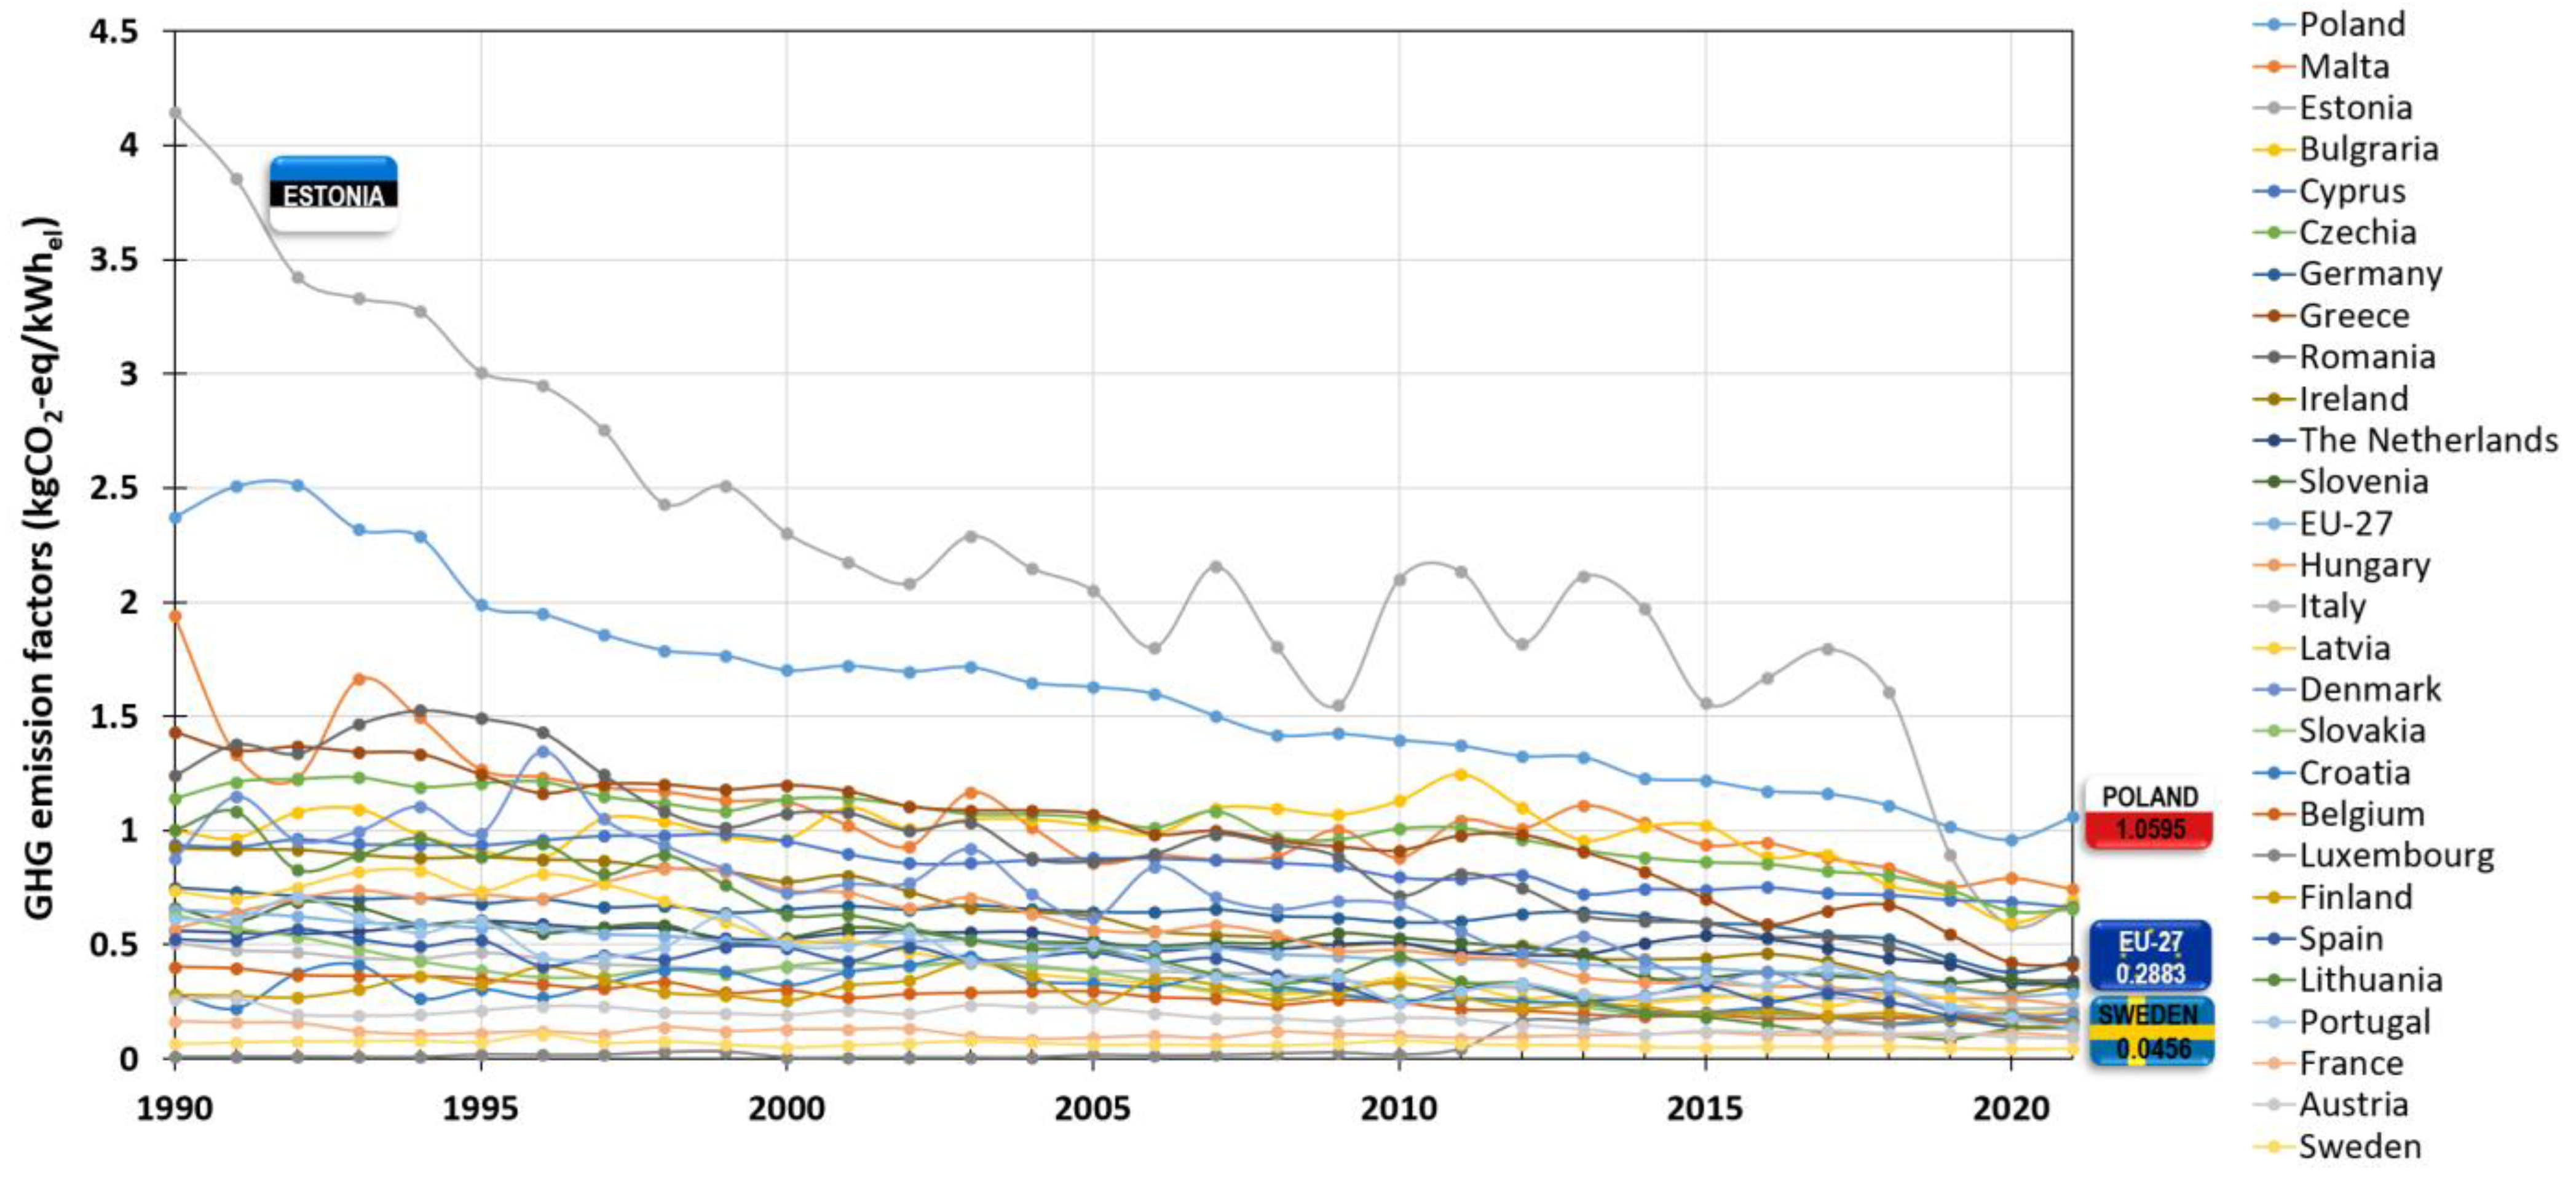
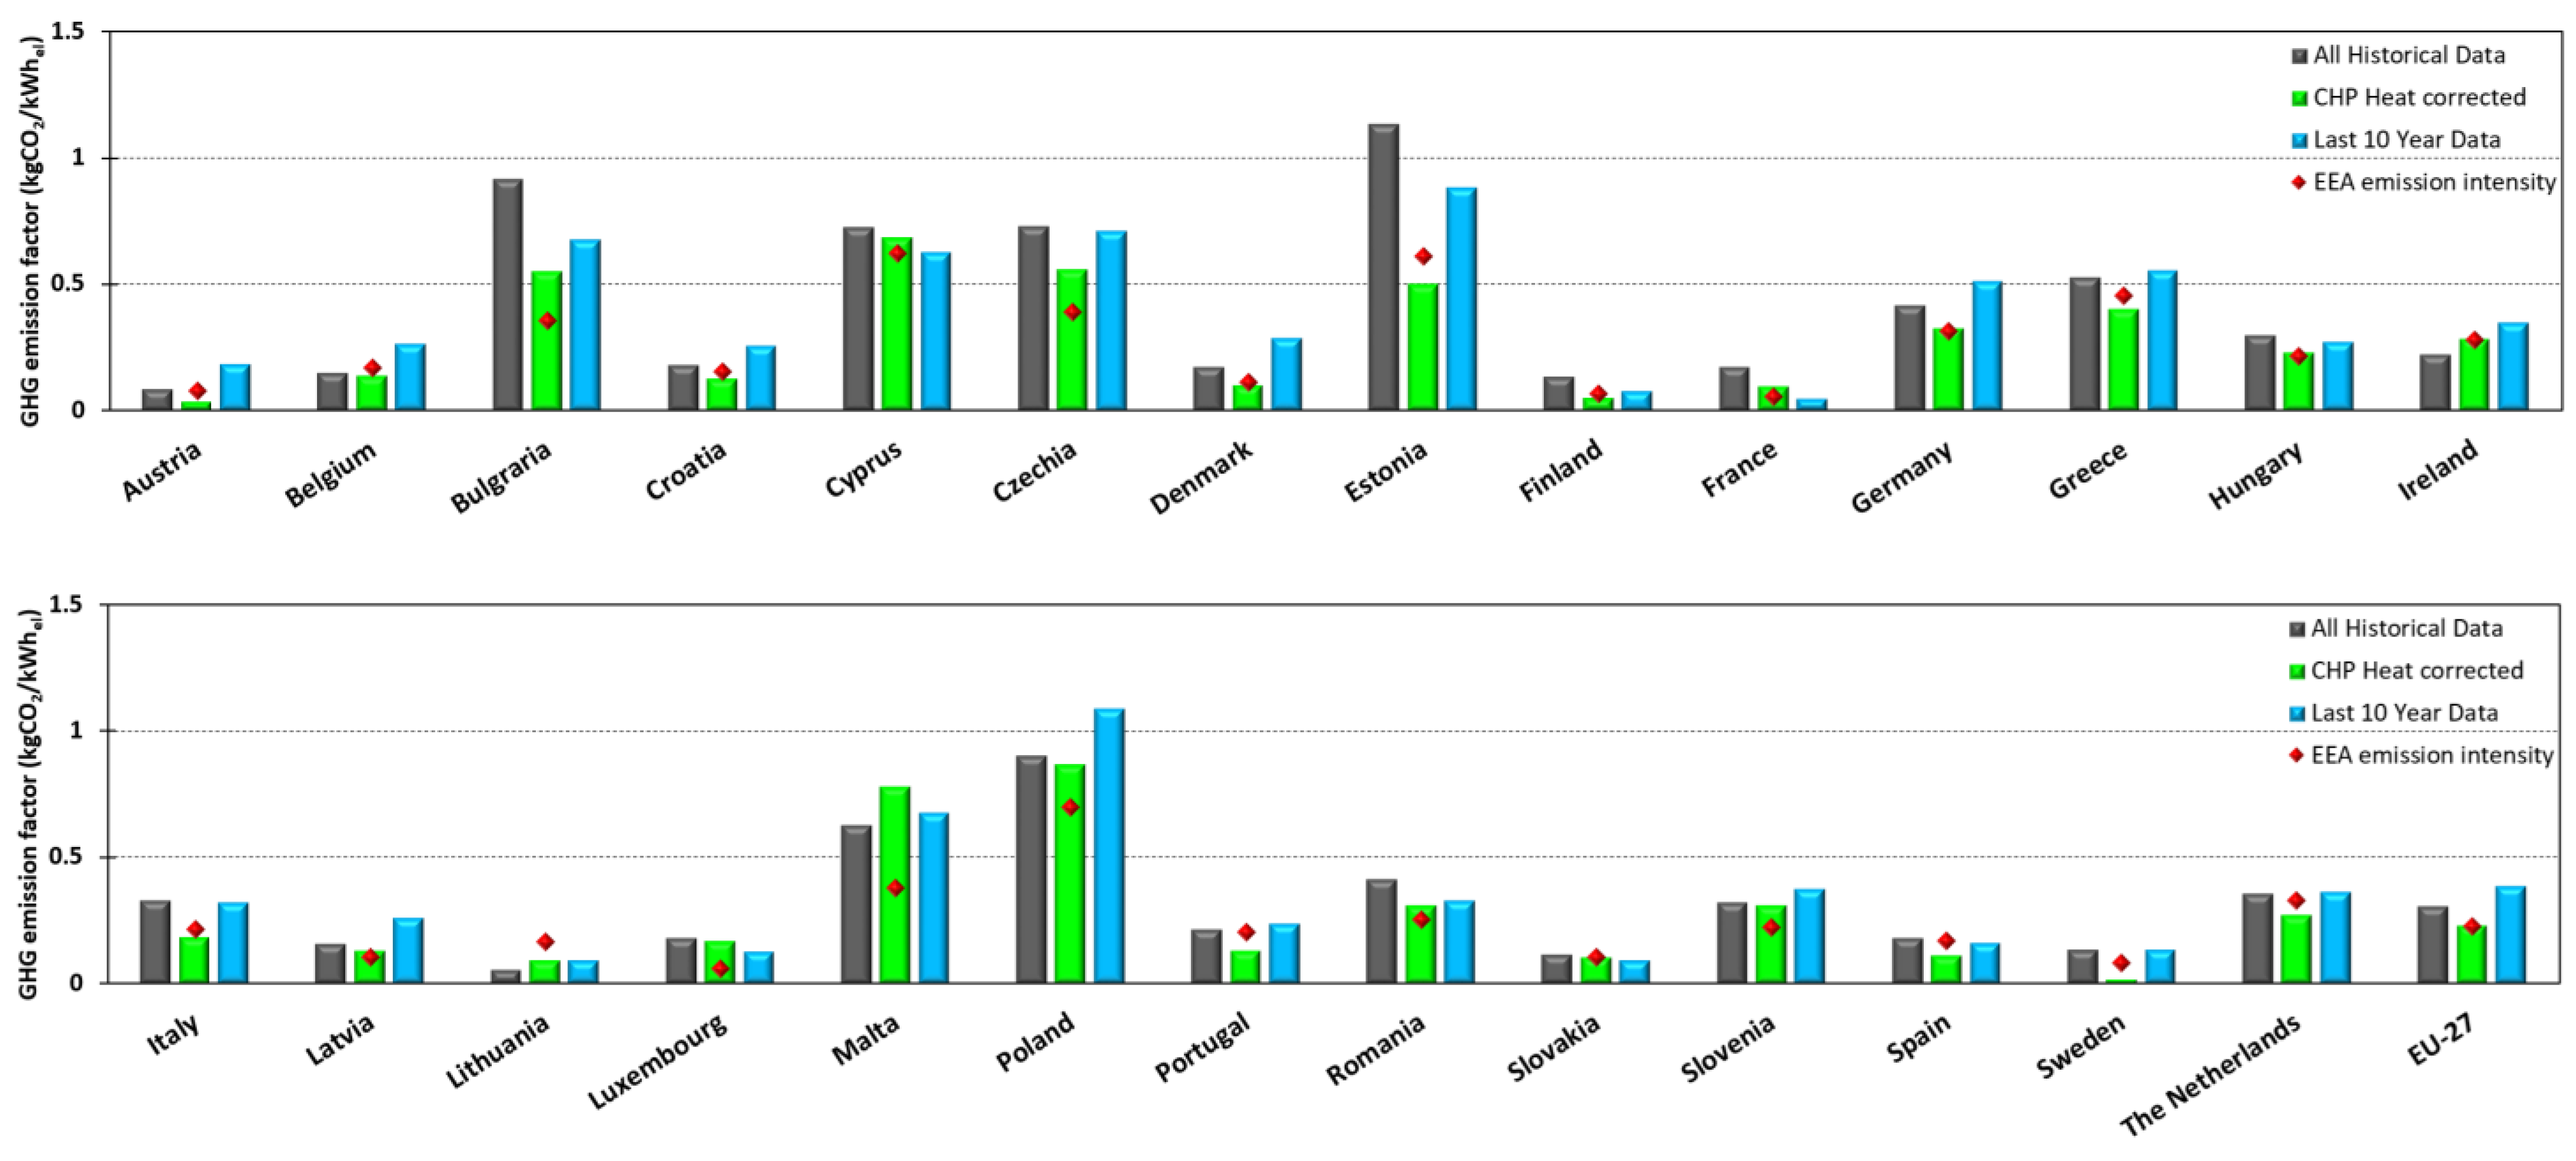
3.1. Emissions Factors
3.2. Trends and Correlations
4. Discussion
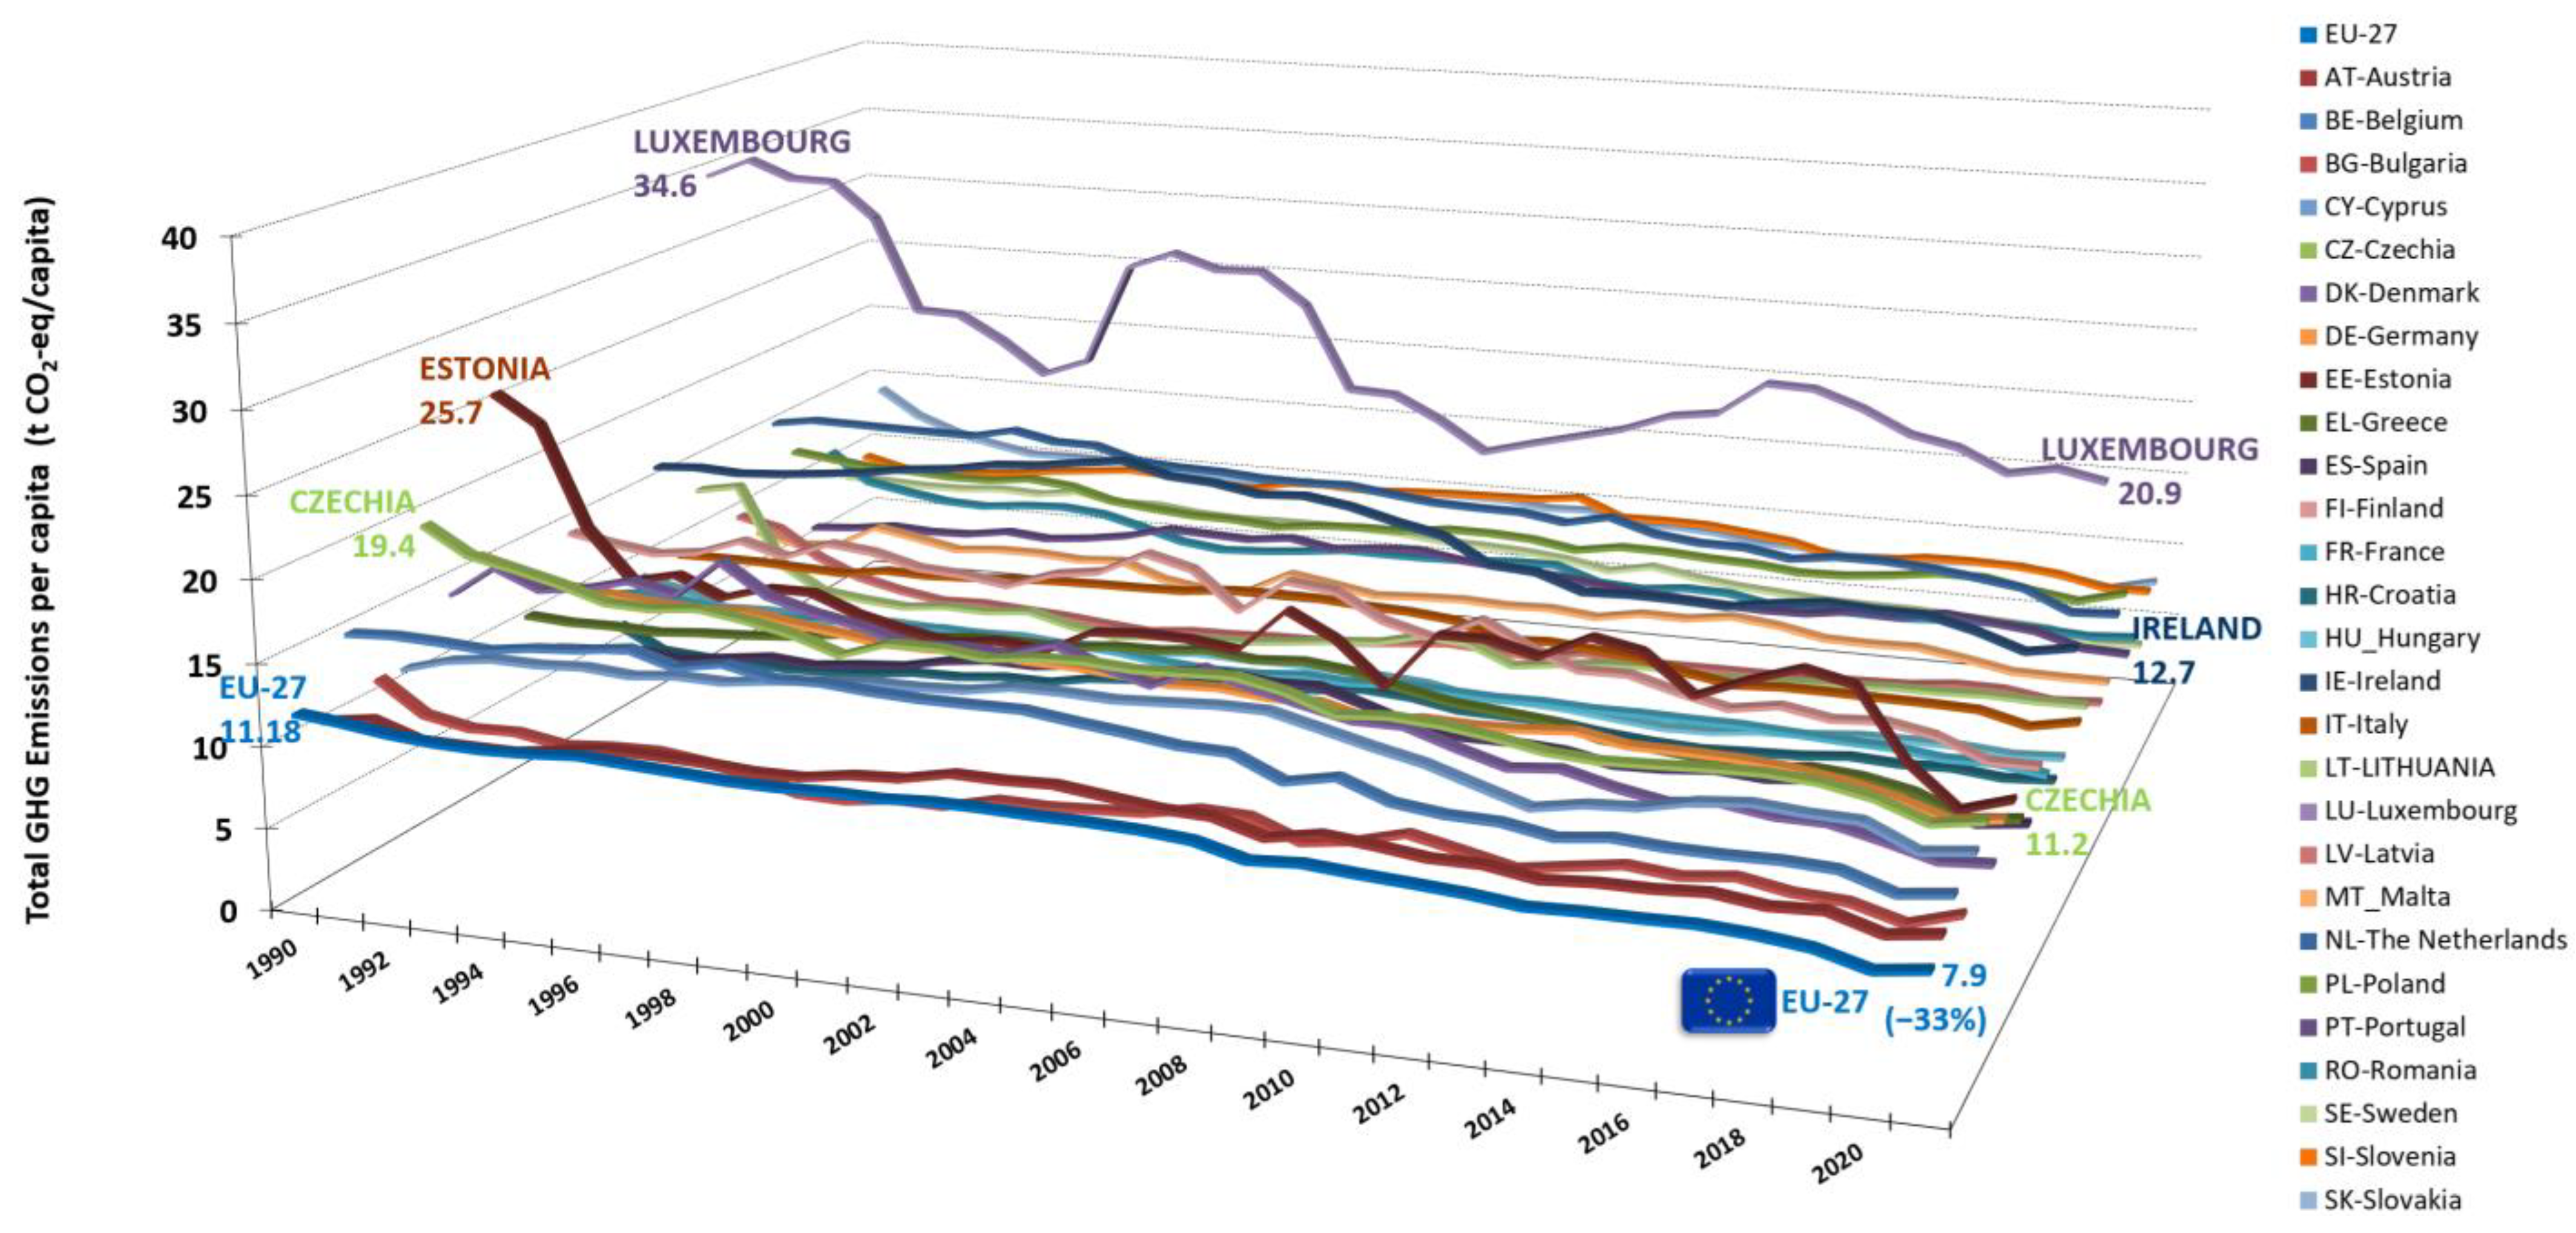
Emissions from the European Building Stock
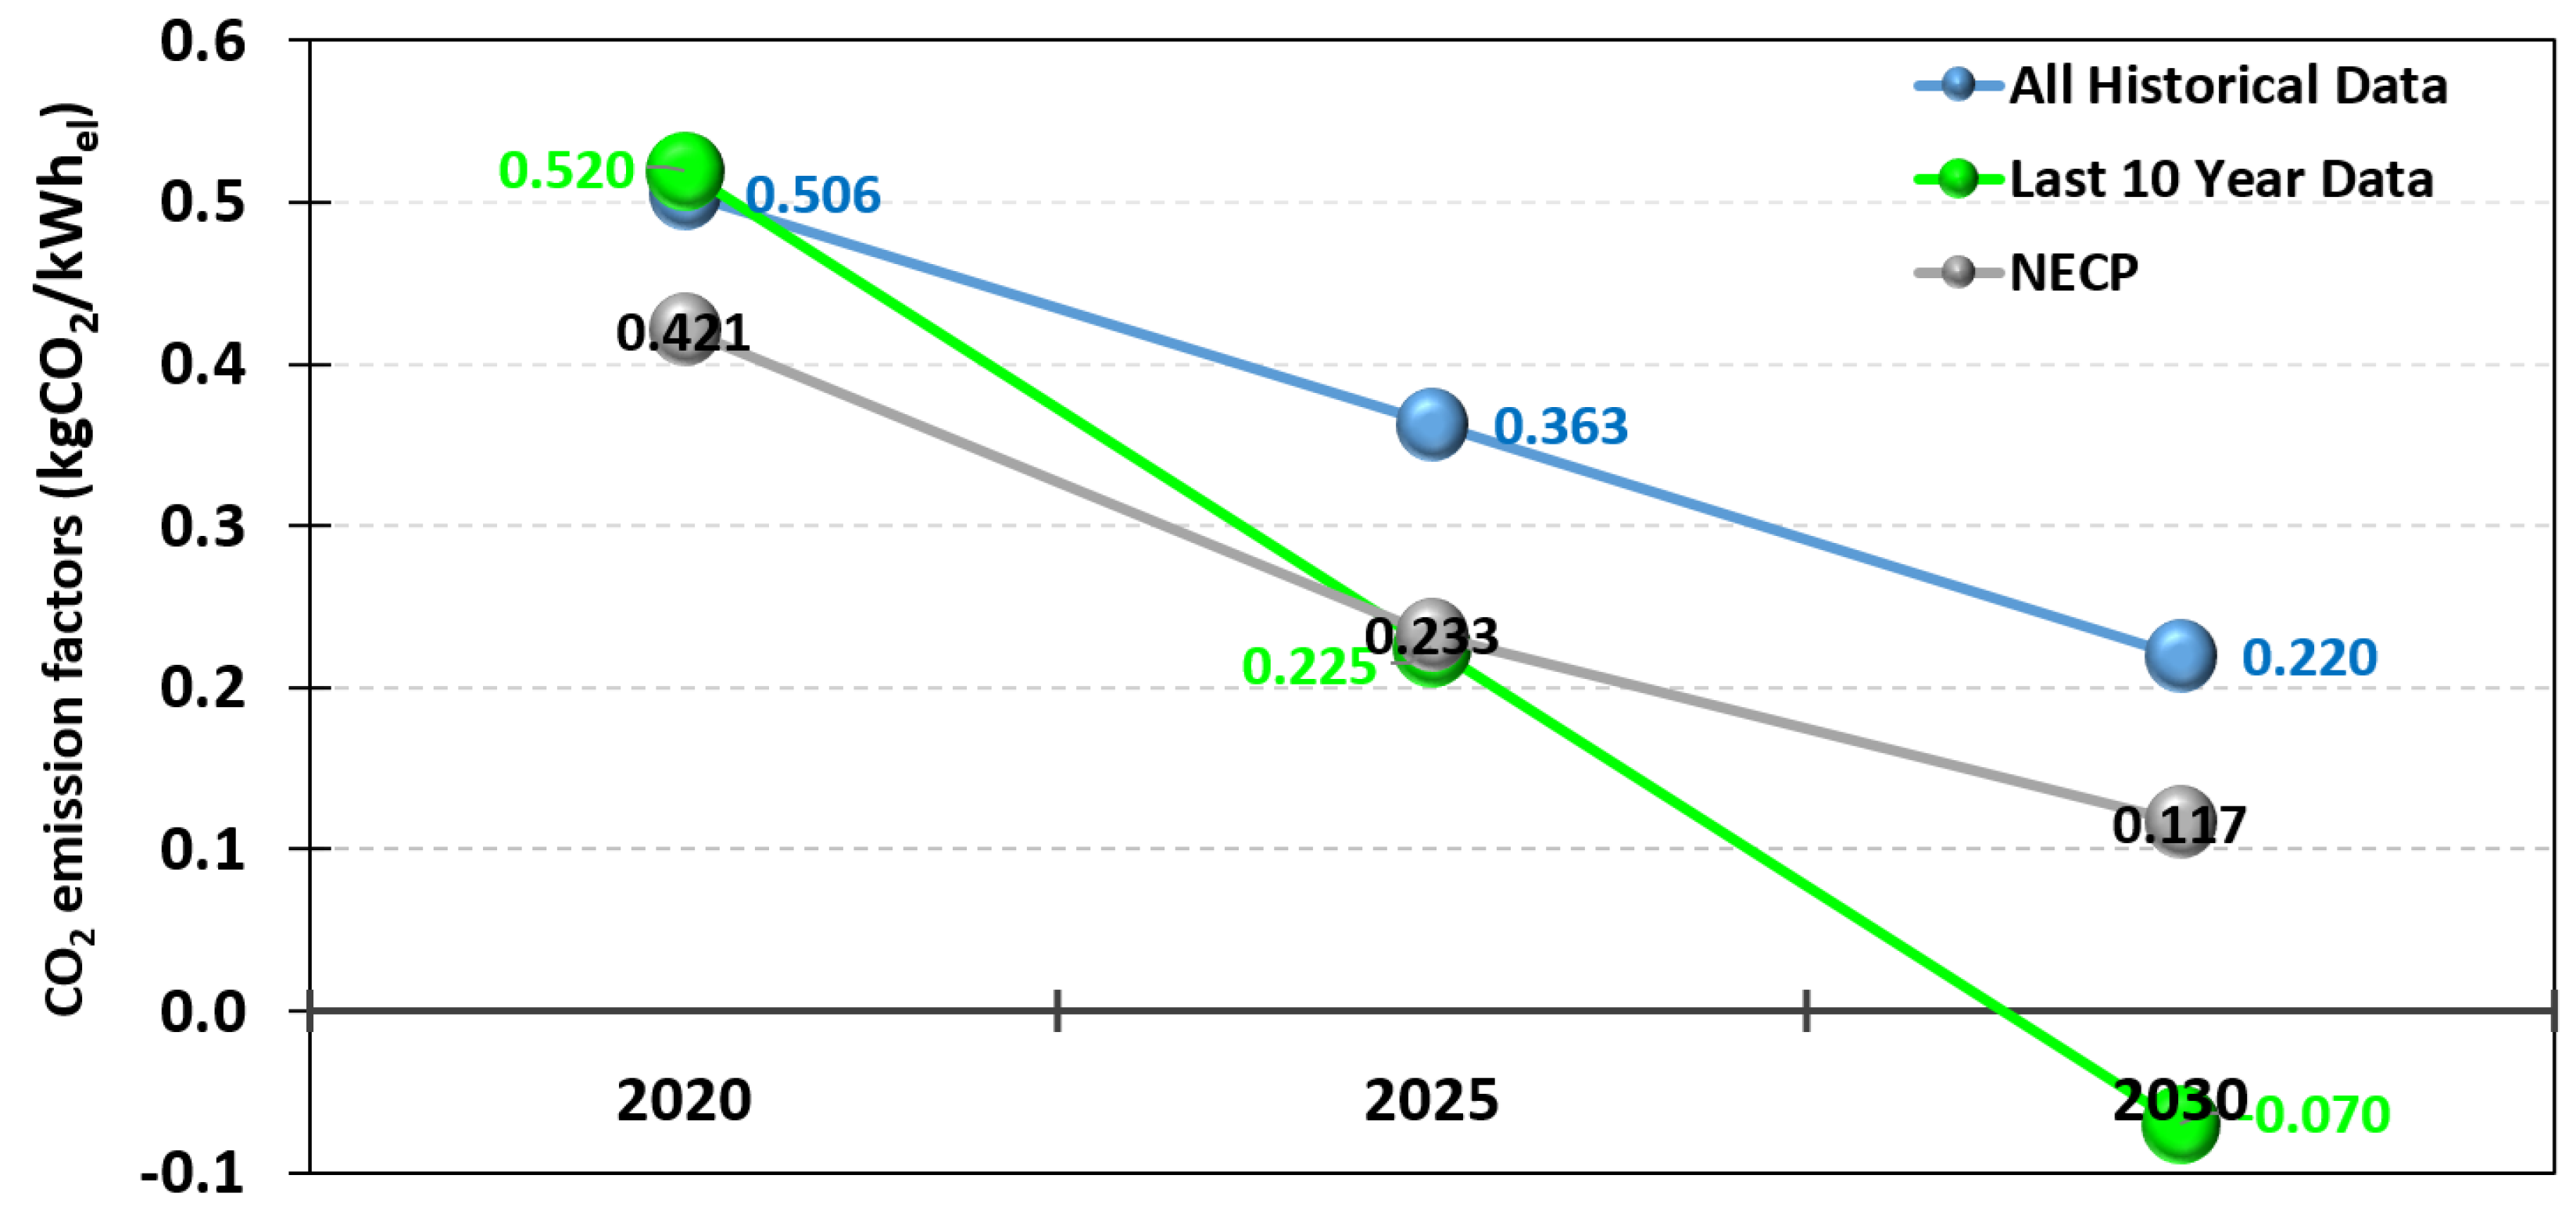
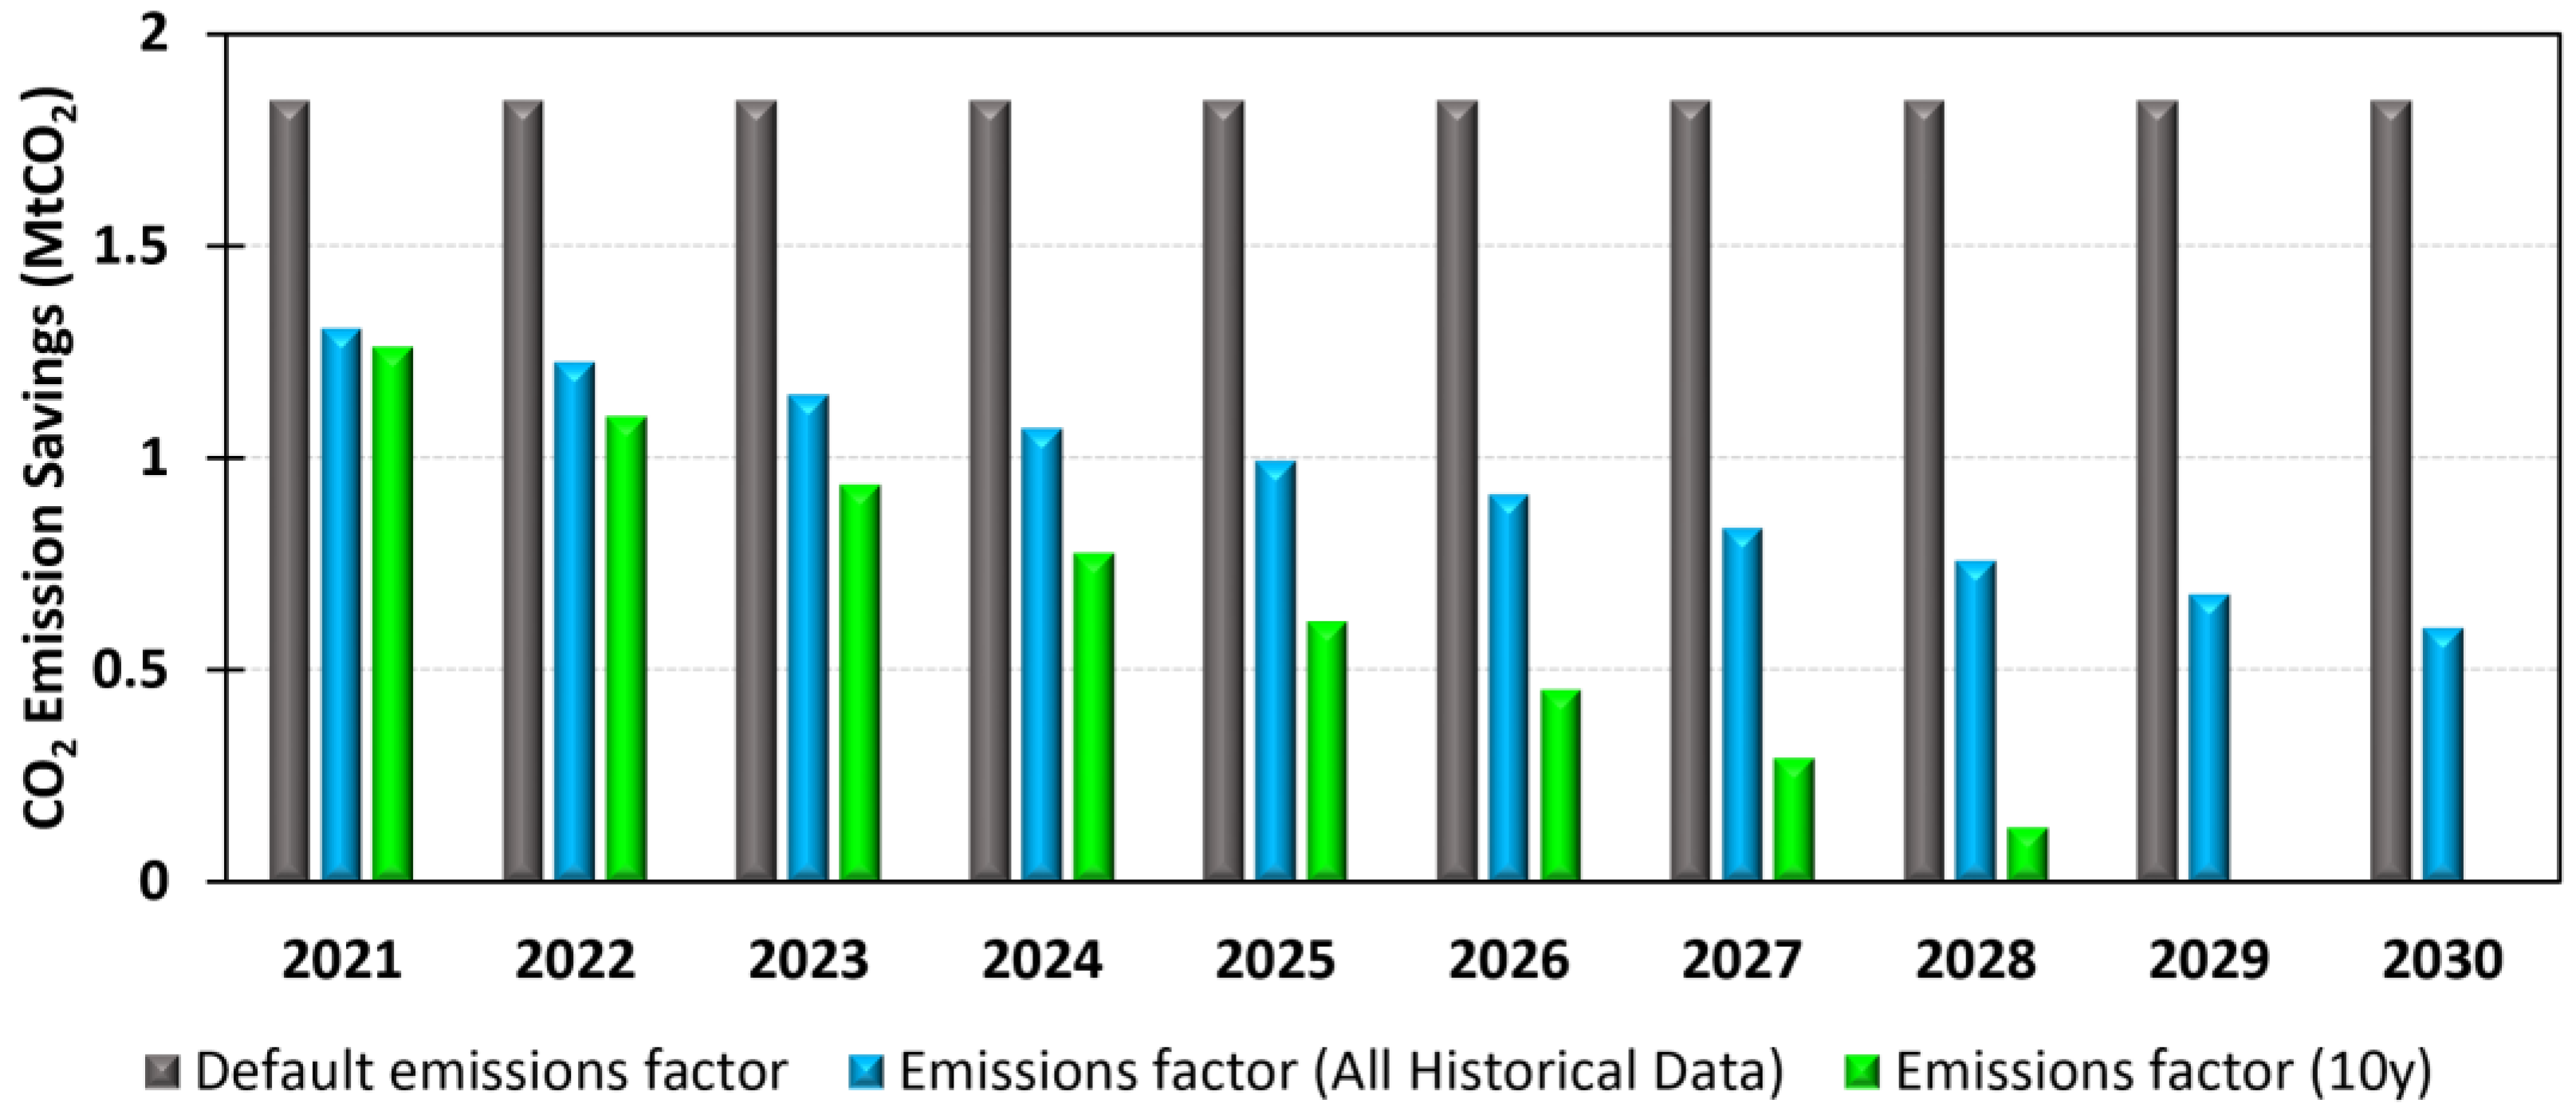
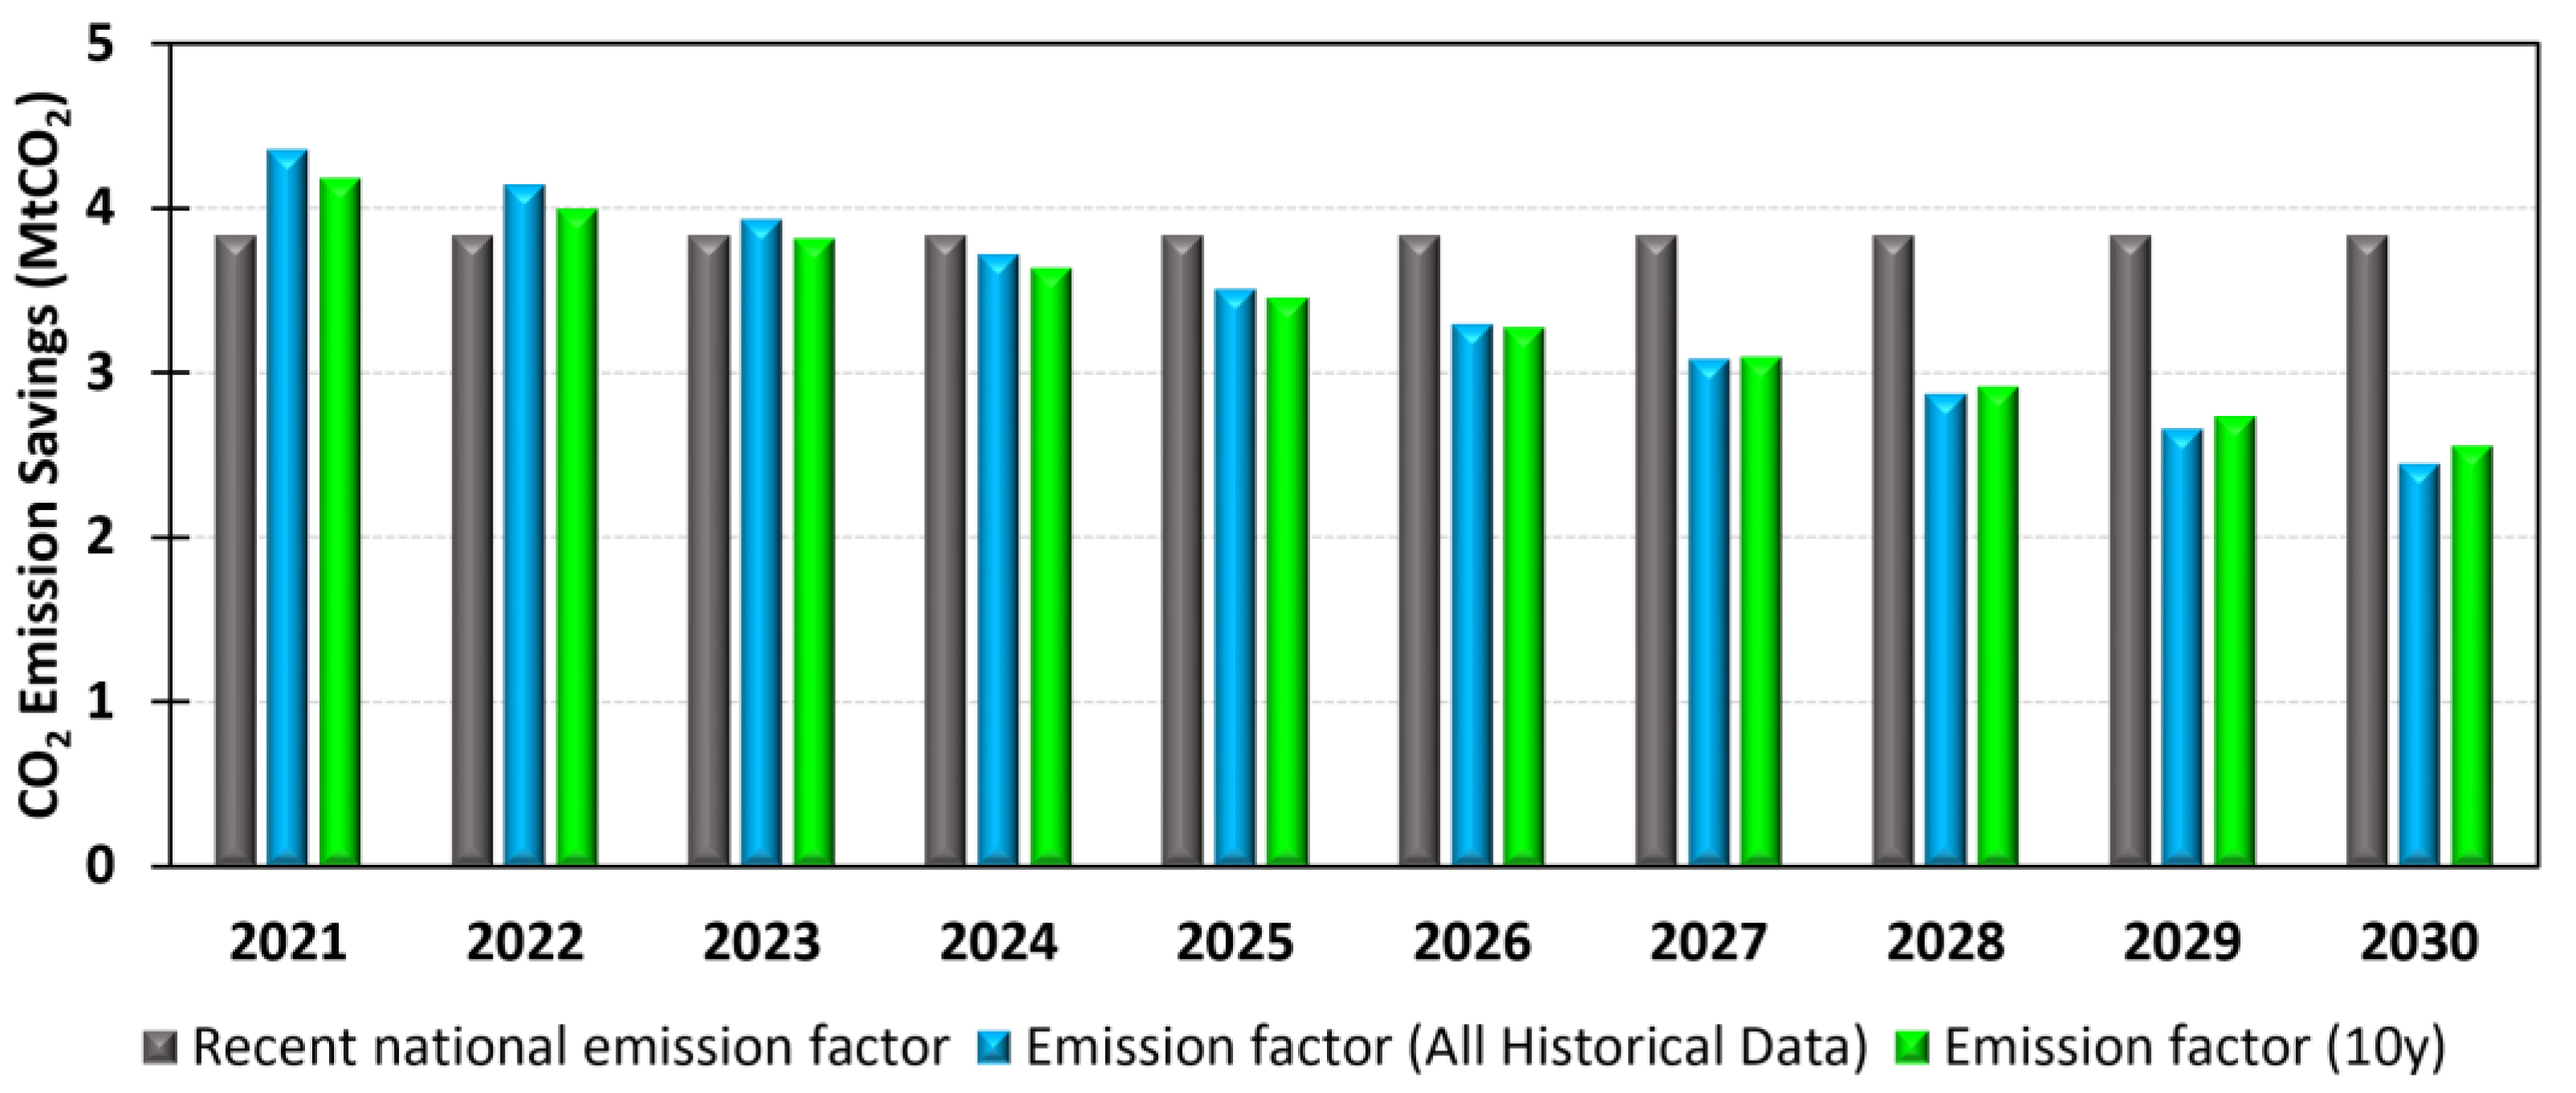
5. Case Studies on Future Projections
5.1. Hellenic Buildings
5.2. Polish Buildings
6. Limitations
6.1. Accounting for CHP Heat Bonus
7. Conclusions
Future Work
Author Contributions
Funding
Data Availability Statement
Acknowledgments
Conflicts of Interest
Abbreviations
| CEF | carbon emissions factors |
| CH4 | methane |
| CO2 | carbon dioxide |
| CO2-eq | carbon dioxide equivalents |
| CHP | combined heat and power |
| GHG | greenhouse gases |
| EEA | European Environment Agency |
| EED | Energy Efficiency Directive |
| EPBD | Energy Performance of Buildings Directive |
| el | electricity |
| EU | European Union |
| EU-27 | European Union 27 Member States |
| FEC | final electricity consumption |
| GEF | greenhouse gas emissions factors |
| GDP | gross domestic product |
| HFC | hydrofluorocarbon |
| IPCC | Intergovernmental Panel on Climate Change |
| kWhel | kilowatt hour electricity |
| LCA | life cycle assessment |
| LULUCF | land use, land use change and forestry |
| Mtoe | million tonnes of oil equivalent |
| N2O | nitrous oxide |
| NECP | National Energy and Climate Plan |
| NF3 | nitrogen trifluoride |
| PFC | perfluorocarbons |
| PJ | PetaJoule |
| RED | Renewable Energy Directive |
| SF6 | sulfur hexafluoride |
| T&D | transmission and distribution |
| TWh | TeraWatt hour |
Appendix A
Appendix B

References
- 2050 Long-Term Strategy, Climate Strategies & Targets, European Union. Available online: https://climate.ec.europa.eu/eu-action/climate-strategies-targets/2050-long-term-strategy_en (accessed on 9 September 2023).
- EU Climate Law-Regulation (EU) 2021/1119 of the European Parliament and of the Council of 30 June 2021 Establishing the Framework for Achieving Climate Neutrality and Amending Regulations (EC) No 401/2009 and (EU) 2018/1999. Brussels: Official Journal of the European Union, L 243. 9 July. 2021. Available online: http://data.europa.eu/eli/reg/2021/1119/oj (accessed on 9 September 2023).
- Energy Datasheets: EU Countries, Energy Statistics, European Commission, DG Energy, Unit A4. Available online: https://energy.ec.europa.eu/data-and-analysis/eu-energy-statistical-pocketbook-and-country-datasheets_en (accessed on 21 May 2023).
- EEA. Annual European Union Greenhouse Gas Inventory 1990–2021 and Inventory Report 2023. EEA/PUBL/2023/044. European Environment Agency: Copenhagen, Denmark. 2023. Available online: https://www.eea.europa.eu//publications/annual-european-union-greenhouse-gas-2. (accessed on 9 September 2023).
- RED. Renewable Energy Directive, European Commission. 2022. Available online: https://energy.ec.europa.eu/topics/renewable-energy/renewable-energy-directive-targets-and-rules/renewable-energy-directive_en (accessed on 9 September 2023).
- Zhang, X.; Zhu, Q.; Zhang, X. Carbon Emission Intensity of Final Electricity Consumption: Assessment and Decomposition of Regional Power Grids in China from 2005 to 2020. Sustainability 2023, 15, 9946. [Google Scholar] [CrossRef]
- EPA. Inventory of U.S. Greenhouse Gas Emissions and Sinks: 1990–2021. U.S. Environmental Protection Agency, EPA 430-R-23-002. 2023. Available online: https://www.epa.gov/system/files/documents/2023-04/US-GHG-Inventory-2023-Main-Text.pdf (accessed on 9 September 2023).
- Dhakal, S.; Minx, J.C.; Toth, F.L.; Abdel-Aziz, A.; Figueroa Meza, M.J.; Hubacek, K.; Jonckheere, I.G.C.; Kim, Y.-G.; Nemet, G.F.; Pachauri, S.; et al. Emissions Trends and Drivers. In IPCC, 2022: Climate Change 2022: Mitigation of Climate Change. Contribution of Working Group III to the Sixth Assessment Report of the Intergovernmental Panel on Climate Change; Shukla, P.R., Skea, J., Slade, R., Al Khourdajie, A., van Diemen, R., McCollum, D., Pathak, M., Some, S., Vyas, P., Fradera, R., et al., Eds.; Cambridge University Press: Cambridge, UK; New York, NY, USA. [CrossRef]
- Kolasa-Więcek, A.; Pilarska, A.A.; Wzorek, M.; Suszanowicz, D.; Boniecki, P. Modeling the Consumption of Main Fossil Fuels in Greenhouse Gas Emissions in European Countries, Considering Gross Domestic Product and Population. Energies 2023, 16, 7906. [Google Scholar] [CrossRef]
- Cellura, M.; Cusenza, M.A.; Longo, S. Energy-related GHG emissions balances: IPCC versus LCA. Sci. Total Environ. 2018, 628–629, 1328–1339. [Google Scholar] [CrossRef] [PubMed]
- Arioli, M.S.; D’Agosto, M.A.; Amaral, F.G.; Cybis, H.B.B. The evolution of city-scale GHG emissions inventory methods: A systematic review. Environ. Impact Assess. Rev. 2020, 80, 106316. [Google Scholar] [CrossRef]
- Bastos, J.; Lo Vullo, E.; Muntean, M.; Duerr, M.; Kona, A.; Bertoldi, P.; GHG Emission Factors for Electricity Consumption. European Commission, Joint Research Centre (JRC) [Dataset] PID. 2020. Available online: http://data.europa.eu/89h/919df040-0252-4e4e-ad82-c054896e1641 (accessed on 9 September 2023).
- Scarlat, N.; Prussi, M.; Padella, M. Quantification of the carbon intensity of electricity produced and used in Europe. Appl. Energy 2022, 305, 117901. [Google Scholar] [CrossRef]
- Wolf, I.; Holzapfel, P.K.R.; Henning, M.; Matthias, F. On the potential of temporally resolved GHG emission factors for load shifting: A case study on electrified steam generation. Appl. Energy 2023, 348, 121433. [Google Scholar] [CrossRef]
- Goldsworthy, M.; Aryai, V. On the use of time varying marginal and time varying average emissions factors in building energy analysis. Sustain. Energy Grids Netw. 2023, 35, 101103. [Google Scholar] [CrossRef]
- Emissions and Generation Resource Integrated Database (eGRID), United States Environmental Protection Agency. Available online: https://www.epa.gov/egrid (accessed on 7 December 2023).
- EU. Energy Balance Flow for European Union (27 Countries) 2021; European Commission: Brussels, Belgium, 2021; Available online: https://ec.europa.eu/eurostat/cache/sankey/energy/sankey.html (accessed on 25 July 2023).
- Jones, D. European Electricity Review 2023; Ember: London, UK; Available online: https://ember-climate.org/insights/research/european-electricity-review-2023/ (accessed on 4 July 2023).
- Latosov, E.; Umbleja, S.; Volkova, A. CO2 emission intensity of the Estonian DH sector. Smart Energy 2022, 6, 100070. [Google Scholar] [CrossRef]
- EEA. Greenhouse Gas Emission Intensity of Electricity Generation in Europe; European Environment Agency: Copenhagen, Denmark. Available online: https://www.eea.europa.eu/en/analysis/indicators/greenhouse-gas-emission-intensity-of-1?activeAccordion=546a7c35-9188-4d23-94ee-005d97c26f2b (accessed on 10 November 2023).
- Greenhouse Gas Emission Intensity of Electricity Generation in Europe. Available online: https://www.eea.europa.eu/ims/greenhouse-gas-emission-intensity-of-1 (accessed on 20 July 2023).
- Balaras, C.A.; Dascalaki, E.G.; Psarra, I.; Cholewa, T. Primary Energy Factors for Electricity Production in Europe. Energies 2023, 16, 93. [Google Scholar] [CrossRef]
- National Energy and Climate Plan; Hellenic Republic, Ministry of the Environment and Energy: Athens, Greece. 2019. Available online: https://ec.europa.eu/info/energy-climate-change-environment/implementation-eu-countries/energy-and-climate-governance-and-reporting/national-energy-and-climate-plans_en (accessed on 9 September 2023).
- Dascalaki, E.G.; Balaras, C.A.; Gaglia, A.G.; Droutsa, K.G.; Kontoyiannidis, S. Energy Performance of Buildings—EPBD in Greece. Energy Policy 2012, 45, 469–477. [Google Scholar] [CrossRef]
- Electricity Maps ApS, Copenhagen, Denmark. Available online: https://www.electricitymaps.com/ (accessed on 20 July 2023).
- Balaras, C.A.; Gaglia, A.G.; Georgopoulou, E.; Mirasgedis, S.; Sarafidis, Y.; Lalas, D.P. European Residential Buildings and Empirical Assessment of the Hellenic Building Stock, Energy Consumption, Emissions & Potential Energy Savings. Build. Environ. 2007, 42, 1298–1314. [Google Scholar] [CrossRef]
- Gaglia, A.G.; Balaras, C.A.; Mirasgedis, S.; Georgopoulou, E.; Sarafidis, Y.; Lalas, D.P. Empirical Assessment of the Hellenic Non-Residential Building Stock, Energy Consumption, Emissions and Potential Energy Savings. Energy Convers. Manag. 2007, 48, 1160–1175. [Google Scholar] [CrossRef]
- Act of 17 July 2009 on the Management of Emissions of Greenhouse Gases and Other Substances, Official Journal of the Laws of 2018, Item 1201 (consolidated Act, as Amended). Available online: https://www.gov.pl/attachment/270be6b8-df12-4e51-8e86-d87d956c42ec (accessed on 9 September 2023).
- Bebkiewicz, K.; Chłopek, Z.; Kargulewicz, I.; Olecka, A.; Rutkowski, J.; Skośkiewicz, J.; Szczepański, K.; Walęzak, M.; Waśniewska, S.; Zakrzewska, D.; et al. Poland’s National Inventory Report 2023, Greenhouse Gas Inventory for 1988–2021, Submission under the United Nations Framework Convention on Climate Change, Warsaw. 2023. Available online: https://cdr.eionet.europa.eu/pl/eu/mmr/art07_inventory/ghg_inventory/envzckvq/NIR_2023_POL.pdf (accessed on 9 September 2023).
- Gawlik, L.; Mokrzycki, E. Changes in the Structure of Electricity Generation in Poland in View of the EU Climate Package. Energies 2019, 12, 3323. [Google Scholar] [CrossRef]
- Pisarski, Z.; Serzysko, A.; Zborowska, I.; Żabicka, J. (Eds.) Eighth National Communication and Fifth Biennial Report Under the United Nations Framework Convention on Climate Change; National Centre for Emissions Management: Warsaw, Poland, 2022; Available online: https://unfccc.int/sites/default/files/resource/Poland_Report-NC8_BR5_27dec2022%20%281%29.pdf (accessed on 9 September 2023).
- National Energy Efficiency Action Plan for Poland; Polish Ministry of Energy: Warsaw, Poland. 2017. Available online: https://energy.ec.europa.eu/system/files/2018-07/pl_building_renov_2017_annex_3_of_the_neeap_en_0.pdf (accessed on 9 September 2023).
- Delangle, A.; Lambert, R.S.C.; Shah, N.; Acha, A.; Markides, C.N. Modelling and optimising the marginal expansion of an existing district heating network. Energy 2017, 140, 209–223. [Google Scholar] [CrossRef]
- Fiaschi, D.; Manfrida, G.; Mendecka, B.; Tosti, L.; Parisi, M.L. A Comparison of Different Approaches for Assessing Energy Outputs of Combined Heat and Power Geothermal Plants. Sustainability 2021, 13, 4527. [Google Scholar] [CrossRef]
- Lo Vullo, E.; Monforti-Ferrario, F.; Palermo, V.; Bertoldi, P. Greenhouse Gases Emission Factors for Local Emission Inventories; Joint Research Centre: Luxembourg, Luxembourg, 2022; Available online: https://op.europa.eu/en/publication-detail/-/publication/983b3bcc-1920-11ed-8fa0-01aa75ed71a1 (accessed on 16 November 2023).
- Peters, J.F.; Iribarren, D.; Martel, P.J.; Burguillo, M. Hourly marginal electricity mixes and their relevance for assessing the environmental performance of installations with variable load or power. Sci. Total Environ. 2022, 843, 156963. [Google Scholar] [CrossRef] [PubMed]


| EU Member State | All Historical Data | Percentage Change (%) | Last 10-Year Data (10 y) | Percentage Change (%) |
|---|---|---|---|---|
| Austria | y = −0.0046x + 9.4614 R2 = 0.7803 | −66.2% | y = −0.0061x + 12.443 R2 = 0.7318 | −48.9% |
| Belgium | y = −0.0074x + 15.134 R2 = 0.9579 | −60.7% | y = −0.0045x + 9.3403 R2 = 0.8097 | −27.2% |
| Bulgaria | y = −0.0063x + 13.661 R2 = 0.1866 | −31.3% | y = −0.056x + 113.7 R2 = 0.9034 | −44.7% |
| Croatia | y = −0.0057x + 11.729 R2 = 0.4275 | −40.8% | y = −0.0104x + 21.255 R2 = 0.8278 | −37.0% |
| Cyprus | y = −0.0099x + 20.656 R2 = 0.8834 | −29.3% | y = −0.0112x + 23.383 R2 = 0.803 | −15.8% |
| Czechia | y = −0.0166x + 34.379 R2 = 0.8998 | −42.5% | y = −0.034x + 69.349 R2 = 0.9558 | −35.2% |
| Denmark | y = −0.0296x + 60.083 R2 = 0.8615 | −77.5% | y = −0.0378x + 76.617 R2 = 0.9192 | −64.4% |
| Estonia | y = −0.0804x + 163.36 R2 = 0.84 | −83.5% | y = −0.1484x + 300.74 R2 = 0.7843 | −67.8% |
| Finland | y = −0.0051x + 10.513 R2 = 0.4581 | −49.3% | y = −0.0109x + 22.199 R2 = 0.8715 | −47.4% |
| France | y = −0.0013x + 2.7698 R2 = 0.3913 | −42.0% | y = 0.0008x − 1.4449 R2 = 0.1235 | 6.3% |
| Germany | y = −0.0079x + 16.486 R2 = 0.7566 | −43.6% | y = −0.025x + 50.868 R2 = 0.8266 | −29.5% |
| Greece | y = −0.0286x + 58.278 R2 = 0.93 | −71.4% | y = −0.059x + 119.7 R2 = 0.9288 | −58.1% |
| Hungary | y = −0.0177x + 36.022 R2 = 0.7971 | −59.7% | y = −0.0194x + 39.527 R2 = 0.9247 | −48.6% |
| Ireland | y = −0.0219x + 44.621 R2 = 0.9675 | −64.2% | y = −0.0185x + 37.754 R2 = 0.7878 | −28.6% |
| Italy | y = −0.0085x + 17.473 R2 = 0.9417 | −56.2% | y = −0.0089x + 18.22 R2 = 0.8647 | −28.6% |
| Latvia | y = −0.0213x + 43.192 R2 = 0.8602 | −72.9% | y = −0.0085x + 17.412 R2 = 0.5629 | −38.8% |
| Lithuania | y = −0.0325x + 65.699 R2 = 0.9514 | −87.0% | y = −0.024x + 48.622 R2 = 0.777 | −61.0% |
| Luxemburg | y = 0.0069x − 13.743 R2 = 0.6665 | 1852.1% | y = 0.0058x − 11.568 R2 = 0.1807 | 265.2% |
| Malta | y = −0.0222x + 45.52 R2 = 0.6382 | −61.7% | y = −0.0354x + 72.361 R2 = 0.8792 | −29.0% |
| Poland | y = −0.0451x + 92.074 R2 = 0.94 | −55.3% | y = −0.0384x + 78.496 R2 = 0.9222 | −22.8% |
| Portugal | y = −0.0138x + 28.153 R2 = 0.8115 | −78.1% | y = −0.0129x + 26.3 R2 = 0.3045 | −54.5% |
| Romania | y = −0.0355x + 72.145 R2 = 0.9249 | −72.5% | y = −0.0442x + 89.679 R2 = 0.9598 | −57.9% |
| Slovakia | y = −0.0123x + 24.958 R2 = 0.8832 | −72.9% | y = −0.009x + 18.278 R2 = 0.8598 | −34.1% |
| Slovenia | y = −0.0102x + 20.867 R2 = 0.8616 | −53.0% | y = −0.0175x + 35.615 R2 = 0.7648 | −38.8% |
| Spain | y = −0.0119x + 24.196 R2 = 0.8637 | −74.0% | y = −0.0172x + 35.009 R2 = 0.726 | −55.4% |
| Sweden | y = −0.001x + 2.0595 R2 = 0.5069 | −31.2% | y = −0.0018x + 3.7064 R2 = 0.782 | −31.5% |
| The Netherlands | y = −0.0057x + 11.93 R2 = 0.6487 | −41.7% | y = −0.0137x + 28.09 R2 = 0.428 | −29.9% |
| EU-27 | y = −0.0104x + 21.347 R2 = 0.9664 | −56.2% | y = −0.0163x + 33.241 R2 = 0.9274 | −34.0% |
| EU Member State | All Historical Data | Percentage Change (%) | Last 10-Year Data (10 y) | Percentage Change (%) |
|---|---|---|---|---|
| Austria | y = −0.0046x + 9.3806 R2 = 0.7765 | −65.7% | y = −0.0061x + 12.51 R2 = 0.7335 | −48.5% |
| Belgium | y = −0.0074x + 15.099 R2 = 0.9575 | −60.5% | y = −0.0045x + 9.3559 R2 = 0.8076 | −27.1% |
| Bulgaria | y = −0.0063x + 13.644 R2 = 0.1856 | −31.1% | y = −0.056x + 113.8 R2 = 0.9029 | −44.6% |
| Croatia | y = −0.0057x + 11.699 R2 = 0.425 | −40.3% | y = −0.0103x + 21.065 R2 = 0.8226 | −36.5% |
| Cyprus | y = −0.0099x + 20.724 R2 = 0.8835 | −29.3% | y = −0.0113x + 23.454 R2 = 0.8031 | −15.8% |
| Czechia | y = −0.0167x + 34.465 R2 = 0.8995 | −42.4% | y = −0.0341x + 69.596 R2 = 0.9557 | −35.2% |
| Denmark | y = −0.0298x + 60.371 R2 = 0.8585 | −76.9% | y = −0.0381x + 77.25 R2 = 0.919 | −64.0% |
| Estonia | y = −0.0802x + 163.14 R2 = 0.8392 | −83.3% | y = −0.1483x + 300.45 R2 = 0.7841 | −67.6% |
| Finland | y = −0.0051x + 10.441 R2 = 0.4509 | −48.5% | y = −0.011x + 22.299 R2 = 0.8709 | −47.0% |
| France | y = −0.0013x + 2.8042 R2 = 0.3955 | −42.1% | y = 0.0007x − 1.3627 R2 = 0.1094 | 5.8% |
| Germany | y = −0.0078x + 16.176 R2 = 0.747 | −42.9% | y = −0.0249x + 50.813 R2 = 0.8244 | −28.9% |
| Greece | y = −0.0287x + 58.503 R2 = 0.9301 | −71.4% | y = −0.0592x + 120.14 R2 = 0.9288 | −58.1% |
| Hungary | y = −0.0177x + 36.055 R2 = 0.797 | −59.5% | y = −0.0195x + 39.666 R2 = 0.9256 | −48.5% |
| Ireland | y = −0.022x + 44.667 R2 = 0.9679 | −64.1% | y = −0.0186x + 37.922 R2 = 0.7886 | −28.6% |
| Italy | y = −0.0085x + 17.502 R2 = 0.9419 | −56.2% | y = −0.0089x + 18.303 R2 = 0.8664 | −28.6% |
| Latvia | y = −0.0212x + 42.985 R2 = 0.8564 | −72.1% | y = −0.008x + 16.425 R2 = 0.5304 | −37.2% |
| Lithuania | y = −0.0324x + 65.442 R2 = 0.9505 | −86.3% | y = −0.0237x + 47.921 R2 = 0.7741 | −59.4% |
| Luxemburg | y = 0.0069x − 13.754 R2 = 0.6662 | 1731% | y = 0.0058x − 11.587 R2 = 0.1809 | 263% |
| Malta | y = −0.0264x + 53.956 R2 = 0.6177 | −61.8% | y = −0.0356x + 72.59 R2 = 0.8792 | −29.0% |
| Poland | y = −0.0453x + 92.409 R2 = 0.9398 | −55.3% | y = −0.0385x + 78.858 R2 = 0.9223 | −27.8% |
| Portugal | y = −0.0138x + 28.094 R2 = 0.8094 | −77.7% | y = −0.0129x + 26.297 R2 = 0.3021 | −54.2% |
| Romania | y = −0.0356x + 72.329 R2 = 0.9247 | −72.4% | y = −0.0444x + 90.018 R2 = 0.9598 | −57.9% |
| Slovakia | y = −0.0123x + 24.965 R2 = 0.8824 | −72.8% | y = −0.009x + 18.276 R2 = 0.8623 | −33.8% |
| Slovenia | y = −0.0102x + 20.928 R2 = 0.8614 | −52.9% | y = −0.0175x + 35.728 R2 = 0.7643 | −38.7% |
| Spain | y = −0.0119x + 24.222 R2 = 0.8628 | −73.8% | y = −0.0173x + 35.11 R2 = 0.7253 | −55.1% |
| Sweden | y = −0.001x + 1.986 R2 = 0.4811 | −29.4% | y = −0.0018x + 3.775 R2 = 0.7831 | −30.9% |
| The Netherlands | y = −0.0057x + 11.871 R2 = 0.6453 | −41.3% | y = −0.0137x + 28.041 R2 = 0.4264 | −29.6% |
| EU-27 | y = −0.0104x + 21.318 R2 = 0.9659 | −55.9% | y = −0.0163x + 33.313 R2 = 0.9271 | −33.8% |
| EU Member State | Electricity Consumption (GWhel) [17] | Calculated Emissions Factors | Calculated Emissions | |||||
|---|---|---|---|---|---|---|---|---|
| Residential | Non-Residential | CO2 | GHG | Residential | Non-Residential | |||
| (kgCO2/kWhel) | (kgCO2-eq/kWhel) | CO2 (MtCO2) | GHG (MtCO2-eq) | CO2 (MtCO2) | GHG (MtCO2-eq) | |||
| Austria | 20,283 | 11,863 | 0.0874 | 0.0891 | 1.77 | 1.81 | 1.04 | 1.06 |
| Belgium | 19,267 | 20,377 | 0.1574 | 0.1586 | 3.03 | 3.06 | 3.21 | 3.23 |
| Bulgaria | 11,956 | 8560 | 0.6856 | 0.6900 | 8.20 | 8.25 | 5.87 | 5.91 |
| Croatia | 6594 | 5687 | 0.1659 | 0.1681 | 1.09 | 1.11 | 0.94 | 0.96 |
| Cyprus | 1814 | 2035 | 0.6619 | 0.6640 | 1.20 | 1.20 | 1.35 | 1.35 |
| Czechia | 17,259 | 15,259 | 0.6517 | 0.6553 | 11.25 | 11.31 | 9.94 | 10.00 |
| Denmark | 10,839 | 9699 | 0.1956 | 0.2018 | 2.12 | 2.19 | 1.90 | 1.96 |
| Estonia | 2233 | 3256 | 0.6852 | 0.6908 | 1.53 | 1.54 | 2.23 | 2.25 |
| Finland | 24,260 | 17,131 | 0.1416 | 0.1447 | 3.43 | 3.51 | 2.43 | 2.48 |
| France | 169,775 | 131,977 | 0.0943 | 0.0951 | 16.02 | 16.14 | 12.45 | 12.55 |
| Germany | 138,467 | 121,568 | 0.4192 | 0.4276 | 58.05 | 59.21 | 50.96 | 51.99 |
| Greece | 17,719 | 16,549 | 0.4085 | 0.4095 | 7.24 | 7.26 | 6.76 | 6.78 |
| Hungary | 13,026 | 8164 | 0.2280 | 0.2297 | 2.97 | 2.99 | 1.86 | 1.88 |
| Ireland | 8804 | 13,851 | 0.3278 | 0.3314 | 2.89 | 2.92 | 4.54 | 4.59 |
| Italy | 67,059 | 79,933 | 0.2218 | 0.2228 | 14.87 | 14.94 | 17.73 | 17.81 |
| Latvia | 1791 | 2710 | 0.1987 | 0.2052 | 0.36 | 0.37 | 0.54 | 0.56 |
| Lithuania | 3408 | 3524 | 0.1304 | 0.1371 | 0.44 | 0.47 | 0.46 | 0.48 |
| Luxemburg | 942 | 2221 | 0.1575 | 0.1582 | 0.15 | 0.15 | 0.35 | 0.35 |
| Malta | 1012 | 1023 | 0.7394 | 0.7418 | 0.75 | 0.75 | 0.76 | 0.76 |
| Poland | 30,587 | 52,684 | 1.0547 | 1.0595 | 32.26 | 32.41 | 55.57 | 55.82 |
| Portugal | 14,282 | 14,712 | 0.1338 | 0.1362 | 1.91 | 1.94 | 1.97 | 2.00 |
| Romania | 14,247 | 8839 | 0.3399 | 0.3414 | 4.84 | 4.86 | 3.00 | 3.02 |
| Slovakia | 5966 | 7164 | 0.1699 | 0.1715 | 1.01 | 1.02 | 1.22 | 1.23 |
| Slovenia | 3803 | 3326 | 0.3103 | 0.3119 | 1.18 | 1.19 | 1.03 | 1.04 |
| Spain | 73,153 | 69,140 | 0.1354 | 0.1372 | 9.90 | 10.04 | 9.36 | 9.49 |
| Sweden | 46,206 | 29,971 | 0.0438 | 0.0456 | 2.02 | 2.11 | 1.31 | 1.37 |
| The Netherlands | 22,760 | 35,995 | 0.3270 | 0.3304 | 7.44 | 7.52 | 11.77 | 11.89 |
| EU-27 | 747,497 | 697,208 | 0.2850 | 0.2883 | 213.04 | 215.48 | 198.71 | 200.98 |
Disclaimer/Publisher’s Note: The statements, opinions and data contained in all publications are solely those of the individual author(s) and contributor(s) and not of MDPI and/or the editor(s). MDPI and/or the editor(s) disclaim responsibility for any injury to people or property resulting from any ideas, methods, instructions or products referred to in the content. |
© 2023 by the authors. Licensee MDPI, Basel, Switzerland. This article is an open access article distributed under the terms and conditions of the Creative Commons Attribution (CC BY) license (https://creativecommons.org/licenses/by/4.0/).
Share and Cite
Balaras, C.A.; Dascalaki, E.G.; Patsioti, M.; Droutsa, K.G.; Kontoyiannidis, S.; Cholewa, T. Carbon and Greenhouse Gas Emissions from Electricity Consumption in European Union Buildings. Buildings 2024, 14, 71. https://doi.org/10.3390/buildings14010071
Balaras CA, Dascalaki EG, Patsioti M, Droutsa KG, Kontoyiannidis S, Cholewa T. Carbon and Greenhouse Gas Emissions from Electricity Consumption in European Union Buildings. Buildings. 2024; 14(1):71. https://doi.org/10.3390/buildings14010071
Chicago/Turabian StyleBalaras, Constantinos A., Elena G. Dascalaki, Matina Patsioti, Kalliopi G. Droutsa, Simon Kontoyiannidis, and Tomasz Cholewa. 2024. "Carbon and Greenhouse Gas Emissions from Electricity Consumption in European Union Buildings" Buildings 14, no. 1: 71. https://doi.org/10.3390/buildings14010071
APA StyleBalaras, C. A., Dascalaki, E. G., Patsioti, M., Droutsa, K. G., Kontoyiannidis, S., & Cholewa, T. (2024). Carbon and Greenhouse Gas Emissions from Electricity Consumption in European Union Buildings. Buildings, 14(1), 71. https://doi.org/10.3390/buildings14010071