Abstract
To ensure the safe operation of concrete structures of deep-burial storages, it is necessary to research the degradation mechanisms of such structures. Concrete carbonation is one of the key factors determining the service life of concrete structures. Existing methods for the concrete carbonation process research at various stages of the building structure life cycle make it possible to conduct model tests in the shortest possible time by simulating the operational factors influencing the corrosion process development. The authors carried out model tests of concrete of deep-burial storages using the method of accelerated concrete carbonation and by taking into account the effects of elevated temperatures. When exposed to elevated temperatures during carbonation, concrete samples exhibit a decrease in compressive strength in the first 56 days of testing by an average of 1.6 MPa. However, by the end of the tests (168 days), the strength of concrete samples at elevated temperatures is on average 4 MPa higher. The microstructure and carbonation dynamics were studied by XRD, TGA and SEM. The data obtained in the research can be used to develop models for predicting the service life of concrete structures of deep-burial storages.
1. Introduction
According to IAEA documents [1,2], one of the priority research areas in the field of used nuclear fuel storage facilities construction is research into the reinforced concrete structure degradation effects and mechanisms in order to ensure their safe operation [3,4,5,6]. Understanding the mechanisms of concrete degradation in relation to such buildings is inextricably connected to the research into the operating conditions of these structures and external influences leading to accelerated aging of concrete and reinforcing steel [1]. Examples of such factors, called “stressors”, include the effects of alkalis, acids, sulfates and salts; penetration of liquids and corrosive gases into the thickness of concrete; long-term static or cyclic vibration and shock loads on structures; cyclic or static exposure to high and low temperatures; radiation impacts; electrochemical reactions, etc.
The current research considered concrete structures of underground deep-burial storage facilities, since the influence of specific operational factors on the degradation process of such structures is more notable.
Among the stressors affecting such structures (in addition to direct radiation exposure), several groups that initiate the corresponding aging mechanisms can be distinguished (Table 1).

Table 1.
Stressors and aging mechanisms of concrete structures of underground deep-burial storage facilities [1].
As can be seen from the table above, the impact of stressors leading to concrete degradation is usually associated with a combination of various internal and external influences. Therefore, it should be taken into account at the design stage of deep-burial storage facilities in order to ensure the resistance of concrete structures to intensive degradation during the design life of the building [1,2,4,6,7,8]. The cumulative influence of factors leading to concrete degradation is determined by the properties of the initial components of the concrete mixture, the environmental conditions of the construction area, the proximity of sources of aggressive media, etc. In addition, there is the problem of CO2 sequestration, which has a significant impact on changes in the microstructure of concrete during operation [9,10,11,12].
In relation to deep-burial storage facilities, there are also a number of additional factors influencing the carbonation process. For example, exposure to groundwater, alkali-silica reactions, exposure to elevated temperatures and exposure to radiation. Each of these factors is a complex problem for ensuring the durability of concrete structures [4].
At the same time, it should be noted that most of the factors listed above that cause degradation of concrete and/or reinforced concrete structures have now been quite well researched, since almost all of them are relevant for any objects built using concrete for industrial and civil needs [4,7,8,9,10,11,12,13,14,15,16,17]. The only notable exception in this case is related to the research into concrete aging under conditions of radiation exposure and elevated temperatures.
The durability of concrete depends on the resistance to external influences of its cement matrix and aggregates, which may have different resistance to certain influences. The rate of concrete degradation is associated with the processes of gas and moisture migration through pores, microcracks and interfaces between the phases of hardened cement paste and aggregates inside the concrete mass. This factor increases the importance of the concrete protective layer (as well as insulating materials) quality, in the process of ensuring the durability of concrete structures [1,2,3,7,15].
The main mechanisms of concrete aging are determined by the influence of one or more factors, which are usually divided into two groups of physical and chemical influences [1,3,4].
Physical impacts lead to cracking or destruction of the concrete protective layer caused by the external influences. Cracking and destruction of structures under the influence of loads due to design errors or violations of the design scheme during the construction process are not related to aging mechanisms and therefore are not taken into account in the group of physical influences mentioned above [1,4]. However, they also lead to a violation of the integrity of the monolithic structure of the concrete and contribute to the acceleration of aging of the structure under the influence of external factors.
Chemical influences affect the properties of reinforced concrete structures through chemical reactions with hardened cement paste, aggregate or reinforcement. Chemical interaction usually occurs within the boundaries of a structure’s open surface areas, but can also occur in deeper layers in the presence of cracks or as a result of prolonged interaction with an aggressive environment [1,4]. At the same time, concrete is quite rarely exposed to chemical reagents in solid form, so concrete degradation processes due to chemical influences usually occur when critical concentrations of chemicals in liquid solutions interacting with concrete are exceeded. In this case, the degree of impact depends on the activity of the substance, the ambient temperature, the type of cement used, the water–cement ratio of the concrete mixture, the degree of compaction of the concrete mixture and the permeability of concrete and other factors [4,15,16,17,18,19,20,21,22,23].
Concrete carbonation, which belongs to the group of chemical influences, is one of the key factors determining the service life of concrete structures [1,2,4,5,23,24,25,26,27,28,29]. Today, there is a lot of research in the field of studying corrosion processes (carbonation in particular) occurring in concrete under normal operating conditions [4,17,25,26,27,28,29,30,31,32,33,34,35,36].
Existing methods for concrete carbonation process research at various stages of the building structure’s life cycle make it possible to carry out model tests of concrete in the shortest possible time by simulating the main operational factors influencing the development of corrosion processes [28,34,37,38,39]. However, specific impacts characteristic of the operation of structures of deep-burial storage facilities (in particular, elevated temperatures and radiation exposure) are rarely taken into account in such research [4,7,8].
The authors produced model tests of deep-burial storage facilities’ concrete using the method of accelerated carbonation and by taking into account the effects of elevated temperatures to study changes in the concrete carbonation process dynamics under various operating conditions. The issue of service life prediction of concrete structures of deep-burial storage facilities based on the results of model tests was also considered.
2. Materials and Methods
2.1. Materials Used
The following materials were selected for the research:
- Portland cement “CEM I” according to [40] (hardening time: beginning 165 min, end 220 min; compressive strength at the age of 2 days, 24.3 MPa; normal density of cement paste, 27.5%, Blaine fineness, 2640 cm2/g. The mineralogical and chemical compositions of the cement used in the research is presented in Table 2 and Table 3 accordingly;
Table 2. Mineralogical composition of the cement used in the research.
Table 3. Chemical composition of the cement used in the research.
- Sand (class 1 according to [41], fineness modulus, 2.76; bulk density, 1.6 g/cm3);
- Crushed stone (bulk density, 1410 kg/m3, strength grade, M1400, frost resistance, F300);
- Microsilica according to [42]. The mineralogical composition of the microsilica used in the research is presented in Table 4;
Table 4. Mineralogical composition of the microsilica used in the research.
- Plasticizing additive based on naphthalene formaldehyde;
- Air-entraining additive based on synthetic surfactants.
2.2. Manufacturing of Test Samples
For the research, Portland cement-based heavy concrete of grade B30 (in accordance with [43]) was used. The concrete composition was selected in accordance with those currently used for the manufacture of deep-burial storage facilities (Table 5).
Table 5.
Composition of concrete used in the research.
Concrete samples of the following sizes were made, modulus multiples of half a standard cube with an edge of 100 mm (Figure 1):
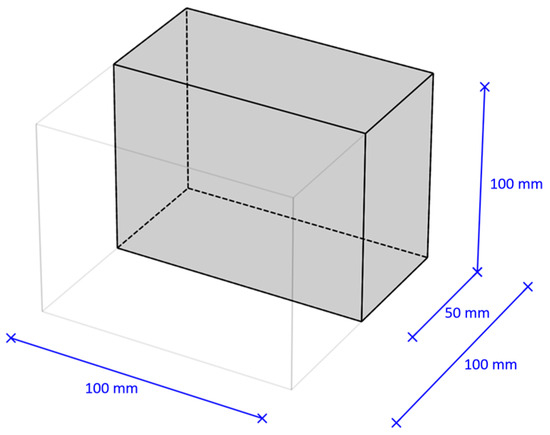
Figure 1.
Modulus of the geometric dimension of the concrete samples used in the research.
- Sample type (1A): plate 100 × 100 × 50 mm.
- Sample type (2A): cube 100 × 100 × 100 mm.
Type (1A) samples were used to research the carbonation depth and the content of carbonation products in concrete; type (2A) samples were used to determine the compressive strength of concrete. Diagrams of samples of various standard sizes are presented in Figure 2.
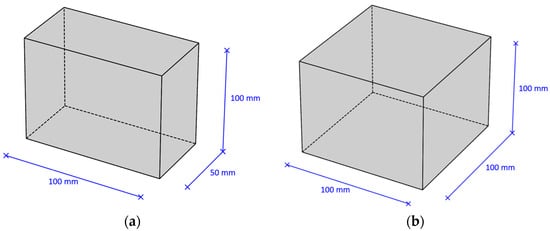
Figure 2.
Types of samples: (a) sample type (1A)—plate 100 × 100 × 50 mm; (b) sample type (2A)—cube 100 × 100 × 100 mm.
The samples were manufactured in calibrated molds in accordance with [44]. The concrete mixture was compacted manually and evenly using a bayonet and then smoothed with a plate.
For the first 24 h after molding, the samples were stored in a chamber with an air temperature of (20 ± 5) °C in molds covered with material that prevented moisture evaporation.
At the end of the primary hardening, the samples were demolded and placed in a climate chamber with constant relative air humidity ((95 ± 5)%) and temperature ((20 ± 2) °C). The samples were placed in a chamber with a gap of at least 5 mm between each other and the chamber walls. Direct contact of samples with water was excluded.
Water- and heat-resistant markings were applied to all concrete samples immediately after their production.
The samples were stored until 28 days from the moment of molding (control samples).
2.3. Model Aging of Concrete
Before testing, all samples (with the exception of control samples) were subjected to model aging in various modes. The aging modes simulating the temperature effect and the influence of the air condition in the operation zone of reinforced concrete structures of deep-burial storage facilities were selected based on the influence of various temperature and humidity conditions and an increased concentration of carbon dioxide, designed to intensify the carbonation process of concrete (Table 6).
Table 6.
Model aging modes.
Mode I is a commonly used mode of accelerated model aging of concrete for assessing the carbonation development in laboratory conditions [13,24,28].
Mode II is intended to assess the contribution of changes in the risks of concrete carbonation relative to the accelerated mode during the operation of structures under conditions of elevated temperatures, characteristic of the reinforced concrete structures of deep-burial storage facilities under conditions of temperature and humidity exposure.
The samples were tested in series at certain exposure intervals in specified modes (Table 7).
Table 7.
Description of the tested series of samples.
Test intervals were selected based on available data on accelerated carbonation [4,13,24,28] for further correlation with the actual service life of concrete.
2.4. Methods for Testing Concrete Samples
According to existing research [4,5,8,15,16,17,18,19,20,21,22,23,24,25,26,27,28,29,30,31,32,33,34,35,36,37,38], there are many different methods for concrete carbonation process research. For the current research, it was decided to focus on studying changes in the physical and mechanical properties of concrete and microstructure during model aging. The mentioned approach was intended to ensure the applicability of the results for further analysis of the process of concrete degradation under various operating conditions and the research into the possibility of correlating the data with the results of actual studies of concrete samples of deep-burial storage facilities.
2.4.1. Determination of Physical and Mechanical Characteristics
After the concrete samples reached the age of 28 days for each subsequent series the following tests were carried out:
- Testing a series of four samples of type (2A) for compressive strength using the standard method according to [45].
- Research into the carbonation depth and the content of carbonation products on one initial sample of type (1A) according to [4,33].
2.4.2. Research into Carbonation Depth and Content of Carbonation Products
The research into the carbonation depth and the content of carbonation products of a type 1A concrete sample includes the following sequence of actions:
The sample is split in the direction normal to the working edge into two equal parts, as shown in Figure 3:
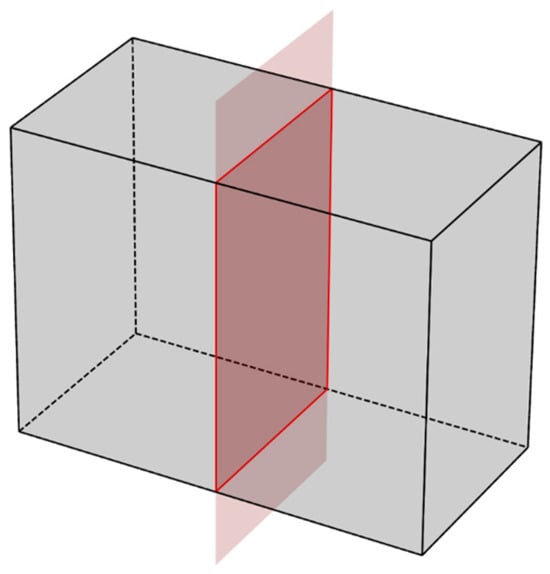
Figure 3.
Scheme of splitting a sample of type (1A) for researching the processes of concrete carbonation.
A 0.1% solution of phenolphthalein in ethyl alcohol is applied to the chip surface of one of the resulting parts of the split sample from the side of the working edge. Then, the thickness of the neutralized concrete layer is measured, which is equal to the distance from the surface of the sample to the layer painted with a colored phenolphthalein solution.
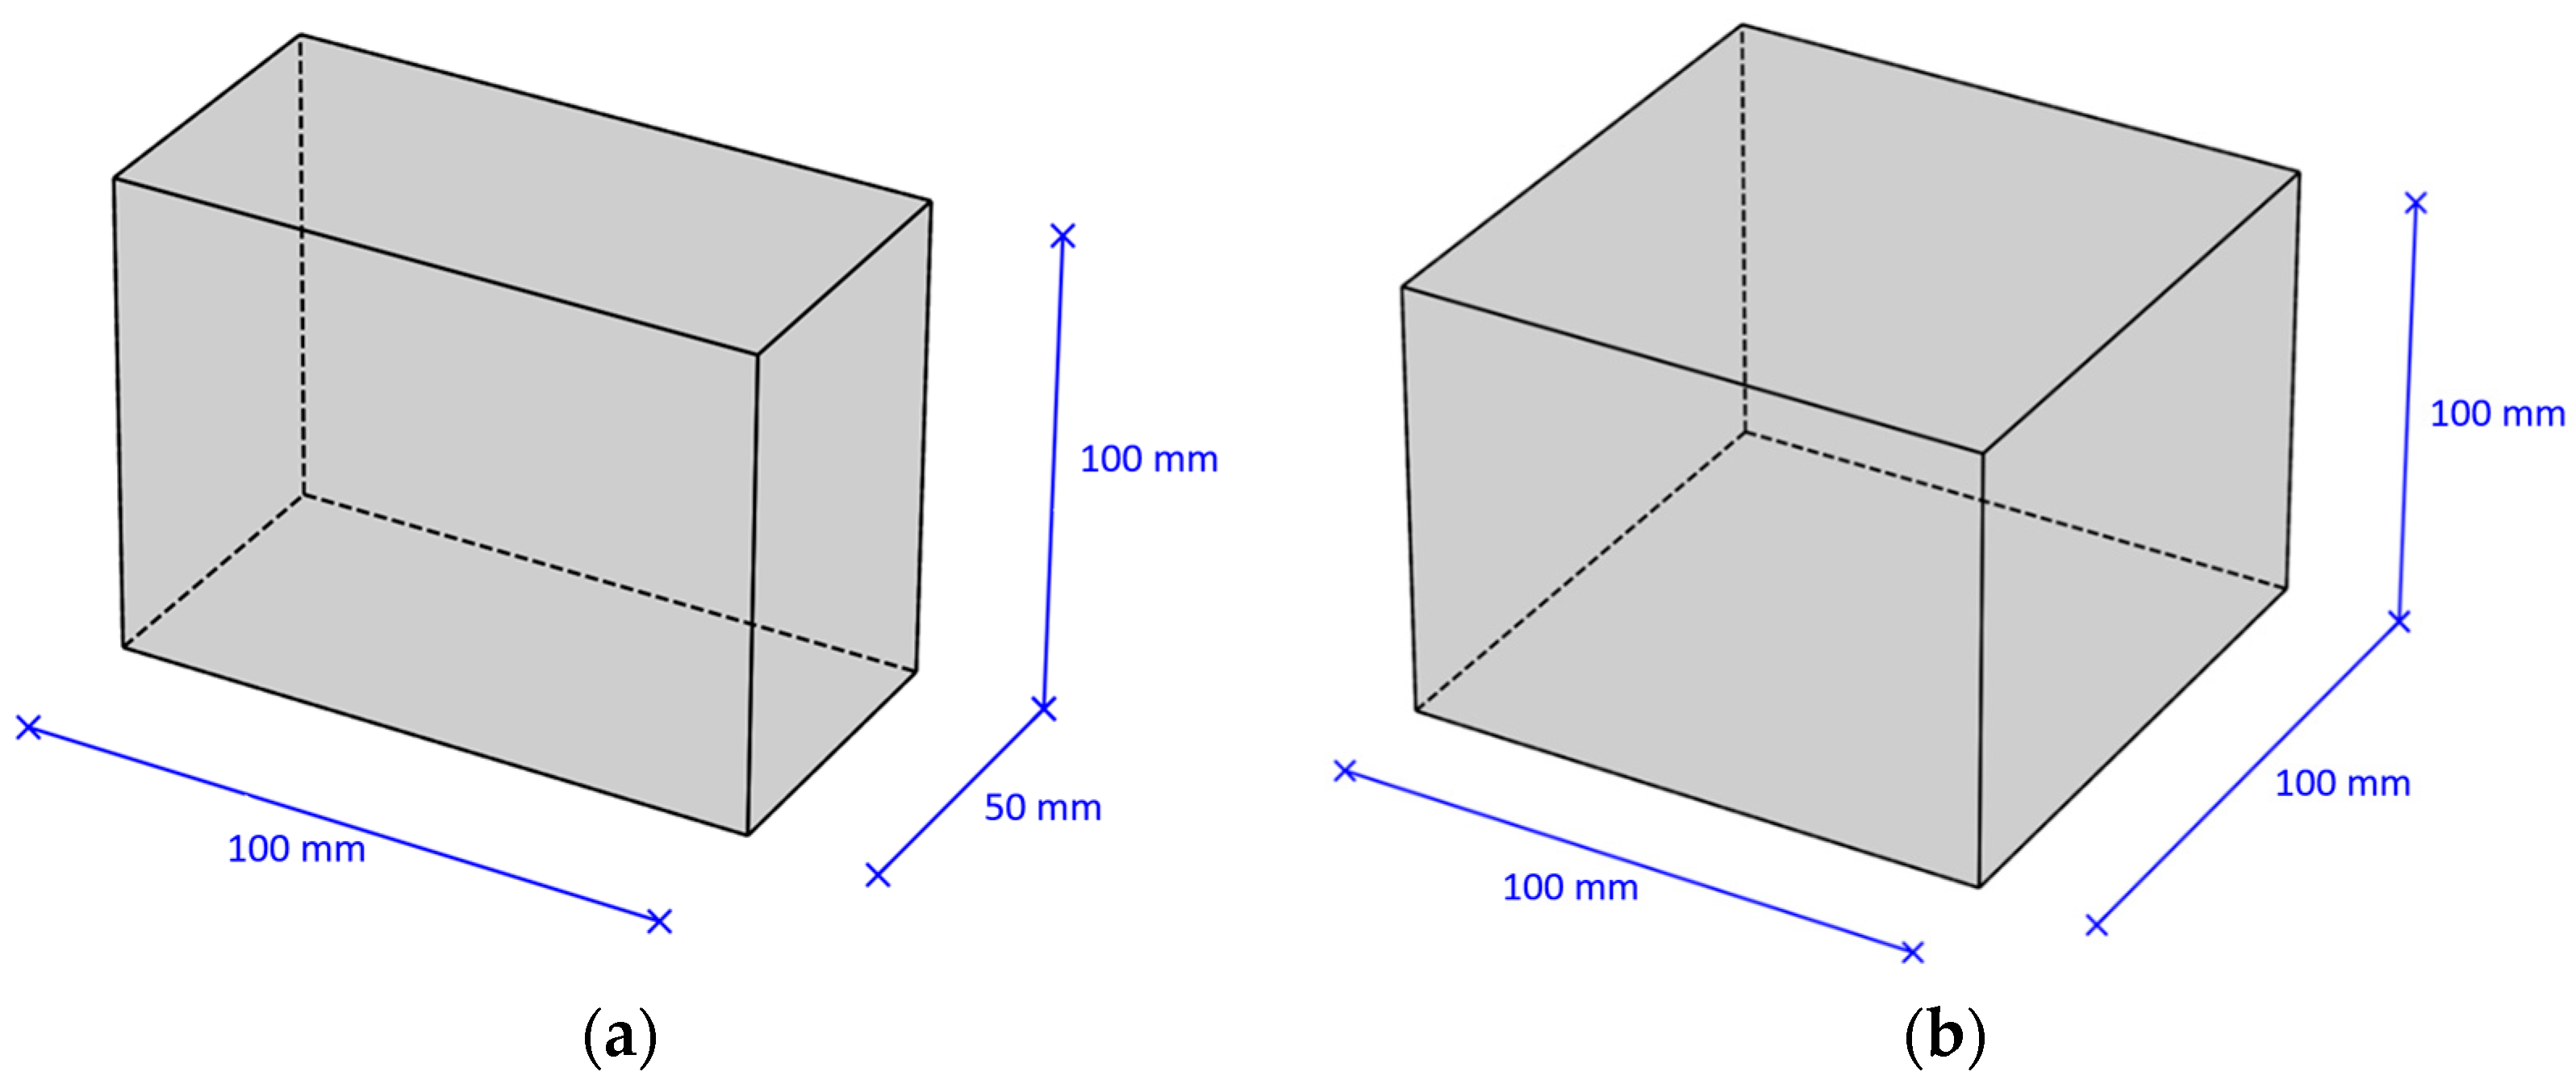
From the cleavage surface of the second part of the split sample, three samples are taken for microscopy and powder X-ray diffraction and three samples for thermogravimetric analysis. Samples are taken from points corresponding to 1/6, 2/6, and 3/6 of the distance along the long edge of the chip, as shown in Figure 4:
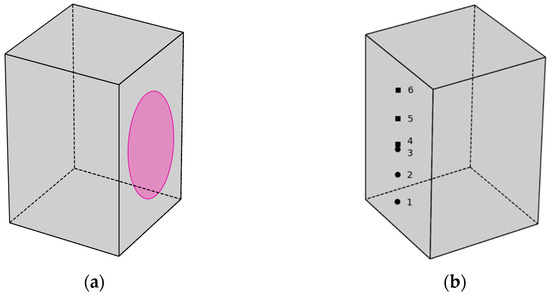
Figure 4.
Scheme of using parts of a split sample of type (1A) to research the processes of concrete carbonation: (a) surface treatment with a 0.1% phenolphthalein solution; (b) points of sampling for physicochemical analysis (round points—SEM and XRD, square points—TGA).
After conducting a microscopic examination using scanning electron microscopy (SEM) and energy-dispersive analysis for the same samples, appropriate sample preparation was carried out in order to conduct X-ray phase analysis using powder X-ray diffraction (XRD).
Carrying out measurements and processing the results of assessing the diffusion permeability of concrete for carbon dioxide using a 0.1% solution of phenolphthalein in ethyl alcohol is carried out according to [46].
2.4.3. Powder X-ray Diffraction (XRD)
The method is based on recording the diffraction of X-ray radiation when it is reflected from flat networks of crystal structures of the sample [4,36,38]. The diffraction patterns obtained during registration are deciphered to determine the qualitative and quantitative mineralogical (phase) composition of the sample.
To carry out X-ray phase analysis, the Thermo Fisher Scientific ARL X’TRA X-ray diffractometer was used (diffraction maximum positions: ±0.015°, relative standard deviation of the output signal: no more than 1.0%, angle sensor readout resolution: 0.00025°, goniometer diameter (adjustable): 400–520 mm, factory software WinXRD version 2.0-6, SIROQUANT version 3.0, Crystallographica Search-Match version 3.1.0.0).
A sample of the test material was manually crushed to a powder state. Then, a sample weighing ~100 g was taken by quartering. The selected sample was crushed in a planetary-type ball mill with a tungsten carbide headset for 600 s at 500 rpm.
The crushed sample for X-ray phase analysis is placed in round top-loading sample holders made of special steel. The parameters for recording diffraction patterns on the Thermo Fisher Scientific ARL X’TRA instrument are given in Table 8.
Table 8.
Parameters for recording diffraction patterns on the Thermo Fisher Scientific ARL X’tra apparatus.
The analysis was carried out by interplanar distances in manual mode using the Hanawalt method and in semi-automatic mode using Crystallographica Search-Match Oxford Cryosystems software (version 3.1.0.0).
Standard-free quantitative X-ray diffraction analysis using the Rietveld method was carried out using Siroquant 4.0 Sietronics Pty Ltd. software (Mitchell, Australia). For all phases, the following parameters were specified: scale factor, zero offset of the device counter, background parameters (Chebyshev polynomial of the 5th degree), unit cell parameters, profile parameters using the Pearson VII profile function (U, V, W according to the Cagliotti dependence).
The analysis of the amorphous phase content in the samples was carried out by comparing the areas of halo and reflections of crystalline phases according to Formula (1):
where νg is a volume fraction of amorphous phase;
is an area under the background curve within the limits of integration;
is an area under the background curve with extrapolation of the area under the halo (straight line is the best approximation to the common tangent);
Stot is total area under the theoretical radiograph (based on refinement results).
2.4.4. Scanning Electron Microscopy (SEM) and Energy-Dispersive Analysis
The essence of the method is to use a scanning electron microscope FEI Quanta 200 FP 2012/13, FEI Company, with an attachment for energy-dispersive chemical microanalysis Apollo10-PSU (EDAX), operating on the principle of interaction of an electron beam with the substance under study, to obtain an image of the surface of an object with high spatial resolution, as well as information about its composition, structure and properties.
Before testing, the test samples were fixed on a flat horizontal surface of metal washers using conductive carbon tape.
The prepared sample washers were installed in the microscope chamber using a special holder in the form of a table with seven connectors.
The following parameters were used during testing:
- Cathode: tungsten;
- Apertures: 7.5–120 µm;
- Accelerating voltage: 100 V–30 kV;
- Maximum magnification: up to 150,000 times;
- High/low vacuum or natural environment modes.
2.4.5. Thermogravimetric Analysis (TGA)
Thermogravimetric analysis a commonly used instrumental method for researching the concrete carbonation process [4].
The research using TGA was carried out in two stages:
- The first stage is obtaining identification thermoanalytical characteristics as a result of testing using statistical methods of processing and calculating average values and dispersions;
- The second stage is to analyze changes in the carbonate content in concrete based on a comparison of dispersions and average values of significant thermo-analytical characteristics.
For testing purposes, a concrete sample was crushed to a homogeneous powder state.
The sample was heated with air entering the test cell. Sample shooting parameters are presented in Table 9:
Table 9.
Parameters for sample shooting using the TGA method.
For each sample, two consecutive tests were carried out to confirm the repeatability of the results obtained. If the obtained data differed significantly, additional tests were carried out.
The choice of the temperature range for the research was based on the considerations that in the case of concrete carbonation process the decomposition of carbonate-containing compounds occurs up to 1000 °C.
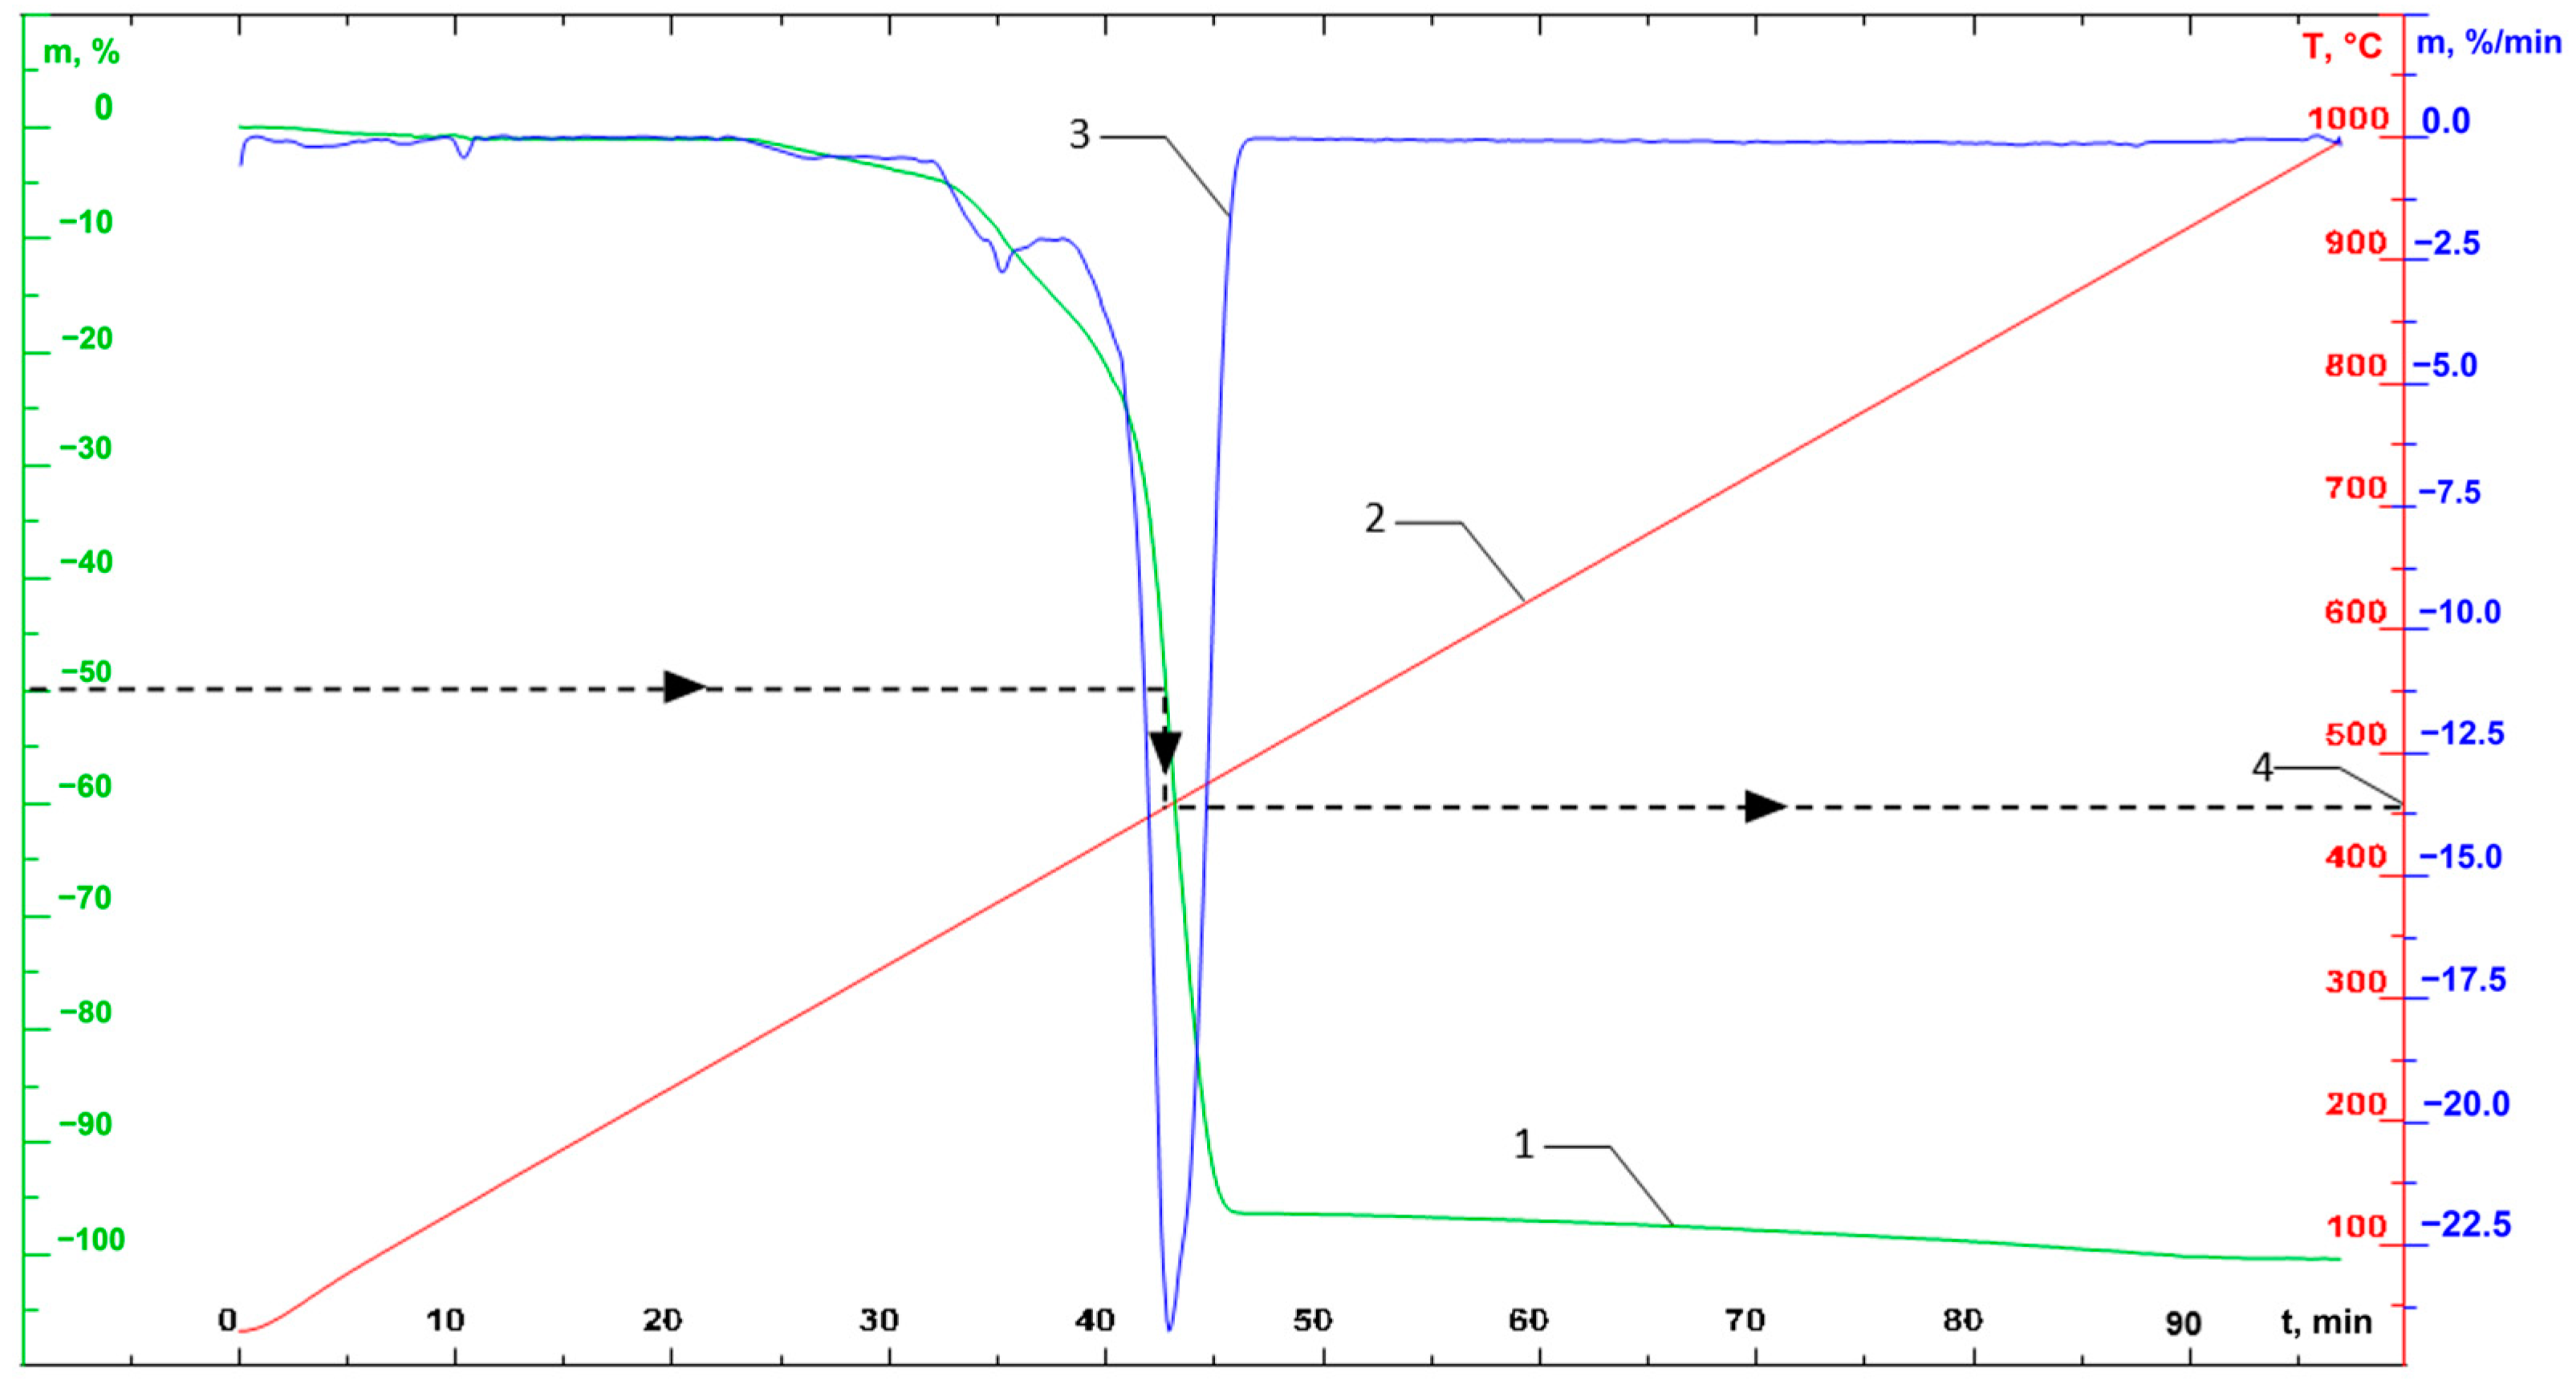
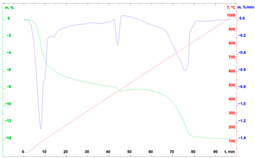
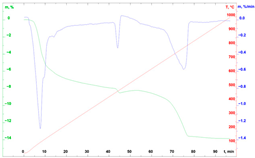
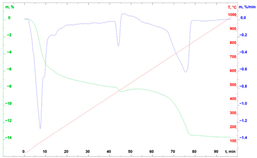
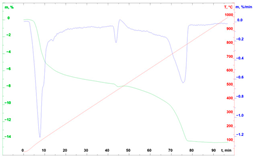
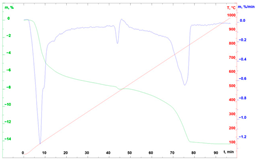
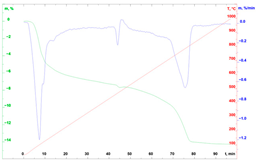
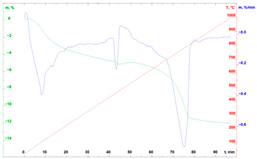
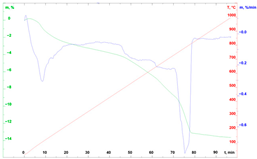
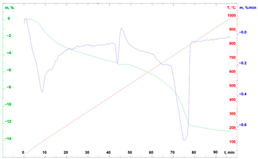
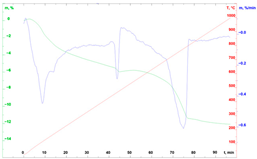
As a result of thermoanalytical tests, the corresponding graphical dependencies are obtained (an example of the obtained graphical dependencies is presented in Figure 5).
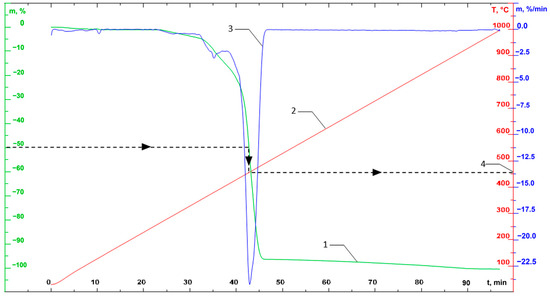
Figure 5.
An example of the resulting TGA curves (on the graph: 1—TG curve (mass loss); 2—temperature; 3—DTG curve (change in mass over time); 4—example of a graphical determination of temperature with a mass loss of 50%).
The following parameters were determined for each set point as a result of processing TGA curves:
- Arithmetic mean according to the Formula (2):
- Deviations d from the arithmetic mean according to the Formula (3):
- The squares of these deviations according to the Formula (4):
- Standard deviation of repeatability (convergence) of measurement results for each point according to the Formula (5):
The evaluation of the results obtained was carried out through a comparative analysis of the thermoanalytical characteristics of the initial (reference) and test (after carbonation) samples.
In the process of analyzing the results obtained, the following points were studied:
- Weight loss in the range up to 100 °C, corresponding to the content of interlayer moisture in the sample;
- Identity of the studied samples over the entire temperature range;
- Weight loss in the range of 700–1000 °C, in which calcite decomposes;
- Dynamics of mass loss at characteristic temperature intervals determined from the DTG curve.
3. Results and Discussion
Please note that due to the excessive amount of the data obtained in the research process, only the most notable results are presented in the current paragraph of the manuscript. The data analysis and conclusions were drawn considering all the data obtained during the research.
3.1. Physical and Mechanical Characteristics
For each series of samples, four consecutive tests were carried out, recording the mass of each sample, linear dimensions and breaking load (in kN). After the tests, the data were recalculated in MPa and averaged for each series.
The average results of determining the compressive strength of cube samples for each of the selected modes are presented in Figure 6. The type of failure when testing all samples in schematic form [45] is indicated in Figure 7.
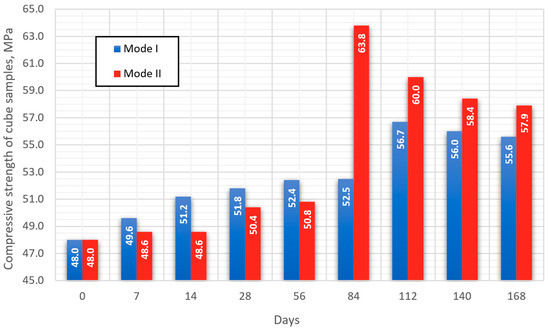
Figure 6.
Data for determining the compressive strength of cube samples.
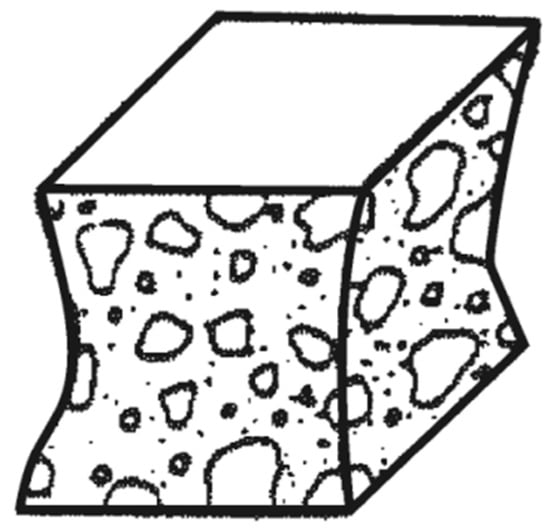
Figure 7.
Schematic illustration of the type of failure of cube samples.
In the first 56 days of testing (series 5), the strength gain for samples of both modes is linear. Up to the 56th day of testing, the strength value of samples maintained at elevated temperatures (mode II) is on average 1.6 MPa lower compared to samples of mode I. The dynamics of changes in the strength of the studied samples changes significantly after the 84th day of testing for mode I (series 6), and after 112 days for mode II (series 7). In the period from 112 to 168 days of testing, the strength of mode II samples exceeds the strength of mode I samples by an average of 4 MPa.
For samples in both modes, a strengthening of the structure is observed, which indicates a positive effect of concrete carbonation on strength gain. At the same time, the dynamics of changes in strength starting after 112 days of testing for samples of both modes has a similar character.
3.2. Depth of Carbonation and Carbonation Products Content
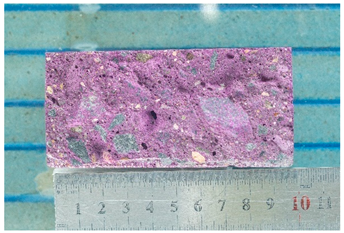
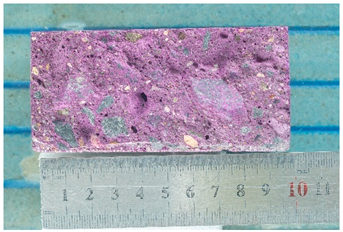
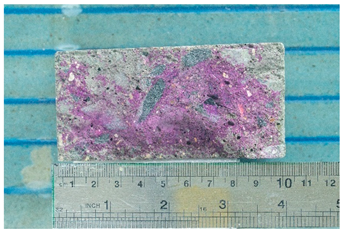
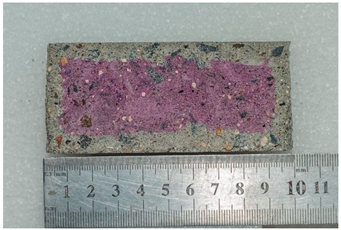
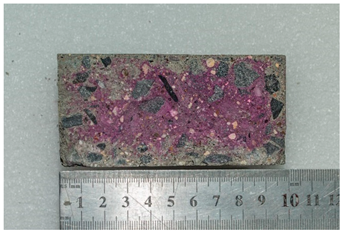
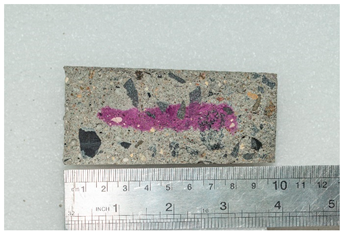
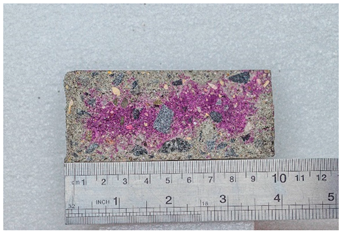
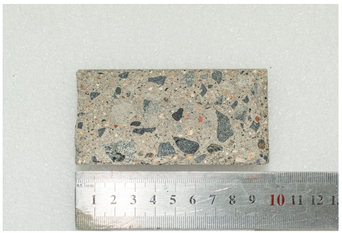
Photographs of samples for researching the depth of carbonation based on assessing the diffusion permeability of concrete for carbon dioxide are presented in the form of photographs of the thickness of the neutralized layer of concrete after treating the split surface with a phenolphthalein solution and are presented in Table 10.
Table 10.
Appearance of samples of modes I and II after phenolphthalein treatment.
As can be seen from a comparison of images, the dynamics of the carbonation process when simulating the operation of concrete under conditions of elevated temperatures noticeably accelerates already in the first weeks of testing. At the 112th day of testing under mode II (series 7), carbonation of the concrete sample reaches its maximum value.
3.3. Results of Carbonation Research Using Scanning Electron Microscopy and Energy-Dispersive Analysis Methods
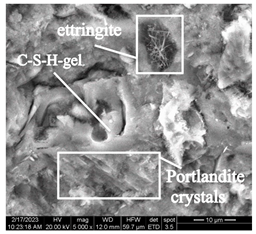
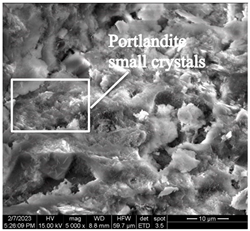
At the early stage of hardening, during the hydration of tricalcium (C3S) and dicalcium (C2S) silicates, portlandite (Ca(OH)2) is formed in the control concrete sample. As can be seen in Figure 8, portlandite is in a form of lamellar crystals fused together, located among crystals of calcium hydrosilicates.
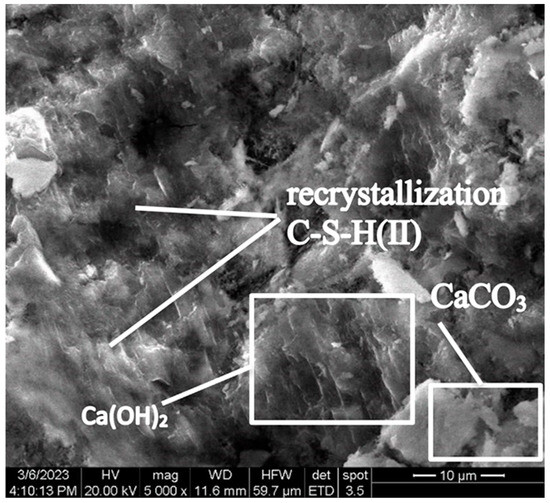
Figure 8.
Lamellar fused crystals of portlandite located among crystals of calcium hydrosilicates (Control sample, mode II series 1).
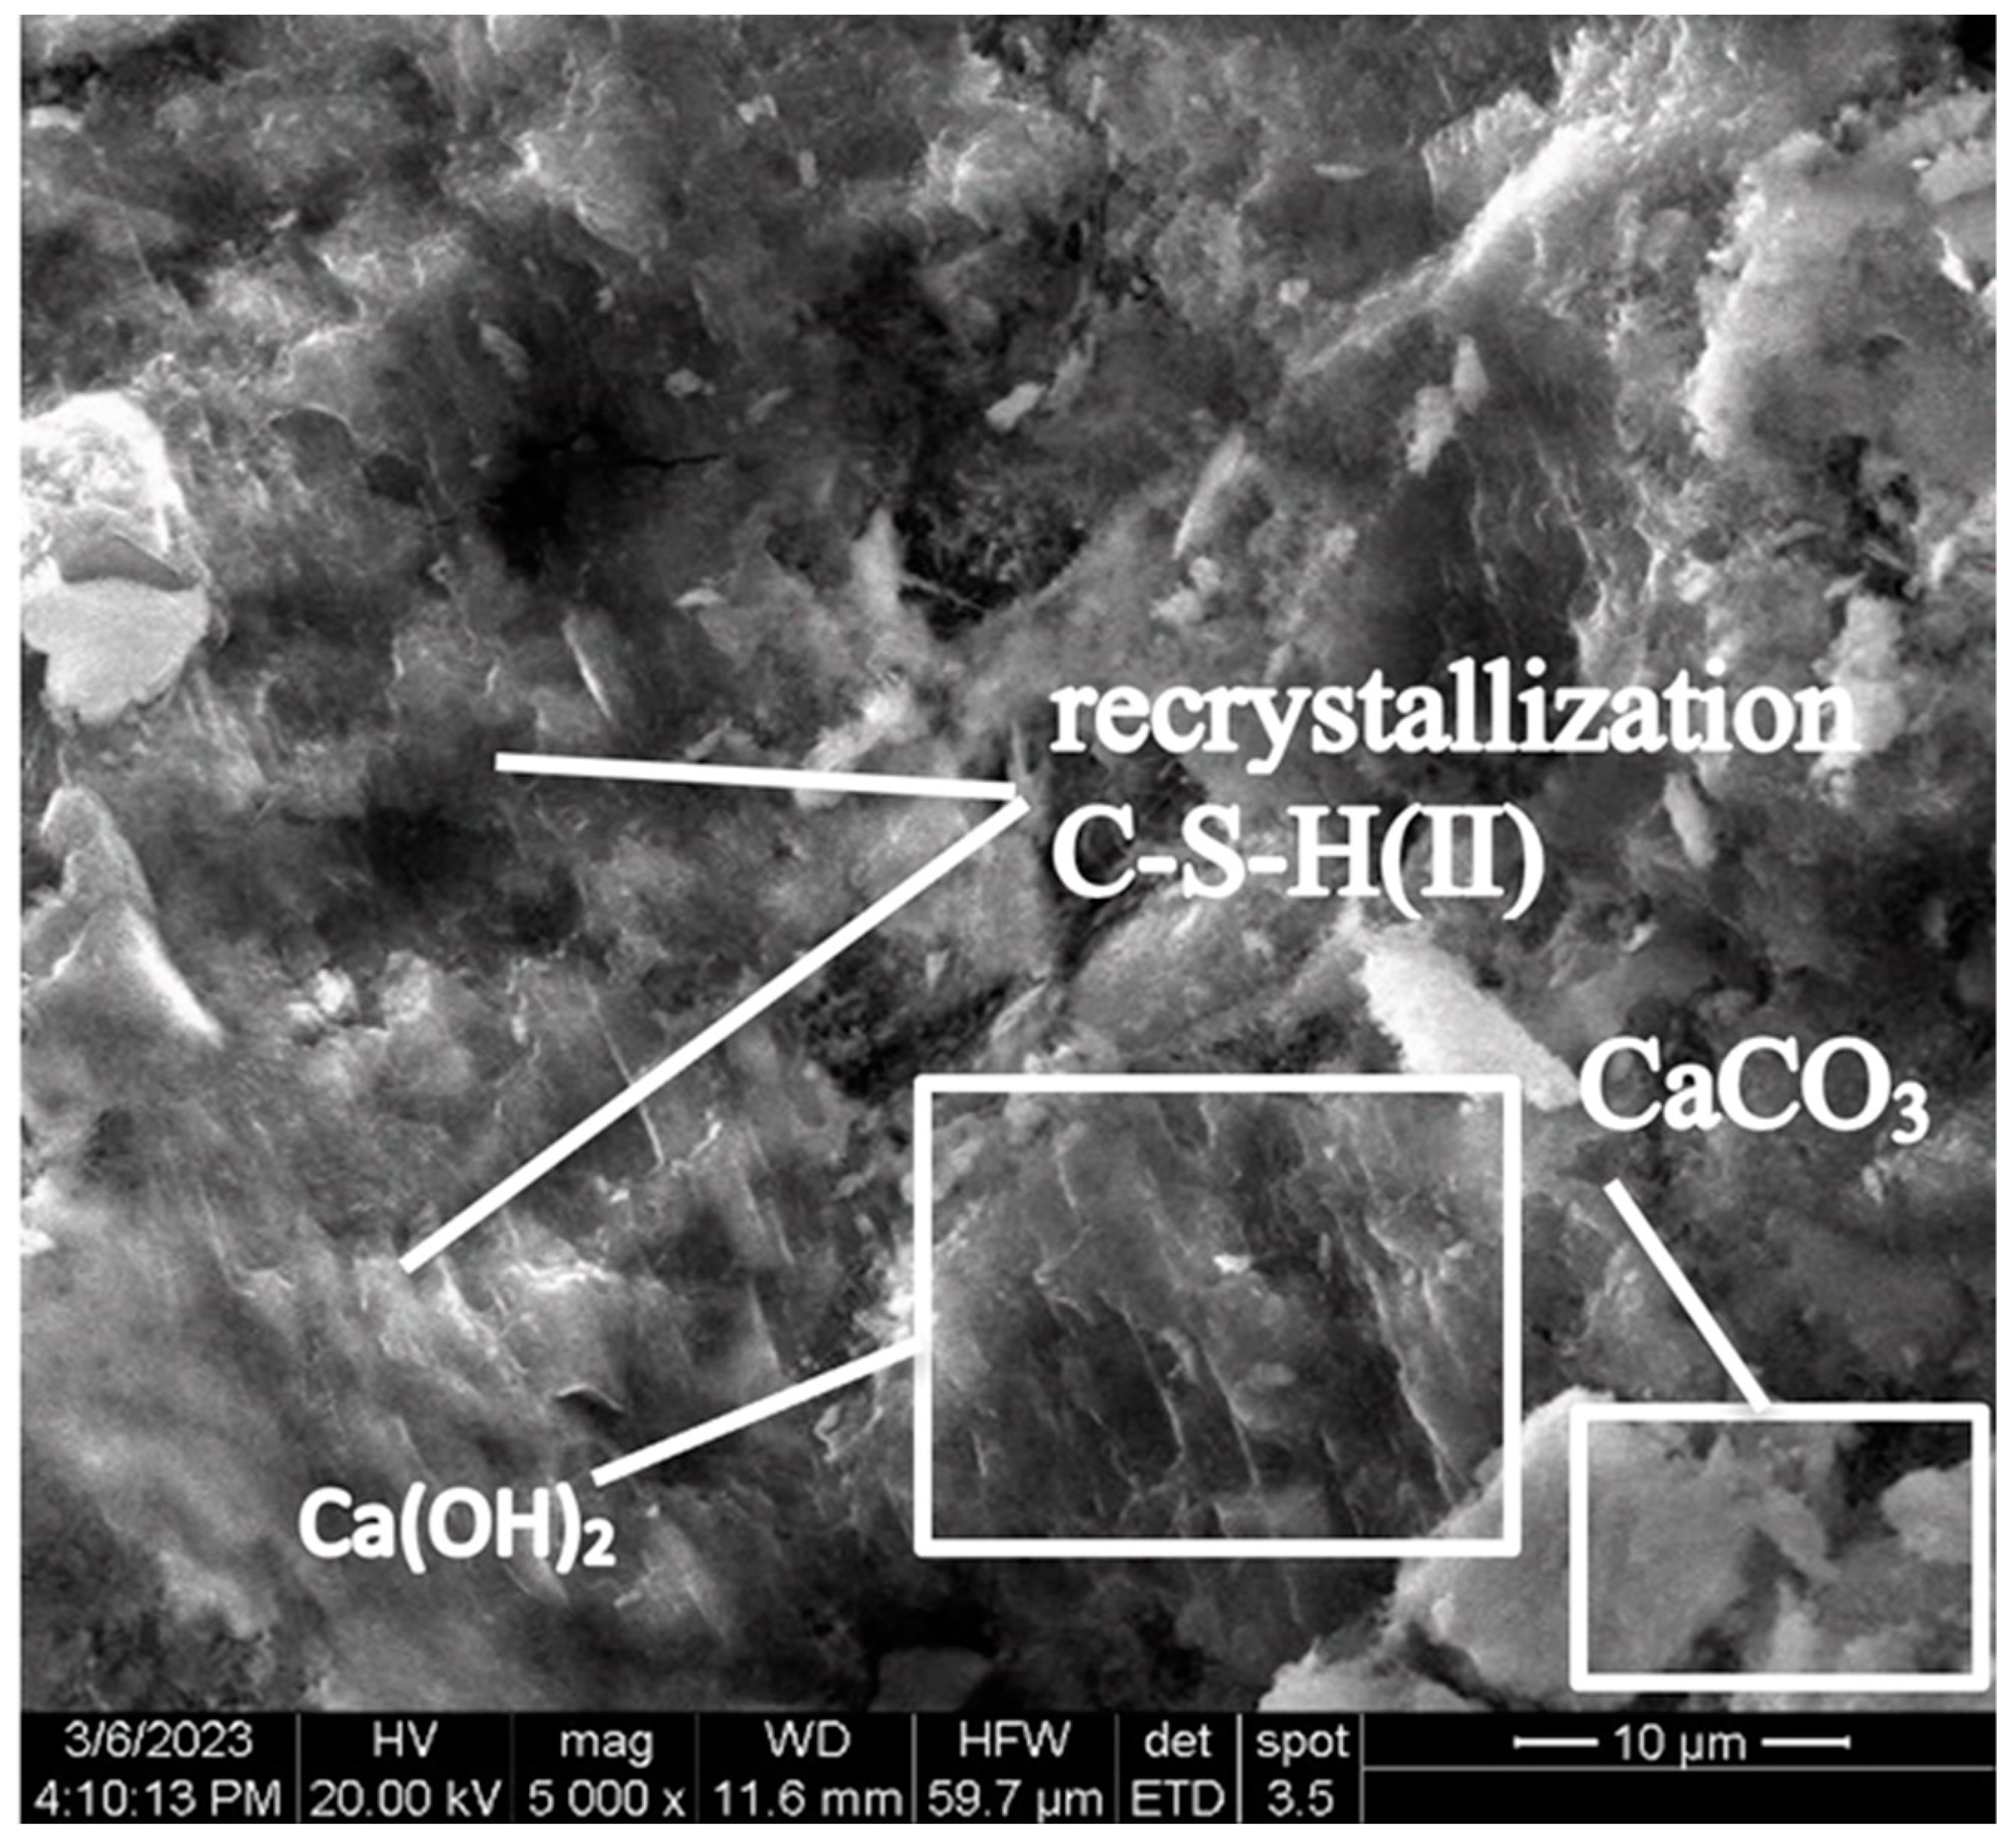
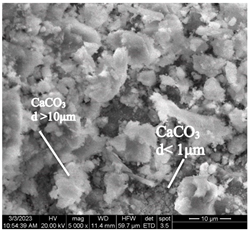
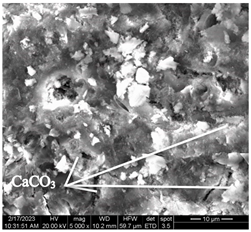
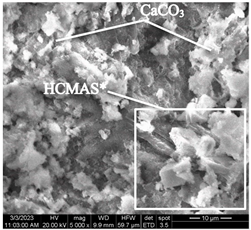
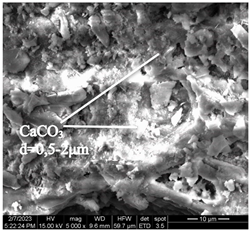
After accelerated carbonation of the samples for 14 days (series 3), it was found that carbonation products are mainly formed on the C-S-H surface. At the same time, at elevated temperatures, a more intense formation of calcium carbonate crystals is observed at point 1 (in accordance with Figure 4), located closer to the surface of the concrete sample, in contrast to a similar point on the sample of mode I (Table 11).
Table 11.
Microstructural changes in concrete samples after 14 days of testing (series 3).
It should be noted that a distinctive feature of the microstructure of the mode I concrete sample is the presence of ettringite crystals, which are absent in the microstructure of the mode II concrete sample. The absence of ettringite in the structure of the sample tested in mode II can be explained by the ettringite transition to monosulfate (according to [4,6,15,19,20,21,22,23,24,25,26,27,28,32,33,34,35,36,37], complete decomposition of ettringite occurs at temperatures around 60–80 °C).
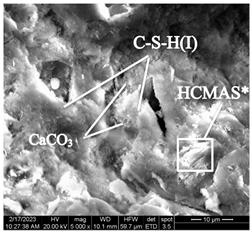
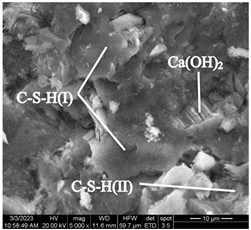
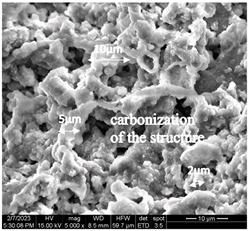
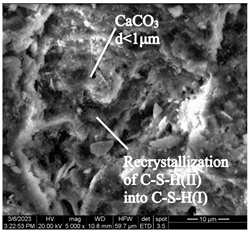
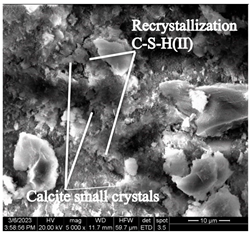
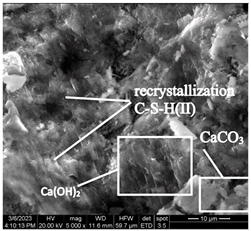
After accelerated carbonation for 84 days (series 6), pores and microstructure defects are filled with carbonation products in samples of both modes (Table 12), which leads to compaction of the concrete structure, and to an increase in compressive strength (Figure 6).
Table 12.
Microstructural changes in concrete samples after 84 days of testing (series 6).
The concrete sample microstructure decompaction in mode II after 14 days of testing (series 3), by the time it reaches 84 days (series 6), is compensated by intensive microstructure compaction by carbonation products and a significant increase in compressive strength (Table 12).
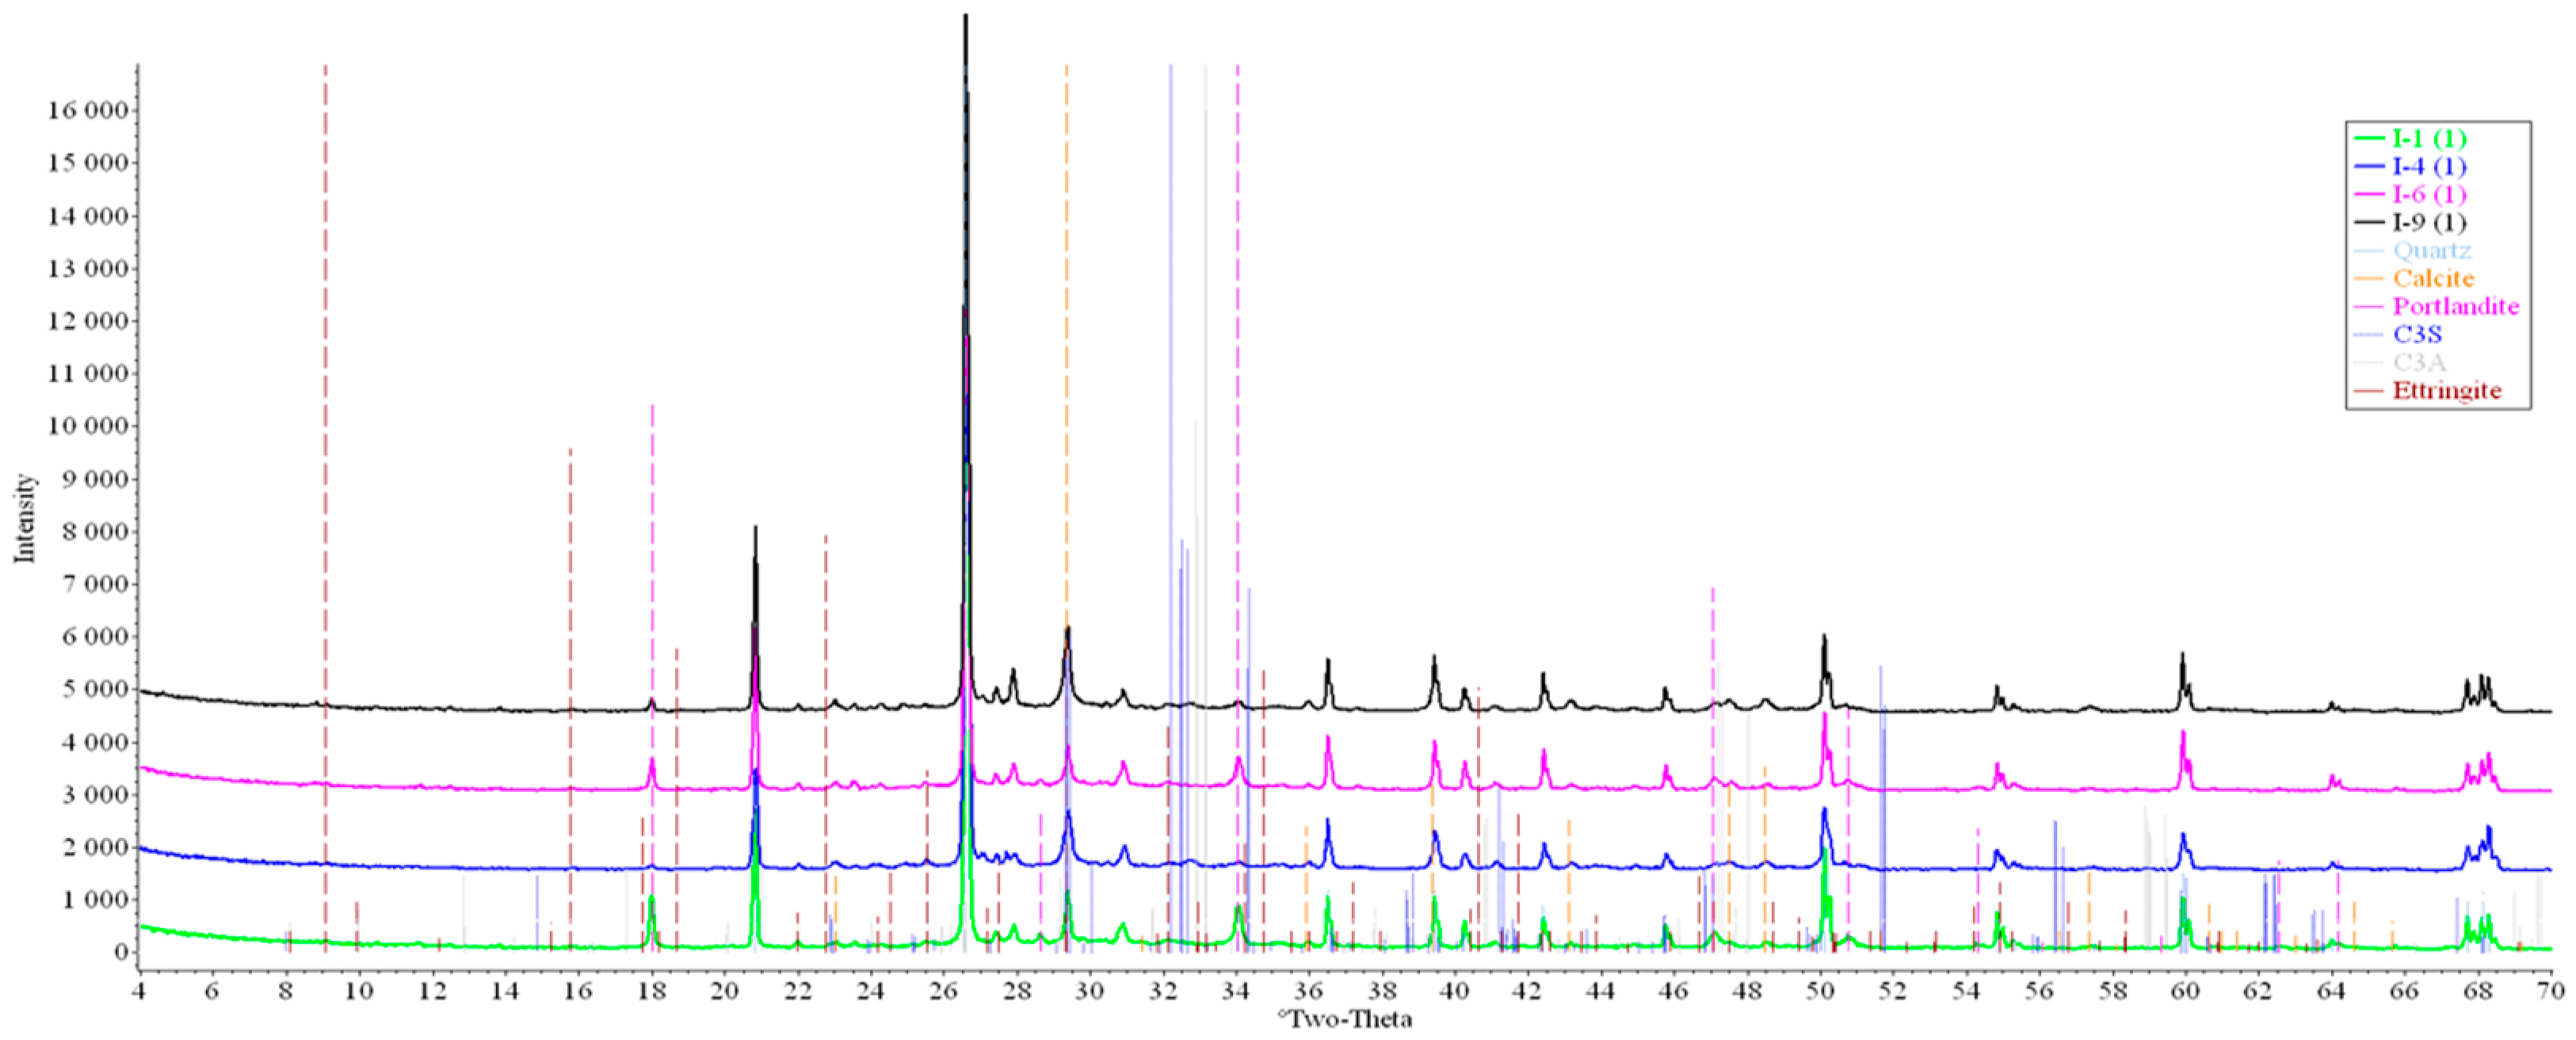
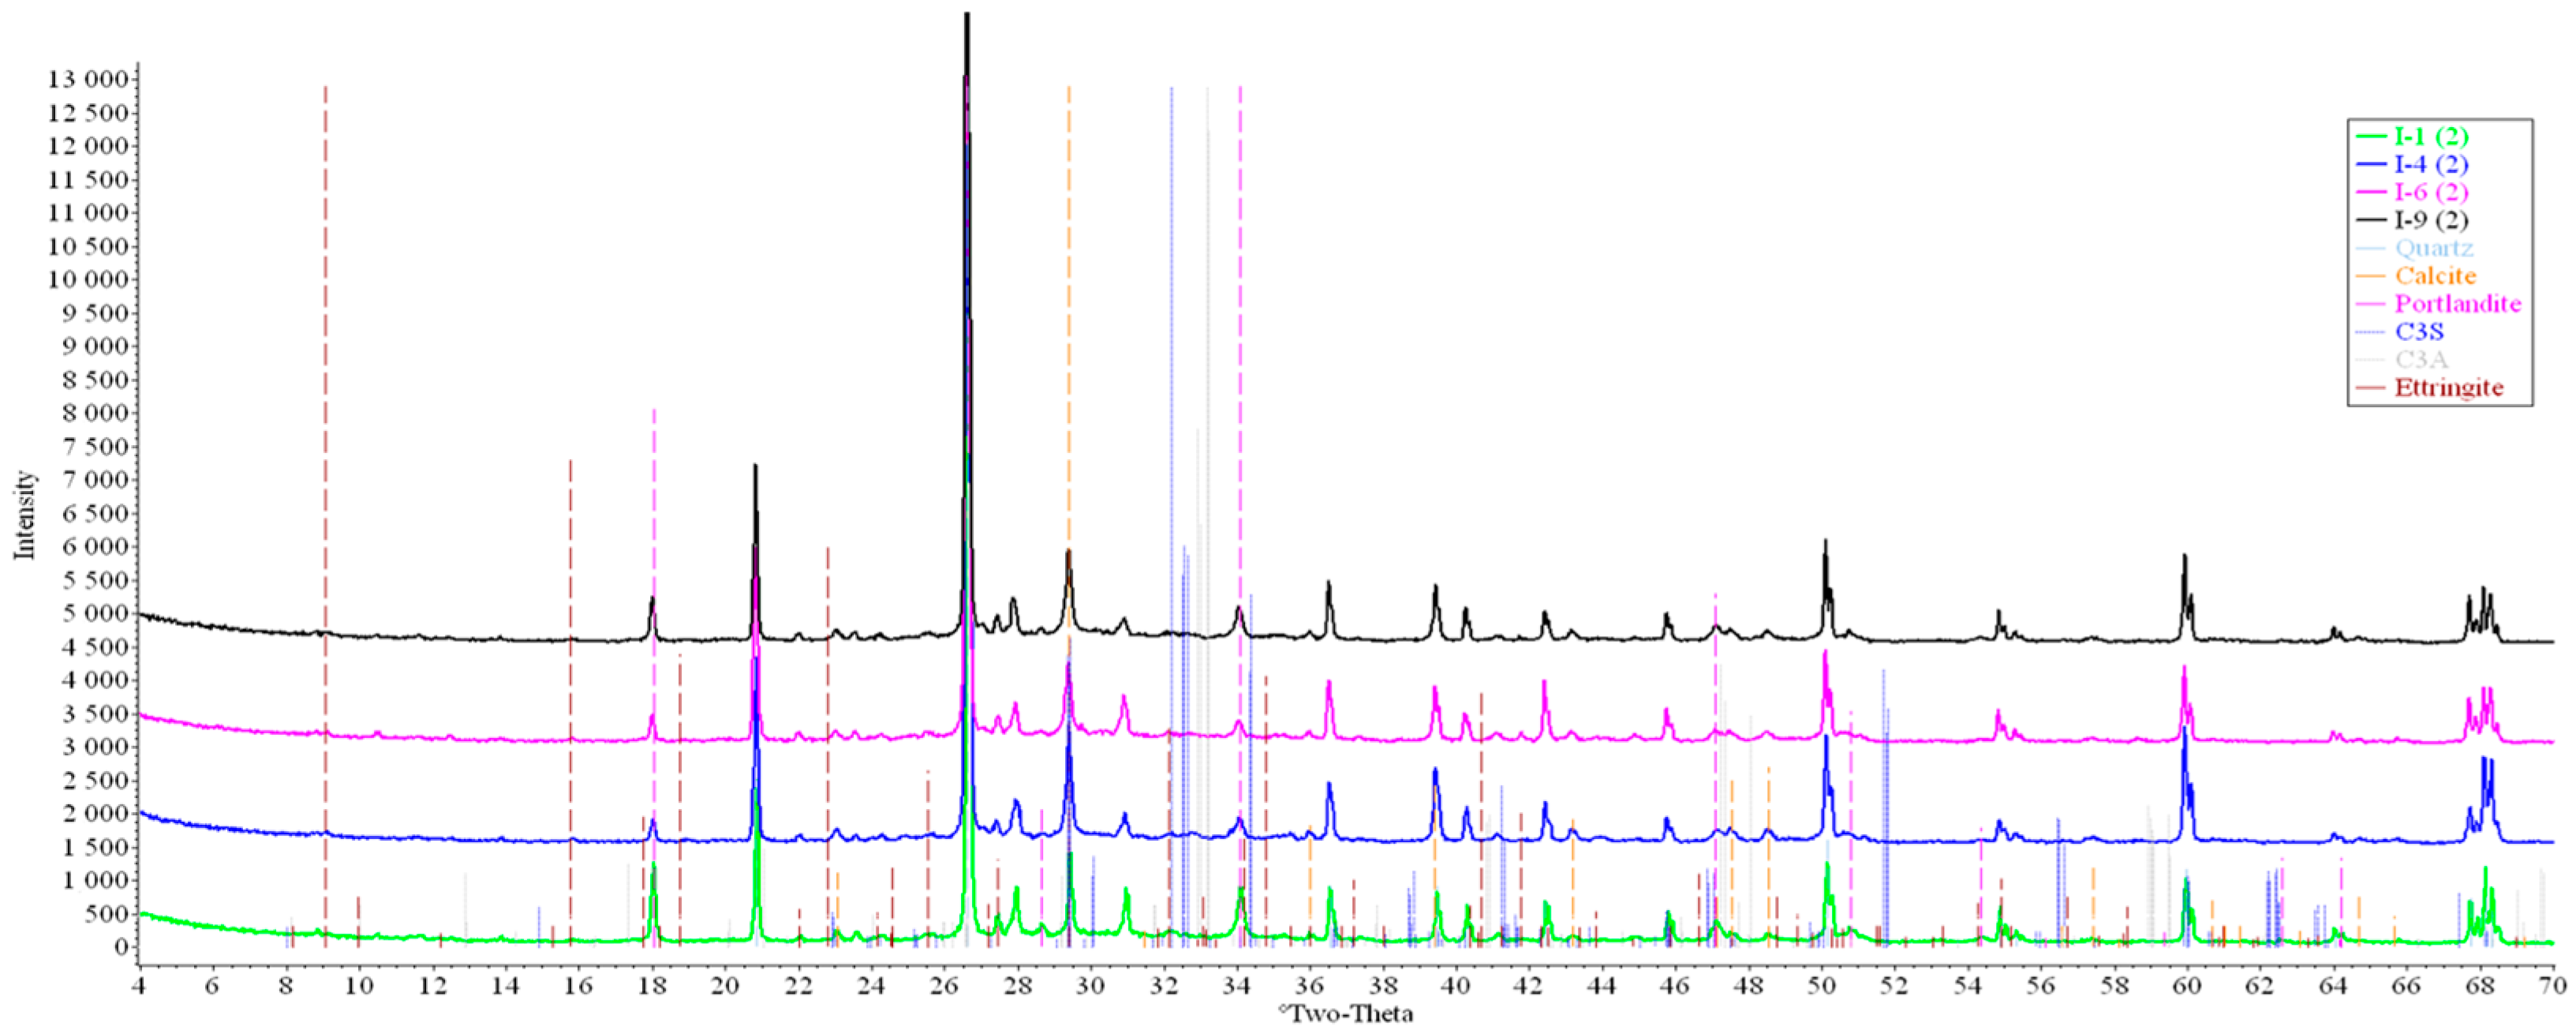
3.4. Results of Carbonation Research Using X-ray Diffraction Method
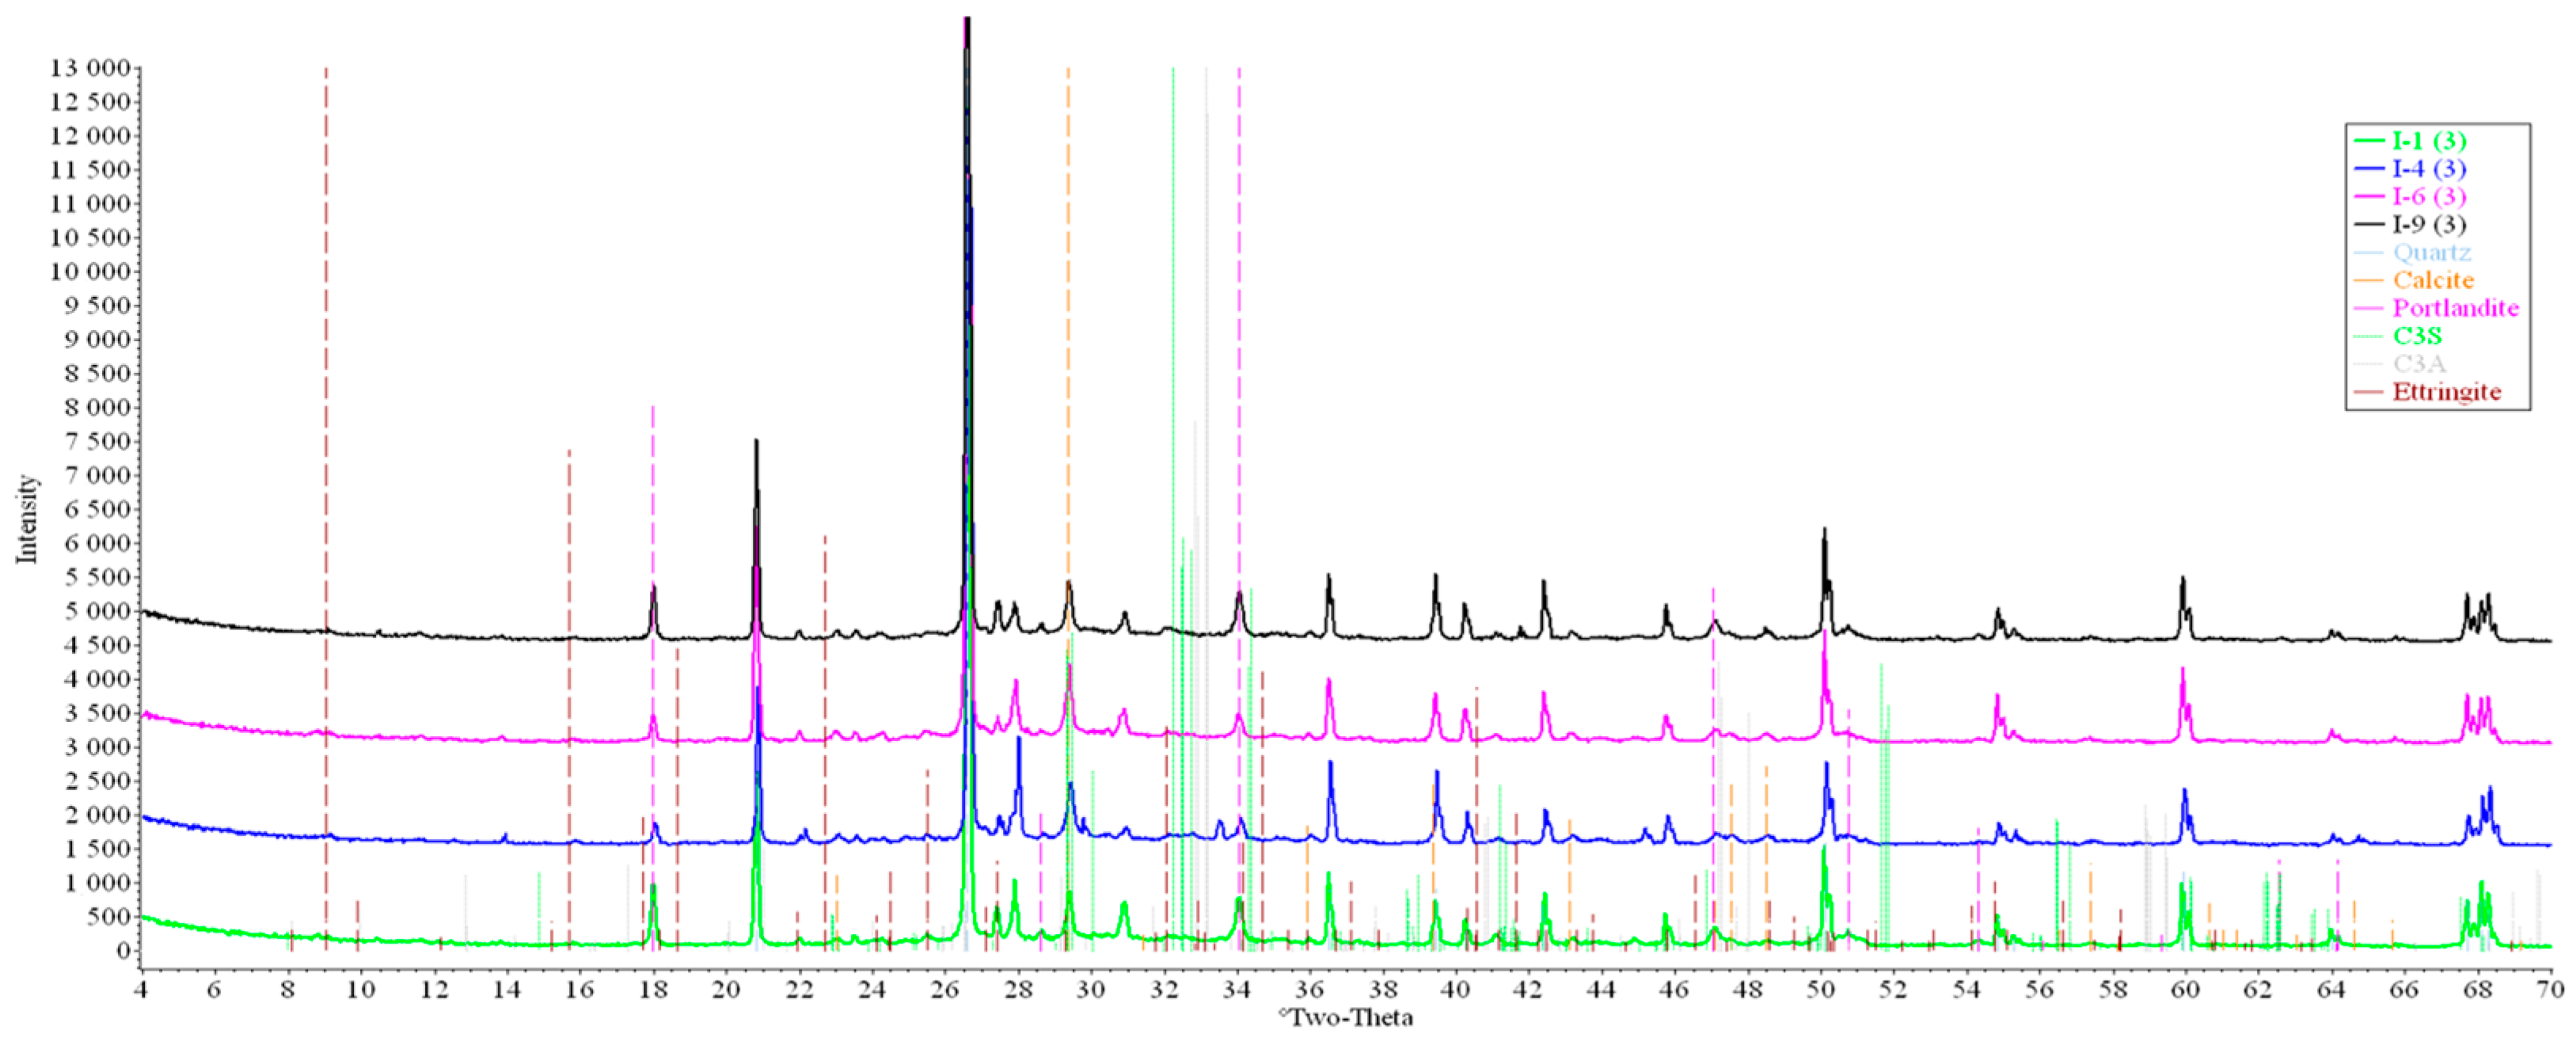
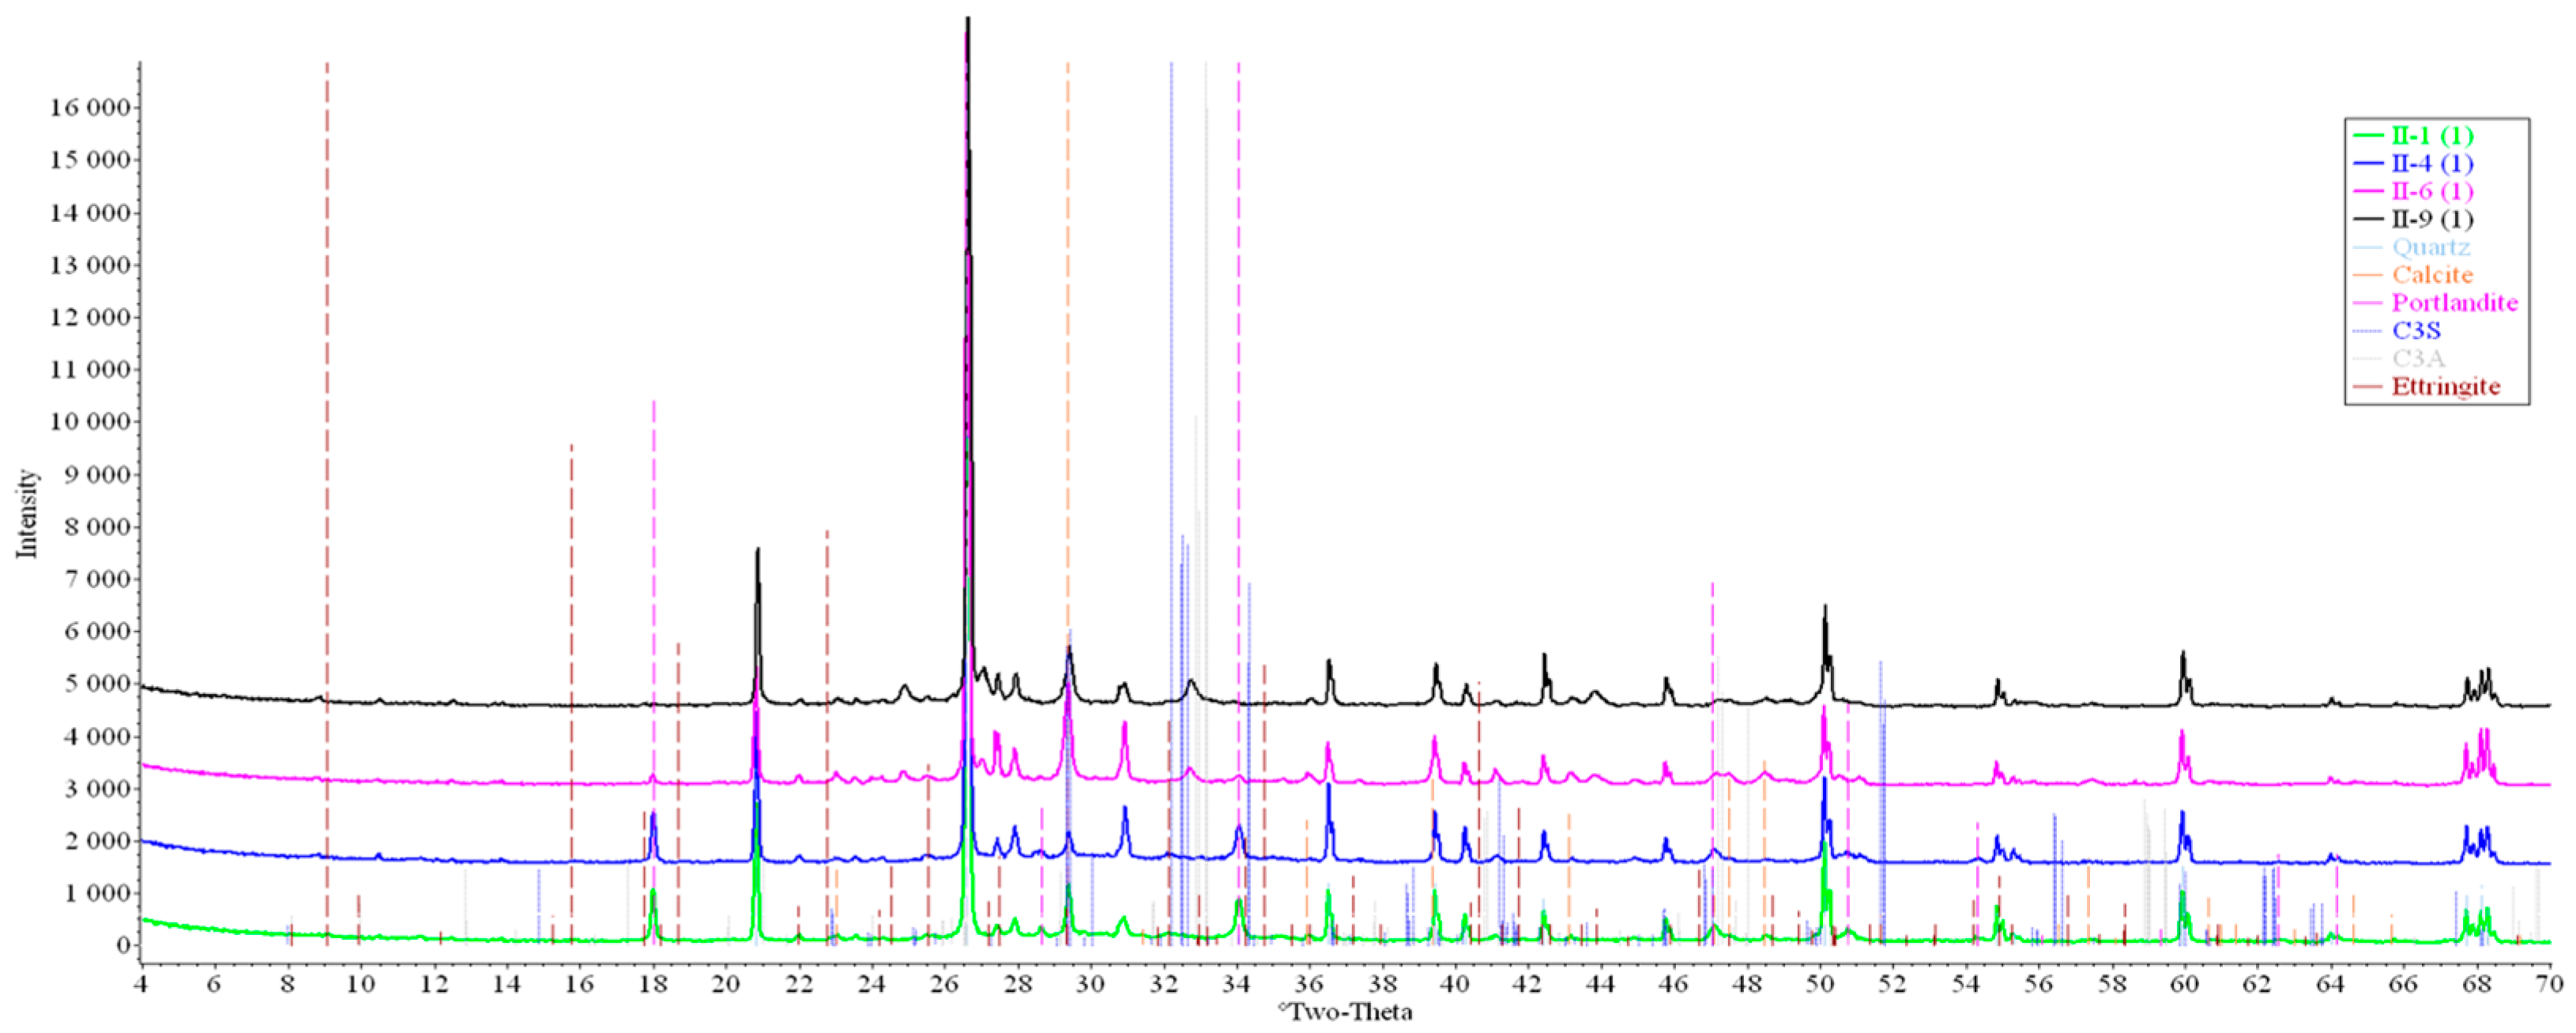
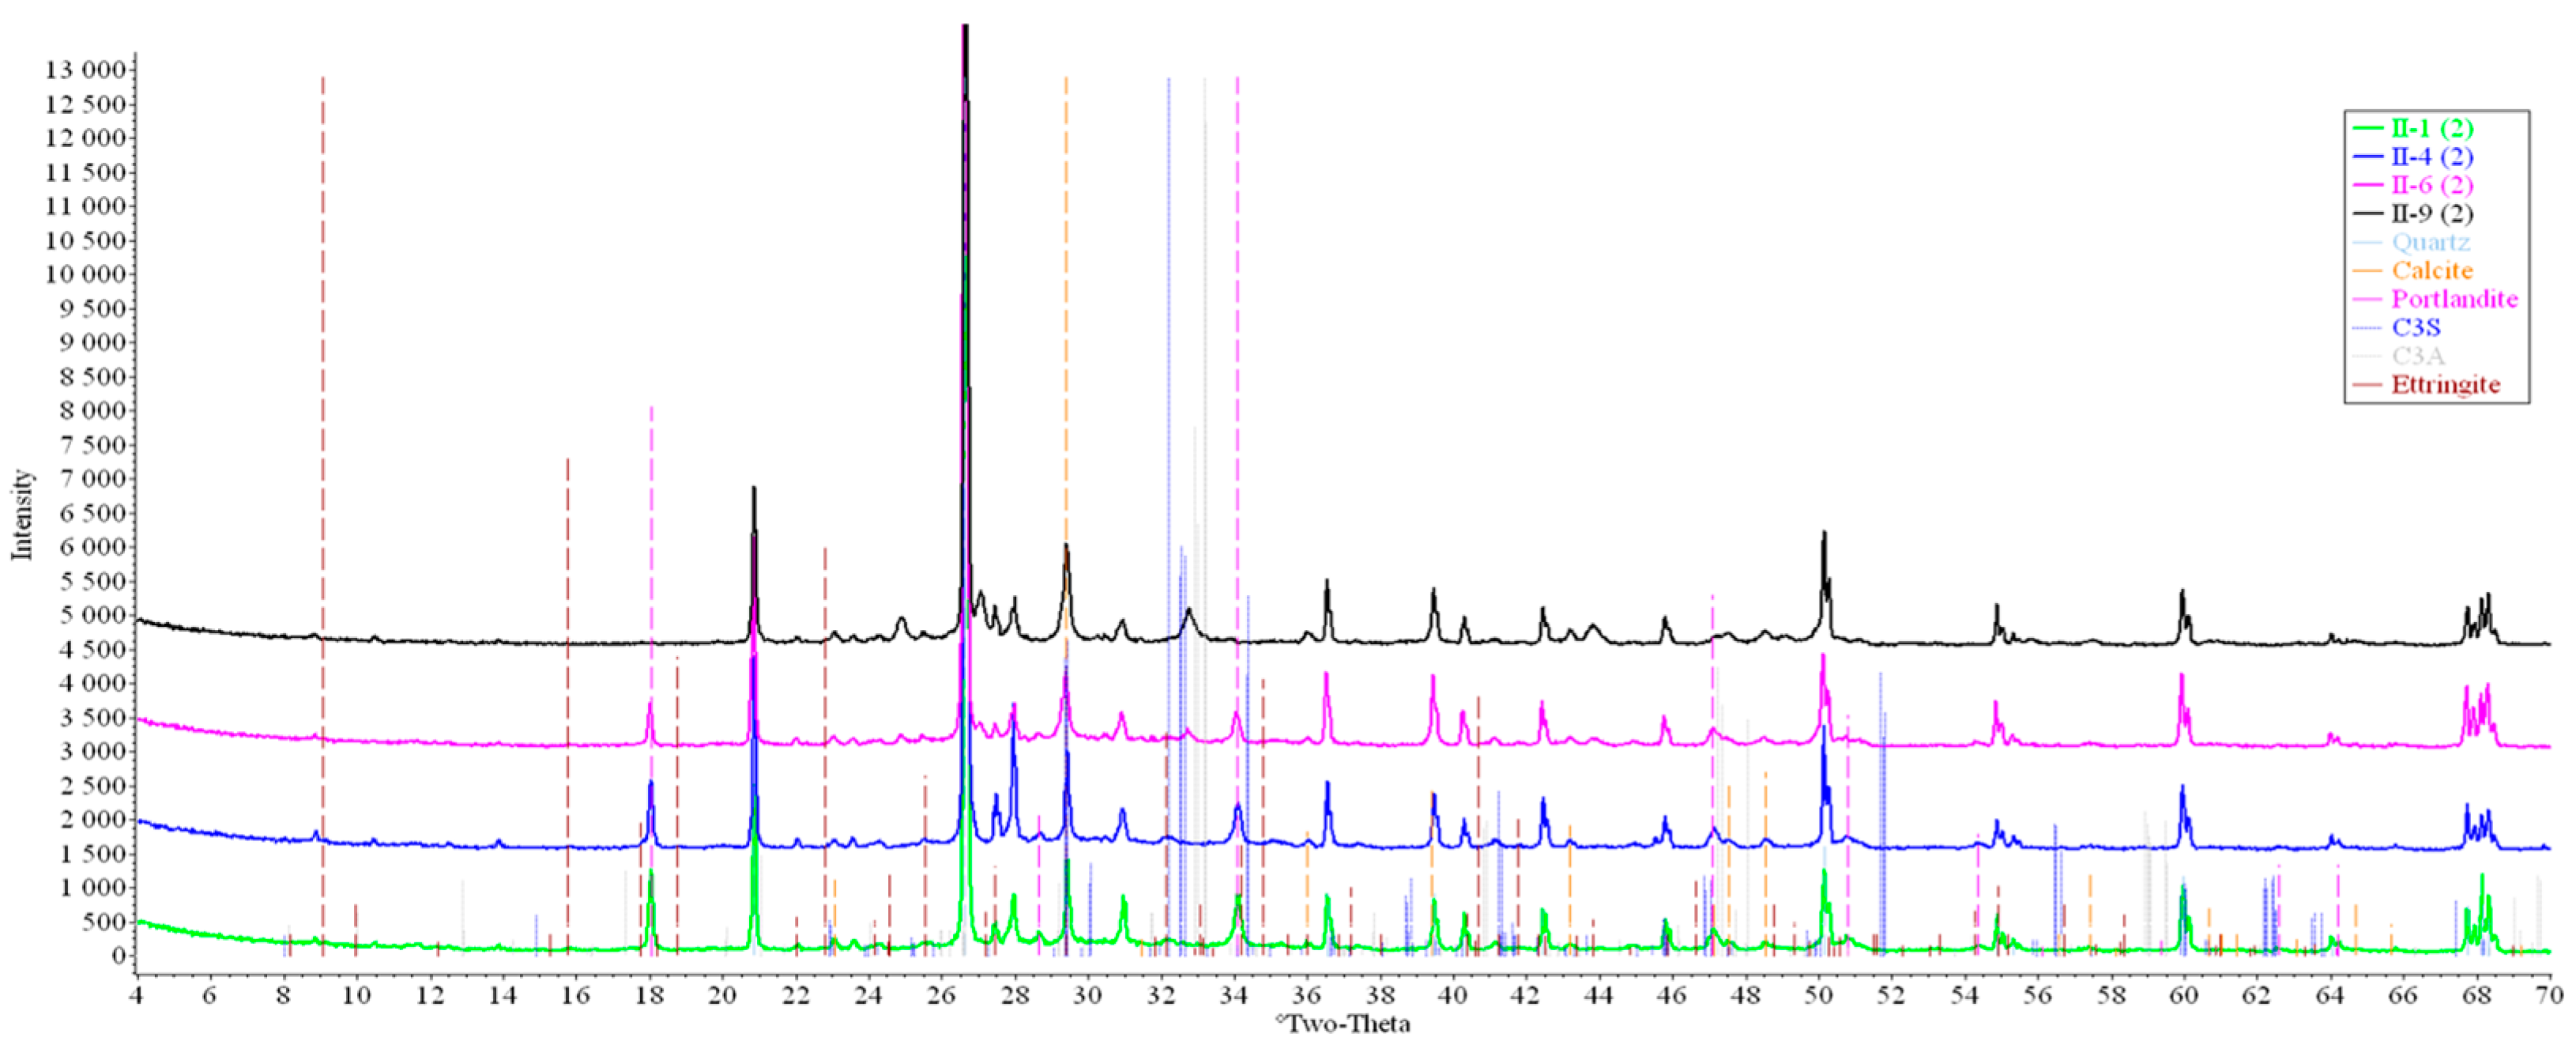
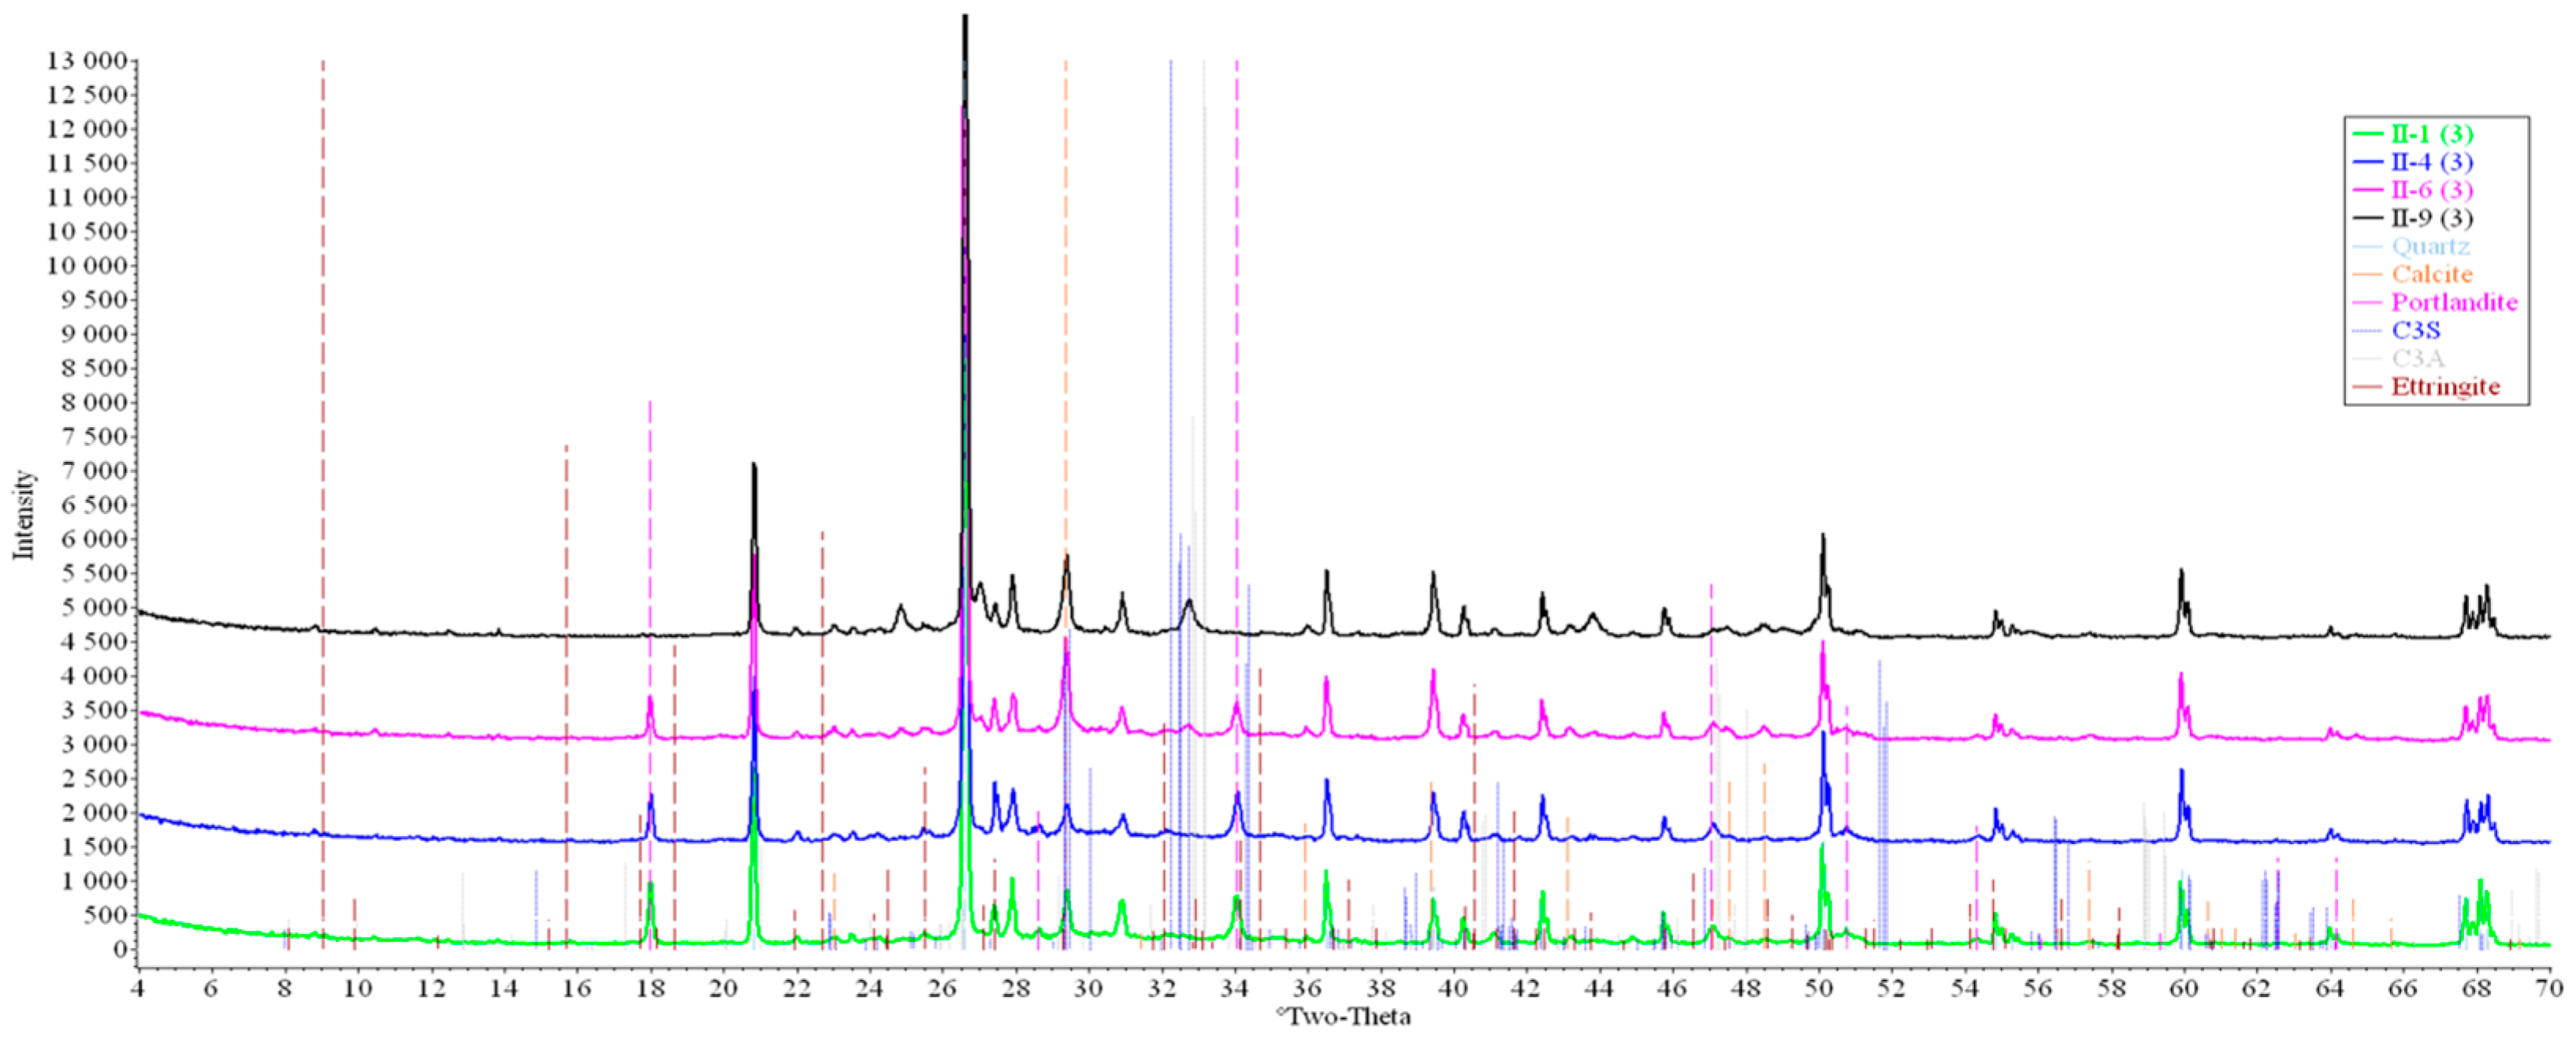
Concrete samples were tested using powder X-ray diffraction (XRD). The research into each sample was carried out at three points (in accordance with Figure 4). Notable diffraction patterns are presented in Figure 9, Figure 10, Figure 11, Figure 12, Figure 13 and Figure 14.
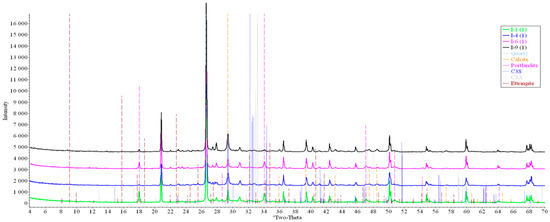
Figure 9.
Comparative analysis of XRD patterns of mode I samples at point 1.
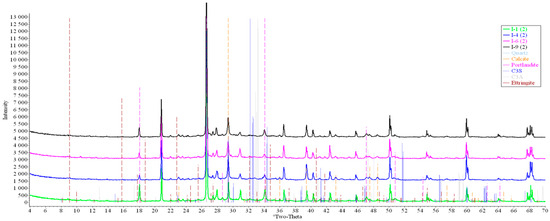
Figure 10.
Comparative analysis of XRD patterns of mode I samples at point 2.
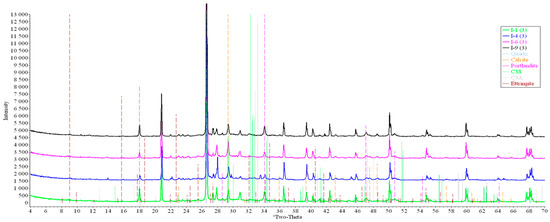
Figure 11.
Comparative analysis of XRD patterns of mode I samples at point 3.
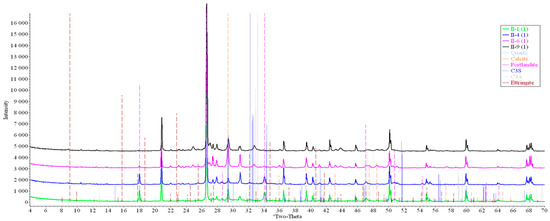
Figure 12.
Comparative analysis of XRD patterns of mode II samples at point 1.
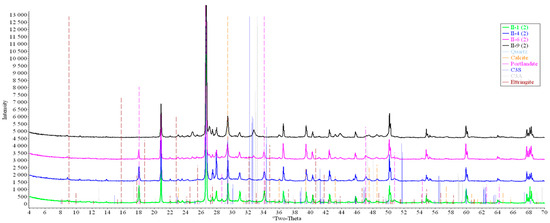
Figure 13.
Comparative analysis of XRD patterns of mode II samples at point 2.
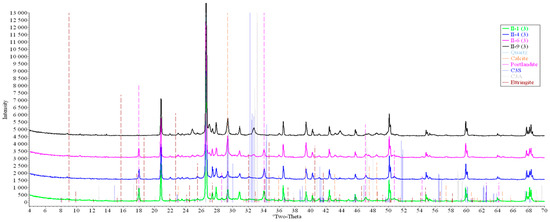
Figure 14.
Comparative analysis of XRD patterns of mode II samples at point 3.
Analysis of the data obtained showed more intense dynamics of the calcium carbonate formation in samples of mode II at point 1 (closer to the outer surface) compared to samples of mode I. A distinctive feature of samples of mode I is the presence of ettringite at all points, which confirms the data of SEM.
The amount of portlandite (Ca(OH)2) in mode II samples at point 1 noticeably decreases during testing. After 168 days of testing (mode II series 9), the mass content of portlandite at point 1 is significantly reduced and is close to zero, which indicates its complete transition to calcite as a result of interaction with CO2.
3.5. Results of Carbonation Research Using TGA Method
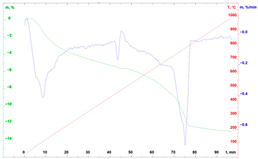
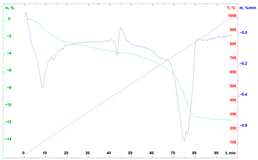
For each sample, two tests were carried out. If there were significant deviations in the thermal characteristics of the samples, identified by the results of a preliminary analysis of the obtained TGA curves, or errors in the form of sharp changes in the values of mass change, an additional test was carried out. In this case, the two closest TGA curves were selected for subsequent analysis. An example of TGA curves obtained and accepted for further analysis is presented in Table 13.
Table 13.
TGA curves for the concrete sample at mode I.
An example of summary data on the obtained TGA curves (at point 1) is presented in Table 14.
Table 14.
Example of the obtained summary data based on the results of TGA.
With accelerated carbonation (mode I), the process begins closer to the surface of the sample (point 1 in accordance with Figure 4). The change in the pore structure also noticeably affects the content of free and interlayer water in the samples (the graphs show the DTG effect with an extremum in the range of 90–120 °C). The mass content of portlandite (Ca(OH)2) also noticeably decreases at point 1, which is explained by interaction with CO2 from the environment and the subsequent intensification of the process of calcium carbonate formation.
In the case of carbonation at elevated temperatures, the process proceeds more intensely. At the same time, the content of free and interlayer water decreases at all three points more evenly compared to samples of mode I. At the 112th day of testing (mode II series 7), new hydrate phases are formed, as indicated by a change in the dynamics of mass loss in the range of 480–760 °C.
At the 84th day of the experiment at elevated temperatures (mode II series 6), the mass content of calcium carbonate inside the sample reaches the same values as during classic accelerated carbonation for 168 days (mode I series 9).
4. Conclusions
Analysis of the data obtained allows us to draw the following conclusions.
When carrying out model-accelerated carbonation under conditions of elevated temperature, the concrete carbonation process proceeds much more intensely compared to classical accelerated carbonation. In the period up to 28 days of testing, the transition of ettringite to monosulfate leads to the microstructure decompression of mode II samples, which leads to a decrease in their compressive strength in comparison with mode I samples (Figure 6).
As a result of carbonation at elevated temperatures for 84 days, a concrete structure is formed similar to that observed after 168 days of accelerated carbonation. At the same time, there are a number of significant differences in the dynamics and depth of carbonation.
A comparison of the data obtained on accelerated carbonation under model aging conditions with the available data from works [24,28,32,38,47,48,49,50,51,52,53] on the analysis of field research data showed the similarity of the results of researching the microstructure and physical and mechanical properties of concrete. Considering the data on microstructural changes, there is a similarity in the dynamics of the formation of calcium carbonate and the compaction of the crystalline structure of concrete. It is noted that, in the case of laboratory samples, the structure is more homogeneous and the carbonation dynamics can be observed more clearly. This fact indicates the relevance of the data obtained by the model aging method both in the case of the normal method of accelerated carbonation and in the case of accelerated carbonation under conditions of elevated temperature.
In general, a positive effect of concrete carbonation expressed in the compaction of the concrete structure due to the filling of the microstructure with carbonation products and a subsequent increase in its strength is observed. In the absence of external factors accelerating the corrosion of concrete, under thermal exposure during the operation of concrete structures of used nuclear fuel storage facilities, a self-healing effect of concrete may be observed as a result of more intense formation of calcium carbonate. However, it is worth considering the fact that the presence of steel reinforcement used in most structures of such buildings will have a negative effect on strength and durability as a result of corrosion of the passivation layer [5,7,8,9,10,11,12,13,16,17,18,28,29,30,31,32]. In this regard, each type of concrete, depending on its mineral and chemical composition, as well as the presence or absence of reinforcement, must be researched in more detail to further predict its performance properties and durability.
5. Future Directions
Selection of optimal conditions for conducting model tests of concrete based on the relationship between thermal and radiation-thermal changes that occur in concrete during irradiation and heat treatment, proven in works [52,53,54,55], will allow for a more in-depth study of the corrosion process of concrete in spent nuclear fuel storage facilities. It will also allow to adapt the methodology for assessing the service life of concrete structures for various operating conditions [56,57].
The obtained data from model research can be used to develop concrete aging models taking into account the dynamics of the carbonation process for the structures of deep-burial storage facilities [2,5,7,58,59].
Further analysis of the obtained data using machine-learning methods will make it possible to establish the dependence of the rate of the corrosion process on temperature, humidity and radiation exposure [4,21,27,39,60]. In addition, it will allow developing methods for assessing the service life and condition of concrete in reinforced concrete structures of deep-burial storage facilities for a long service life under the influence of temperature, humidity and radiation.
Correlation of the data obtained as a result of model tests with the results of research on concrete carbonation in real objects will make it possible to more accurately predict the dynamics of the carbonation process based on the results of model tests, taking into account the requirements of the IAEA [1,2].
According to these requirements, concrete and reinforced concrete structures of such buildings must be designed for a service life of up to 1000 years. In the case of concrete (without the use of reinforcement), its service life can be increased due to the positive effect as a result of carbonation. However, in the presence of metal reinforcement in concrete, the service life of such structures under the same conditions may be significantly lower. More in-depth research should be carried out on the use of alternative methods of concrete reinforcement (for example, fiber) or monolithic concrete structures in areas with the highest thermal and radiation loads. In addition, the authors consider one of the options for extending the service life of such structures to be the development of methods for protecting reinforced concrete structures from carbonation. Model tests will speed up the development and implementation of this approach.
The results of such research may become the basis for adjusting existing methods for calculating and predicting the durability of concrete structures for used nuclear fuel storage facilities.
Author Contributions
Conceptualization, V.M. and A.P.; methodology, V.M., A.P. and A.A.; validation, A.P. and A.A.; formal analysis, V.M., A.P. and L.A.; investigation, V.M., A.P. and A.A.; resources, V.M. and L.A.; writing—original draft preparation, V.M. and L.A.; writing—review and editing, V.M. and L.A.; visualization, V.M., A.A. and L.A.; supervision, A.P.; project administration, A.P. and A.A. All authors have read and agreed to the published version of the manuscript.
Funding
This research received no external funding.
Data Availability Statement
The data presented in this study are available on request from the corresponding author. The data are not publicly available due to internal company policies.
Conflicts of Interest
The authors declare no conflict of interest.
References
- International Atomic Energy Agency (Ed.) Ageing Management of Concrete Structures in Nuclear Power Plants; IAEA Nuclear Energy Series No. NP-T-3.5; International Atomic Energy Agency: Vienna, Austria, 2016; 355p. [Google Scholar]
- IAEA Safety Standards No. SSG-15 (Rev. 1); Storage of Spent Nuclear Fuel. Specific Safety Guide. International Atomic Energy Agency: Vienna, Austria, 2020; 150p.
- STO 1.1.1.02.009.1548-2018; Justification of the Service Life of Building Structures of Buildings and Structures of Nuclear Plants. JSC “Concern Rosenergoatom”: Moscow, Russia, 2019; 92p.
- Medvedev, V.; Pustovgar, A. A Review of Concrete Carbonation and Approaches to Its Research under Irradiation. Buildings 2023, 13, 1998. [Google Scholar] [CrossRef]
- Alexander, M.G. Service life design and modelling of concrete structures—Background, developments, and implementation. Rev. Alconpat 2018, 8, 224–245. [Google Scholar] [CrossRef]
- Suleymanova, L.A.; Pogorelova, I.A.; Suleymanov, K.A.; Kirilenko, S.V.; Marushko, M.V. Durability as integral characteristic of concrete. IOP Conf. Ser. Mater. Sci. Eng. 2018, 327, 042127. [Google Scholar] [CrossRef]
- Model Code for Service Life Design; fib Bulletin 34; Federation International du Beton (FIB): Lausanne, Switzerland, 2006; 116p. [CrossRef]
- Di, N.T. The Durability and Life Prediction of Concrete Structures; Science Press: Beijing, China, 2003. (In Chinese) [Google Scholar]
- Mahmood, A.; Ibuk, A.; Vogel, M.; Neuhaus, C.; Dehn, F.; Thissen, P. Unraveling Carbonation and CO2 Capture in Calcium–Silicate–Hydrate. ACS Sustain. Chem. Eng. 2023, 11, 13002–13012. [Google Scholar] [CrossRef]
- Izadifar, M.; Natzeck, C.; Emmerich, K.; Weidler, P.G.; Gohari, S.; Burvill, C.; Thissen, P. Unexpected Chemical Activity of a Mineral Surface: The Role of Crystal Water in Tobermorite. J. Phys. Chem. C 2022, 126, 12405–12412. [Google Scholar] [CrossRef]
- Chun, Y.-M.; Naik, T.R.; Kraus, R.N. Carbon dioxide sequestration in concrete in different curing environments. In Proceedings of the Coventry University International Conference on Sustainable Construction Materials and Technologies, Coventry, UK, 11–13 June 2007; pp. 18–24. [Google Scholar]
- Kutchko, B.G.; Strazisar, B.R.; Dzombak, D.A.; Lowry, G.V.; Thaulow, N. Degradation of Well Cement by CO2 under Geologic Sequestration Conditions. Environ. Sci. Technol. 2007, 41, 4787–4792. [Google Scholar] [CrossRef] [PubMed]
- Alexander, M.G.; Santhanam, M. Achieving durability in reinforced concrete structures: Durability indices, durability design and performance-based specifications. In Proceedings of the International Conference on Advances in Building Sciences & Rehabilitation and Restoration of Structures, IIT Madras, Chennai, India, 13–16 February 2013. [Google Scholar]
- Wei sheng Lu, V.W.T. Construction waste management policies and their effectiveness in Hong Kong: A longitudinal review. Renew. Sustain. Energy Rev. 2013, 23, 214–223. [Google Scholar]
- Veselkin, A.P. Study of the Protective Properties of Concrete of Different Compositions; Issues in the Physics of Reactor Protection; Atomizdat: Moscow, Russia, 1974; 230p. [Google Scholar]
- Suleymanova, L.A. Energy of inner connections in material—Basis of its durability, deformability and resistance to different factors. Her. Belgorod State Technol. Univ. Named V. G. Shukhov 2002, 6, 154–159. [Google Scholar]
- Engelund, S. General Guidelines for Durability Design and Redesign: DuraCrete—Probabilistic Performance Based Durability Design of Concrete Structures (Contract BRPR-CT95-0132, Project BE95-1347); CUR: Gouda, The Netherlands, 2000; 109p. [Google Scholar]
- Sarja, A.; Vesikari, E. Durability Design of Concrete Structures; CRC Press: London, UK, 2019; 160p. [Google Scholar]
- Esenov, A.V. Effective “Dry” Serpentinite Concrete for Radiation and Thermal Protection of the VVER Type Reactor. Ph.D. Thesis, Moscow State University of Civil Engineering, Moscow, Russia, 2014. (In Russian). [Google Scholar]
- Korenevsky, V.V. The Effect of Irradiation on Concrete and Its Components. Ph.D. Thesis, Moscow Institute of Civil Engineering named after Valerian V. Kuibyshev, Moscow, Russia, 1974. (In Russian). [Google Scholar]
- Literature Review of Concrete Durability & Service Life Requirements; PIVOT Engineering, ACI Foundation: Farmington Hills, MI, USA, 2020; p. 89.
- Gladkov, D.I.; Suleymanova, L.A.; Nesterov, A.P. Strength as an integral characteristic of concrete. In Proceedings of the International Conference on Cement Combinations for Durable Concrete, Scotland, UK, 5–7 July 2005. [Google Scholar]
- Ramachandran, V.S.; Zhang, C. Cement with calcium carbonate additions. In Proceedings of the 8th International Congress on the Chemistry of Cement, Rıo de Janeiro, Brazil, 22–27 September 1986; pp. 178–187. [Google Scholar]
- Sanjuan, M.A.; Andrade, C.; Cheyrezy, M. Concrete carbonation tests in natural and accelerated conditions. Adv. Cem. Res. 2003, 15, 171–180. [Google Scholar] [CrossRef]
- Ngala, V.T.; Page, C.L. Effects of carbonation on pore structure and diffusional properties of hydrated cement pastes. Cem. Concr. Res. 1997, 27, 995–1007. [Google Scholar] [CrossRef]
- Thiery, M.; Villain, G.; Dangla, P.; Platret, G. Investigation of the carbonation front shape on cementitious materials: Effects of the chemical kinetics. Cem. Concr. Res. 2007, 37, 1047–1058. [Google Scholar] [CrossRef]
- Zhang, H.; Huang, Y.J.; Xu, S.L.; Natarajan, S.; Yao, F. An explicit methodology of random fibre modelling for FRC fracture using non-conforming meshes and cohesive interface elements. Compos. Struct. 2023, 310, 116762. [Google Scholar] [CrossRef]
- Neves, R.; Branco, F.; Brito, J.D. Field assessment of the relationship between natural and accelerated concrete carbonation resistance. Cem. Concr. Compos. 2013, 41, 9–15. [Google Scholar] [CrossRef]
- Leemann, A.; Nygaard, P.; Kaufmann, J.; Loser, R. Relation between carbonation resistance, mix design and exposure of mortar and concrete. Cem. Concr. Compos. 2015, 62, 33–43. [Google Scholar] [CrossRef]
- Ashraf, W.; Olek, J.; Atakan, V. A comparative study of the reactivity of calcium silicates during hydration and carbonation reactions. In Proceedings of the International Congress on the Chemistry of Cement, Beijing, China, 13–16 October 2015. [Google Scholar]
- Morandeau, A.; Thiéry, M.; Dangla, P. Investigation of the carbonation mechanism of CH and C–S–H in terms of kinetics, microstructure changes and moisture properties. Cem. Concr. Res. 2014, 56, 153–170. [Google Scholar] [CrossRef]
- Papadakis, V.; Vayenas, C.; Fardis, M. Physical and chemical characteristics affecting the durability of concrete. ACI Mater. J. 1991, 8, 186–196. [Google Scholar]
- Houst, Y.F.; Wittmann, F.H. Depth profiles of carbonates formed during natural carbonation. Cem. Concr. Res. 2002, 32, 1923–1930. [Google Scholar] [CrossRef]
- Hyvert, N.; Sellier, A.; Duprat, F.; Rougeau, P.; Francisco, P. Dependency of C–S–H carbonation rate on CO2 pressure to explain transition from accelerated tests to natural carbonation. Cem. Concr. Res. 2010, 40, 1582–1589. [Google Scholar] [CrossRef]
- Shen, L.; Gao, T.; Zhao, J.; Wang, L.; Wang, L.; Liu, L.; Chen, F.; Xue, J. Factory-level measurements on CO2 emission factors of cement production in China. Renew. Sustain. Energy Rev. 2014, 34, 337–349. [Google Scholar] [CrossRef]
- Zhang, H.; Huang, Y.J.; Xu, S.L.; Hu, X.J.; Zheng, Z.S. 3D cohesive fracture of heterogeneous CA-UHPC: A mesoscale investigation. Int. J. Mech. Sci. 2023, 249, 108270. [Google Scholar] [CrossRef]
- Young, J.F.; Berger, R.L.; Breese, J. Accelerated curing of compacted calcium silicate mortars on exposure to CO2. Am. Ceram. Soc. 1974, 57, 394–397. [Google Scholar] [CrossRef]
- Morandeau, A.E.; White, C.E. In situ X-ray pair distribution function analysis of accelerated carbonation of a synthetic calcium–silicate–hydrate gel. Mater. Chem. 2015, 3, 8597–8605. [Google Scholar] [CrossRef]
- Huang, Y.J.; Guo, F.Q.; Zhang, H.; Yang, Z.J. An efficient computational framework for generating realistic 3D mesoscale concrete models using micro X-ray computed tomography images and dynamic physics engine. Cem. Concr. Compos. 2022, 126, 104347. [Google Scholar] [CrossRef]
- GOST 31108-2020; Common Cements. Specifications. Introduced 1 March 2021; Standartinform: Moscow, Russia, 2016; 15p.
- GOST 8736-2014; Sand for Construction Works. Specifications. Introduced 1 April 2015; Standartinform: Moscow, Russia, 2019; 11p.
- BS EN 13263-1:2005+A1:2009; Silica Fume for Concrete—Part 1: Definitions, Requirements and Conformity Criteria. BSI: London, UK, 2010; 28p.
- GOST 26633-2015; Normal-Weight and Sand Concretes. Specifications. Introduced 1 September 2016; Standartinform: Moscow, Russia, 2019; 15p.
- GOST 22685-89; Moulds for Making Control Specimens of Concrete. Specifications. Introduced 1 January 1990; Standartinform: Moscow, Russia, 2006; 13p.
- GOST 10180-2012; Concretes. Methods for Strength Determination Using Reference Specimens. Introduced 1 July 2013; Standartinform: Moscow, Russia, 2018; 36p.
- GOST 31383-2008; Protection against Corrosion of Concrete and Reinforced Concrete Constructions. Test Methods. Introduced 1 July 2010; Standartinform: Moscow, Russia, 2010; 40p.
- El-Hassan, H.; Shao, Y. Carbon storage through concrete block carbonation. Clean Energy Technol. 2014, 2, 287–291. [Google Scholar] [CrossRef]
- Denisov, A.V.; Medvedev, V.V.; Pustovgar, A.P.; Solovyov, V.N. Evaluation of radiation stability of the cement stone modified with the most perspective additives for application in cocrete for the purpose of acceleration of production of concrete works at construction of nuclear stations. In Proceedings of the XXI Russian-Slovak-Polish Seminar Theoretical Foundation of Civil Engineering, Arkhangelsk, Russia, 3–7 July 2012. [Google Scholar]
- Huang, Y.J.; Yang, Z.J.; Chen, X.W.; Liu, G.H. Monte Carlo simulations of meso-scale dynamic compressive behavior of concrete based on X-ray computed tomography images. Int. J. Impact Eng. 2016, 97, 102–115. [Google Scholar] [CrossRef]
- Komarovskii, A. Construction of Nuclear Installations; State Publishing House of Power Literature: Moscow, Russia, 1961; p. 336. (In Russian) [Google Scholar]
- Dubrovskii, V.B. Radiation Resistance of Mineral and Polymer Building Materials; MEI Publishing House: Moscow, Russia, 2012; p. 384. (In Russian) [Google Scholar]
- Dubrovsky, V.B.; Lavdansky, P.A.; Pergamenshchik, B.K.; Solovyov, V.N. Radiation Resistance of Materials; Atomizdat: Moscow, Russia, 1973; 264p. (In Russian) [Google Scholar]
- Ershov, V.Y. Radiation Resistance of Portland Cement Stone with Chemical and Mineral Additives. Ph.D. Thesis, Moscow Institute of Civil Engineering named after Valerian V. Kuibyshev, Moscow, Russia, 1992. (In Russian). [Google Scholar]
- Medvedev, V.V. Increasing the Radiation Resistance of Concrete through the Use of Effective Superplasticizers. Ph.D. Thesis, Moscow State University of Civil Engineering, Moscow, Russia, 2014. (In Russian). [Google Scholar]
- Dubrovsky, V.B. Radiation Resistance of Construction Materials; Stroyizdat: Moscow, Russia, 1977; 277p. (In Russian) [Google Scholar]
- RD EO 1.1.2.99.0538-2011; Methodology for Assessing the Technical Condition and Residual Life of Containment Shells of Nuclear Power Plants with VVER-1000. JSC “Concern Rosenergoatom”: Moscow, Russia, 2013.
- Potapov, V.V.; Loginov, A.M.; Ilyin, V.A.; Kolomiets, V.G.; Pustovgar, A.P. Determination of the resource characteristics of the containment shell as one of the tasks of life cycle management of NPPs with VVER-1000. At. Energy 2015, 119, 308–310. [Google Scholar]
- Taffese, W.Z.; Sistonen, E.; Puttonen, J. CaPrM: Carbonation prediction model for reinforced concrete using machine learning methods. Constr. Build. Mater. 2015, 100, 70–82. [Google Scholar] [CrossRef]
- Garboczi, E.J. Three-dimensional mathematical analysis of particle shape using X-ray tomography and spherical harmonics: Application to aggregates used in concrete. Cem. Concr. Res. 2002, 32, 1621–1638. [Google Scholar] [CrossRef]
- Garg, A.; Aggarwal, P.; Aggarwal, Y.; Belarbi, M.O.; Chalak, H.D.; Tounsi, A.; Gulia, R. Machine learning models for predicting the compressive strength of concrete containing nano silica. Comput. Concr. 2022, 30, 33–42. [Google Scholar]


Disclaimer/Publisher’s Note: The statements, opinions and data contained in all publications are solely those of the individual author(s) and contributor(s) and not of MDPI and/or the editor(s). MDPI and/or the editor(s) disclaim responsibility for any injury to people or property resulting from any ideas, methods, instructions or products referred to in the content. |
© 2023 by the authors. Licensee MDPI, Basel, Switzerland. This article is an open access article distributed under the terms and conditions of the Creative Commons Attribution (CC BY) license (https://creativecommons.org/licenses/by/4.0/).