Abstract
Adequate school buildings are essential for the development of children, young people, and adolescents, as they must provide conditions that support their well-being and health. A healthy and comfortable indoor environment is critical for students’ performance in the learning process. This study aims to evaluate the indoor environment in kindergartens located in northern Portugal, with a primary focus on thermal comfort and indoor air quality. To achieve this, five buildings with varying construction characteristics were monitored, with temperature and relative humidity measurements taken in classrooms of different orientations over time. Additionally, the outdoor climate was also monitored. Based on the collected data, thermal comfort was evaluated using the adaptive model defined by the European standard EN 16798. Continuous monitoring of carbon dioxide concentration was also conducted in three of these buildings. The results reveal significant heterogeneity among the buildings, demonstrating the influence of construction characteristics on the interior thermal conditions. The recorded temperatures ranged from 10 °C to 27 °C, highlighting a substantial variability in performance across the different buildings. Particularly, the orientation and size of glazed openings, together with the lack of thermal insulation in the building envelope, especially in the roof, were found to have an important impact on the thermal comfort of the occupants. Furthermore, a relationship was observed between the daily maximum carbon dioxide concentration and the outdoor temperature, as a result of users’ efforts to minimize uncontrolled air infiltration, by limiting the opening of doors and windows, with consequences in the air exchange between the interior and exterior.
1. Introduction
Understanding the quality of the indoor environment in educational spaces is crucial for assessing their current conditions and, if necessary, proposing effective improvement measures. This is especially pertinent in kindergartens and schools, where children and young people spend long periods indoors. The environmental conditions within these spaces significantly impact both their health and learning processes. In this context, monitoring environmental parameters, particularly temperature, relative humidity, and carbon dioxide concentration, becomes especially relevant.
The formation of cognitive structures is deeply influenced by a person’s life experiences, with school playing a critical role in this development. Classrooms, therefore, are not just spaces for learning but are also fundamental environments that contribute to cognitive and social development. The intrinsic characteristics of classrooms, both in architectural and constructive terms, play a very important role in student performance and can significantly enhance the learning process [1,2,3,4].
Numerous studies have demonstrated the impact of thermal comfort and indoor air quality on students’ well-being and academic performance [5,6,7]. For example, research has shown that students perform better in environments where temperature and air quality are maintained within optimal ranges, as these factors reduce distractions and discomfort, allowing for better concentration and learning outcomes. However, various studies have also pointed out that many school spaces do not meet the necessary environmental standards, leading to conditions that are less than ideal for learning [8,9]. These inadequacies can range from poor ventilation, resulting in high levels of carbon dioxide, to suboptimal temperature control, which can lead to discomfort and decreased productivity among students. Additionally, there is often a discrepancy between the predicted comfort levels, based on standard models, and the actual perceptions and experiences of the space users [10,11].
Baseline measurements of indoor environmental quality (IEQ) are therefore crucial when planning renovation projects for educational buildings. These measurements provide a clear understanding of the existing conditions and help identify specific areas that require improvement [12,13]. Without accurate data, efforts to enhance IEQ may be misdirected, leading to suboptimal outcomes [14]. Detailed IEQ assessments provide valuable insights for the design and implementation of rehabilitation projects, guiding decisions on whether to act on the building envelope, upgrade ventilation systems, improve lighting, or reduce noise pollution. For instance, identifying high levels of carbon dioxide (CO2) can lead to the upgrading of ventilation systems [15,16,17], while poor lighting assessments might result in the installation of better lighting fixtures. Acoustic measurements can guide the selection of materials and designs that minimize noise pollution [18,19]. An integrated approach is presented by Hu et al. [20], proposing a retrofit optimization method for kindergarten buildings that considers thermal comfort, daylighting, and life-cycle carbon emissions.
Renovation projects often aim to improve energy efficiency, and accurate IEQ measurements are instrumental in achieving this goal [21]. By understanding the thermal performance of a building, strategies can be developed to enhance insulation [22], optimize HVAC systems [23], and utilize passive heating and cooling techniques [24]. These approaches can significantly reduce energy consumption while simultaneously improving comfort levels. Post-renovation, continuous monitoring of IEQ ensures that improvements are maintained over time, allowing for early detection of any deviations from the desired conditions and enabling timely interventions. This ongoing evaluation is essential for sustaining the benefits of renovation and ensuring a healthy learning environment for students and staff alike [25,26]. Domínguez-Amarillo et al. [27] used a school in Seville (Spain) as a case study and proposed a post-occupancy strategy combined with participatory action to empower occupants as agents actively engaging in their own comfort in order to mitigate overheating issues.
Various standards and regulations specify procedures and models for evaluating thermal comfort in buildings, including kindergartens. Among the numerous alternatives, adaptive comfort models have gained prominence in recent years due to their increased flexibility and ability to reflect the behavior of space users more accurately. The EN 16798:2020 [28] standard presents an adaptive model based on a range of operative comfort temperatures, which are determined from an exponentially weighted running mean outdoor temperature over the past seven days. Adaptive models have been successfully applied in several previous studies focused on educational buildings. Yun et al. [29] conducted a study in 10 kindergartens in South Korea, comparing the adaptive model proposed by ASHRAE 55 [30] with that of EN 16798:2020 [28]. Their goal was to gather data to support the development of a new comfort model specifically tailored for children. The findings highlighted the need for adaptive comfort models that are sensitive to the unique requirements of younger occupants. Similarly, Aparicio-Ruiz et al. [31] analyzed the thermal perception of children aged between 10 and 11 years, taking into account their adaptive behavior. Their study revealed a preference for cooler environments during the summer and suggested that comfort models may need to be adjusted to reflect the socio-economic contexts of the users.
The indoor air quality (IAQ) of classrooms is a critical factor influencing the health, comfort, and cognitive performance of students. Among various IAQ parameters, CO2 concentration is a key indicator and a widely accepted metric of ventilation effectiveness and occupant density [32]. High CO2 levels are often associated with inadequate ventilation, which can lead to discomfort, drowsiness, and impaired decision-making abilities among students and teachers. Consequently, understanding and optimizing CO2 levels through effective ventilation strategies has become a focus of research in the field of building engineering, particularly within educational environments [33,34]. In classrooms, where the density of occupants is typically high, CO2 levels can quickly rise if ventilation is insufficient. The ASHRAE Standard 62.1:2022 [35] recommends that indoor CO2 concentrations should not exceed 700 ppm above outdoor levels, which typically range from 350 to 450 ppm. Zapata-Lancaster et al. [36] investigated the actions taken by teachers and pupils of two primary schools in South Wales (UK) to balance the thermal comfort needs while minimizing CO2 concentration levels. The results showed the difficulty in making IAQ requirements compatible with thermal comfort criteria. These conclusions are in line with the work of Fernández-Agüera et al. [37], who analyzed the relationship between air tightness and CO2 concentration in classrooms located in southern Spain. Recently, Munckton and Rajagopalan [38] examined current practices in kindergarten heating, cooling, and ventilation, and investigated how IAQ and thermal comfort interact with each other at five selected kindergartens in Melbourne (Australia).
The importance of measuring and evaluating indoor environmental conditions in educational spaces cannot be overstated. Ensuring optimal IEQ in kindergartens and schools is fundamental to the health, well-being, and academic success of students. Comprehensive assessment methodologies, informed policy frameworks, and proactive management practices are necessary to create environments that support learning and development. Additionally, accurate IEQ measurements are indispensable in guiding and supporting building renovation projects, ensuring that improvements are targeted, effective, and sustainable. As awareness and technological solutions continue to advance, the potential for enhancing IEQ in educational settings becomes increasingly achievable, leading to better learning outcomes and healthier environments.
The primary objective of this study is to analyze the indoor environmental conditions of five kindergartens through continuous monitoring of temperature, relative humidity, and carbon dioxide concentration in classrooms over approximately three months, as a support tool for the future renovation of the buildings. Gaining accurate insights into thermal comfort and ventilation performance within these school buildings will contribute decisively to optimizing their performance after renovation. This is particularly true when considering the architectural features as geometric, and construction parameters that characterize these buildings. By understanding the existing conditions and how they interact with various building characteristics, it becomes possible to make informed decisions that enhance both the comfort and the energy efficiency not only of buildings under study, but also of other buildings with similar features.
2. Framework
2.1. Case Studies
Five kindergartens, designated as (i) to (v) in Figure 1, were selected as case studies. The buildings were chosen to represent various construction periods of Portuguese kindergartens. This approach not only broadens the applicability of the conclusions to other buildings but also enables the exploration of potential correlations between building performance and construction characteristics. However, due to the small sample size, caution is advised when generalizing the findings, particularly in regions with different climatic conditions. Moreover, the sample size and heterogeneity can be a limitation if one intends to establish general guidelines or recommendations.
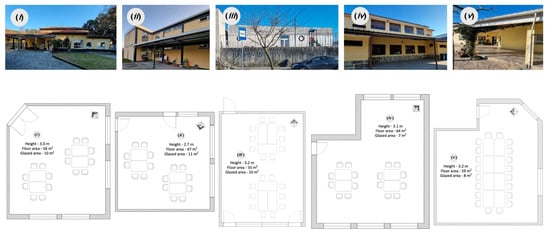
Figure 1.
Case studies (i–v): photography of the building and plan of the room under study.
All these buildings are located in Porto region, in the north of Portugal. For each kindergarten, a single classroom was selected for detailed environmental monitoring. In cases where the building housed multiple classrooms, the classroom occupied by 5-year-old children was chosen as the primary focus for measurements. This decision was based on the assumption that this age group would provide a representative sample of the typical indoor environmental conditions experienced by children in the kindergarten setting and would have greater maturity for evaluating thermal comfort through questionnaires. The selected classrooms are all located on the ground floors of the buildings, and their floor plans, areas, and heights are shown in Figure 1.
The measurements involved continuous monitoring of several key environmental parameters, including air temperature, relative humidity, and carbon dioxide concentration. These data were collected over a period of approximately three months, allowing for a comprehensive assessment of the indoor environmental conditions in each classroom. It is important to note that while air temperature and relative humidity were monitored in all five buildings, carbon dioxide concentration measurements were only conducted in three of the kindergartens. This limitation was due to logistical constraints and resource availability, which restricted the scope of carbon dioxide monitoring.
Regarding the external climate of this region, the average daily temperature varies between 3 °C and 29 °C, reflecting a climate with considerable seasonal variation. Summers are typically dry, with warm to hot temperatures, while winters are cooler and characterized by significant precipitation. The heating degree days, for a base temperature of 20 °C, are 1610 °C and the duration of the heating season is 6.7 months. According to the Köppen–Geiger climate classification, the region is classified as having a Mediterranean climate with Atlantic influence, denoted as Csb. This classification indicates that the region experiences mild, wet winters and dry, warm summers.
The geometric and construction characteristics of the buildings were meticulously gathered through a combination of on-site inspections and, when available, by consulting the original architectural plans and project documentation. This dual approach ensured that the data collected were both accurate and comprehensive, allowing for a detailed understanding of each building’s design and construction features. Table 1 and Table 2 provide a summary of the key information collected during this process.

Table 1.
Geometric characteristics of the classrooms.
Table 2.
Constructive characteristics of the case studies.
The geometric data presented in Table 1 specifically relate to the classroom where the environmental measurements were conducted. These data include crucial dimensions, such as room size, ceiling height, window area, and the orientation of the classroom, all of which play a significant role in influencing the indoor environmental conditions. The number of children is very similar in all classrooms under study, except for kindergarten (ii), corresponding to a number close to the maximum legally allowed per classroom (25 children). The floor areas are also very similar and are according to the Portuguese legislation, which imposes 2 m2 per children. The window orientation and the window to floor ratio are the parameters that most differ within the cases studies. Table 2, on the other hand, summarizes the construction characteristics of the buildings. This includes details about the materials used in the building envelope, the presence of insulation, the glazing and shading properties of the windows, and the type of heating and ventilation systems installed. All buildings have double-layer brick walls, except for kindergarten (v), which corresponds to the oldest building under study, which was constructed before the introduction of the first Portuguese regulation on buildings’ thermal behavior in the 1990s. Although the other buildings are more recent and were built according to the legislation in force at the time of construction, only three of them include thermal insulation in the walls and roofs. Double glazing, aluminum window frames, and interior shading are used in all kindergartens, except for kindergarten (iv), which has wooden frames. Only kindergarten (iii) has mechanical ventilation and a centralized heating system.
2.2. Equipment and Methods
For the monitoring of environmental parameters, portable sensors equipped with data storage capabilities were employed. These sensors provide measurements with an accuracy of ±0.21 °C for temperature and ±2.5% for relative humidity. In terms of carbon dioxide concentration, the sensor’s accuracy is ±3% or ± 50 ppm.
The sensors were strategically placed in the classrooms at a height exceeding 1 m, in accordance with the guidelines set forth in ISO 7726 [39]. This positioning was carefully chosen to minimize potential disturbances and ensure that the readings accurately reflected the typical environmental conditions experienced by the occupants. The location of the sensors was selected to avoid direct sunlight, drafts, or proximity to heating sources, which could otherwise skew the data. To ensure the accuracy and reliability of the sensors, a preliminary calibration check was performed in a controlled laboratory environment. This involved subjecting the sensors to a pre-programmed cycle of temperature and relative humidity variations within a climate chamber over a 28 h period. The results of this test confirmed that the sensors were properly calibrated. The carbon dioxide concentration sensors were calibrated following the recommendations of the manufacturer.
The data acquisition interval was set at 10 min, allowing for a detailed and continuous record of the environmental conditions within the classrooms. The monitoring period extended from February 2023 to May 2023, covering both winter and shoulder-season conditions. This timeframe was chosen to provide a comprehensive assessment of the buildings’ performances across different climatic scenarios, from the colder winter months to the milder conditions of early spring. Increasing the duration of the monitoring would effectively result in greater reliability of the results. Nevertheless, the data collected during this period offer valuable insights into how the classrooms respond to seasonal variations in outdoor temperature and humidity, as well as the effectiveness of their heating and ventilation systems. Figure 2 illustrates the time variation of the exterior temperature and relative humidity during the monitoring period. The air temperature varied between 2.2 and 35.0 °C, with an average of 16.4 °C, and relative humidity ranged from 18 to 89%, with an average of 62%.
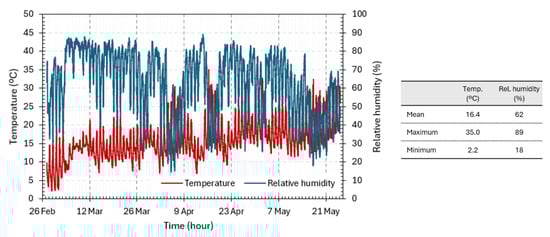
Figure 2.
Exterior temperature and relative humidity during the monitoring period.
The thermal comfort assessment was conducted using the adaptive model of EN 16798:2020 [28], distinguishing two periods: the theoretical period of classroom occupancy (09:00 to 16:00, only on weekdays) and the total period, considering 24 h a day, including weekends and holidays. To facilitate the interpretation of the results, two indicators were calculated, I1 and I2. Indicator I1, expressed as a percentage (%), corresponds to the percentage of time in discomfort, based on the “percentage outside the range” and “degree hours criteria” methods outlined in EN 16798-2 [40]. Indicator I2, expressed in degrees Celsius (°C), represents the severity of discomfort, corresponding to the average of the differences between the recorded temperature and the respective limit in the discomfort records, assuming category II of the adaptive model of EN 16798-2, and can be calculated from the following equation:
In which Ti is the temperature measured at instant i, Tlimit(lower)i is the corresponding lower comfort limit and N is the total number of measurements.
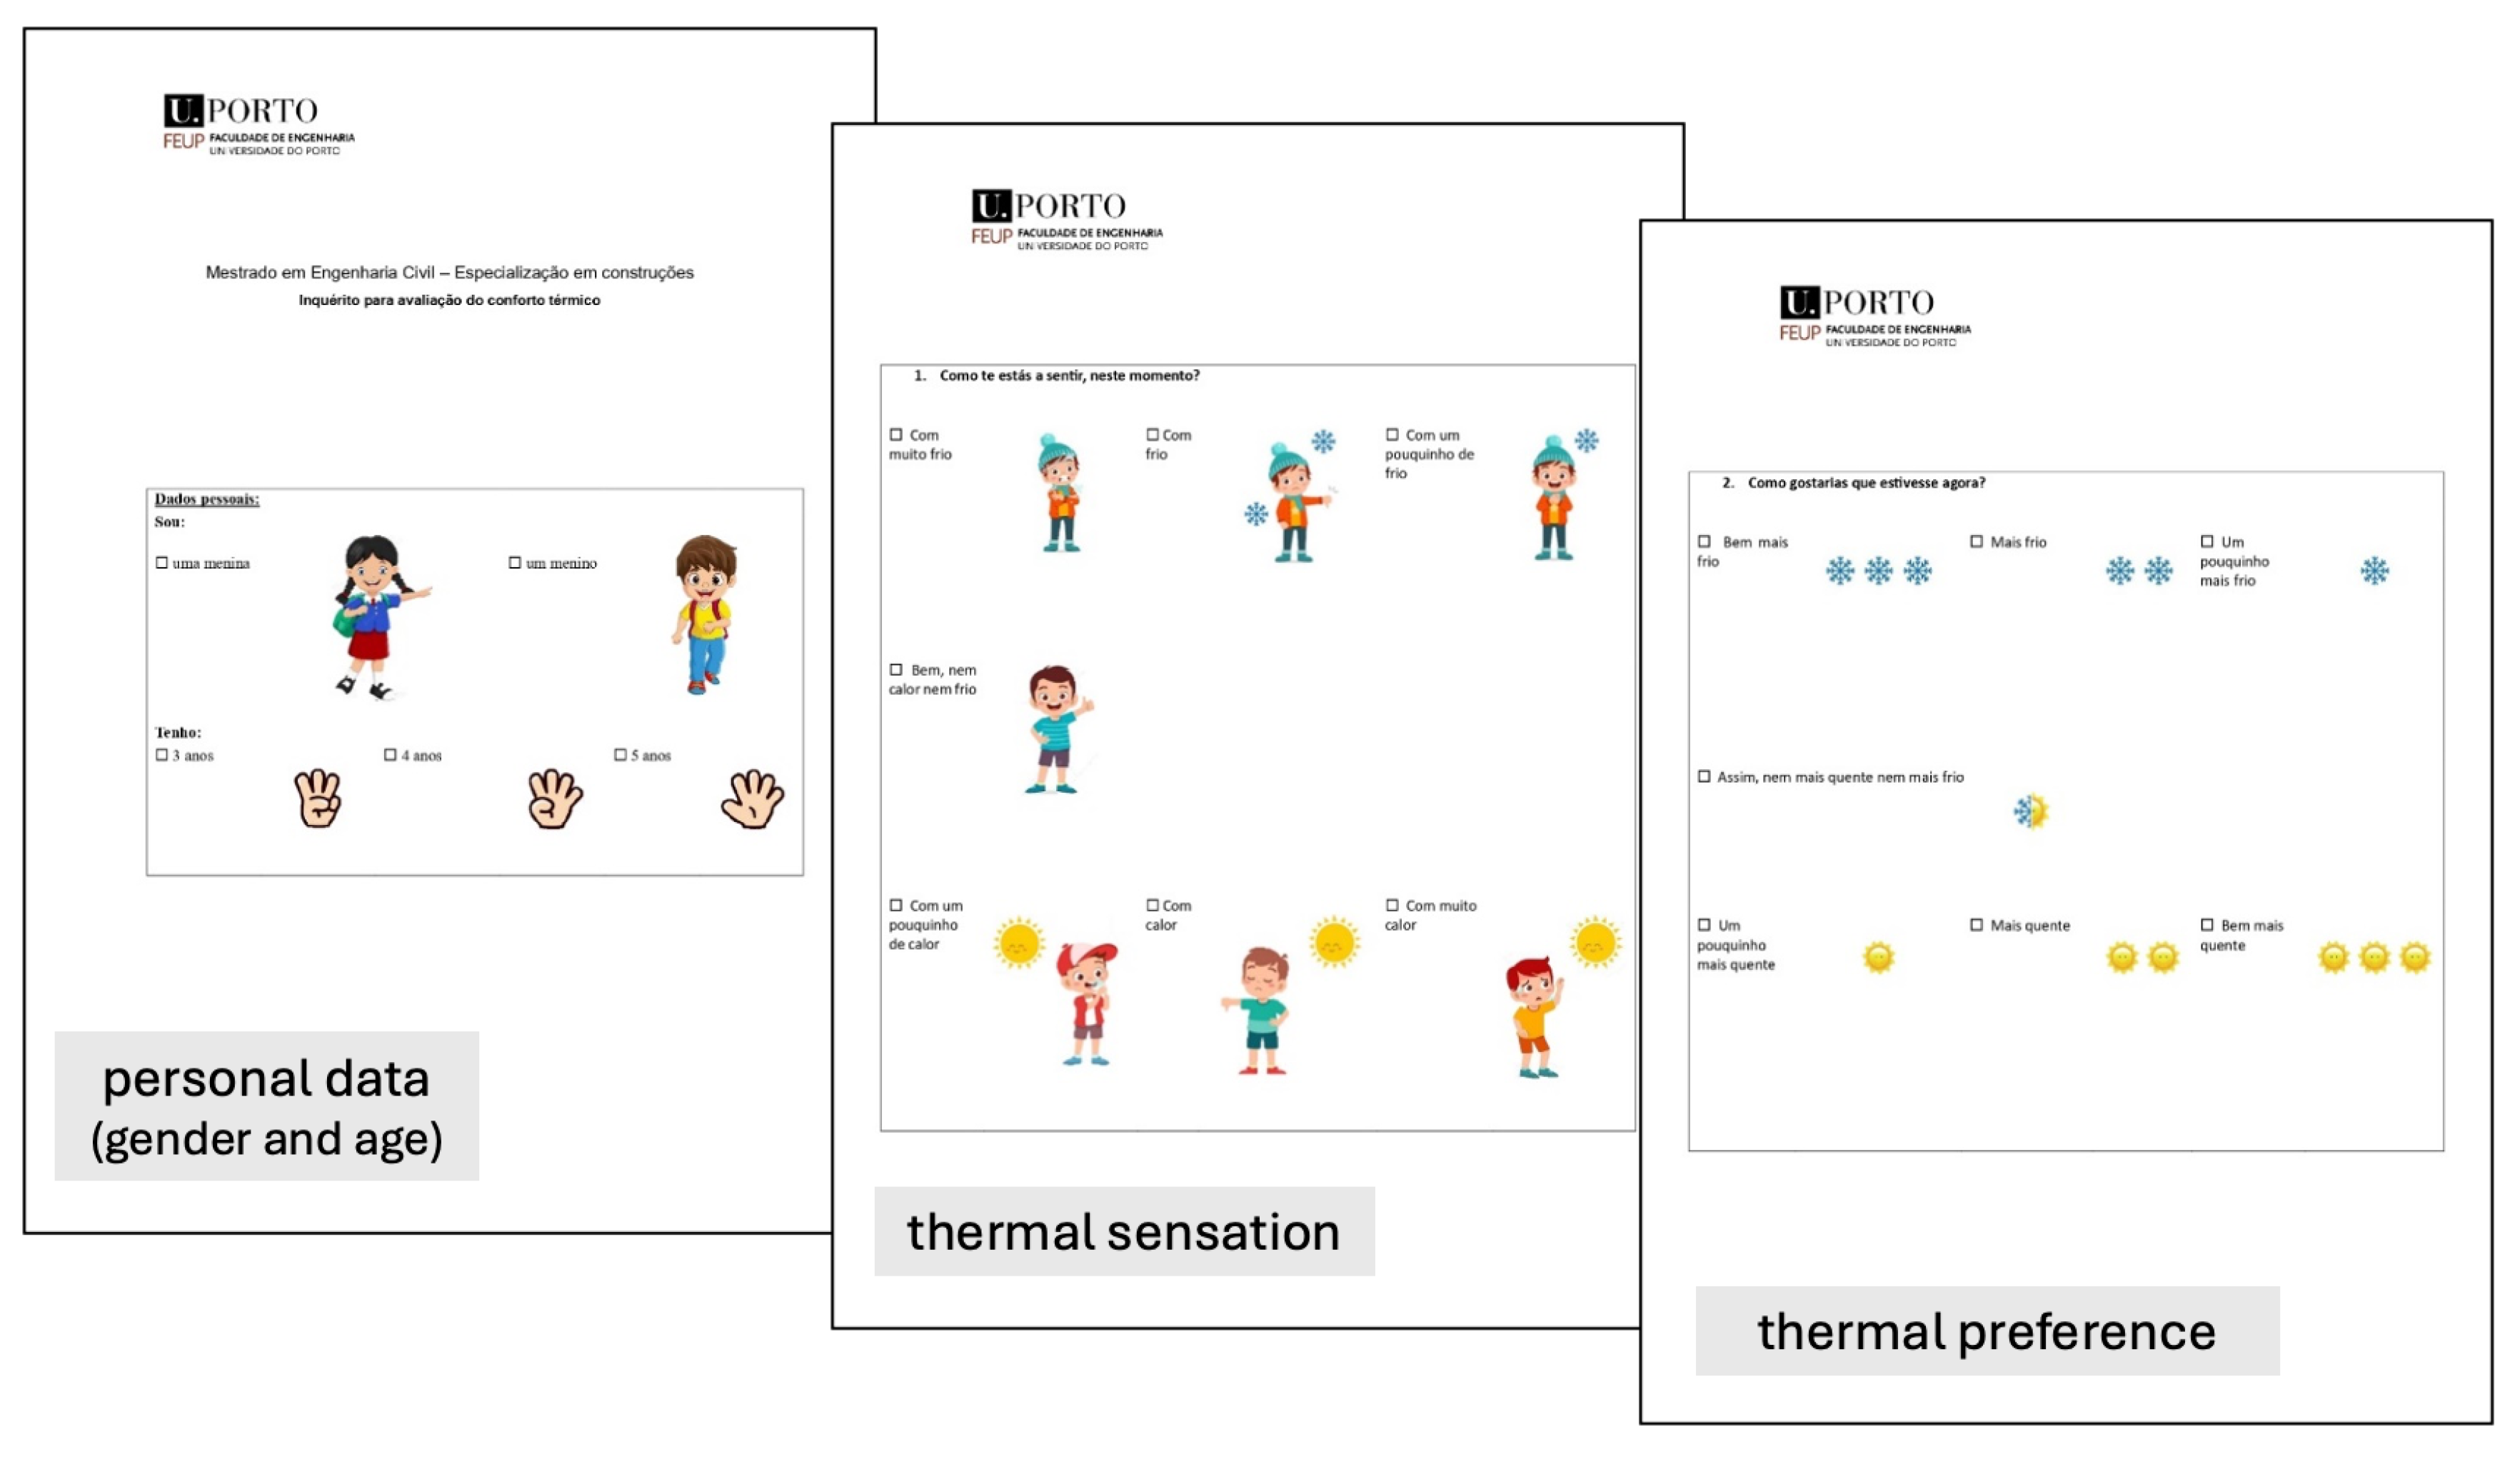
Specific questionnaires were developed to collect the thermal perception of the users inside the classrooms. The respondents were children aged 3 to 5 years old, in cases where the classrooms are mixed-age groups. In kindergartens where children are separated by age, only the students in the 5-year-old classroom were surveyed. The structure of the questionnaires was divided into four groups. The first group assessed the personal characteristics of the sample, specifically gender and age. The second and third groups allowed for the evaluation of thermal sensation and thermal preference, respectively, based on two questions formulated in accordance with ISO 10551 [41] subjective scales. Finally, in the fourth group, a more open-ended question was included, asking the children to draw a picture related to their thermal sensation at that moment. It is important to note that all questions were explained by the kindergarten teachers before any responses were given. All response options were accompanied by illustrations (Figure 3) to help the students better understand what was being asked. A total of 130 surveys were conducted in two phases (72 in the first phase I and 58 in the second). The sample size ensures the representativeness of the study population; however, once again, caution should be exercised when generalizing the findings to regions with different climatic conditions. The first phase took place between 20 April and 27 April, and the second phase on 25 May.
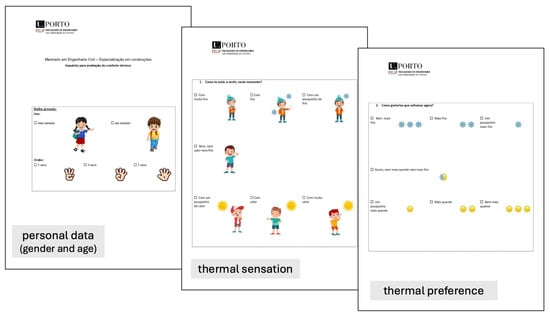
Figure 3.
Comfort questionnaires.
3. Results and Discussion
3.1. Air Temperature and Relative Humidity
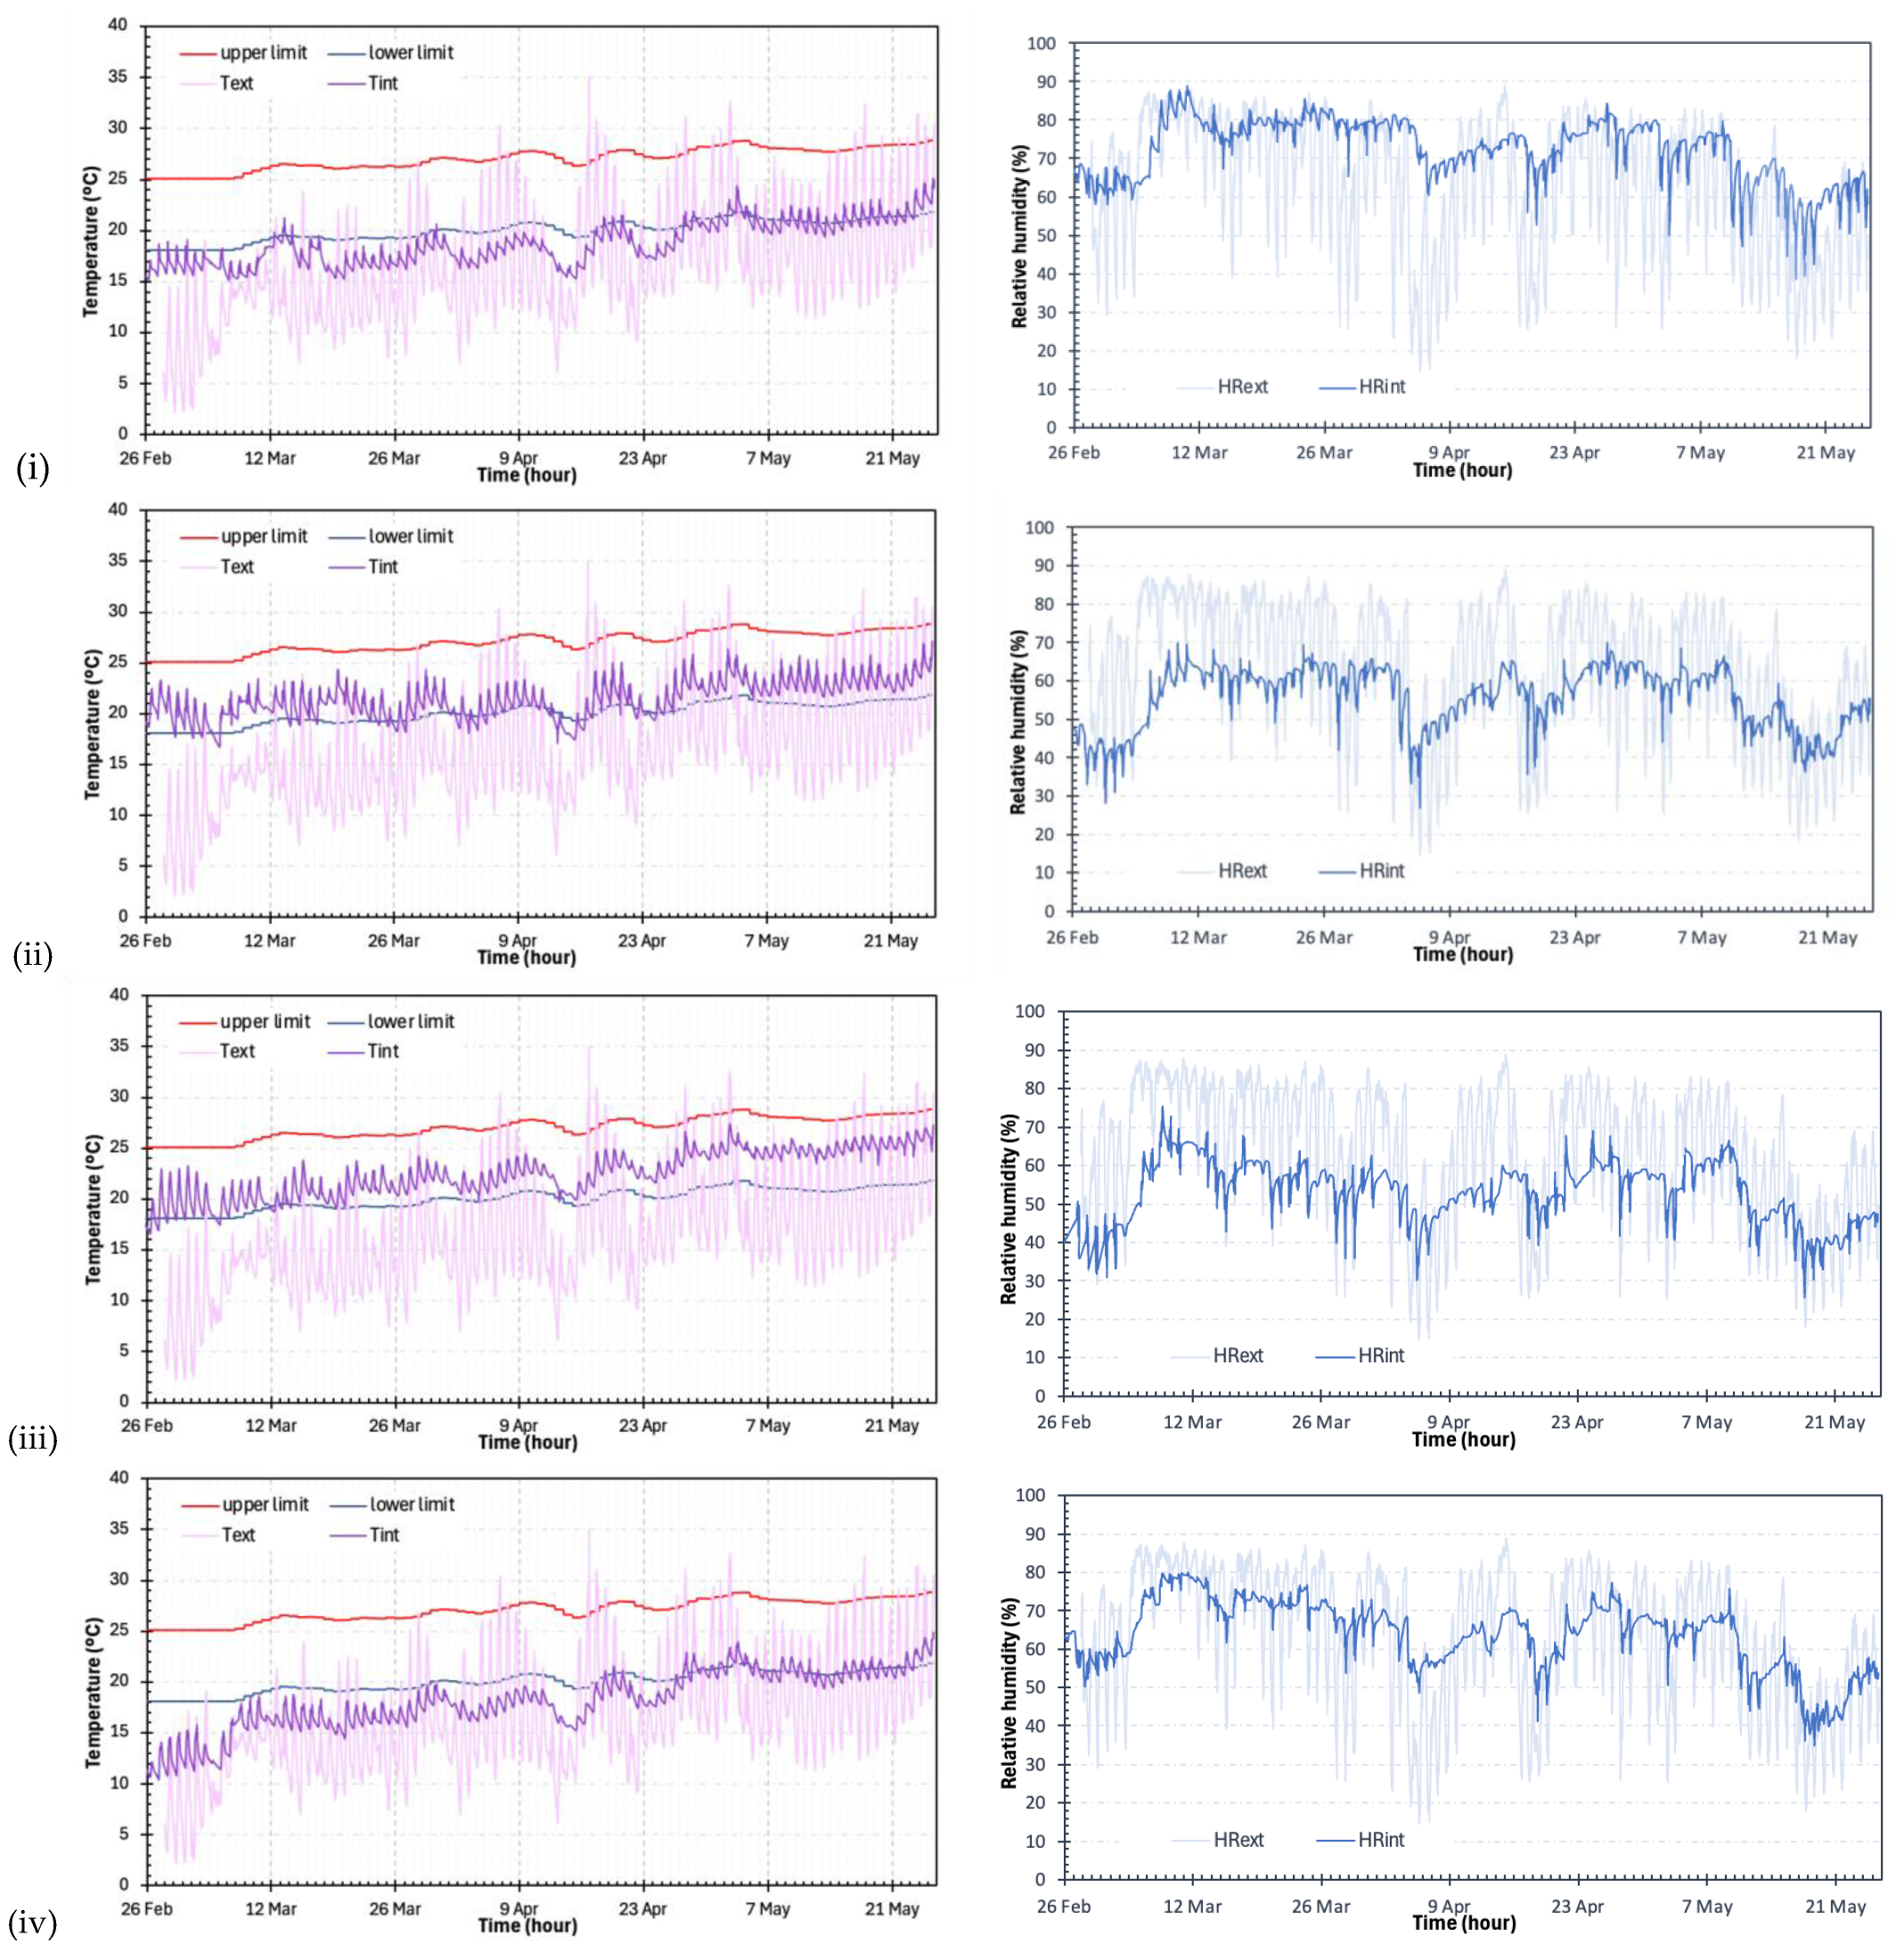
In Figure 4, a representation of the variation in temperature and relative humidity inside and outside the classrooms throughout the entire measurement period is presented. The temperature representation also includes the lower and upper comfort limits determined according to the EN 16798:2020 [28] standard.
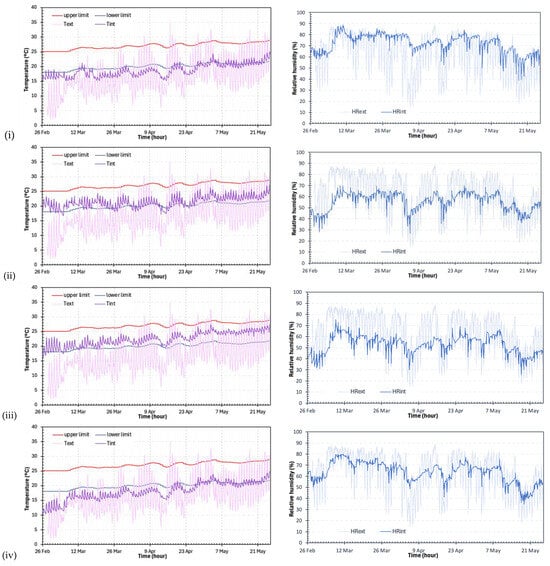
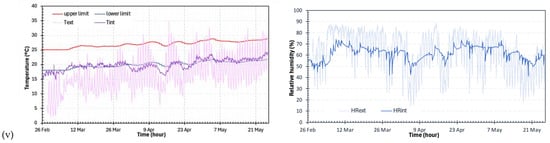
Figure 4.
Air temperature (left side) and relative humidity (right side) variation for case studies (i–v).
The results show a significantly distinct behavior among the different case studies. Kindergartens (i) and (iv) stand out negatively. Kindergarten (iv) presents quite low temperatures, ranging between 10.4 °C and 15.9 °C, during the initial monitoring period, which corresponds to late February and early March. On the other hand, Kindergartens (ii) and (iii) present temperature variations more consistent with comfort conditions.
According to the records from Kindergarten (i), the indoor temperature fluctuated between 15 °C and 24 °C, indicating that the building was frequently below the comfort range during the measurement period. Despite the Southeast and Southwest-facing openings that allow solar radiation to enter in the morning and afternoon, the building consistently maintained temperatures below the comfort threshold. This suggests that the opaque envelope is thermally inefficient, resulting in significant heat losses through both the walls and the roof.
In Kindergarten (ii), the indoor temperature generally remained within the acceptable thermal comfort limits, ranging from 17 °C to 26 °C. This case study benefited from a significant area of southwest-facing glazed openings, which contributed to solar gains. Additionally, the classroom’s location on the ground floor helped mitigate the impact of heat losses through the roof, compared to some of the other kindergartens studied.
The indoor temperature in Kindergarten (iii) ranged between 17 °C and 27 °C, closely following the rise in outdoor temperatures. Like Kindergarten (ii), this building shows strong performance, with indoor temperatures consistently remaining within the comfort range for most of the monitoring period. The well-insulated building envelope, along with the mechanical ventilation and central heating system, played a significant role in maintaining stable indoor temperatures. The impact of the heating system is particularly evident during the first weeks of monitoring, where there was a noticeable variation in daily temperature values, reflecting the differences between occupied (heated) and unoccupied (non-heated) periods.
The indoor temperature in Kindergarten (iv) varied between 10 °C and 24 °C, with significant fluctuations observed throughout the monitoring period. The lack of insulation on the building’s façade contributes to heat loss from the interior. Additionally, the wooden window frames, which are aged, may lead to greater air infiltration compared to the other case studies, further contributing to the low minimum temperatures recorded.
Analyzing the results of the indoor temperature variation in Kindergarten (v), it is observed that the temperature remained consistently between 15 °C and 24 °C. The kindergarten benefits from a glazed window and a glass door, both facing south, which significantly contribute to solar heat gains. However, the fact that the window frames are made of aluminum without a thermal break may have compromised the building’s performance during colder periods.
Regarding relative humidity, the results are generally good, remaining within appropriate limits. The only exception occurred in Kindergarten (i), where several periods with relative humidity above 80% were recorded. From the results and the inspection carried out on the building, it was not possible to identify with certainty the reasons for this behavior, especially when compared with Kindergarten (iv), which presents the worst thermal performance. However, it may be related to higher airtightness of the building envelope, which may contribute to the high relative humidity.
3.2. Thermal Comfort
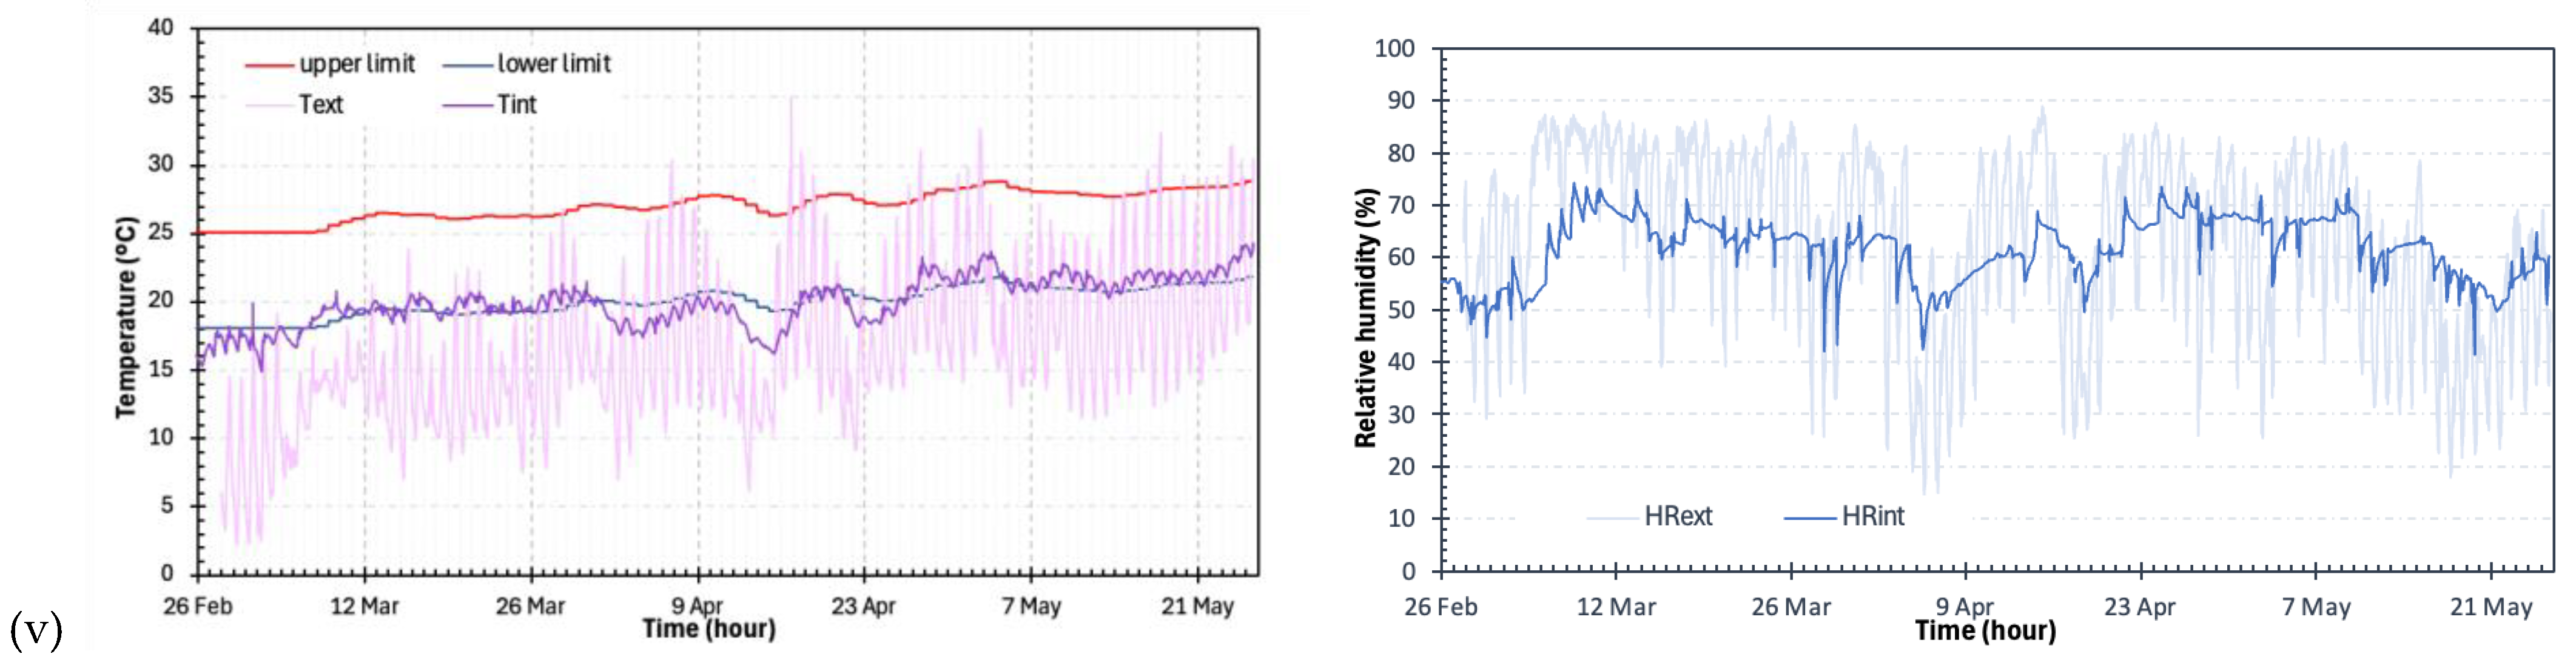
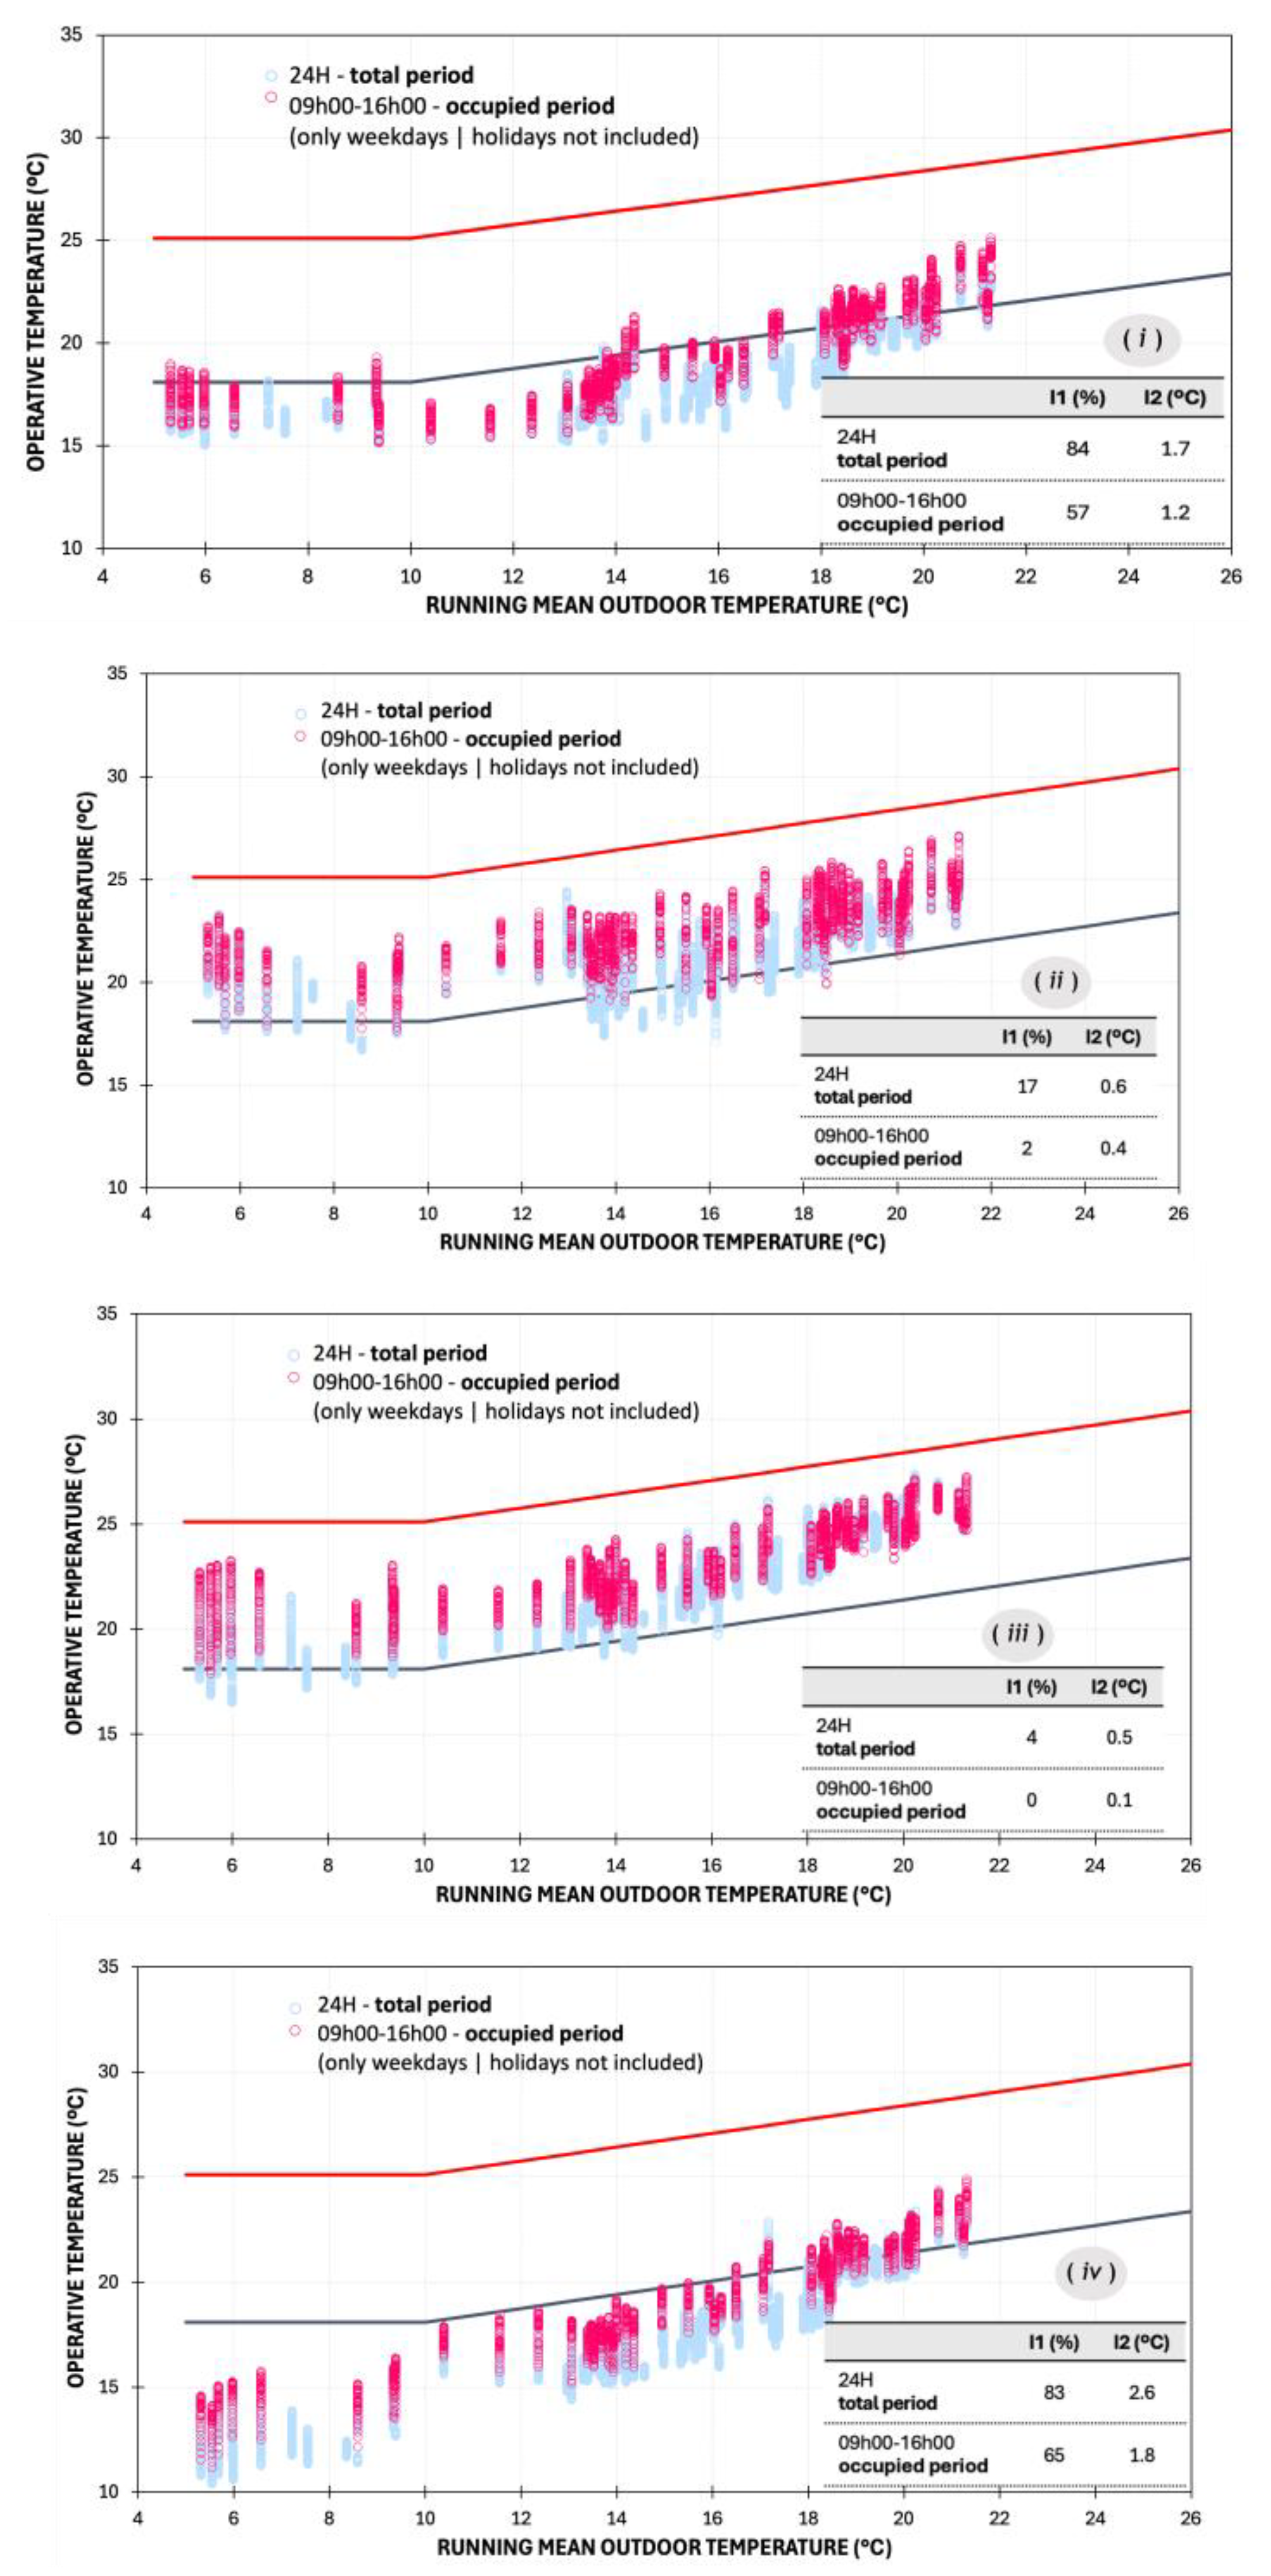
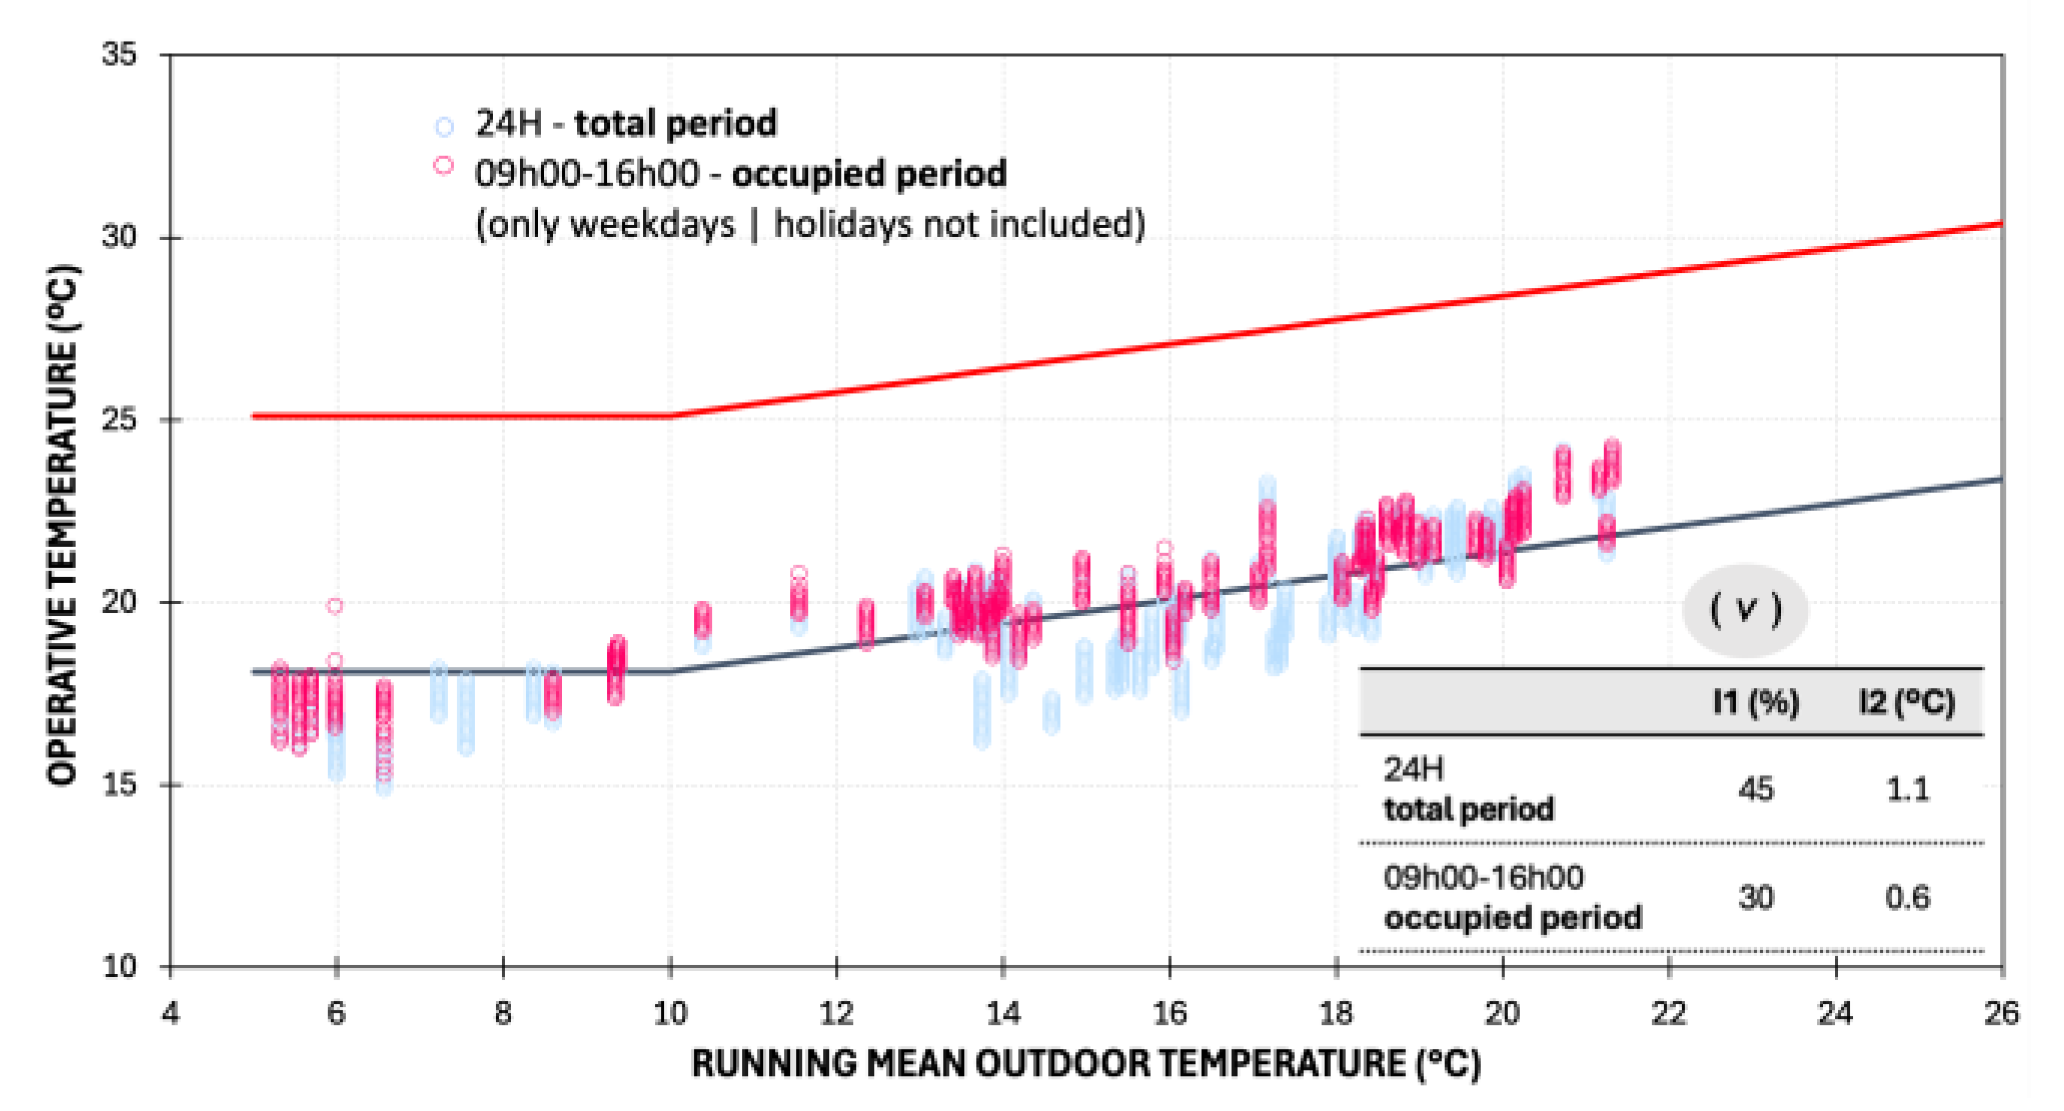
The thermal comfort assessment was conducted using the adaptive model outlined in EN 16798:2020 [28] (Figure 5), distinguishing two periods: the theoretical classroom occupancy period (09:00 to 16:00 on weekdays) and the entire 24 h period, including weekends and holidays. To facilitate the interpretation of the results, the values of the two indicators, I1 and I2, are also included in the graphs.
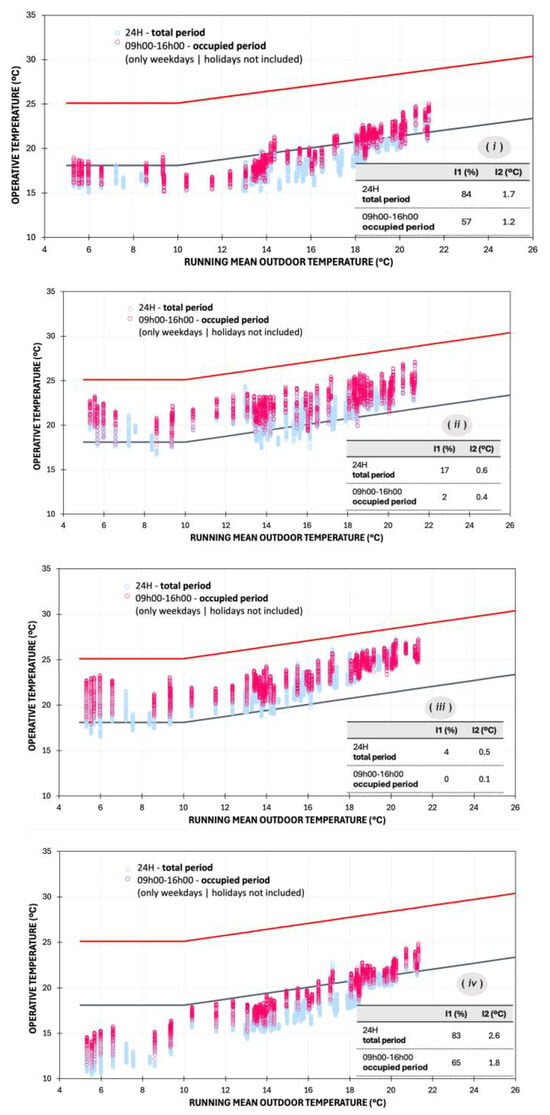
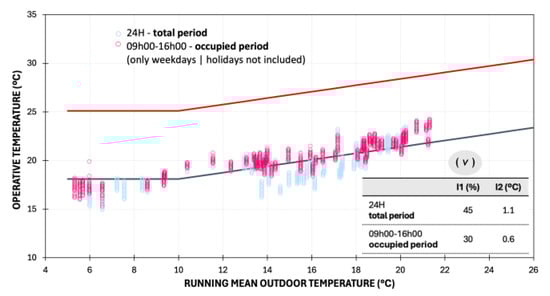
Figure 5.
Application of the EN 16798 adaptive model in case studies (i–v).
Regarding the percentage of time spent in discomfort during the occupied period (Indicator I1), Kindergarten (iv) shows the poorest performance with 65%, while Kindergarten (iii) performs the best. For Indicator I2, which indicates the severity of discomfort, Kindergarten (iv) records the highest values: 2.6 °C for the total period and 1.8 °C for the occupied period. In contrast, the best-performing kindergarten is Kindergarten (iii), with values of 0.5 °C and 0.1 °C for the total and occupied periods, respectively.
When comparing the construction characteristics of the five kindergartens, it is evident that the three best-performing kindergartens in terms of thermal comfort—namely (ii) and (iii)—feature glazed openings oriented to the south and southwest, giving them an advantage in terms of solar exposure. In contrast, the less efficient kindergartens, (i) and (iv), share a common orientation of openings to the southeast and northwest, which results in reduced solar exposure and, consequently, lower indoor temperatures. These results confirm the importance of solar gains in building performance, especially in spaces with free temperature fluctuation. On the other hand, one must stress the importance of proper shading control to maximize the benefits of these gains without compromising comfort during the hottest periods. In the case of kindergartens, the challenge becomes even more complex due to the need to make this situation compatible with visual comfort and the use of natural lighting.
It is also noteworthy that in Kindergartens (i), (ii), and (iii) the influence of heating systems is observable during the colder weeks, as the operative temperature tends to stabilize, diverging from the trend of the outdoor temperature. This situation is more evident when analyzing the results considering only the theoretical period of occupation, suggesting that in most situations there is only an occasional and intermittent use of the heating systems. Conversely, in Kindergartens (iv) and (v), there is a direct correlation between the operative temperature and the outdoor temperature, even during the coldest periods, indicating either the absence or non-use of a heating system, with important consequences to the discomfort inside the classrooms.
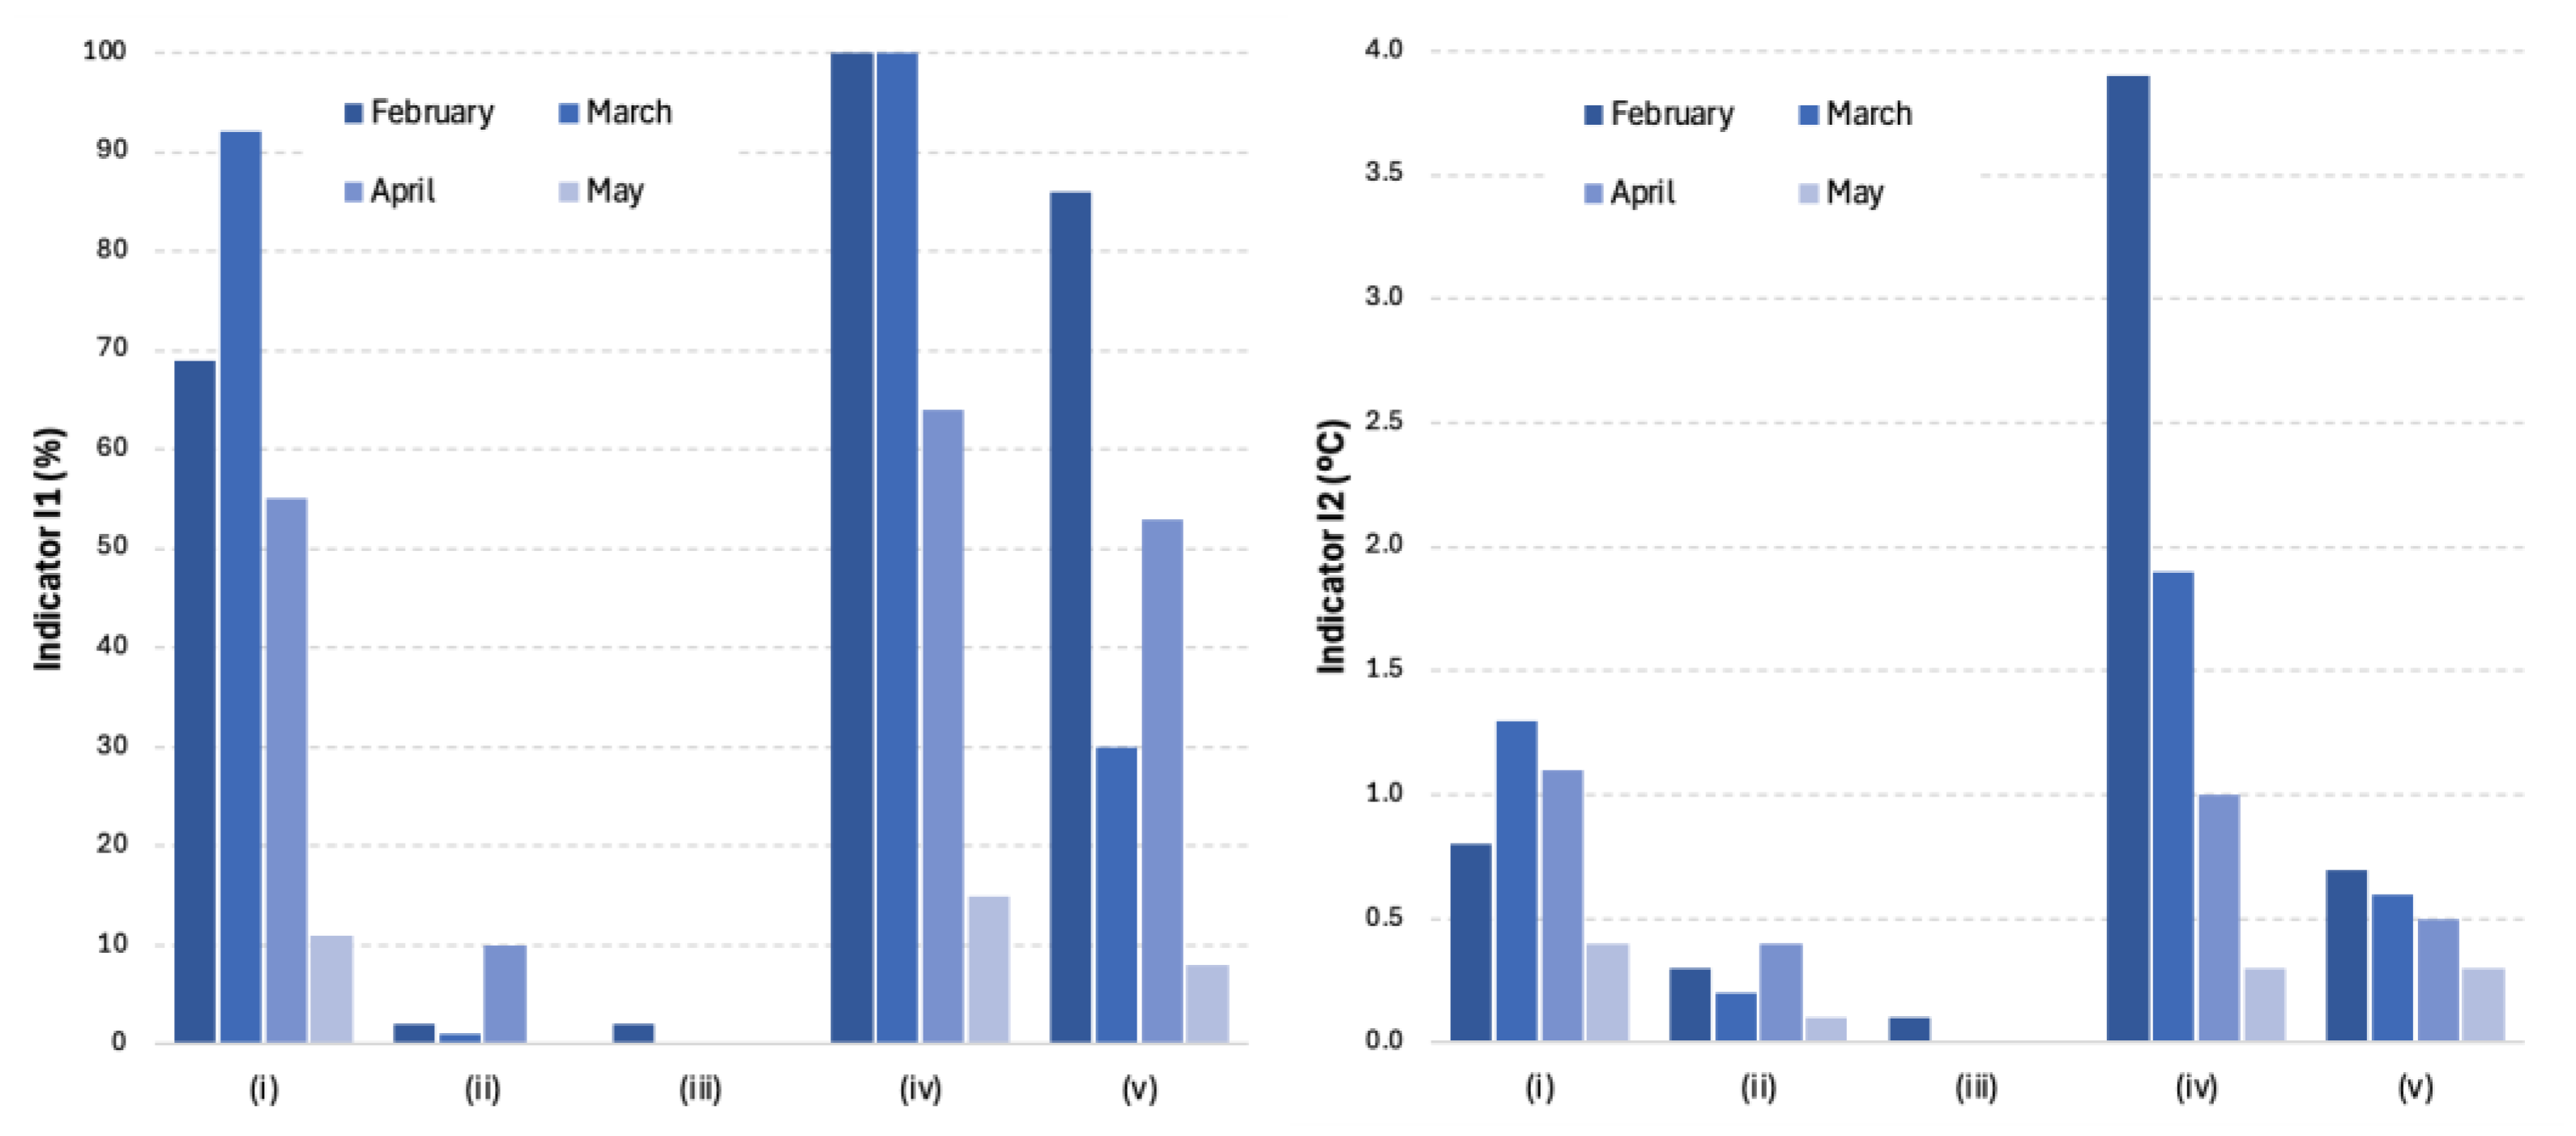
To assess the impact of the outdoor climate on the discomfort levels, the values of indicators I1 and I2 were calculated separately for each month of measurement considering only the theoretical classroom occupancy period. The results are graphically presented in Figure 6.
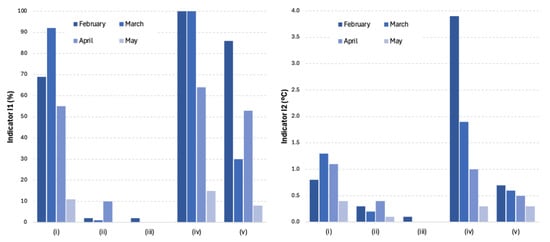
Figure 6.
Comfort indicators I1 and I2 throughout the measurement period in case studies (i–v).
As expected, the impact of the outdoor climate on thermal discomfort is significant. Discomfort levels are considerably higher during the colder months, confirming the limited or even non-use of heating systems in some classrooms. Among the case studies, Kindergarten (iv) shows the worst scenario: not only experiencing prolonged periods of discomfort (a situation also observed in Kindergartens (i) and (v)), but also with high severity —averaging nearly 4 °C below the comfort limit in February and almost 2 °C in March. In contrast, Kindergartens (ii) and (iii) demonstrate satisfactory performance throughout the measurement period, with little to no discomfort observed.
3.3. Questionnaires
The assessment of thermal comfort through questionnaires was conducted in two phases (the first phase between 20 April and 27 April, and the second phase on 25 May). To better contextualize the conditions under which this task was carried out, Table 3 shows the average, maximum, and minimum values of the exterior and interior temperature during the period in which the children responded to the surveys. The outdoor conditions in the second phase are slightly warmer (average temperature of 17.1 °C in the first phase I and 22.9 °C in the second), although the difference is not very significant during the occupancy period (the main differences occurred during the night period).
Table 3.
Exterior and interior temperature during the questionnaires.
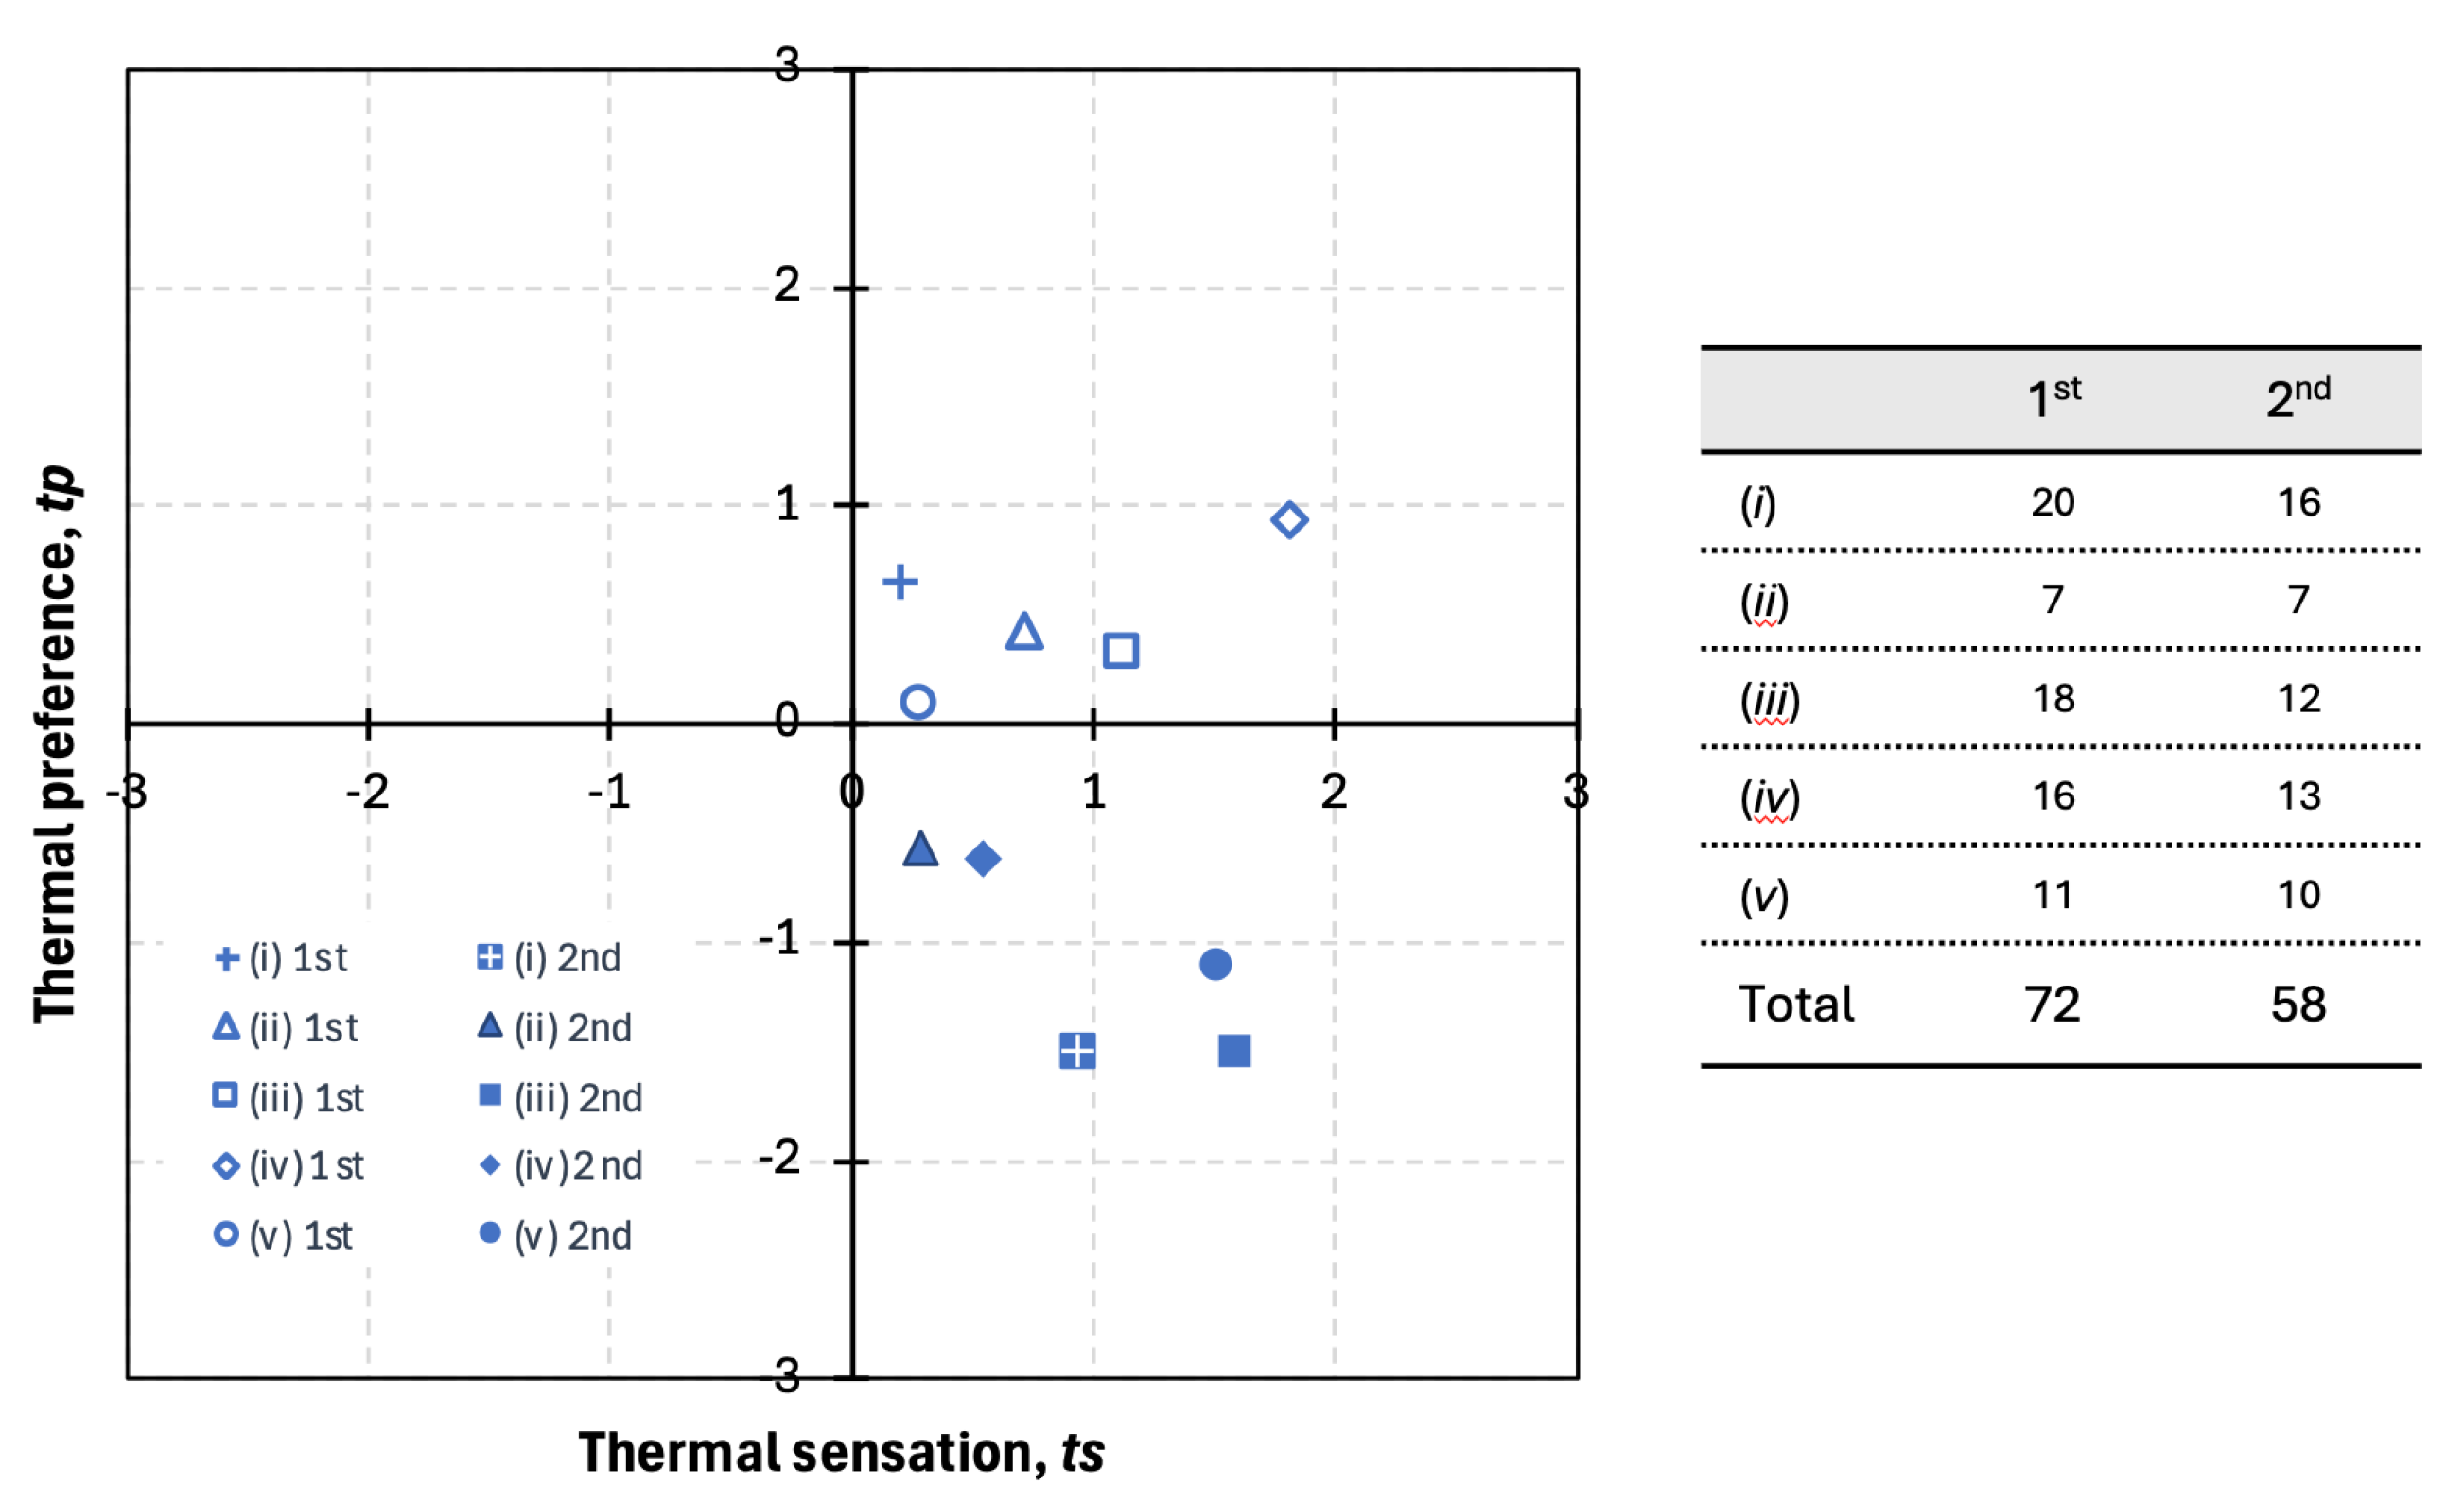
The thermal sensation, ts, was assessed through the well-known Fanger’s scale ranging from −3 (cold) to 3 (hot). The thermal preference, tp, was also assessed through a −3 (much colder) to 3 (much warmer) scale [10]. Figure 7 shows the relationship between the thermal sensation and thermal preference, separately for the two phases of the questionnaires. The number of respondents is each classroom and phase is also included. The number of respondents in the second phase of the survey was smaller or the same in all the classrooms, but always enough to guarantee the representativeness of the sample.
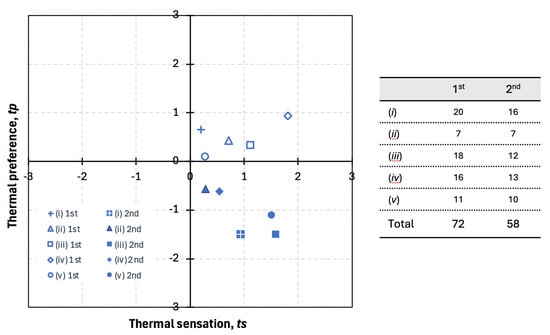
Figure 7.
Thermal sensation vs. thermal preference.
The results show that the children’s thermal sensation consistently indicated slight warm (ts = 1) or warm (ts = 2) in both evaluation phases. This result points to a misalignment with comfort models. This difficulty in applying the models to young children is consistent with findings reported by other researchers who have also reported warmer sensations in children. [29,42]. These results confirm the need for more research in this area, seeking to expand the available data in the search for a comfort assessment model specifically designed for children.
Another important aspect is the results concerning thermal preference, which in the first campaign did not show coherence with the response regarding thermal sensation. This apparent inconsistency is due to the difficulty in explaining the methodology to the children, a situation that was corrected in the second campaign, resulting in greater coherence in the results. This point reinforces the importance of developing specific methodologies for evaluating thermal comfort tailored to children, especially younger ones as found in kindergartens.
3.4. Carbon Dioxide Concentration
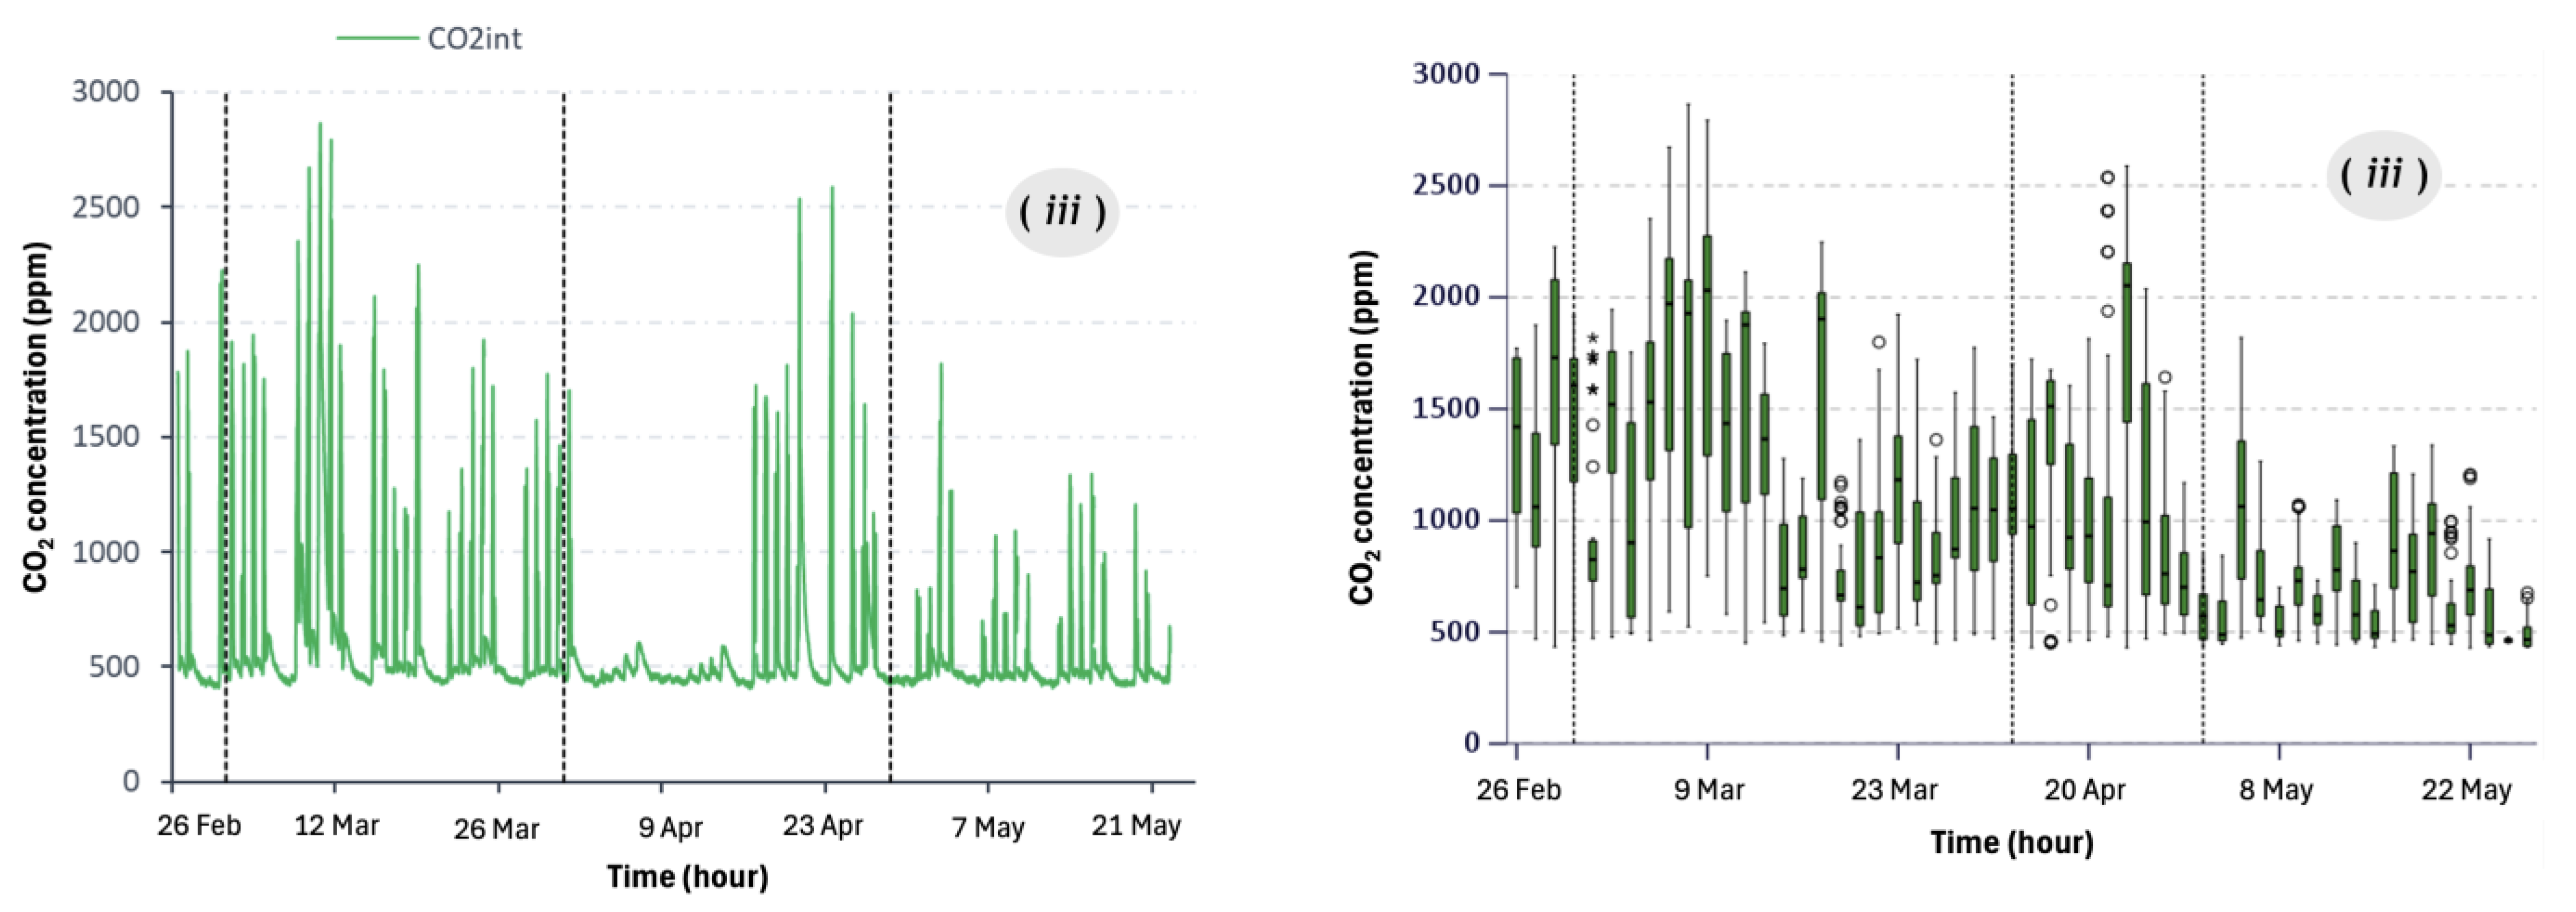
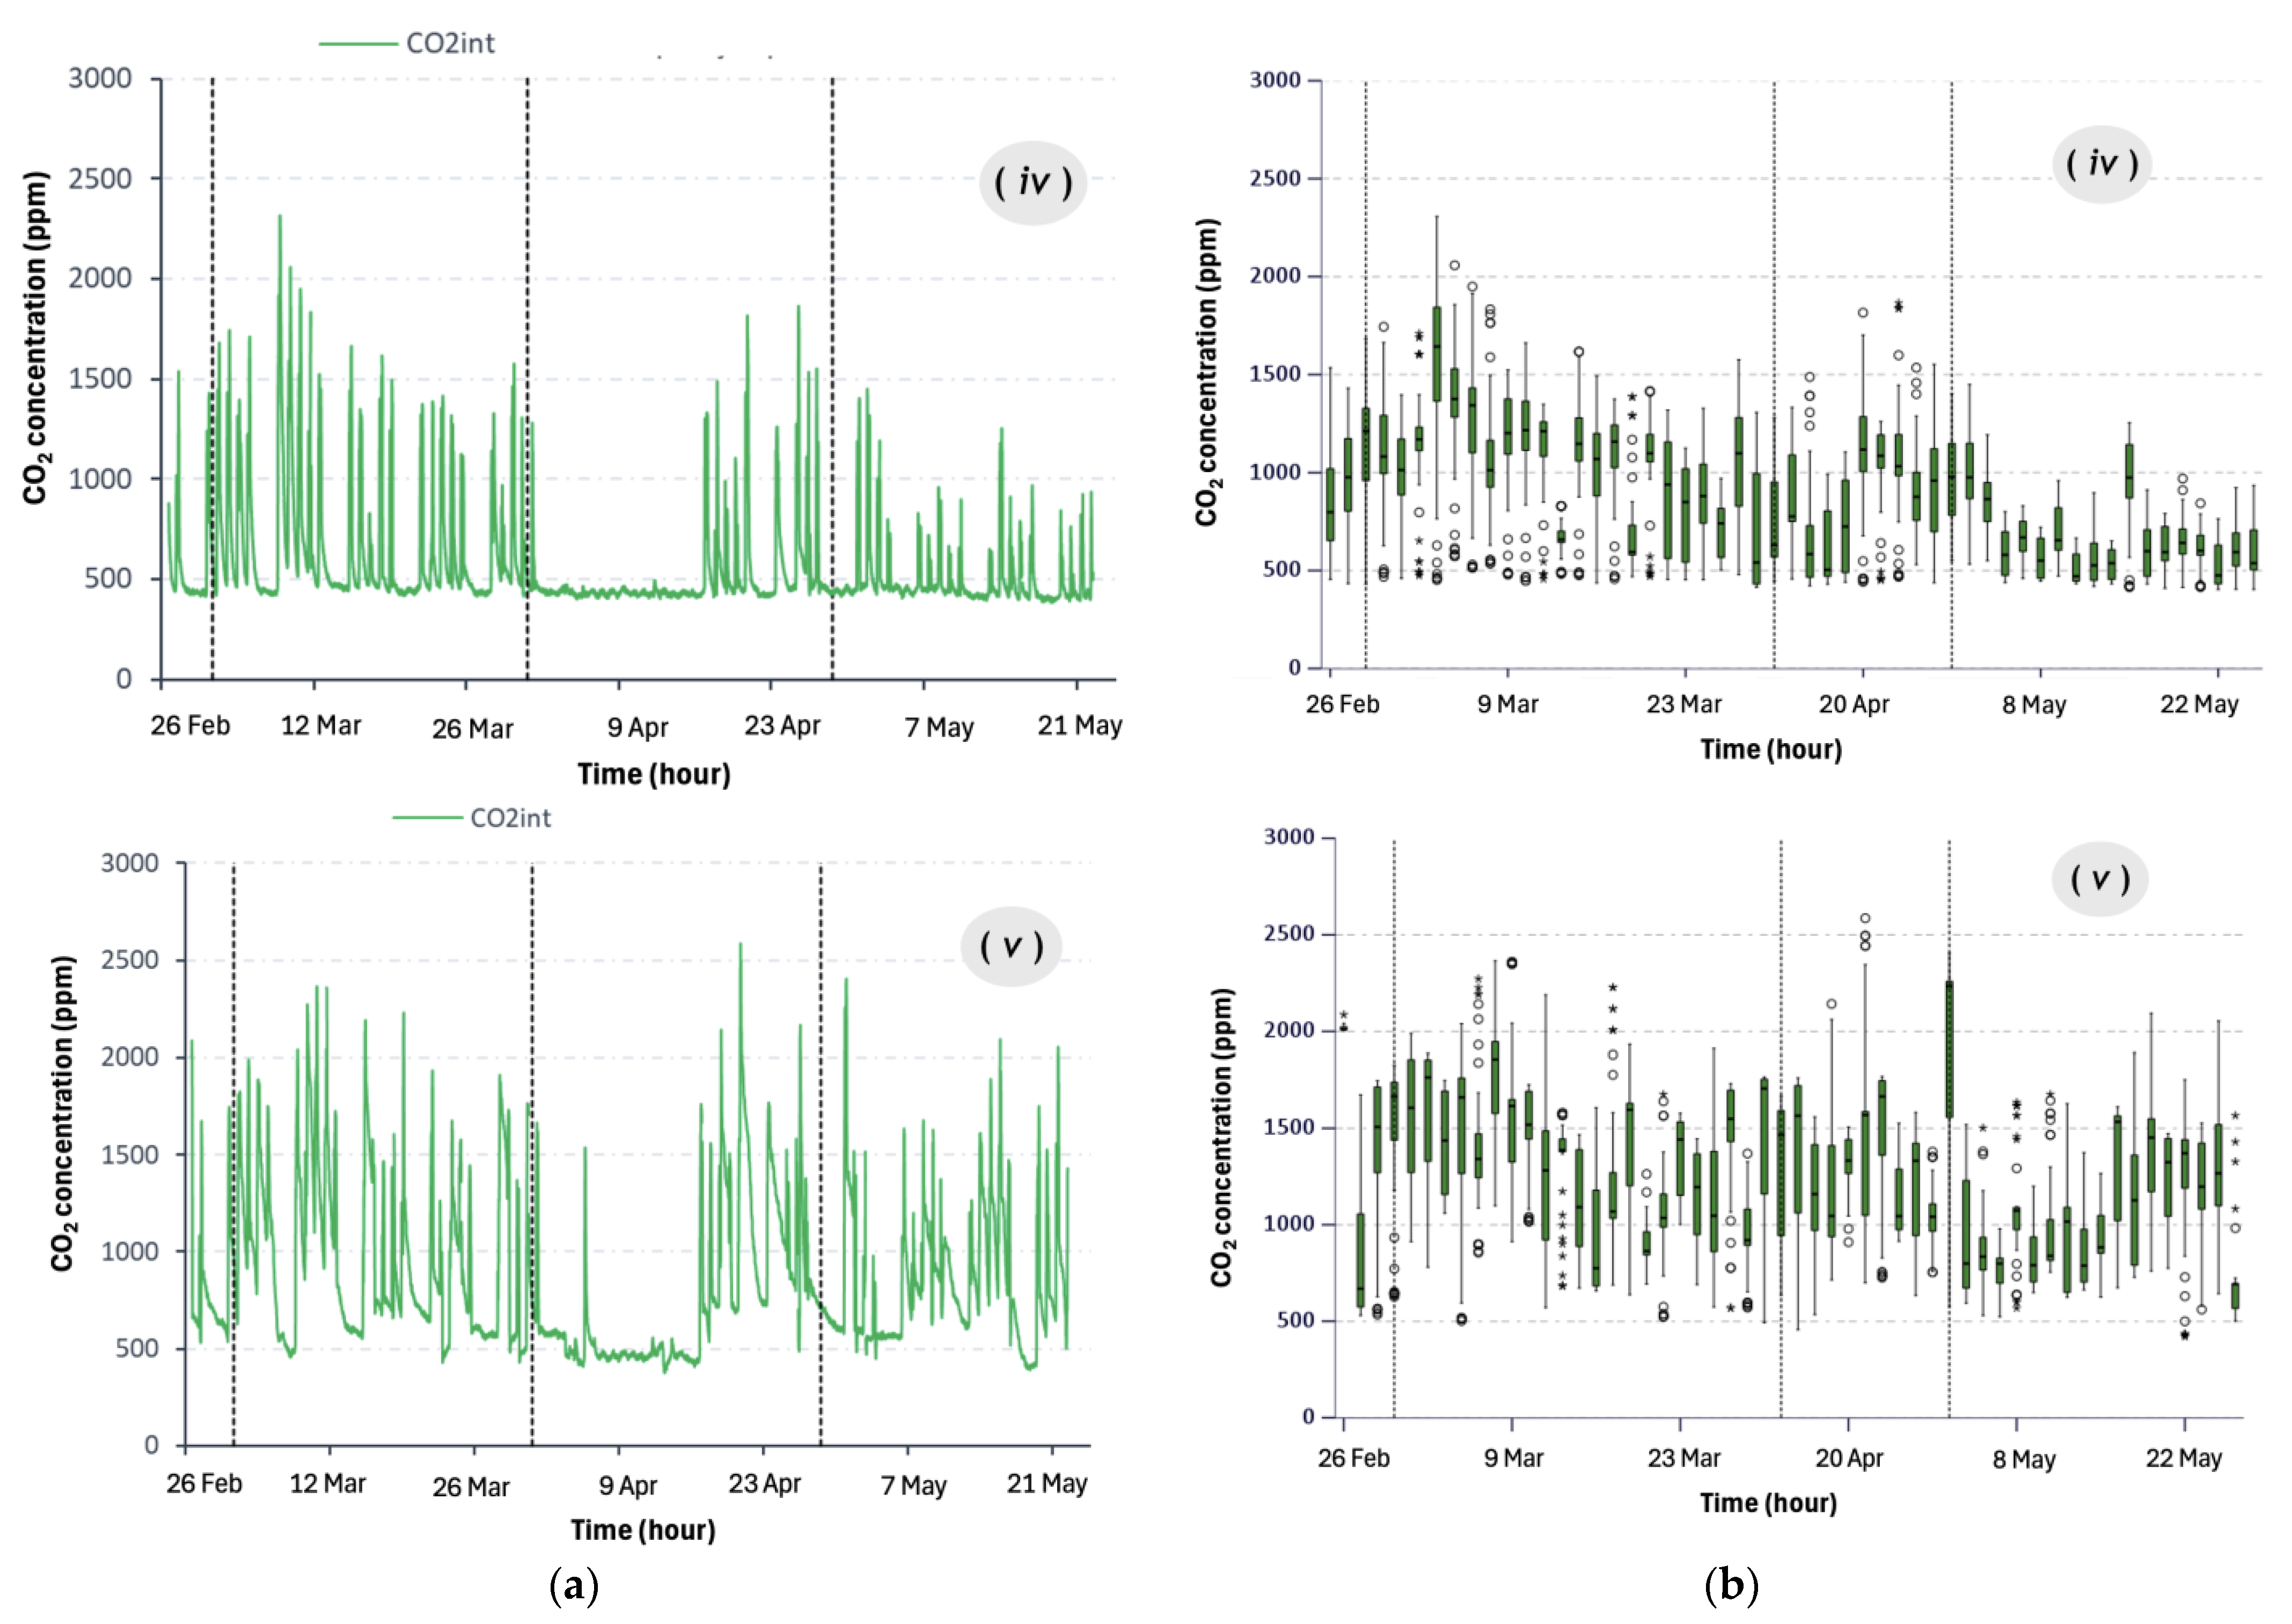
The measurement of carbon dioxide concentration was conducted in only three buildings: (iii), (iv), and (v). Figure 8a shows the variation in carbon dioxide concentration over the entire monitoring period, while Figure 8b displays the box plot representation of the daily variation of the concentration considering only the records taken during the occupancy period.
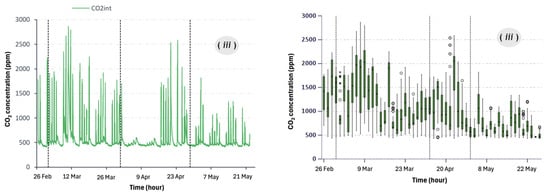
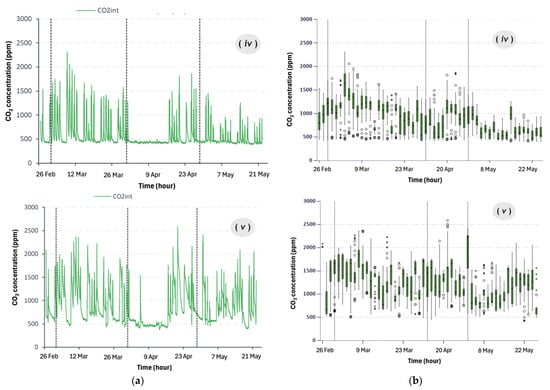
Figure 8.
Carbon dioxide concentration: (a) 24 h period; (b) occupied period, for case studies (iii), (iv) and (v).
The maximum carbon dioxide concentrations recorded were 2866 ppm, 2588 ppm, and 2307 ppm in Kindergartens (iii), (v), and (iv), respectively. Although the differences between the kindergartens are not significantly pronounced, the results do indicate a trend toward higher carbon dioxide levels in Kindergarten (iii), which also exhibited the best performance in terms of thermal comfort. This building is the newest among the group, featuring a more insulated and airtight envelope. This finding underscores the critical need to balance ventilation requirements with energy efficiency objectives, particularly in buildings designed with highly airtight envelopes.
When examining the boxplot representation, it becomes evident that on certain days, the interquartile range is wider, suggesting a greater dispersion of the data. This increased variability can likely be attributed to fluctuations in the number of occupants, changes in the activities conducted (which influence metabolism and, consequently, carbon dioxide production), or variations in ventilation practices. This phenomenon is more pronounced on colder days and in more airtight buildings, as in the case of Kindergarten (iii).
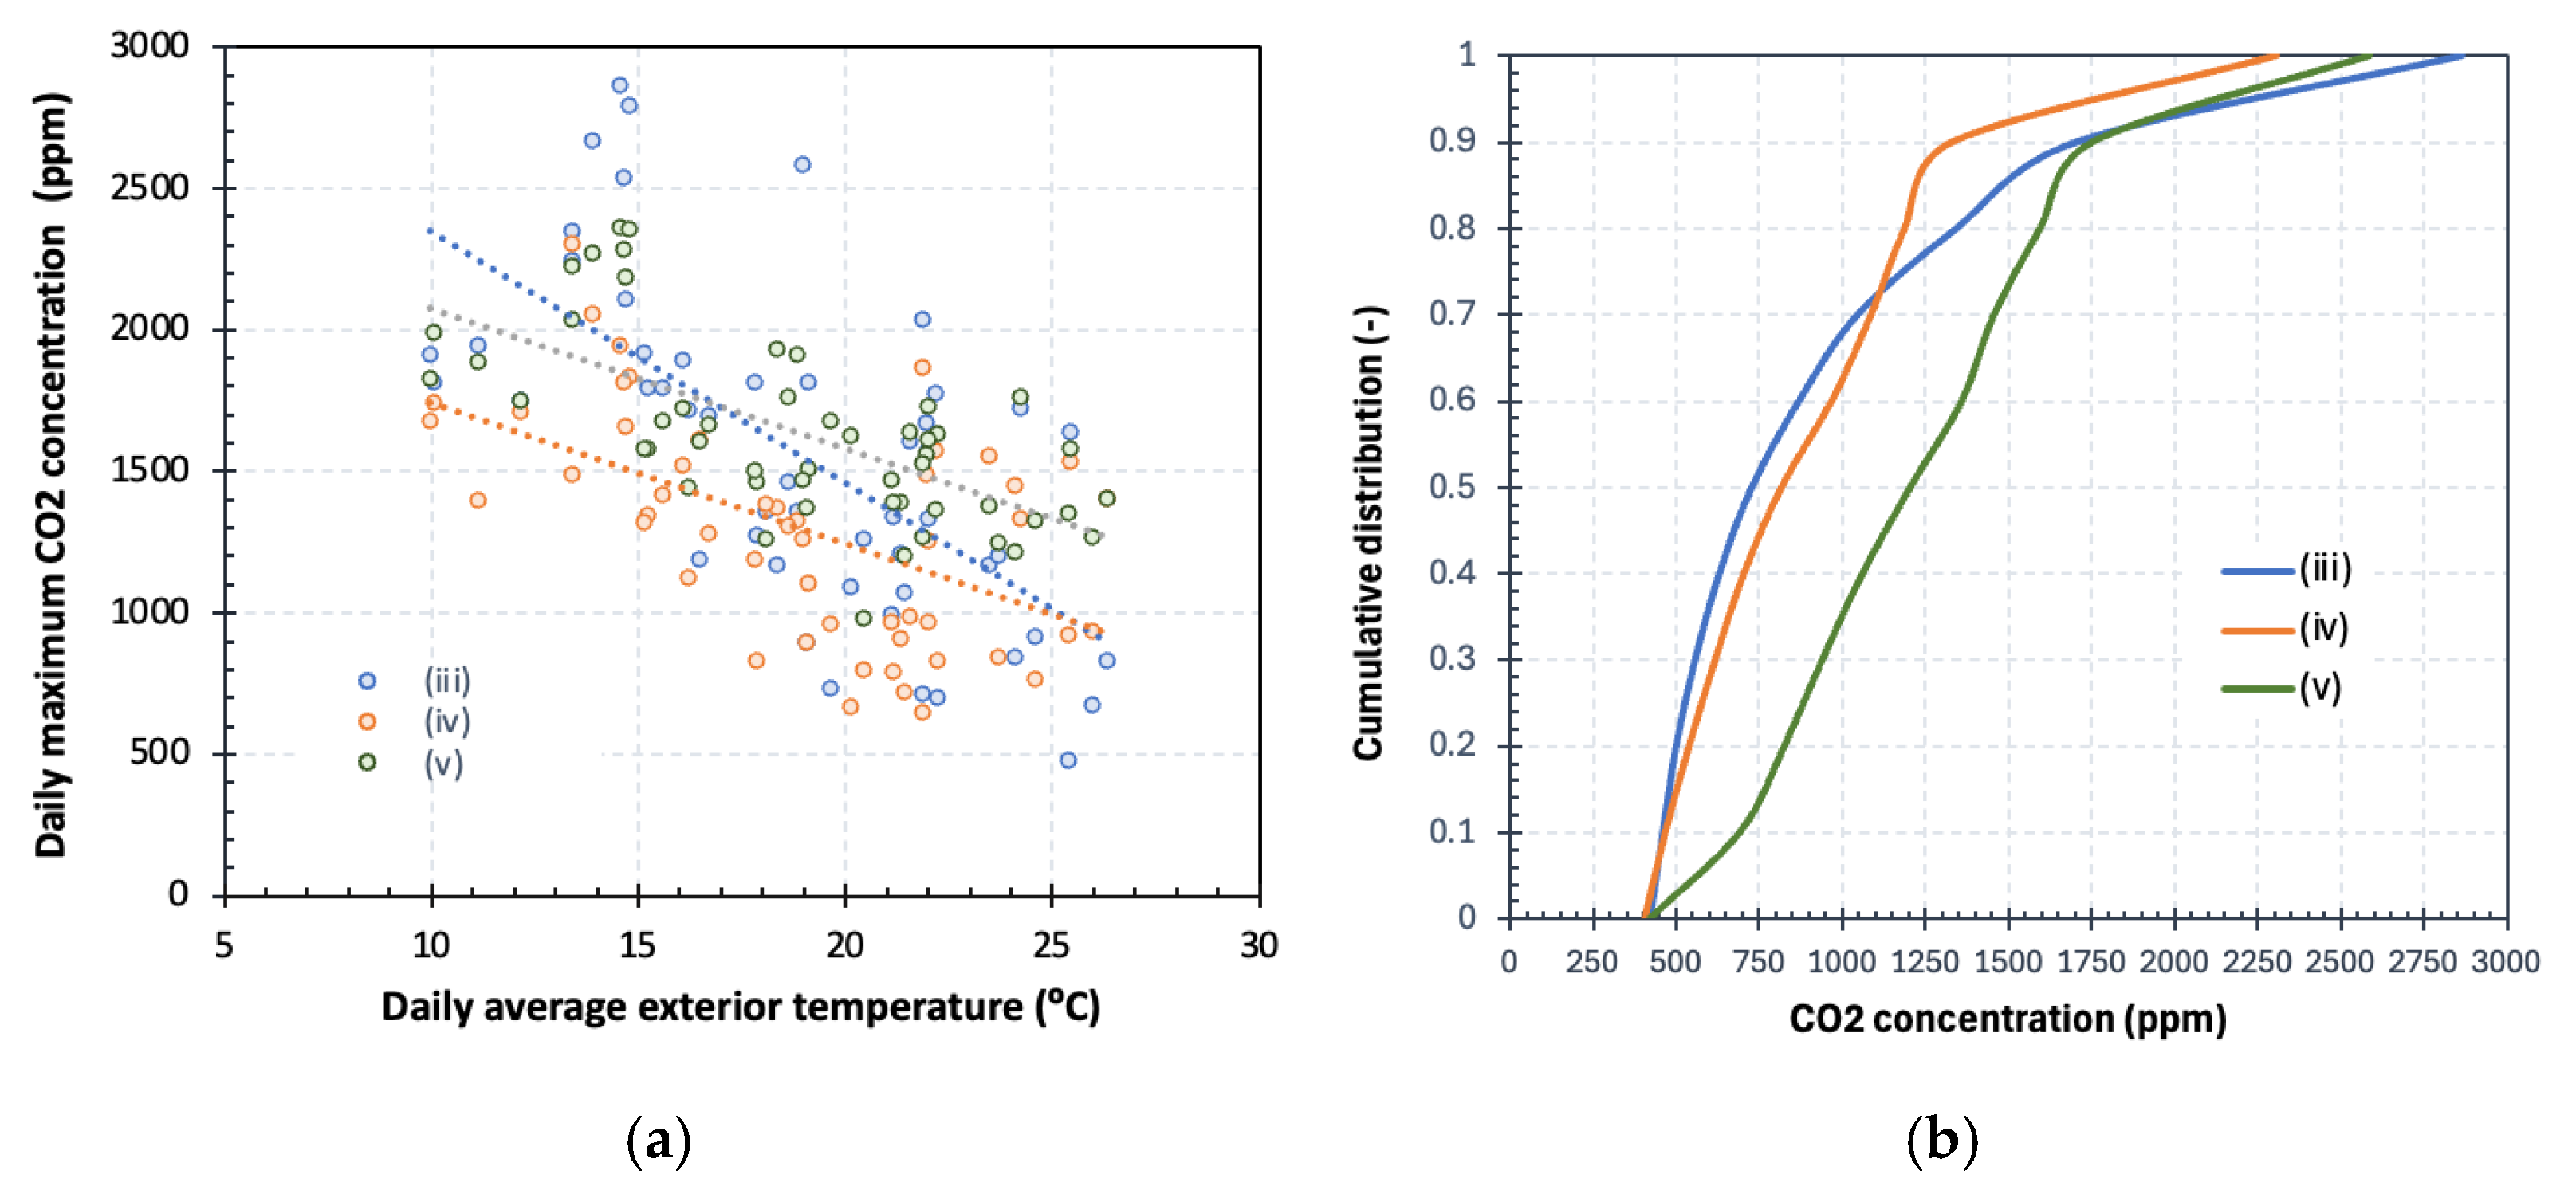
As expected, the data show that carbon dioxide concentrations are higher during the occupancy period. Furthermore, it is observed that carbon dioxide levels peak in the first few weeks, coinciding with the colder season. This pattern confirms the users’ efforts to minimize air exchange with the outdoors during colder periods, which, while conserving energy, also impacts indoor air quality. To further detail this phenomenon, Figure 9a shows the relationship between the daily maximum carbon dioxide concentration and the daily average outdoor temperature, considering only the occupied period, from 09:00 to 16:00, excluding holidays and weekends. The results confirm that outdoor temperature influences the maximum levels of carbon dioxide concentration. Lower outdoor temperatures correspond to higher carbon dioxide concentrations, confirming that building occupants tend to minimize uncontrolled air infiltration by reducing the opening of doors and windows. This leads to reduced air exchange between the interior and exterior, and consequently, higher carbon dioxide concentrations.
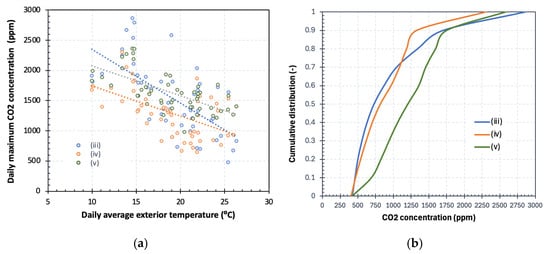
Figure 9.
(a) Daily maximum carbon dioxide concentration vs. daily average outdoor temperature; (b) cumulative distribution of the carbon dioxide concentration.
Figure 9b shows the cumulative distribution of the carbon dioxide concentration in the three kindergartens. Analyzing the results, it is observed that the 1000 ppm limit is exceeded for approximately 65%, 40%, and 30% of the occupancy time in Kindergartens (v), (iv), and (iii), respectively. These percentages drop to 50%, 10%, and 25% when the limit is set at 1250 ppm. On the other hand, allowing for a 10% tolerance in exposure time, the maximum carbon dioxide concentration is 1350 ppm in Kindergarten (iv), 1700 ppm in Kindergarten (iii), and 1750 ppm in Kindergarten (v). These results are in line with previous works carried out in Portuguese kindergartens [10,43,44].
4. Conclusions
This study presents and discusses the results of monitoring the indoor environmental conditions (air temperature, relative humidity, and carbon dioxide concentration) in five kindergartens located in the northern region of Portugal. A comprehensive survey of the buildings’ geometric and construction characteristics was also conducted, and specific questionnaires were developed to collect the thermal perception of the users. The following conclusions can be drawn:
- The recorded temperature ranged from 10 to 27 °C, demonstrating variability in performance across the different buildings. Additionally, significant fluctuations were observed even within the same building, largely driven by external weather conditions, suggesting that the use of heating systems is either very sporadic or entirely absent in some of the case studies;
- The impact of the buildings’ construction characteristics was evident in some of the case studies, particularly concerning the size and orientation of glazed areas and the lack of thermal insulation in the building envelope, especially in the roof. The kindergartens that performed best in terms of thermal comfort feature glazed openings oriented to the south and southwest. In contrast, the less efficient kindergartens share a common orientation of openings to the southeast and northwest;
- The comfort questionnaires consistently indicated a slight warm to warm thermal sensation in both evaluation phases. However, some issues arose in the first phase, particularly in explaining the methodology to the children. This situation was addressed in the second phase, leading to greater coherence in the results. The study confirmed the importance of developing specific methodologies for evaluating thermal comfort that are tailored to young children;
- The results on carbon dioxide concentration highlight the need to balance ventilation with energy efficiency. To combat low indoor temperatures, occupants often limit the opening of doors and windows, reducing air exchange and resulting in higher CO2 levels.
As future work, the authors intend to extend the monitoring period to increase the available database, allowing for a sufficiently robust and complete discussion that will result in concrete proposals in terms of energy renovation and optimization of the operating conditions of these buildings.
Author Contributions
Conceptualization, R.M.S.F.A. and E.B.; methodology, R.M.S.F.A. and E.B.; formal analysis, R.M.S.F.A., J.G. and E.B.; resources, E.B.; data curation, R.M.S.F.A. and J.G.; writ-ing—original draft preparation, J.G.; writing—review and editing, R.M.S.F.A. and E.B.; super-vision, R.M.S.F.A. and E.B.; project administration, E.B. All authors have read and agreed to the published version of the manuscript.
Funding
This work was financially supported by Base Funding–UIDB/04708/2020 with DOI 10.54499/UIDB/04708/2020 (https://doi.org/10.54499/UIDB/04708/2020) of the CONSTRUCT - Instituto de I&D em Estruturas e Construções - funded by national funds through the FCT/MCTES (PIDDAC).
Data Availability Statement
The raw data supporting the conclusions of this article will be made available by the authors on request, due to privacy restrictions.
Conflicts of Interest
The authors declare no conflicts of interest.
References
- Milesi, C.; Gamoran, A. Effects of Class Size and Instruction on Kindergarten Achievement. Educ. Eval. Policy Anal. 2006, 28, 287–313. [Google Scholar] [CrossRef]
- Tanner, C.K. Effects of school design on student outcomes. J. Educ. Adm. 2009, 47, 381–399. [Google Scholar] [CrossRef]
- Haghighi, M.M.; Jusan, M.B.M. The impact of classroom settings on students’ seat-selection and academic performance. Indoor Built Environ. 2015, 24, 280–288. [Google Scholar] [CrossRef]
- López-Chao, V.; Amado Lorenzo, A.; Saorín, J.L.; De La Torre-Cantero, J.; Melián-Díaz, D. Classroom Indoor Environment Assessment through Architectural Analysis for the Design of Efficient Schools. Sustainability 2020, 12, 2020. [Google Scholar] [CrossRef]
- Mendell, M.J.; Heath, G.A. Do indoor pollutants and thermal conditions in schools influence student performance? A critical review of the literature. Indoor Air 2005, 15, 27–52. [Google Scholar] [CrossRef]
- Wargocki, P.; Wyon, D.P.; Matysiak, B.; Irgens, S. The effects of classroom air temperature and outdoor air supply rate on performance of school work by children. HVACR Res. 2005, 13, 165–191. [Google Scholar] [CrossRef]
- Bakó-Biró, Z.; Clements-Croome, D.J.; Kochhar, N.; Awbi, H.B.; Williams, M.J. Ventilation rates in schools and pupils’ performance. Build. Environ. 2012, 48, 215–223. [Google Scholar] [CrossRef]
- Almeida, R.M.S.F.; Freitas, V.P. Indoor environmental quality of classrooms in Southern European climate. Energy Build. 2014, 81, 127–140. [Google Scholar] [CrossRef]
- Heebøll, A.; Wargocki, P.; Toftum, J. Window and door opening behavior, carbon dioxide concentration, temperature, and energy use during the heating season in classrooms with different ventilation retrofits—ASHRAE RP1624. Sci. Technol. Built Environ. 2018, 24, 626–637. [Google Scholar] [CrossRef]
- Almeida, R.M.S.F.; Ramos, N.M.M.; Freitas, V.P. Thermal comfort models and pupils’ perception in free-running school buildings of a mild climate country. Energy Build. 2016, 111, 64–75. [Google Scholar] [CrossRef]
- Guevara, G.; Soriano, G.; Mino-Rodriguez, I. Thermal comfort in university classrooms: An experimental study in the tropics. Build. Environ. 2021, 187, 107430. [Google Scholar] [CrossRef]
- Barmparesos, N.; Papadaki, D.; Karalis, M.; Fameliari, K.; Assimakopoulos, M.N. In Situ Measurements of Energy Consumption and Indoor Environmental Quality of a Pre-Retrofitted Student Dormitory in Athens. Energies 2019, 12, 2210. [Google Scholar] [CrossRef]
- Hu, M. Optimal Renovation Strategies for Education Buildings—A Novel BIM–BPM–BEM Framework. Sustainability 2018, 10, 3287. [Google Scholar] [CrossRef]
- Niemelä, T.; Kosonen, R.; Jokisalo, J. Cost-optimal energy performance renovation measures of educational buildings in cold climate. Appl. Energy 2016, 183, 1005–1020. [Google Scholar] [CrossRef]
- Almeida, R.M.S.F.; Freitas, V.P. IEQ assessment of classrooms with an optimized demand controlled ventilation system. Energy Procedia 2015, 78, 3132–3137. [Google Scholar] [CrossRef]
- Almeida, R.M.S.F.; Pinto, M.; Pinho, P.; Lemos, L.T. Natural Ventilation and Indoor Air Quality in Educational Buildings: Experimental Assessment and Improvement Strategies. Energy Effic. 2017, 10, 839–854. [Google Scholar] [CrossRef]
- Cordero, A.S.; Melgar, S.G.; Márquez, J.M.A. Validation of Dynamic Natural Ventilation Protocols for Optimal Indoor Air Quality and Thermal Adaptive Comfort during the Winter Season in Subtropical-Climate School Buildings. Appl. Sci. 2024, 14, 4651. [Google Scholar] [CrossRef]
- Pinho, P.; Pinto, M.; Almeida, R.M.S.F.; Lopes, S.M.; Lemos, L.T. Aspects concerning the acoustical performance of school buildings in Portugal. Appl. Acoust. 2016, 106, 129–134. [Google Scholar] [CrossRef]
- Pinho, P.; Pinto, M.; Almeida, R.M.S.F.; Lemos, L.T.; Lopes, S.M. Aspects concerning the acoustical performance of school cafeterias. Appl. Acoust. 2018, 136, 36–40. [Google Scholar] [CrossRef]
- Hu, K.; Xu, C.; Li, W.; Ye, J.; Yang, Y.; Xu, Y. Consideration of Thermal Comfort, Daylighting Comfort, and Life-Cycle Decarbonization in the Retrofit of Kindergarten Buildings in China: A Case Study. Buildings 2024, 14, 2703. [Google Scholar] [CrossRef]
- Miao, S.; Gangolells, M.; Tejedor, B. Data-driven model for predicting indoor air quality and thermal comfort levels in naturally ventilated educational buildings using easily accessible data for schools. J. Build. Eng. 2023, 80, 108001. [Google Scholar] [CrossRef]
- Almeida, R.M.S.F.; Freitas, V.P. An insulation thickness optimization methodology for school buildings rehabilitation combining artificial neural networks and life cycle cost. J. Civ. Eng. Manag. 2016, 22, 915–923. [Google Scholar] [CrossRef]
- Wang, Y.; Kuckelkorn, J.; Zhao, F.Y.; Liu, D.; Kirschbaum, A.; Zhang, J.L. Evaluation on classroom thermal comfort and energy performance of passive school building by optimizing HVAC control systems. Build. Environ. 2015, 89, 86–106. [Google Scholar] [CrossRef]
- Lakhdari, K.; Sriti, L.; Painter, B. Parametric optimization of daylight, thermal and energy performance of middle school classrooms, case of hot and dry regions. Build. Environ. 2021, 204, 108173. [Google Scholar] [CrossRef]
- Sadick, A.M.; Issa, M.H. Differences in teachers’ satisfaction with indoor environmental quality and their well-being in new, renovated and non-renovated schools. Indoor Built Environ. 2018, 27, 1272–1286. [Google Scholar] [CrossRef]
- Zaeh, S.E.; Koehler, K.; Eakin, M.N.; Wohn, C.; Diibor, I.; Eckmann, T.; Wu, T.D.; Clemons-Erby, D.; Gummerson, C.E.; Green, T.; et al. Indoor Air Quality Prior to and Following School Building Renovation in a Mid-Atlantic School District. Int. J. Environ. Res. Public Health 2021, 18, 12149. [Google Scholar] [CrossRef]
- Domínguez-Amarillo, S.; Fernández-Agüera, J.; González, M.M.; Cuerdo-Vilches, T. Overheating in Schools: Factors Determining Children’s Perceptions of Overall Comfort Indoors. Sustainability 2020, 12, 5772. [Google Scholar] [CrossRef]
- EN 16798-1:2020; Energy Performance of Buildings—Ventilation for Buildings—Part 1: Indoor Environmental Input Parameters for Design and Assessment of Energy Performance of Buildings Addressing Indoor Air Quality, Thermal Environment, Lighting and Acoustic. European Standard: Newark, DE, USA, 2020.
- Yun, H.; Nam, I.; Kim, J.; Yang, J.; Lee, K.; Sohn, J. A field study of thermal comfort for kindergarten children in Korea: An assessment of existing models and preferences of children. Build. Environ. 2014, 75, 182–189. [Google Scholar] [CrossRef]
- ANSI/ASHRAE Standard 55; Thermal Environmental Conditions for Human Occupancy. ASHRAE: Peachtree Corners, GA, USA, 2020.
- Aparicio-Ruiz, P.; Barbadilla-Martín, E.; Guadix, J.; Muñuzuri, J. A field study on adaptive thermal comfort in Spanish primary classrooms during summer season. Build. Environ. 2021, 203, 108089. [Google Scholar] [CrossRef]
- Almeida, R.M.S.F.; Barreira, E.; Moreira, P. A Discussion Regarding the Measurement of Ventilation Rates Using Tracer Gas and Decay Technique. Infrastructures 2020, 5, 85. [Google Scholar] [CrossRef]
- Jia, L.-R.; Han, J.; Chen, X.; Li, Q.-Y.; Lee, C.-C.; Fung, Y.-H. Interaction Between Thermal Comfort, Indoor Air Quality and Ventilation Energy Consumption of Educational Buildings: A Comprehensive Review. Buildings 2021, 11, 591. [Google Scholar] [CrossRef]
- De la Hoz-Torres, M.L.; Aguilar, A.J.; Ruiz, D.P.; Martínez-Aires, M.D. Analysis of Impact of Natural Ventilation Strategies in Ventilation Rates and Indoor Environmental Acoustics Using Sensor Measurement Data in Educational Buildings. Sensors 2021, 21, 6122. [Google Scholar] [CrossRef] [PubMed]
- ANSI/ASHRAE Standard 62.1; Ventilation and Acceptable Indoor Air Quality. ASHRAE: Peachtree Corners, GA, USA, 2022.
- Zapata-Lancaster, M.G.; Ionas, M.; Toyinbo, O.; Smith, T.A. Carbon Dioxide Concentration Levels and Thermal Comfort in Primary School Classrooms: What Pupils and Teachers Do. Sustainability 2023, 15, 4803. [Google Scholar] [CrossRef]
- Fernández-Agüera, J.; Campano, M.Á.; Domínguez-Amarillo, S.; Acosta, I.; Sendra, J.J. CO2 Concentration and Occupants’ Symptoms in Naturally Ventilated Schools in Mediterranean Climate. Buildings 2019, 9, 197. [Google Scholar] [CrossRef]
- Munckton, B.; Rajagopalan, P. Interaction between Thermal Conditions and Ventilation in Kindergartens in Melbourne, Australia. Sustainability 2024, 16, 1186. [Google Scholar] [CrossRef]
- ISO 7726; Ergonomics of the Thermal Environment—Instruments for Measuring Physical Quantities, 2nd ed. International Standard ISO 7726: 1998 from Technical Committee ISO/TC 159; ISO: Berlin, Germany, 1998.
- EN 16798-2:2019; Energy Performance of Buildings-Ventilation for Buildings—Part 2: Interpretation of the Requirements in EN 16798-1—Indoor Environmental Input Parameters for Design and Assessment of Energy Performance of Buildings Addressing Indoor Air Quality, Thermal Environment, Lighting and Acoustics. European Committee for Standardization: Brussels, Belgium, 2019.
- ISO 10551; Ergonomics of the Thermal Environment—Assessment of the Influence of the Thermal Environment Using Subjective Judgement Scales, International Standard ISO 10551:1995. International Organization for Standardization: Geneva, Switzerland, 1995.
- Fabbri, K. Thermal comfort evaluation in kindergarten: PMV and PPD measurement through datalogger and questionnaire. Build. Environ. 2013, 68, 202–214. [Google Scholar] [CrossRef]
- Branco, P.T.B.S.; Nunes, R.A.O.; Alvim-Ferraz, M.C.M.; Martins, F.G.; Sousa, S.I.V. Children’s exposure to indoor air in urban nurseries—Part II: Gaseous pollutants’ assessment. Environ. Res. 2015, 142, 662–670. [Google Scholar] [CrossRef]
- Oliveira, M.; Slezakova, K.; Delerue-Matos, C.; Pereira, M.C.; Morais, S. Assessment of air quality in preschool environments (3–5 years old children) with emphasis on elemental composition of PM10 and PM2. Environ. Pollut. 2016, 214, 430–439. [Google Scholar] [CrossRef]


Disclaimer/Publisher’s Note: The statements, opinions and data contained in all publications are solely those of the individual author(s) and contributor(s) and not of MDPI and/or the editor(s). MDPI and/or the editor(s) disclaim responsibility for any injury to people or property resulting from any ideas, methods, instructions or products referred to in the content. |
© 2024 by the authors. Licensee MDPI, Basel, Switzerland. This article is an open access article distributed under the terms and conditions of the Creative Commons Attribution (CC BY) license (https://creativecommons.org/licenses/by/4.0/).