Abstract
The aim of this paper is to propose a workflow for the real-time visualization of virtual environments that supports diagnostic tasks in heritage buildings. The approach integrates data from terrestrial laser scanning (3D point clouds and meshes), along with panoramic and thermal images, into a unified virtual model. Additionally, the methodology incorporates several post-processing stages designed to enhance the user experience in visualizing both the building and its associated damage. The methodology was tested on the Medieval Templar Church of Vera Cruz in Segovia, utilizing a combination of visible and infrared data, along with manually prepared damage maps. The project results demonstrate that the use of a hybrid digital model—combining 3D point clouds, polygonal meshes, and panoramic images—is highly effective for real-time rendering, providing detailed visualization while maintaining adaptability for mobile devices with limited computational power.
1. Introduction
Digital tools are transforming how heritage sites are documented, analyzed, and preserved, offering new possibilities for both professionals and the public to engage with Cultural Heritage. Its ongoing development is providing groundbreaking tools for the conservation and restoration of architectural heritage [1]. Notable examples of these new tools can be found in the works of Barontini et al. [2], Mishra et al. [3], and Sánchez-Aparicio et al. [4]. The first study develops a Building Information Modelling methodology for preventive conservation of historic sites by using 3D point clouds for modelling the sites as well as ad-hoc families for integrating the data coming from previous tests and the damage assessment. The second example explores the application of novel artificial intelligence techniques to enhance visual inspections by detecting damage in images captured with standard devices. The detection is performed by using a Deep Learning Neural Network that evaluates the features of the images captured. The third study introduces a platform: the PlusCARE system. This tool utilizes digital tools such as virtual reality, laser scanning (static and mobile mapping), and 360-degree images to integrate the diverse information necessary for effective preventive conservation of heritage sites. This information includes data from different tests, as well as from monitoring systems.
In all of these cases, the concept of eXtended Reality (XR) plays a significant role. XR defines how users—whether technical experts or casual visitors—interact with the building or asset. This interaction can take the form of virtual reality (VR), mixed reality (MR), or augmented reality (AR) [5]. According to Mudicka and Kapica [6], VR is the most recognized approach, allowing users to engage solely with a digital representation of the building. In contrast, MR and AR provide opportunities to interact with physical assets, enhancing the overall experience for users from both technical and tourism perspectives [7].
Numerous studies in the literature focus on the development of new XR environments for remotely visiting heritage sites, visualizing their original appearance, or supporting technical tasks such as site diagnostics and preventive conservation [8,9,10]. In this case, the primary concerns are the inputs for the environment, as well as real-time visualization (including compatibility with devices with low computational power).
Typically, the geometrical base used for virtual environments relies on reality capture techniques, often utilizing remote sensing sensors. These sensors can be categorized as either passive (e.g., digital cameras) or active (e.g., laser scanners), and they capture not only geometric data but also radiometric information. These data can then be used to generate highly detailed and accurate 3D models in the form of point clouds or meshes that precisely represent the captured scene [11]. Moreover, the captured information can support damage mapping by using the geometry contained into the 3D models, as well as its radiometry [12,13]. The radiometric data can be gathered in the visible spectrum or beyond, such as in the infrared range by using the reflectance values of the laser scanner, multispectral [14,15], and thermal cameras. This information is often compared with other previous tests to assess construction systems or trace the origin and progression of damage [16,17,18].
Regarding real-time rendering, the literature can be categorized into two main groups. The first group involves the use of 3D rendering engines such as WEBGL applications (i.e., Potree or 3DHOP) [19,20,21], Unreal Engine, Unity, or Lumion [22,23,24,25,26,27]. The second group relies on panoramic images to create virtual experiences, using tools like Pano2VR [28,29] or Marzipano [30,31] among others. The first group leverages 3D point clouds and meshes, providing a fully immersive experience with 3D visualization of information. In contrast, the second group focuses on 2D data (panoramic images), which, through proper projection, can still deliver an immersive experience. While the first approach offers a more comprehensive experience, it demands careful management of computational resources, especially for high-resolution rendering. This limitation is addressed in the second approach, where environments are image-based, requiring fewer resources. However, this method lacks the capability for measurements (i.e., crack lengths, area of moisture, etc.), which are critical for assessing the conservation status of a building.
Under this basis, this paper proposes a hybrid approach that attempts to exploit the advantages of both approaches in a unique immersive experience to support the diagnosis of historic constructions. To this end the methodology integrates 3D point clouds, 3D meshes, and 360-degree images into a unified environment, enabling users to switch between these sources of information based on their needs and facilitating real-time interaction even in devices with low-computational resources. In addition, the methodology incorporates radiometric information from both the laser scanner and a thermographic camera to enhance damage mapping assessments. The environment leverages widely used software solutions such as CloudCompare, Agisoft Metashape, Pano2VR, and Unreal Engine 5 to streamline the application of this approach and enhance its practicality for real-world case studies.
Following this Introduction, the paper is structured as follows: Section 2 presents the methodology for real-time rendering. Section 3 describes the case study used for validation. Section 4 discusses the experimental results and provides a comparison with other state-of-the-art works. Finally, Section 5 offers conclusions and outlines potential directions for future work.
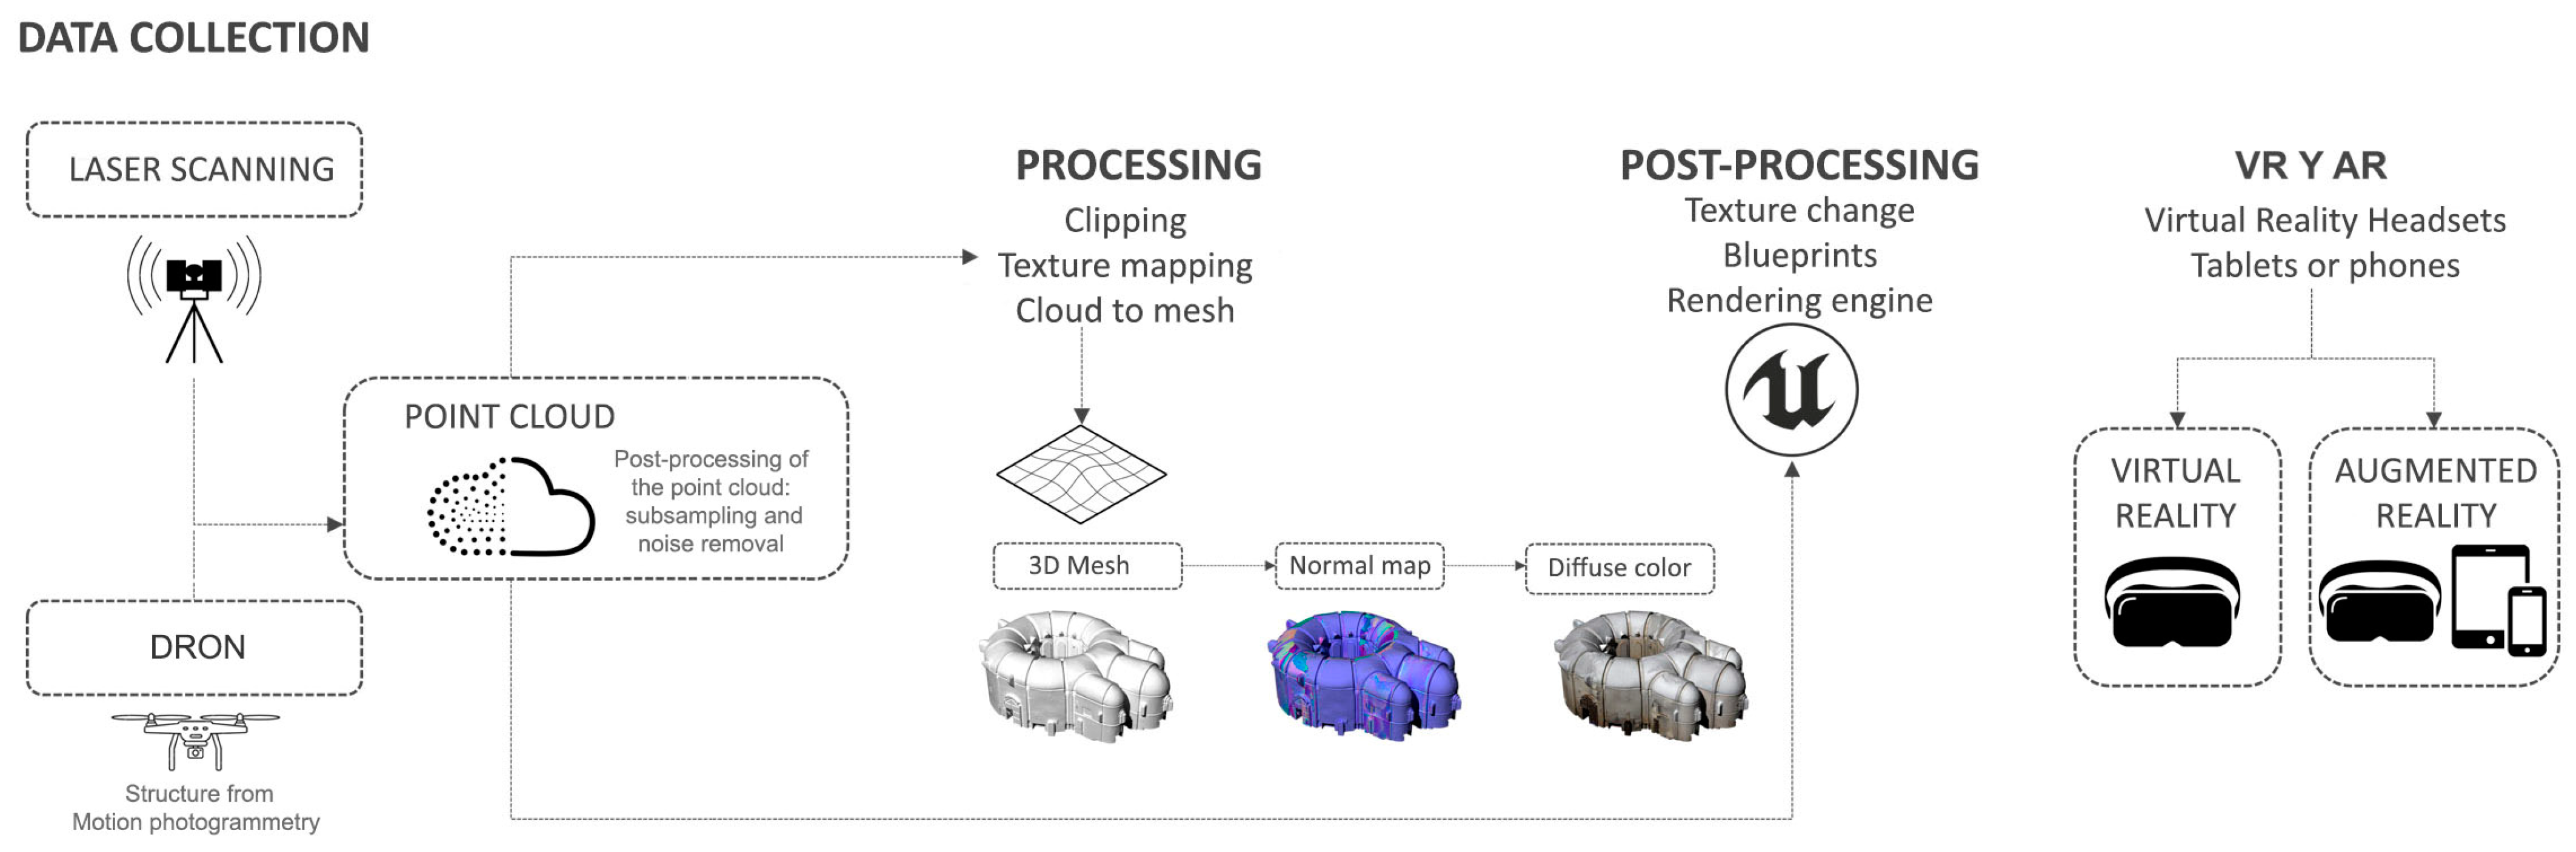
2. Methodology
This section provides a detailed explanation of the proposed methodology, which integrates 3D point clouds, meshes, and panoramic images into a unified environment. This hybrid approach allows for flexible selection between different data sources, depending on the user’s specific requirements at any given time. The proposal is articulate into two environments that interact between them. The first environment is dynamic, utilizing 3D point clouds and meshes to generate the environment (Figure 1). In contrast, the second environment, embedded within the first, is static and relies on panoramic images with overlaid information (Figure 2).
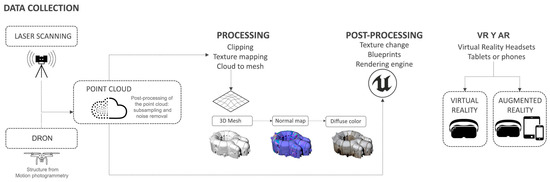
Figure 1.
From scan to VR/AR. Workflow diagram from 3D point cloud to the generation of a three-dimensional mesh for creating a digital twin to be integrated into virtual reality and augmented reality.
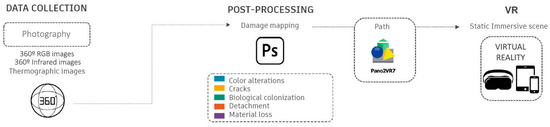
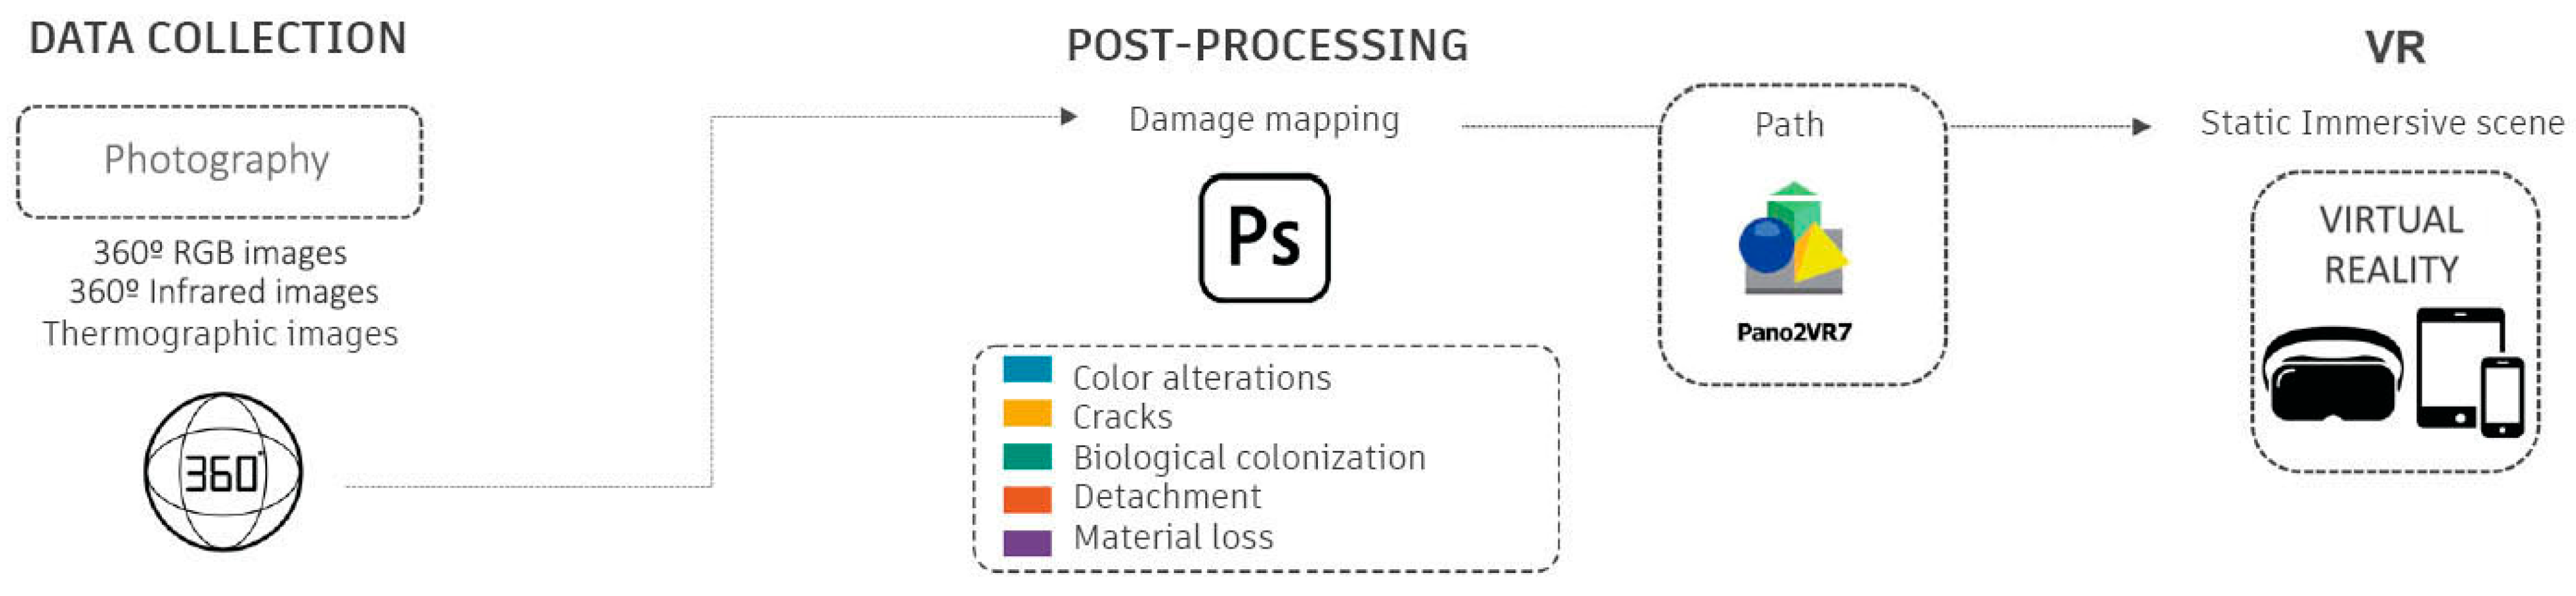
Figure 2.
Workflow diagram from 360° images and thermographic images for the creation of an immersive scene in virtual reality.
Before creating the dynamic and static environments, a complete digitalization of the building is necessary. This paper proposes using laser scanning and Structure from Motion photogrammetry due to its high performance in data acquisition and its ability to function effectively in low-light conditions. Additionally, RGB panoramic images must be captured from the same position as the laser. These images can be generated either using the laser’s integrated camera or through external systems consisting of a DSLR camera, a fisheye lens, and a roundabout system.
2.1. Dynamic Environment
The dynamic environment primarily utilizes a 3D point cloud as its main input. This representation is generated directly from laser scanning, where each point corresponds to a measurement taken by the equipment. The final resolution of the 3D point cloud is influenced not only by the scanning resolution but also by the overlap between scan stations, which is essential for aligning the data within a common coordinate system. Consequently, the first step involves subsampling the 3D point cloud to achieve a reliable resolution. This process can include spatial subsampling or curvature-based subsampling. The latter makes it possible to decimate areas with planar surfaces while preserving high-detail regions, such as ornamental features. This approach could be carried out on the open-source software CloudCompare v2.14.
The subsampled 3D point cloud can be seamlessly integrated into VR and AR environments. Specifically, this methodology proposes the use of Unreal Engine 5, a cutting-edge game engine known for its exceptional capabilities in handling 3D point clouds and meshing. The engine incorporates Nanite Virtualized Geometry, which allows for the seamless rendering of vast amounts of geometric data. Additionally, its advanced lighting and material systems enable highly realistic rendering, enhancing the overall immersion and visual fidelity of virtual experiences.
Based on this, the dynamic environment incorporates two layers of geometric representation. First, there is the 3D point cloud, which has been subsampled and can be directly integrated into the engine. Second, a 3D mesh is derived from the original point cloud. While it is technically possible to convert the 3D point cloud directly into a mesh, this approach is not recommended, as it typically results in a product that is not optimized for visualization purposes. Therefore, the current methodology includes a processing stage designed to transform the 3D point cloud into an optimized mesh. This stage is conducted using the well-known software Agisoft Metashape v2.0.0 and consists of the following steps: (i) meshing of the 3D point cloud; (ii) texture projection; (iii) generation of diffuse and normal maps; (iv) decimation of the mesh.
The first stage of processing involves generating a mesh from the 3D point cloud using the Delaunay triangulation algorithm. Next, the texture captured by the integrated camera or the external panoramic imaging system (used alongside the laser scanner) is projected onto the mesh, as these images were obtained from the same positions as the laser scanning stations. In the case of Structure from Motion, the texture projection comes directly from the positioned cameras. This process yields a dense polygonal model with high-quality textures. However, this product is not suitable for real-time rendering, necessitating further simplification. To address this, the next step involves extracting the diffuse and normal maps from the mesh. Both maps are integrated into a single UV map created during the texture projection. Subsequently, the mesh is simplified using the built-in approach in Agisoft Metashape. Finally, the diffuse and normal maps are projected onto the simplified model. As a result, the final mesh features a reduced triangle count while retaining the appearance of the full-resolution model, thanks to the application of the diffuse and normal maps.
2.2. Static Environment
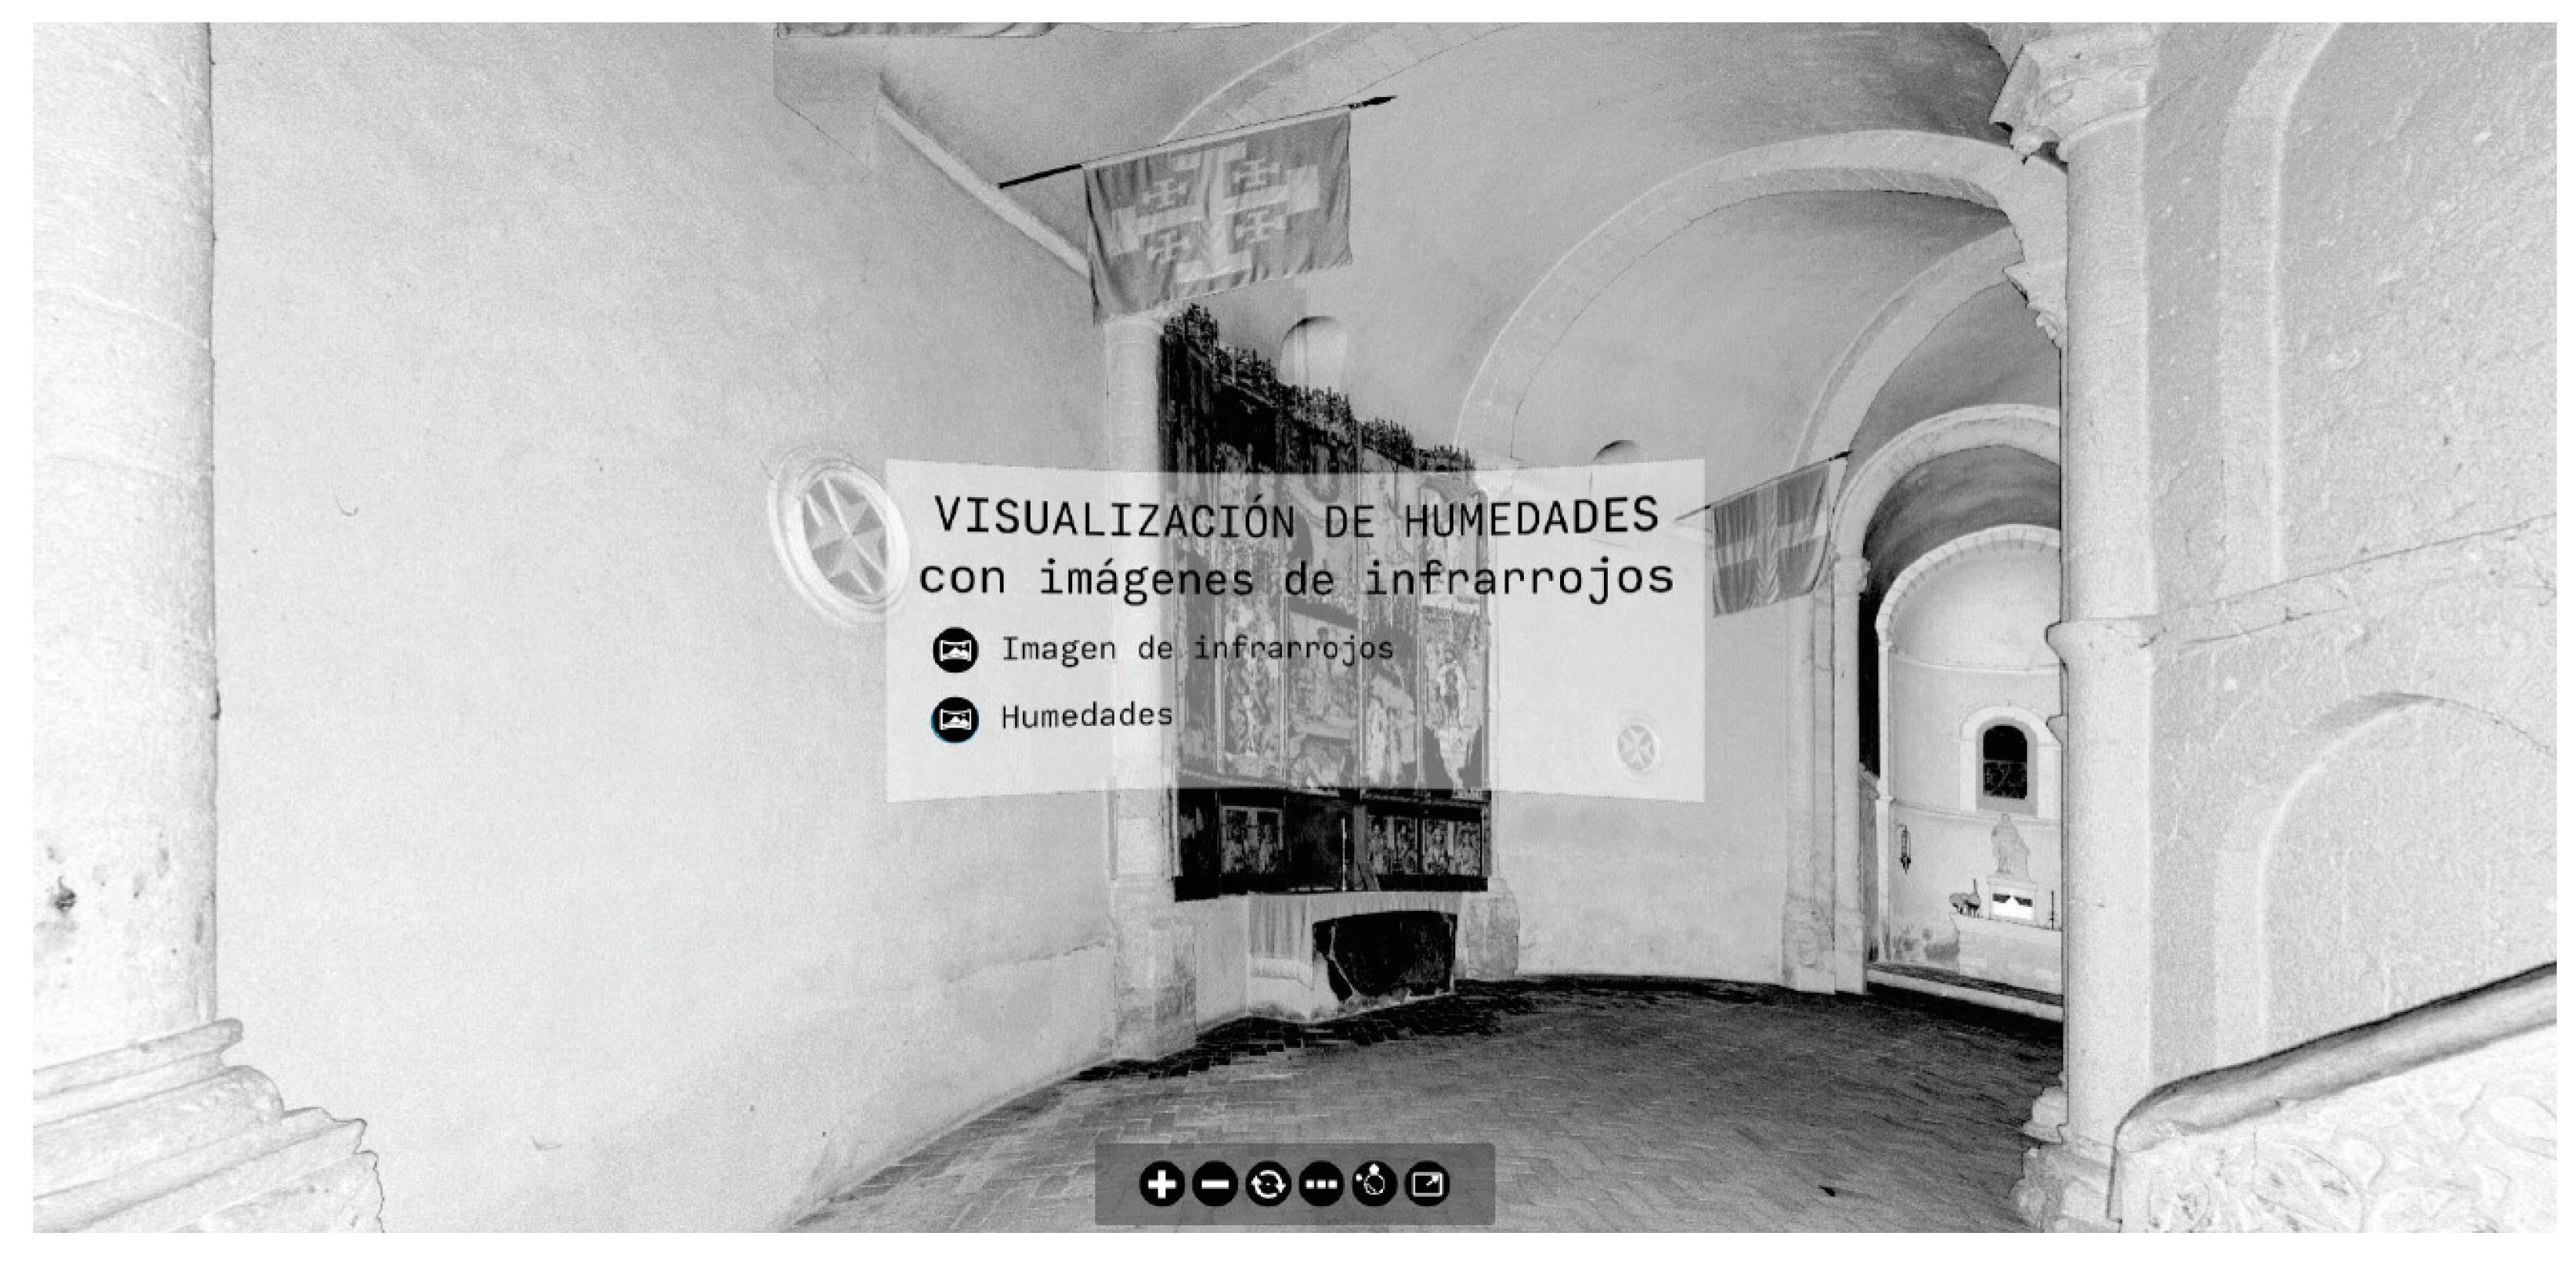
For the static environment, the primary inputs are panoramic images captured by the laser, which result from the reflection of the laser beam, as well as RGB panoramic images generated by the integrated camera. Both types of images share the same point of view, providing identical information. These images are then post-processed using Photoshop to map the damage present in the building. Generally, most damage can be mapped using only the RGB images. However, in certain cases, the panoramic images obtained from laser reflections can enhance damage detection, particularly in areas with moisture. This is due to water’s specific behavior in absorbing energy, which makes moisture more detectable in the laser-captured images. All this information, including the panoramic images and mapped damage, is integrated into the Pano2VR v7.0 software as individual panoramas, which are interconnected to allow seamless navigation throughout the Church. This approach enables the creation of a static virtual environment that is compatible with low-resource devices, as it eliminates the need for 3D rendering of the building. Additionally, this environment can be enhanced with supplementary data, such as thermal images, to provide a richer and more detailed experience. Unlike dynamic VR experiences that may involve real-time interactions or animations, this static immersive scene focuses on providing a high-fidelity, detailed view of the building as it appears in the edited 360-degree images.
3. Case Study of the Church of La Veracruz—Geometric and Architectural Description
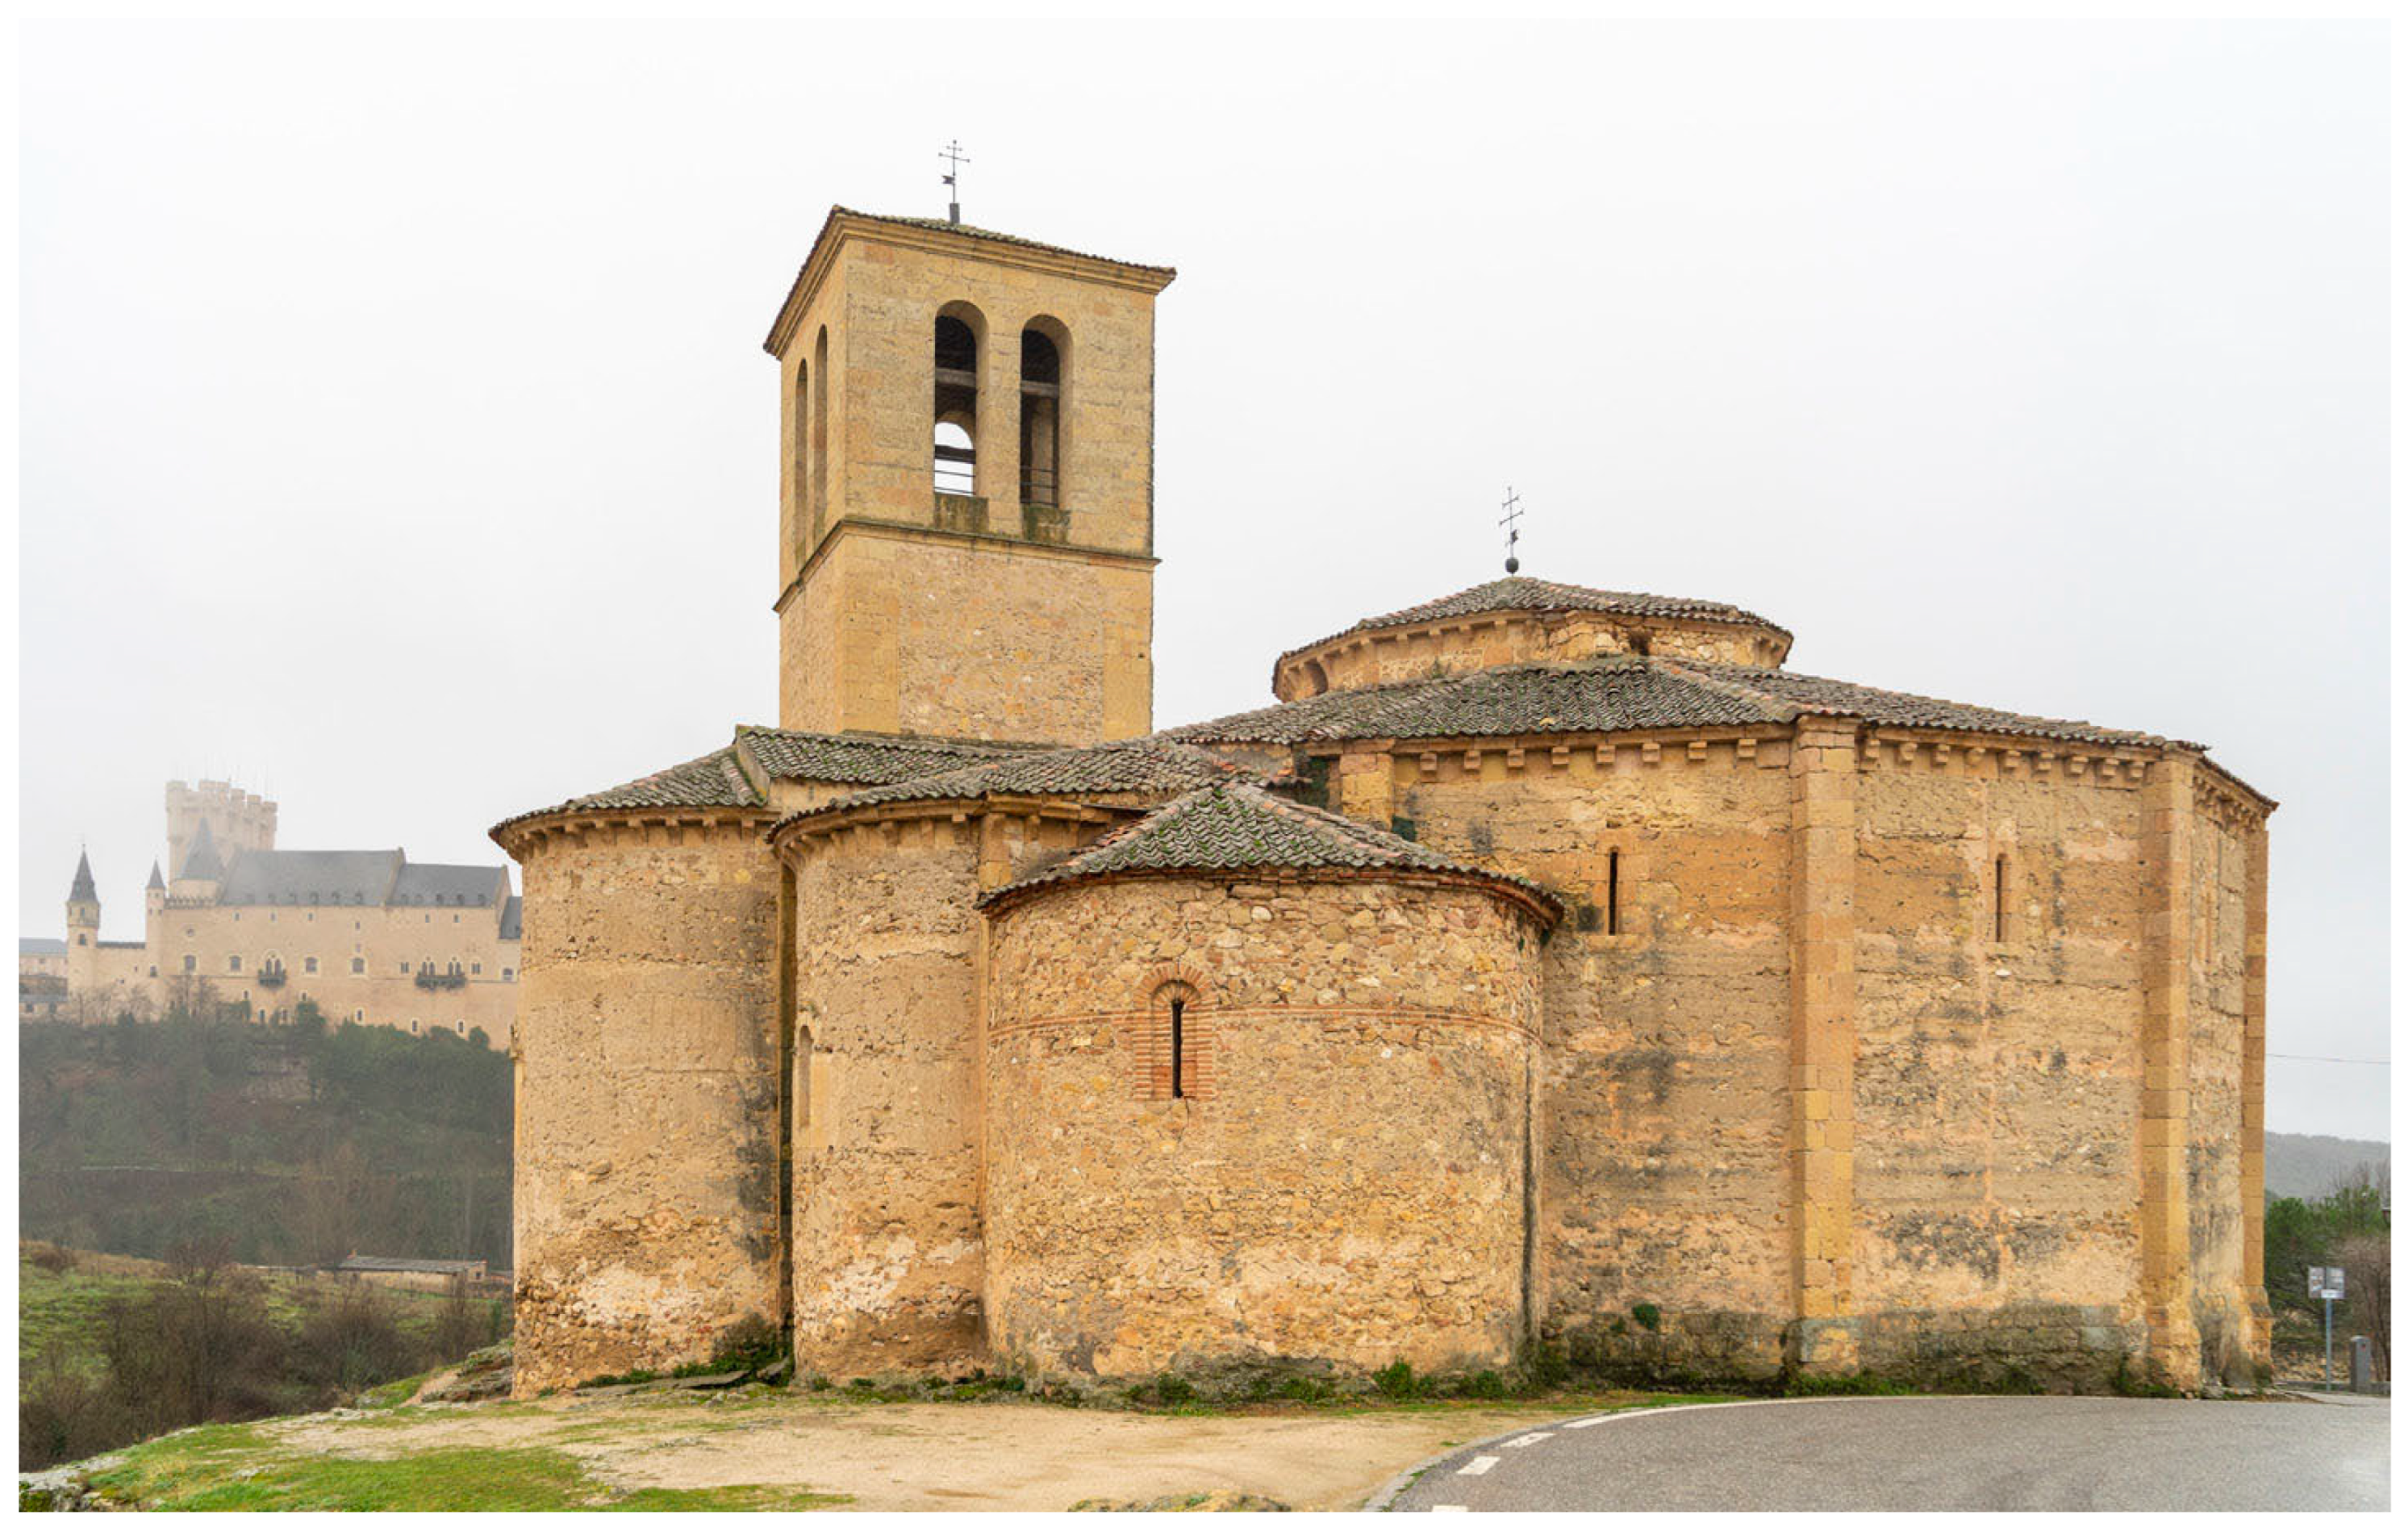
The Church of La Veracruz in Segovia stands out with its unique dodecagonal floor plan and distinct Romanesque style, making it an exceptional example of late Romanesque architecture in Spain (Figure 3). Dating back to 1208, this church is a notable late specimen closely linked to the Castilian School of architecture [32]. The design of La Veracruz is particularly significant due to its association with the Knights Templar and its resemblance to the Holy Sepulchre in Jerusalem. However, historical records indicate that it was actually constructed by the Knights of the Order of the Holy Sepulchre.
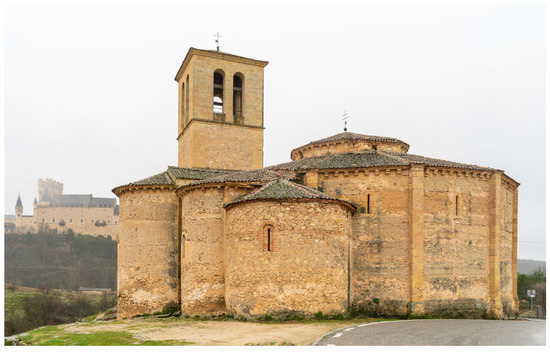
Figure 3.
Exterior view of La Veracruz Church.
Situated in the northern part of Segovia, the Church is positioned across from the Alcázar and ascends from the San Marcos valley towards the Zamarramala area. Its location outside the city walls, in a somewhat isolated setting, adds to its historical and architectural significance. Today, the church is open to the public as a museum, although worship services are held only sporadically.
Historically, this Church is a marked late example within Segovia’s Romanesque architecture and is fundamentally connected with the rest of the Castilian School. Despite historical associations with the Knights Templar, documents reviewed by Santos San Cristóbal confirm that the Church of La Veracruz was constructed by the Knights of the Order of the Holy Sepulchre, who consecrated it in 1208.
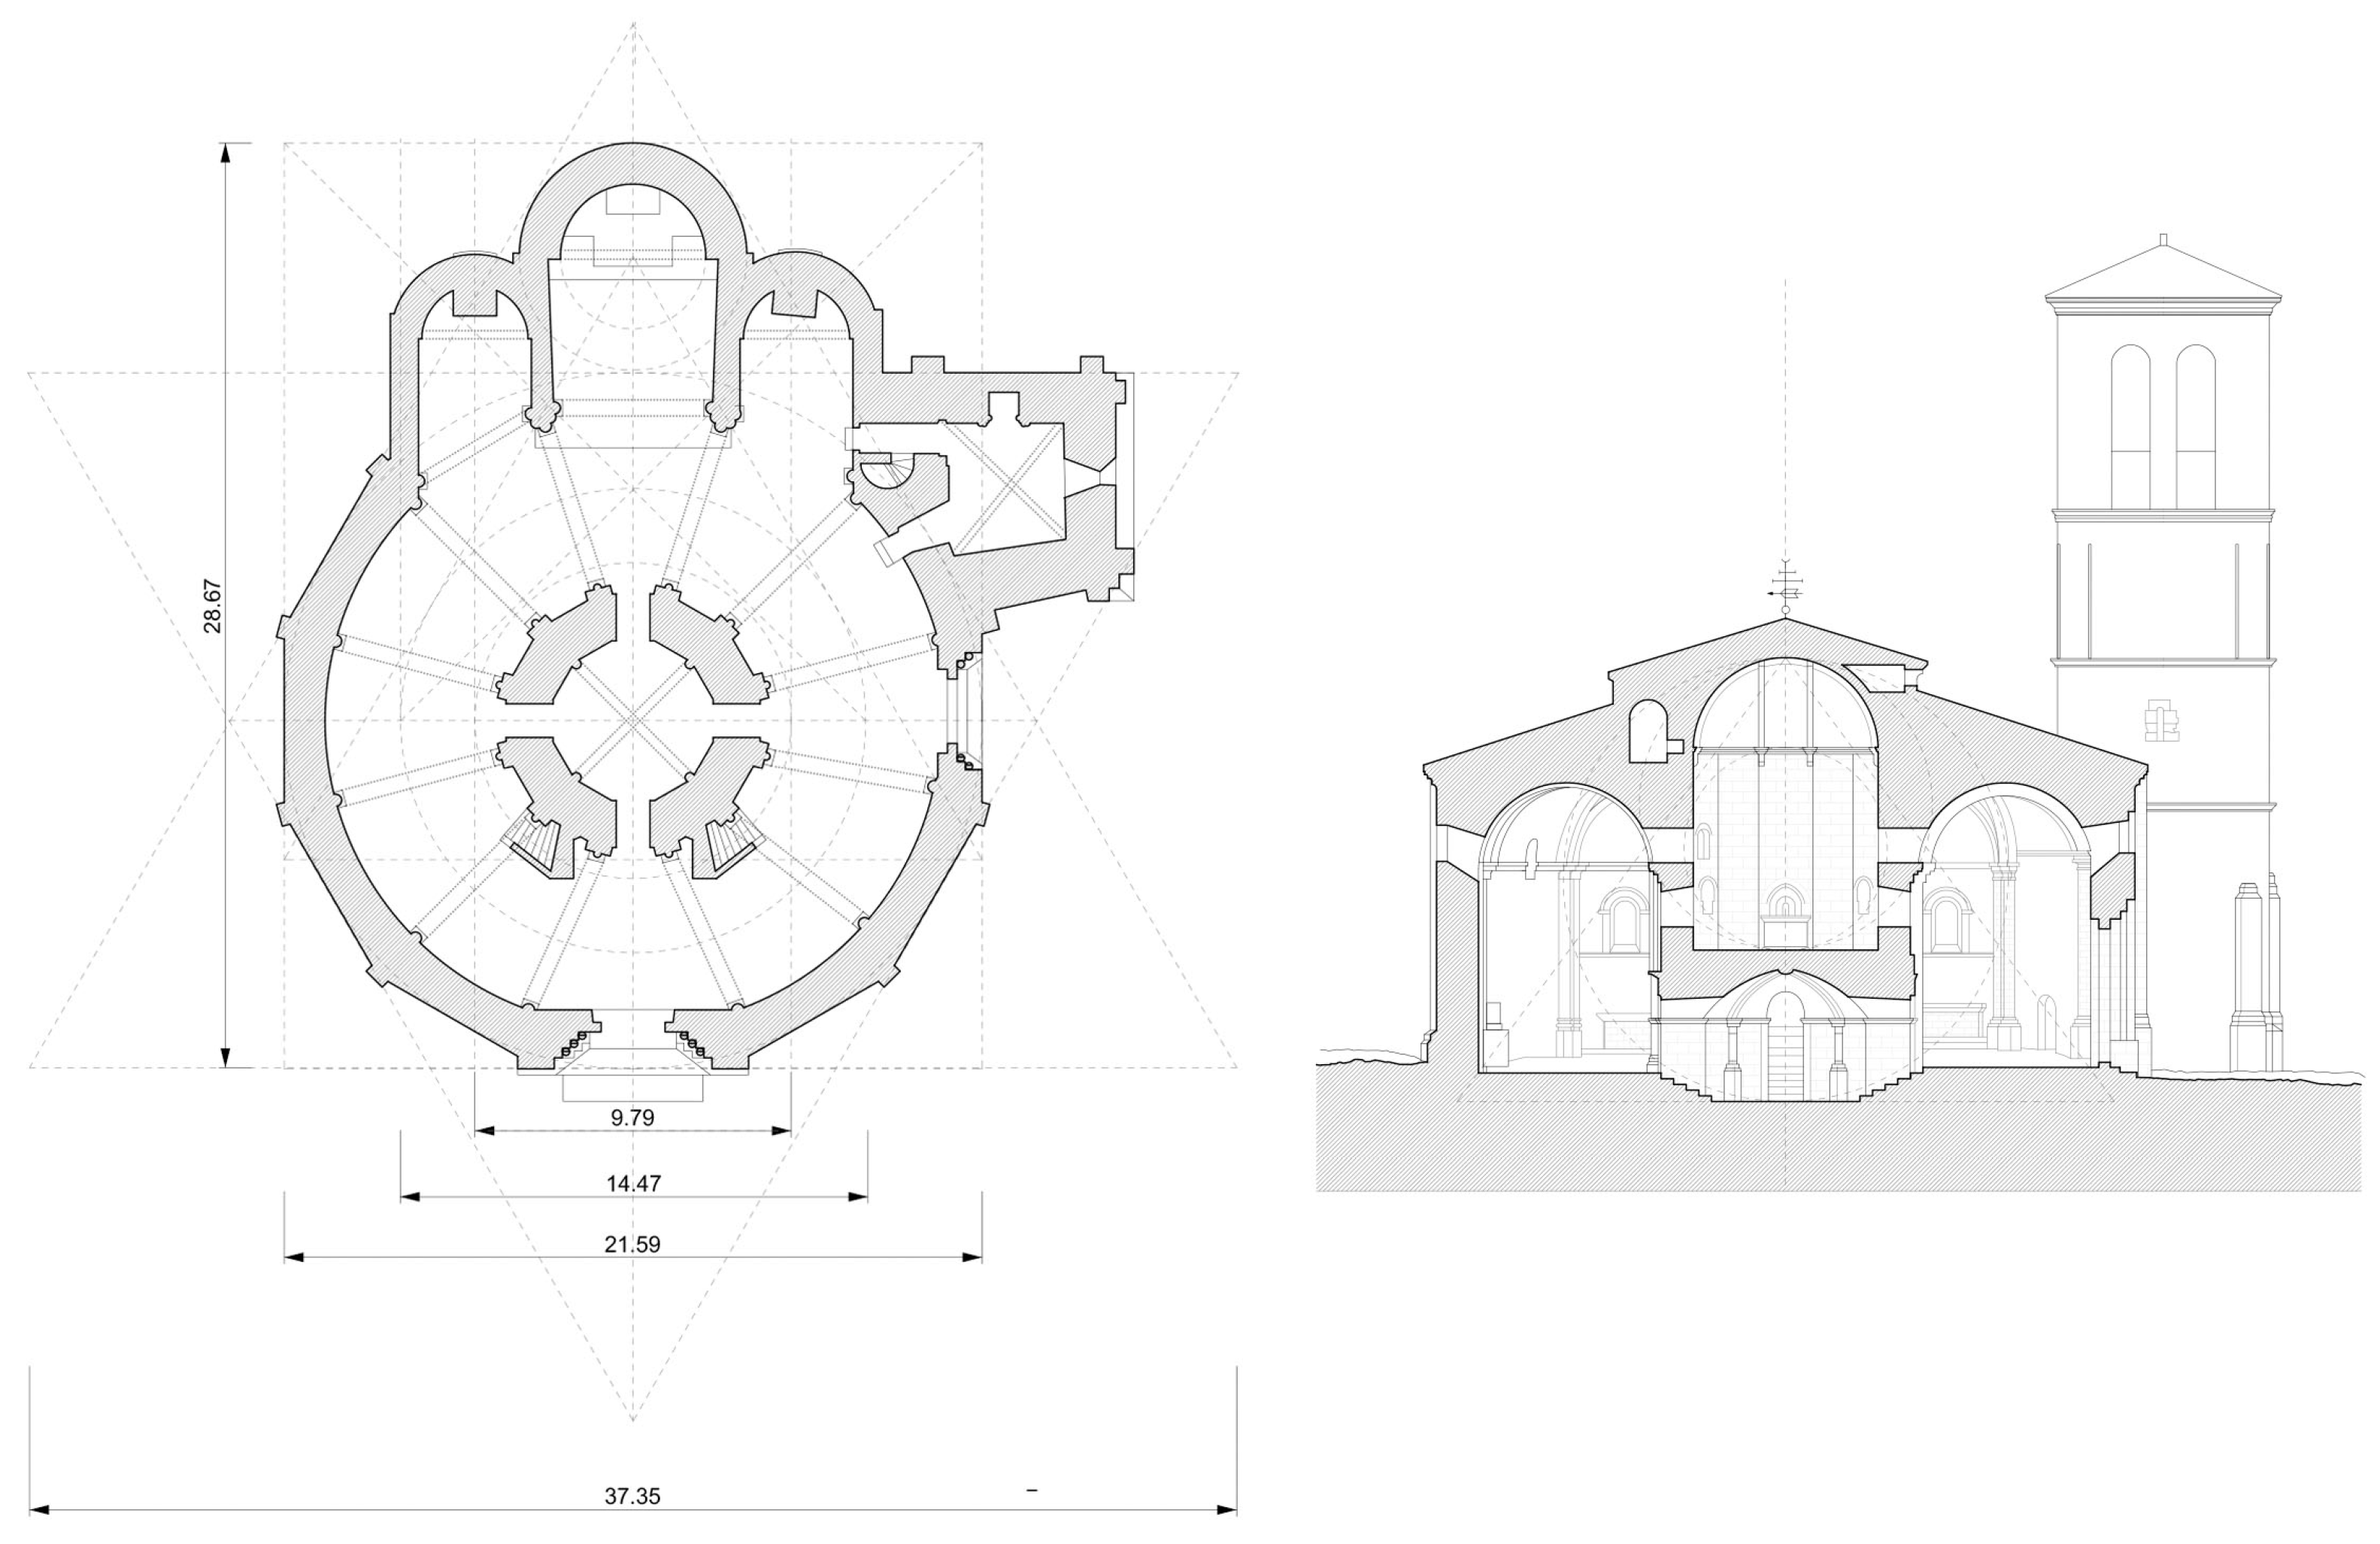
The architectural configuration of the Church of La Veracruz is distinctive within the Romanesque tradition of Segovia. The Church features a dodecagonal plan, characterized by a central double-height space surrounded by a simple annular ambulatory. This design is complemented by three cylindrical apses, a cylindrical sacristy, and a square-shaped tower. Externally, the enclosing wall is dodecagonal, while internally it is circular, with the exception of the two located on the south and west sides (Figure 4). The southern entrance is relatively simple, adorned with vegetal capitals and quadruple arches. In contrast, the western door showcases Cistercian influence, featuring pointed arches and zigzag decoration on the archivolts.

Figure 4.
Geometric analysis of the Church based on a simplified 3D model created before the generation of the point cloud.
The Church’s architectural measurement unit is 28.78 cm. The design of La Veracruz can be interpreted as a formal overlay of the basilica scheme of the Anastasis and the concentric centralized scheme of the Martyrium from the Constantinian complex of the Holy Sepulchre in Jerusalem. This comparison establishes a clear analogy between the Church of La Veracruz in Segovia and the latter, reflecting the influence of significant early Christian architectural models on its design.
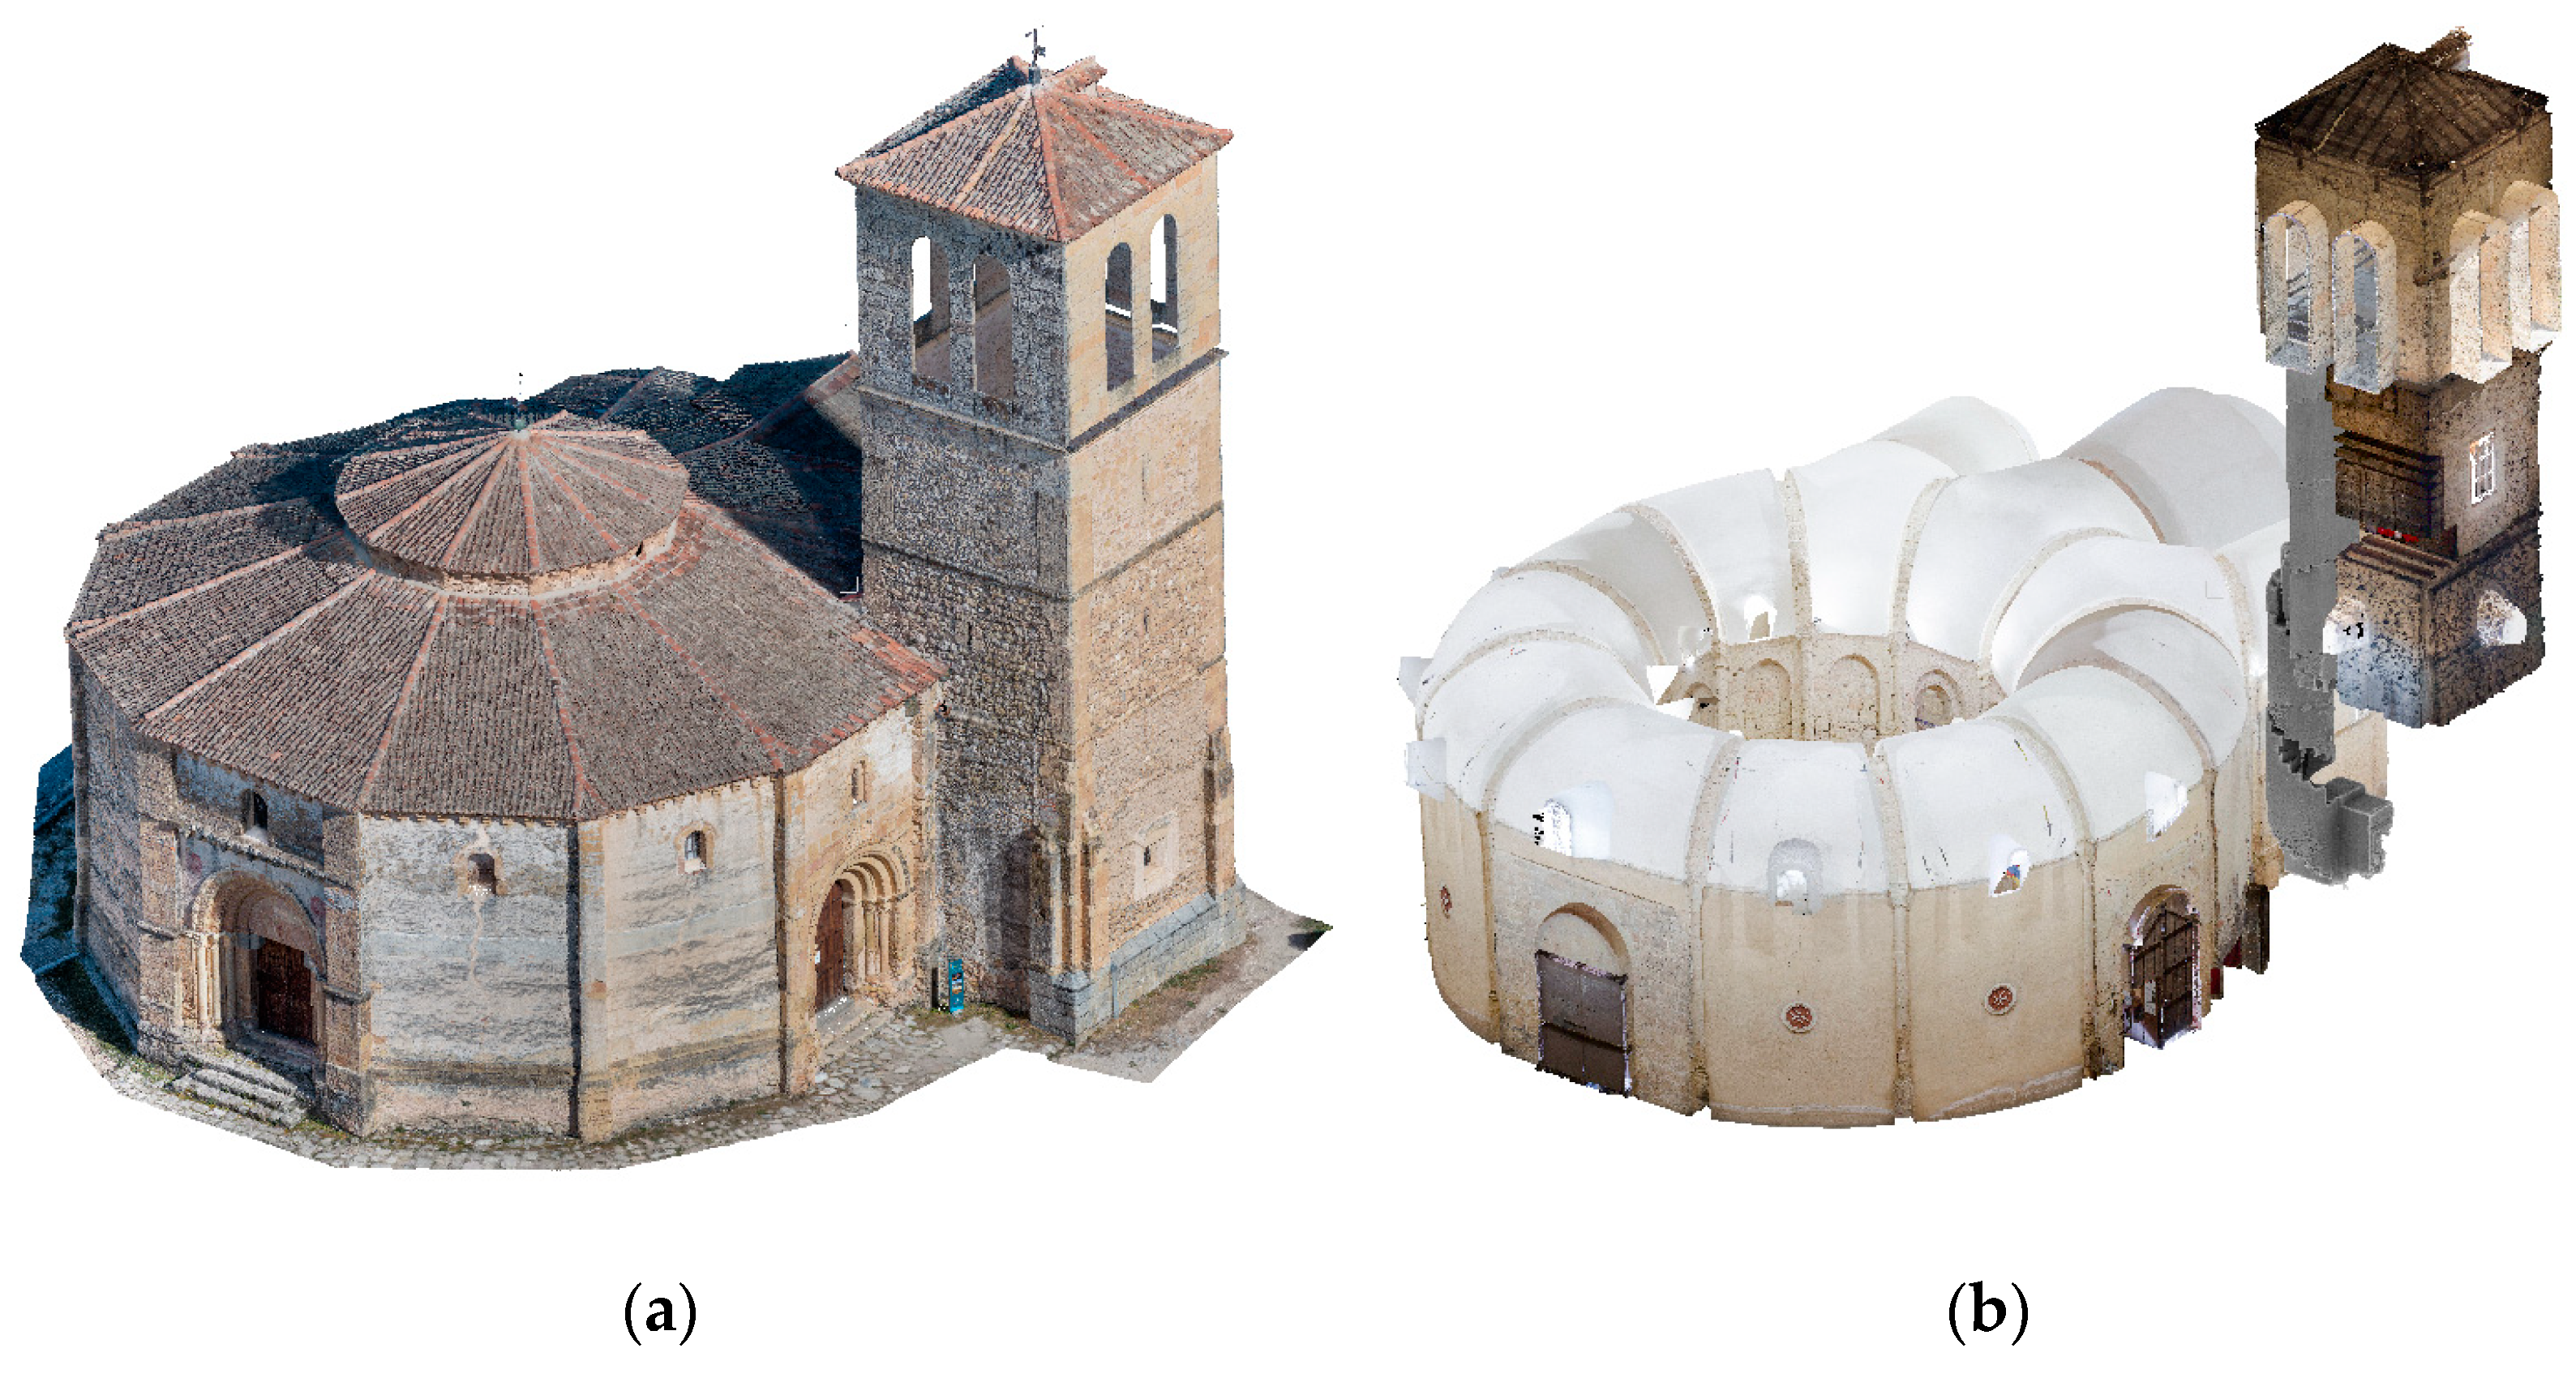
The 3D digitization of the Church was carried out in previous studies by combining laser scanning with a photogrammetric approach. Specifically, a Faro Focus 150 Plus scanner (Faro, Germany) was used to capture both the interior and exterior walls, while a UAV equipped with an RGB camera (DJI Mavic 2, DJI, Shenzhen, China) was employed to capture aerial photographs. The images were then processed using a standard Structure from Motion (SfM) method. To ensure both the laser and photogrammetric models were aligned within the same coordinate system, several control points extracted from the laser scans were applied to the photogrammetric model. A total of 43 scan stations and approximately 600 drone-captured photographs were required to document the entire structure. This process resulted in a 3D point cloud with an average resolution of 2 mm, allowing for a detailed digital representation of the Church (Figure 5).
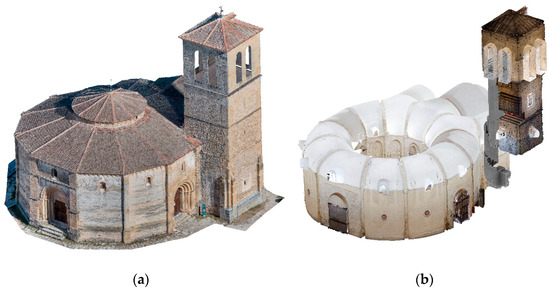
Figure 5.
A 3D point cloud of the Church: (a) outdoors; (b) indoors.
As observed, the hybrid sensor approach enabled the creation of a comprehensive model of the Church. However, some elements, such as the glass windows and certain intricate sections, were not fully captured, necessitating post-processing before rendering the building in a virtual environment. This process is discussed in the following section.
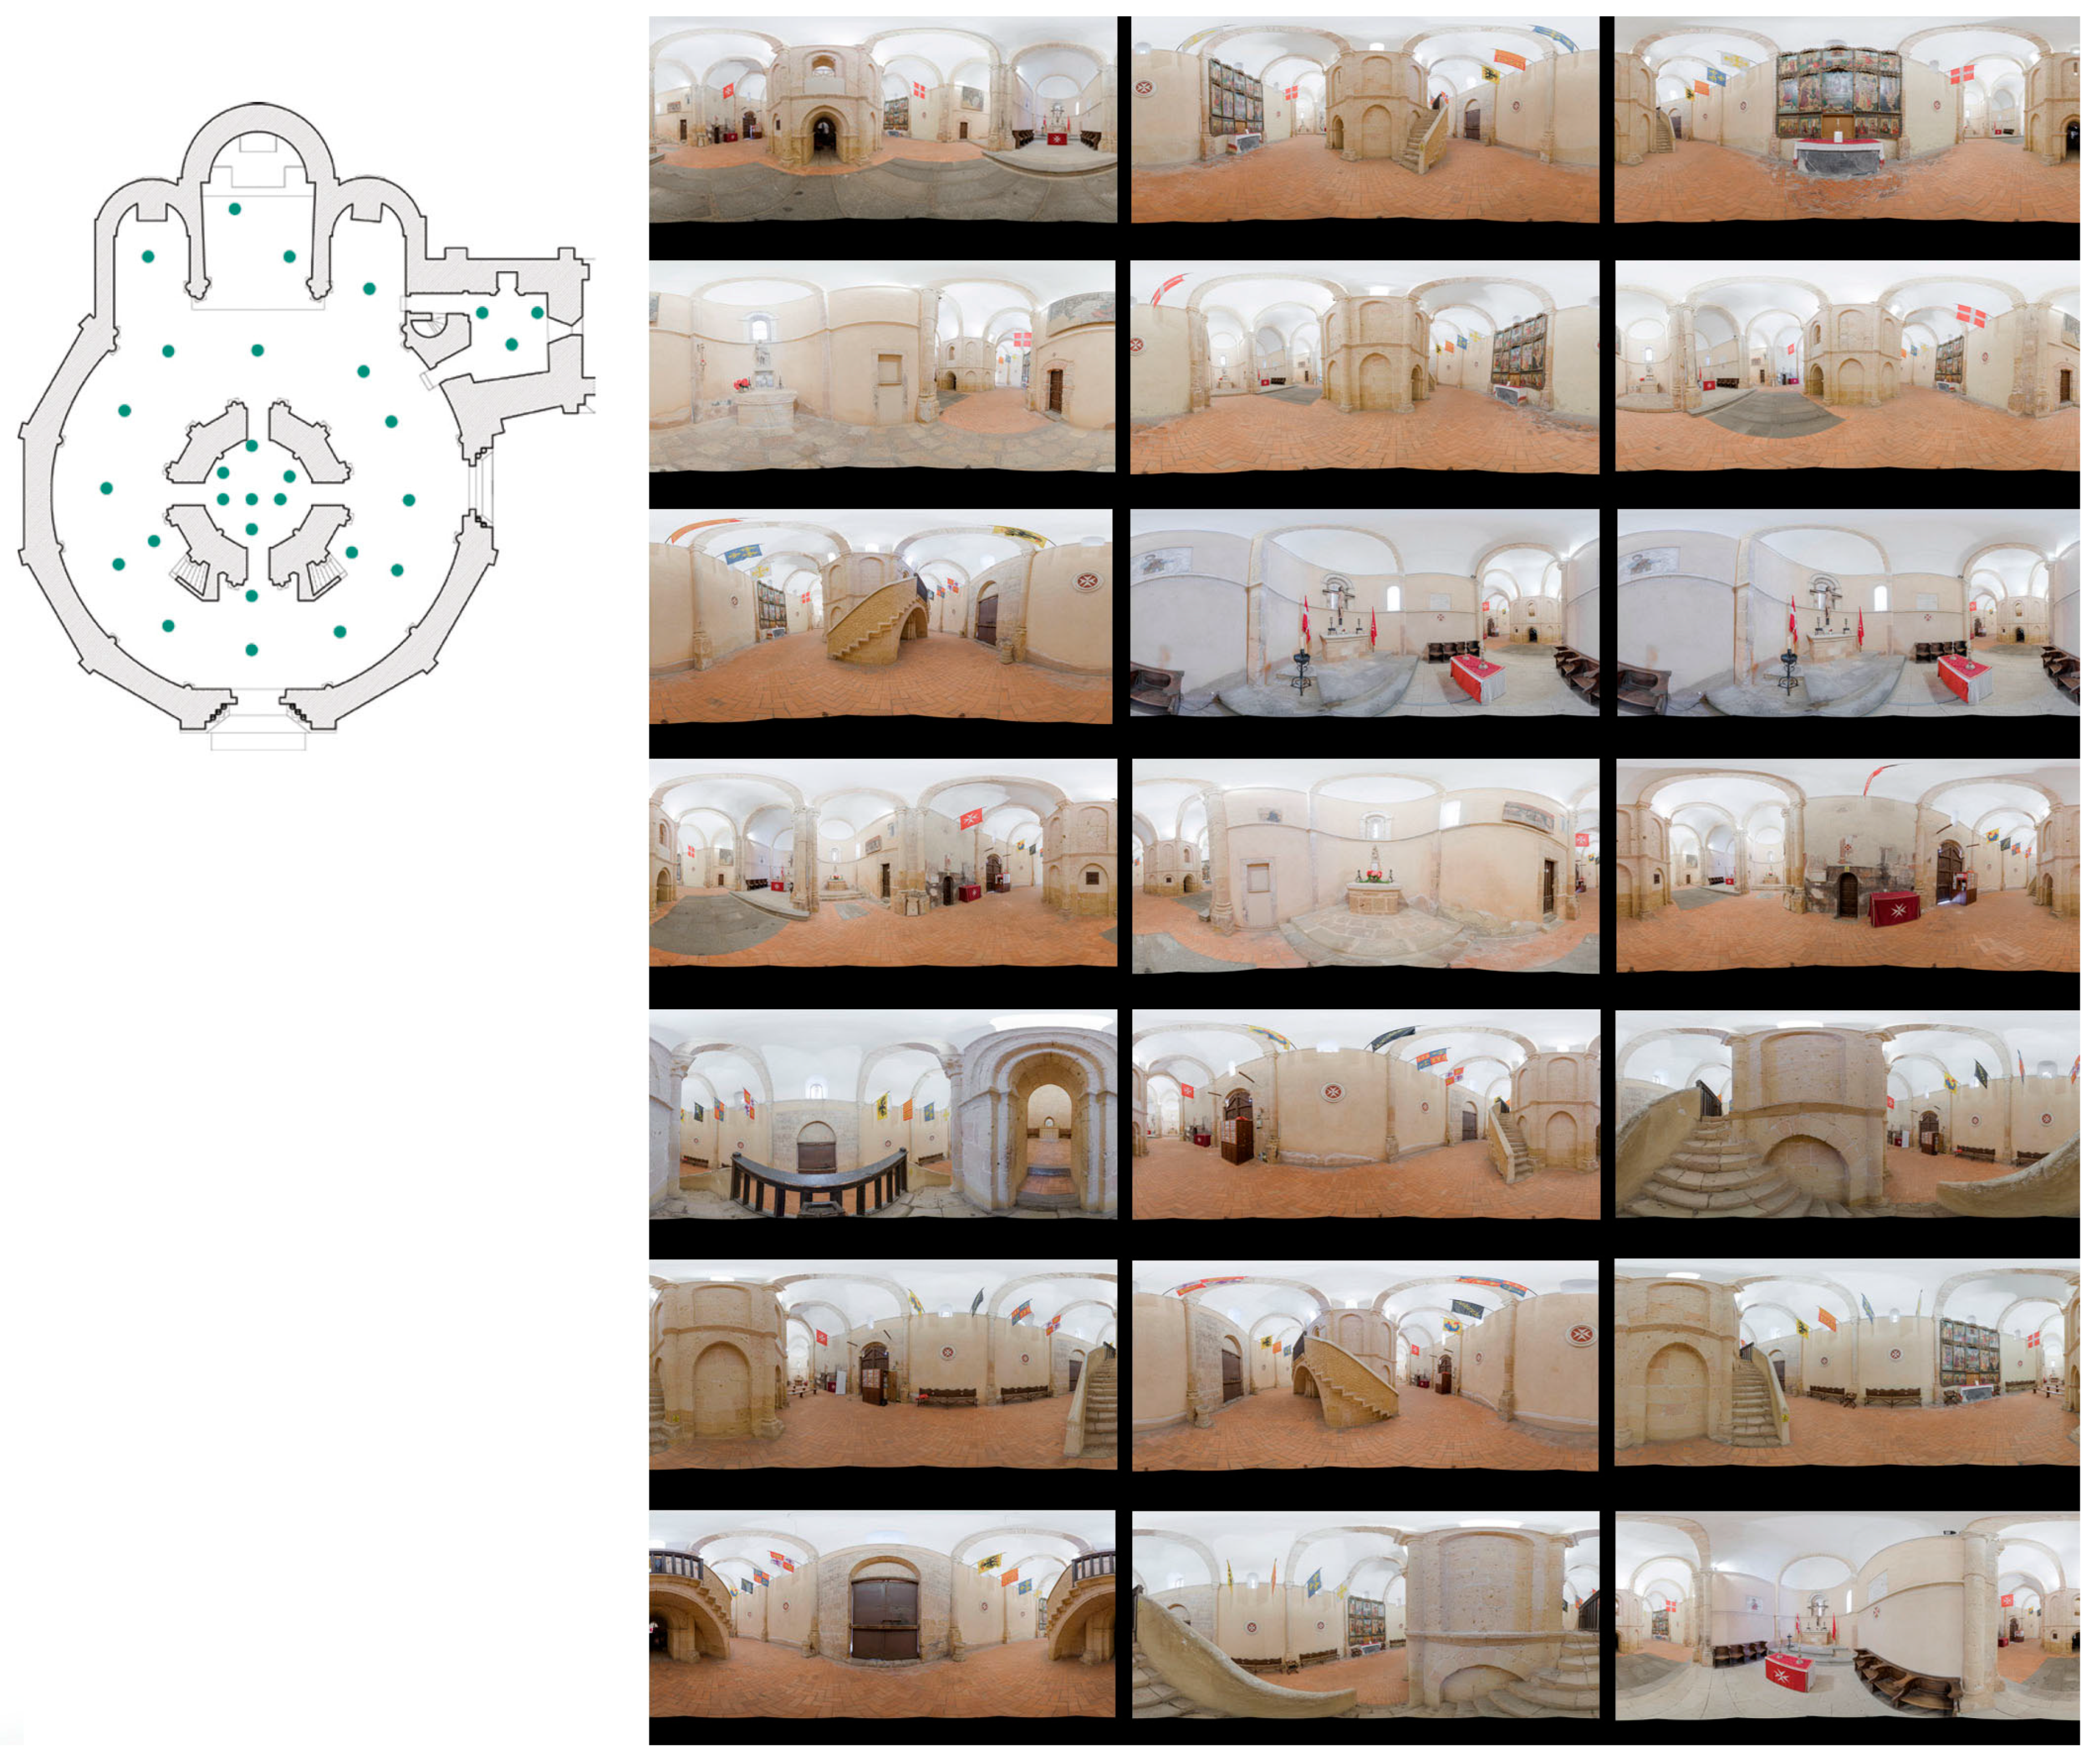
Each scan station is associated with a RGB and an infrared 360° image. The RGB panoramas were captured in high resolution, producing images of 16,952 × 8476 pixels with 300 pixels per inch (ppi) (Figure 6). A total of 43 photographs are taken: 21 of the central nave, 6 of the upper edicule vault, 4 of the Lignum Crucis chapel, 2 of the sacristy, 6 of the tower, and 4 of the lower Edicule vault.
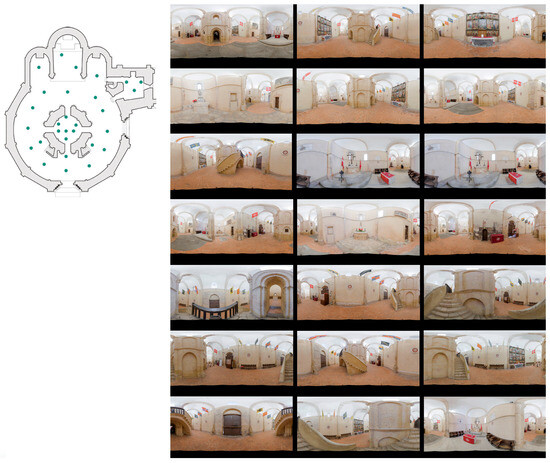
Figure 6.
Floor plan of the church with the locations of the 360-degree images.
Additionally, 360 infrared images were generated from the same position, which are then post-processed to create 360° environments. Each of the infrared images has a resolution of 20,651 × 8605 pixels with a resolution of 72 pixels per inch (Figure 7).
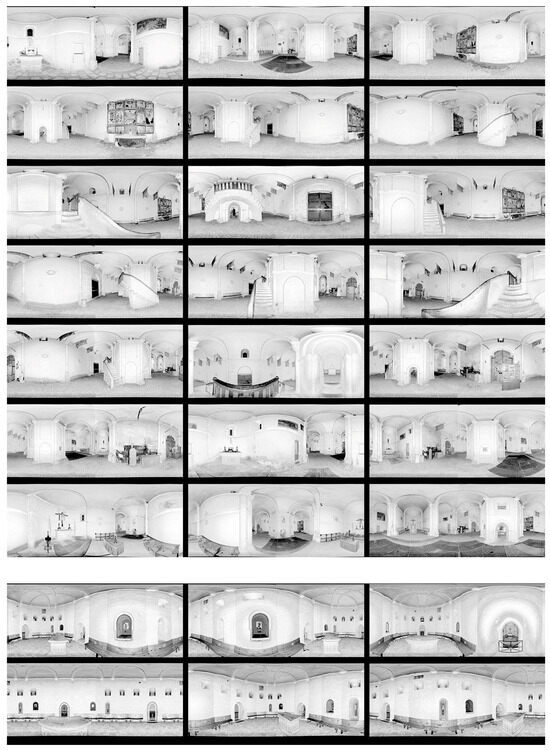
Figure 7.
The 360 infrared images used to map the virtual models.
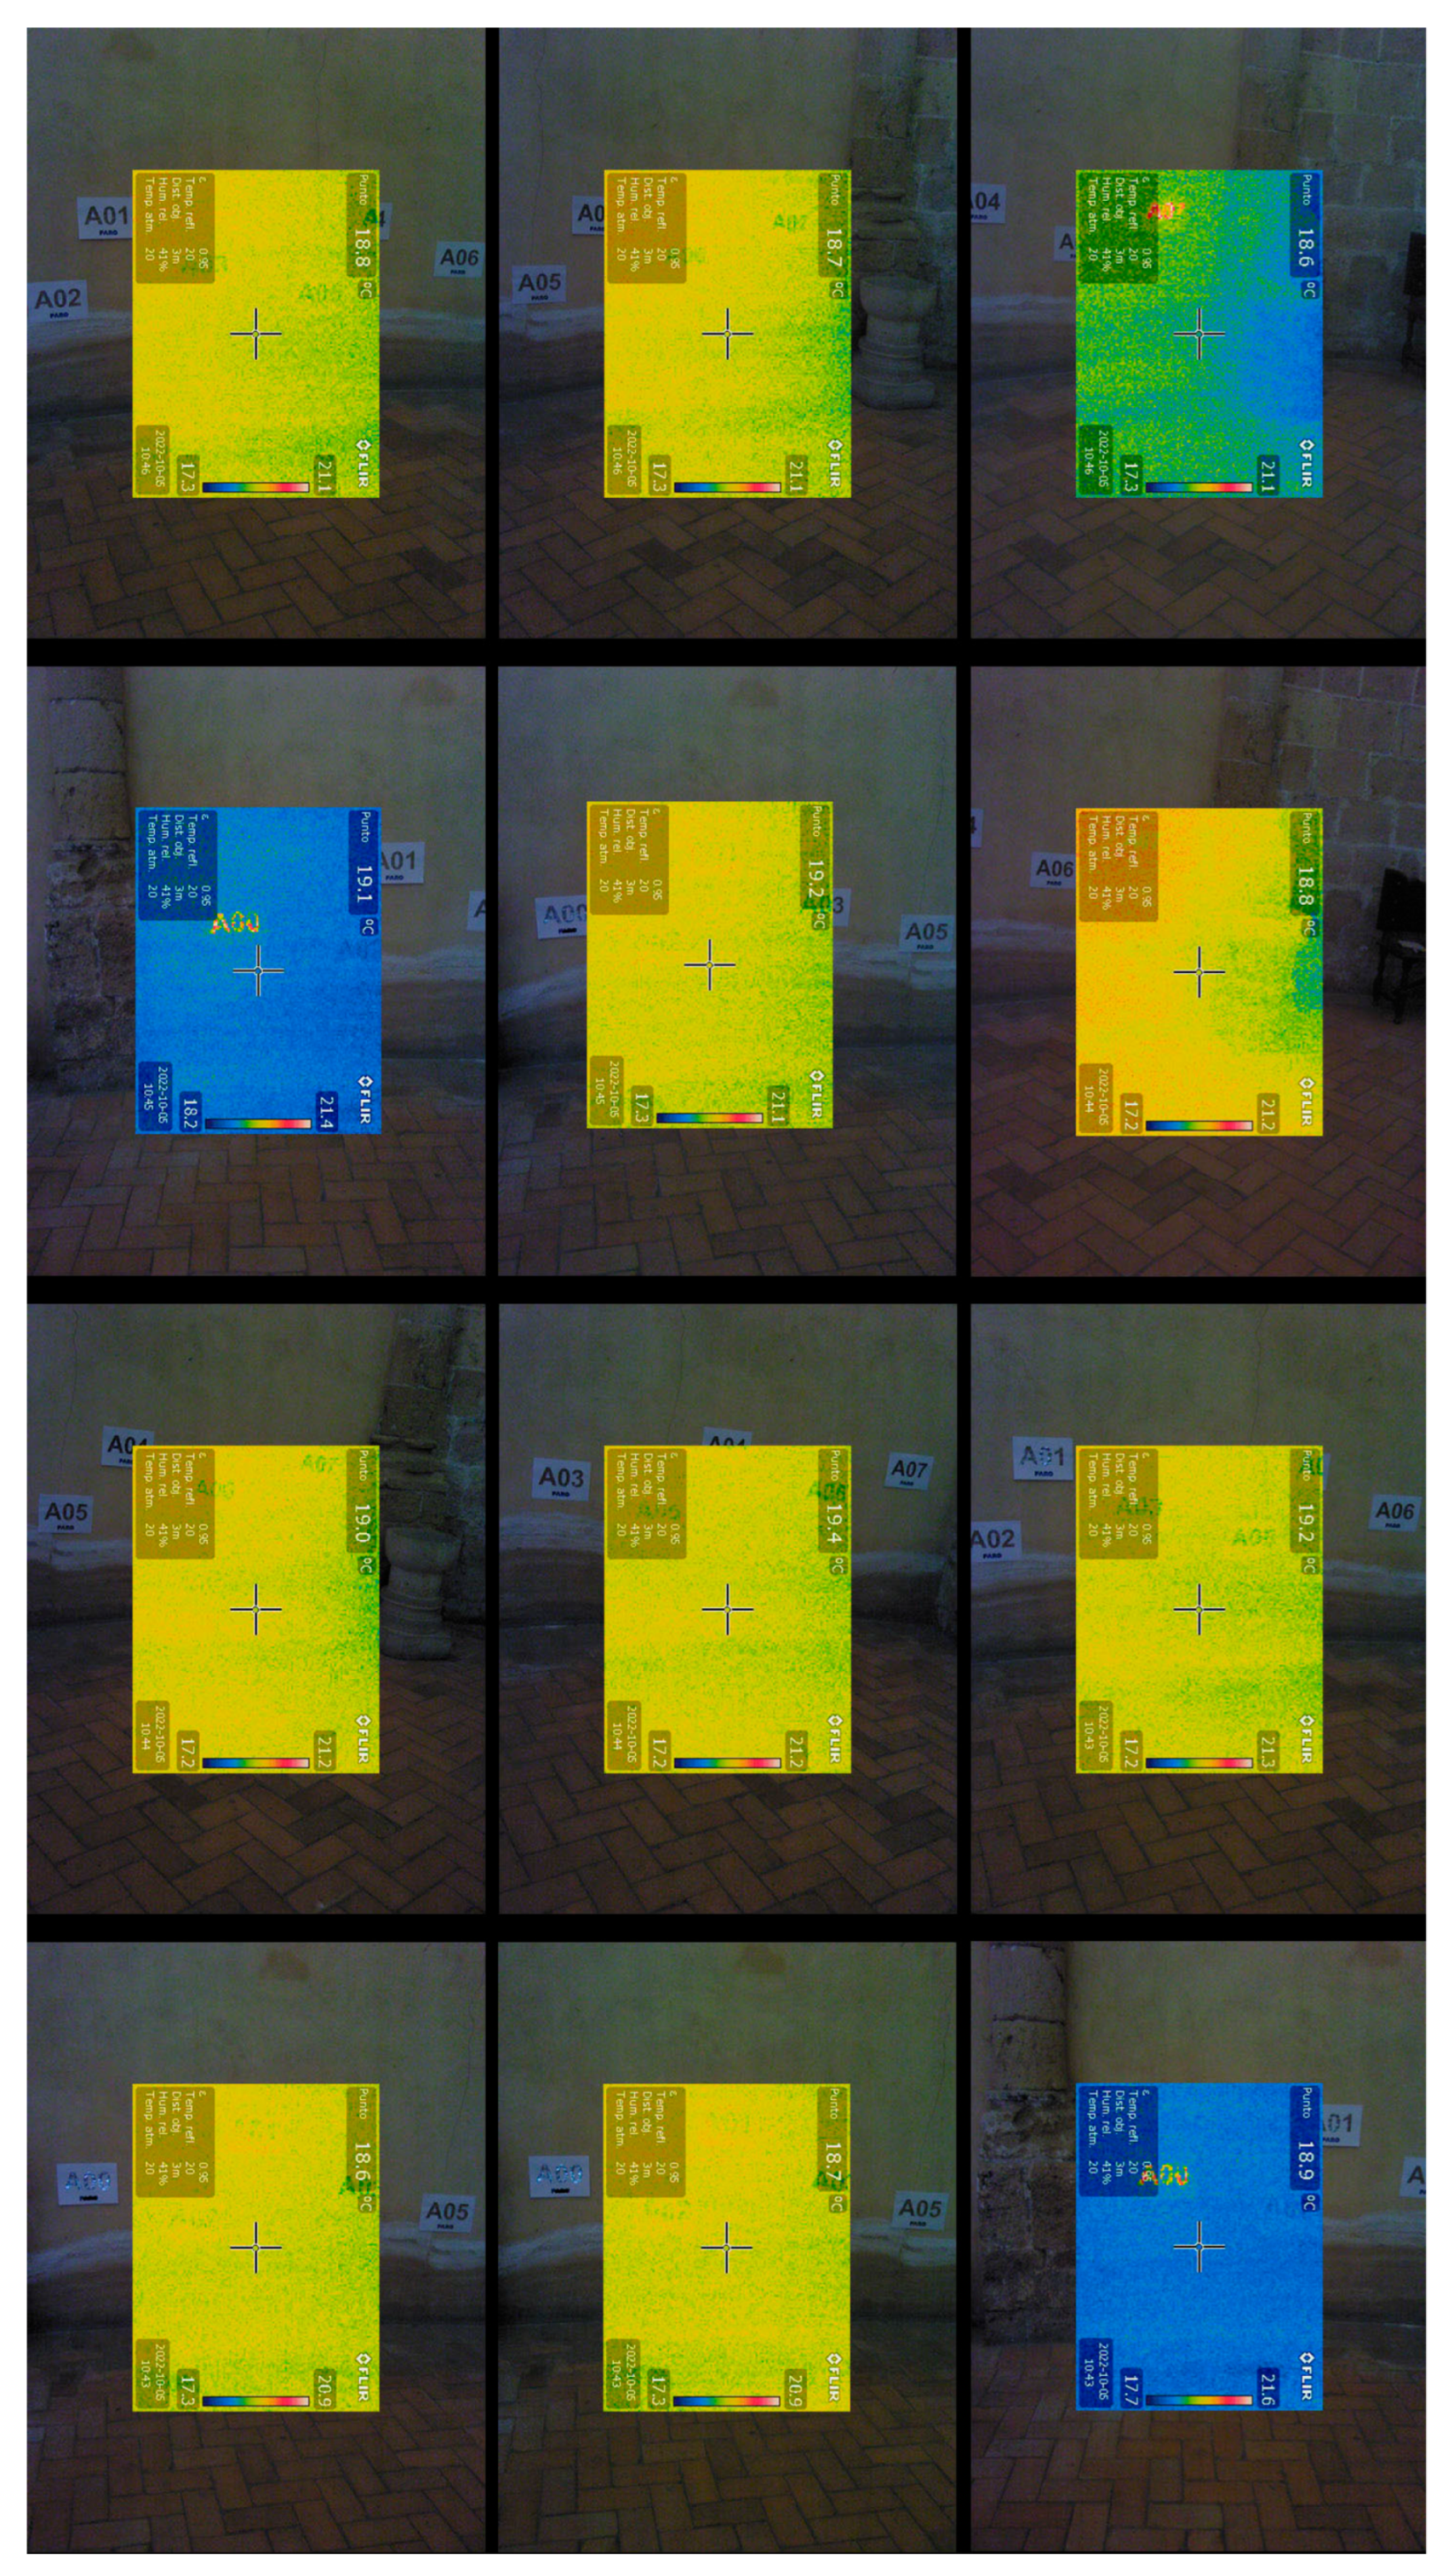
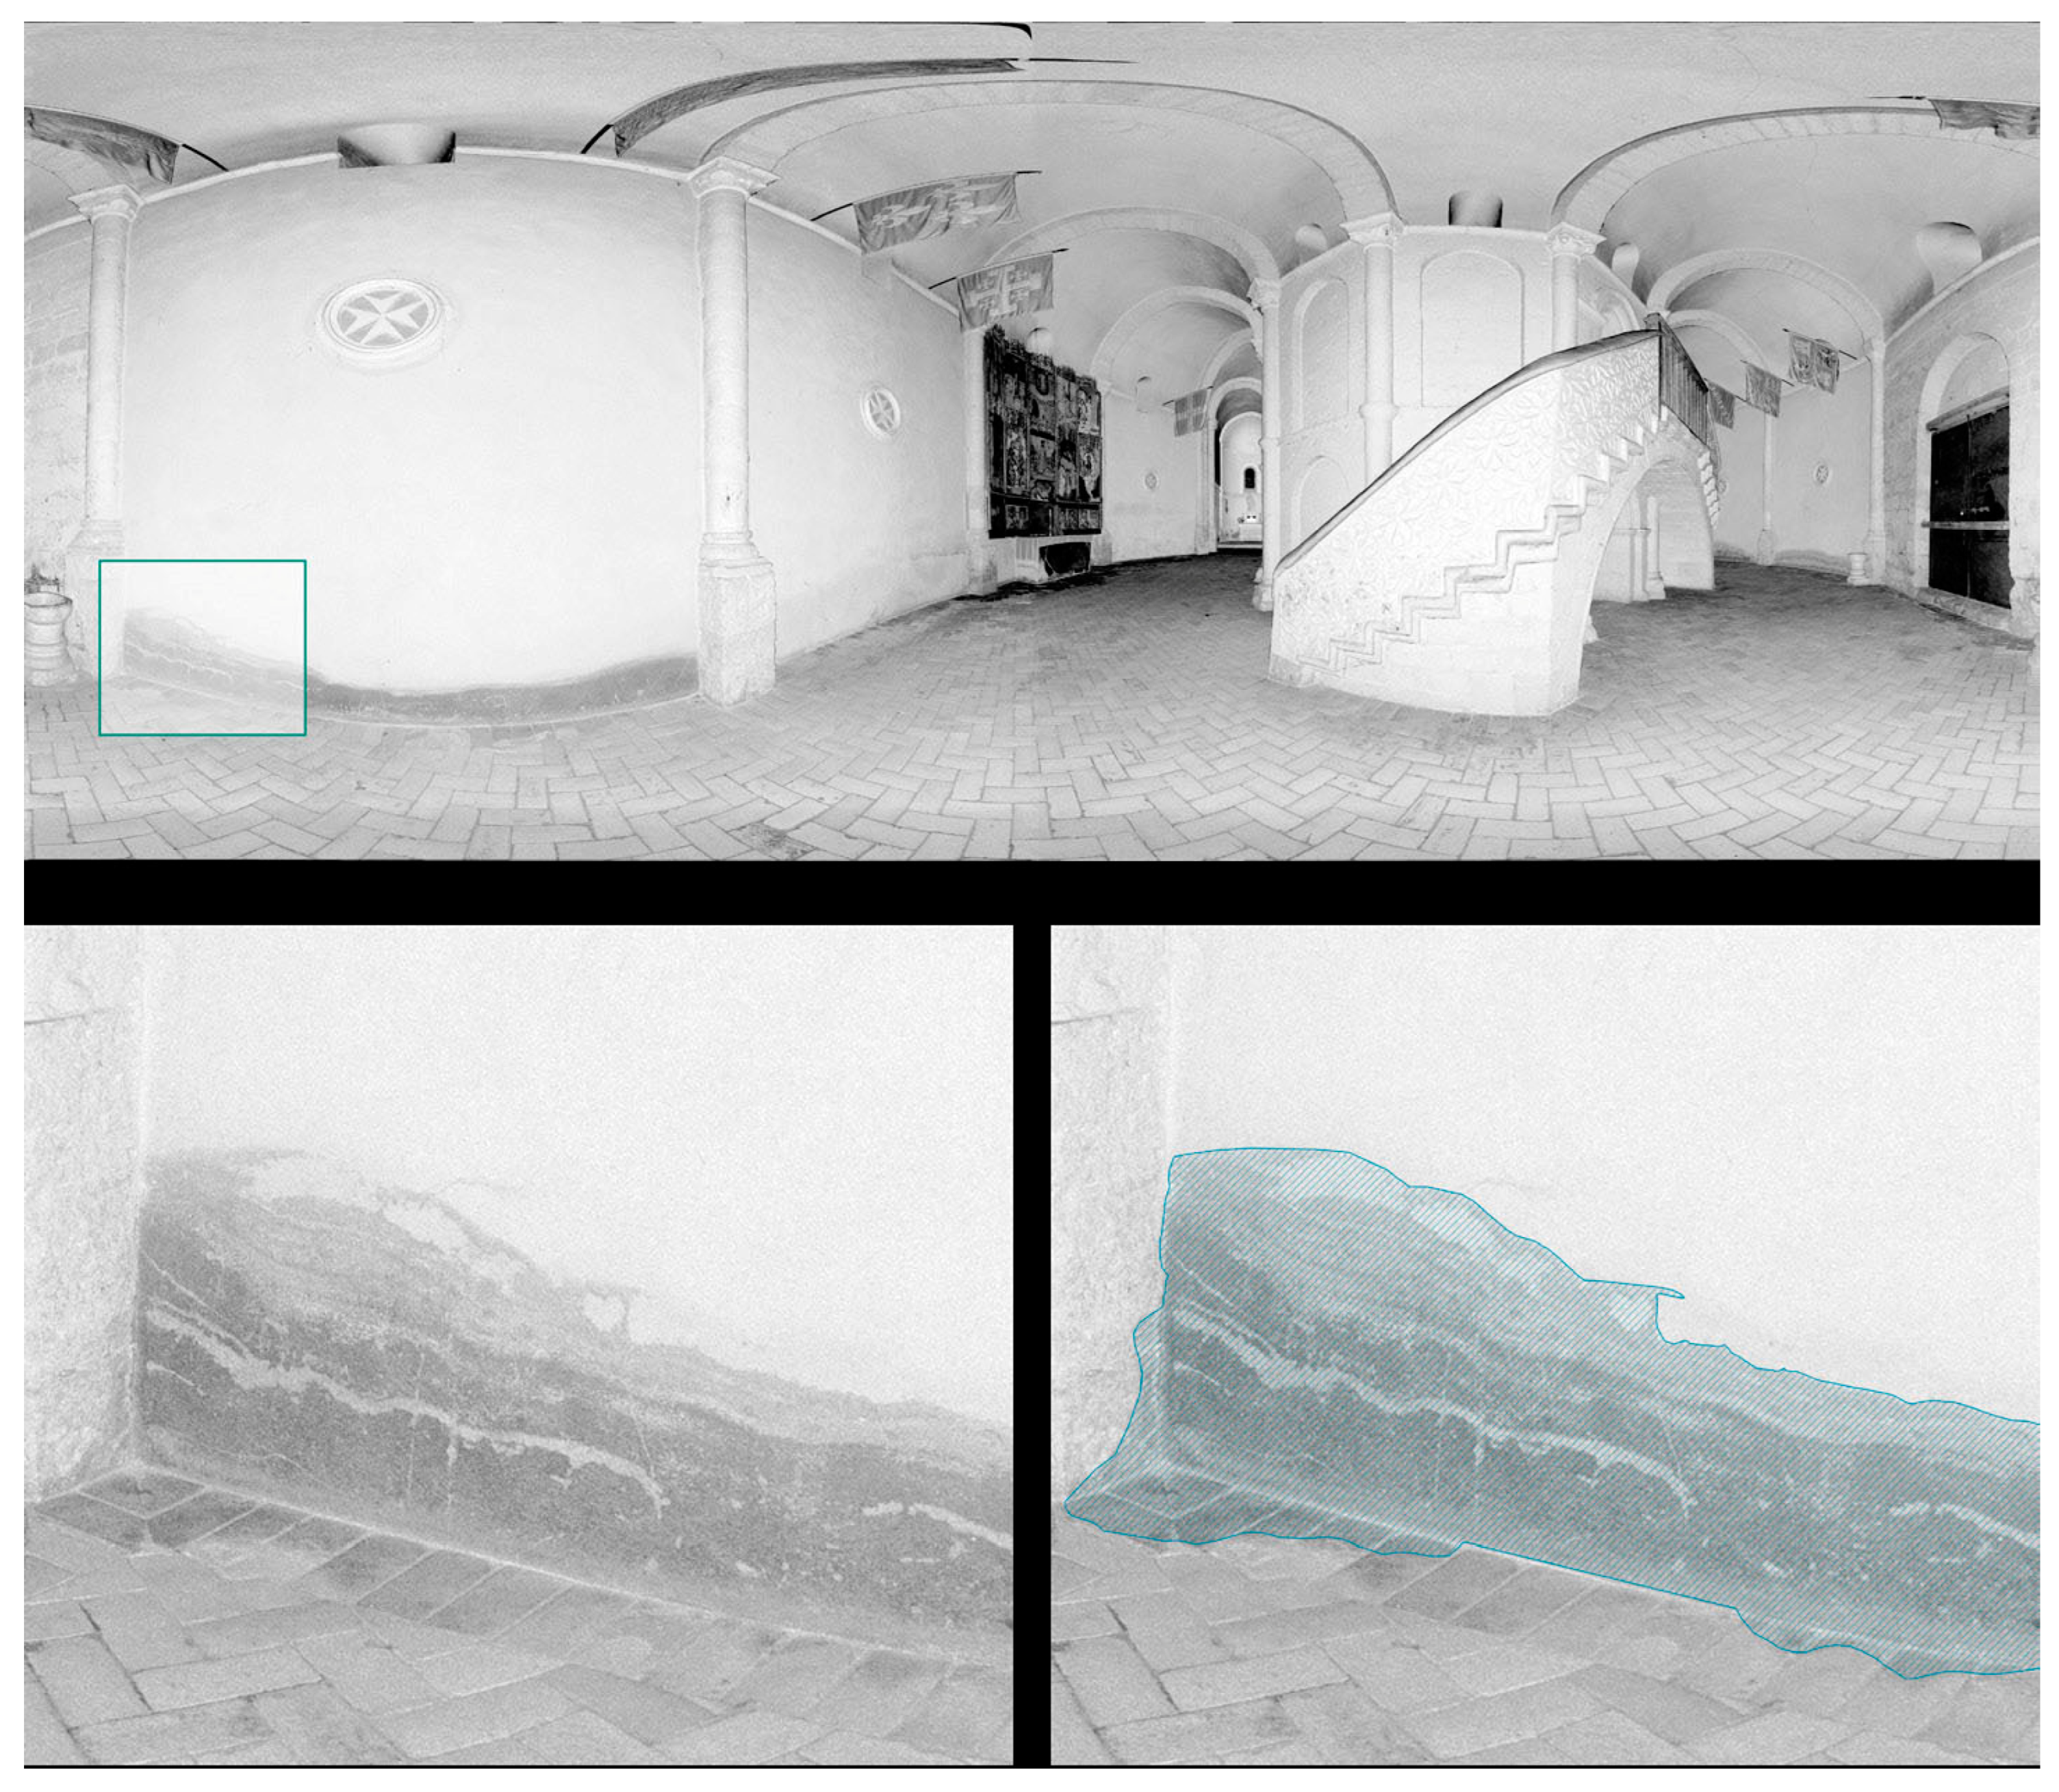
Furthermore, thermographic images were taken of areas showing moisture damage. These images were captured using a LaserLine Highsense Pro device (LaserLine, Shanghai, China). Calibration was performed using an aluminum plate to capture reflected emission and black tape to adjust for material emissivity. A total of 12 thermographic images were collected (Figure 8). This information is mapped onto the 360° images of the Church in an analogous manner, allowing different visualizations to be interactively toggled in Virtual Reality, making it easier for professionals to evaluate without the need to visit the site in person.

Figure 8.
Overlaid thermographic images of one of the walls of the central nave of the Church.
This case study provides an ideal testing ground for the proposed methodology, featuring complex geometry, moderate size, and various types of damage, including moisture-related deterioration in the lower wall sections and cracks due to structural movement. These conditions require precise digitization using both 3D point clouds and images, ensuring accurate visualization.
4. Results and Discussion
After generating the virtual models, a comprehensive comparison between them is performed. Both the polygonal mesh and the 3D point cloud are carefully exported into a sophisticated virtual reality system (Unreal Engine 5), which allows for a meticulous analysis of the workflows involved, as well as a detailed examination of the specific advantages and disadvantages that each model provides in the context of digital heritage preservation.
4.1. Creation of a Detailed Digital Model for Virtual Reality
The process of creating the digital models is divided into two distinct parts: one that encompasses the entire structure of the Church, and another that focuses specifically on an isolated wall. This division permits the generation of results that are not only faster but also smoother in terms of rendering, thus facilitating a more streamlined and efficient workflow. This approach ensures that both large-scale and detailed elements are accurately captured and represented within the virtual environment.
The initial phase of the process begins with the processing of the 3D point cloud data, utilizing the CloudCompare v.2.14 software, as well as the damage mapping onto the 360-degree images. The initial 3D point cloud is subsampled and clipped to focus on specific areas of interest, which are then exported for further processing.
The 3D point cloud is exported into the virtual reality system, where additional configurations are made. Specifically, the size and shape of the points can be adjusted, which has a significant impact on rendering speed and overall performance. This aspect of the process has been thoroughly examined to optimize the balance between visual quality and computational efficiency throughout the project (Figure 9). This product is used for a large-scale visualization of the project.
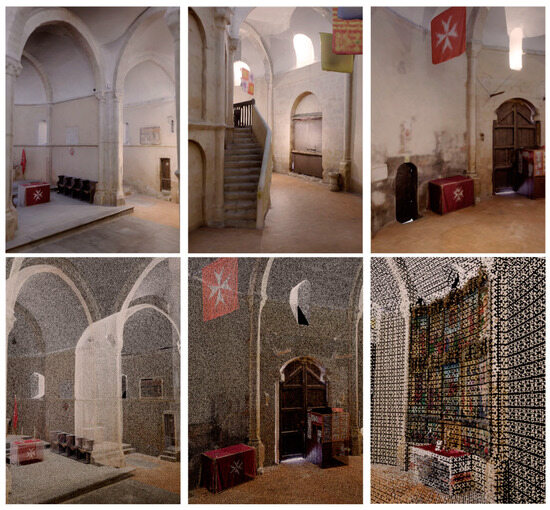
Figure 9.
Top: real-time visualization of the three-dimensional mesh. Bottom: real-time visualization of the low-resolution point cloud (1 cm), adjusting the size of each point.
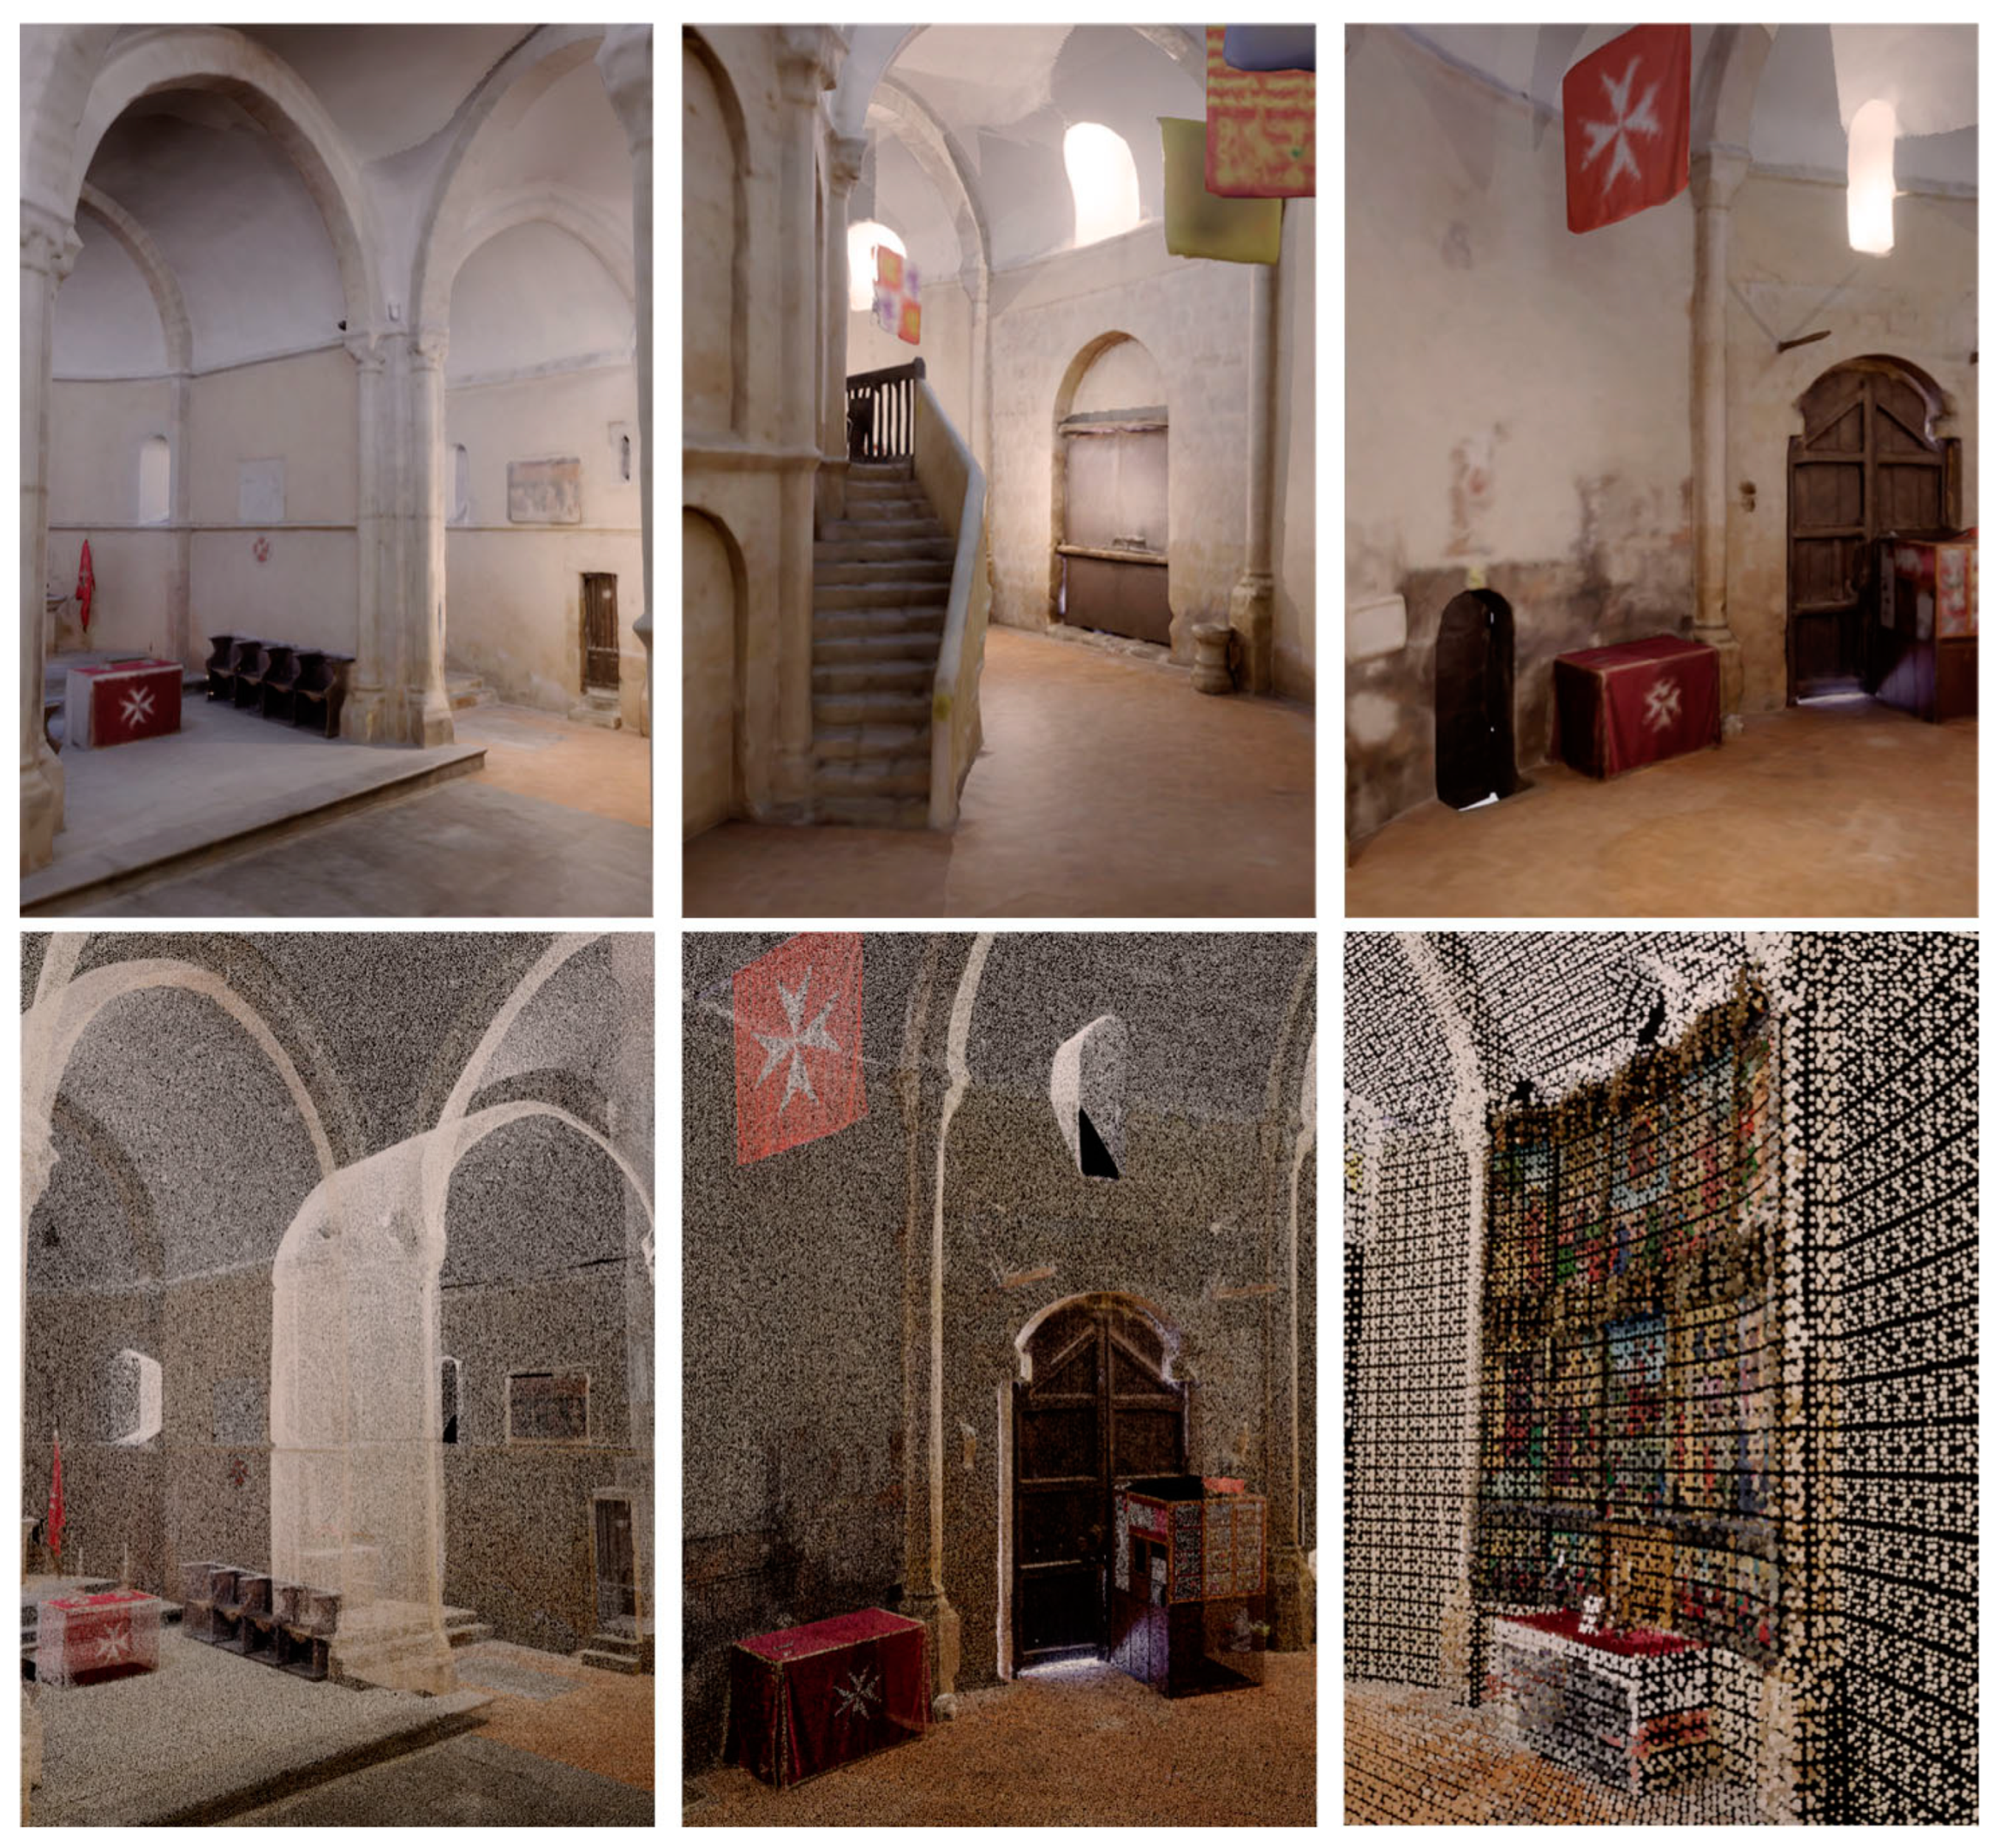
However, one of the main limitations encountered when working directly with the point cloud is the inability to modify or change materials as flexibly as with the mesh model. In the point cloud, each individual point is assigned a specific color based on the scanned data, which can make it challenging to visualize and analyze lesions or structural damages with the same clarity and detail that the mesh model offers. In accordance with this, the next step involves importing the point cloud into Metashape v.2.0.0 software, where it is transformed into a detailed 3D mesh. This process includes the generation of accurate textures that are essential for proper visualization (diffuse and normal maps) that are projected over a simplified mesh by following the approach described in Section 2. These textures, combined with the mesh, are then exported into Unreal Engine 5, allowing to observe areas with high detail (Figure 10).
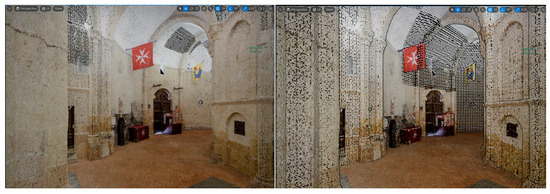
Figure 10.
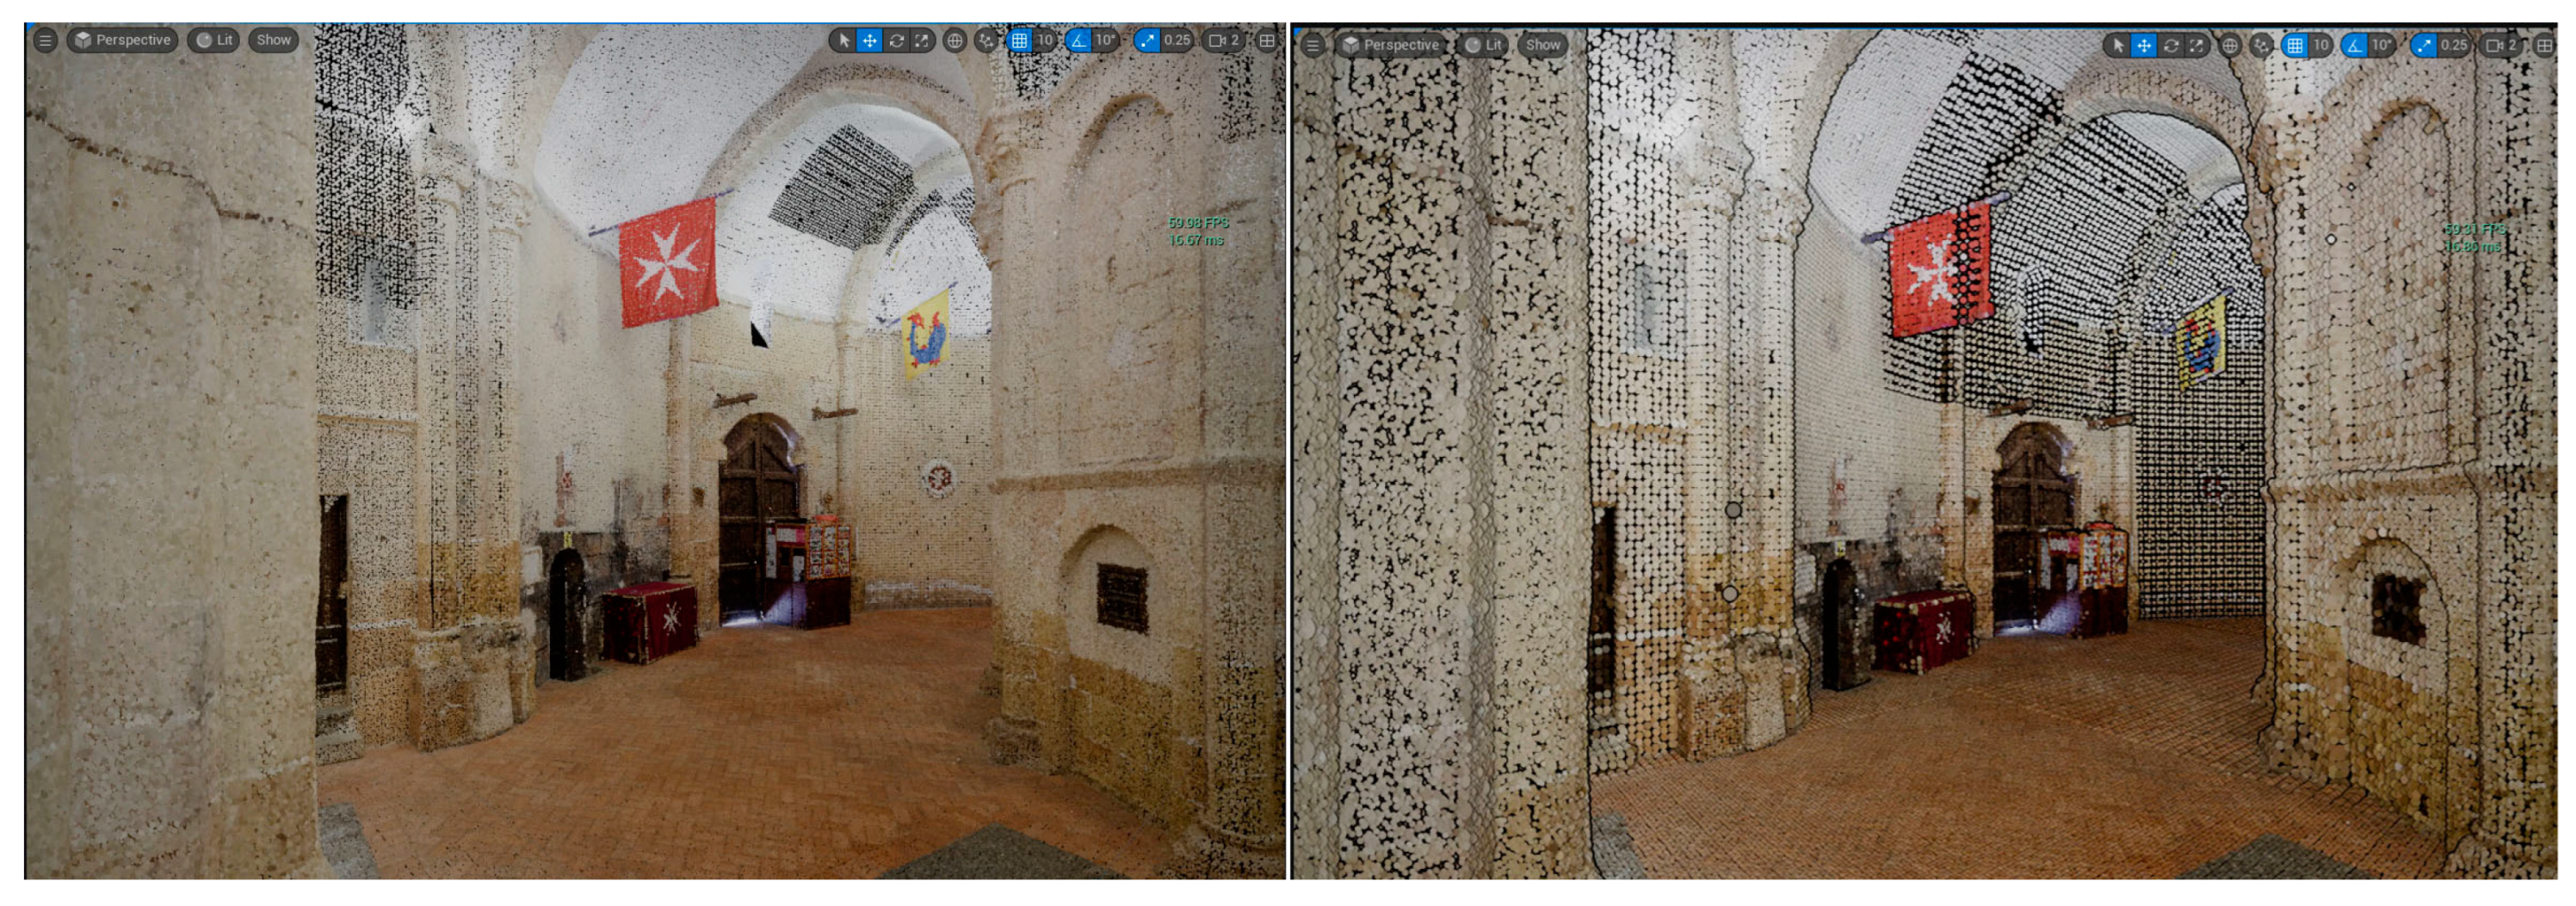
Real-time visualization of the point cloud with low resolution (1 cm) for its implementation in mobile devices. Left: using a selective Eye-Dome Lighting. Right: using the default UE5 system.
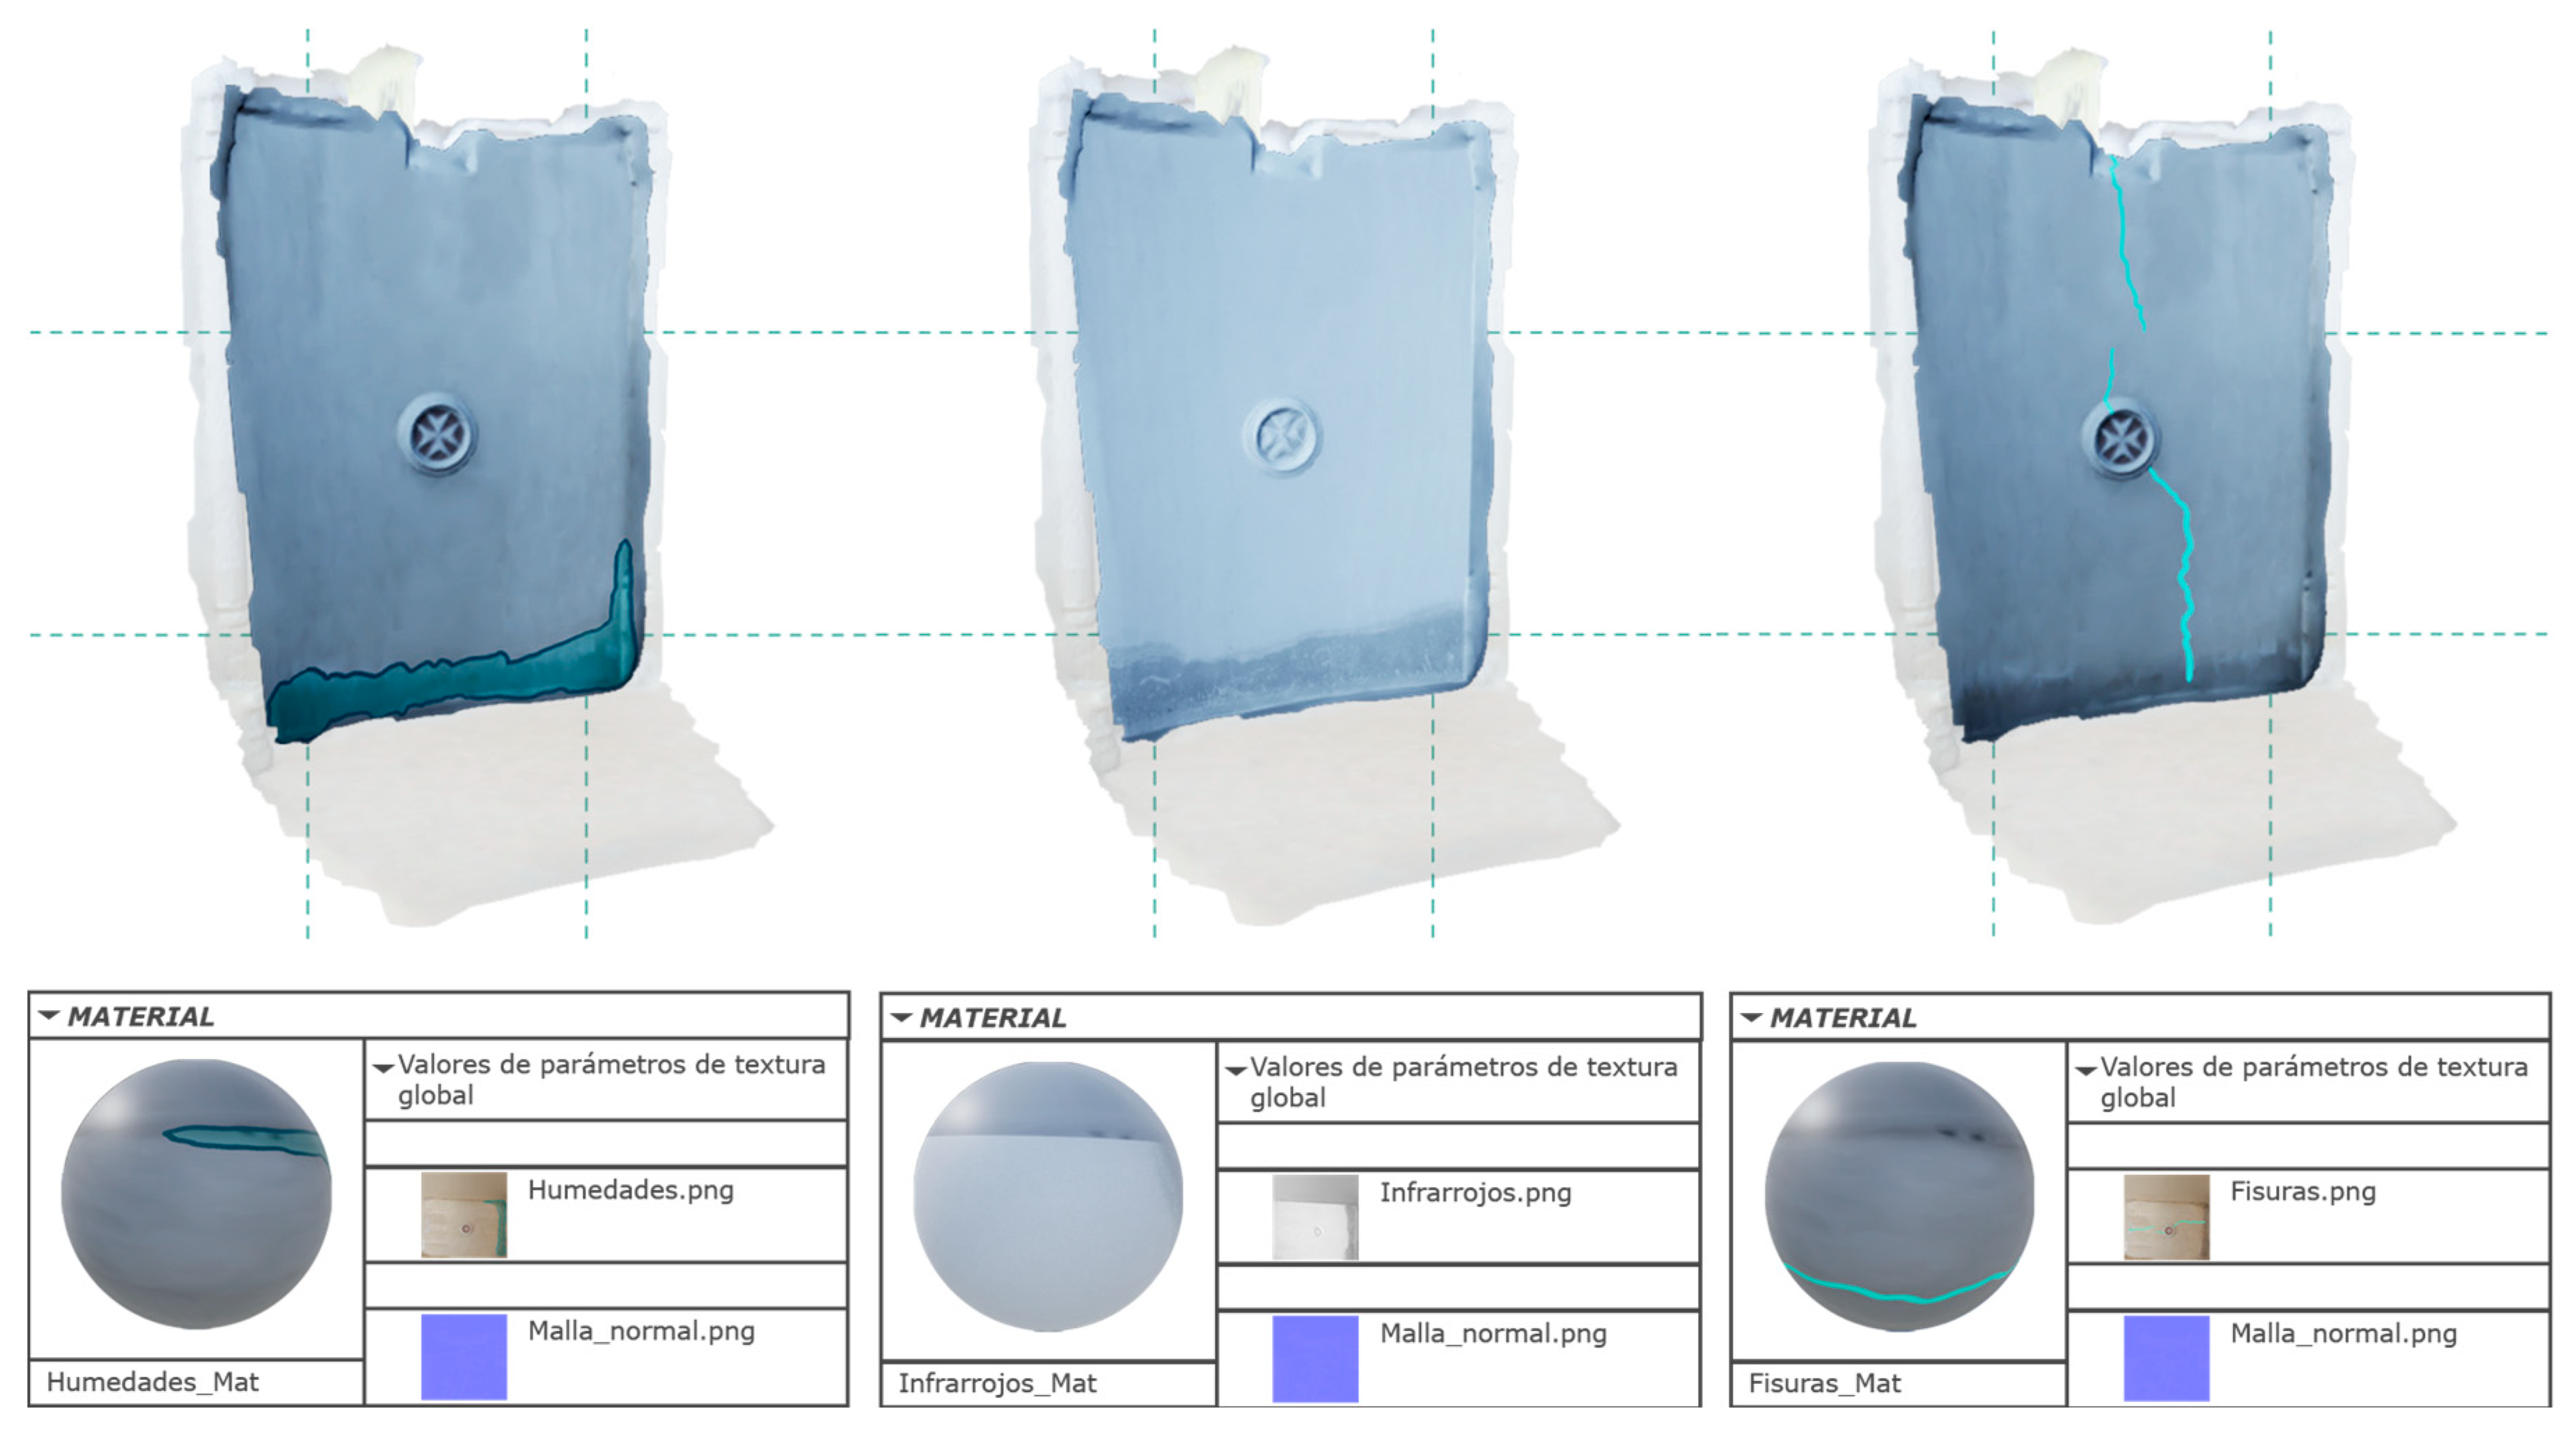
To enhance the immersive quality of the virtual reality experience (when the users chose the mesh), Unreal Engine’s visual scripting language, known as Blueprints, is employed (Figure 11). This advanced feature allows users to interact with the virtual environment in real time, offering the capability to dynamically switch between different material types. Moreover, users can preview various forms of structural damage, such as cracks, moisture-related issues, or material degradation. The integration of Blueprints results in the creation of an interactive scene where users can explore and analyze different types of damage that have been selected for study (Figure 12). The mapping of damage was manually performed in Photoshop (Figure 13). This level of interactivity is further enhanced using infrared panoramas combined with thermal imaging, which enables the precise identification and delineation of moisture-affected areas within the structure (Figure 14).
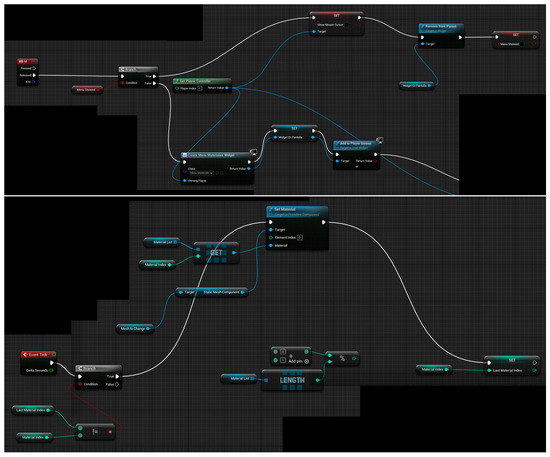
Figure 11.
Blueprints to create an interactive material selection menu in UE5.
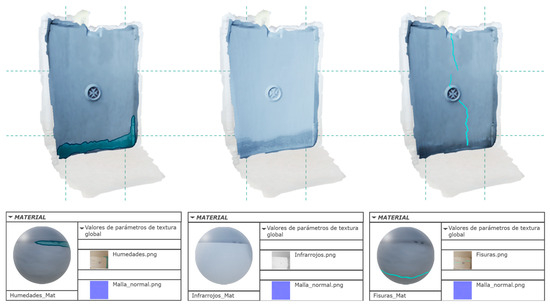
Figure 12.
Different materials applied to a wall, highlighting areas of dampness and cracks.

Figure 13.
Applying texture mapping to 360° images.

Figure 14.
Mapping of color alterations caused by moisture using 360-degree infrared images.
In addition to the creation of a virtual reality model, digital data are also utilized to generate an augmented reality (AR) scene. This is achieved by mapping one of the Church’s walls, thereby creating an interactive model that can be superimposed onto the physical structure. This feature allows for a real-time comparison between the digital model and the actual building, providing insights into the condition and preservation needs of the heritage site. In this specific application, the AR model is used to highlight chromatic alterations and the presence of efflorescence, both of which are indicative of moisture-related damage.
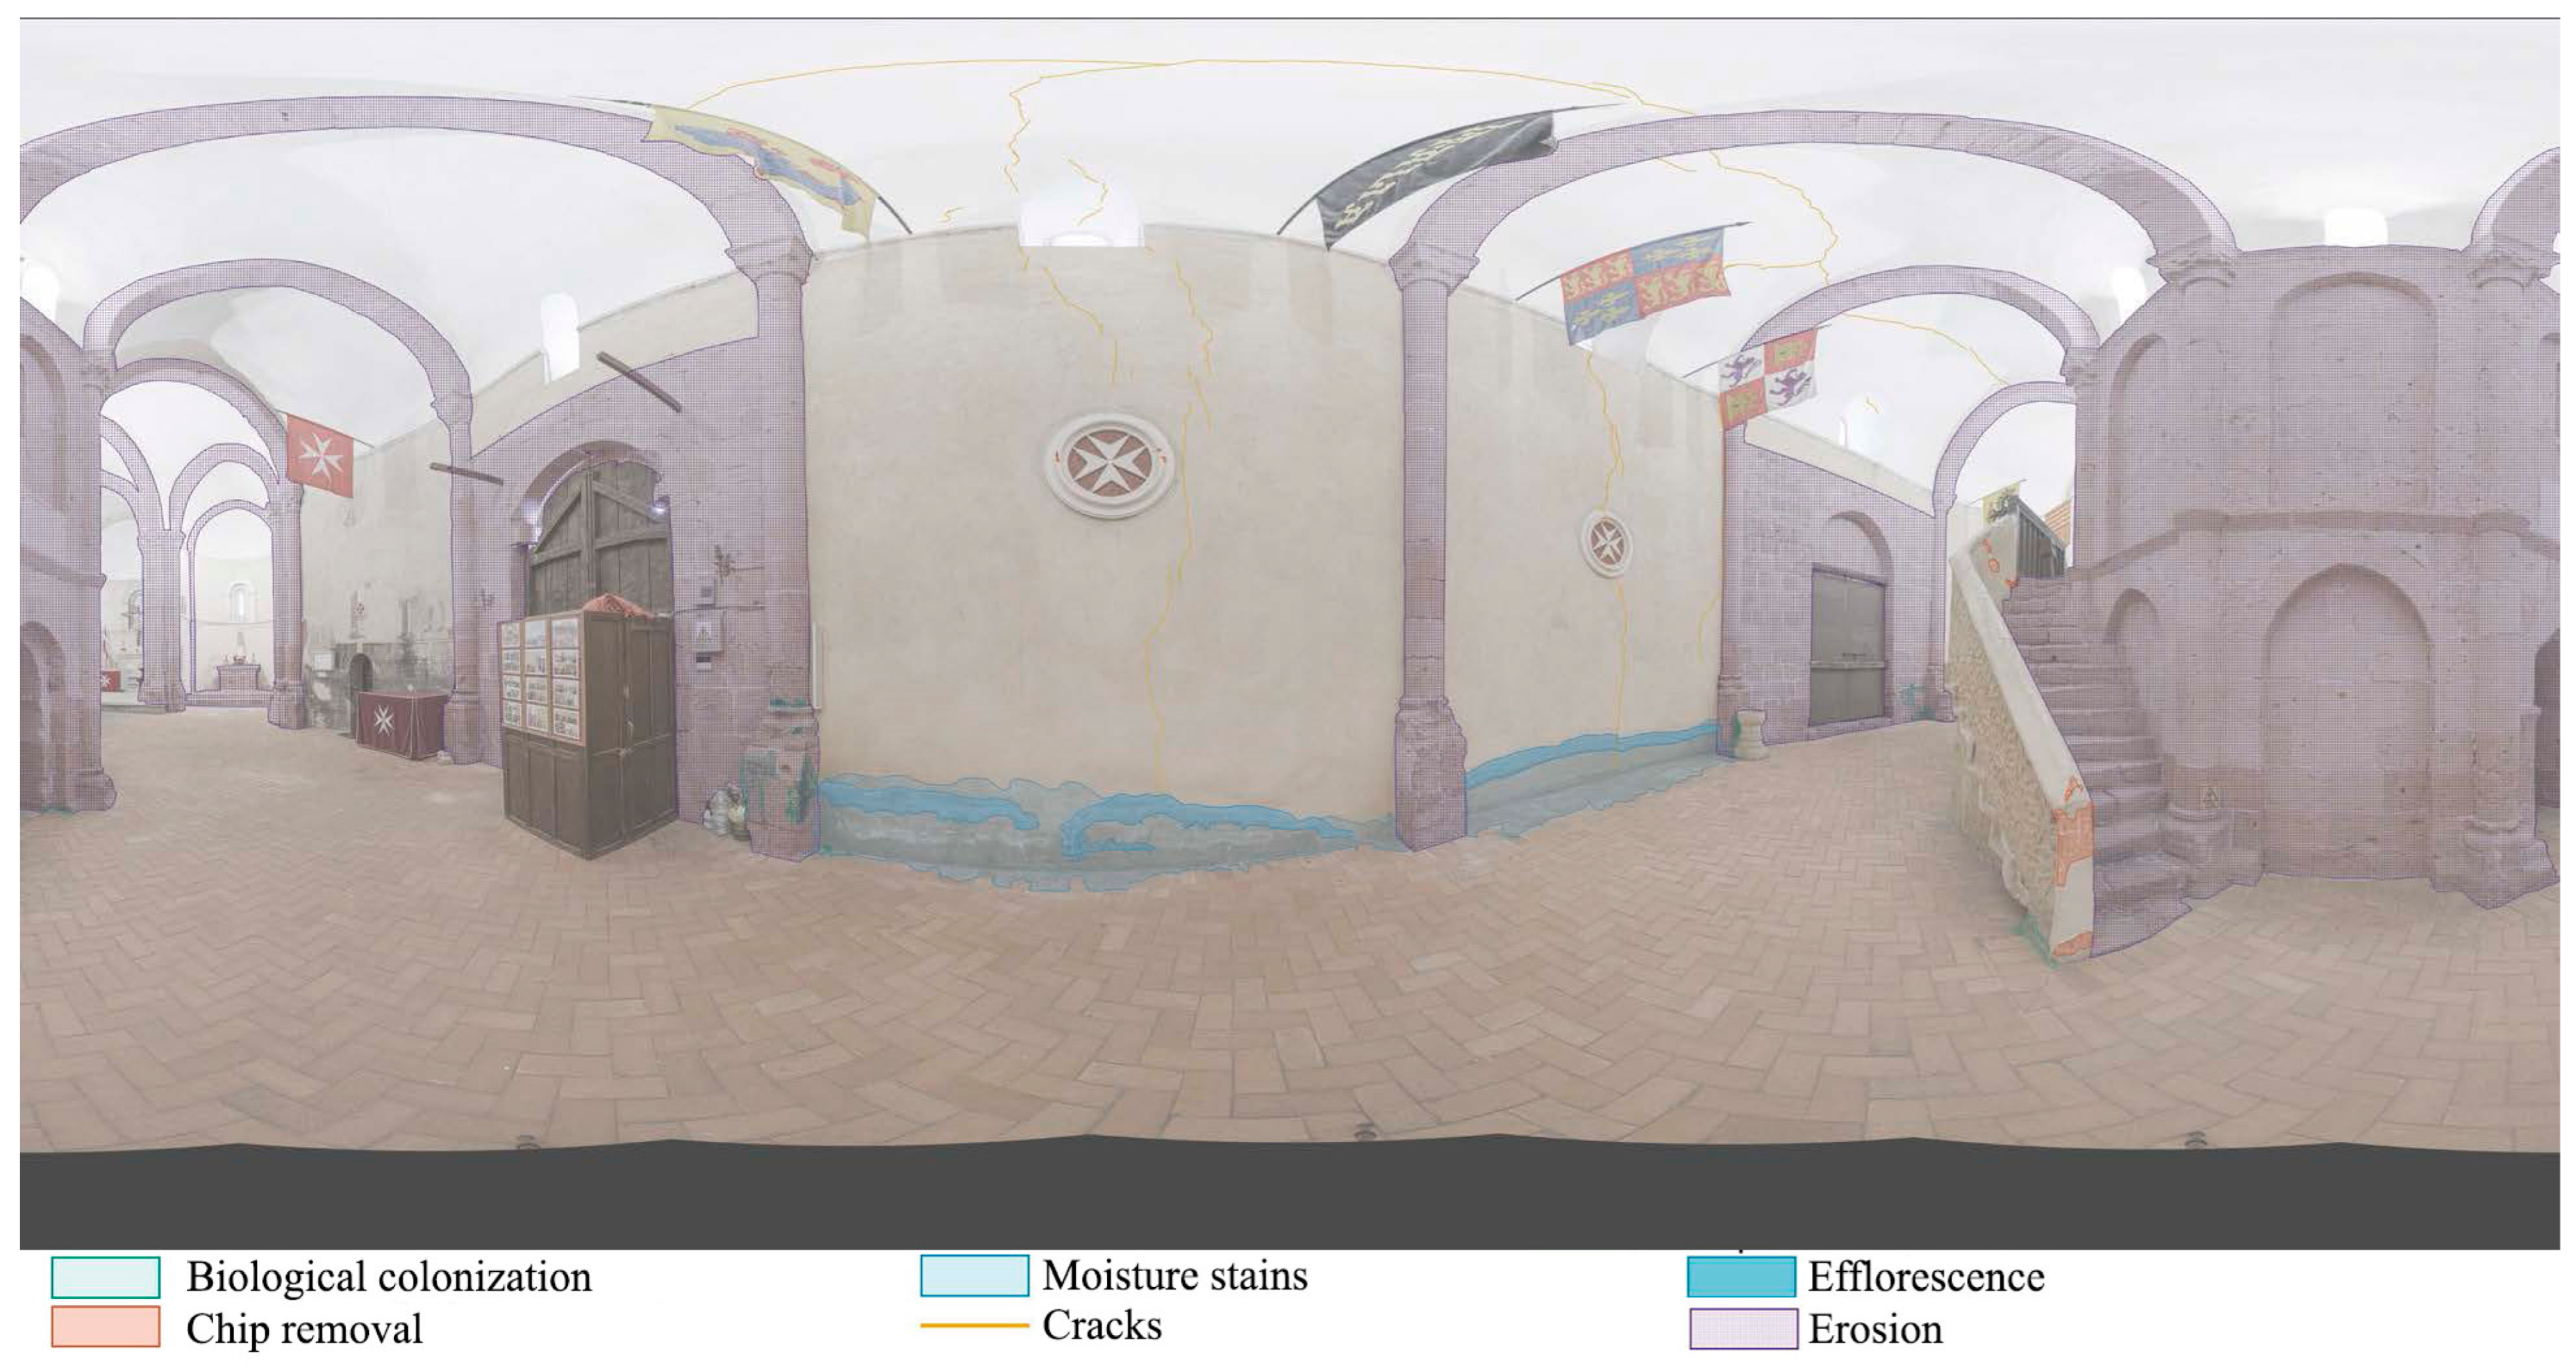
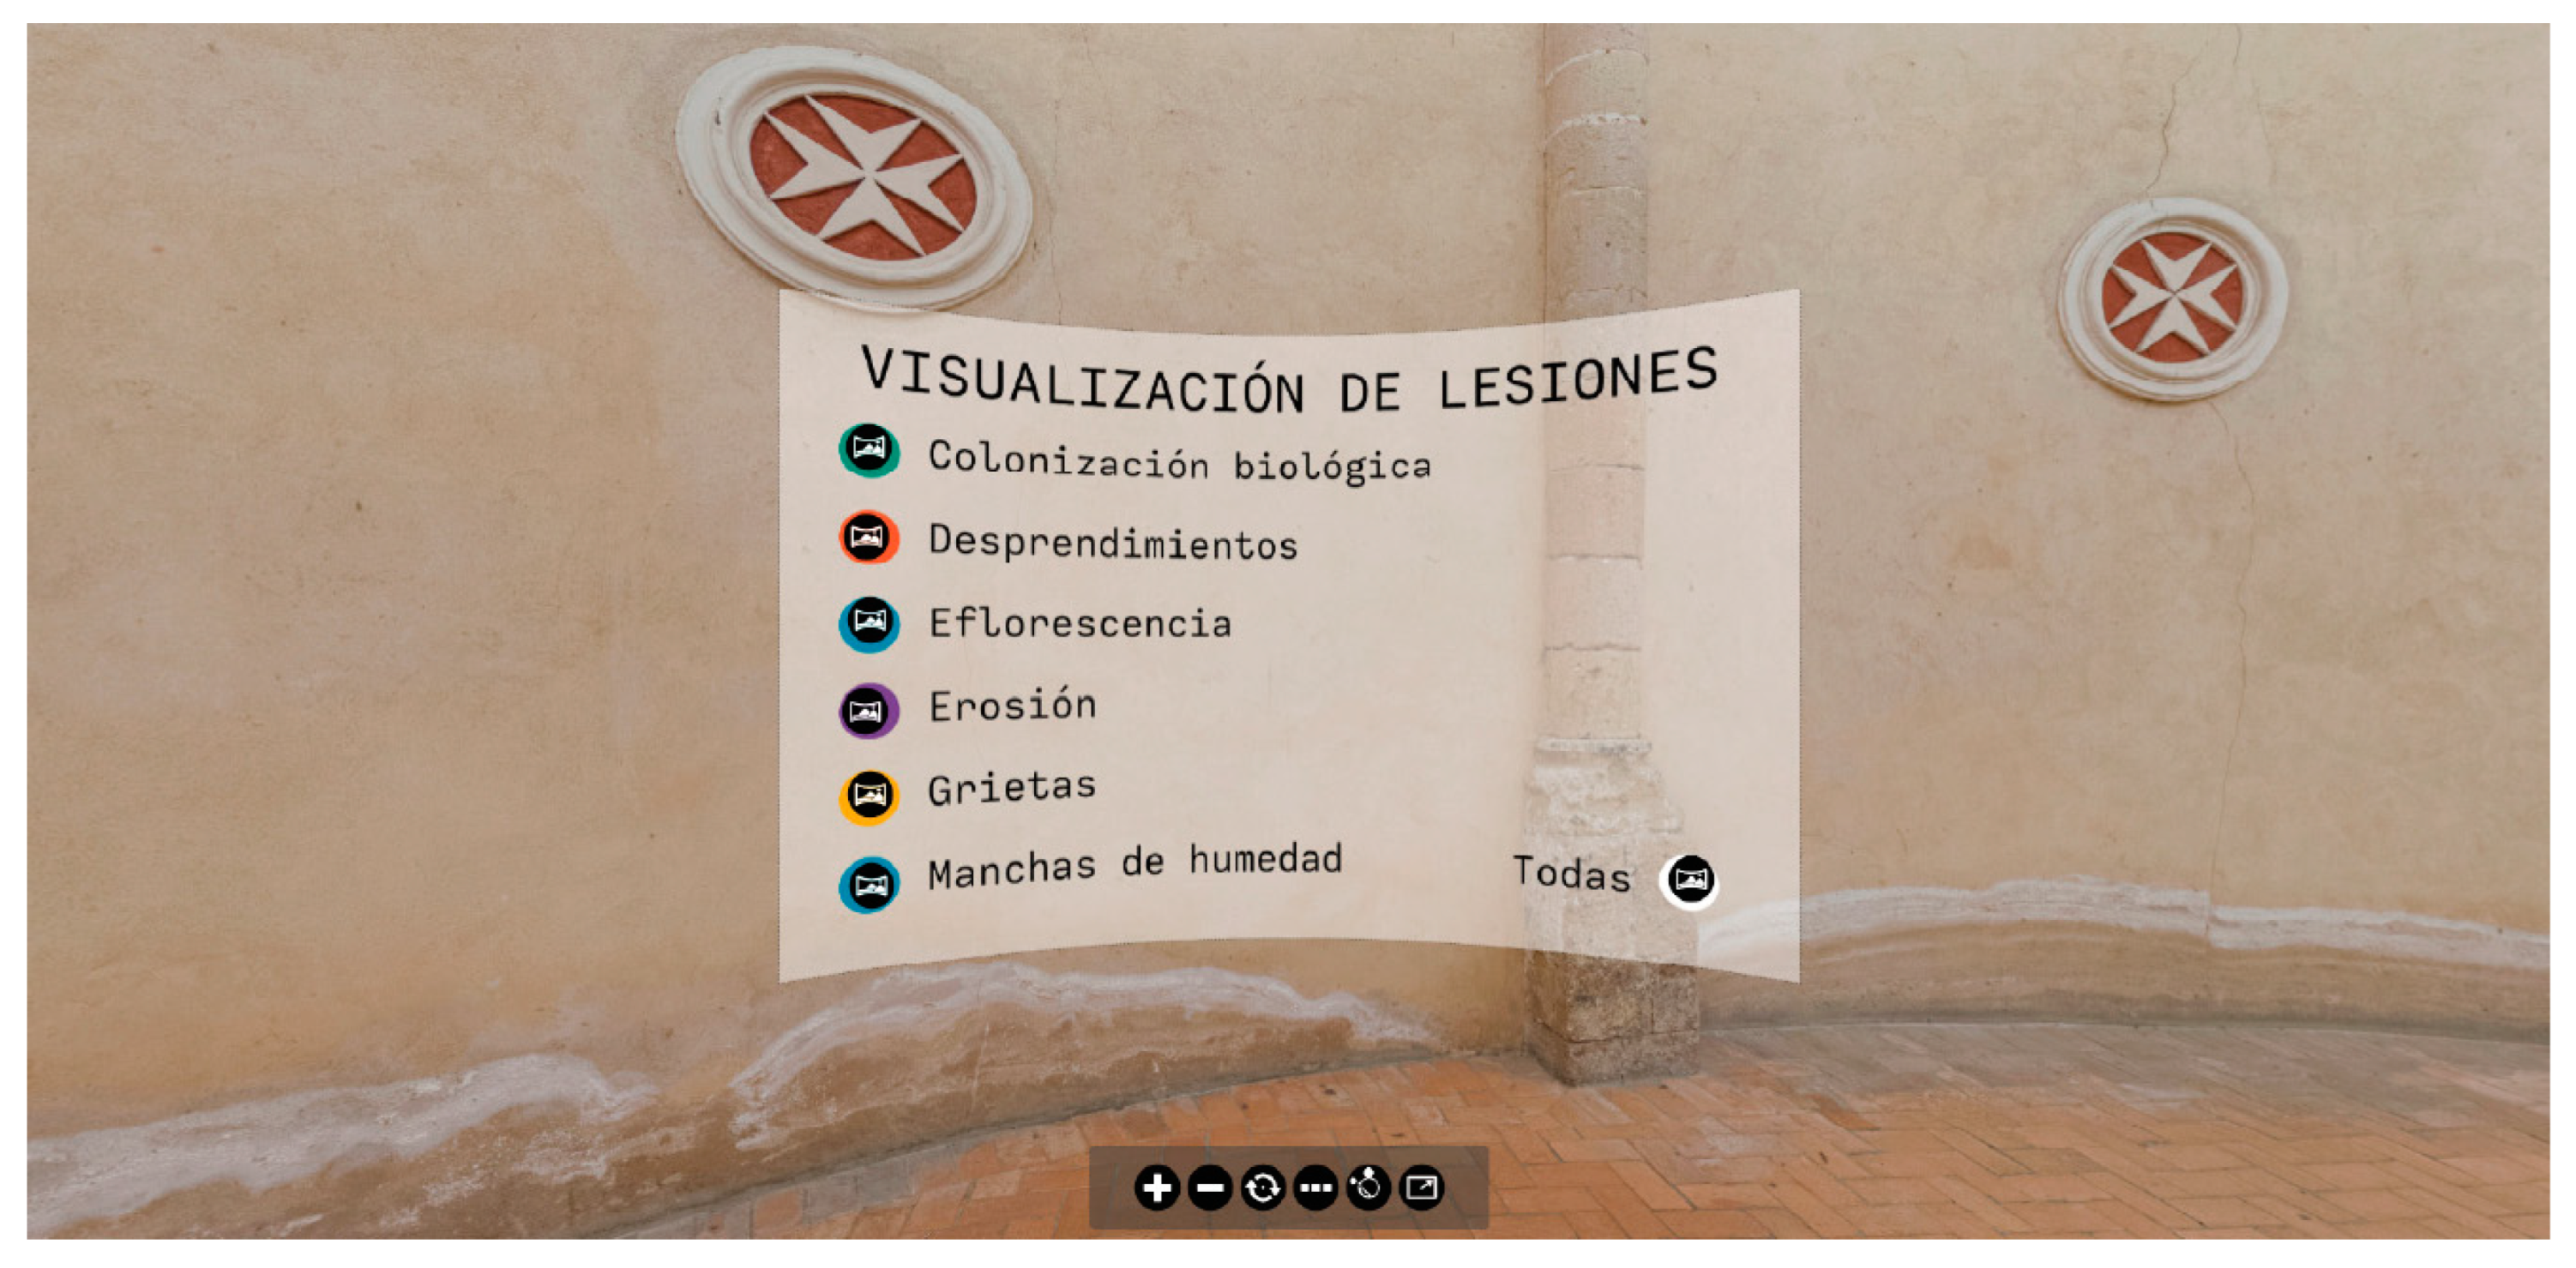
Moreover, the project also takes advantage of the 360° panoramic images that were generated during the initial phases of data collection. These images are exported into the software Pano2VR v.7.0.0, generating a static virtual environment. This environment offers a high degree of flexibility and ease of manipulation (Figure 15 and Figure 16). Users can directly add textures, annotations, or other visual elements to these images, making them a valuable tool for comparative analysis. This environment is integrated into the dynamic one. The ability to seamlessly switch between the visualization of 3D digital models and 360-degree images within the same virtual environment greatly enhances the user experience and provides a more comprehensive understanding of the heritage site.
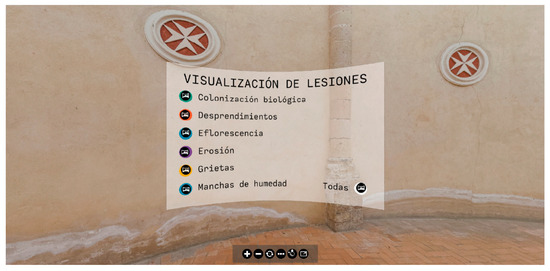
Figure 15.
Screenshots of the scene using 360-degree images with a selection interface. Visualization of lesions: biological colonization, detachment, efflorescence, erosion, cracks, moisture stains.
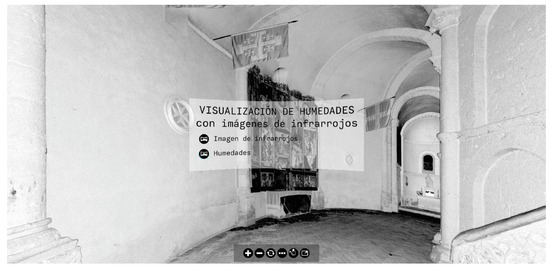
Figure 16.
Screenshots of the scene using 360-degree infrared images. Visualization of moisture with infrared images: infrared image, moisture.
4.2. Comparison of Results Within the Dynamic Environment
Following the development and integration of the digital models, a comprehensive comparison of the results obtained throughout the process is conducted. This comparison is particularly focused on the early stages of the project, where the point cloud data obtained from laser scanning was processed and subsequently integrated into both virtual reality and augmented reality environments. The comparison aims to evaluate the effectiveness and accuracy of the various methods and software tools employed in transforming the raw point cloud data into a usable 3D mesh that can be rendered in real-time.
The study also undertakes a detailed comparison of the different software programs used in the process of converting the point cloud into a fully realized three-dimensional mesh. These programs are evaluated based on their ability to accurately translate the point cloud data into a mesh that is not only visually accurate but also optimized for real-time rendering in virtual and augmented reality applications. This phase makes it possible to evaluate the effectiveness of the tools and methodologies for achieving high-quality digital models that can be used for heritage preservation.
4.2.1. Evaluation of Resources Utilized by Each Model in the Dynamic Environment
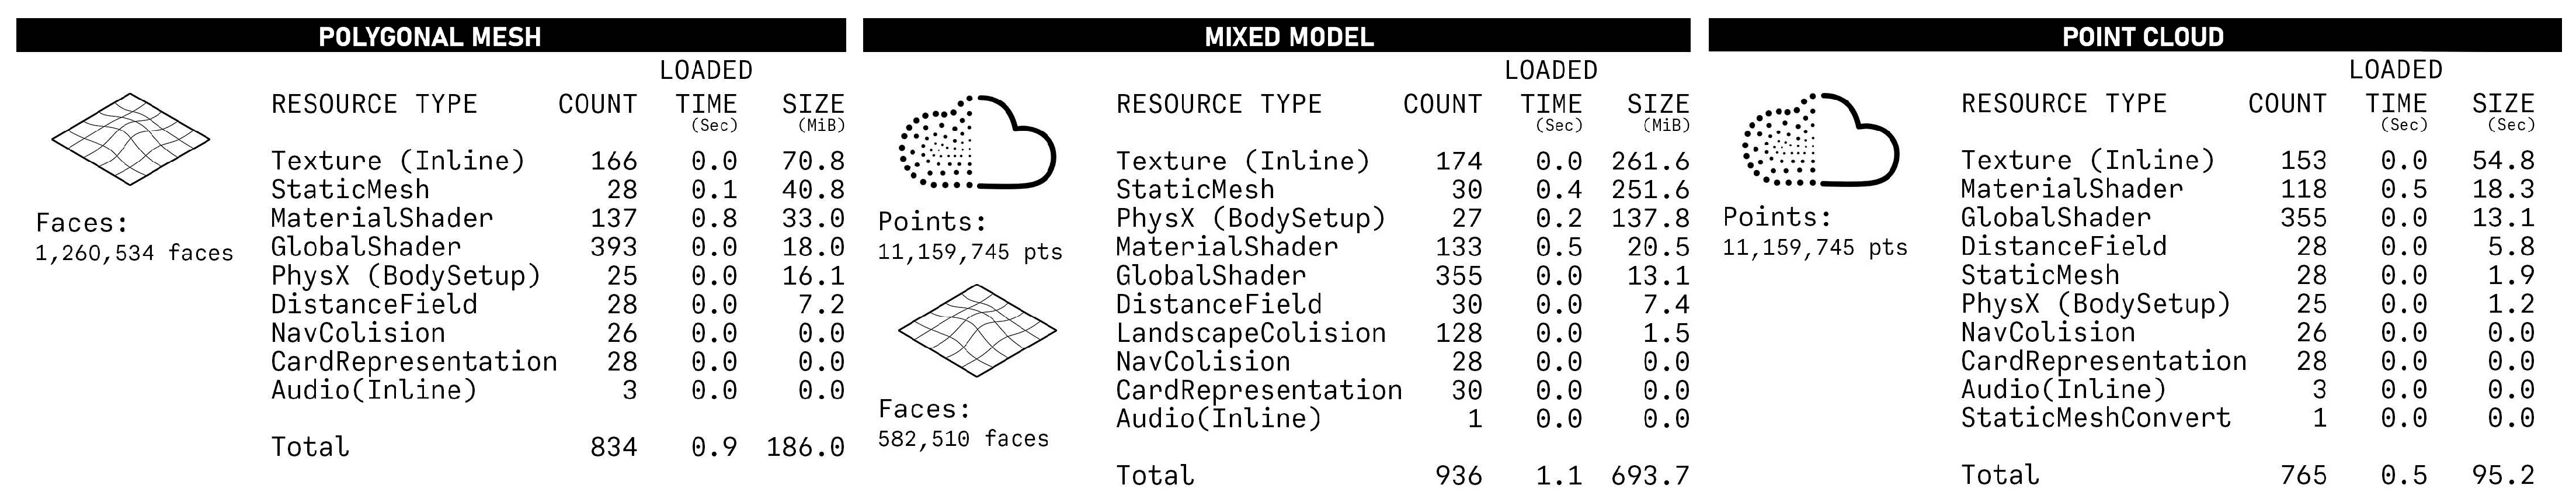
An evaluation of the technical resources utilized by each model introduced into the Virtual Reality environment is conducted. This evaluation is performed by creating three distinct models: the polygonal mesh, the 3D point cloud, and a hybrid model that combines elements of both. In this evaluation, specific attention is given to the representation of key architectural elements, such as two walls and the church floor, which are modeled as a mesh, while the remaining structural elements are depicted using the point cloud (Figure 17). The hybrid model is found to be particularly effective in maintaining both visual quality and the fluidity of the virtual experience, making it the preferred option for applications that require a balance between detail and performance.
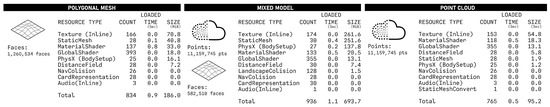
Figure 17.
Comparison of the resources utilized in the virtual reality system for each digital model.
The following Figure 18 shows the refined methodology proposed in this article.
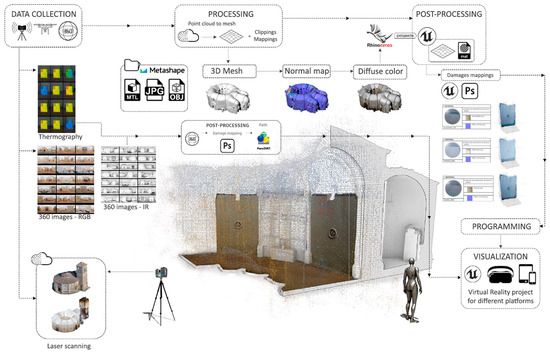
Figure 18.
Workflow for creating a virtual reality project designed for visualization across various platforms, allowing for material changes to observe the building’s damage.
4.2.2. Comparison Between Original Documentation and Scanned Model
The study includes a comparative analysis between the original documentation of the Church and the model generated from the 3D point cloud data. This comparison is achieved by creating a sectional view of the scanned model and juxtaposing it with the section plan derived from the church’s original architectural drawings, as depicted in Figure 19. This analysis reveals notable differences between the manually created section, which is based on traditional measurement techniques, and the section generated from the laser-scanned model. The laser scanning process offers a significantly higher level of resolution and accuracy, highlighting the accuracy of the scanned model in capturing the true dimensions and conditions of the Church.
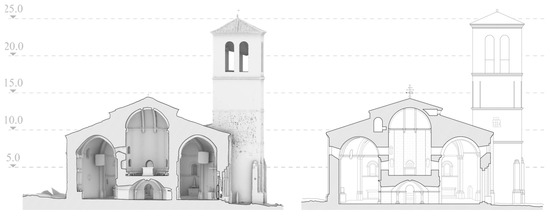
Figure 19.
Comparison of the scan-generated model with the initial Church documentation.
4.2.3. Discussion of the Results and Comparison with Other Proposals
The research presents a novel methodology for rendering heritage sites for diagnostic purposes. This methodology integrates 3D point clouds, meshes, and 360-degree images within a unified framework that comprises both a dynamic environment—generated using 3D point clouds and meshes—and a static environment, created with 360-degree images.
In the dynamic environment, polygonal meshes stand out due to their superior visualization capabilities, enabling the dynamic alteration of materials and textures. This flexibility is particularly valuable for detailed examinations of structural damage and other building features. A balance between visual accuracy and practical usability in heritage preservation can be achieved by simplifying the mesh and using diffuse and normal maps derived from high-detail versions. Conversely, while 3D point clouds retain the original colors and geometry captured during laser scanning, they present significant challenges in projecting images for real-time modifications, making this approach often impractical for effective real-time rendering. To address these issues, the proposed methodology seamlessly integrates both data sources into a cohesive framework, allowing users to select the most appropriate source for their specific needs.
Regarding the static environment, the results presented in this article indicate that this type of virtual environment can effectively complement the dynamic one, particularly in situations where computational resources are limited. With the appropriate configuration, users can toggle layers of damage visualization, like the dynamic environment.
It is also worth noting that the input used for generating this environment has a large impact on the final results. The laser scanning process does provide a high level of precision, which is one of its primary strengths for documenting and analyzing heritage sites like the Church. However, certain real-world conditions can affect the accuracy of the data captured during the scan. Occlusions occur when parts of the structure are blocked from the scanner’s line of sight. In the case of this historic Church, elements such as columns, furniture, or even intricate carvings can obscure portions of the building. These occlusions create shadows in the 3D point cloud, meaning parts of the structure might not be captured, which can impact the overall completeness of the model. Additionally, the material properties of the scanned affect how accurately the laser scanner can capture them. Some materials in the church (highly reflective surfaces, polished stone, stained glass windows, and metal fixtures) may cause the laser to bounce unpredictably. All these issues need to be fixed in a manual way and are also present in other state-of-the-art methods.
To conclude this section, a comparison table is presented that highlights the current methodology alongside other state-of-the-art approaches [33,34,35,36,37,38,39]. Table 1 aims to evaluate the key advantages and disadvantages of each methodology, providing a clear overview of their respective strengths and weaknesses.

Table 1.
Comparative of different methodologies. Where 3D PC RT is the capacity of rendering in real time a 3D point cloud; 3D M RT is the capacity of rendering 3D meshes in real time; and VR is virtual reality, between brackets the possibility of using Augmented Reality.
The use of game engines is predominant, especially Unreal Engine, due to its graphic power and ability to handle large files. Most of the projects take an approach using 3D meshes, often generated through 3D point clouds. There are some approaches that make use of 360-degree images. None of the approaches propose the integration, in a unique environment, of the 3D point clouds, meshes and 360-degree images, which limits certain important capabilities. Based on this, our approach proposes a complete integration. In this way, access to all available information from the different sources is achieved through a virtual reality environment. This virtual reality environment offers the possibility of rendering the building by using 3D data or by using 360-degree images. Thanks to this, it is possible to consult the information even with devices with low-computational resources. Adding interactive materials enables real-time modifications and analysis within the virtual model, enhancing workflow efficiency. It reduces the need to switch between design tools, maintaining focus within the interactive scene. This integration also allows for instant feedback, improving decision-making and design accuracy by visualizing changes immediately.
5. Conclusions
The methodology presented in this paper focuses on integrating 3D point clouds and meshes from terrestrial laser scanners, as well as panoramic images with virtual reality (VR) engines to enhance the visualization and detection of damage in historic buildings, with compatibility for portable devices. This approach utilizes well-known software tools such as CloudCompare and Unreal Engine 5, supplemented by custom programming scripts in the form of blueprints to provide tailored functionality. Additionally, the methodology incorporates various post-processing techniques to ensure both efficiency and effectiveness. Specifically, it suggests the decimation of the 3D point cloud and the application of normal maps and textures over a simplified mesh. This approach optimizes the balance between rendering time and visual quality, ensuring a seamless user experience while maintaining detailed visual accuracy in the model.
The main advantages of this methodology include:
- Use of well-known and user-friendly software solutions: one of the main advantages of the proposed method is the use of well-established software. This question simplifies the implementation of this approach in other study cases.
- Real-time user experience: integrating 3D point clouds and polygonal meshes within a unified virtual environment enables users to visualize and interact with the building in real-time, delivering instant feedback and insights. Users can seamlessly switch between visualization layers to suit their specific needs.
- Efficient rendering on portable devices: despite the complexity of the environment, the methodology ensures efficient rendering on portable devices, making it accessible even with limited computational resources. This aspect is possible due to the use of a simplified mesh as well as static virtual environments with panoramic images.
- Infrared imaging integration: infrared images from laser scanners or thermographic cameras can be seamlessly incorporated, offering enhanced diagnostic capabilities by adding thermal data for a more complete structural analysis.
- Damage visualization and categorization: users can not only visualize detected damages but also switch between various damage categories, enabling a more detailed and flexible assessment of the current conservation status of the building.
However, several limitations were identified:
- Lower accuracy in complex geometries and fine textures: in areas with intricate geometries or fine surface textures, the resolution of the 3D point cloud data occasionally resulted in reduced accuracy in the model’s surface representation (including the mesh). This limitation could be partially mitigated by supplementing these areas with high-detail 3D scans from handheld scanners, or by projecting high-resolution images, like the way thermographic images were utilized in this study.
- Performance issues on portable devices: although the model was adaptable to mobile devices with lower computational power, rendering speed and visual quality were sometimes affected by hardware limitations. This highlights the need for more optimized algorithms to ensure smooth performance and consistent quality across various platforms.
- Another potential limitation is the resolution of 360-degree images. Fine details, such as small cracks, may be difficult to detect due to the lower resolution commonly associated with 360-degree imaging. This limitation will be addressed by utilizing gigapixel panoramic images for further analysis.
Despite these challenges, the research results confirm the potential of combining 3D point cloud, meshes, panoramic images and virtual reality technologies for heritage conservation. The methodology presented not only improves the precision of damage analysis but also makes it more accessible, offering an interactive and immersive tool for professionals in the field. Future work should focus on refining the integration of data sources and improving the performance of real-time rendering, particularly for mobile platforms.
In future research, the integration of DT with IoT devices presents a promising avenue for real-time monitoring and data-driven management of physical structures. Embedding sensors within buildings could enable continuous updates to digital twins, providing valuable insights into structural health, environmental conditions, and energy usage. Additionally, incorporating AI and ML algorithms could significantly enhance the automation of damage detection and material degradation analysis within these virtual models. This would not only expedite the assessment process but also improve the accuracy of identifying and predicting structural issues. Furthermore, the use of AI in predictive maintenance could improve how we manage infrastructure, allowing for the anticipation of potential failures based on historical and real-time data, thereby enabling timely and proactive interventions. These advancements highlight the potential for digital twins to become even more powerful tools in the management and preservation of physical assets.
Author Contributions
Conceptualization and methodology, F.L.d.B.G. and L.J.S.-A.; software, C.A.M. and F.L.d.B.G.; validation, D.S.A., A.J.G.C., J.R.A.Z., M.P.C. and S.G.M.; formal analysis, C.A.M.; resources, D.S.A., A.J.G.C., J.R.A.Z., M.P.C. and S.G.M.; writing—original draft preparation, C.A.M. and F.L.d.B.G.; writing—review and editing, F.L.d.B.G., C.A.M., D.S.A., A.J.G.C., J.R.A.Z., M.P.C., S.G.M. and L.J.S.-A.; visualization, C.A.M. and F.L.d.B.G.; supervision, F.L.d.B.G. and L.J.S.-A.; project administration, D.S.A., A.J.G.C., J.R.A.Z., M.P.C. and S.G.M.; funding acquisition, L.J.S.-A. and D.S.A. All authors have read and agreed to the published version of the manuscript.
Funding
This work has been partially funded by the Community of Madrid through the Project CAREEN (Desarrollo de nuevos métodos basados en inteligenCia ARtificial para la caracterización de daños en cosntruccioEs históricas a través de nubEs de puNtos 3D) with reference APOYO-JOVENES-21-RCDT1L-85-SL9E1R.
Data Availability Statement
The original contributions presented in the study are included in the article. Further inquiries can be directed to the corresponding authors.
Conflicts of Interest
The authors declare no conflicts of interest.
References
- Georgopoulos, A. Conemporary Digital Technologies at the Service of Cultural Heritage. In Heritage Preservation; Chanda, B., Chaudhuri, S., Chaudhury, S., Eds.; Springer: Singapore, 2018; pp. 1–20. [Google Scholar] [CrossRef]
- Barontini, A.; Alarcon, C.; Sousa, H.S.; Oliveira, D.V.; Masciotta, M.G.; Azenha, M. Development and demonstration of an HBIM framework for the preventive conservation of cultural heritage. Int. J. Architect. Herit. 2022, 16, 1451–1473. [Google Scholar] [CrossRef]
- Mishra, M.; Lourenço, P.B. Artificial intelligence-assisted visual inspection for cultural heritage: State-of-the-art review. J. Cult. Herit. 2024, 66, 536–550. [Google Scholar] [CrossRef]
- Sánchez-Aparicio, L.J.; Masciotta, M.G.; García-Alvarez, J.; Ramos, L.F.; Oliveira, D.V.; Martín-Jiménez, J.A.; González-Aguilera, D.; Monteiro, P. Web-GIS approach to preventive conservation of heritage buildings. Autom. Constr. 2020, 118, 103304. [Google Scholar] [CrossRef]
- Yastikli, N. Documentation of cultural heritage using digital photogrammetry and laser scanning. J. Cult. Herit. 2007, 8, 423–427. [Google Scholar] [CrossRef]
- Mudička, Š.; Kapica, R. Digital heritage, the possibilities of information visualisation through extended reality tools. Heritage 2023, 6, 112–131. [Google Scholar] [CrossRef]
- Ramtohul, A.; Khedo, K.K. Augmented reality systems in the cultural heritage domains: A systematic review. Digit. Appl. Archaeol. Cult. Herit. 2024, 32, e00317. [Google Scholar] [CrossRef]
- Upasani, N.; Manna, A.; Ranjanikar, M. Augmented, virtual and mixed reality research in cultural heritage: A bibliometric study. Int. J. Adv. Comput. Sci. Appl. 2023, 14, 832–842. [Google Scholar] [CrossRef]
- Omran, W.; Ramos, R.F.; Casais, B. Virtual reality and augmented reality applications and their effect on tourist engagement: A hybrid review. J. Hosp. Tour. Technol. 2024, 15, 497–518. [Google Scholar] [CrossRef]
- Chen, Y.; del Blanco García, F.L. Constructive analysis and digital 3D reconstruction of the Yuanmingyuan ruins: Wanfanganhe Pavillion (China). VAR 2022, 13, 1–16. [Google Scholar] [CrossRef]
- Guidi, G.; Frischer, B.D. 3D digitization of cultural heritage. In 3D Imaging, Analysis and Applications; Springer: Berlin/Heidelberg, Germany, 2020; pp. 631–697. [Google Scholar]
- Sánchez-Aparicio, L.J.; del Blanco-García, F.L.; Mencías-Carrizosa, D.; Villanueva-Llauradó, P.; Aira-Zunzunegui, J.R.; Sanz-Arauz, D.; Garcia-Gago, J. Detection of damage in heritage constructions based on 3D point clouds. A systematic review. J. Build. Eng. 2023, 77, 107440. [Google Scholar] [CrossRef]
- Del Pozo, S.; Rodríguez-Gonzálvez, P.; Sánchez-Aparicio, L.J.; Muñoz-Nieto, A.; Hernández-López, D.; Felipe-García, B.; González-Aguilera, D. Multispectral imaging in cultural heritage conservation. Int. Arch. Photogramm. Remote Sens. Spat. Inf. Sci. 2017, 42, 155–162. [Google Scholar] [CrossRef]
- Aira-Zunzunegui, J.R.; Sánchez-Aparicio, M.; Sánchez-Aparicio, L.J.; Pinilla-Melo, J.; García-Morales, S. Determination of wood moisture content with terrestrial laser scanner. Constr. Build. Mater. 2022, 350, 128834. [Google Scholar] [CrossRef]
- Lerones, P.M.; Vélez, D.O.; Rojo, F.G.; Gómez-García-Bermejo, J.; Casanova, E.Z. Moisture detection in heritage buildings by 3D laser scanning. Stud. Conserv. 2016, 61 (Suppl. 1), 46–54. [Google Scholar] [CrossRef]
- Solla, M.; Maté-González, M.Á.; Blázquez, C.S.; Lagüela-López, S.; Nieto, I.M. Analysis of structural integrity through the combination of non-destructive testing techniques in heritage inspections: The study case of San Segundo’s hermitage (Ávila, Spain). J. Build. Eng. 2024, 89, 109295. [Google Scholar] [CrossRef]
- Lagüela, S.; Garrido, I.; Balado, J.; López-Rebollo, J.; Pisonero, J. Applications of deep learning to infrared thermography for the automatic classification of thermal pathologies: Review and case study. In Diagnosis of Heritage Buildings by Non-Destructive Techniques; Woodhead Publishing: Sawston, UK, 2024; pp. 103–132. [Google Scholar]
- Elizalde, R.R. Thermography applied to damage diagnosis over monuments and ancient constructions. J. Mater. Sci. Eng. Technol. 2023, 1, 1–6. [Google Scholar] [CrossRef]
- Gaspari, F.; Ioli, F.; Barbieri, F.; Rivieri, C.; Dondi, M.; Pinto, L. Rediscovering cultural heritage sites by interactive 3D exploration: A practical review of open-source WebGL tools. Int. Arch. Photogramm. Remote Sens. Spat. Inf. Sci. 2023, 48, 661–668. [Google Scholar] [CrossRef]
- Néroulidis, A.; Pouyet, T.; Tournon, S.; Rousset, M.; Callieri, M.; Manuel, A.; De Luca, L. A digital platform for the centralization and long-term preservation of multidisciplinary scientific data belonging to the Notre Dame de Paris scientific action. J. Cult. Herit. 2024, 65, 210–220. [Google Scholar] [CrossRef]
- Spettu, F.; Achille, C.; Fassi, F.; Della Giovampaola, I. Web platforms for cultural heritage management: The Parco Archeologico del Colosseo case study. Int. Arch. Photogramm. Remote Sens. Spat. Inf. Sci. 2023, 48, 1493–1500. [Google Scholar] [CrossRef]
- González, E.R.; Ausió, J.R.C.; Pérez, S.C. Application of real-time rendering technology to archaeological heritage virtual reconstruction: The example of Casas del Turuñuelo (Guareña, Badajoz, Spain). Virtual Archaeol. Rev. 2023, 14, 38–53. [Google Scholar] [CrossRef]
- Song, S.; Ghani, D.B.A. User experience design of digital display of San Jiang Dong wooden building construction skills based on Unreal Engine technology. Indones. J. Art Des. Stud. 2023, 2, 191–198. [Google Scholar]
- Aparicio Pérez, D.; del Blanco García, F.L. Design of immersive experiences for a utopian city. Graphic and virtual reconstruction of “The walking city”, Archigram. EGA 2022, 27, 98–109. [Google Scholar] [CrossRef]
- Banfi, F. HBIM, 3D drawing and virtual reality for archaeological sites and ancient ruins. VAR 2020, 11, 16–33. [Google Scholar] [CrossRef]
- del Blanco García, F.L. Virtual reconstruction and geometric analysis of Félix Candela’s inverted umbrellas for The Villahermosa Cathedral. Disegnarecon 2021, 14, 1–14. [Google Scholar] [CrossRef]
- García Ríos, P.; del Blanco García, F.L. New Babylon. Analysis and Virtual Reconstruction of the Utopian Vision of Constant Nieuwenhuys. EGA 2023, 28, 256–271. [Google Scholar] [CrossRef]
- Chaves, E.; Aguilar, J.; Barontini, A.; Mendes, N.; Compán, V. Digital tools for the preventive conservation of built heritage: The Church of Santa Ana in Seville. Heritage 2024, 7, 3470–3494. [Google Scholar] [CrossRef]
- Masciotta, M.G.; Sanchez-Aparicio, L.J.; Oliveira, D.V.; Gonzalez-Aguilera, D. Integration of laser scanning technologies and 360° photography for the digital documentation and management of cultural heritage buildings. Int. J. Archit. Herit. 2023, 17, 56–75. [Google Scholar] [CrossRef]
- Acquaviva, S.; Pulcrano, M.; Scandurra, S.; Palomba, D.; di Luggo, A. Digital technologies to the enhancement of the cultural heritage: A virtual tour for the Church of San Giacomo Apostolo Maggiore. In Beyond Digital Representation: Advanced Experiences in AR and AI for Cultural Heritage and Innovative Design; Springer: Cham, Switzerland, 2023; pp. 343–358. [Google Scholar]
- Manna, P.A.; Casadei, E.; Frau, M.; Luca, V.D. The website of the Archaeological Museum in Collelongo (AQ)—An example of sustainable technological development. Proceedings 2024, 96, 16. [Google Scholar] [CrossRef]
- Merino de Cáceres, J.M. La Iglesia de la Vera-Cruz de Segovia, Conocida como de los Templarios. Academia de Historia y Arte de San Quirce. 1998. Available online: https://datos.bne.es/edicion/bimo0001023474.html (accessed on 20 October 2024).
- Al Shawabkeh, R.; Arar, M. Virtual reality as a tool to enhance the efficiency and reliability of the virtual reconstruction process for heritage/archaeological sites: The case of Umm Al-Jimal in Jordan. Digit. Appl. Archaeol. Cult. Herit. 2024, 33, e00325. [Google Scholar] [CrossRef]
- Bianconi, F.; Filippucci, M.; Cornacchini, F.; Meschini, M.; Mommi, C. Cultural heritage and virtual reality: Application for visualization of historical 3D reproduction. Int. Arch. Photogramm. Remote Sens. Spatial Inf. Sci. 2023, XLVIII-M-2-2023, 203–210. [Google Scholar]
- Pavelka, K., Jr.; Pacina, J. Using modern technologies for visualization of cultural heritage. Civ. Eng. J. 2023, 32, 549–563. [Google Scholar] [CrossRef]
- Costantino, D. The missing sky: A dome for the SS. Medici of Alberobello. VR for heritage valorization. In Extended Reality; De Paolis, L.T., Arpaia, P., Sacco, M., Eds.; XR Salento; Lecture Notes in Computer Science; Springer: Cham, Switzerland, 2024. [Google Scholar] [CrossRef]
- Zhang, X.; Zhi, Y.; Xu, J.; Han, L. Digital Protection and Utilization of Architectural Heritage Using Knowledge Visualization. Buildings 2022, 12, 1604. [Google Scholar] [CrossRef]
- Abergel, V.; Manuel, A.; Pamart, A.; Cao, I.; De Luca, L. Aïoli: A reality-based 3D annotation cloud platform for the collaborative documentation of cultural heritage artefacts. Digit. Appl. Archaeol. Cult. Herit. 2023, 30, e00285. [Google Scholar] [CrossRef]
- Franczuk, J.; Boguszewska, K.; Parrinello, S.; Dell’Amico, A.; Galasso, F.; Gleń, P. Direct use of point clouds in real-time interaction with the cultural heritage in pandemic and post-pandemic tourism on the case of Kłodzko Fortress. Digit. Appl. Archaeol. Cult. Herit. 2022, 24, e00217. [Google Scholar] [CrossRef]


Disclaimer/Publisher’s Note: The statements, opinions and data contained in all publications are solely those of the individual author(s) and contributor(s) and not of MDPI and/or the editor(s). MDPI and/or the editor(s) disclaim responsibility for any injury to people or property resulting from any ideas, methods, instructions or products referred to in the content. |
© 2024 by the authors. Licensee MDPI, Basel, Switzerland. This article is an open access article distributed under the terms and conditions of the Creative Commons Attribution (CC BY) license (https://creativecommons.org/licenses/by/4.0/).