
Automated Surface Crack Identification of Reinforced Concrete Members Using an Improved YOLOv4-Tiny-Based Crack Detection Model


Abstract
:1. Introduction
- (a)
- Automated classification and detection of flexure/shear cracks in RC beam elements using the modified YOLOv4-tiny model, overcoming the limitations seen in traditional methods.
- (b)
- Quantifying the total flexure/shear cracks present in an image, which gives an option for further action on the structure.
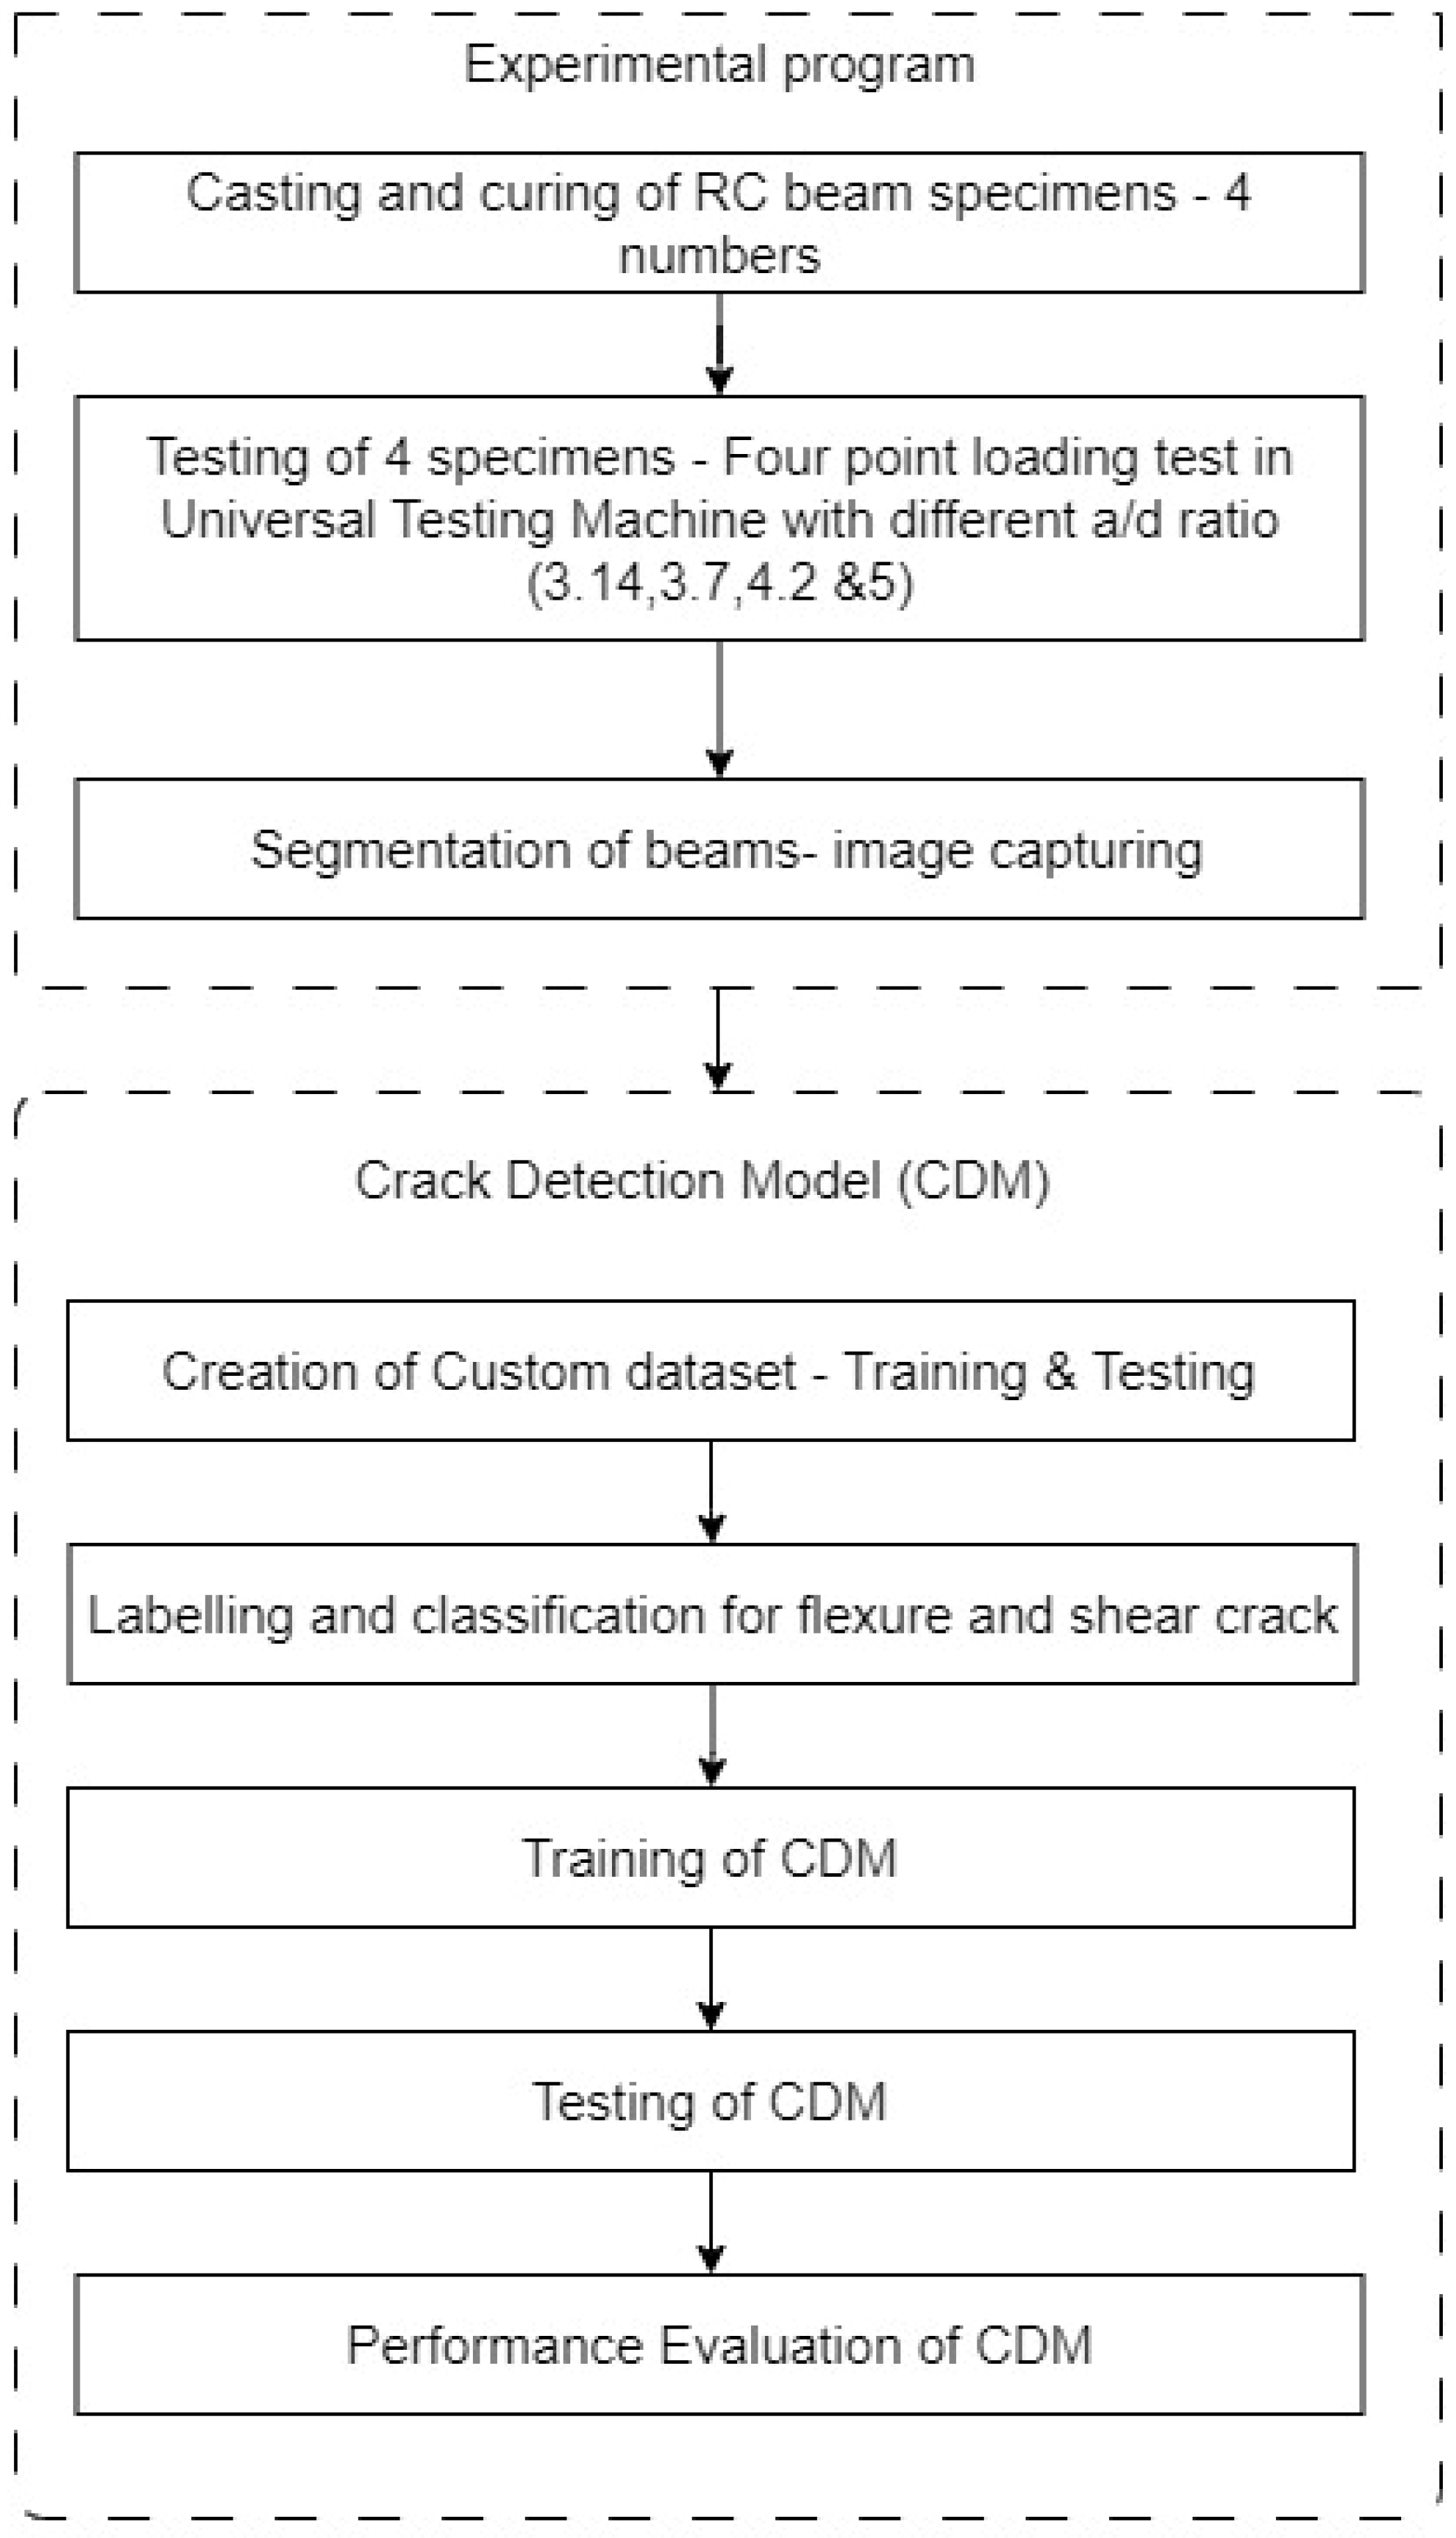
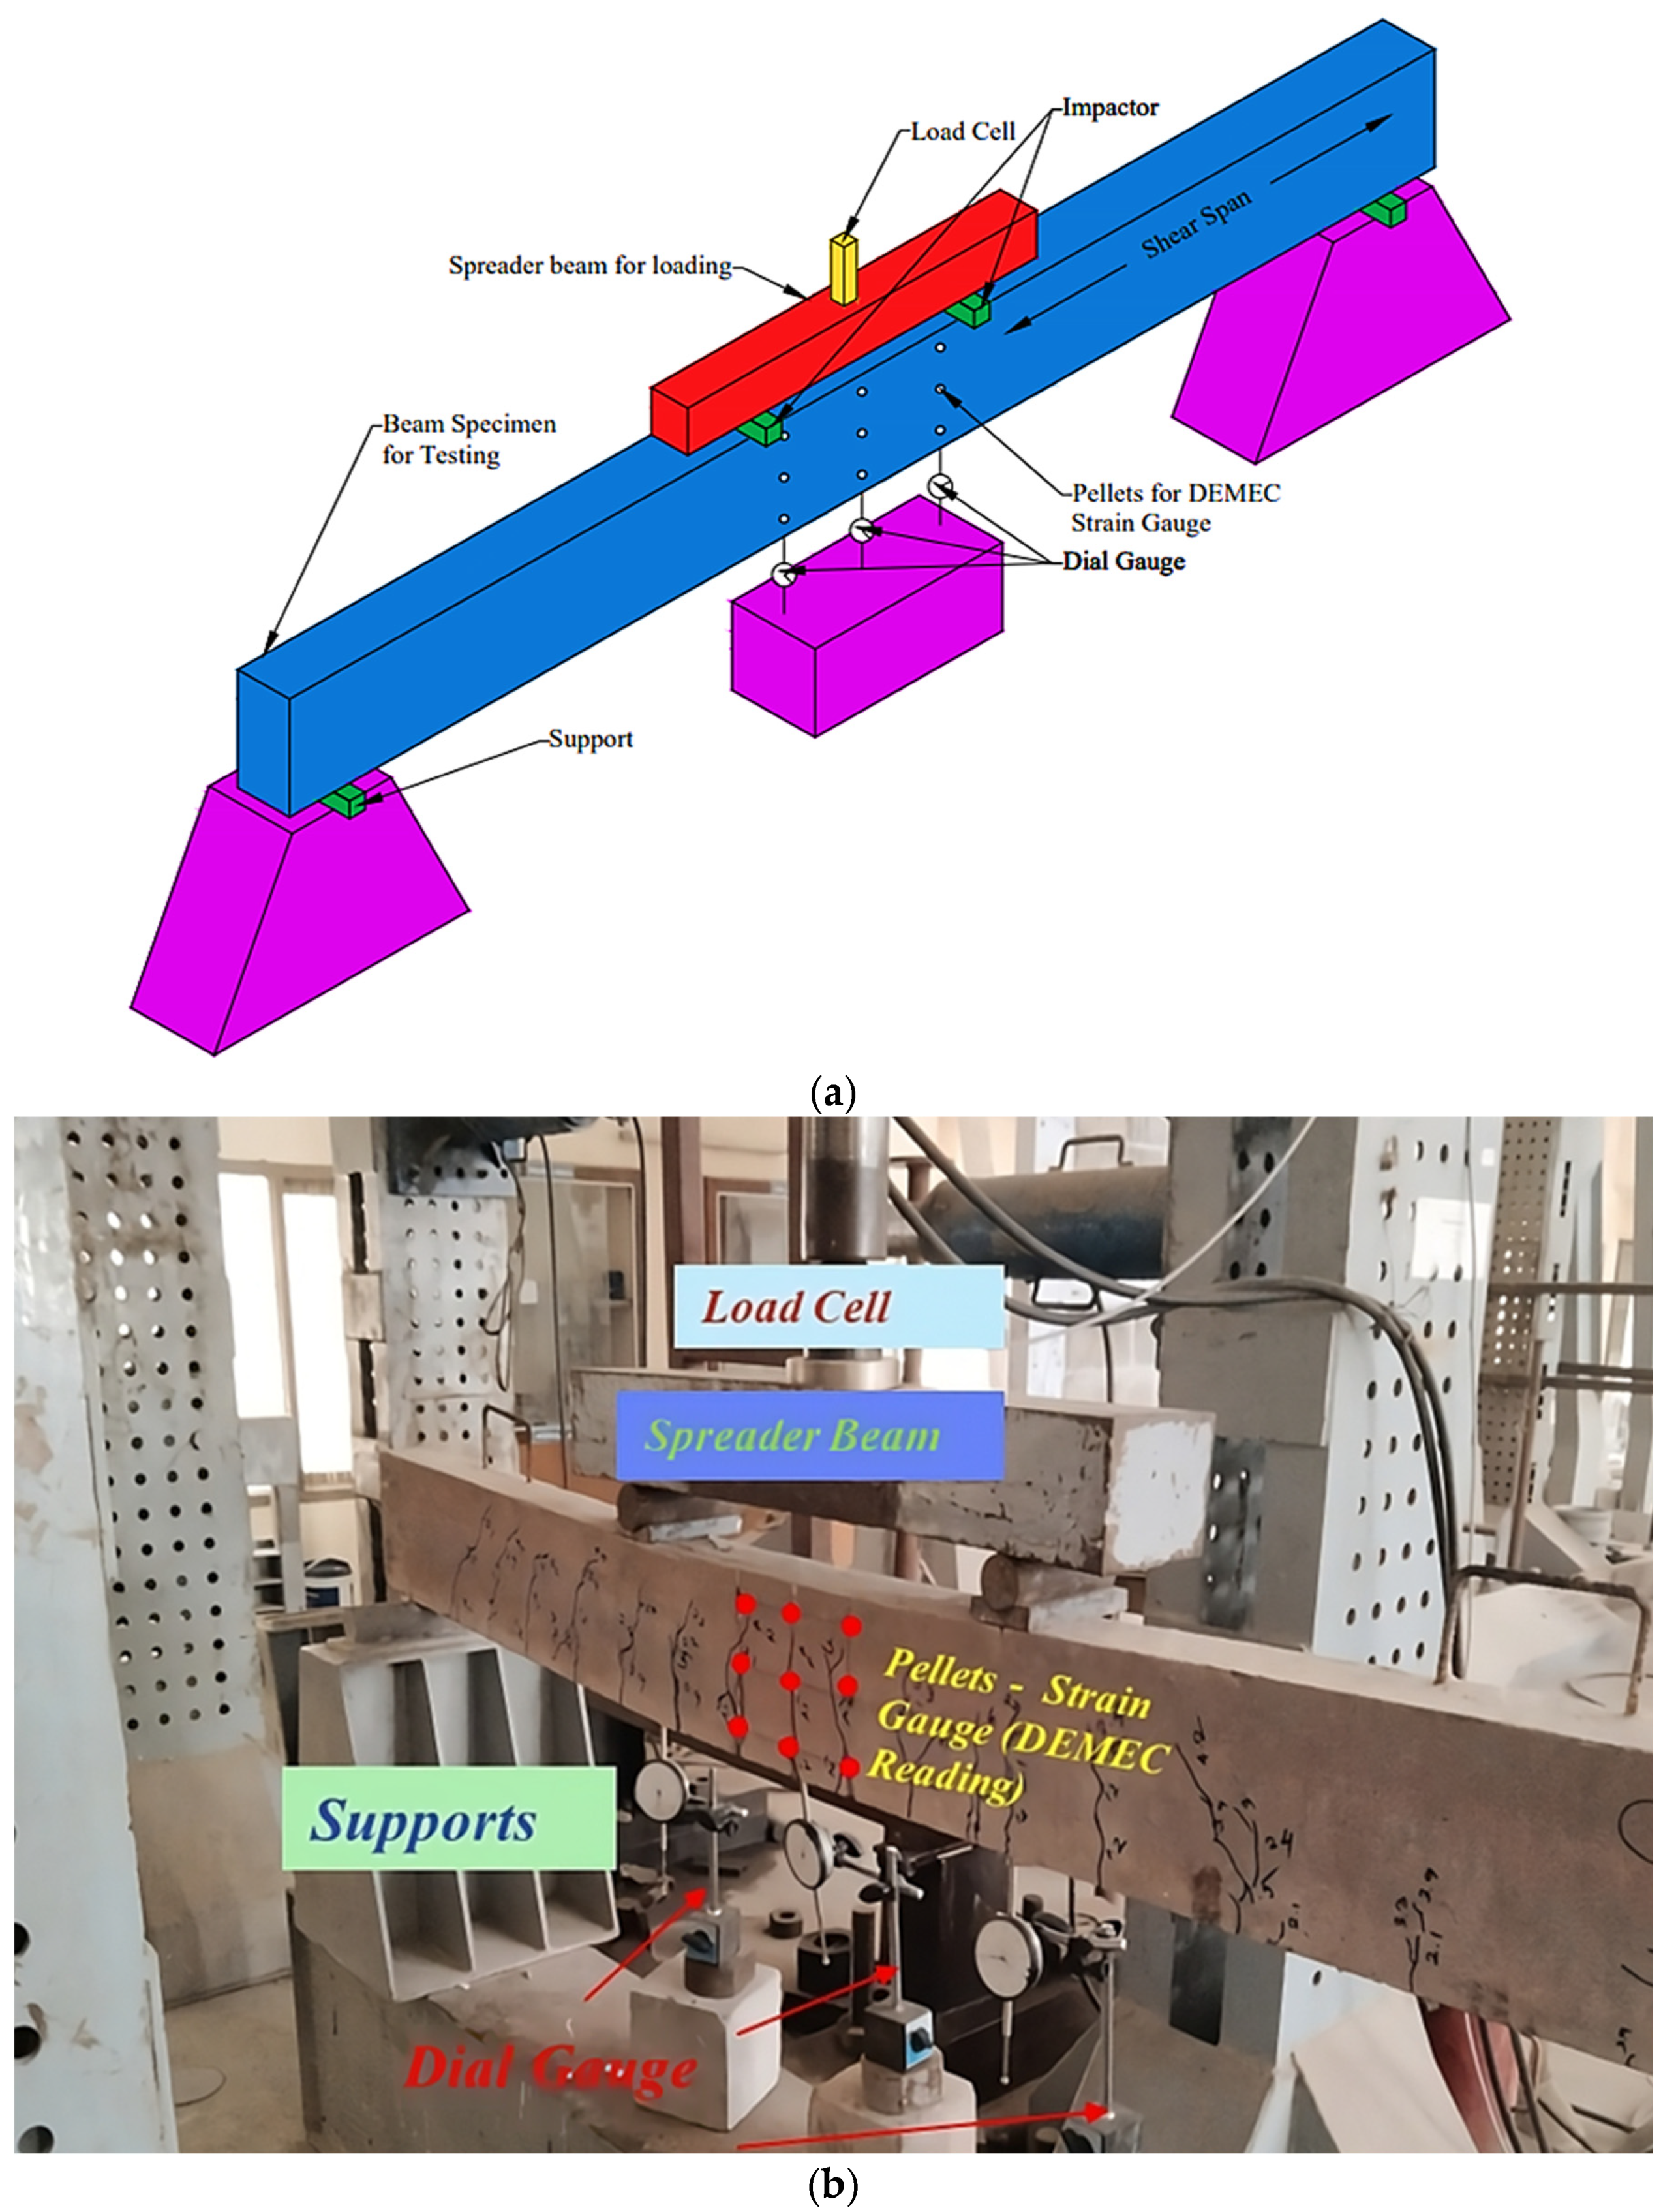
2. Experimental Corroboration
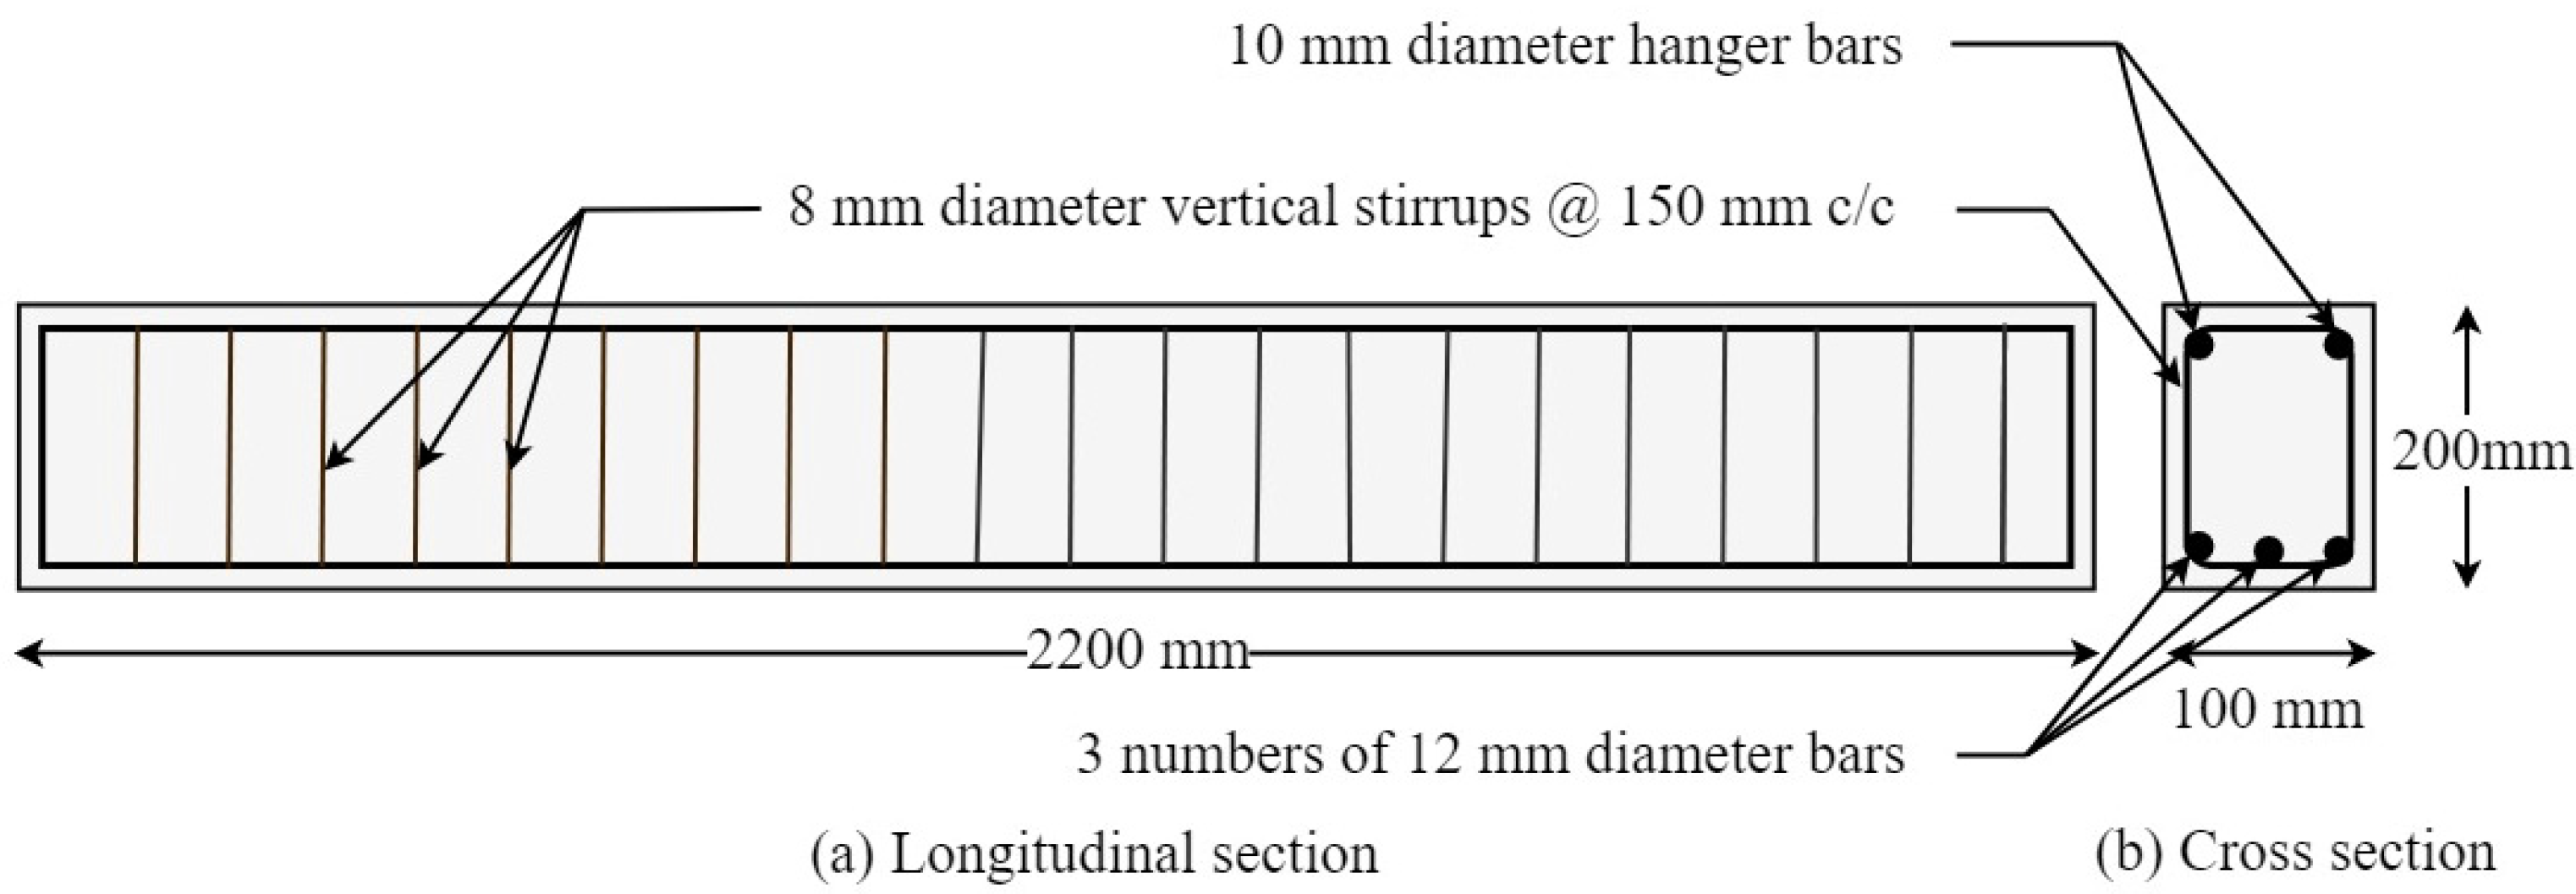
Experimental Study and Dataset Preparation
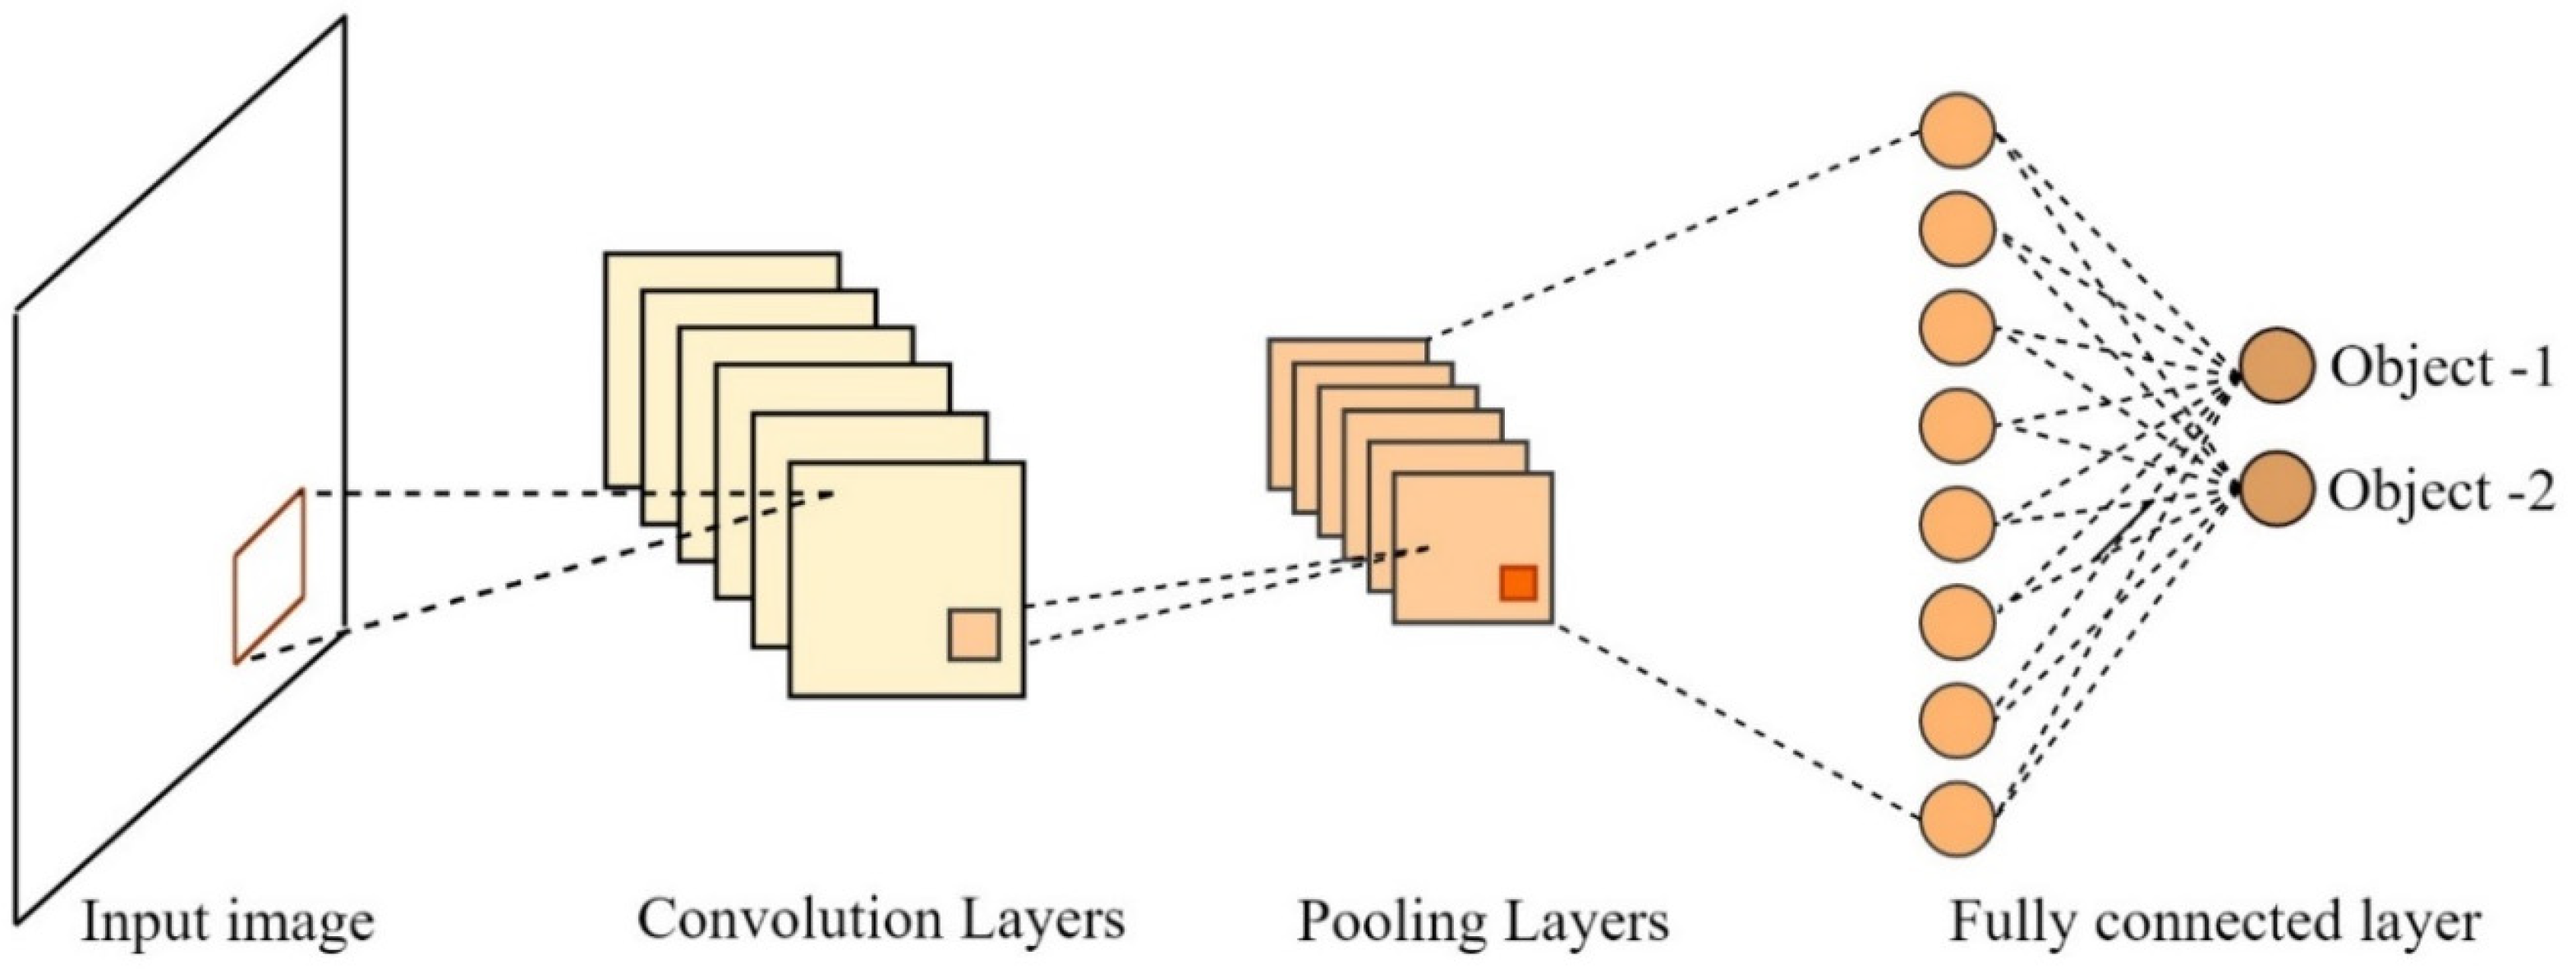
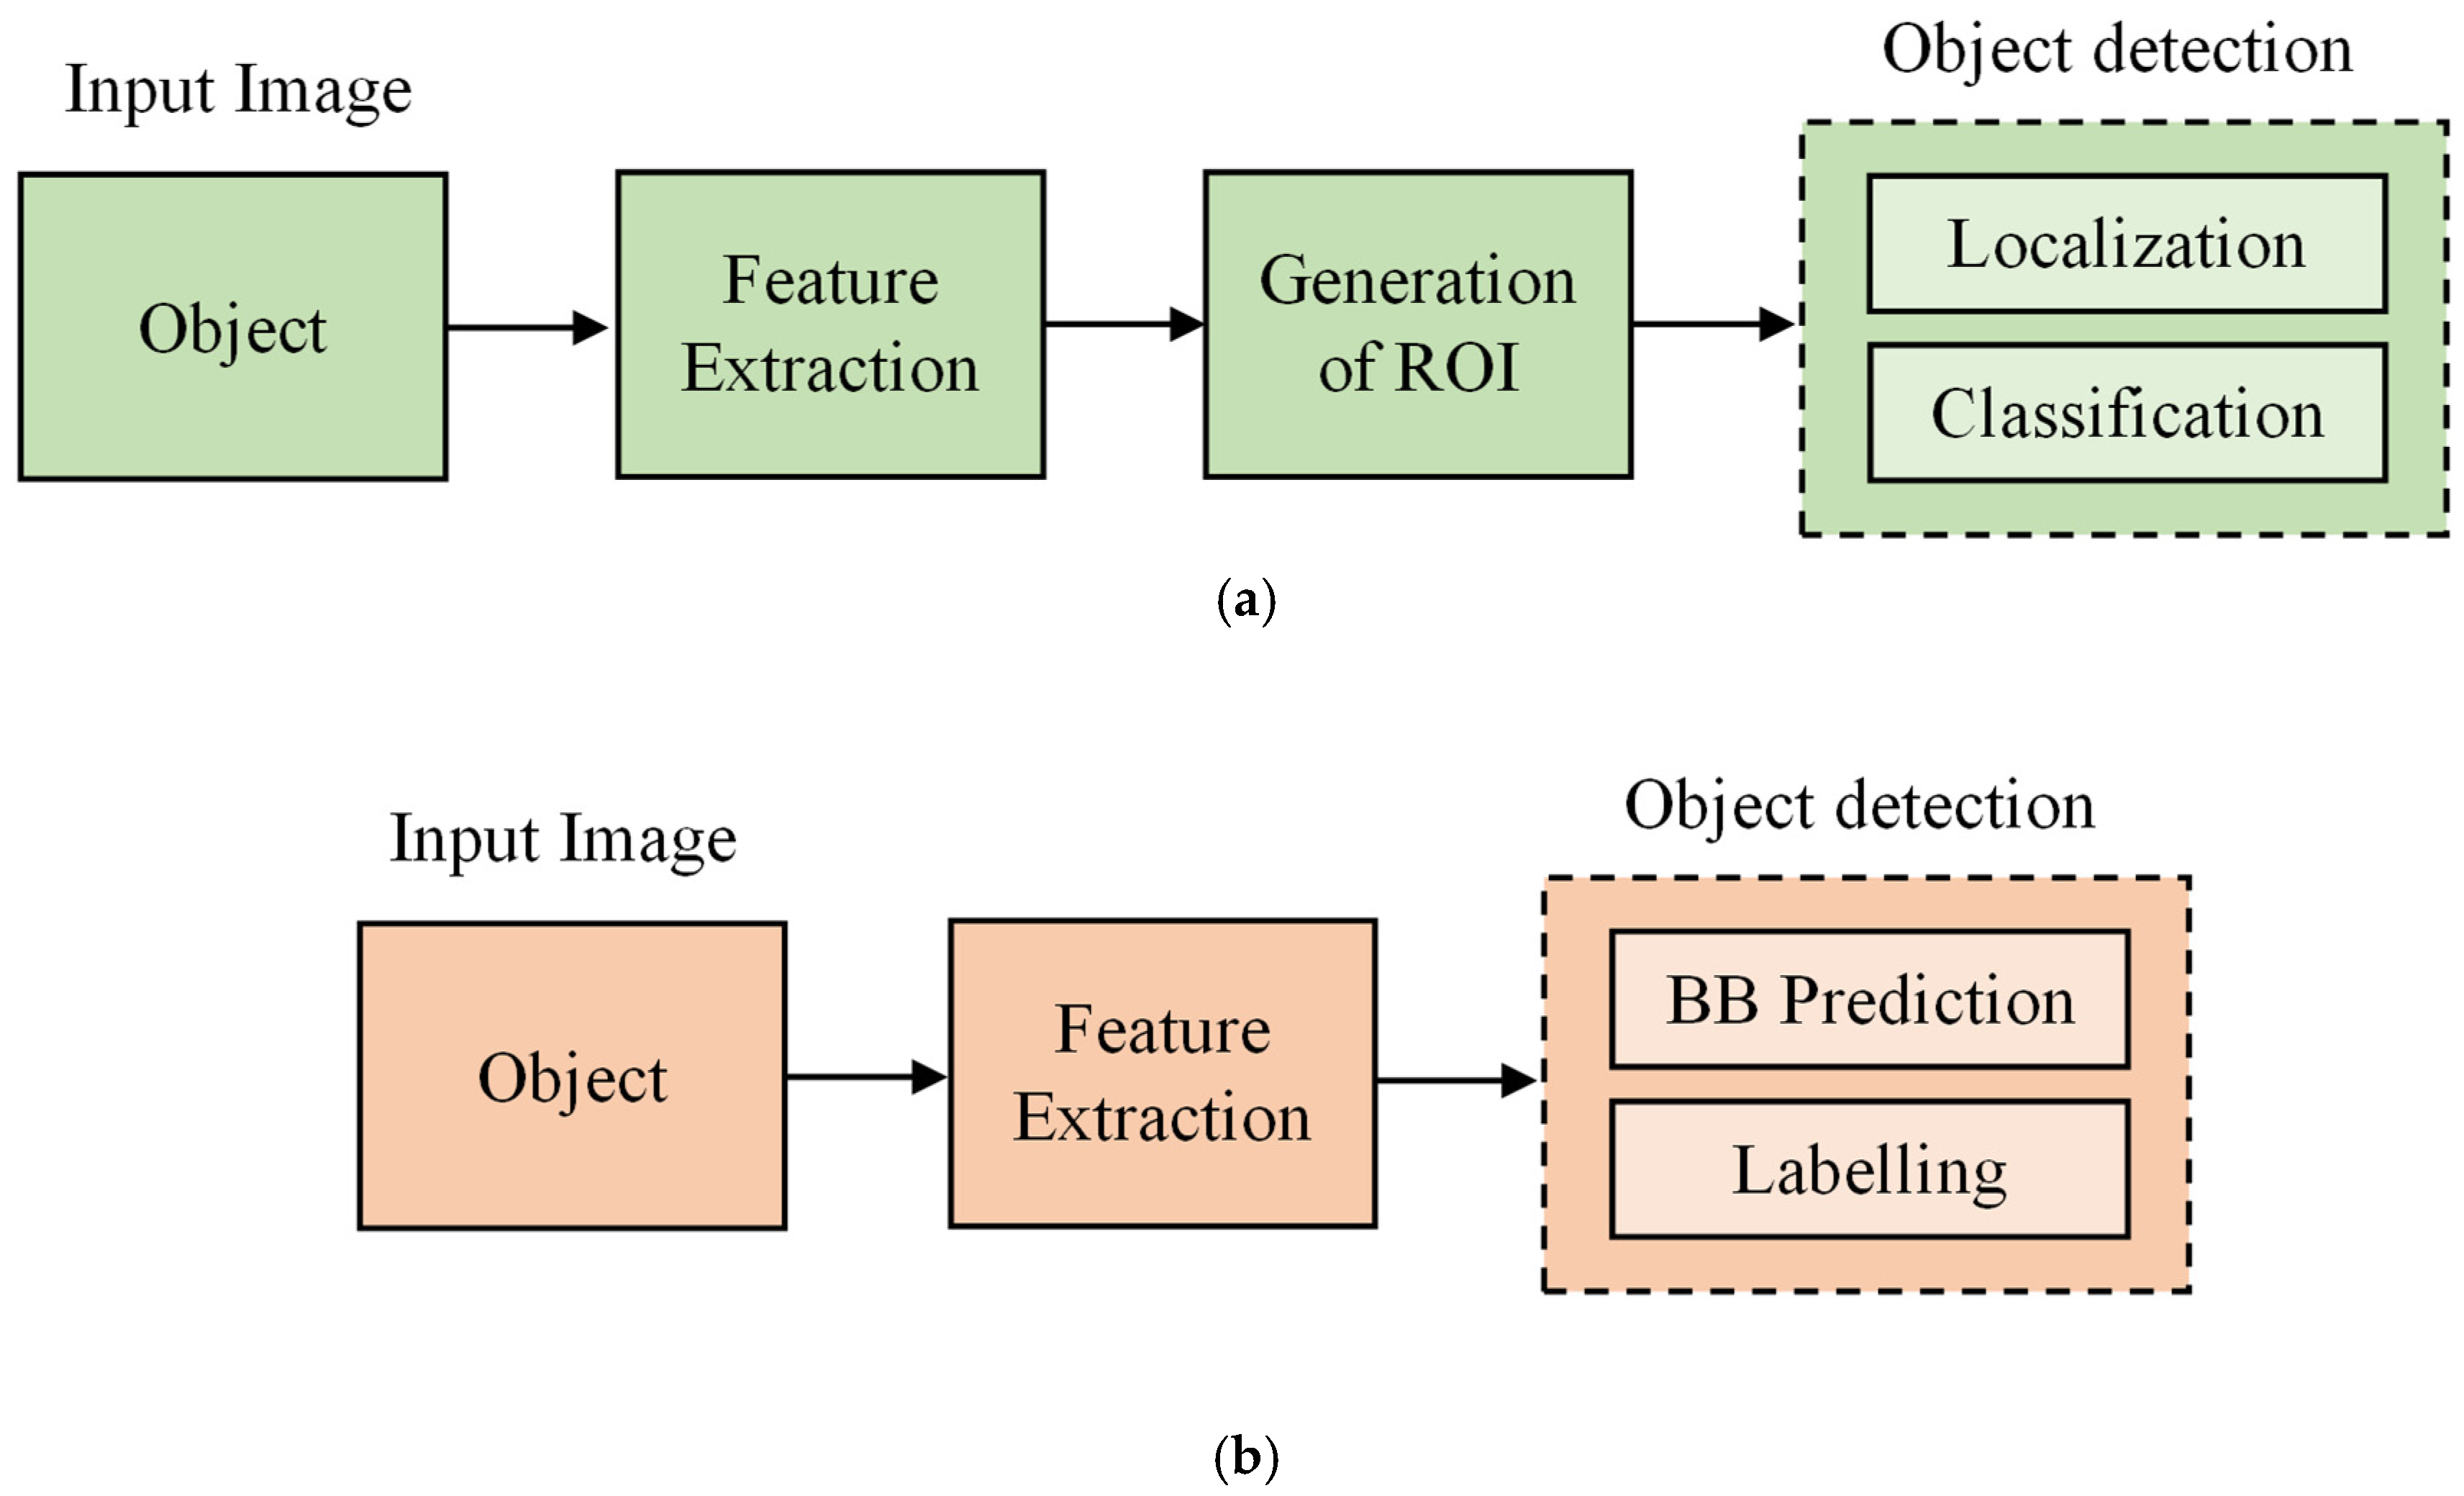
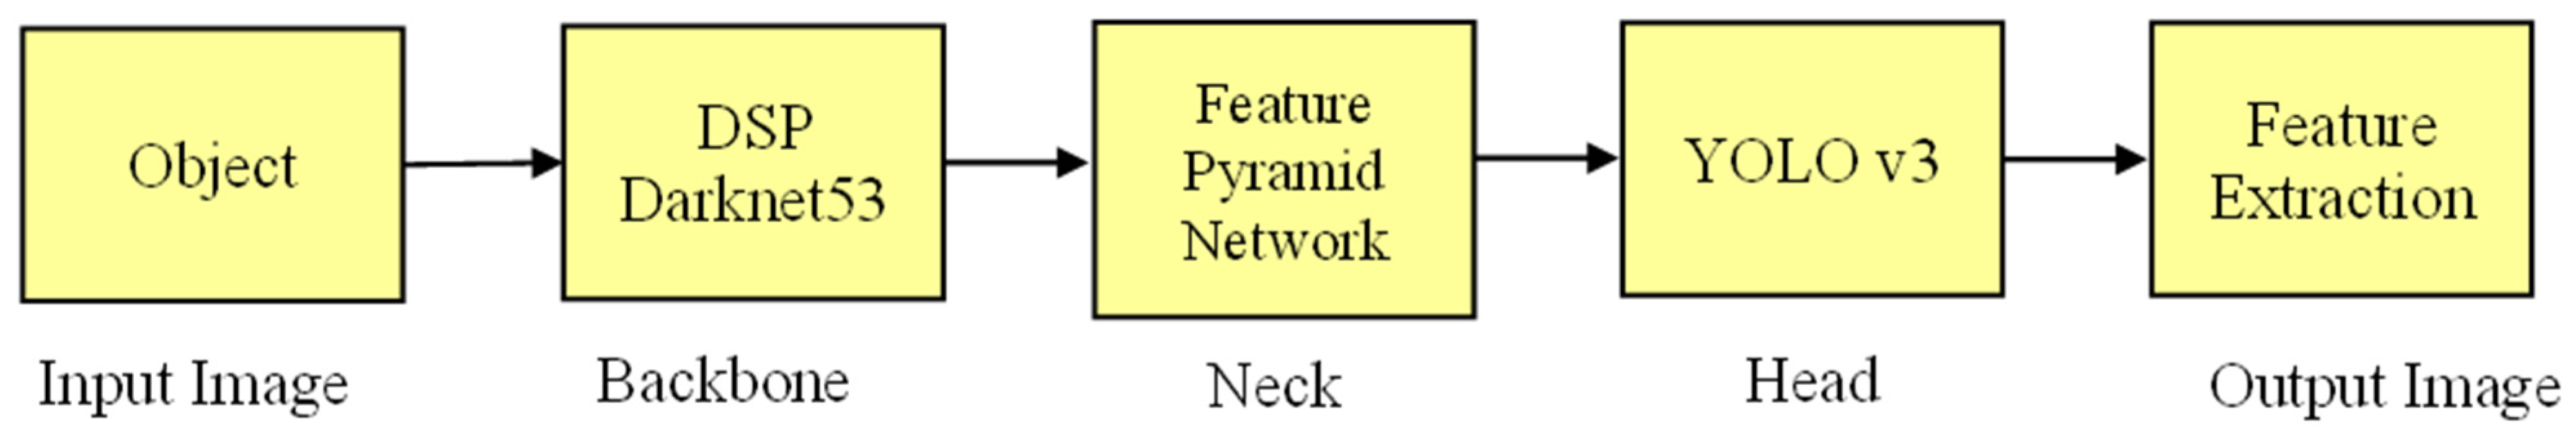
3. Object Detection Using YOLO
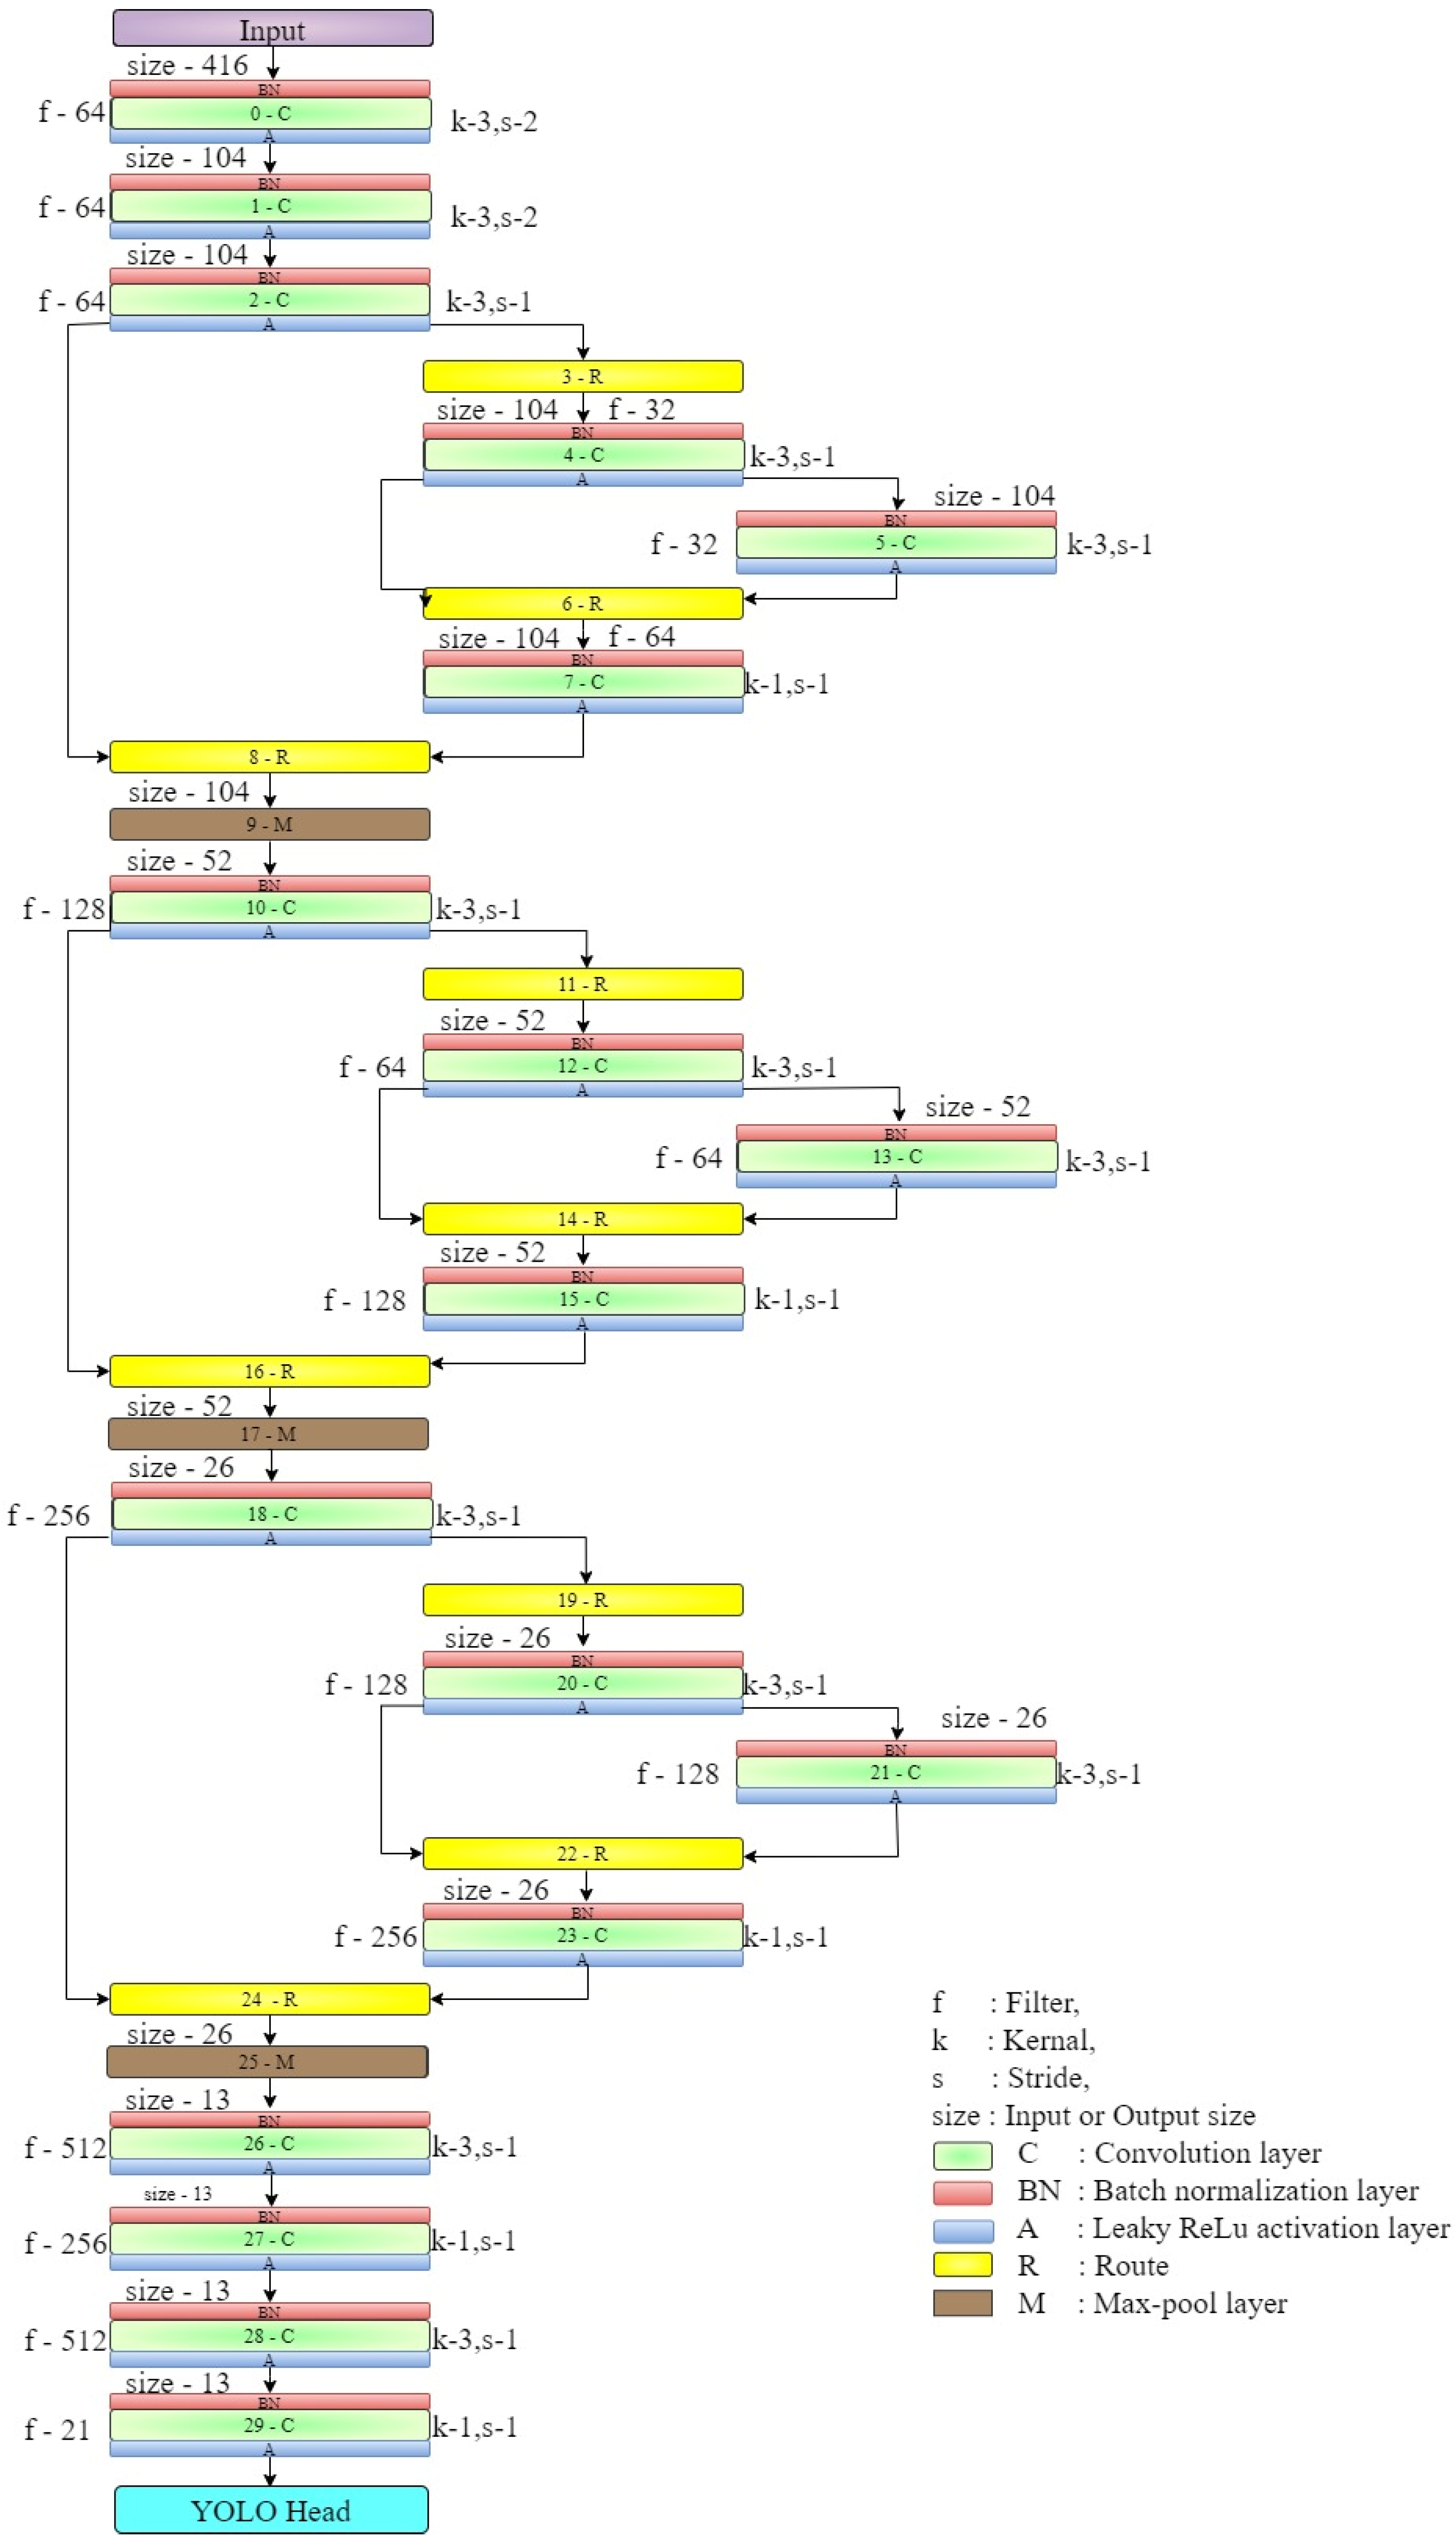
3.1. YOLOv4-Tiny Algorithm
- Clear visibility of cracks in the images selected for analysis.
- A dataset with flexure and shear crack of RC members with consistent image quality.
- The image will possess constant environmental factors, such as lighting.
3.2. Crack Detection Model
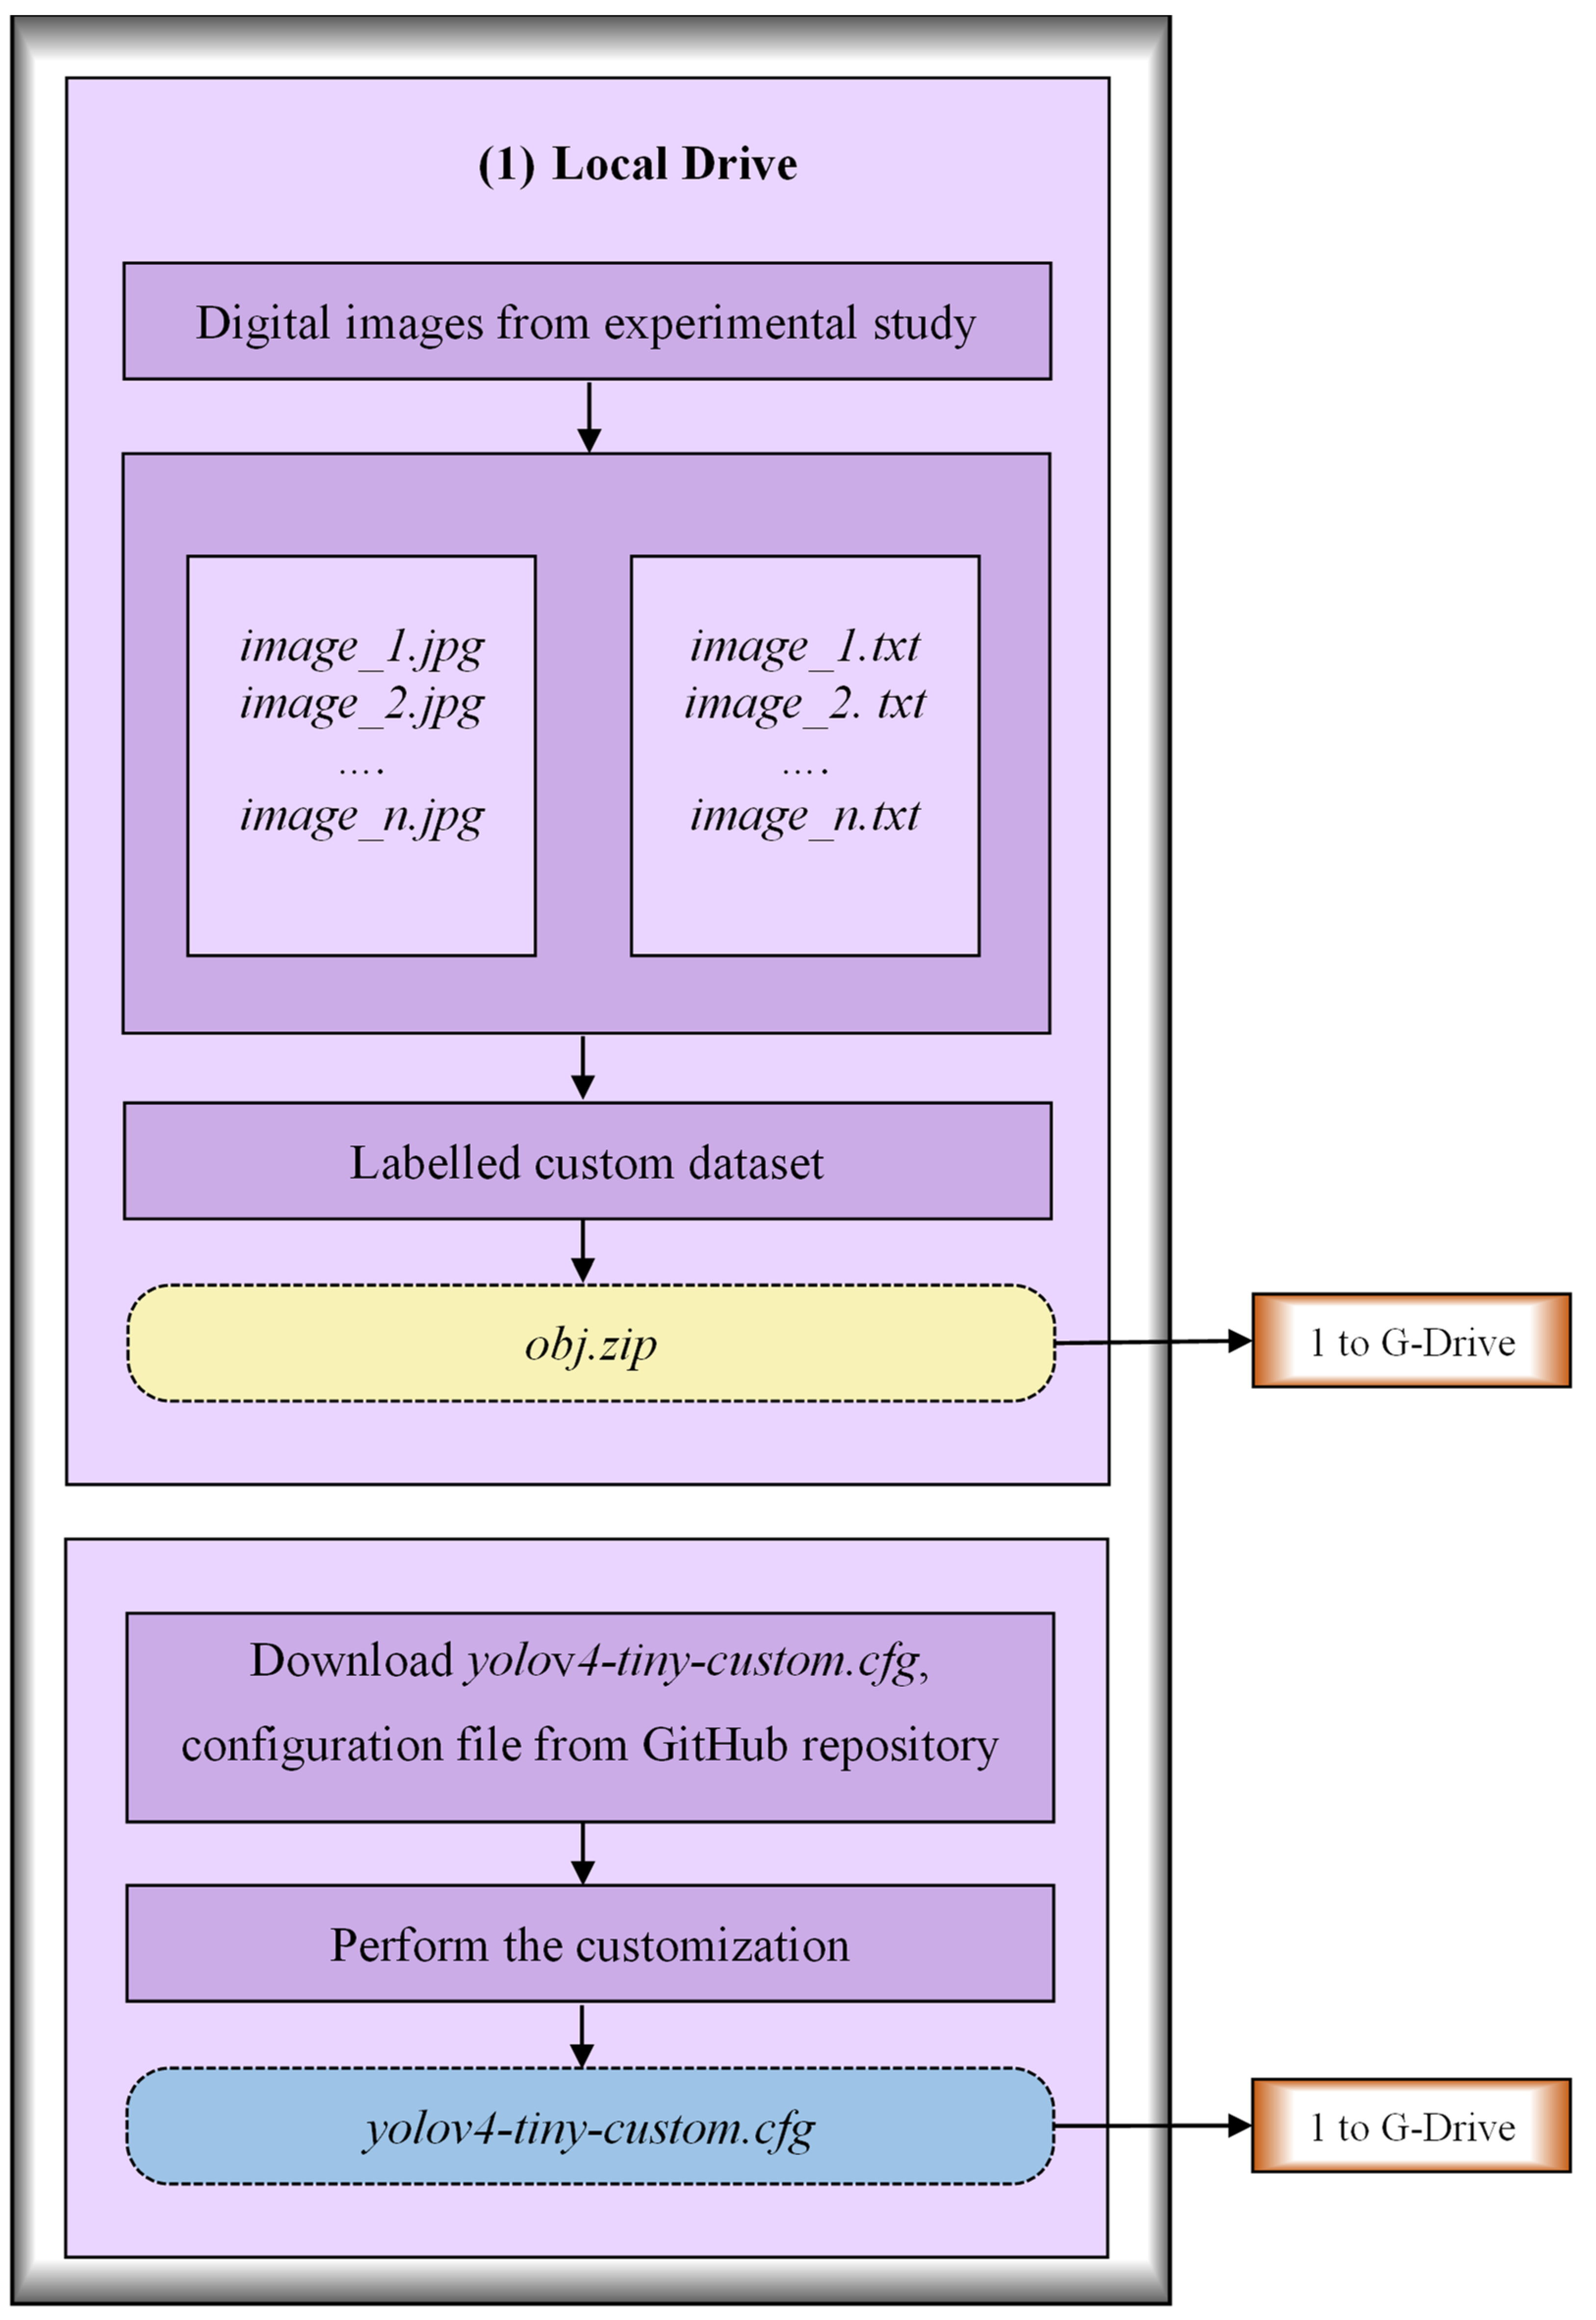
3.2.1. Creation of Labeled Custom Dataset
3.2.2. Customization of the Configuration File
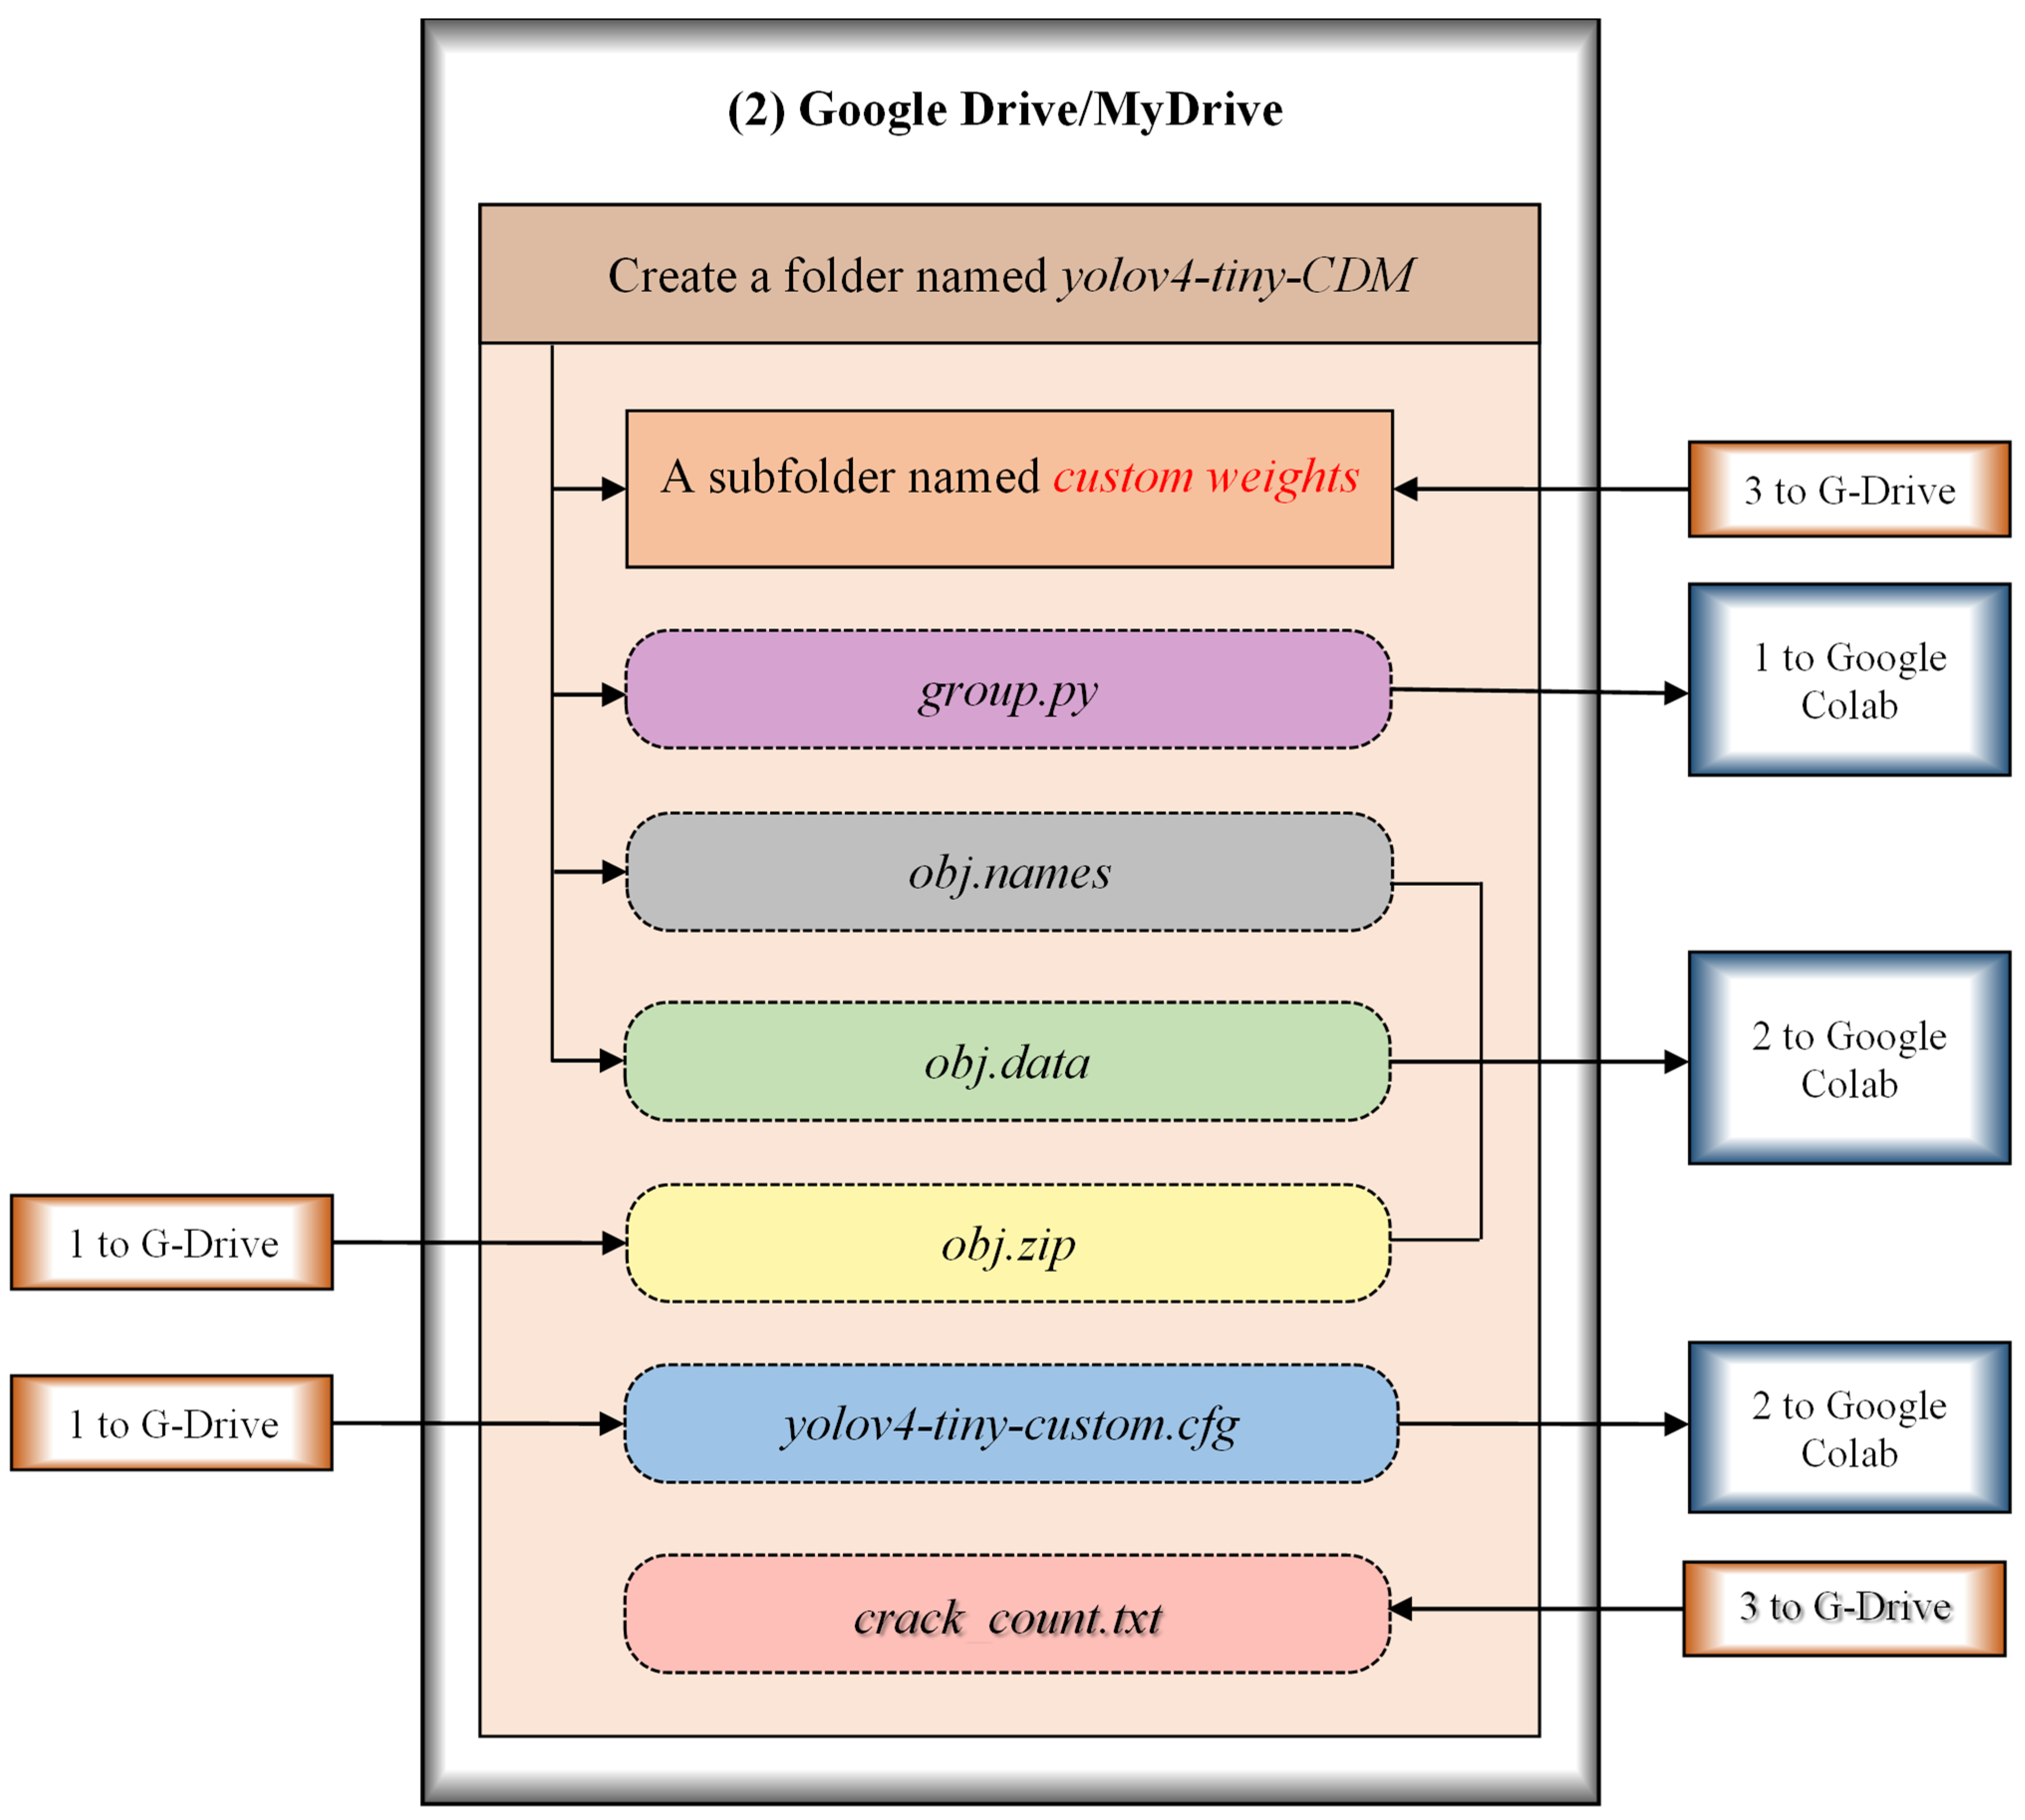
3.2.3. Preparation of Necessary Files and Folders in G-Drive
3.2.4. Building Darknet Directory and Grouping of Datasets
3.2.5. Training of the CDM
4. Results and Discussions
4.1. Training of the CDM
4.2. Testing of the CDM
4.3. Performance Evaluation of the CDM
4.3.1. Performance During Training
4.3.2. Performance During Testing
5. Conclusions
- The use of the YOLOv4-tiny-based CDM for RC members is highly accurate in detecting the total number of cracks as well as the types of cracks.
- The performance of the CDM was evaluated through standard evaluation metrics: intersection over union, F1 score, precision, recall, mean average precision, and confidence score. The average IOU score was found to be 82.93% for the set threshold of 0.5. However, it is very important to draw the bounding boxes precisely for the custom dataset images since the performance of the CDM highly depends on the ground truth images. The values of precision and recall and the F1 score for the CDM were found to be 0.83. The mean average precision was found to be 87.5%.
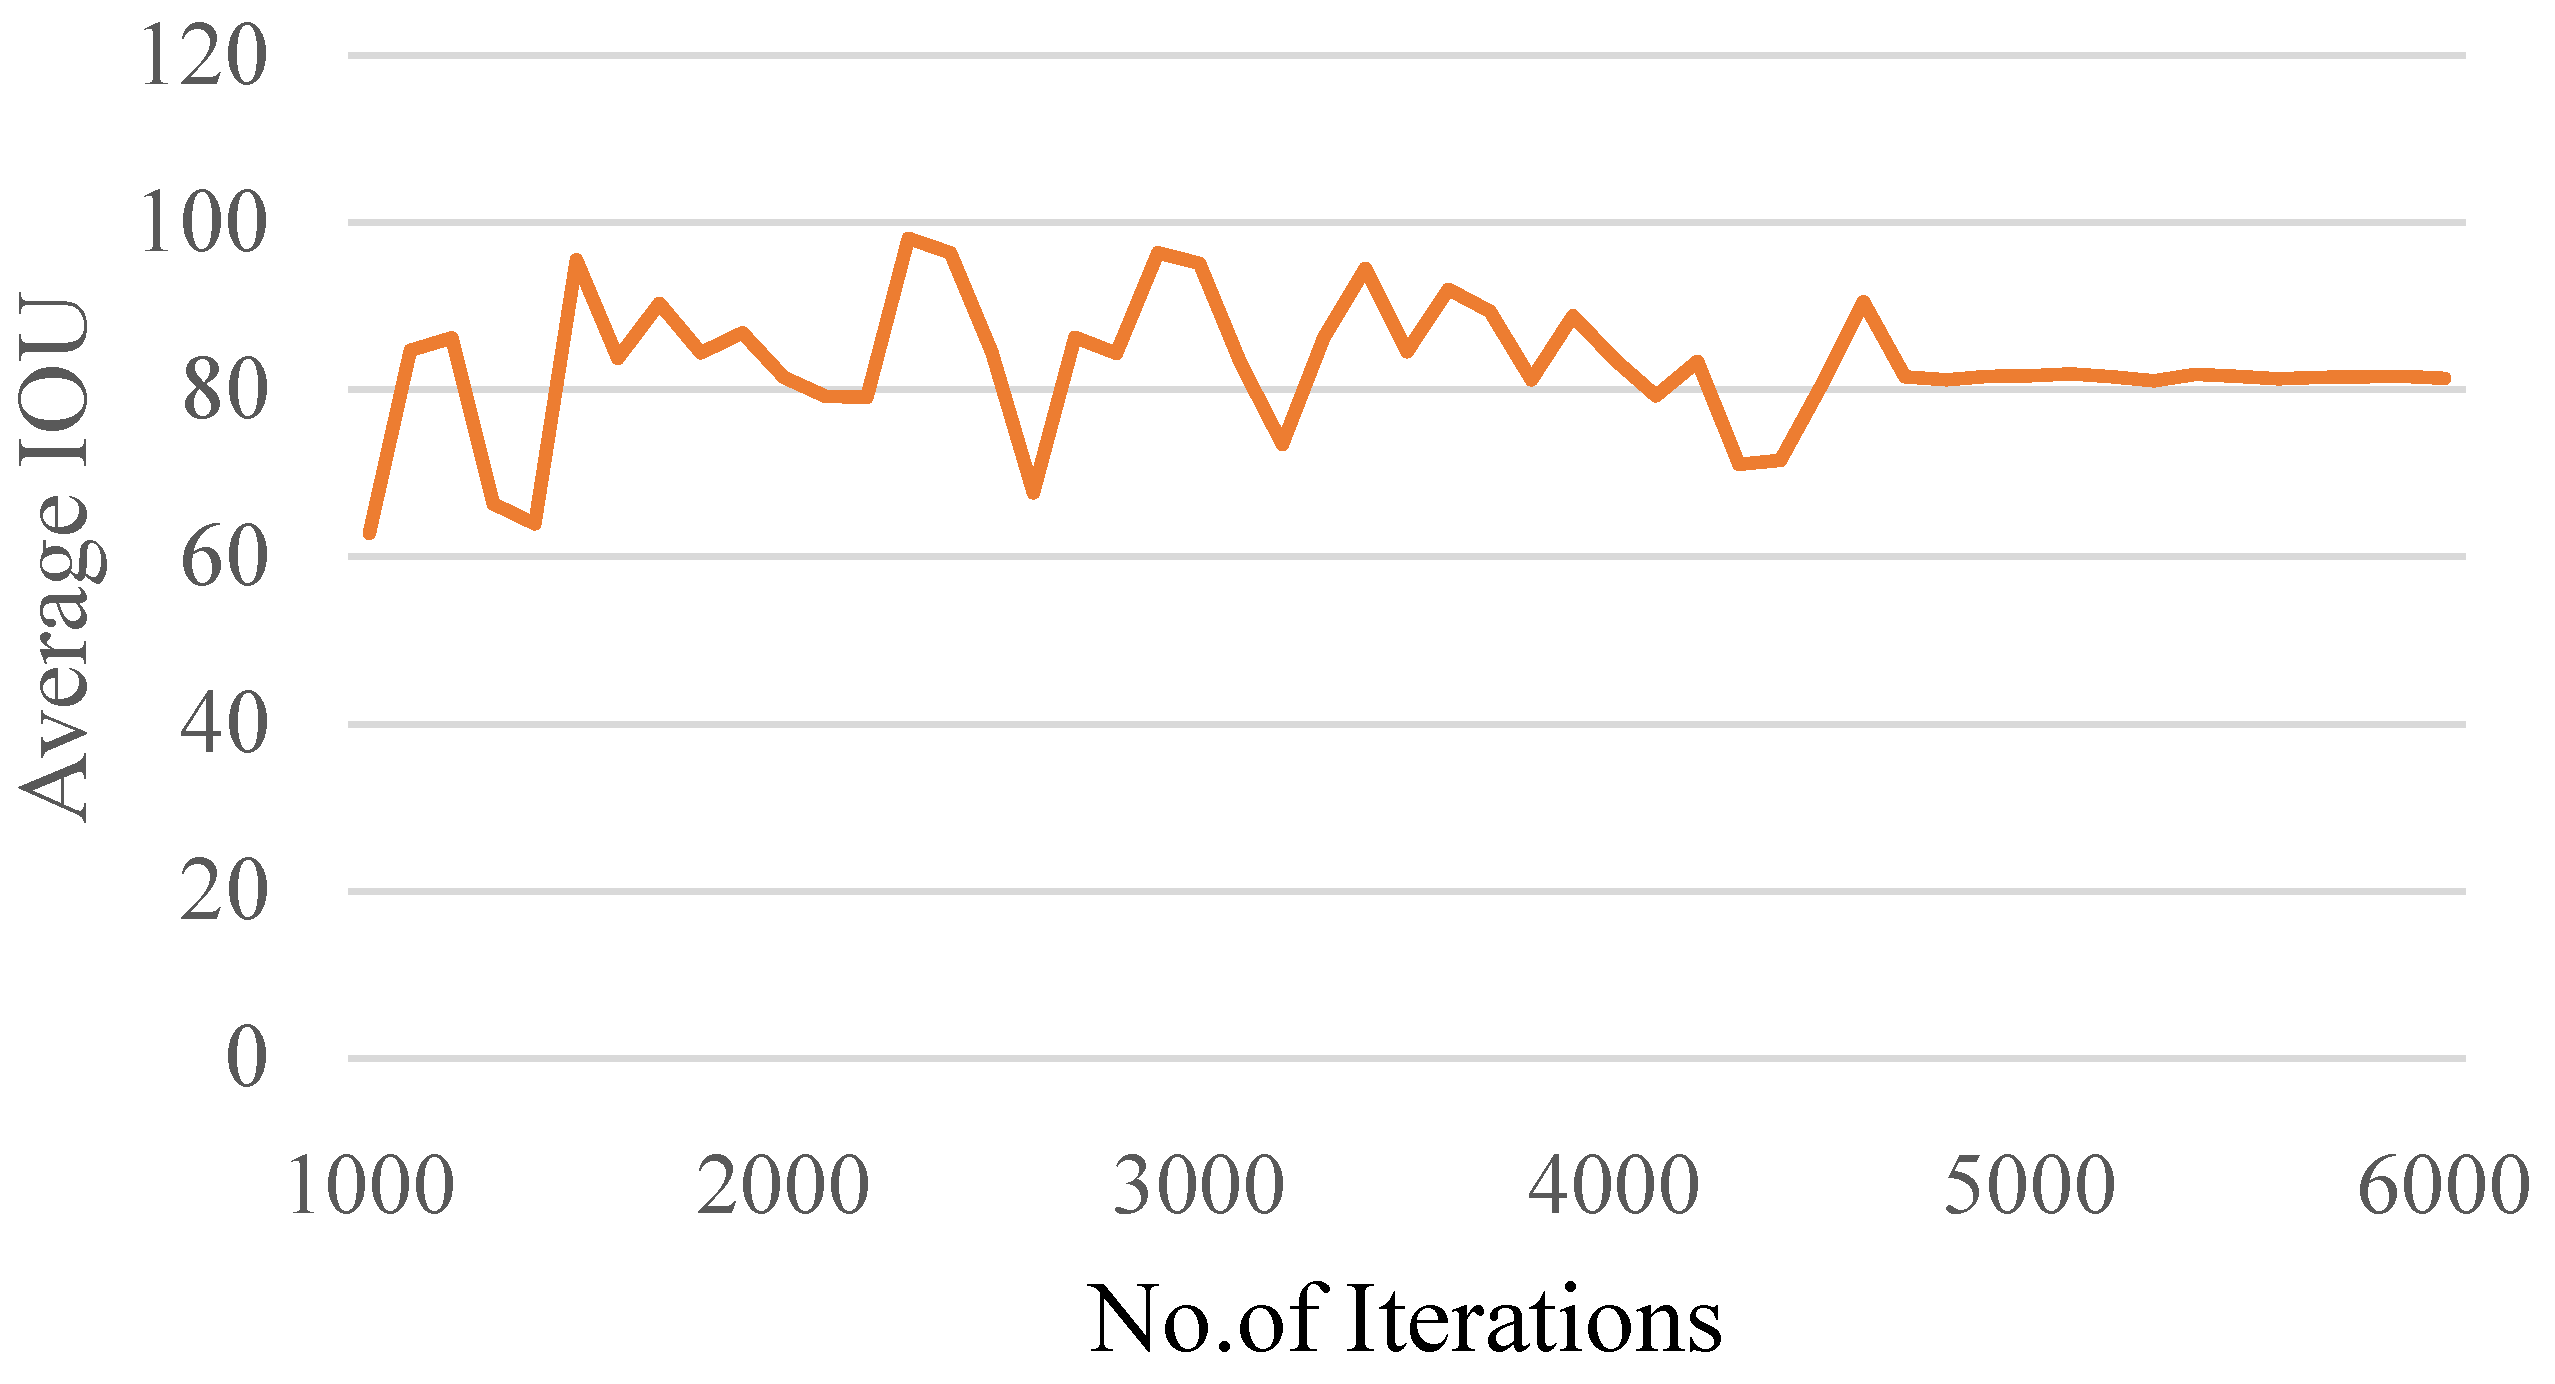
- The P, R, F1 score and mAP are stabilized within 5000 iterations. Therefore, 6000 iterations are sufficient to train the CDM. However, if the number of classes is greater than three, then the thumb rule 2* number of classes can be tried.
- For the gallery of test images, the mean confidence score obtained for the detection of flexure and shear cracks is 0.98 and 0.99, respectively.
- This work mainly focused on the cracks developed in beam elements exposed to four-point flexure, which creates flexure and shear cracks while bending. However, other types of cracks, like compression cracks, torsional cracks, corrosion cracks, etc., are also possible in structural elements. In future studies, the YOLOv4-tiny-based CDM can be extended to detect the above-mentioned cracks in images after training with the appropriate dataset.
- Recommendations for further work: The YOLOv4-tiny algorithm used in the present work can be adapted for detecting any type of crack, such as compression or torsional cracks. This can be accomplished through the expansion of the dataset with examples of new crack types. Moreover, the model needs to apply advanced data augmentation for crack diversity and modify training labels to differentiate between crack types. This can also be achieved by fine-tuning the model through transfer learning. However, care should be taken to optimize the anchor boxes and loss functions for irregular crack patterns. By incorporating these strategies, the YOLOv4-tiny algorithm can be effectively adapted to detect and classify a broader range of structural cracks. Considering the importance, the detection of cracks other than flexure-shear can be considered as the scope for further work.
- Additionally, the model will be refined for use in real-time structural assessment, allowing for continuous monitoring of critical infrastructure. By integrating these advanced features, the system will be more adaptable to diverse structural conditions and will offer more actionable insights for preventive maintenance and timely interventions, improving the overall safety and durability of concrete structures.
Author Contributions
Funding
Data Availability Statement
Conflicts of Interest
References
- Munawar, H.S.; Hammad, A.W.A.; Haddad, A.; Soares, C.A.P.; Waller, S.T. Image-Based Crack Detection Methods: A Review. Infrastructures 2021, 6, 115. [Google Scholar] [CrossRef]
- Rana, I.A.; Khaled, S.; Jamshed, A.; Nawaz, A. Social protection in disaster risk reduction and climate change adaptation: A bibliometric and thematic review. J. Integr. Environ. Sci. 2022, 19, 65–83. [Google Scholar] [CrossRef]
- Palevičius, P.; Pal, M.; Landauskas, M.; Orinait, U.; Timofejeva, I.; Ragulskis, M. Automatic Detection of Cracks on Concrete Surfaces in the Presence of Shadows. Sensors 2022, 22, 3662. [Google Scholar] [CrossRef] [PubMed]
- Kim, J.J.; Kim, A.-R.; Lee, S.-W. Artificial Neural Network-Based Automated Crack Detection and Analysis for the Inspection of Concrete Structures. Appl. Sci. 2020, 10, 8105. [Google Scholar] [CrossRef]
- Valença, J.; Puente, I.; Júlio, E.; González-Jorge, H.; Arias-Sánchez, P. Assessment of cracks on concrete bridges using image processing supported by laser scanning survey. Constr. Build. Mater. 2017, 146, 668–678. [Google Scholar] [CrossRef]
- Adhikari, R.S.; Moselhi, O.; Bagchi, A. Image-based retrieval of concrete crack properties for bridge inspection. Autom. Constr. 2014, 39, 180–194. [Google Scholar] [CrossRef]
- Park, S.E.; Eem, S.-H.; Jeon, H. Concrete crack detection and quantification using deep learning and structured light. Constr. Build. Mater. 2020, 252, 119096. [Google Scholar] [CrossRef]
- Valença, J.; Dias-da-Costa, D.; Júlio, E.; Araújo, H.; Costa, H. Automatic crack monitoring using photogrammetry and image processing. Measurement 2013, 46, 433–441. [Google Scholar] [CrossRef]
- Fujita, Y.; Hamamoto, Y. A robust automatic crack detection method from noisy concrete surfaces. Mach. Vis. Appl. 2011, 22, 245–254. [Google Scholar] [CrossRef]
- Mohan, A.; Poobal, S. Crack detection using image processing: A critical review and analysis. Alex. Eng. J. 2018, 57, 787–798. [Google Scholar] [CrossRef]
- Spencer, B.F., Jr.; Hoskere, V.; Narazaki, Y. Advances in Computer Vision-Based Civil Infrastructure Inspection and Monitoring. Engineering 2019, 5, 199–222. [Google Scholar] [CrossRef]
- Xu, Y.; Cai, Y.; Li, D.; Zhang, T. Building crack monitoring based on digital image processing. Frat. Integrità Strutt. 2020, 52, 1–8. [Google Scholar] [CrossRef]
- Rao, A.S.; Nguyen, T.; Palaniswami, M.; Ngo, T. Vision-based automated crack detection using convolutional neural networks for condition assessment of infrastructure. Struct. Health Monit. 2020, 20, 2124–2142. [Google Scholar] [CrossRef]
- Ali, R.; Chuah, J.H.; Talip, M.S.A.; Mokhtar, N.; Shoaib, M.A. Structural crack detection using deep convolutional neural networks. Autom. Constr. 2022, 133, 103989. [Google Scholar] [CrossRef]
- Wang, Y.; Zhang, J.Y.; Liu, J.X.; Zhang, Y.; Chen, Z.P.; Li, C.G.; He, K.; Yan, R.B. Research on Crack Detection Algorithm of the Concrete bridge based on image processing. Procedia Comput. Sci. 2019, 154, 610–616. [Google Scholar] [CrossRef]
- Abdel-Qader, I.; Abudayyeh, O.; Kelly, M.E. Analysis of Edge-Detection Techniques for Crack Identification in Bridges. J. Comput. Civ. Eng. 2003, 17, 255–263. [Google Scholar] [CrossRef]
- Rajadurai, R.-S.; Kang, S.-T. Automated Vision-Based Crack Detection on Concrete Surfaces Using Deep Learning. Appl. Sci. 2021, 11, 5229. [Google Scholar] [CrossRef]
- Miao, P.; Srimahachota, T. Cost-effective system for detection and quantification of concrete surface cracks by combination of convolutional neural network and image processing techniques. Constr. Build. Mater. 2021, 293, 123549. [Google Scholar] [CrossRef]
- Wenga, A.X.; Huanga, Y.; Wang, W. Assessment of the feasibility of detecting concrete cracks in images acquired by unmanned aerial vehicles. Autom. Constr. 2019, 105, 102819. [Google Scholar] [CrossRef]
- Aravind, N.; Nagajothi, S.; Elavenil, S. Machine learning model for predicting the crack detection and pattern recognition of geopolymer concrete beams. Constr. Build. Mater. 2021, 297, 123785. [Google Scholar] [CrossRef]
- Zhang, A.; Wang, K.C.P.; Li, B.; Yang, E.; Dai, X.; Peng, Y.; Fei, Y.; Liu, Y.; Li, J.Q.; Chen, C. Automated Pixel-Level Crack Detection on 3D Asphalt Surfaces Using a Deep-Learning Network. Comput.-Aided Civ. Infrastruct. Eng. 2017, 32, 805–819. [Google Scholar] [CrossRef]
- Chun, P.-J.; Izumi, S.; Yamane, T. Automatic detection method of cracks from concrete surface imagery using two-step light gradient boosting machine. Comput.-Aided Civ. Infrastruct. Eng. 2020, 36, 61–72. [Google Scholar] [CrossRef]
- Sarker, I.H. Deep Learning: A Comprehensive Overview on Techniques, Taxonomy, Applications and Research Directions. Comput. Sci. 2021, 2, 420. [Google Scholar] [CrossRef] [PubMed]
- Yao, Y.H. Feature Extraction and Image Recognition with Convolutional Neural Networks. IOP Conf. Ser. J. Phys. Conf. Ser. 2018, 1087, 062032. [Google Scholar] [CrossRef]
- Liu, F.; Wang, L. Net-based model for crack detection integrating visual explanations. Constr. Build. Mater. 2022, 322, 126265. [Google Scholar] [CrossRef]
- Hacıefendioğlu, K.; Başağa, H.B.; Kahya, V.; Özgan, K.; Altunışık, A.C. Automatic Detection of Collapsed Buildings after the 6 February 2023 Türkiye Earthquakes Using Post-Disaster Satellite Images with Deep Learning-Based Semantic Segmentation Models. Buildings 2024, 14, 582. [Google Scholar] [CrossRef]
- Ye, W.; Deng, S.; Ren, J.; Xu, X.; Zhang, K.; Du, W. Deep learning-based fast detection of apparent concrete crack in slab tracks with dilated convolution. Constr. Build. Mater. 2022, 329, 127157. [Google Scholar] [CrossRef]
- Su, C.; Wang, W. Concrete Cracks Detection Using Convolutional Neural Network Based on Transfer Learning. Hindawi Math. Probl. Eng. 2020, 2020, 7240129. [Google Scholar] [CrossRef]
- Ali, L.; Alnajjar, F.; Al Jassmi, H.; Gocho, M.; Khan, W.; Serhani, M.A. Performance Evaluation of Deep CNN-Based Crack Detection and Localization Techniques for Concrete Structures. Sensors 2021, 21, 1688. [Google Scholar] [CrossRef]
- Yao, G.; Sun, Y.; Wong, M.; Lv, X. A Real-Time Detection Method for Concrete Surface Cracks Based on Improved YOLOv4. Symmetry 2021, 13, 1716. [Google Scholar] [CrossRef]
- Guo, C.; Lv, X.L.; Zhang, Y.; Zhang, M.L. Improved YOLOv4-tiny network for real-time electronic component detection. Sci. Rep. 2021, 11, 22744. [Google Scholar] [CrossRef] [PubMed]
- de Menezes, R.S.T.; Magalhaes, R.M.; Maia, H. Object Recognition Using Convolutional Neural Networks. In Recent Trends in Artificial Neural Networks—From Training to Prediction; IntechOpen: London, UK, 2019. [Google Scholar] [CrossRef]
- Zhou, X.; Koltun, V.; Krahenbühl, P. Probabilistic two-stage detection. arXiv 2013, arXiv:2103.07461v1. [Google Scholar]
- Du, Y.; Pan, N.; Xu, Z.; Deng, F.; Shen, Y.; Kang, H. Pavement distress detection and classification based on YOLO network. Int. J. Pavement Eng. 2020, 22, 1659–1672. [Google Scholar] [CrossRef]
- Li, Y.; Han, Z.; Xu, H.; Liu, L.; Li, X.; Zhang, K. YOLOv3-Lite: A Lightweight Crack Detection Network for Aircraft Structure Based on Depthwise Separable Convolutions. Appl. Sci. 2019, 9, 3781. [Google Scholar] [CrossRef]
- Wu, P.; Liu, A.; Fu, J.; Ye, X.; Zhao, Y. Autonomous surface crack identification of concrete structures based on an improved one-stage object detection algorithm. Eng. Struct. 2022, 272, 114962. [Google Scholar] [CrossRef]
- Jiang, Y.; Pang, D.; Li, C. A deep learning approach for fast detection and classification of concrete damage. Autom. Constr. 2021, 128, 103785. [Google Scholar] [CrossRef]
- Tran, T.V.; Nguyen-Xuan, H.; Zhuang, X. Investigation of crack segmentation and fast evaluation of crack propagation, based on deep learning. Front. Struct. Civ. Eng. 2024, 18, 516–535. [Google Scholar] [CrossRef]
- Dong, X.; Liu, Y.; Dai, J. Concrete Surface Crack Detection Algorithm Based on Improved YOLOv8. Sensors 2024, 24, 5252. [Google Scholar] [CrossRef]
- Kheradmandi, N.; Mehranfar, V. A critical review and comparative study on image segmentation-based techniques for pavement crack detection. Constr. Build. Mater. 2022, 321, 126162. [Google Scholar] [CrossRef]
- Redmon, J.; Divvala, S.; Girshick, R.; Farhadi, A. You Only Look Once: Unified, Real-Time Object Detection. In Proceedings of the IEEE Conference on Computer Vision and Pattern Recognition, Las Vegas, NV, USA, 27–30 June 2016. [Google Scholar] [CrossRef]
- Montalbo, F.J.P. A Computer-Aided Diagnosis of Brain Tumors Using a Fine-Tuned YOLO-based Model with Transfer Learning. KSII Trans. Internet Inf. Syst. 2020, 14, 4816–4834. [Google Scholar] [CrossRef]
- Brindha, U.; Maheswaran, J.; Chellapandian, M.; Arunachelam, N. Quantitative Assessment of Strengthening Strategies and Design Recommendations for the Repair of Corrosion-Damaged Reinforced Concrete Members. Buildings 2023, 13, 1080. [Google Scholar] [CrossRef]
- Maheswaran, J.; Chellapandian, M.; Arunachelam, N. Retrofitting of severely damaged RC members using fiber reinforced polymer composites: A comprehensive review. Structures 2022, 38, 1257–1276. [Google Scholar] [CrossRef]
- Chellapandian, M.; Maheswaran, J.; Arunachelam, N.; Prem Kumar, N. Shear Behavior of Low-Cost and Sustainable Bio-Fiber based Engineered Cementitious Composite Beams –Experimental and Theoretical Studies. J. Build. Eng. 2024, 84, 108497. [Google Scholar] [CrossRef]
- Maheswaran, J.; Chellapandian, M.; Arunachelam, N.; Hari, M.N.T. Thermal and Durability Characteristics of Optimized Green Concrete Developed using Slag Powder and Pond Ash. Mater. Res. Express 2023, 10, 095503. [Google Scholar] [CrossRef]
- Maheswaran, J.; Chellapandian, M.; Subramanian, M.V.R.; Murali, G.; Vatin, N.I. Experimental and Numerical Investigation of Shear Behavior of Engineered Cementitious Composite Beams Comprising Fibers. Materials 2022, 15, 5059. [Google Scholar] [CrossRef]
- Arulanandam, P.M.; Subramanian, M.V.R.; Chellapandian, M.; Murali, G.; Vatin, N.I. Analytical and Numerical Investigation of the Behavior of Engineered Cementitious Composite Members under Shear Loads. Materials 2022, 15, 4640. [Google Scholar] [CrossRef]
- Available online: https://github.com/heartexlabs/labelImg#labelimg (accessed on 1 July 2022).
- Available online: https://github.com/AlexeyAB/darknet (accessed on 1 July 2022).


| S. No. | Beam Specimen | a/d Ratio | First Crack | At Ultimate Load | Failure Modes | |||
|---|---|---|---|---|---|---|---|---|
| Load (kN) | Displ. (mm) | Stiffness (kN/mm) | Load (kN) | Displ. (mm) | ||||
| 1 | B1 | 5.00 | 40.0 | 1.18 | 33.89 | 131.21 | 10.92 | Flexure |
| 2 | B2 | 4.20 | 20.0 | 2.11 | 9.45 | 166.71 | 21.75 | Flexure and Shear |
| 3 | B3 | 3.70 | 30.0 | 1.18 | 25.42 | 167.50 | 24.13 | Flexure and Shear |
| 4 | B4 | 3.14 | 20.0 | 1.33 | 15.04 | 128.96 | 12.8 | Shear |
| Parameter | Value | Path |
|---|---|---|
| classes | 2 | - |
| train | - | data/train.txt |
| valid | - | data/test.txt |
| names | - | data/obj.names |
| backup | - | /mydrive/CDM/custom-weights |
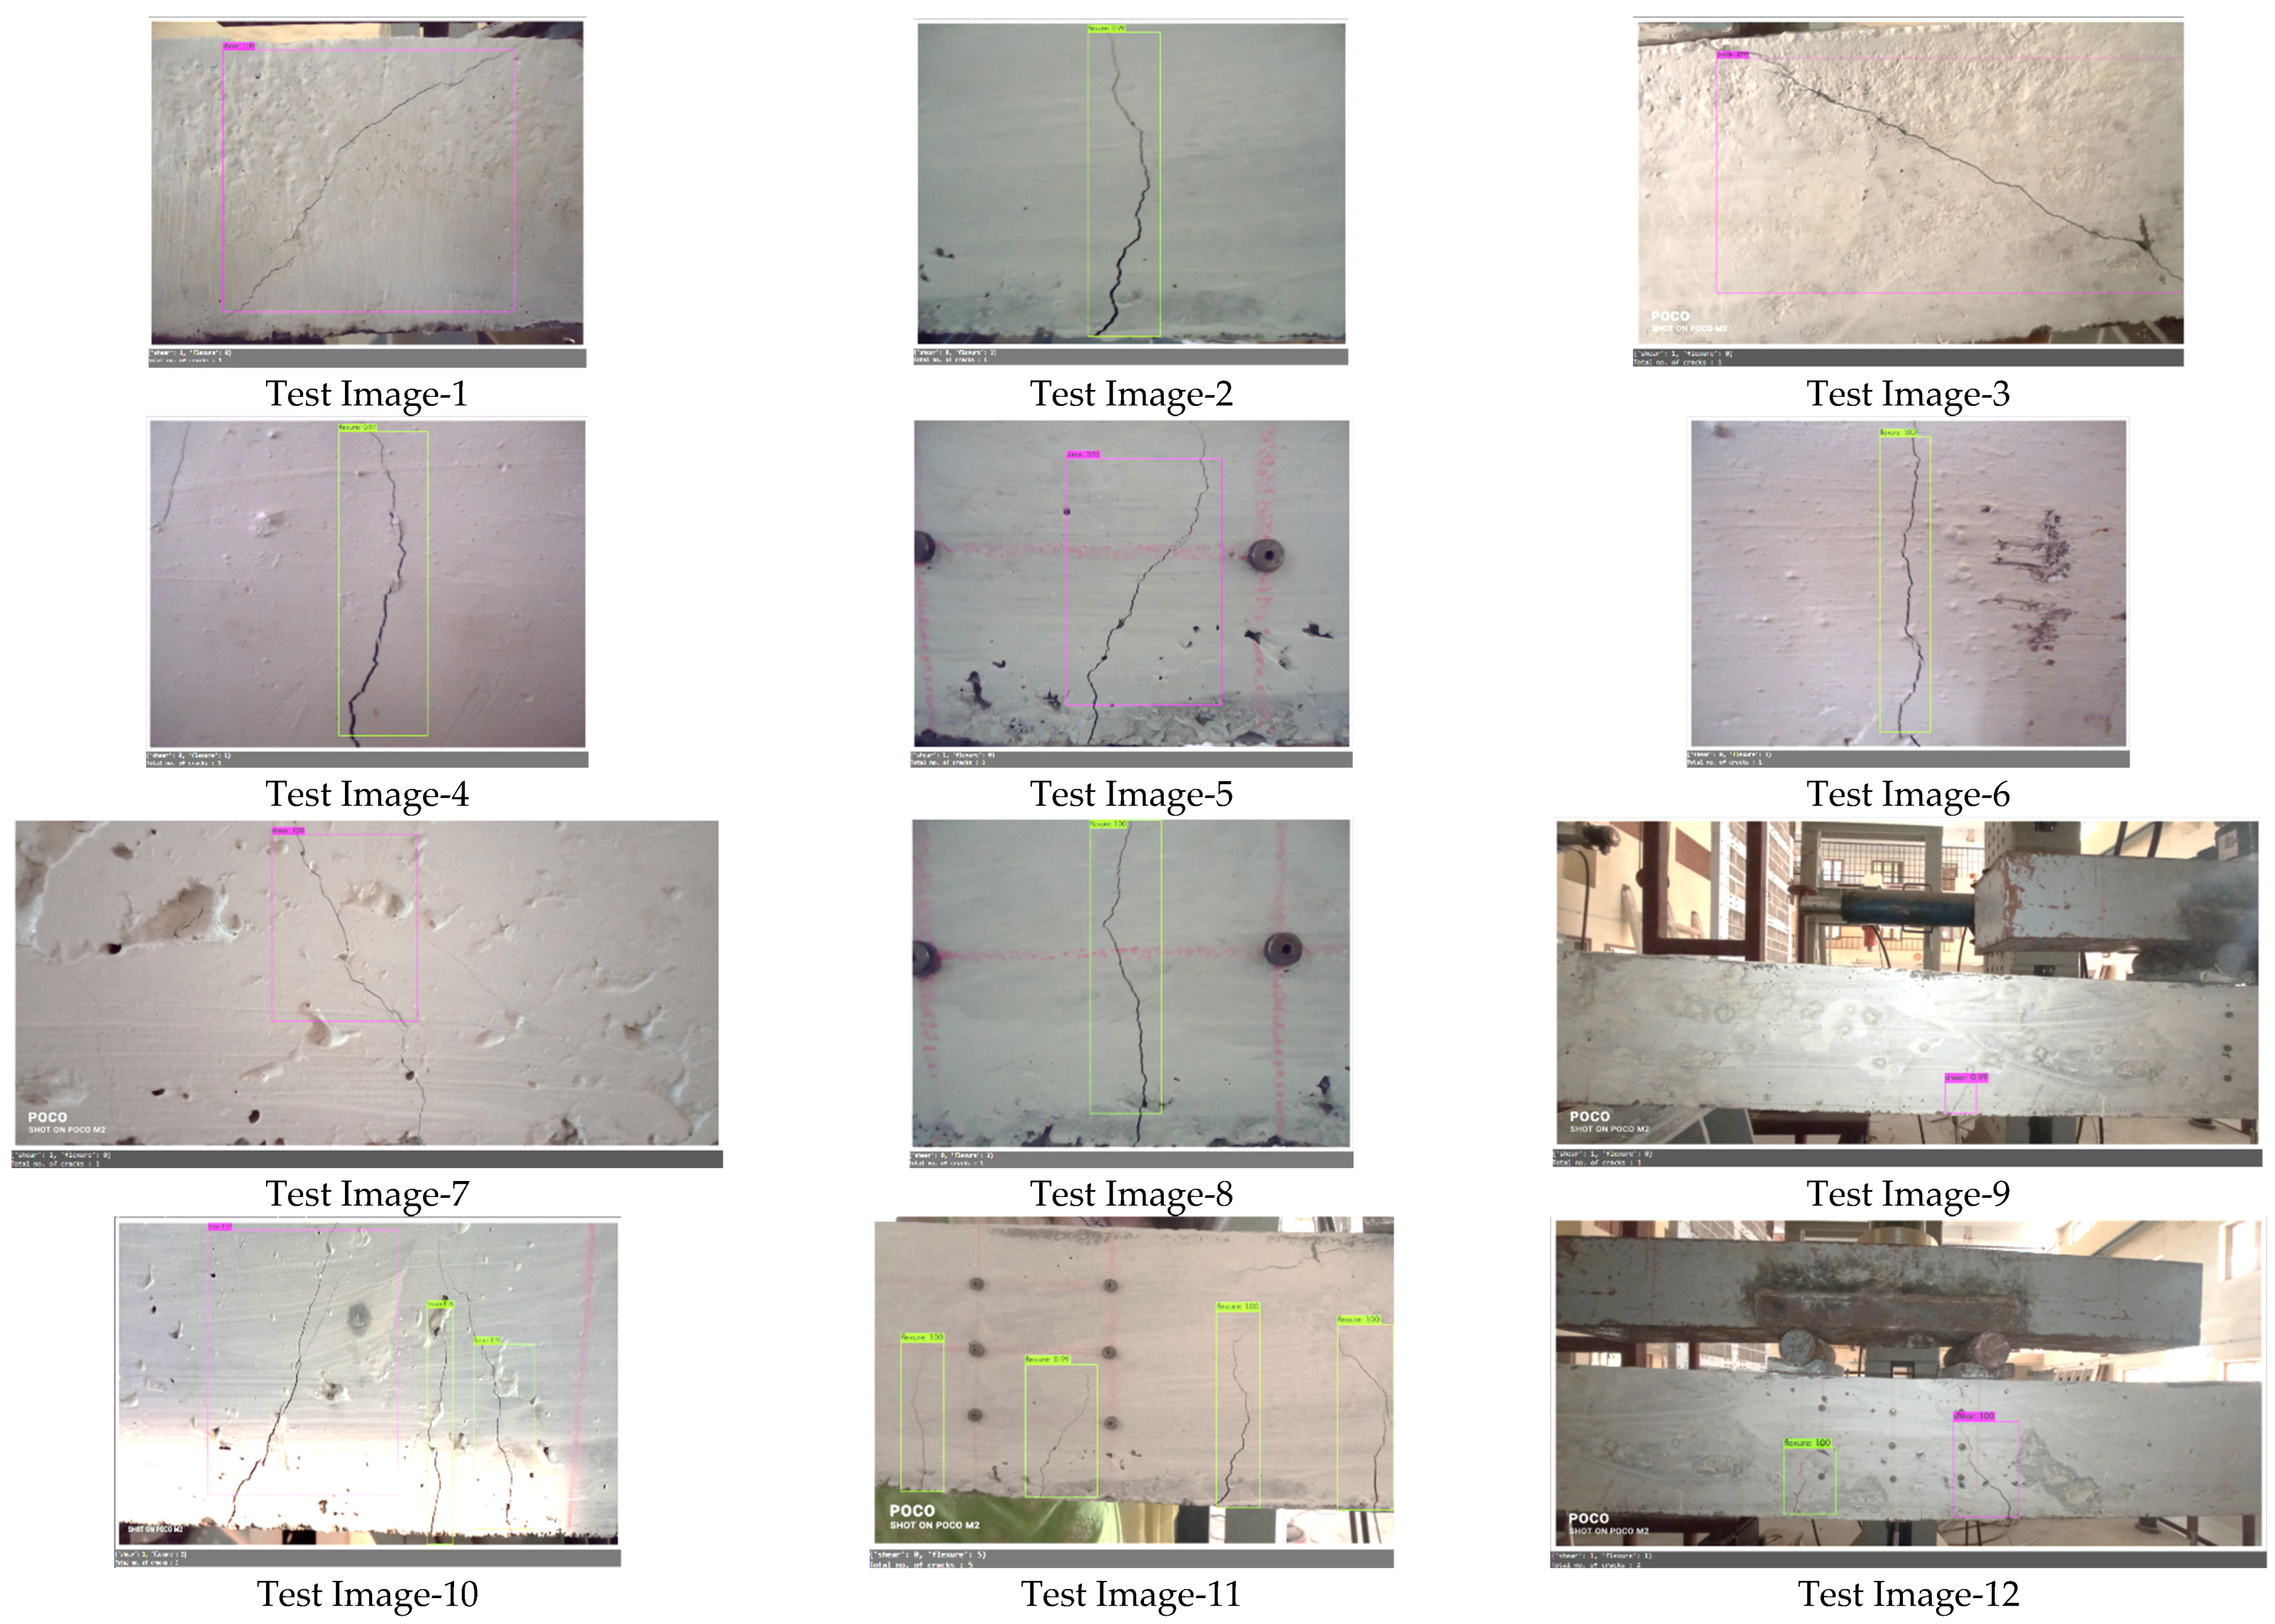
| Image | No. of Cracks Present | Crack Type | CS |
|---|---|---|---|
| Test Image-1 | 1 | Shear | 1.00 |
| Test Image-2 | 1 | Flexure | 0.97 |
| Test Image-3 | 1 | Shear | 0.99 |
| Test Image-4 | 1 | Flexure | 0.98 |
| Test Image-5 | 1 | Shear | 0.96 |
| Test Image-6 | 1 | Flexure | 0.97 |
| Test Image-7 | 1 | Shear | 0.96 |
| Test Image-8 | 1 | Flexure | 1.00 |
| Test Image-9 | 1 | Shear | 1.00 |
| Test Image-10 | 3 | Shear | 0.99 |
| Flexure | 1.00 | ||
| Test Image-11 | 3 | Flexure | 1.00 |
| Flexure | 0.99 | ||
| Flexure | 0.99 | ||
| Test Image-12 | 2 | Flexure | 1.00 |
| Shear | 1.00 | ||
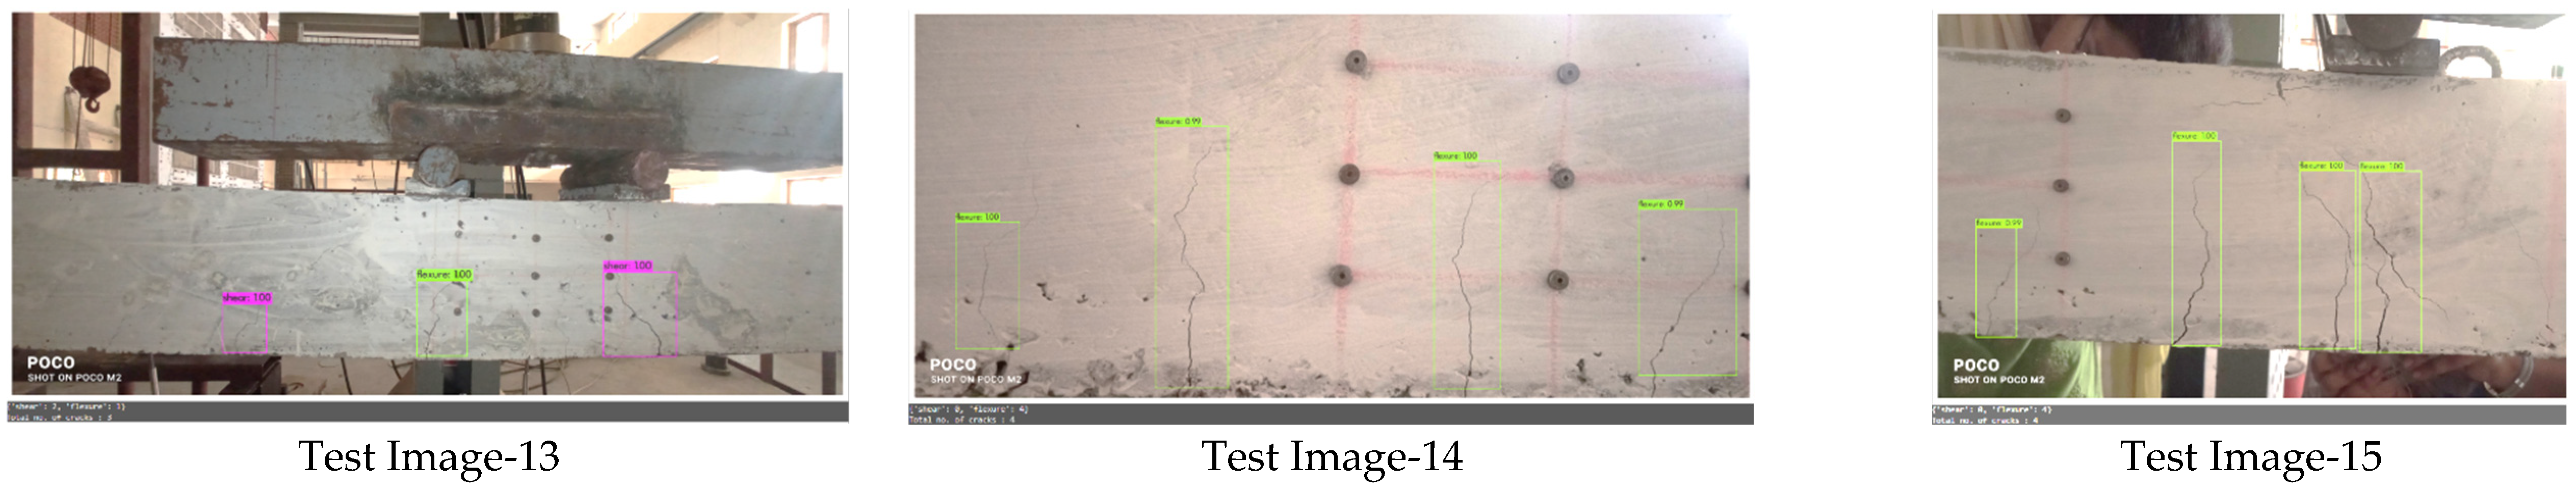
| Test Image-13 | 2 | Shear | 0.98 |
| Flexure | 1.00 | ||
| Test Image-14 | 2 | Flexure | 1.00 |
| Flexure | 1.00 | ||
| Test Image-15 | 4 | Flexure | 0.94 |
| Flexure | 0.99 | ||
| Flexure | 1.00 | ||
| Flexure | 0.99 | ||
| Mean | 0.99 | ||
| Maximum | 1.00 | ||
| Minimum | 0.94 |
Disclaimer/Publisher’s Note: The statements, opinions and data contained in all publications are solely those of the individual author(s) and contributor(s) and not of MDPI and/or the editor(s). MDPI and/or the editor(s) disclaim responsibility for any injury to people or property resulting from any ideas, methods, instructions or products referred to in the content. |
© 2024 by the authors. Licensee MDPI, Basel, Switzerland. This article is an open access article distributed under the terms and conditions of the Creative Commons Attribution (CC BY) license (https://creativecommons.org/licenses/by/4.0/).
Share and Cite
Rajesh, S.; Jinesh Babu, K.S.; Chengathir Selvi, M.; Chellapandian, M. Automated Surface Crack Identification of Reinforced Concrete Members Using an Improved YOLOv4-Tiny-Based Crack Detection Model. Buildings 2024, 14, 3402. https://doi.org/10.3390/buildings14113402
Rajesh S, Jinesh Babu KS, Chengathir Selvi M, Chellapandian M. Automated Surface Crack Identification of Reinforced Concrete Members Using an Improved YOLOv4-Tiny-Based Crack Detection Model. Buildings. 2024; 14(11):3402. https://doi.org/10.3390/buildings14113402
Chicago/Turabian StyleRajesh, Sofía, K. S. Jinesh Babu, M. Chengathir Selvi, and M. Chellapandian. 2024. "Automated Surface Crack Identification of Reinforced Concrete Members Using an Improved YOLOv4-Tiny-Based Crack Detection Model" Buildings 14, no. 11: 3402. https://doi.org/10.3390/buildings14113402
APA StyleRajesh, S., Jinesh Babu, K. S., Chengathir Selvi, M., & Chellapandian, M. (2024). Automated Surface Crack Identification of Reinforced Concrete Members Using an Improved YOLOv4-Tiny-Based Crack Detection Model. Buildings, 14(11), 3402. https://doi.org/10.3390/buildings14113402