Abstract
Transmission towers in service are highly susceptible to corrosion caused by environmental conditions. It is crucial to assess the residual load capacity of corroded angles in transmission towers. In this study, corrosion at the connection of angels was simulated by local damage using a mechanical cutting method, and compression tests and numerical simulations were performed to investigate the load capacity of corroded angles. A total of 24 angles were designed and tested in the experiments, and the parameters considered included the location and thickness of damage and slenderness. The local damage was designed on the loaded or non-loaded legs, with slendernesses of 80 and 140, and a thickness of damage of 1 mm and 2 mm. The residual load capacity, failure modes, and strain of the angles were analysed based on experimental results. Furthermore, corrosion was simulated by reducing the local thickness of angles using ABAQUS. The accuracy of numerical models was verified after comparing the numerical results with experimental data. Based on the verified model, parameter analysis was conducted, in which the slendernesses was extended to 100 and 120, and the local damage thickness was also set to be 0.5 mm and 1.5 mm to quantitatively study the influence on the residual load capacity. The tests results showed that with the damage depth at the ends of the angle increased, and the load capacity of the angle decreased by up to 6.7%. Finally, a design equation for calculating the residual load capacity of corroded angles was proposed using the numerical results. By comparing the design equation, experimental results, and load capacity calculated per existing standards, it was found that the load-bearing capacity of corroded angles can be accurately predicted by the equation.
1. Introduction
As a crucial supporting structure for transmission lines, the structural health of transmission towers is directly connected to the safe operation of the lines. However, due to environmental factors, components of transmission towers often are exposed to severe corrosion issues in service, which reduces their load capacity and service life. In extreme environmental conditions, the corrosion of steel components may even lead to the complete collapse of structures. Traditional methods for assessing the load capacity of corroded components primarily rely on visual inspection and classification based on the degree of damage. Such methods are insufficient to accurately and objectively evaluate the residual load capacity of corroded steel components, as the load capacity of the steel is highly sensitive to geometric damages [1]. For the commonly used steel equal-leg angles in transmission towers, their connection method and loading characteristics make the influence of corrosion on global buckling performance particularly significant. Thus, it is necessary to study the load capacity of these components.
Diagonal members in transmission towers typically use steel equal-leg angles with bolted connections at one leg, and the overall buckling performance under compression has become a hot area of research [2,3,4,5,6,7,8]. Relevant studies have explored the influences of different end support conditions, geometric imperfections, slendernesses and width-to-thickness ratios on the stability of the angle [9,10,11]. Additionally, some studies have addressed the gaps in research concerning the load capacity of high-strength angles with bolted connections [12,13,14,15]. The influence of corrosion on the buckling performance of an angle has also gained considerable attention and become a crucial research focus.
Many researchers have conducted experimental studies and numerical analyses to study the overall buckling capacity of corroded angles in compression. Cinitha et al. [1] designed specimens with uniform and localised corrosion using a constant current method and found that localised corrosion had a greater detrimental effect on components than uniform corrosion. Beaulieu et al. [16] conducted accelerated corrosion tests and axial compression experiments on several groups of angles with different degrees of corrosion, and developed numerical models. The study revealed that the failure mode of corroded angles primarily included local and overall buckling and differed significantly from uncorroded angles. Shu et al. [17] conducted accelerated corrosion tests on 90 angles and also used ABAQUS software (version 2020) to perform finite element simulations to analyse their failure modes and residual load capacity. The experimental results showed that the residual load capacity of corroded angles has a quadratic parabolic relationship with the degree of corrosion. Gao et al. [18] conducted finite element analyses to quantitatively investigate the influences of four common corrosion types and corrosion levels on the mechanical performance of angle components in transmission towers. Zhang et al. [19] studied the mechanical performance of Q345 equal-leg angle steel members under corrosion conditions using quasi-static tests. The results showed that corrosion significantly reduced the load-bearing capacity and ductility of the members. Corrosion also caused the disappearance of the yield point, expedited stiffness degradation, and reduced the energy dissipation capacity. Based on artificial accelerated corrosion tests and finite element simulations, Ye et al. [20] studied the mechanical performance degradation of steel members with pitting corrosion characteristics. The study revealed that pitting corrosion primarily caused local cross-sectional weakening, leading to a reduction in the equivalent elastic modulus of the members, which in turn affected their overall mechanical behaviour. Notably, in areas with deeper corrosion, local failure becomes significant. Wang et al. [21] explored the effects of localised corrosion by numerical simulations, such as surface density, pit thickness, corrosion type, corrosion site, and slenderness, on the mechanical performance of Q420 angle components. The study showed that local corrosion significantly reduced the tensile and compressive load capacities of Q420 angles. Key factors affecting the load capacity included corrosion thickness, the density of localised corrosion and the scale of the corroded area. Mateus et al. [22] introduced a uniform thickness reduction method using ABAQUS software to simulate corrosion and predict the post-buckling and buckling behaviour of steel plates.
Additionally, mechanical cutting has been used as a corrosion simulation method in the study of the residual load capacity of angles with corrosion. Oszvald et al. [23] simulated corrosion as a reduction in thickness through mechanical cutting and completed compression tests and numerical simulations of steel equal-leg angles with corrosion. Luo et al. [24] simulated local corrosion in angles through mechanical drilling and studied the influences of different slendernesses and corrosion levels on the mechanical behaviour of the angle. The experimental results showed that local corrosion led to buckling in areas of stress concentration, and the local buckling effect gradually diminished as the corrosion length increased.
With experimental and numerical results, it is necessary to develop simple and practical design equations to determine the residual load capacity of corroded components. Sarveswaran et al. [25] proposed a method to determine the load capacity of steel components with corrosion using measured data and emphasised that the corrosion thickness was a key indicator in reliability analysis. Hisazumi et al. [26] conducted compression tests and numerical analyses on corroded angles exposed to long-term marine environments and found that the interaction between local and overall buckling was the most common failure mode. Based on the result, they also developed a modified buckling load capacity formula suitable for severely corroded angles. Oszvald et al. [23], Gao et al. [18], Luo et al. [24] and Wang et al. [21] have proposed simplified calculation methods based on their respective research findings to determine the residual load capacity of angles with corrosion. However, existing experimental and numerical work is still insufficient to assess the residual load capacity of an angle with local corrosion at the connection.
This study focuses on the buckling behaviour of steel equal-leg angles under compression at one leg. In the test, local damage with different thicknesses was made at the bolted connection of angles with different slendernesses, and the angles were tested to buckling under compression. Numerical simulations were also conducted to simulate the buckling behaviour of the angles tested in compression, in which the influences of damage thickness and slenderness on load-bearing capacity were obtained and compared. The test and numerical results were then used to develop design equations to calculate the load-bearing capacity of angles with local damage at the connection.
2. Experimental Programme
2.1. Test Specimens
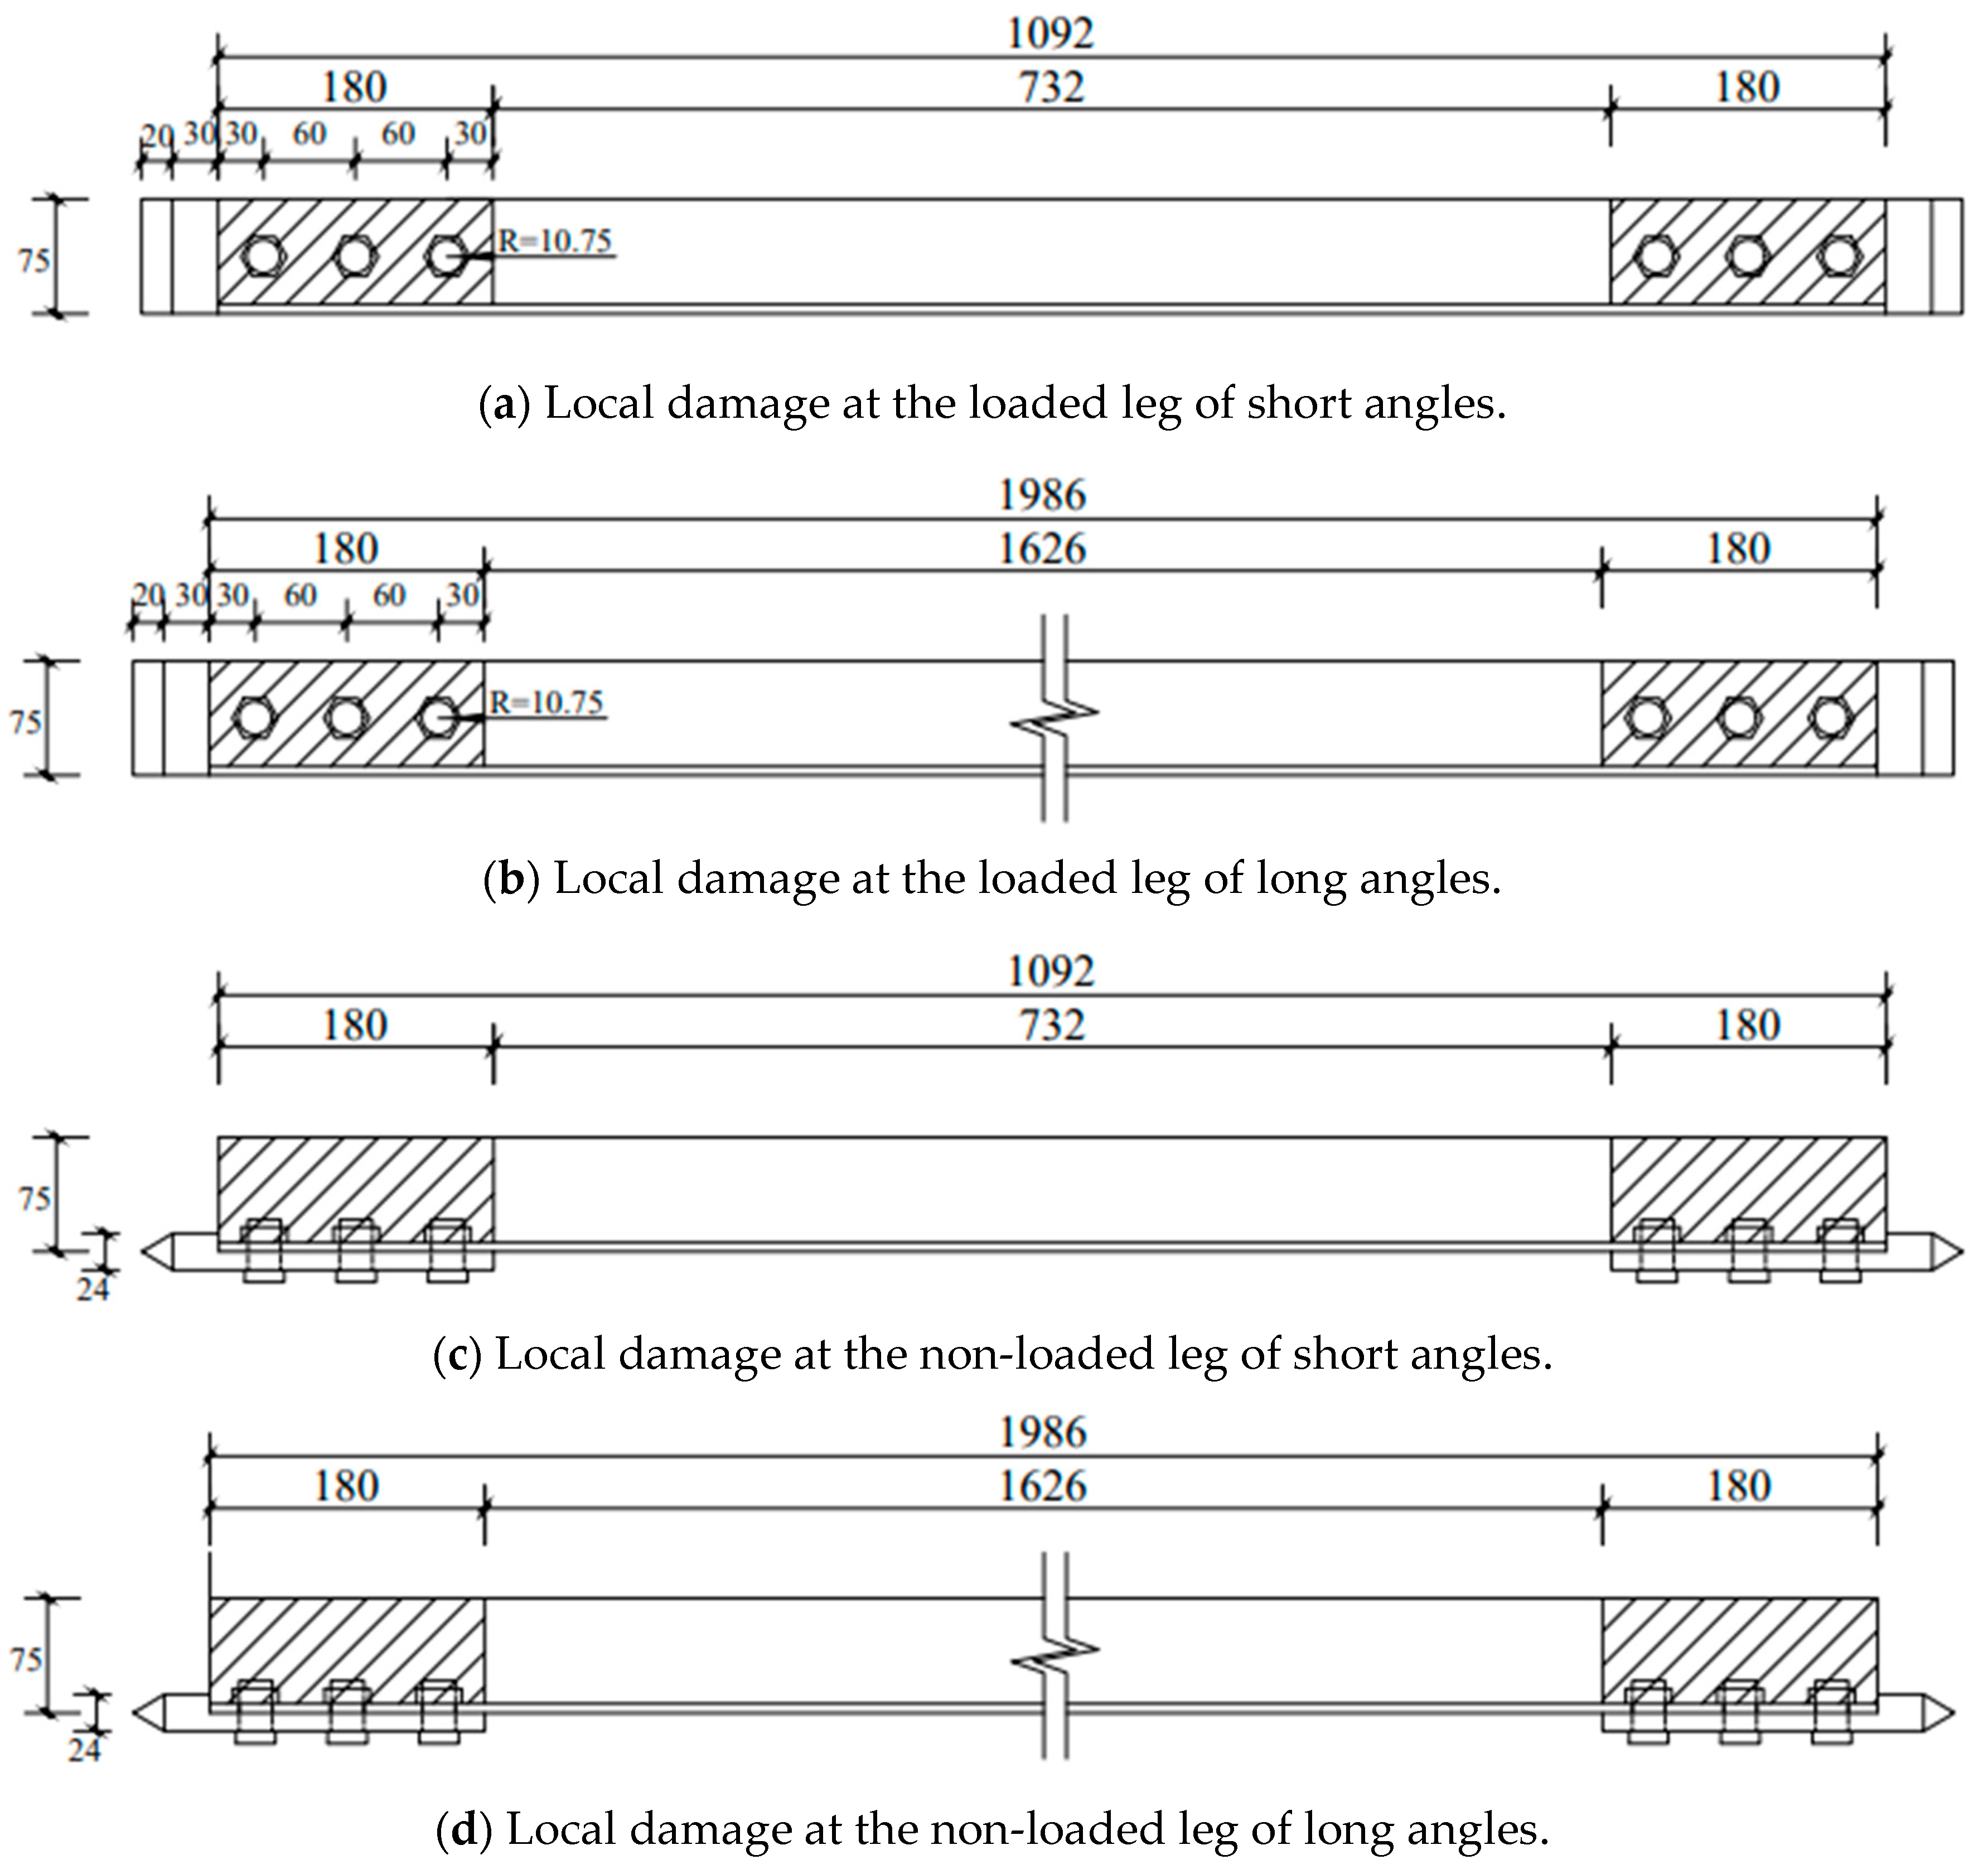
Before testing, the cross-section and length of angles widely used as diagonal members in transmission towers were determined. Angles with a strength grade of Q355 and equal legs were selected, and the cross-sectional dimensions were 75 mm in width by 6 mm in thickness, as shown in Figure 1. The steel angles were selected to represent the widely used steel angles in transmission towers in China. To simulate connections in transmission towers, three bolts were designed at each end of the angle, and Grade 8.8 steel bolts with a diameter of 20 mm were used to connect one leg of the angle and the end plate. A hinge was manufactured at the end plate. The lengths of specimens, measured between the two ends of plates, were 1192 mm and 2086 mm, with corresponding slendernesses about the minor axis of 80 and 140. Note that the length of short angles was 1092 mm, and that of long angles was 1986 mm.
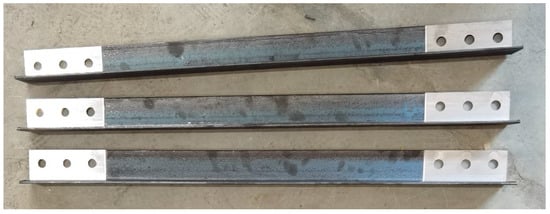
Figure 1.
Specimens used in the tests.
Thelocal corrosion of steel members can be simulated through cutting the thickness of steel plates using mechanical grinding [23]. It should be noted that mechanical cutting is slightly different from corrosion as it only reduces the thickness of steel angles at the connections. However, mechanical cutting can represent actual corrosion when the member is subjected to compression, since the buckling of steel angles is mainly affected by a reduction in angle thickness. In this study, the thickness of angles at the connection was ground to different levels to represent local damage, as shown in Figure 1. Site inspections show that steel transmission towers may be subjected to severe corrosion at the connection of steel angles. To simulate the local corrosion at the connection, the thickness of local damage was determined as 1 mm and 2 mm based on site inspections [27], and the length was 180 mm. In addition to the damage thickness, its location at the angle was also taken into consideration. Three different locations of local damage were considered in the experimental programme, namely, the inner surface at the connection of the loaded leg, the inner and outer surfaces at both ends of the non-loaded leg. Hence, a total of six sets of specimens were designed, as listed in Table 1. In the term, SC and LC represent a short angle and long angle under compression, respectively, E denotes the local damage at the end, U and O stand for the inner and outer surfaces of the non-loaded leg, respectively, and the last numerals 1 and 2 indicate the thickness of local damage, respectively. For example, SC-E1 refers to a short angle with a slenderness of 80, and the thickness of local damage is 1 mm at the inner surface of the loaded leg end. It should be pointed out that the maximum thickness of local depth was determined based on site measurements of steel towers after a service period of 30 years, but the depth could also be affected by the environmental conditions (see Figure 2).

Table 1.
Parameters of the angles in the tests.
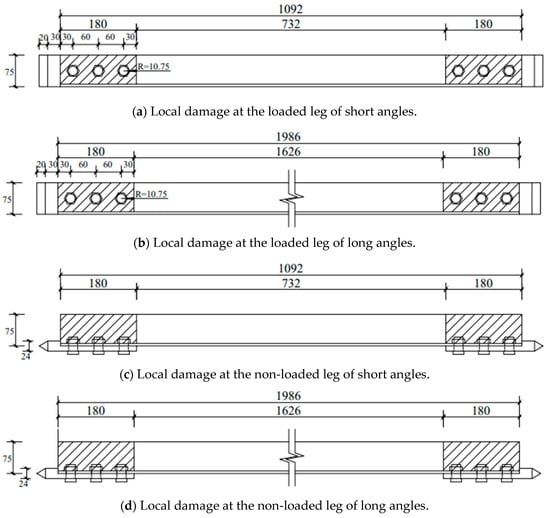
Figure 2.
Geometric dimension of members in the tests (mm).
2.2. Test Setup and Loading Procedures
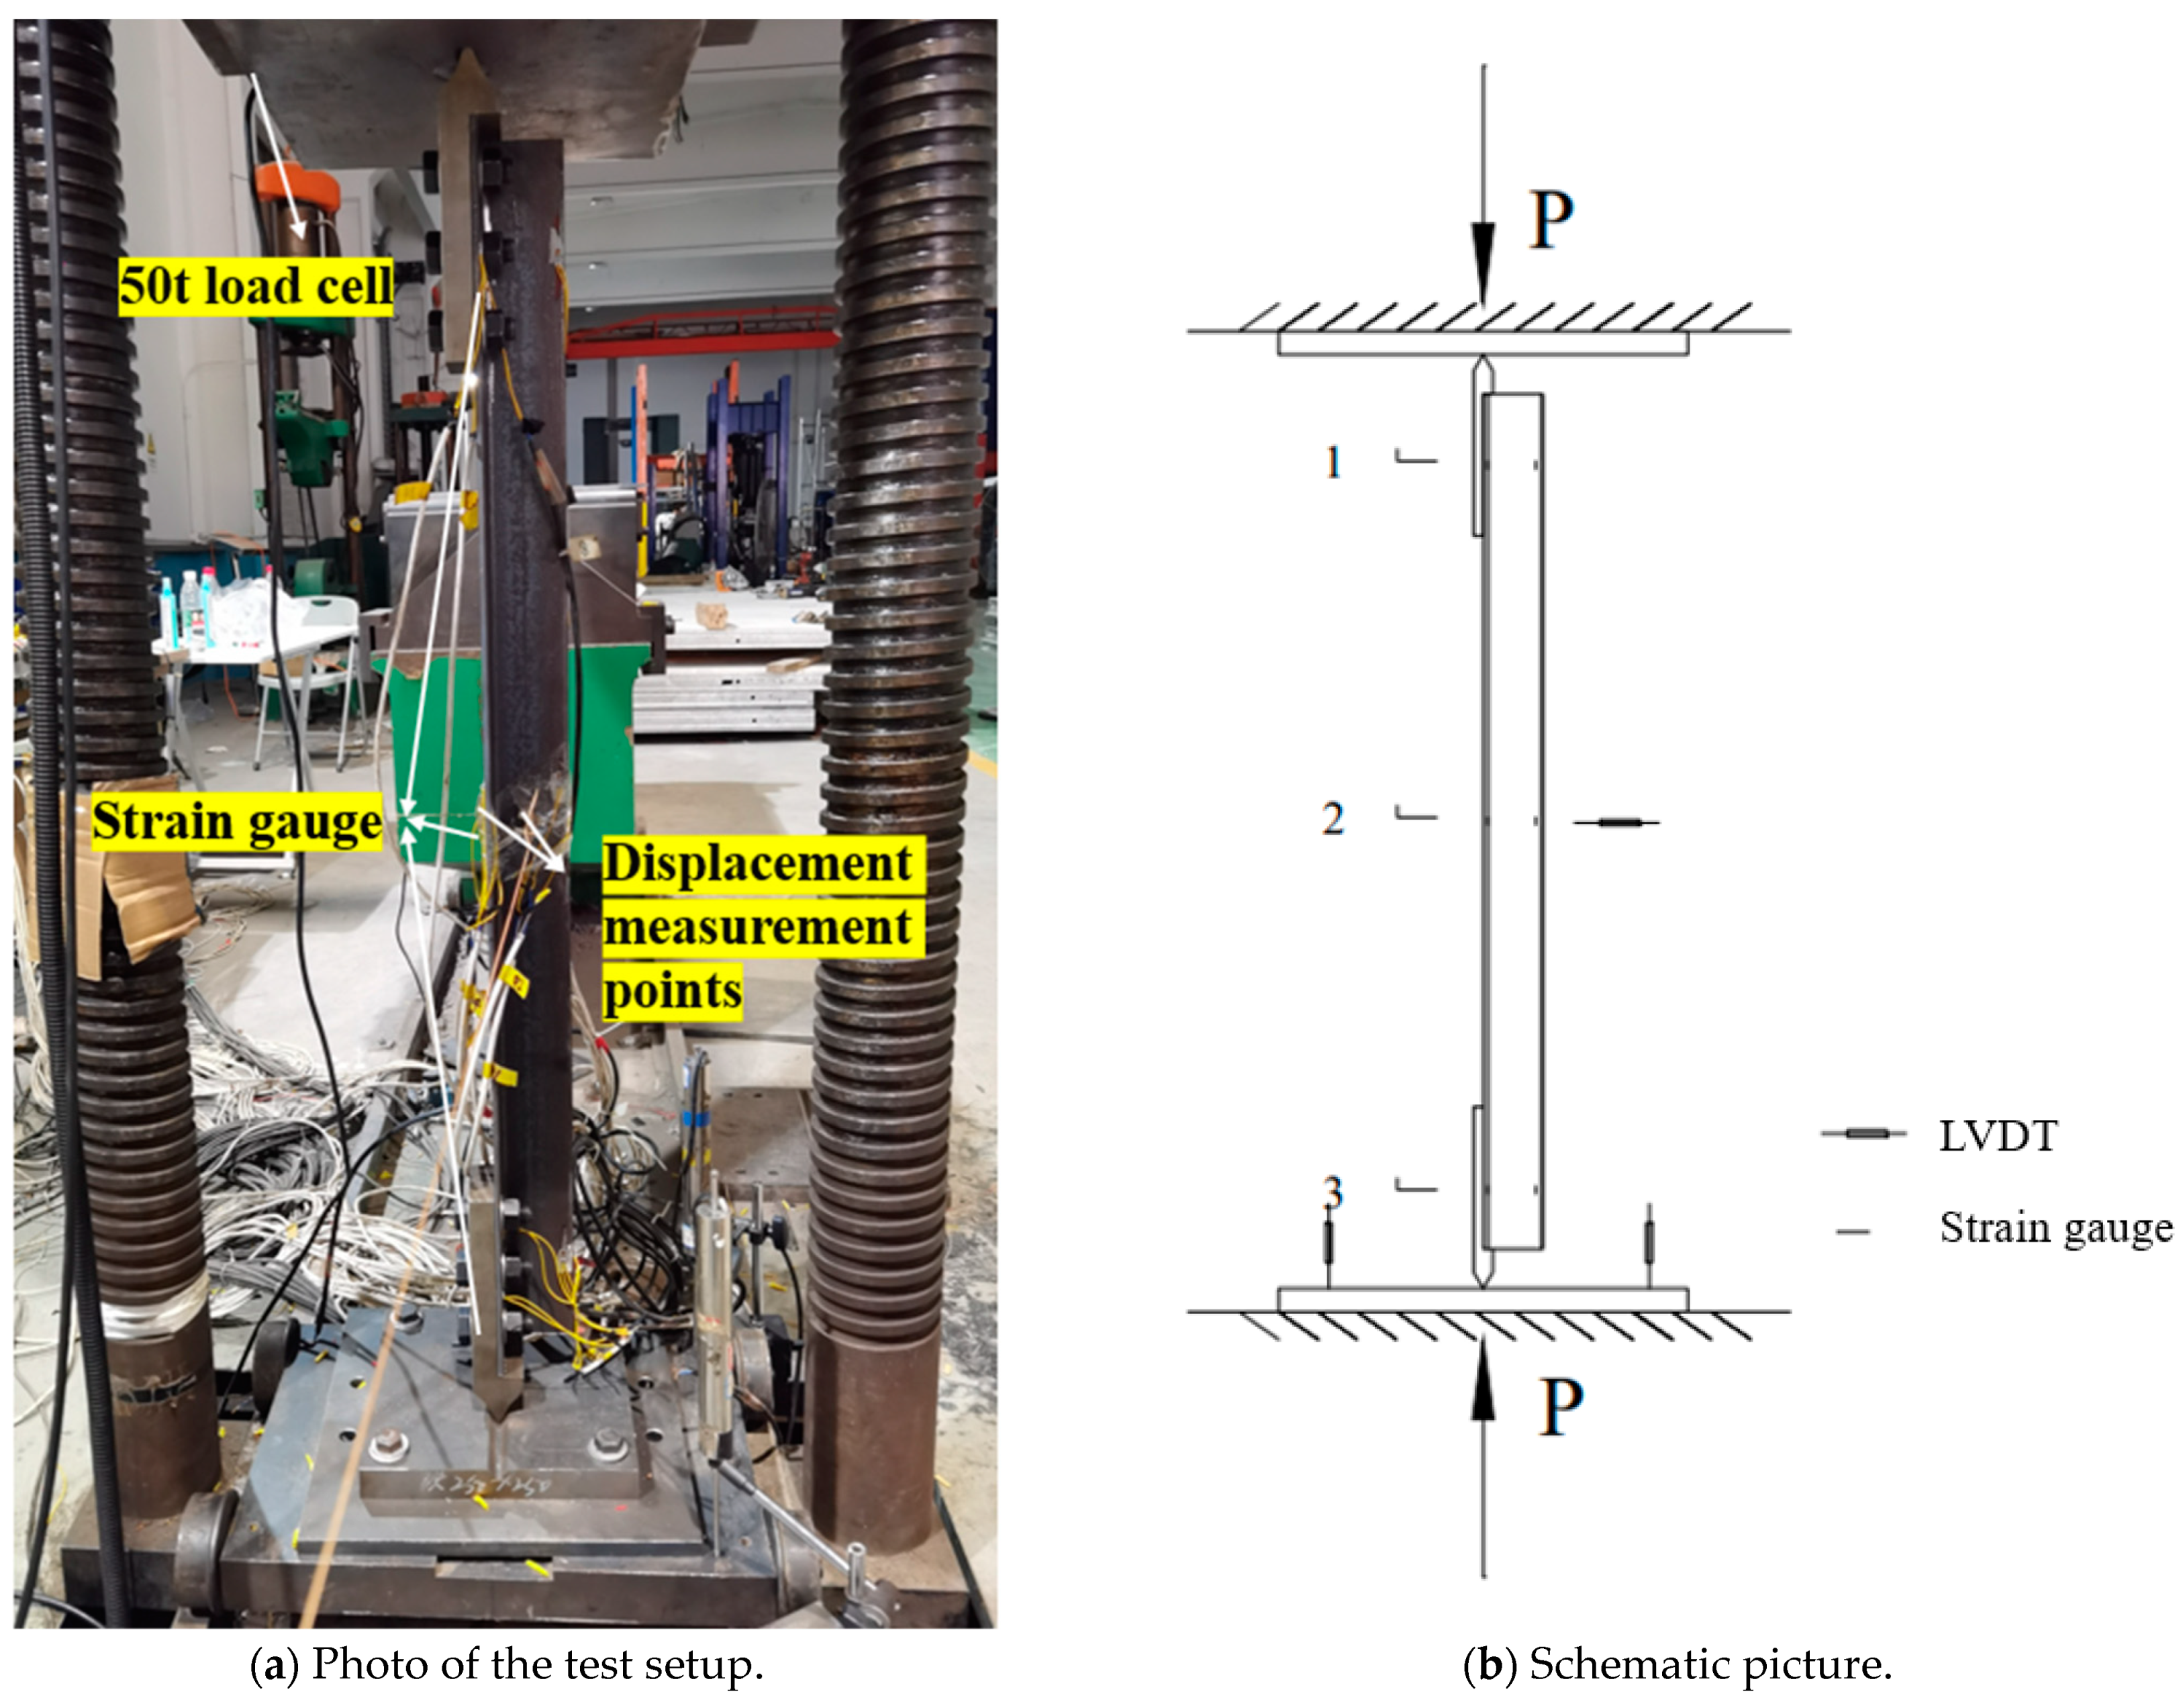
One leg of angles was designed with bolted connections at both ends. A hydraulic testing machine was used to test each specimen in compression on a single leg, as displayed in Figure 3. The applied compressive force was measured by a load cell inserted between the loading machine and the angle. The axial and transverse deformations of angles were measured by linear variable differential transducers (LVDTs) erected at the bottom and mid-height of angles. Moreover, 5 mm long steel strain gauges were also mounted at the end of angles to monitor the variation in steel strains under eccentric compression.
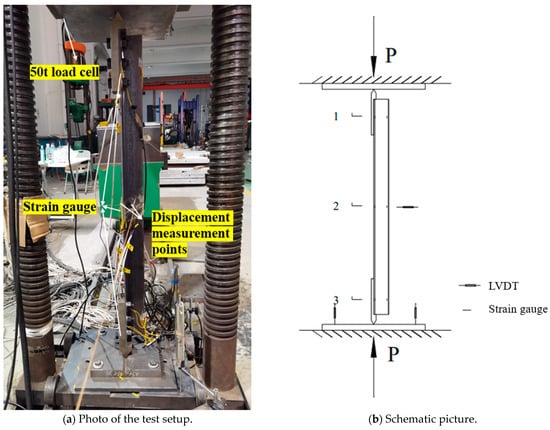
Figure 3.
Test setup for steel angles in compression.
Compression tests were conducted for angles in accordance with DL/T 5486-2020 [28]. In the loading scheme, the loading rate was kept constant at 2 kN/s before 80% of the estimated load capacity of angles was reached. Thereafter, the loading rate was reduced to 1 kN/s to capture the ultimate load of the applied load. Loading was terminated when angles failed in global buckling and the load decreased to less than 70% of the peak value.
2.3. Mechanical Properties of Angles
Three coupons were cut from the angle, and tension tests were conducted according to GB/T 228.1-2010 [29]. The thickness of the coupon was 6 mm, identical to the thickness of the angle, and the width in a gauge length of 96 mm was 20 mm. The experimental results showed that the elastic modulus of the coupon was 201,172 MPa, and the yield and ultimate strengths were 380.3 MPa and 555.9 MPa, respectively.
3. Experimental Tests and Discussions
3.1. Load-in-Plane-Deflection Curves
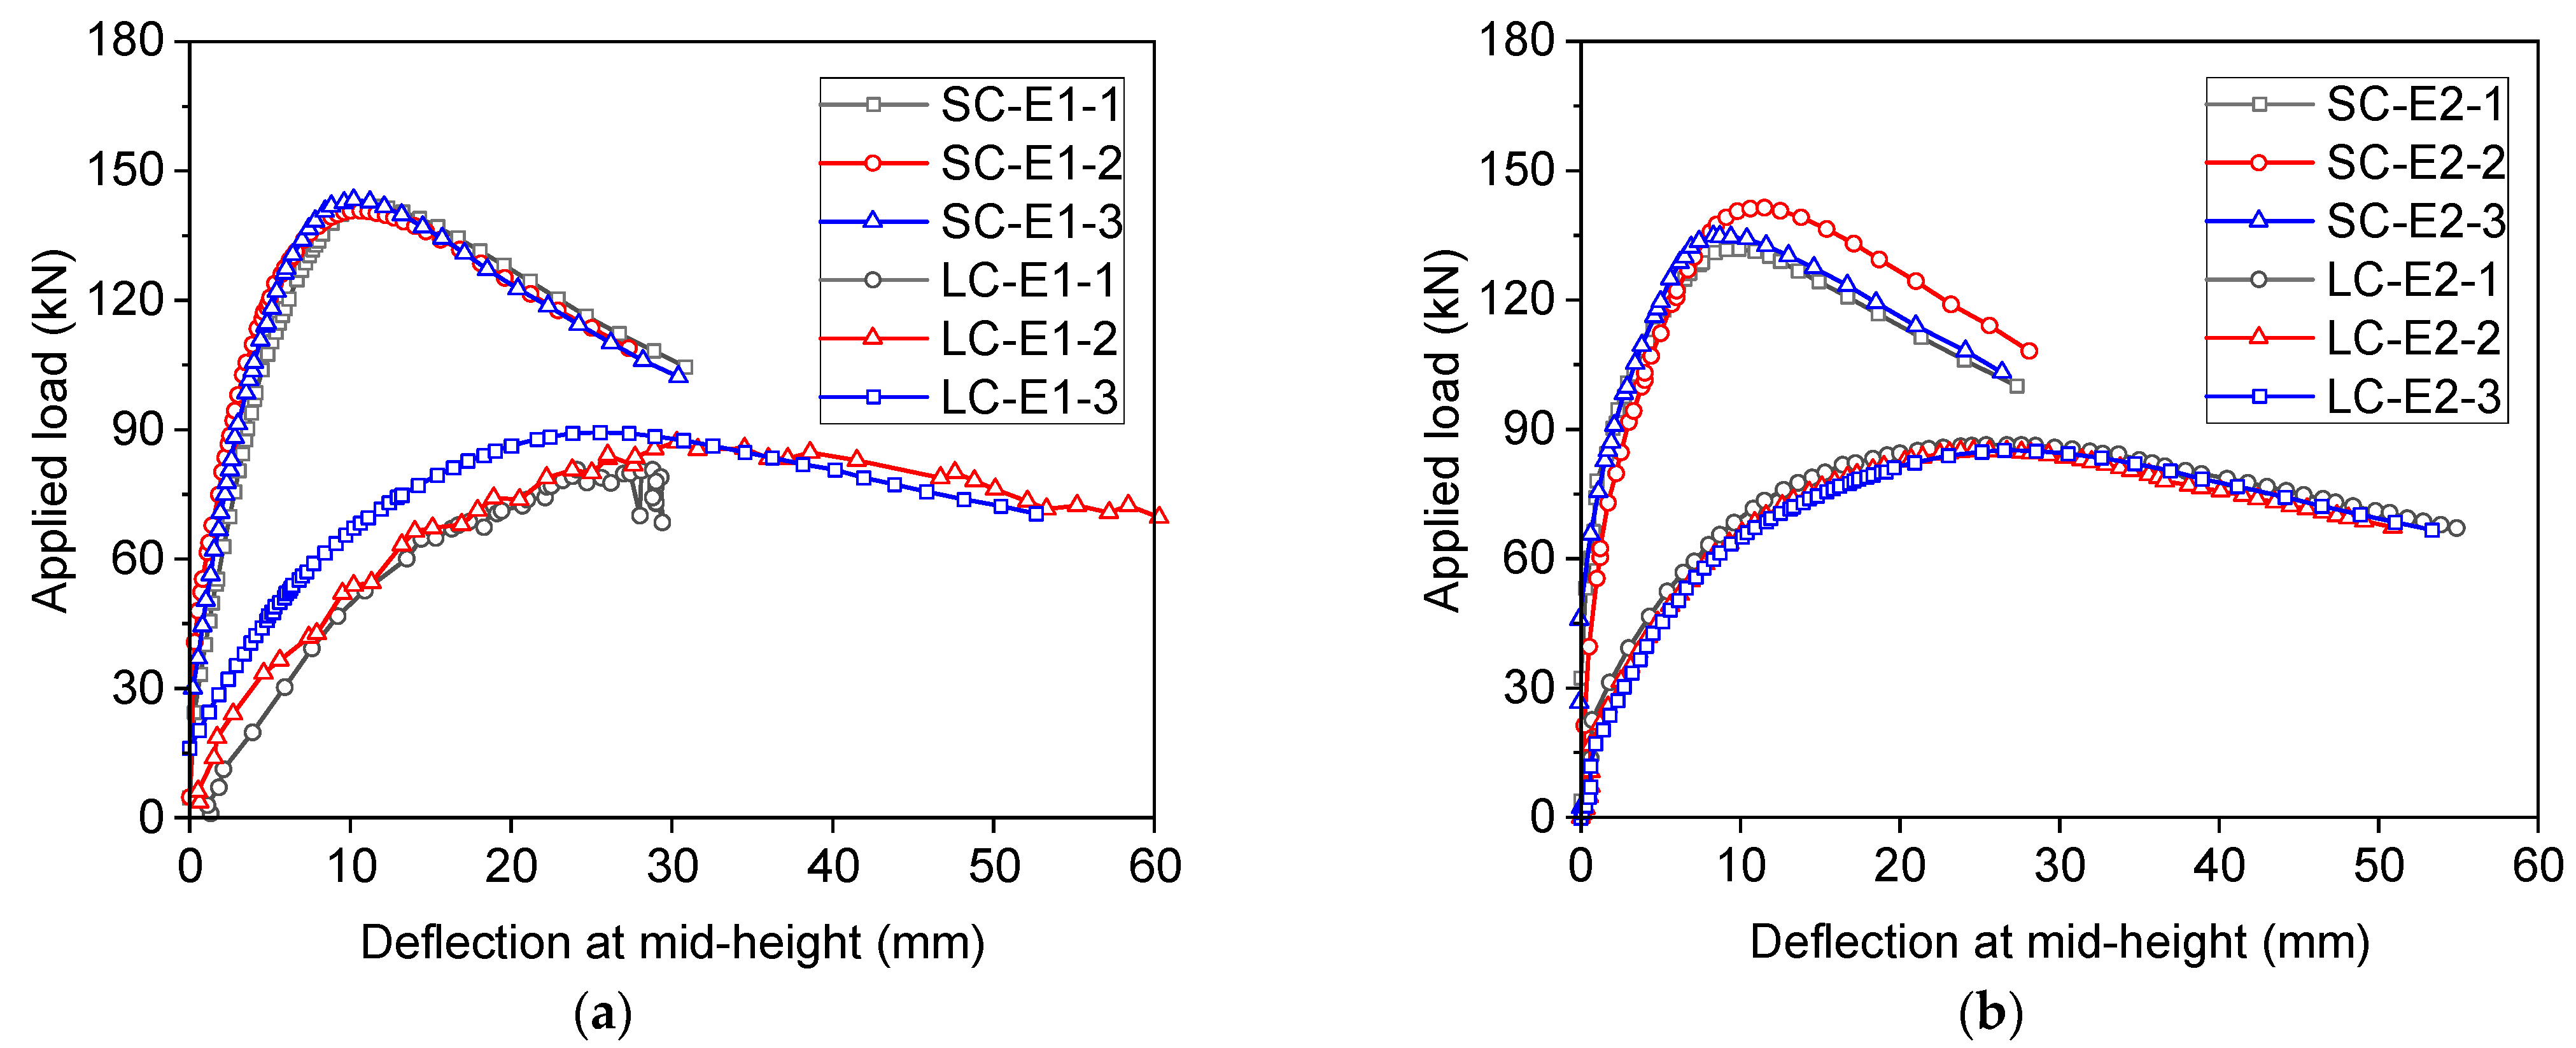
Figure 4 plots the load–deflection curve of angles. Note that the deflection was measured perpendicular to the loaded leg. In general, the curve shows a similar shape, with nonlinear increasing branch before the ultimate load and decreasing branch after buckling, in spite of different slendernesses and thicknesses of local damage. However, the load-bearing capacity of the angles with 80 slenderness was greater than those with a slenderness of 140, and the associated deflection of the former was smaller than that of the latter. For instance, SC-E1 develop a load capacity of 141.6 kN at 10.8 mm deflection on average, whereas the load-bearing capacity of angle LC-E1 was 86.4 kN, reached at 29.2 mm deflection. Moreover, the ultimate load of angles also increased with a decreasing thickness of local damage. This phenomenon could be caused by several factors, including the local buckling of angles in areas with local damage and compressive stress redistribution at the connection. Detailed analyses of the influence of local damage can be found in the subsequent section.
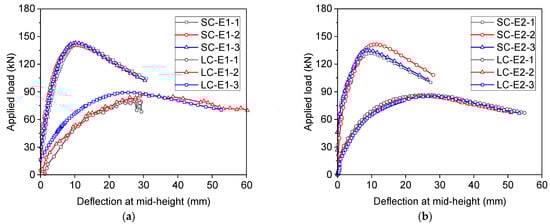

Figure 4.
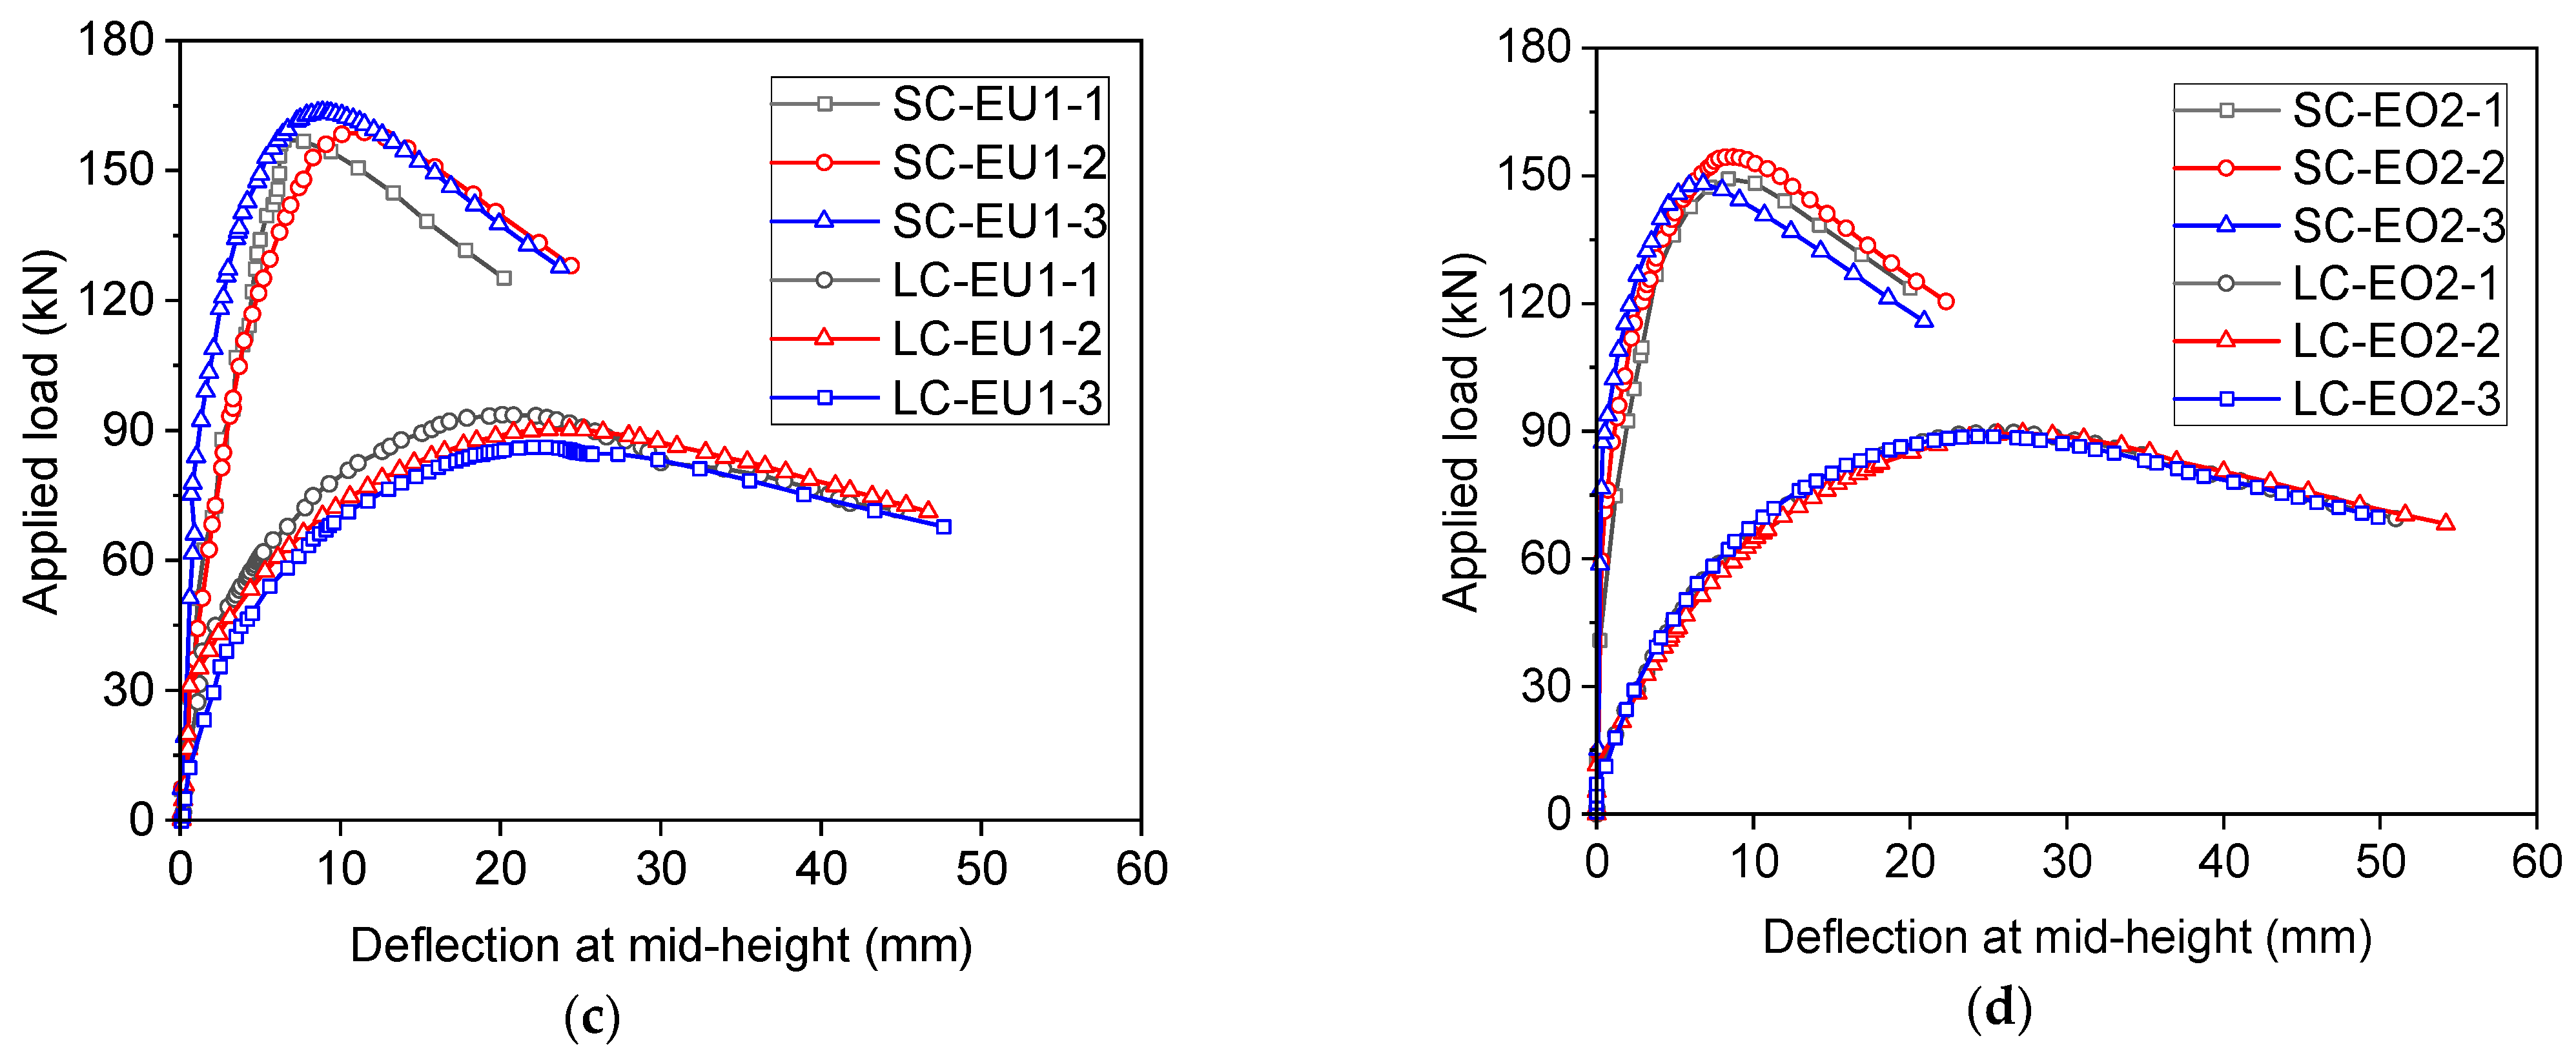
Load–deflection curves of angles with local damages at the end. (a) 1 mm thickness damage on the inner surface of loaded leg. (b) 2 mm thickness damage on the inner surface of loaded leg. (c) 1 mm thickness damage on the inner surface of non-loaded leg. (d) 2 mm thickness damage on the inner surface of non-loaded leg.
3.2. Load–out-of-Plane-Deflection Curves
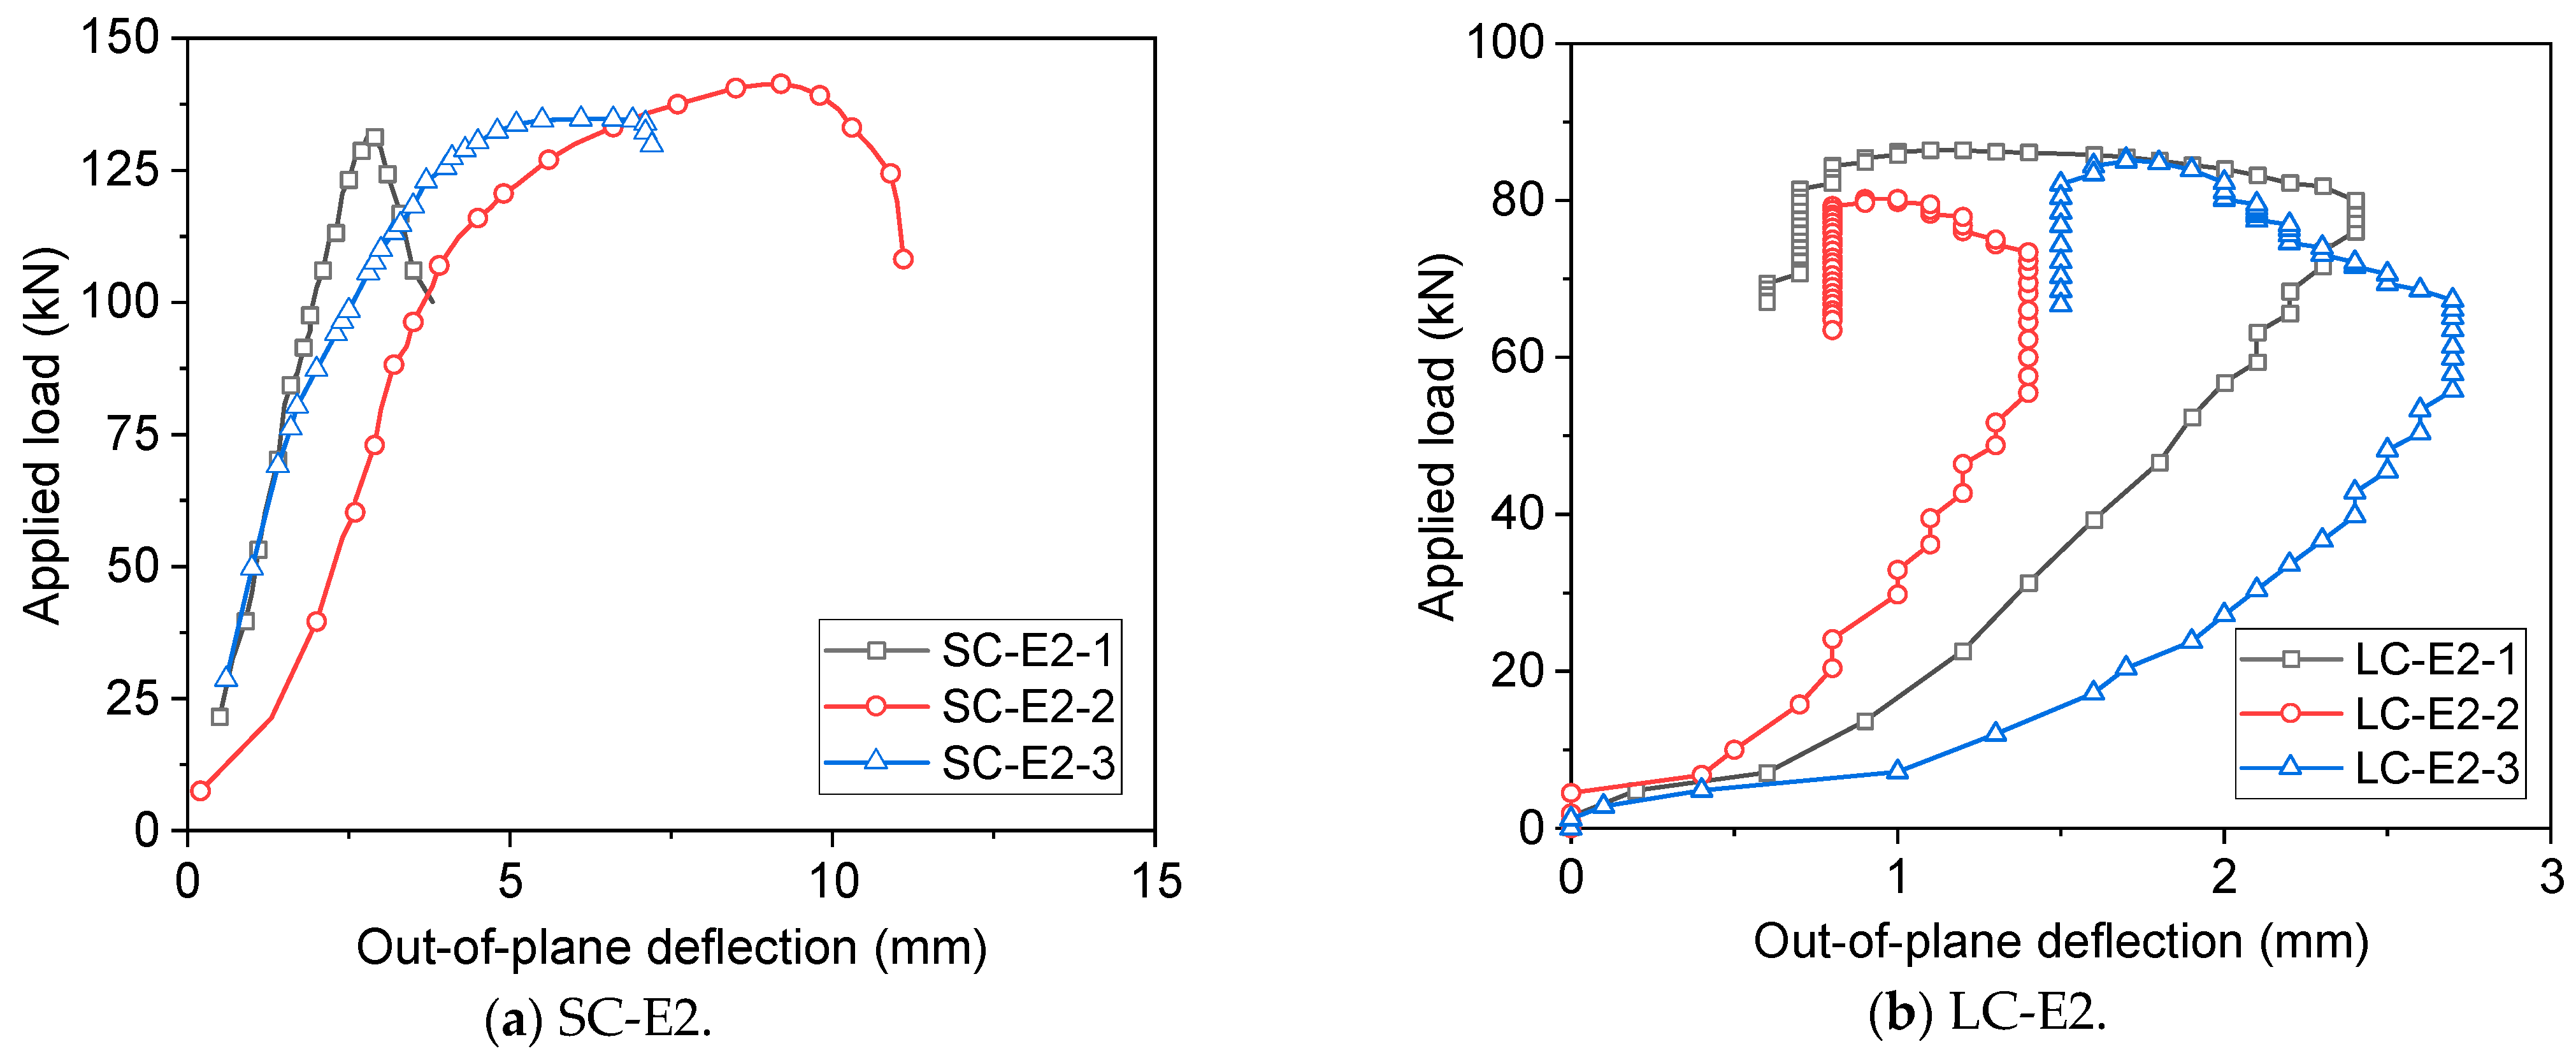
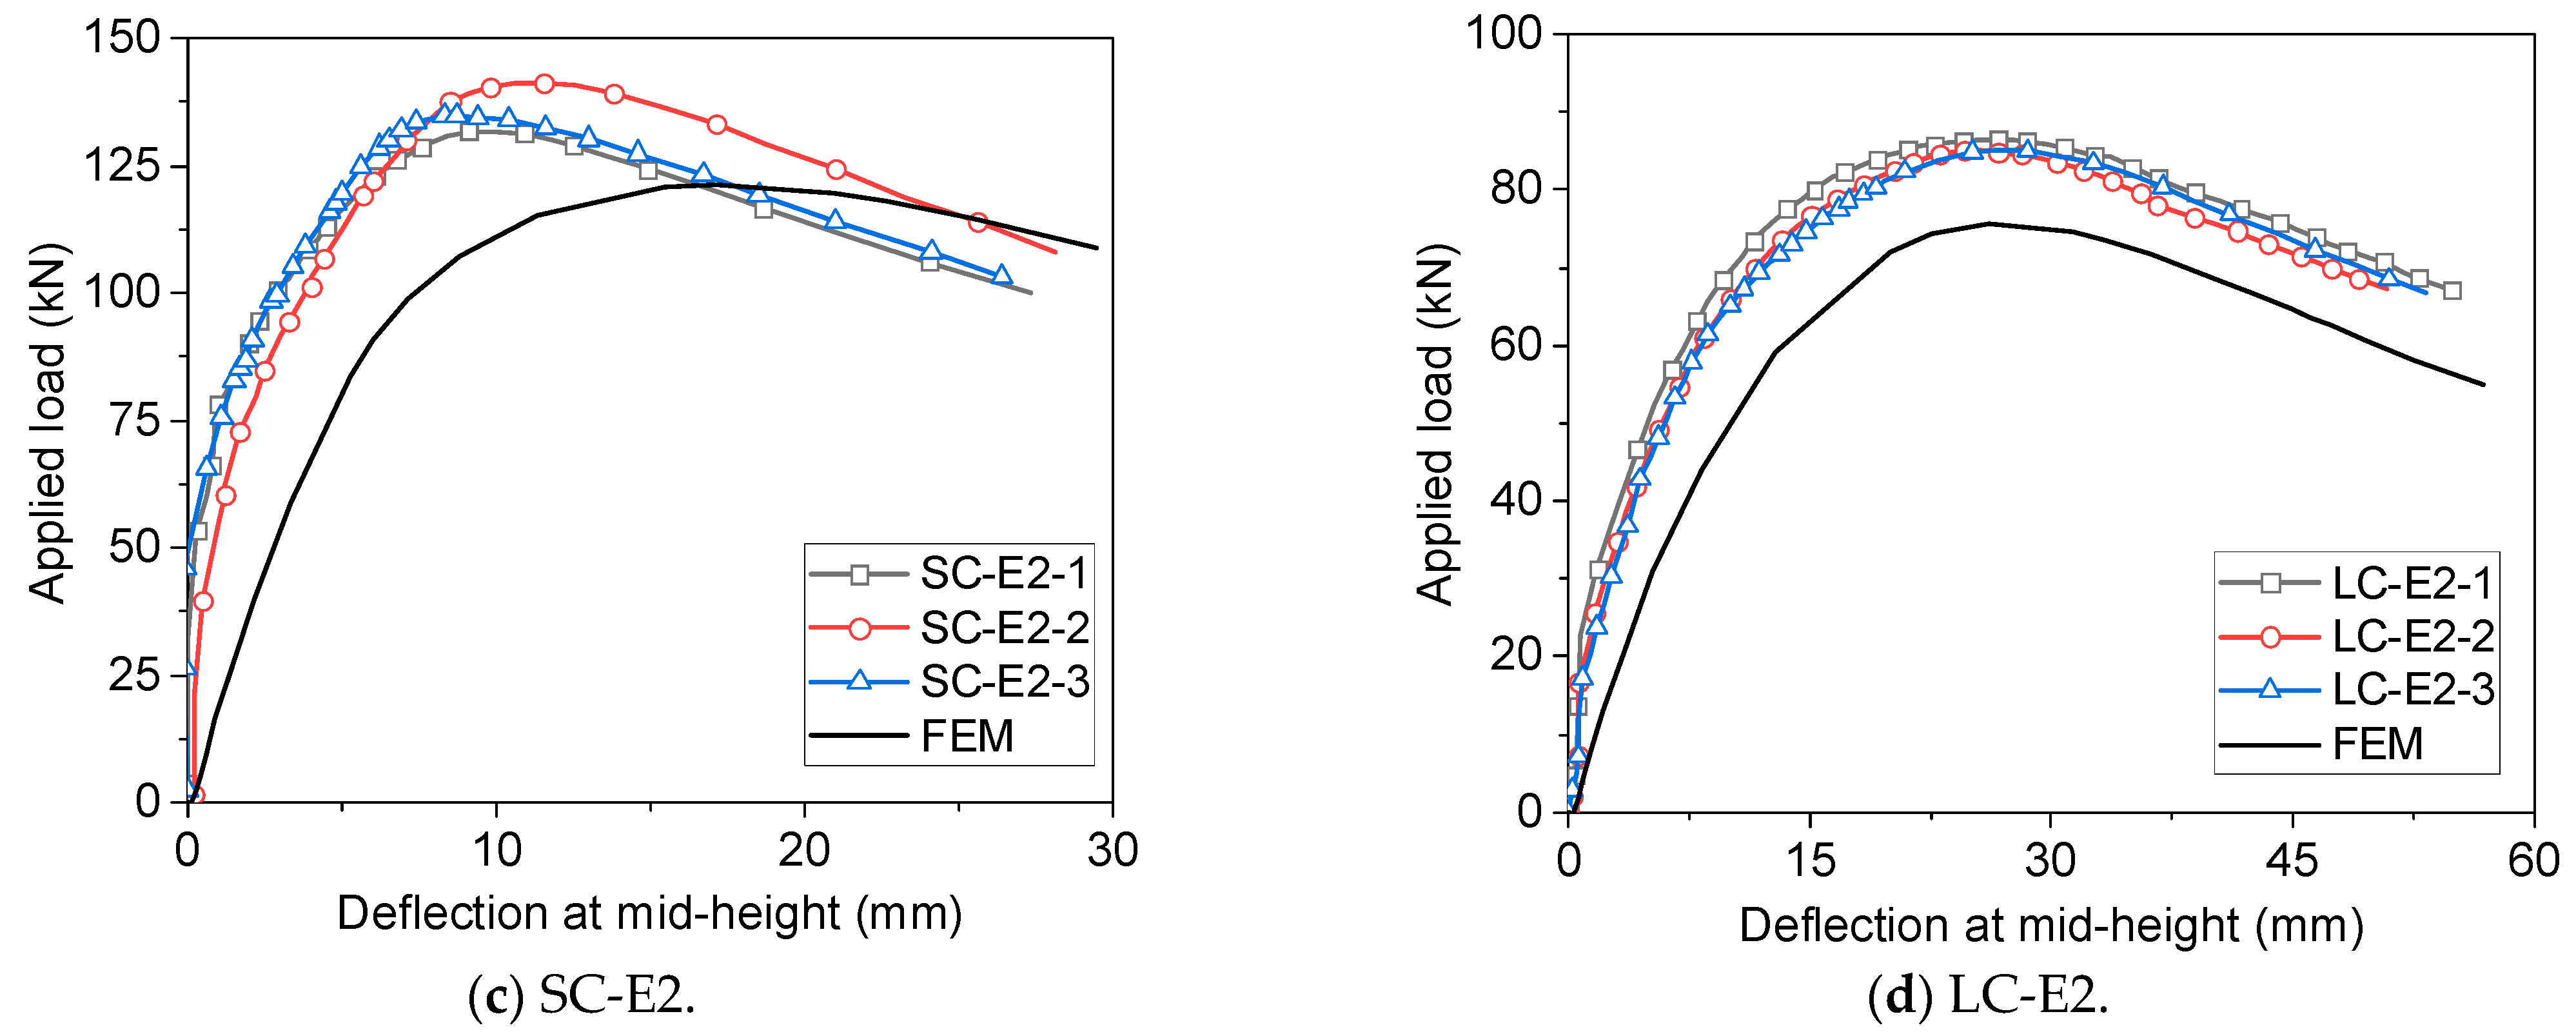
Figure 5 plots the load-deflection curve of angles parallel to the loaded leg. Two different curves were measured during testing, as shown in Figure 5a,b. In most cases, with the increasing applied load, the measured deflection increased before the ultimate load was achieved, as for angle SC-E2 (see Figure 5a). It should be pointed out that the out-of-plane deflection was mainly contributed by the deformation induced by overall bending. The connection region with 1 mm thickness local damage could not buckle locally. Once the local damage thickness reached 2 mm, the local buckling of the loaded leg would occur, but it did not result in significant out-of-plane deflections of SC-E2. For angle LC-E2, local buckling took place before the ultimate load was achieved and induced significant out-of-plane deflections. Thereafter, the overall buckling of the angles led to an inverse development of the out-of-plane deflection. Hence, the deflection increased with the applied load at first and then decreased slowly after local buckling but before global buckling, as shown in Figure 5b.
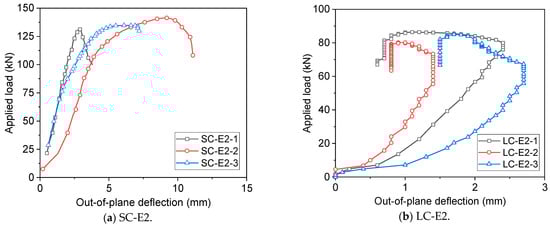
Figure 5.
Load–out-of-plane-deflection curves of angles with 2 mm thickness local damage.
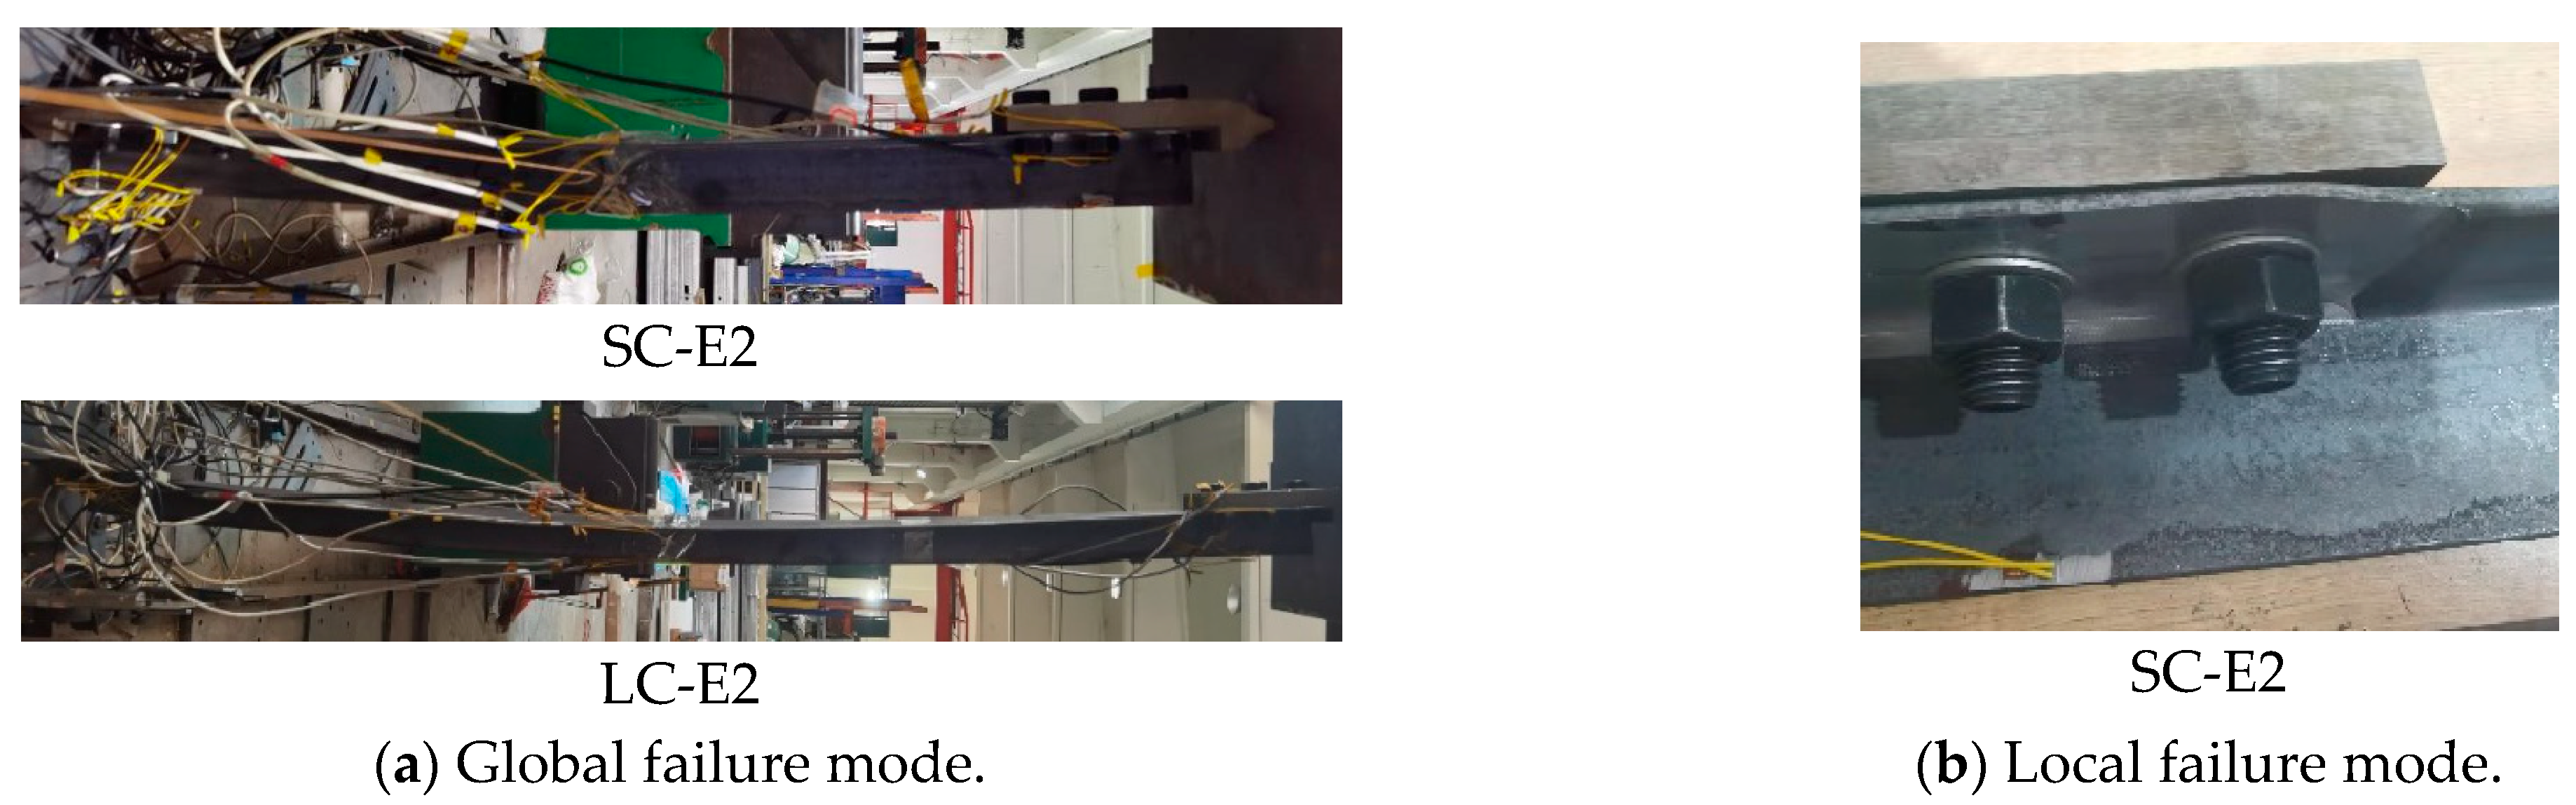
3.3. Failure Modes of Angles
Figure 6 shows the common failure modes of angles in compression on one leg. The test observations showed that deflections developed in the angle about its axes parallel to its two legs, and in-plane and out-of-plane deflections were measured during loading. Once the load approached its ultimate value, a twisting of the angle started, and the final failure was characterised by combined flexural and torsional buckling (see Figure 6a). Moreover, if the local damage reached a thickness of 2 mm at the loaded leg, local buckling at the connection region could occur ahead of global buckling, as shown in Figure 6b, as the net thickness of the leg with local damage could not satisfy the width-to-thickness ratio specified against local buckling.

Figure 6.
Common failure modes of angles in compression.
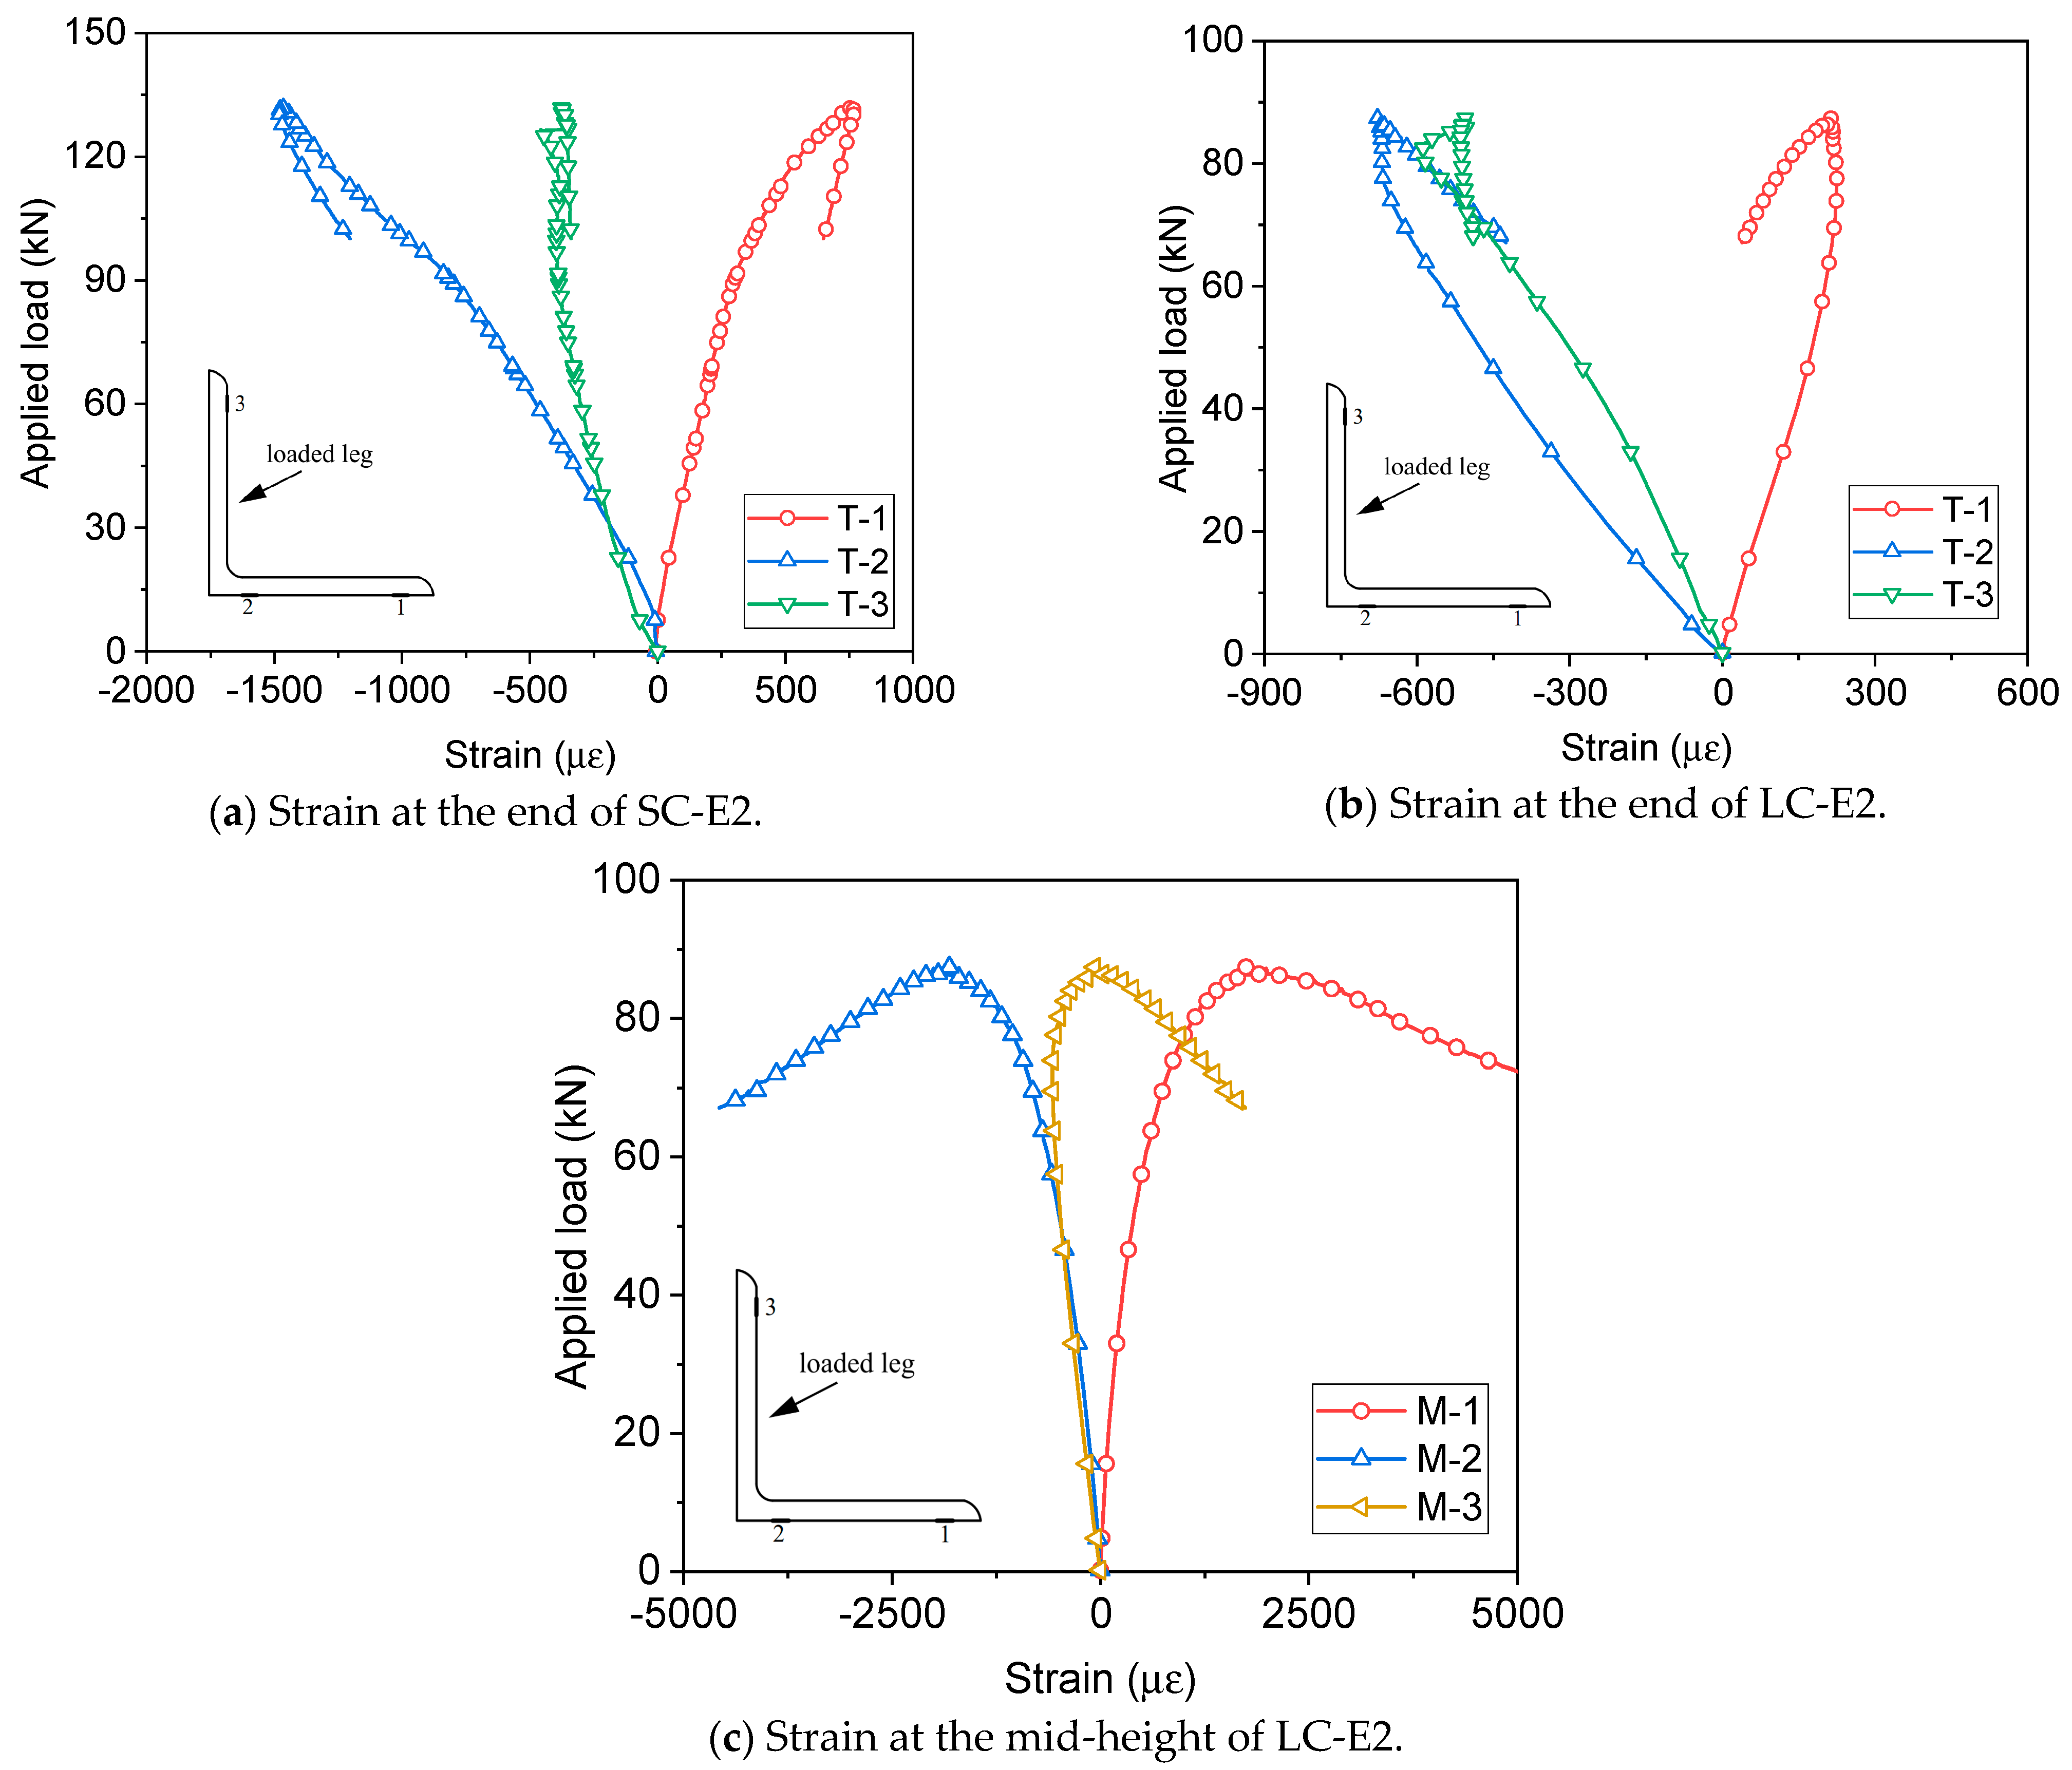
3.4. Load–Strain Curves
Figure 7a plots the variation in the strain measured at the end with the applied load of SC-E2. It can be observed that the strain of T-2 was greater than that of T-3 at the same load greater than 30 kN. However, a turning point exists on the load–strain curve, in particular of T-2 and T-3, when the load was close to 93 kN. After the turning point, the compressive strain of T-2 increased rapidly with increasing applied load, but that of T-3 slightly decreased. This point resulted from the local buckling of the angles with damage at the loaded leg. Nevertheless, strains obtained at the top end of LC-E2 showed different variations with the applied load, as plotted in Figure 7b. The strain of T-2 was greater than that of T-3 at the initial loading. Moreover, a reduction in the strain of T-3 was observed prior to the attainment of the ultimate load due to the occurrence of local buckling in the loaded leg with reduced thickness. For the other two strains, T-1 and T-2, their values kept increasing with increasing applied load. As all specimens developed similar load–strain curves at the mid-height, only the result of LC-E2 was selected in the present study. It can be observed from Figure 7c that the compressive strain of M-2 was rather close to that of M-3 at the initial stage and tensile strains were measured for M-1, indicating that the angle was bending about the axis parallel to the loaded leg. The strain of M-3 started deviating from that of M-2 once the applied load exceeded around 60 kN, with the strain of M-3 turning into positive values. Thus, twisting in the angle occurred about the longitudinal axis, and the axis about which the angle bent came close the minor axis of the angle.
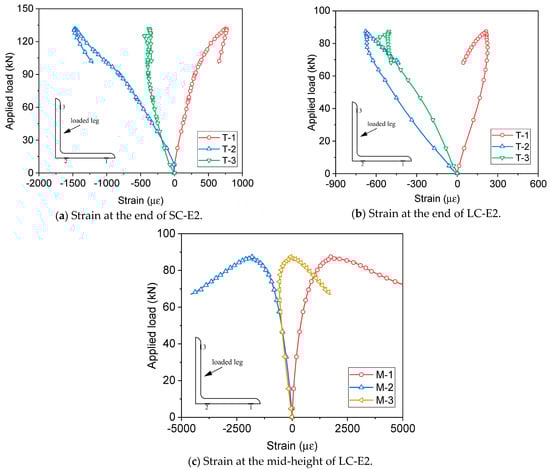
Figure 7.
Longitudinal strains obtained at various sections of angles.
3.5. Discussions on Test Results
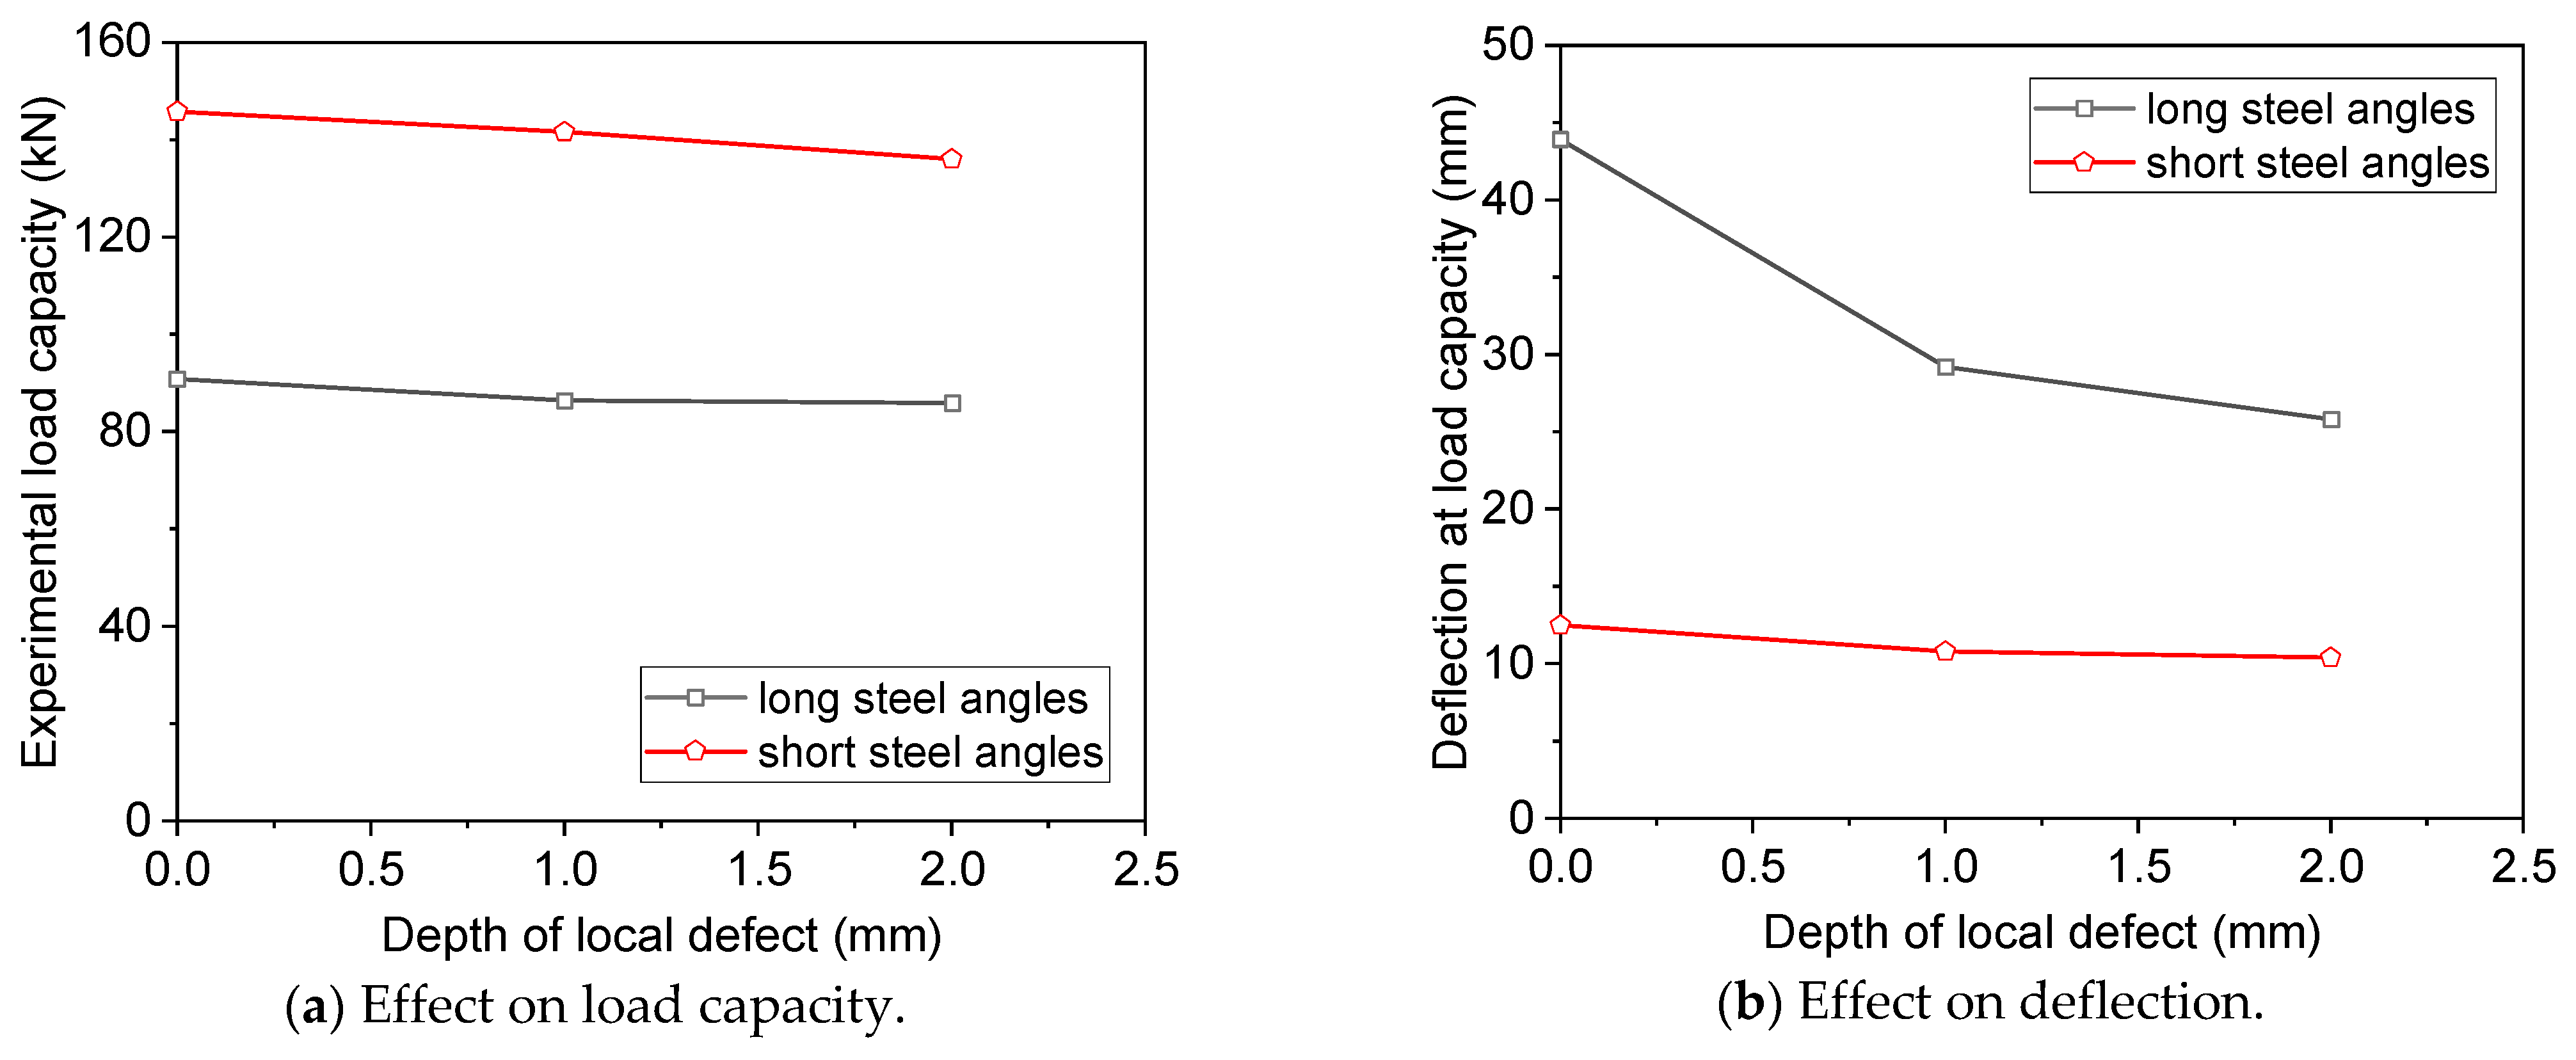
Table 2 summarises the load capacity and associated deflection of the angles. Note that the load capacities of undamaged short and long angles were 145.8 kN and 90.8 kN, respectively, as can be found in reference [30]. Figure 8a shows that for angles with local damage at the connection, the load capacity decreased as the thickness of the local damage increased. When the thickness of local damage at the loaded leg increased from 1 mm to 2 mm, the load capacity of short angles reduced by 4.0% from 141.6 kN to 136.0 kN. However, the influence of local damage thickness on the load-bearing capacity became insignificant as the slenderness of angles reached 140. A change in the local damage thickness from 1 mm to 2 mm resulted in only a slight decrease in the load-bearing capacity from 86.4 kN to 85.9 kN. Figure 8b plots the influence of local damage thickness on the in-plane deflection of the angles at the load capacity. It is evident that for short angles, when the thickness of local damage at the loaded leg was increased from 1 mm to 2 mm, the deflection corresponding to the load-bearing capacity was only reduced from 10.8 mm to 10.4 mm, indicating an insignificant influence of the local damage thickness on the critical deflection. Nonetheless, if the slenderness of the angle reached 140, the influence of local damage thickness on the deflection became significant. The deflection corresponding to the load capacity was apparently reduced from 29.2 mm to 25.8 mm when the thickness of the local damage increased from 1 mm to 2 mm. This is likely due to the fact that for angles with a smaller degree of slenderness, the overall stiffness of the steel was higher, and the influence of local damage was mainly limited to the area near the damage. Therefore, even with an increase in the damage thickness, the overall deformation was minimally affected. Nonetheless, for angles with greater slenderness, the deformation was primarily dominated by global buckling due to the lower overall stiffness. The presence of local damage only affected local stress distribution but had limited effects on global buckling.
Table 2.
Load capacity and deflection of angles in compression.
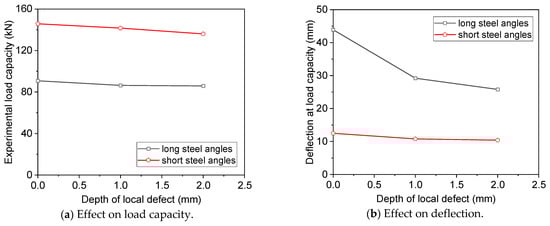
Figure 8.
Effect of the thickness of local damage on load capacity and deflection of angles.
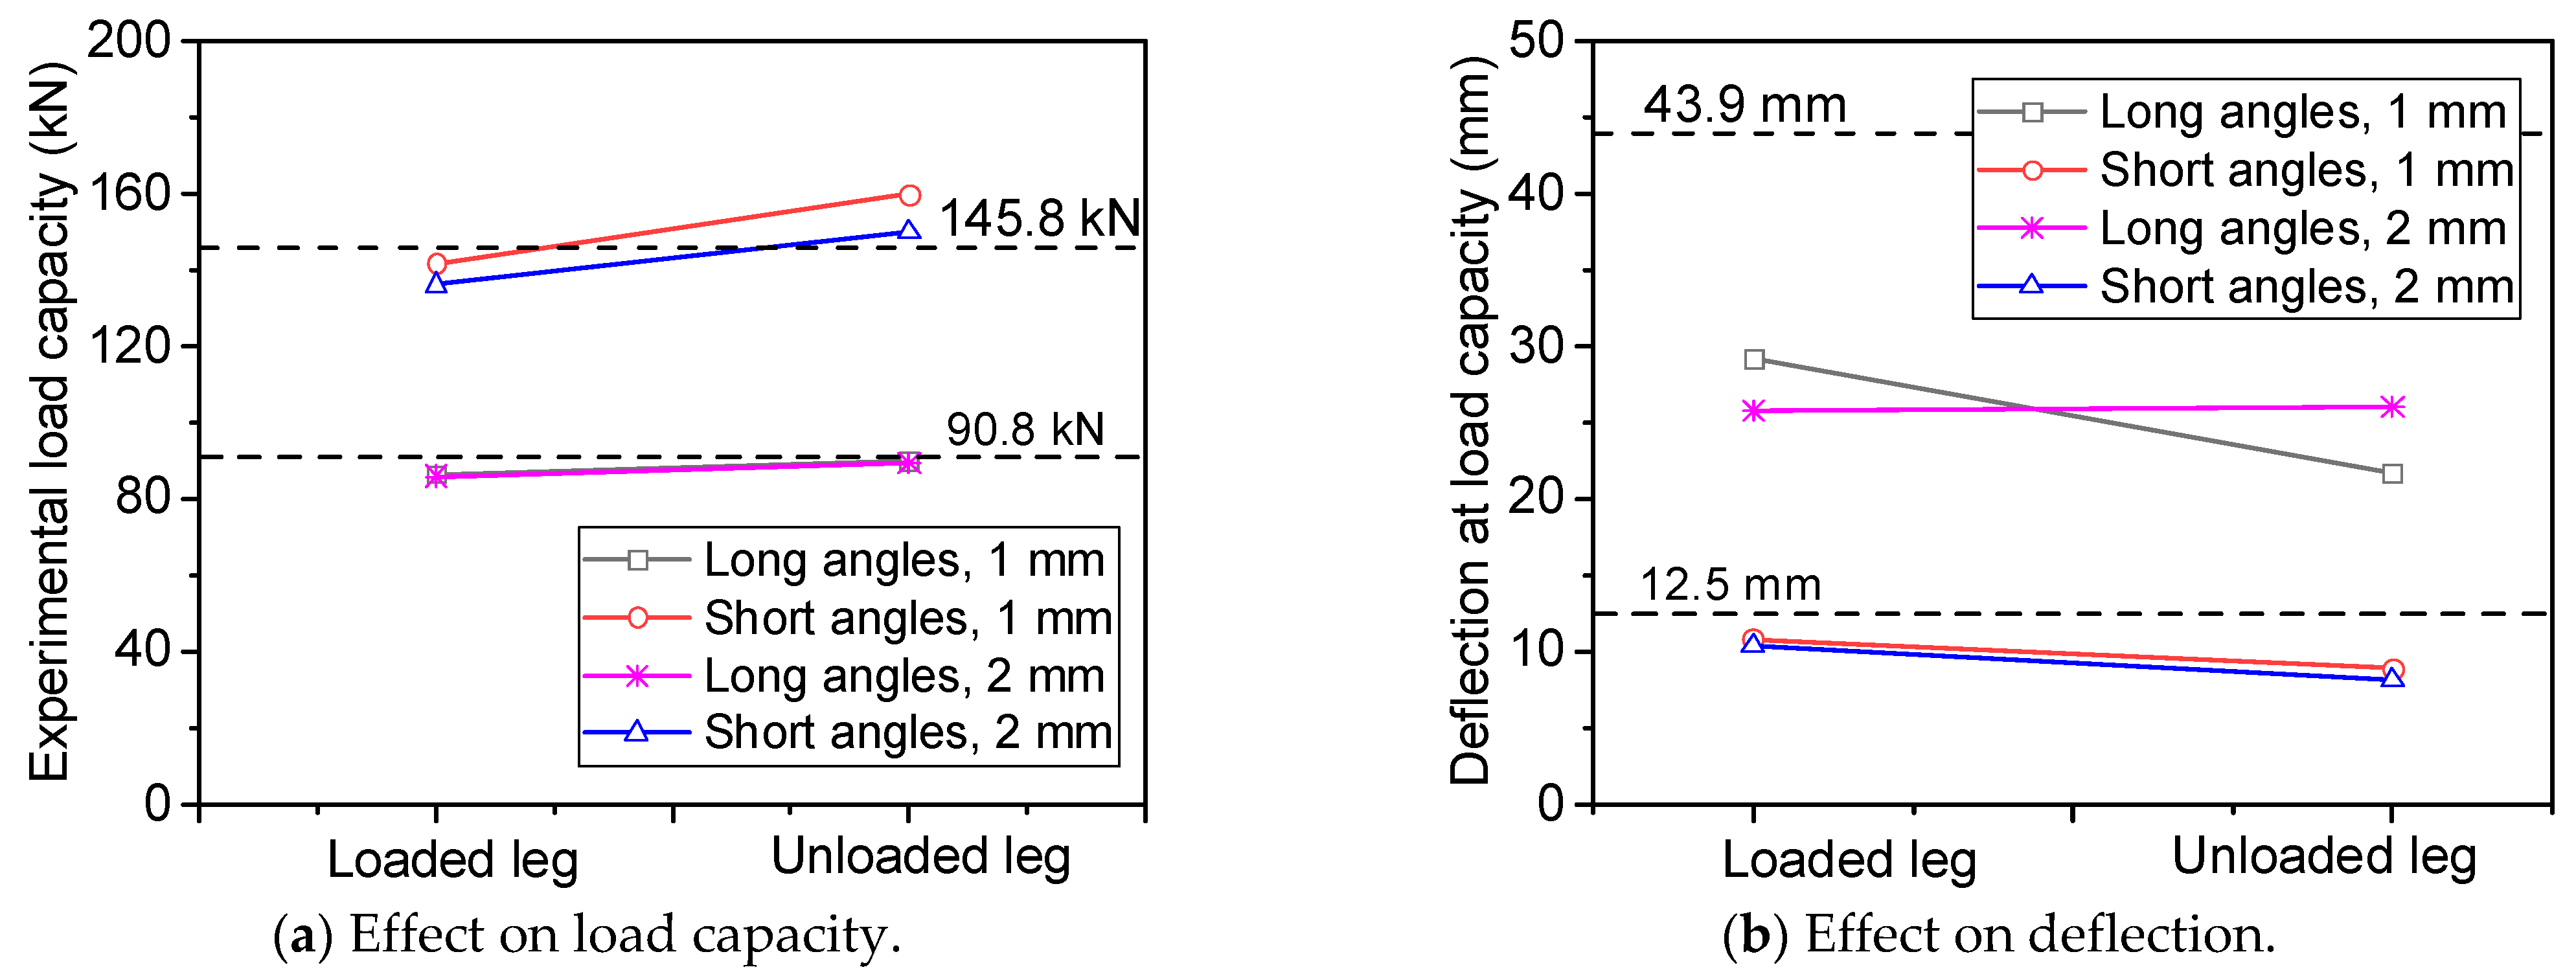
Figure 9 plots the effect of local damage location on the compression behaviour of angles, namely, damage at the loaded leg or the non-loaded leg. It is clear that when the local damage of the angle occurred at the non-loaded leg, its influence on the load-bearing capacity of the angle was not as significant as that at the loaded leg, as shown in Figure 9a. In general, if the slenderness remained identical, the load-bearing capacity of the angle with local damage at the non-loaded leg was slightly greater than the angle with local damage at the loaded leg. For instance, when the local damage exhibited 2 mm thickness, the load-bearing capacity of short angles with it at the non-loaded leg was 150 kN, 10.3% higher than the value of 136 kN when the local damage of the angle was located at the loaded leg. It should also be pointed out that the difference in the two load capacities became smaller when the slenderness of the angle increased from 80 to 140. This was due to the fact that when the local damage was located on the loaded leg, it reduced the effective load-bearing area of the leg, thereby decreasing the overall load capacity. Nonetheless, when the local damage was on the non-loaded leg, the loaded leg could still sustain a significant portion of the compression, and the non-loaded leg was not mobilised to resist the applied load. Consequently, the reduction in load-bearing capacity was not as significant as for the local damage of the angle located at the loaded leg. Figure 9b plots the effect of local damage location on the deflection of the angle associated with the load capacity. It can be observed from the figure that when the local damage of the angle was located at the loaded end, the deflection corresponding to the ultimate load was generally greater than that for the damage at the unloaded end. When the thickness of the local damage was 2 mm, the deflection of short angles with it at the loaded end was 10.4 mm, 28.4% greater than the value of 8.1 mm with the local damage occurred at the non-loaded leg. This resulted from the fact that when the local damage of the angle was located on the loaded leg, the angle experienced more significant stress concentration near the affected area, resulting in greater deformations of the angle. In contrast, when the local damage of the angle was on the non-loaded leg, the damage had a limited impact on the compression behaviour of the angle, as the non-loaded leg only sustained a small portion of the load at the connection.
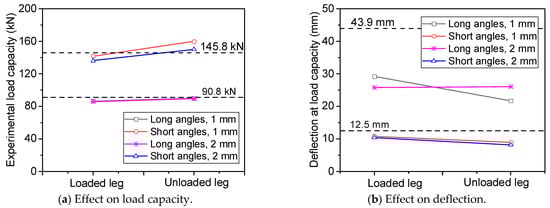
Figure 9.
Effect of local damage location on load capacity and deflection of angles.
4. Numerical Modelling of Angles
4.1. Establishment of Numerical Models
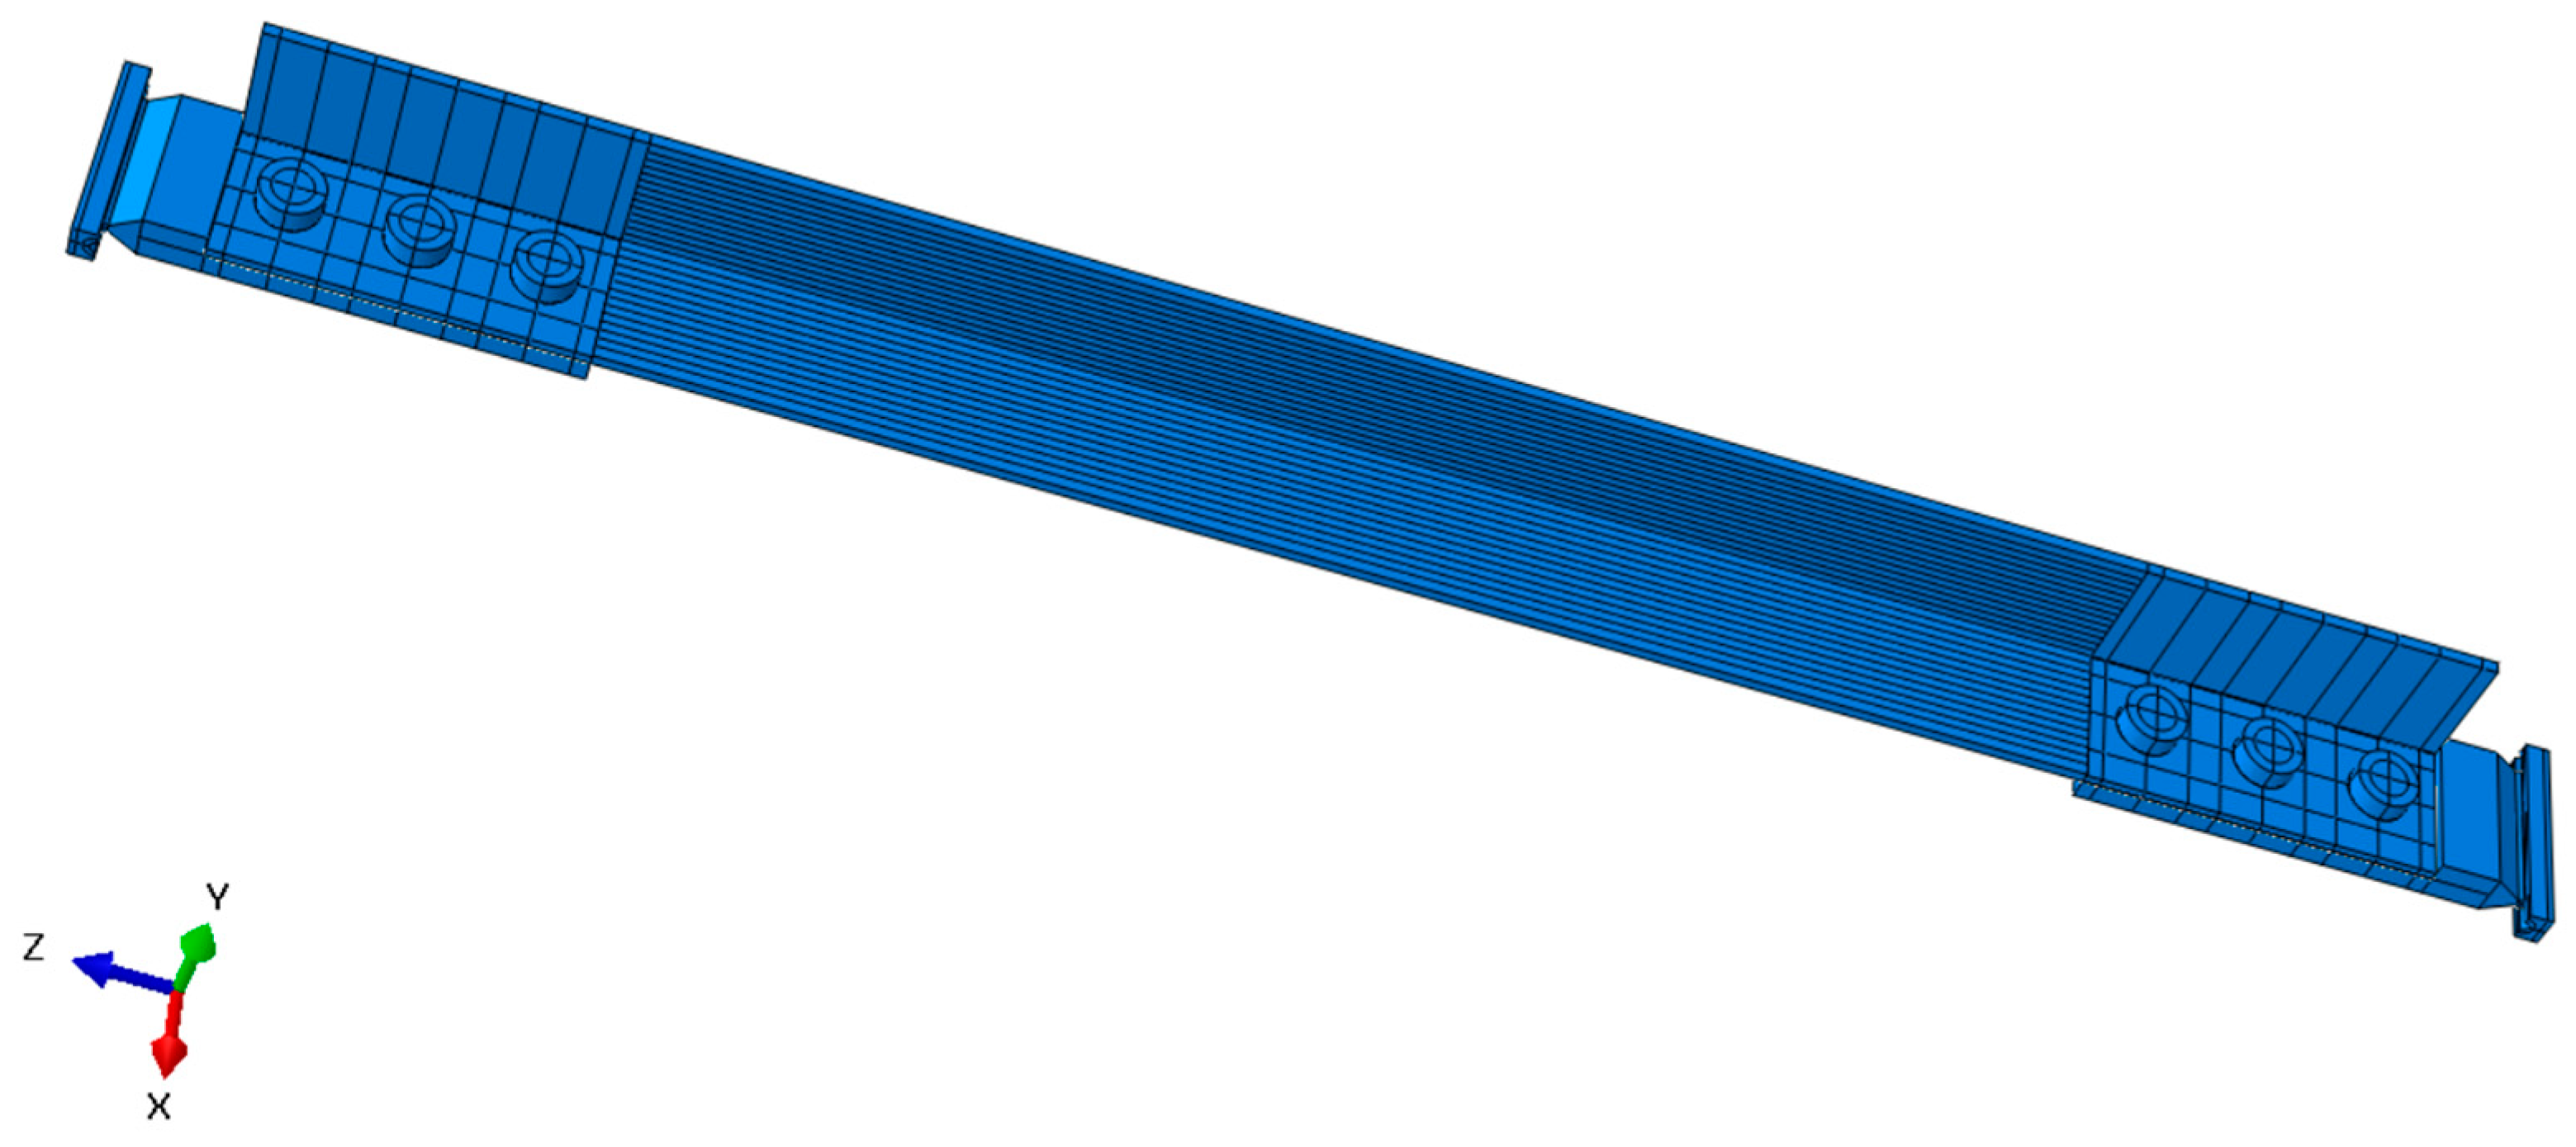
Numerical simulations were performed using ABAQUS [31] to study the effect of local damage on the compression behaviour of angles. Figure 10 plots the numerical model for angles. Eight-node linear hexahedral, reduced integration elements C3D8R were used for the angle, bolts, connection plates and loading plates. Note that the dimension of the end plate was decreased to reduce the total number of elements and to increase the computational efficiency. Hexahedral meshes were used for all components in the specimen. The mech size was selected to be 10 mm along the longitudinal axis, 5 mm across the section, and 2 mm in the thickness direction. Moreover, both local and global seeds were placed in the model to provide higher mesh density at the connection and to capture stress concentration.
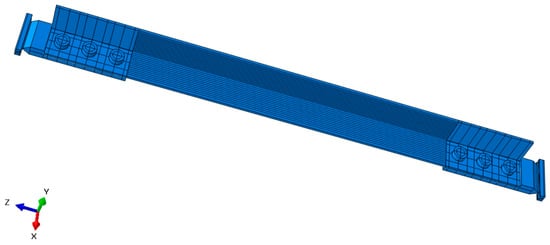
Figure 10.
Numerical models for angles in compression.
Surface-to-surface contact was defined for angles, bolts, and connection and end plates in the model. To define the boundary condition of angles in compression, all freedoms of the loading plate were connected to a reference point using the point-to-surface coupling method. As a hinge connection was employed at the connection plate, only the rotation of the end plate was released, whereas degrees of freedom in other directions were restrained. The loading plate was fully fixed to avoid any displacement or rotation. A compression was imposed on one single steel leg using the displacement control method. A total of four analysis steps were set. In the initial step, interactions between different parts, boundary conditions and other parameters were established. Pre-tightening forces were applied to the bolts in Step-1 and Step-2, and in Step-3, the load was applied.
4.2. Material Properties and Initial Imperfections
The mechanical properties of angles in the numerical model were obtained from property tests on steel coupons, including the yield and ultimate strengths and the modulus of elasticity. A bilinear stress–strain model was defined for steel plates, but the bolt, connection and end plates were assumed to be elastic. As residual stresses were not measured for angles, the simplified residual stress distribution proposed by Wang [32,33] was adopted and applied along the length of angles by defining a prestress field in the model.
4.3. Model Validation
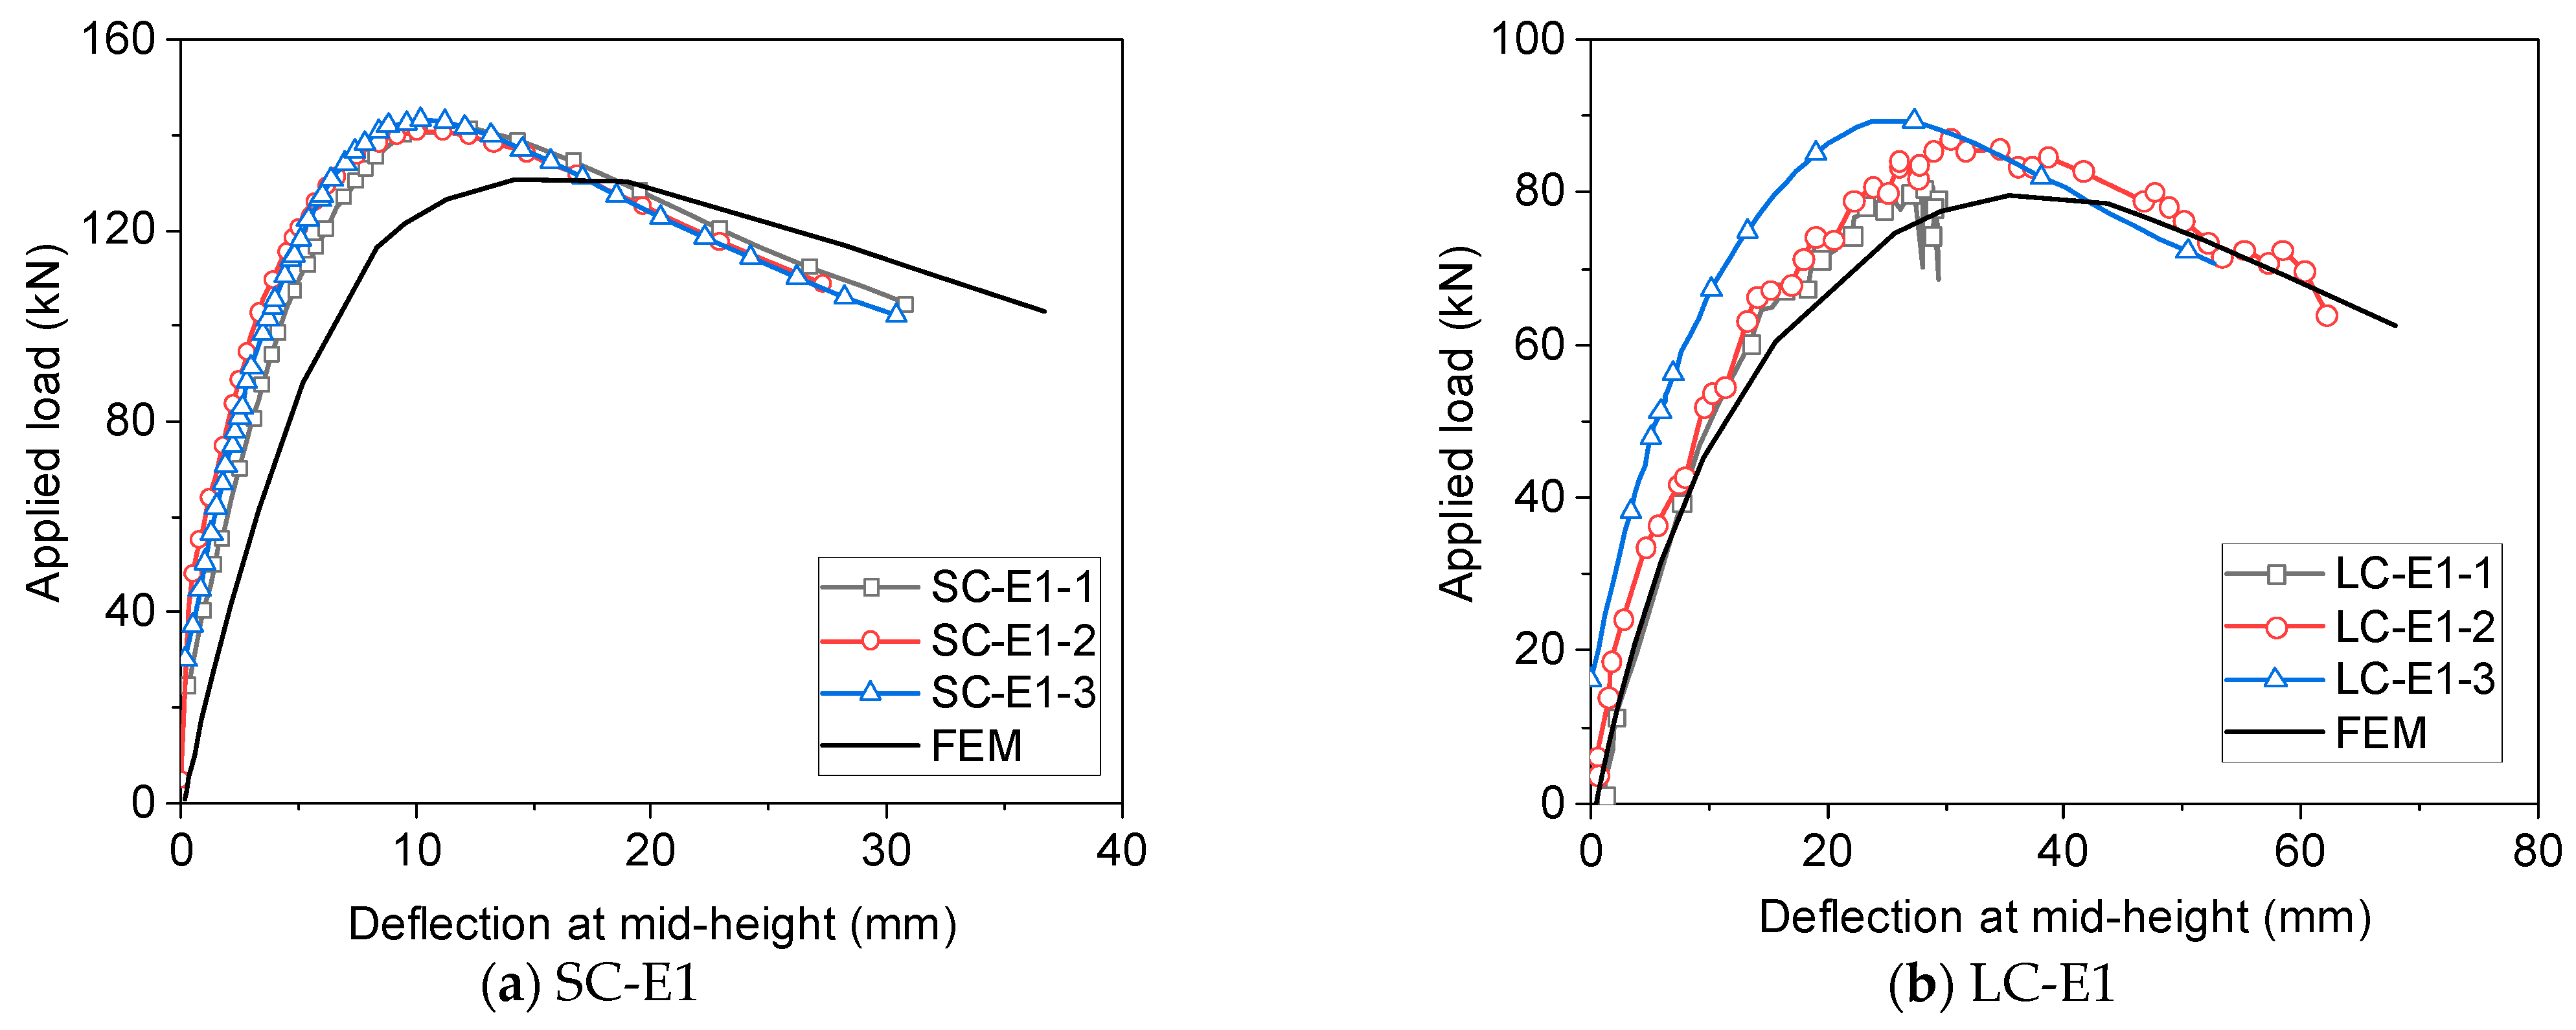
Numerical models were developed for all specimens in compression. Specimens SC-E1, LC-E1, SC-E2 and LC-E2 were selected from the numerical result to compare the load–deflection curve with experimental results, as shown in Figure 11. It is evident that the numerical and experimental curves are in general in good agreement with each other, but the stiffness and ultimate load obtained from the numerical model are smaller than those in the test when an initial bending of 1/1000 of the specimen length is used in the simulation. This difference can be attributed to the assumption of ideal hinges at both ends of the angles. In practise, a certain level of rotational stiffness might exist at the support, which could increase the ultimate load and the initial stiffness of the angles. Moreover, the actual value of the initial bending could be smaller than that assumed in the numerical model, leading to underestimations of the stiffness and ultimate load as well.
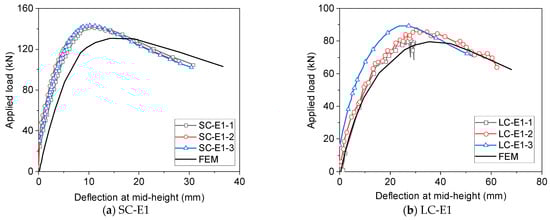
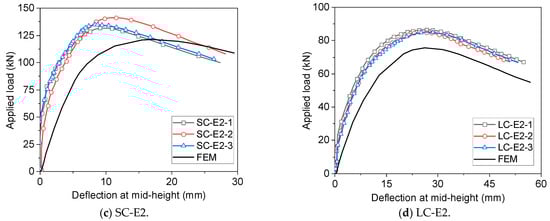
Figure 11.
Comparisons of load–deflection curves between experiment and numerical simulations.
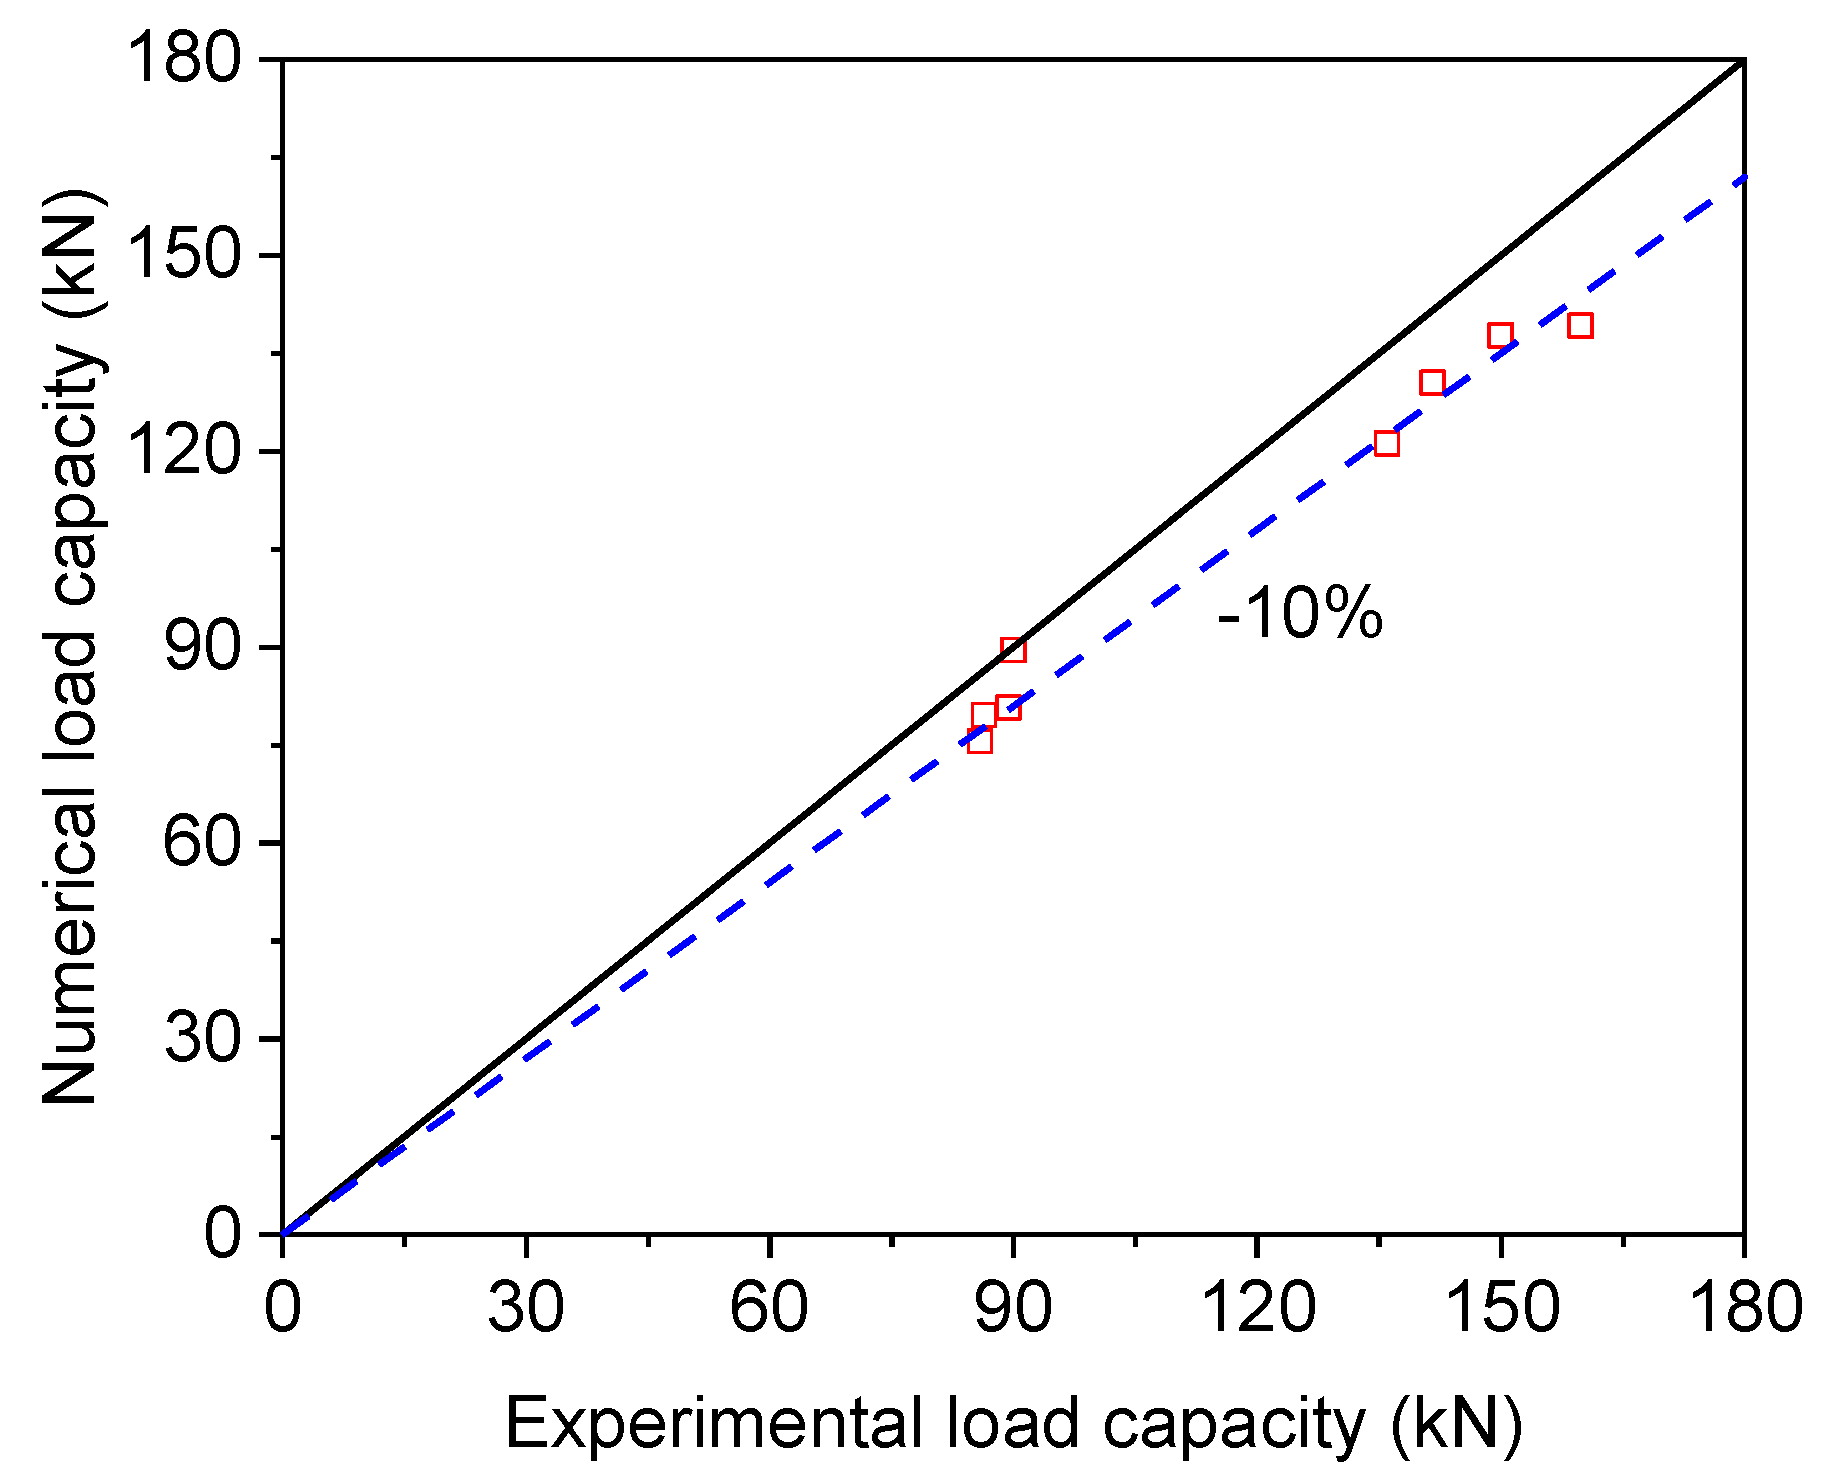
The numerical and experimental ultimate loads of angles are also compared besides the load–deflection curve, as plotted in Figure 12. When the initial bending was taken as 1/1000 of the member length, the average ratio of the numerical to experimental ultimate load is 0.91, with a coefficient of variation of 4.4%. Thus, the numerical model yields reasonable conservative estimations of the ultimate load due to neglecting the rotational restraint and the use of possible smaller initial bending.
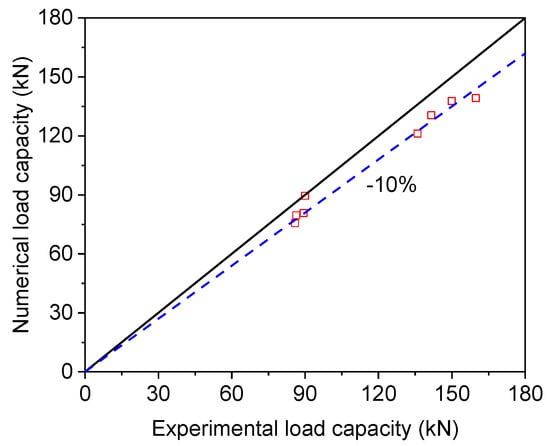
Figure 12.
Comparisons between experimental and numerical ultimate loads.
Figure 13 plots the deformation of angles attained from the numerical simulation. The numerical failure mode matches well with the experimental observation. Moreover, the development of deformation can also be extracted from the numerical model. It is evident from the numerical result that the angle initially bends about the loaded leg and then develops significant twisting prior to failure. The final failure mode features combined flexural and torsional buckling. By increasing the thickness of local damage at the connection, the torsional deformation is concentrated near the connection, thereby reducing the torsional stiffness and the associated load capacity.
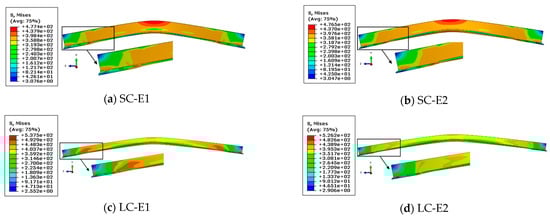
Figure 13.
Failure modes of angles in numerical models and experimental tests.
In contrast, the maximum stress in angles with end local damages occurs at the inner side of the non-loaded leg near the bolt holes, reaching up to 537.5 MPa. This indicates that the end local damages significantly alter the stress distribution, moving the maximum von Mises stress toward the end. Moreover, the observed maximum von Mises stresses are all larger than the yield strength of the angle, indicating that these angles have undergone inelastic buckling.
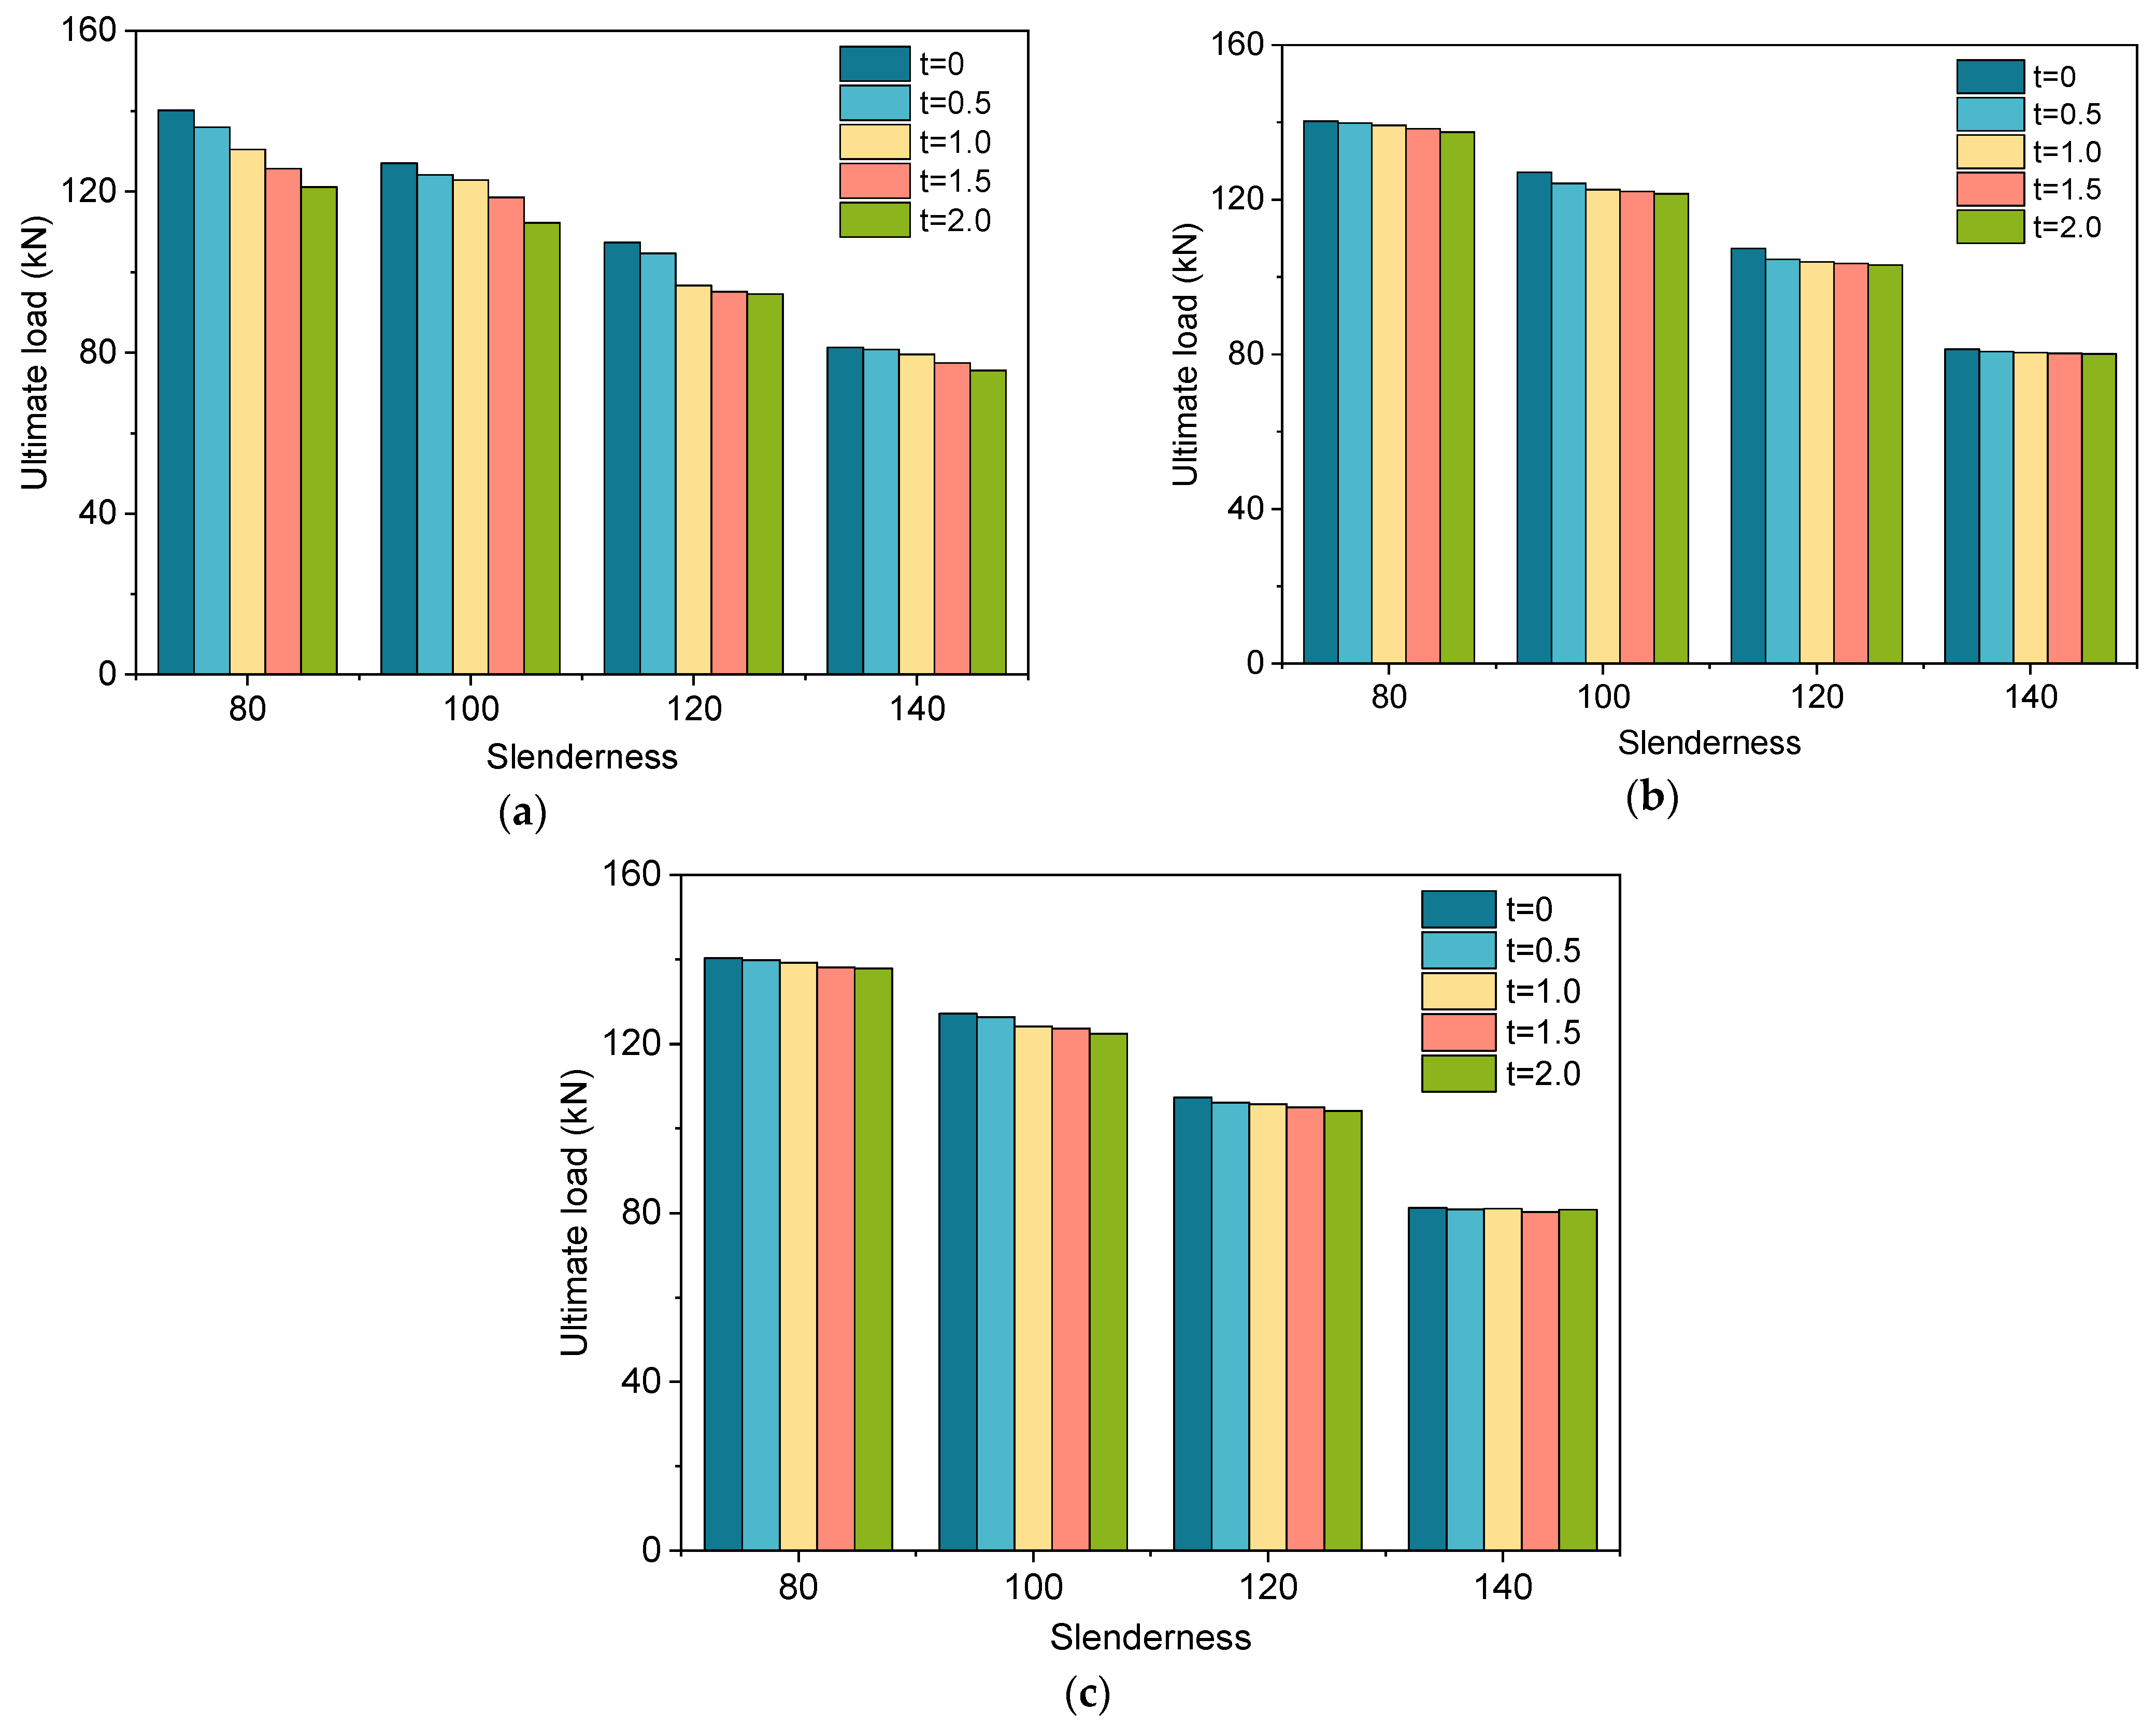
5. Parametric Study
Using the validated numerical model, the effects of slenderness and local damage thickness were further investigated through parametric studies. In the study, four different slendernesses, namely, 80, 100, 120, and 140, were utilised, and the local damage thickness at the loaded leg was selected to be 0.5 mm, 1.0 mm, 1.5 mm, and 2.0 mm. Figure 14 displays the effects of slenderness and the thickness of local damage on the load capacity of angles. It is clear that the ultimate load capacity of angles decreases with increasing slenderness when the thickness of local damage is identical. By increasing the thickness of local damage, the load capacity of the angles is reduced when the local damage occurs at the loaded leg. This effect is more significant when the slenderness is relatively small. With regard to angles of 80, 100, 120, and 140 slendernesses, the ultimate load decreases by 13.6%, 11.6%, 11.9%, and 7.0%, respectively, when the local damage thickness increases from 0 to 2 mm, as plotted in Figure 14a. Nonetheless, when the damage is at the non-loaded leg, the influence of damage on the ultimate load capacity becomes insignificant for the range of local damage thickness in the present study, with a maximum reduction of 4.4%, as plotted in Figure 14b,c.
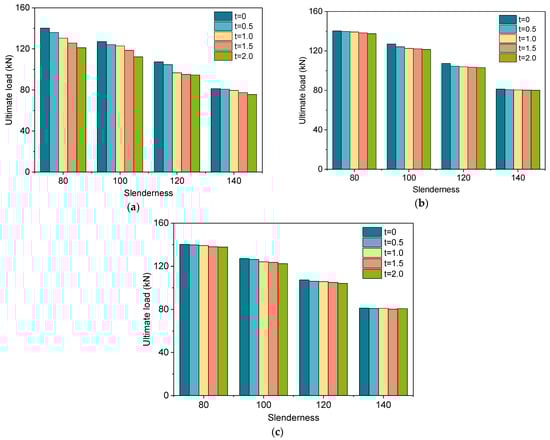
Figure 14.
Effects of slenderness and local damage thickness on load capacity of angles. (a) Angles with local damage at the inner surface of the loaded leg. (b) Angles with local damage at the inner surface of the non-loaded leg. (c) Angles with local damage at the outer surface of the non-loaded leg.
6. Design Equations for Angles
6.1. Existing Design Method
When intact angles are exposed to compression at one leg, the ultimate load can be calculated in accordance with Eurocode 3 [34], expressed in Equation (1).
where is the ultimate load, is the buckling coefficient and can be obtained from Equation (2), is the cross-sectional area of angles, is the yield strength of angles, and is the partial safety factor and can be taken as 1.0.
where is used to determine the reduction factor , is the dimensionless slenderness, is the imperfection factor and can be taken as 0.34, and is the elastic critical force based on the gross cross-sectional properties.
The design load capacity of angles can also be determined according to DL/T5486-2020 [28] in China, as expressed in Equations (5)–(8).
where is the stability coefficient for angles, and is the stability strength reduction factor.
When is smaller than or equal to , the value of can be computed from
Otherwise,
where is the outstanding width of the flange, is the thickness of the steel, and is the limiting width-to-thickness ratio of the steel in axial compression.
6.2. Reduction Factors
Based on numerical results, a series of design equations is proposed to estimate the load-bearing capacity of angles with local damage at the loaded end. In the equation, the effects of slenderness and the damage ratio on load-bearing capacity are considered, as shown in Equation (9).
where is the ultimate load of angles with damage, is the ultimate load of intact angles (the value of can be obtained through experiments or numerical simulations), is a factor considering the influence of slenderness, and is the damage ratio, described as the ratio of the equivalent reduced thickness to the initial thickness of angles (with reference to Equation (10)).
To calculate the damage ratio, the local damage occurred at the loaded end has to be converted to the equivalent reduced thickness of angles, as shown in Equation (11), which depends on the original thickness of angles and the volume ratio of the local damage. The volume ratio of the local damage represents the ratio of the volume of the local damage to the total volume of the intact angle (see Equation (12)) [30].
where is the equivalent reduced thickness of angles, is the original thickness of angles, is the width of angles, is the volume of the local damage, and is the total volume of the intact angle.
The experimental and numerical results indicate that the influence of the damage on the load capacity of angles is more significant if the slenderness is comparatively small. To quantify the effect of slenderness on load-bearing capacity, statistical analyses are performed to obtain the relationship between and the slenderness, as expressed in Equation (13).
where is the slenderness of an angle about its minor axis. It should be noted that should be in the range of 80 and 140 in the present study.
6.3. Validation of Modified Method
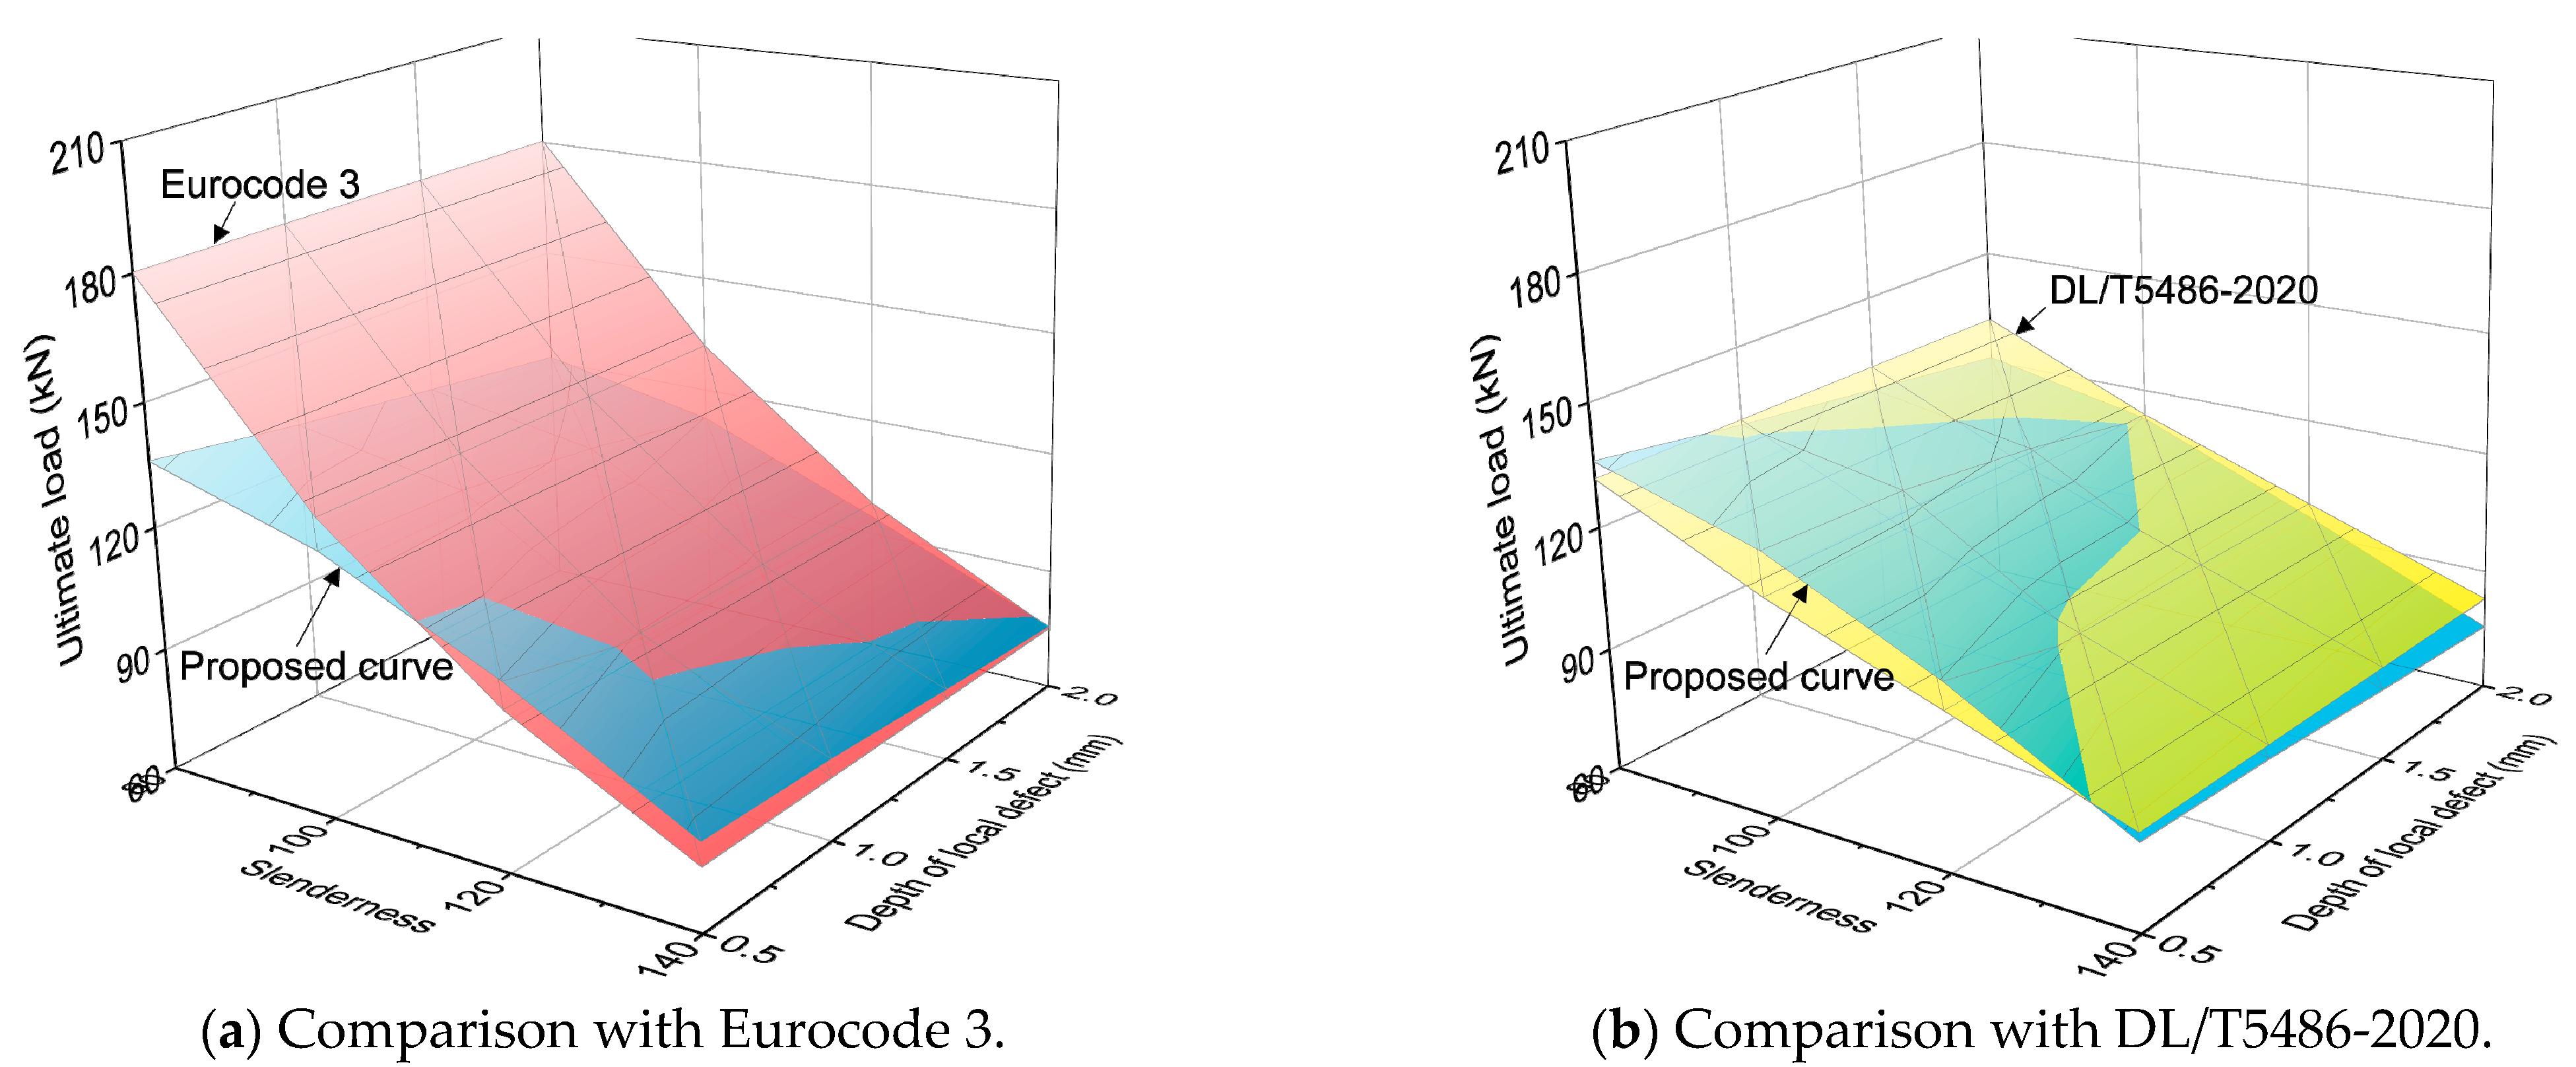
Comparisons are made among ultimate loads calculated according to different design methods, as plotted in Figure 15. It can be observed from Figure 15a that when the slenderness of angles is not less than 120, the design method in Eurocode 3 can be used to evaluate the ultimate load capacity of angles when the local damage thickness at the loaded end is less than or equal to 1.0 mm. Nevertheless, the design method in Eurocode 3 can significantly overestimate the ultimate load for the angles with a slenderness less than 100, this may be due to that Eurocode 3 is primarily intended for members with high slenderness ratios, and it inadequately accounts for the yielding and local damage effects in members with low slenderness ratios. It is also obvious that when the local damage thickness increases to 2.0 mm, the design curve in Eurocode 3 tends to be unconservative. Thus, it can be unsafe when used for angles with relatively little slenderness or with thicker local damage. The design equation in DL/T5486-2020 can also be used to assess the load capacity of angles. It is found from Figure 15b that the design equation is in general conservative when the thickness of local damage at the loaded end is not more than 1.0 mm. However, the method can be slightly unconservative when the damage thickness is greater than 1.0 mm, particularly if the slenderness of angles is 80 or 140. For example, with a 2 mm thickness of local damage, the calculated load capacity per the design method in DL/T5486-2020 is 5.0% greater than the value obtained from the proposed method on average, which may be due to the limitations of the standard formulae for members of high slenderness ratios and significant local damage. When the reduction factor is used, the proposed design equation can accurately estimate the load-bearing capacity of angles with local damage at the loaded end. Therefore, when the engineering conditions are consistent, the design equation can be used to reliably predict the load capacity of corroded angles.
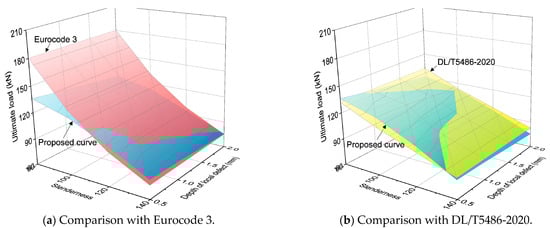
Figure 15.
Comparisons of ultimate loads of angles with different slenderness values and local damage thicknesses at the loaded leg.
7. Conclusions
This paper investigates the buckling behaviour of steel equal-leg angles with local damage at the connection. Compression tests and numerical simulations were conducted on angles loaded at one leg in the study. The load-bearing capacity and failure mode of angles were analysed, and the effects of local damage on the compression behaviour of the angle were also discussed. Design equations were also developed and compared with existing methods. The following conclusions could be drawn from the experimental and numerical studies:
- (1)
- The load capacity of angles decreased with an increase in the thickness of local damage at the loaded leg, particularly if the slenderness of angles was 80, and the load capacity decreased by up to 6.7%. However, when the local damage of the angle was at the non-loaded leg, its influence on the load capacity was insignificant, and the reduction in the load capacity was within 2%.
- (2)
- All angles developed combined flexural and torsional buckling during loading at one leg. When the local damage thickness reached 2 mm, the local buckling of the angles near the connection was also observed due to the reduced thickness of the angle.
- (3)
- A parametric study suggests that the reduction in load capacity induced by local damage at the loaded end needs to be considered in design. When the slenderness of the angle is 100 and the local damage increases from 0 mm to 2 mm, the load-bearing capacity of the angle steel decreases from 127.1 kN to 112.3 kN, representing a reduction of 11.6%. But the influence of local damage at the non-loaded leg can be neglected as a result of the marginal effect on load capacity, and the reduction is only 4.4%.
- (4)
- Design equations are proposed based on numerical results, in which the influences of the damage thickness and slenderness of angles are considered. Comparisons with Eurocode 3 and DL/T5486-2020 show that Eurocode 3 can be unsafe when the slenderness of the angle is small but the local damage thickness is large, whereas DL/T5486-2020 can be unconservative when the slenderness of the angle is large.
Author Contributions
Formal analysis, C.X.; Investigation, H.-Q.Y.; Writing—original draft, C.X.; Writing—review & editing, H.-Q.Y. and S.-B.K.; Funding acquisition, S.-B.K. All authors have read and agreed to the published version of the manuscript.
Funding
This research received no external funding.
Data Availability Statement
The data presented in this study are available on request from the corresponding author.
Acknowledgments
The authors gratefully acknowledge the support provided by the Structural Laboratory of Chongqing University.
Conflicts of Interest
Author Cheng Xu was employed by the company China Southern Power Grid. The remaining authors declare that the research was conducted in the absence of any commercial or financial relationships that could be construed as a potential conflict of interest.
References
- Cinitha, A.; Umesha, P.K.; Iyer, N.R. An overview of corrosion and experimental studies on corroded mild steel compression members. KSCE J. Civ. Eng. 2014, 18, 1735–1744. [Google Scholar] [CrossRef]
- Chen, S.F. Elastic and inelastic stability capacity of single angle under axial compression. J. Build. Struct. 2012, 33, 134–141. [Google Scholar]
- Adluri, S.M.R.; Madugula, M.K.S. Flexural buckling of steel angles: Experimental investigation. J. Struct. Eng.-Asce 1996, 122, 309–317. [Google Scholar] [CrossRef]
- Bathon, L.; Mueller, W.H.; Kempner, L. Ultimate Load Capacity of Single Steel Angles. J. Struct. Eng. 1993, 119, 279–300. [Google Scholar] [CrossRef]
- Bashar, I.; Amanat, K.M. Comparison of Codes for Axial Compression Capacity of Eccentrically Loaded Single Angles. J. Constr. Steel Res. 2021, 185, 106829. [Google Scholar] [CrossRef]
- Elgaaly, M.; Dagher, H.; Davids, W. Behavior of Single-Angle-Compression Members. J. Struct. Eng. 1991, 117, 3720–3741. [Google Scholar] [CrossRef]
- Liu, Y.; Hui, L. Experimental study of beam–column behaviour of steel single angles. J. Constr. Steel Res. 2008, 64, 505–514. [Google Scholar] [CrossRef]
- Zhou, F.; Lim, J.B.P.; Young, B. Ultimate Compressive Strength of Cold-Formed Steel Angle Struts Loaded through a Single Bolt. Adv. Struct. Eng. 2016, 15, 1583–1595. [Google Scholar] [CrossRef]
- Kettler, M.; Taras, A.; Unterweger, H. Member capacity of bolted steel angles in compression—Influence of realistic end supports. J. Constr. Steel Res. 2017, 130, 22–35. [Google Scholar] [CrossRef]
- Shi, G.; Liu, Z.; Zhang, Y.; Shi, Y.J.; Wang, Y.Q. Study on the Local Buckling Behavior of Steel Equal Angle Members under Axial Compression with the Steel Strength Variation. Adv. Mater. Res. 2011, 374–377, 2430–2436. [Google Scholar] [CrossRef]
- Fasoulakis, Z.C.; Lignos, X.A.; Avraam, T.P.; Katsatsidis, S.P. Investigation on single-bolted cold-formed steel angles with geometric imperfections under compression. J. Constr. Steel Res. 2019, 162, 105733. [Google Scholar] [CrossRef]
- Qu, S.; Guo, Y.; Sun, Q. Resistances of high-strength steel equal-leg-angle section columns eccentrically connected by one leg. J. Constr. Steel Res. 2022, 191, 107143. [Google Scholar] [CrossRef]
- Qu, S.; Wang, J.; Guo, Y.; Hao, J.; Yang, X. Experiment and code-based study on high-strength steel pin-ended angles under axial compression. Thin-Walled Struct. 2020, 149, 106541. [Google Scholar] [CrossRef]
- Wang, F.; Liang, Y.; Zhao, O.; Young, B. Pin-ended press-braked S960 ultra-high strength steel angle section columns: Testing, numerical modelling and design. Eng. Struct. 2021, 228, 111418. [Google Scholar] [CrossRef]
- Zhang, L.; Liang, Y.; Zhao, O. Flexural-torsional buckling behaviour and resistances of fixed-ended press-braked S690 high strength steel angle section columns. Eng. Struct. 2020, 223, 111180. [Google Scholar] [CrossRef]
- Beaulieu, L.V.; Legeron, F.; Langlois, S. Compression strength of corroded steel angle members. J. Constr. Steel Res. 2010, 66, 1366–1373. [Google Scholar] [CrossRef]
- Shu, Q.; Wang, K.; Yuan, G.; Zhang, Y.; Lu, L.; Liu, Z. Assessing capacity of corroded angle members in steel structures based on experiment and simulation. Constr. Build. Mater. 2020, 244, 118210. [Google Scholar] [CrossRef]
- Gao, C.; Liu, J.; Zheng, Y.; Wu, B.; Chu, Z. Effect of Corrosion on Mechanical Properties of Transmission Tower Angle Steel. Corros. Prot. 2020, 41, 32–38. [Google Scholar]
- Zhang, C.T.; Fan, W.L.; Li, Z.L. Quasi-Static Test of Q345 Equal-Angles in Corrosion Environment. Eng. Mech. 2014, 31, 53–62. [Google Scholar]
- Ye, J.H.; Shen, H.Q.; Xue, S.D. Simplified analytical method of mechanical property degradation for steel members with pitting corrosion. J. Harbin Inst. Technol. 2016, 48, 70–75. [Google Scholar]
- Wang, X. Study on the Bearing Performance of Q420 Equal Angle Steel Subjected to Local Corrosion. Master’s Thesis, Wuhan University, Wuhan, China, 2021. [Google Scholar]
- Mateus, A.; Witz, J.A. On the Post-buckling of Corroded Steel Plates used in Marine Structures. 1999. Available online: https://www.semanticscholar.org/paper/On-the-Post-buckling-of-Corroded-Steel-Plates-used-Mateus-Witz/62f21427eb2c5e79b27ae9ce7f09e9b373b0bbc8 (accessed on 24 September 2024).
- Oszvald, K.; Tomka, P.; Dunai, L. The remaining load-bearing capacity of corroded steel angle compression members. J. Constr. Steel Res. 2016, 120, 188–198. [Google Scholar] [CrossRef]
- Luo, Z.; Li, Q.; Xu, C.; Hu, H.; Zhang, D.; Han, X. Experimental and theoretical investigations on axial bearing capacity of steel angle members with local corrosion on their limb peaks. Constr. Build. Mater. 2023, 363, 129862. [Google Scholar] [CrossRef]
- Sarveswaran, V.; Smith, J.W.; Blockley, D.I. Reliability of corrosion-damaged steel structures using interval probability theory. Struct. Saf. 1998, 20, 237–255. [Google Scholar] [CrossRef]
- Hisazumi, K.; Kanno, R. Column Buckling of Corroded Steel Angles and Channels: Experiments and Failure Mode Analyses. J. Struct. Eng. 2021, 147, 04021106. [Google Scholar] [CrossRef]
- Huang, Y.; Su, Z.G.; Zhu, B.R.; Chen, Y.X.; Wan, T.; Tuo, Z.X. The influence of corrosion on the bearing capacity characteristics of overhead transmission line tower. Nonferrous Met. Sci. Eng. 2023, 1–11. [Google Scholar]
- DL/T5486-2020; Management Committee for National Standards, Technical Specification for the Design of Steel Supporting Structures of Overhead Transmission Line. China Planning Publishing House Distribution Department: Beijing, China, 2020.
- GB/T 228.1-2010; Management Committee for National Standards, Metallic materials-Tensile Testing Part 1: Method of Test at Room Temperature. General Administration of Quality Supervision, Inspection and Quarantine of the People’s Republic of China: Beijing, China, 2010.
- Huang, X.; He, S.-Y.; Liu, X.-Y.; Han, D.-G.; Pu, F.; Yan, H.-Q.; Kang, S.-B. Compression behaviour of Q355 steel equal-leg angles with simulated local defects at the mid-height. J. Constr. Steel Res. 2024, 217, 108673. [Google Scholar] [CrossRef]
- Dassault Systèmes. ABAQUS, version 2020; Dassault Systèmes Simulia Corp.: Providence, RI, USA, 2019. [Google Scholar]
- Wang, G.Z. The Influence of Residual Stress on the Bearing Capacity of Steel Tie Rods: Overview and Theoretical Analysis (1). Metall. Constr. 1981, 8, 15–19. [Google Scholar]
- Wang, G.Z. The Influence of Residual Stress on the Bearing Capacity of Steel Tie Rods: Overview and Theoretical Analysis (2). Metall. Constr. 1981, 9, 31–36. [Google Scholar]
- EN 1993-1-1; European Committee for Standardization. Eurocode 3: Design of steel structures—Part 1-1: General rules and rules for buildings. CEN: Brussels, Belgium, 2005.


Disclaimer/Publisher’s Note: The statements, opinions and data contained in all publications are solely those of the individual author(s) and contributor(s) and not of MDPI and/or the editor(s). MDPI and/or the editor(s) disclaim responsibility for any injury to people or property resulting from any ideas, methods, instructions or products referred to in the content. |
© 2024 by the authors. Licensee MDPI, Basel, Switzerland. This article is an open access article distributed under the terms and conditions of the Creative Commons Attribution (CC BY) license (https://creativecommons.org/licenses/by/4.0/).