
Multi-Domain Environmental Quality of Indoor Mixed-Use Open Spaces and Insights into Healthy Living—A Quarantine Hotel Case Study

Abstract
1. Introduction
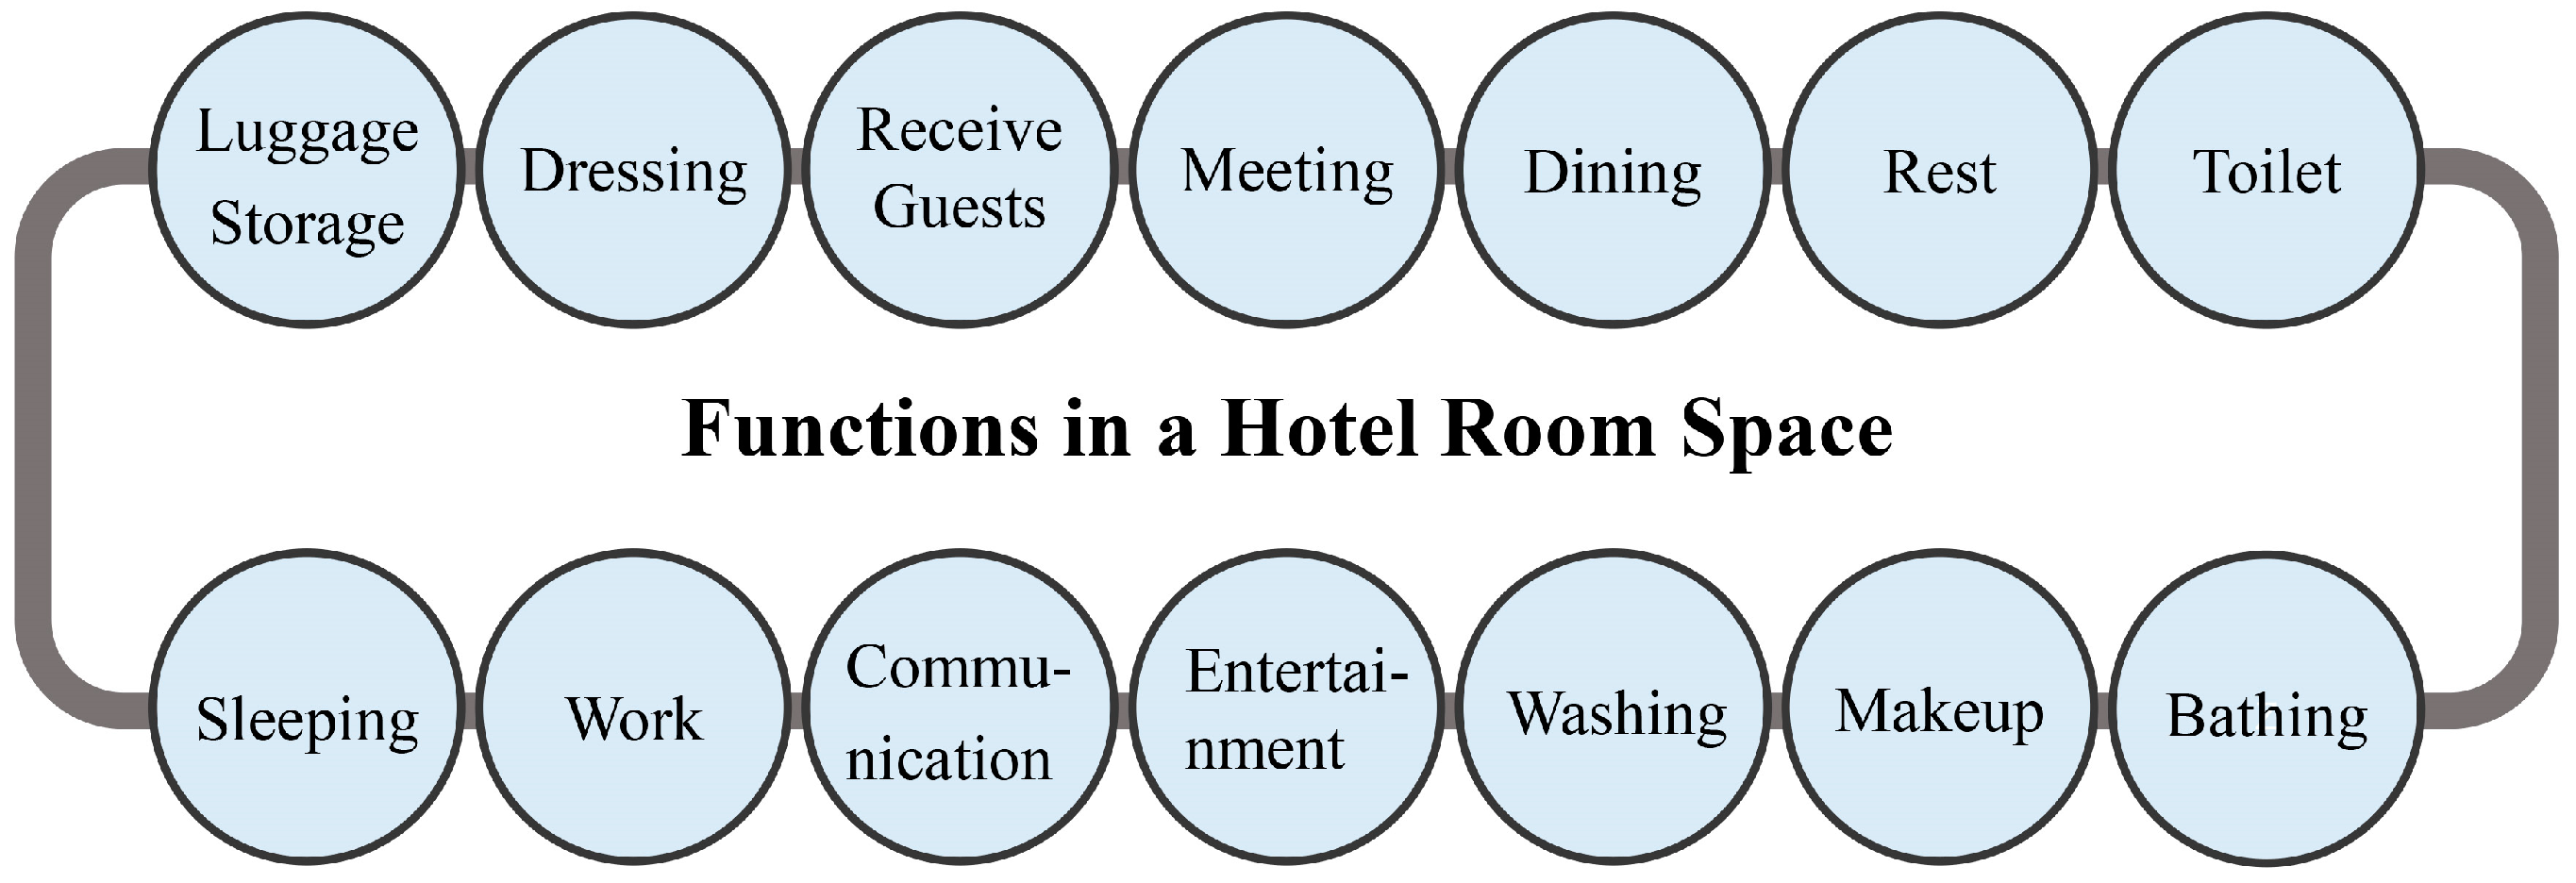
1.1. Mixed-Use and Open: From Urban Blocks to Architectural Spaces
1.2. Literature Review
1.3. Research Objectives
- To evaluate the environmental performance characteristics of mixed-use and open hotel room spaces, including chemical pollutant concentration, physical environmental performance, and heat stress conditions;
- To assess the variations in indoor environmental quality across functional zones in mixed-use and open hotel room spaces;
- To examine the relationships between physical conditions and chemical pollutant concentrations in mixed-use and open hotel room spaces;
- To provide preliminary insights into the improvement of environmental quality in mixed-use and open hotel room spaces and future further investigation.
2. Theoretical Framework
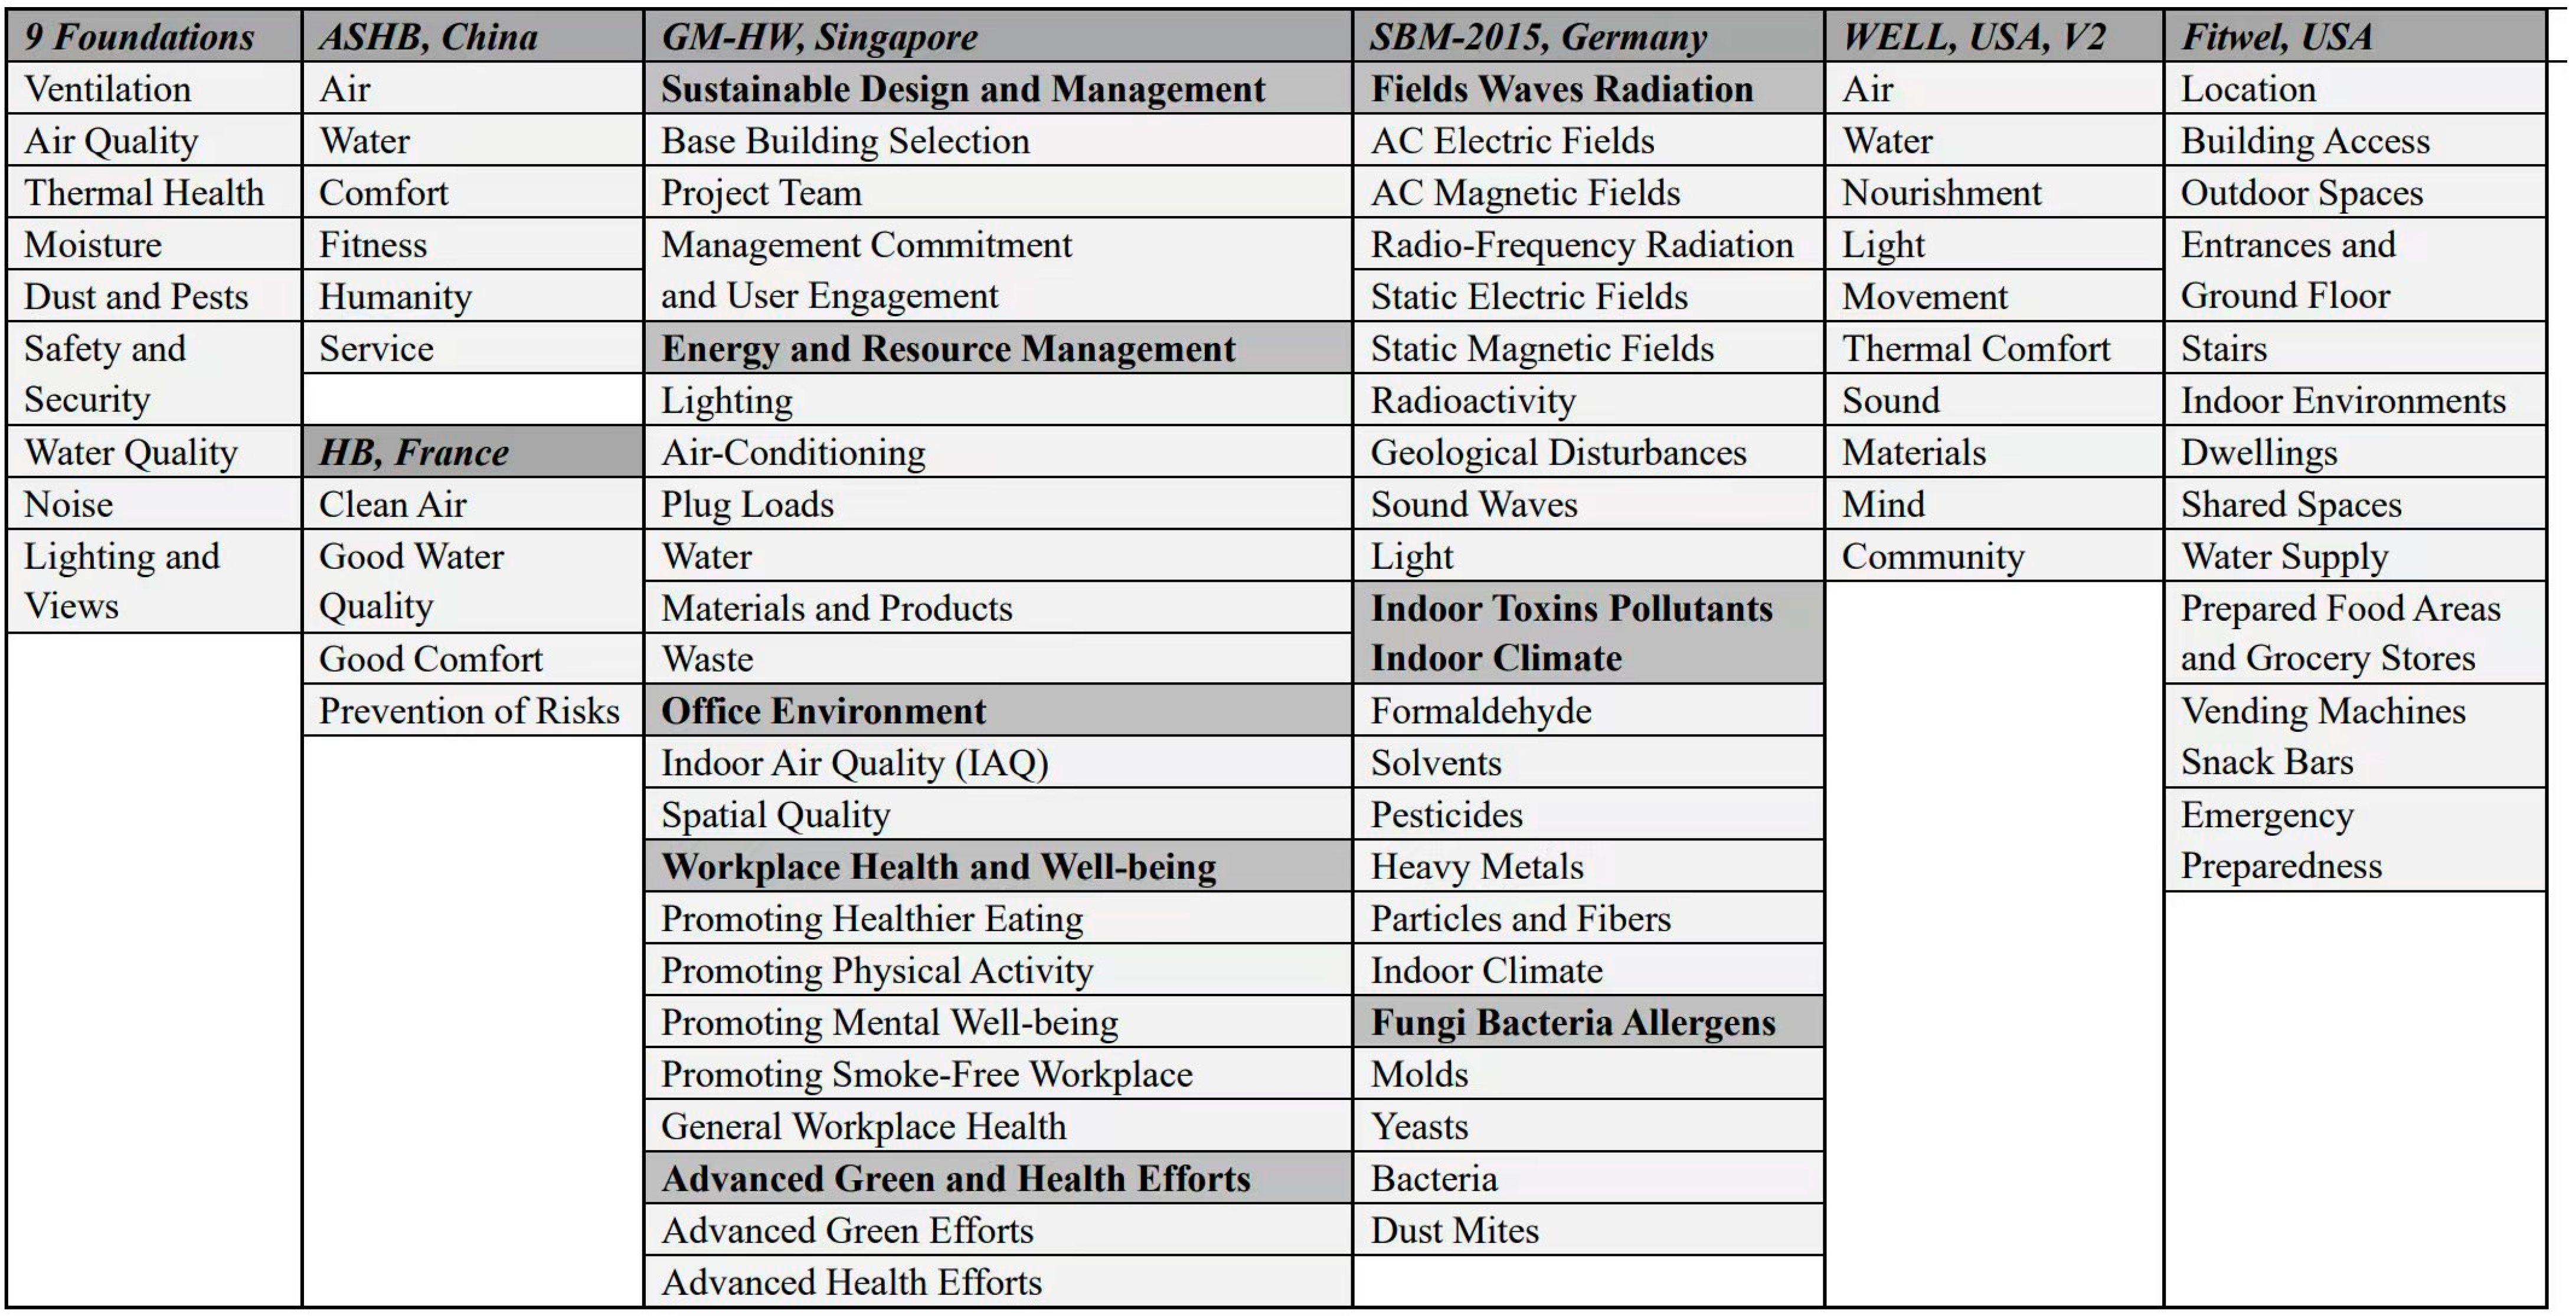
2.1. Healthy Building Concept
2.2. Healthy Building Evaluation Dimensions
2.2.1. Chemical-Physical Dimension
- Air Quality: Reduce the concentrations of air pollutants, such as CO, CO2, PM2.5, formaldehyde, and TVOC.
- Thermal environment: maintain a thermally comfortable indoor environment, as well as keep good ventilation.
- Lighting condition: Adopt reasonable use of natural light and energy saving artificial lighting equipment.
- Acoustic environment: Implement highly efficient sound insulation measures to reduce noise interference.
- Building materials and decoration: Utilize environmentally friendly and healthy materials to reduce indoor pollution.
2.2.2. Psychological Dimension
- Spatial layout: Optimize the spatial layout to enhance the occupant’s satisfaction of living and working.
- Environmental color: Consider color harmony to create a comfortable atmosphere.
- View: Provide good views to promote visual comfort and mental health.
- Healing space: Offer meditation, catharsis, and psychological counseling spaces to alleviate undesirable psychological conditions.
2.2.3. Socio-Cultural Dimension
- Social connection: Promote communication and interactions among occupants and enhance community cohesion.
- Community services: Offer access to service facilities and amenities (e.g., gyms and swimming pools, and community libraries) to meet occupants’ needs of daily life.
- Barrier-free designed spaces: Pay attention to the needs of special groups and ensure barrier-free access.
2.2.4. Facility Dimension
- Water quality: Provide safe and clean drinking water.
- Health promotion facilities: Offer shared fitness spaces to encourage healthy lifestyles and inspire exercises.
- Health-risk monitoring systems: Employ intelligent monitoring systems to assess the interior environmental quality and occupants’ physical conditions and mental health.
3. Materials and Methods
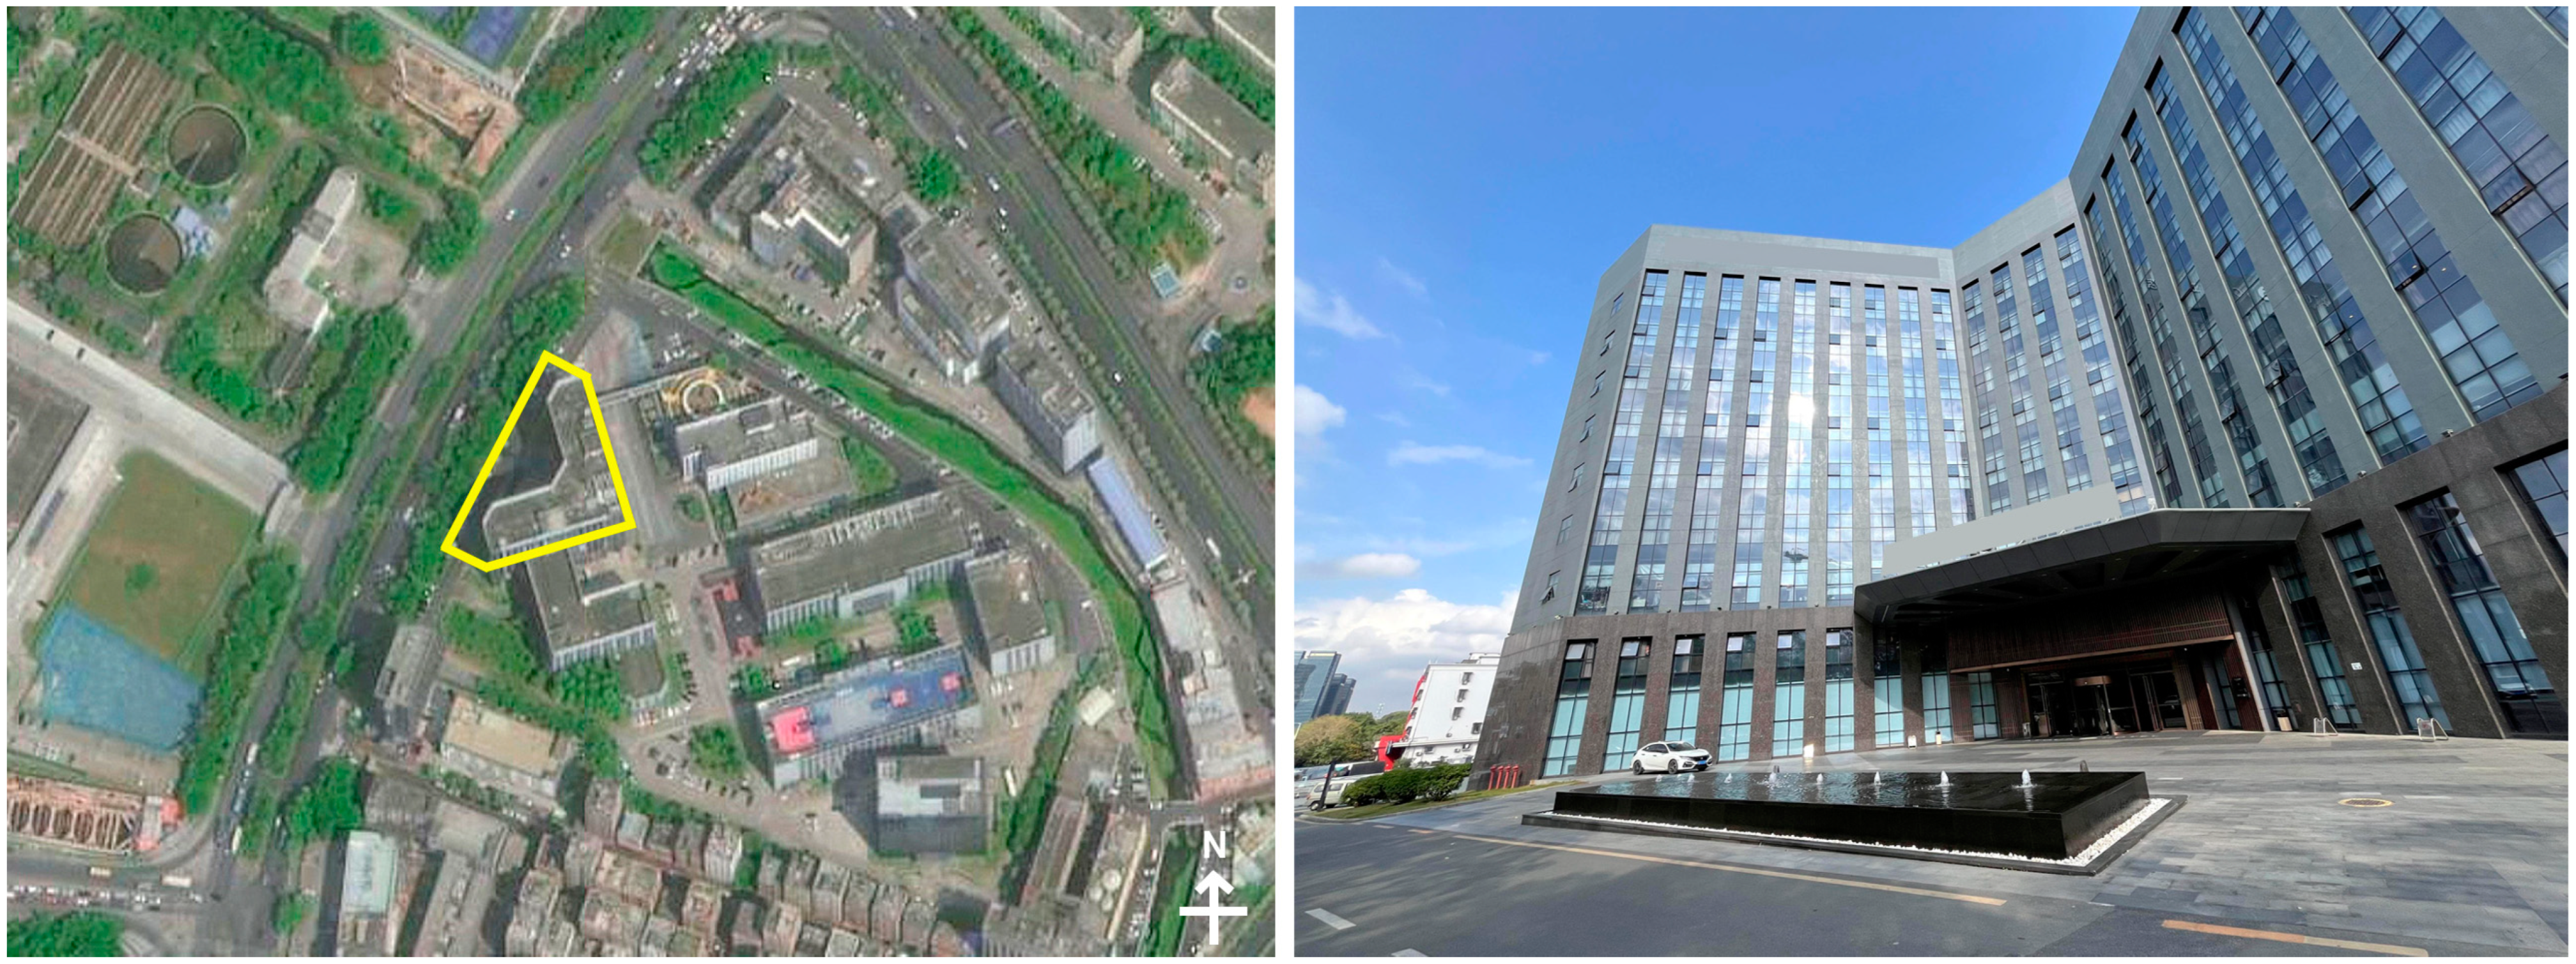
3.1. Case Study City and Context
3.1.1. Background Context of the City
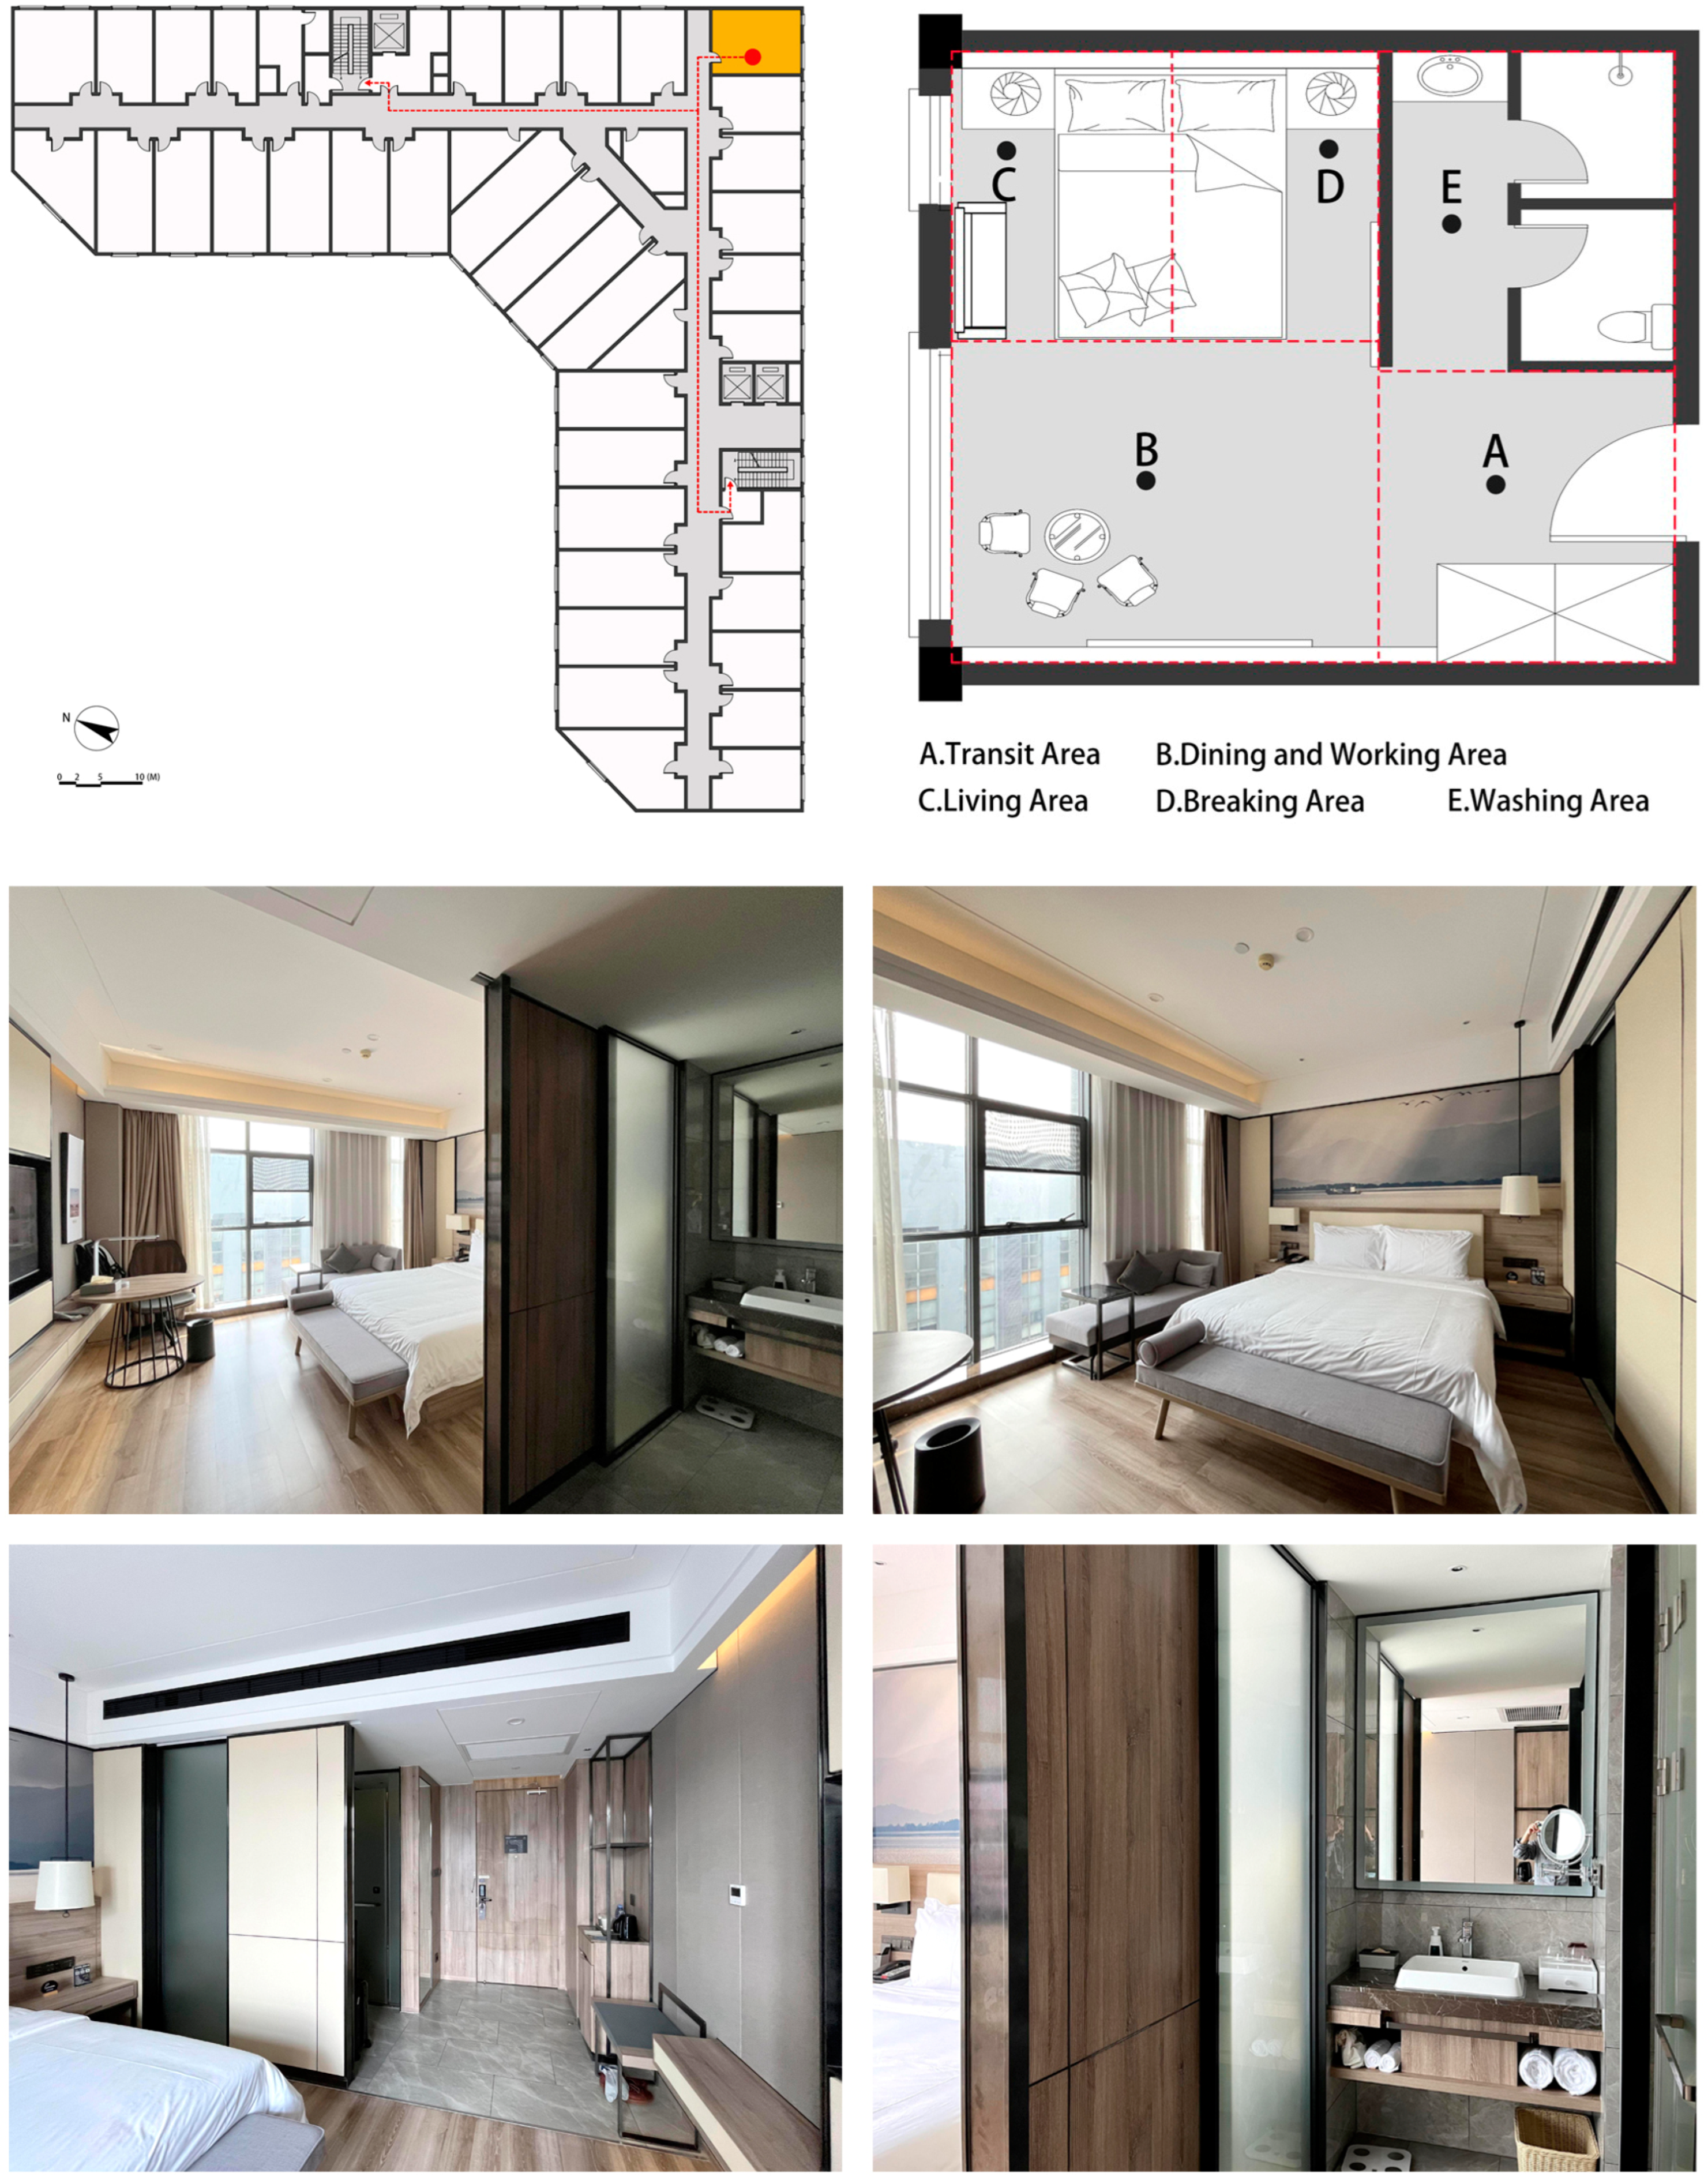
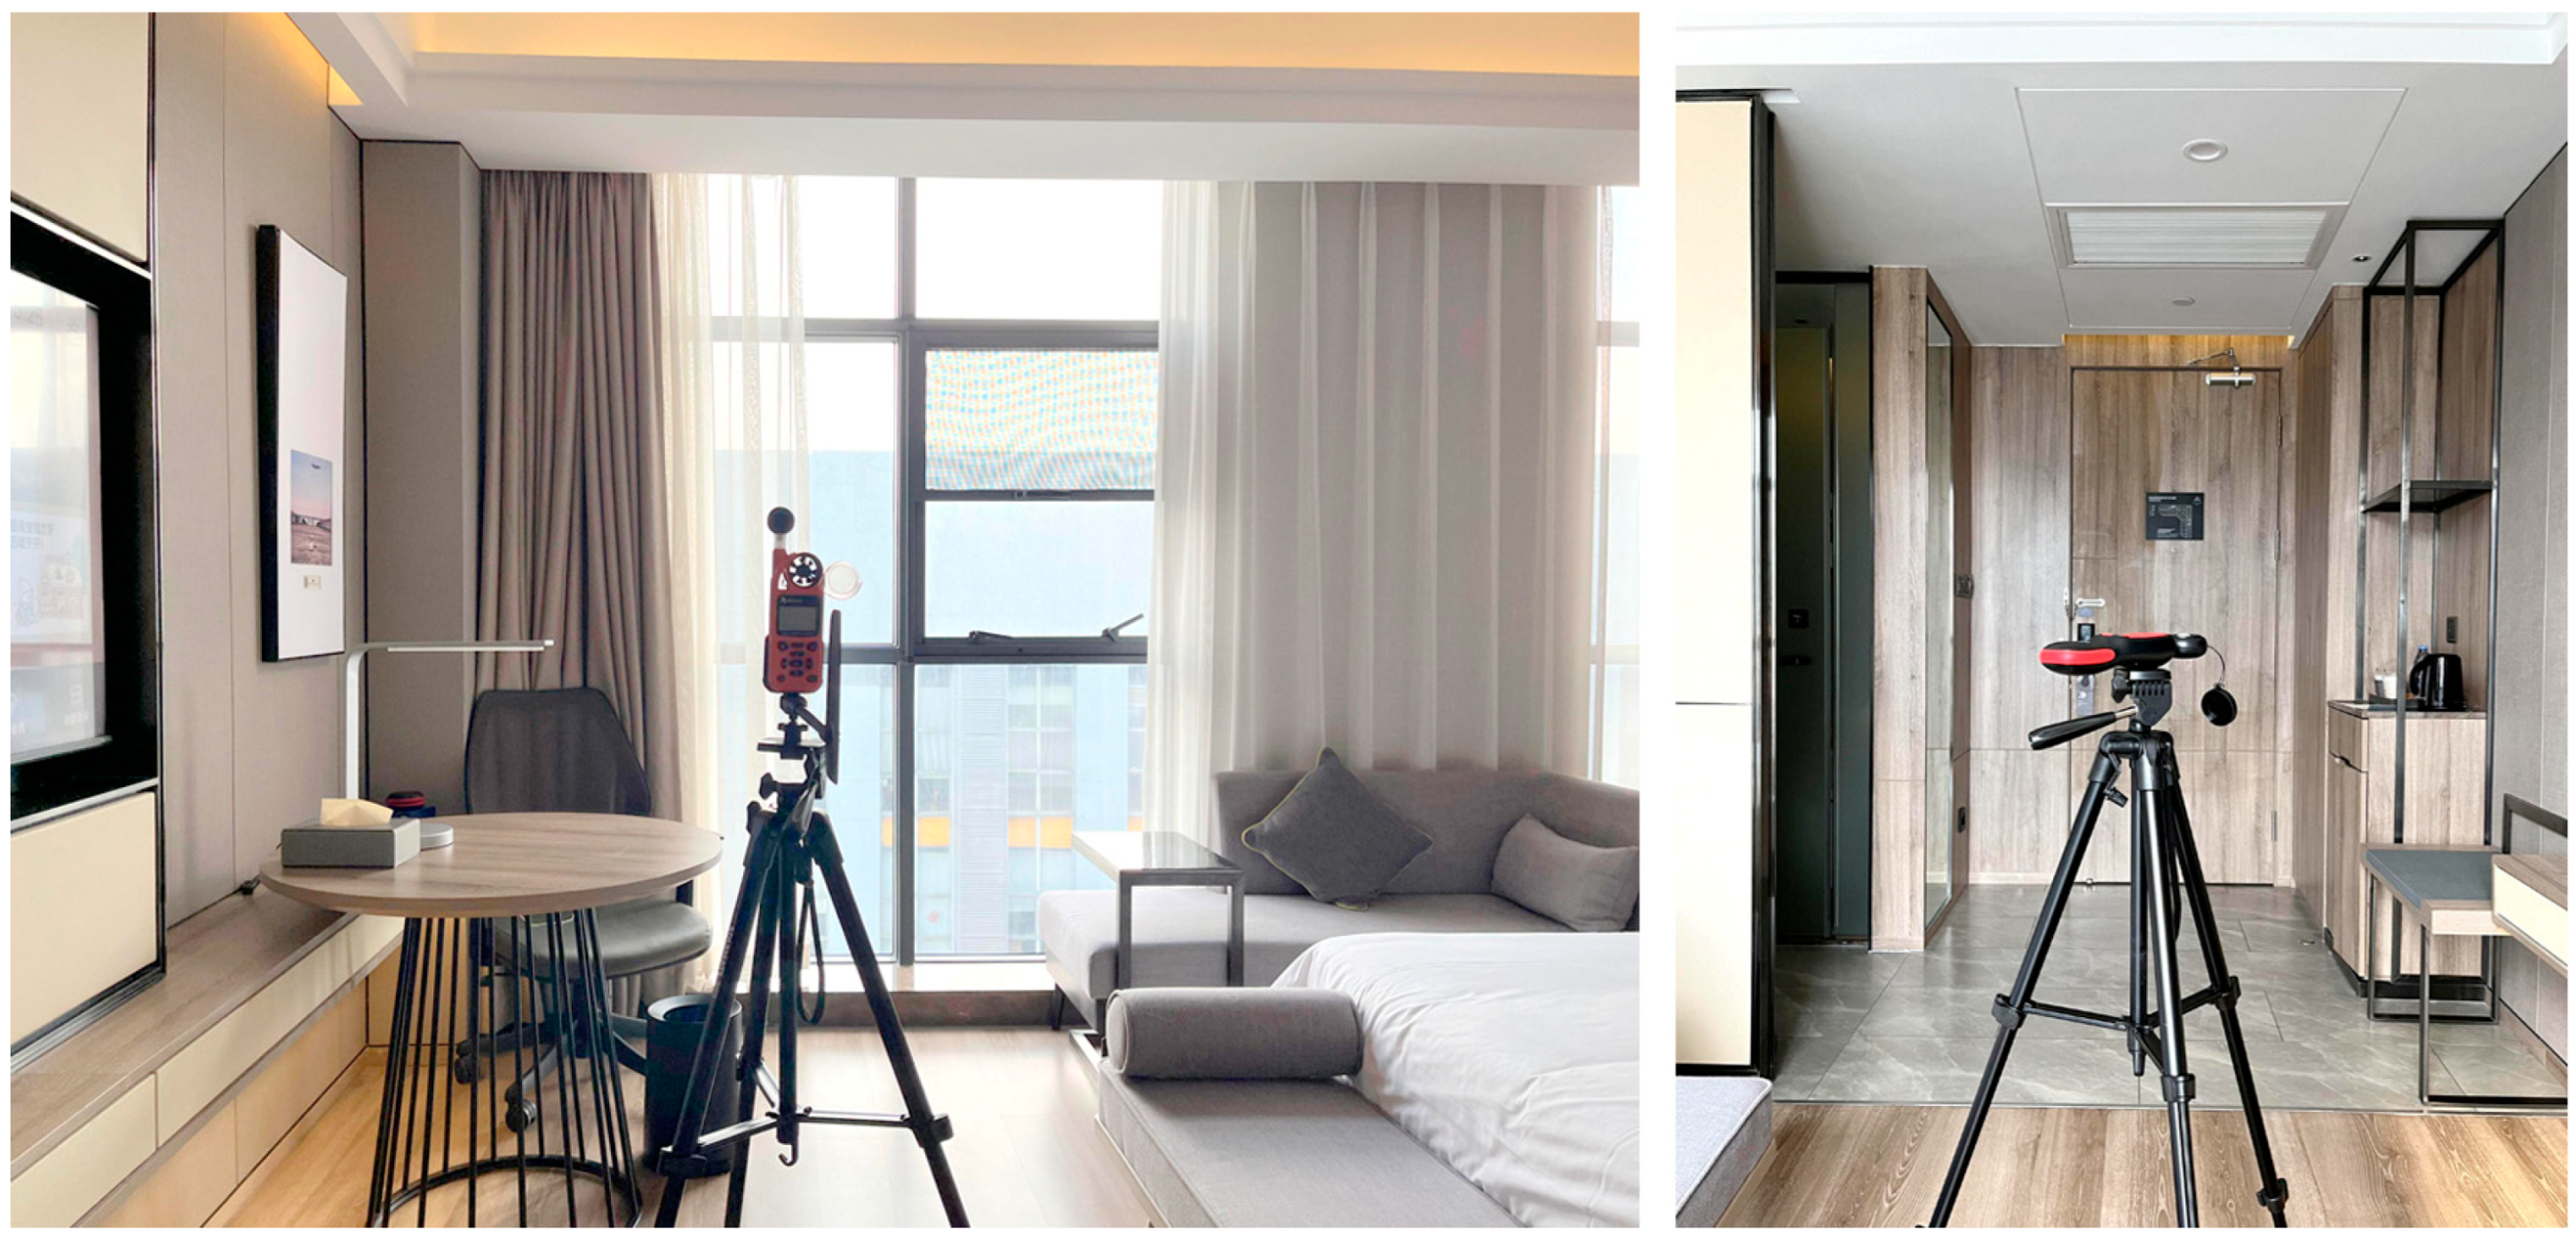
3.1.2. Characteristics of the Case Study Hotel Room
3.2. Measurement Protocol
3.2.1. Examined Environmental Indices
- Heat index (HI)
- Web bulb globe temperature (WBGT)
- Illuminance uniformity (Uo)
3.2.2. Instrumentations and Data Collection
3.3. Data Assembly and Analysis
4. Results and Discussion
4.1. Occupant’s Daily Activities
4.2. Change Trends of Different Environmental Indices
4.2.1. Concentration of Chemical Pollutants
4.2.2. Physical Environmental Performance
4.2.3. Heat Stress and Thermal Comfort Conditions
4.3. Performance Variations Among Functional Zones
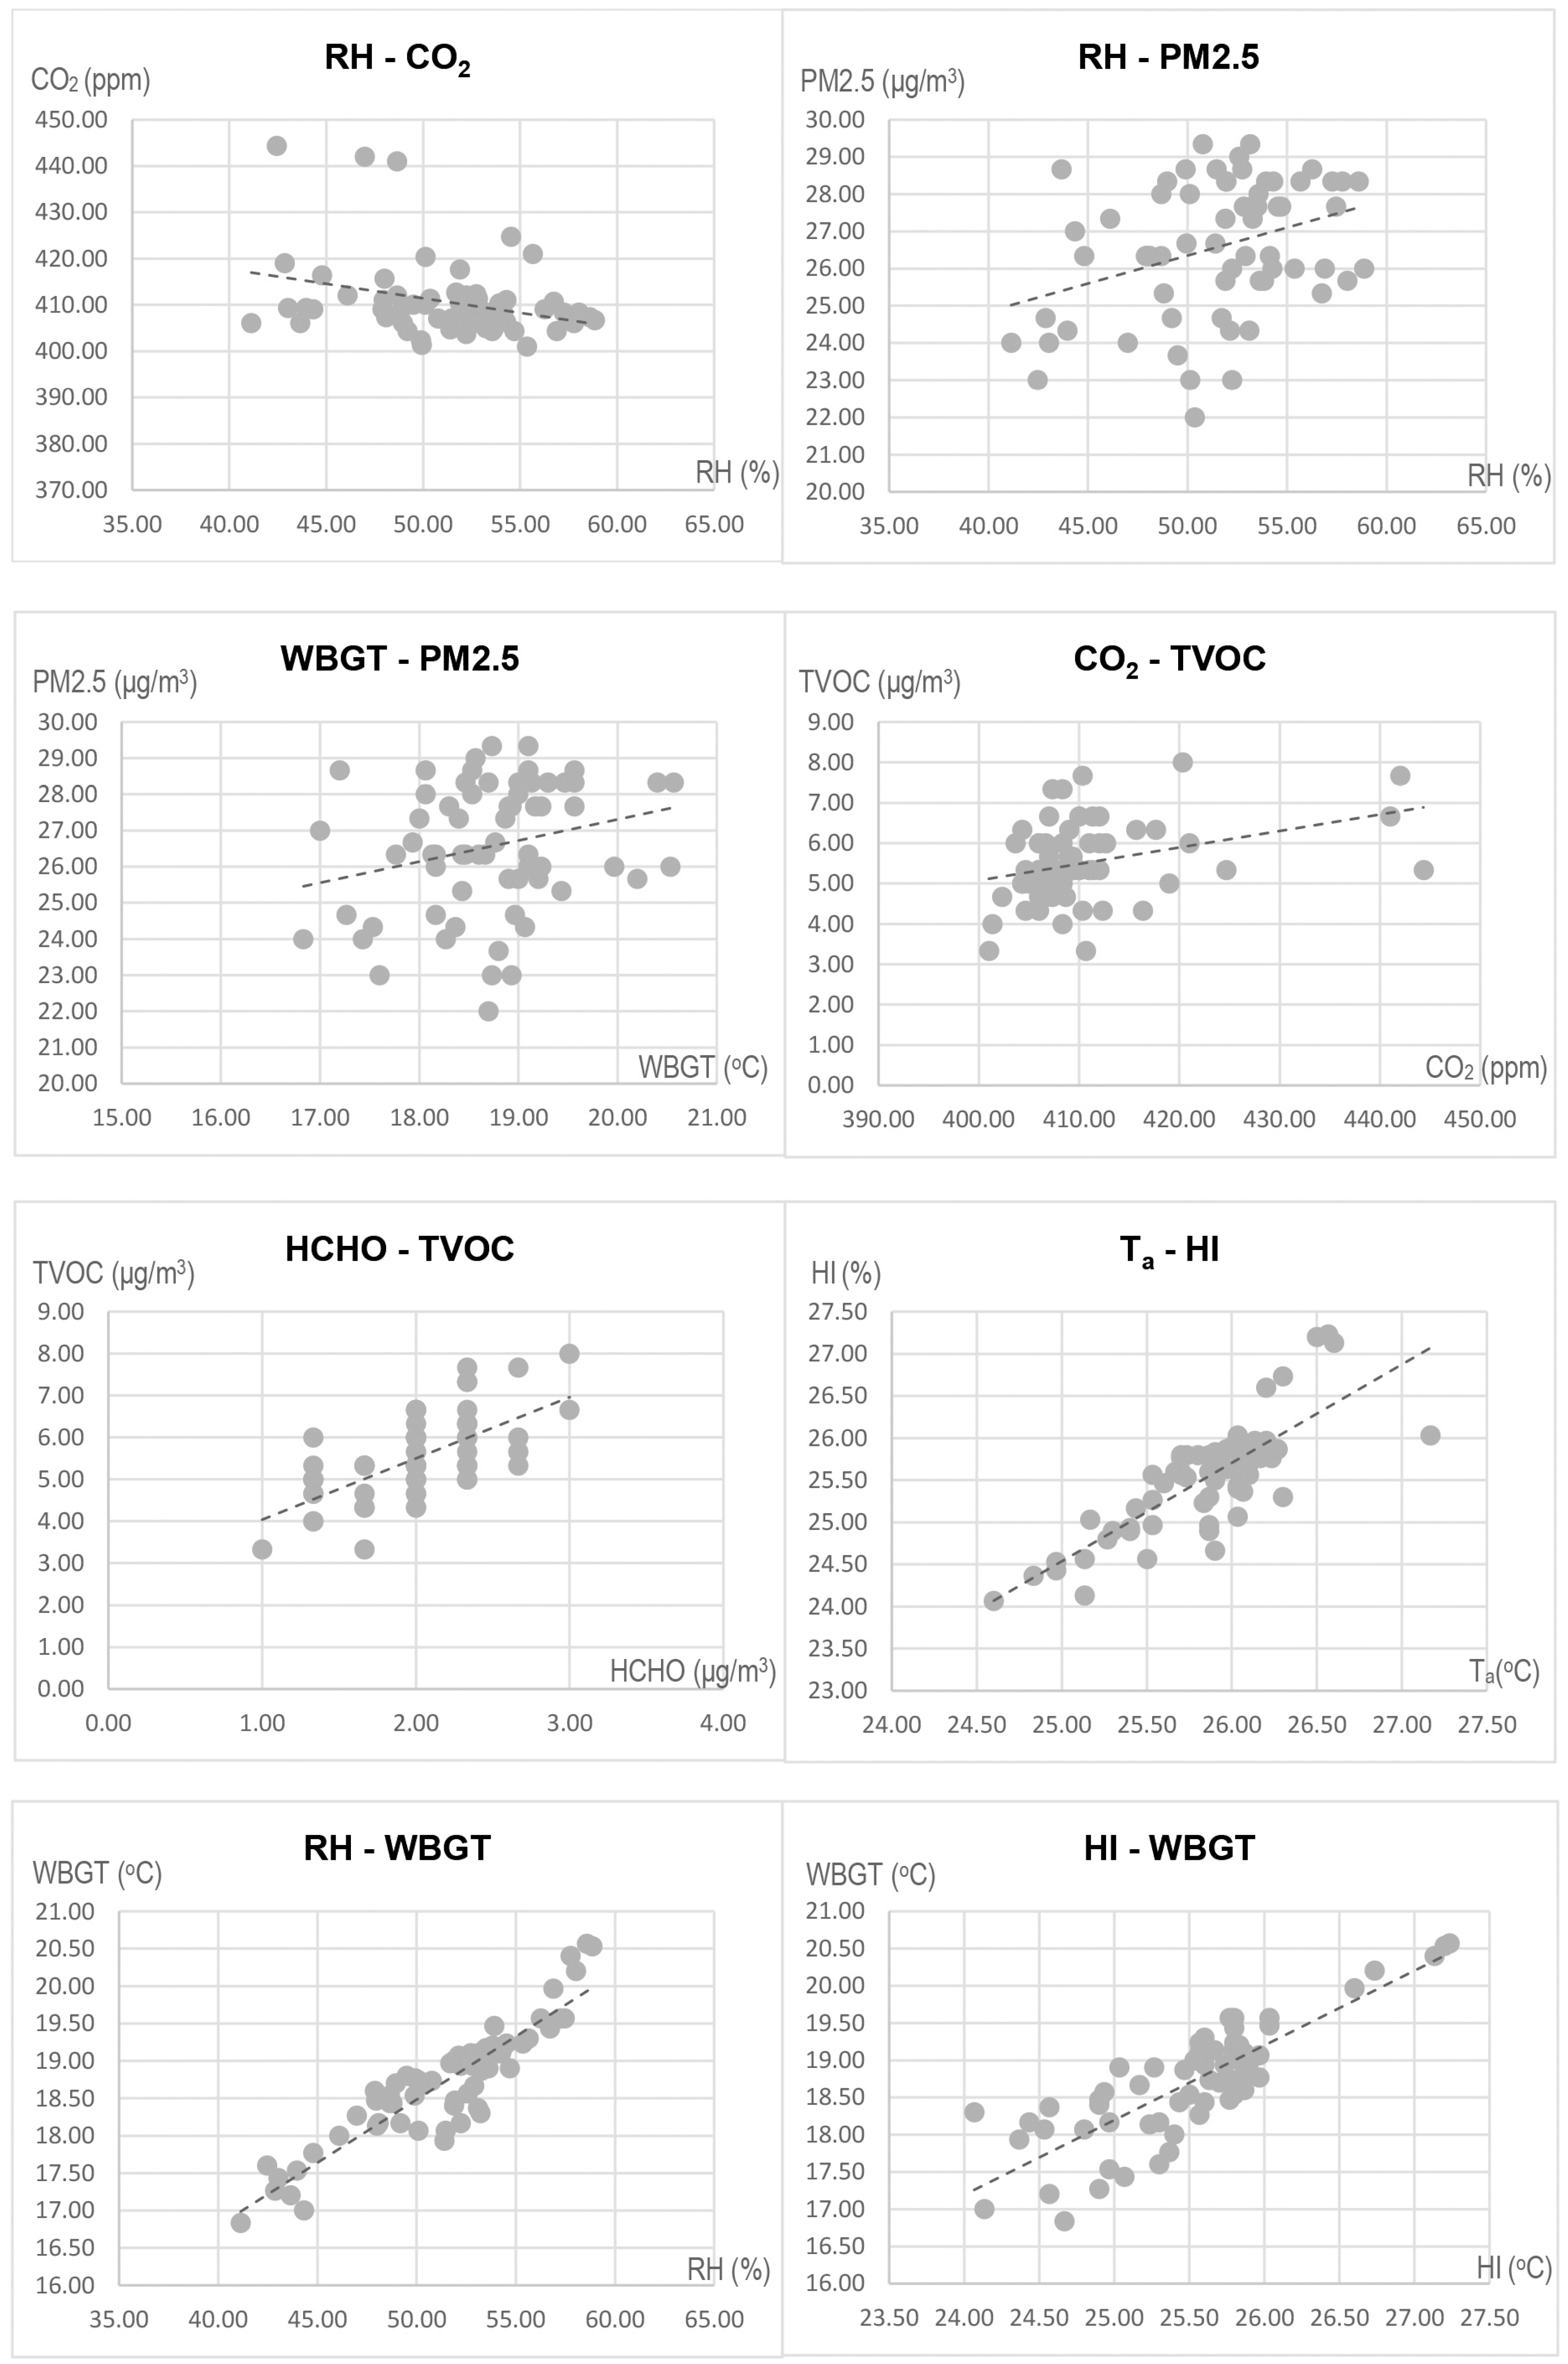
4.4. Impacts of Physical Conditions on Pollutant Concentrations
4.4.1. Correlations Among Chemical, Physical, and Heat Stress Indices
4.4.2. Multiple Regression Analysis
5. Architectural Design and Rehabilitation Implications
5.1. Enhancing Standards for Interior Lighting
5.2. Establishing Flexible Interior Spatial Layout System
5.3. Adopting Soft Interventions and Smart Environmental Re-Architecting Strategies
5.4. Promoting Advocay of Healthy Living and Self-Help Adjustment
6. Conclusions and Outlooks
- During the studied extended quarantine stay, most examined indoor environmental indices meet both local and global IEQ and IAQ standards, indicating the suitability and general effectiveness of the tested hotel room as a quarantine residential space.
- However, the PM2.5 level was observed to exceed the WHO AQG standard (24-h avg., 15 μg/m3), suggesting that there is still space to enhance hotel rooms to be healthier for travelers during both normal times and epidemic situations.
- In many situations, the interior lighting environment did not meet task-specific needs, particularly at night, when artificial lighting was mainly relied on to conduct activities, suggesting that hotel illumination standards do not sufficiently consider the specific needs of quarantine occupants.
- Relative humidity (RH) was preliminarily identified as a critical physical environmental index, impacting both CO2 and PM2.5 concentrations. Higher RH seemed to lead to lower concentrations of CO2 but higher concentrations of PM2.5.
- The wet bulb globe temperature (WBGT) heat stress index was observed in this study to positively correlate with CO2 concentration to some extent.
- Incorporating biophilic interventions and integrating natural elements, such as indoor plants, to promote occupants’ wellness by reducing stress and anxiety as well as improving indoor air quality.
- Offering low-cost portable IEQ monitoring devices (e.g., portable air purifier and environmental meter) to residing guests or employing fixed smart environmental meters to be linked to IoT systems for dynamic monitoring.
- Increasing window areas in non-load-bearing walls to introduce sufficient natural light into the hotel room spaces that function for dining and working.
- Installing adjustable illuminance lighting fixtures in hotel rooms, which can be adjusted by occupants based on their needs and activities.
- Adopting the “Open Building” design methodology and establishing a spatial system that enables occupants to achieve flexible and self-help layout adjustments.
- Promoting healthy living functionalities and providing tips on healthy lifestyles and behaviors during extended stays or quarantine in hotel rooms.
Limitations and Directions for Future Studies
- Conducting comprehensive analysis of the impacts of daily occupant activities within hotel room spaces on indoor environmental quality.
- Extending measurement periods and study durations to capture seasonal variations and long-term trends through cooperating with local governmental agencies and adopting computational simulations in order to provide more systematic direction for upgrading hotel guest rooms.
- Integrating more aspects of the “healthy building” (e.g., noise, moisture, water quality, dust, and bioaerosols) into building design consideration and regulation and evaluating occupants’ subjective perceptions.
- Collecting more granular data by employing more smart instruments with higher measuring accuracy and adopting machine-learning analysis to enable exploration of deeper mechanisms and hidden factors that affect the indoor environmental quality of the hotel rooms in both objective and subjective dimensions.
Author Contributions
Funding
Data Availability Statement
Conflicts of Interest
Abbreviations
| IEQ | Indoor environmental quality |
| IAQ | Indoor air quality |
| AQG | Air quality guideline |
| AQI | Air quality index |
| CO2 | Carbon dioxide (ppm) |
| PM2.5 | Particulate matter (μg/m3) |
| HCHO | Formaldehyde (μg/m3) |
| TVOC | Total volatile organic compounds (μg/m3) |
| VOC | Volatile organic compounds (μg/m3) |
| Ta | Air temperature (°C) |
| Tnw | Nature wet temperature (°C) |
| Tg | Globe temperature (°C) |
| RH | Relative humidity (%) |
| v | Air velocity (m/s) |
| IL | Horizontal illumination level (lx) |
| Uo | Illumination uniformity (0–1) |
| HI | Heat index (°C) |
| WBGT | Wet bulb globe temperature (°C) |
| ppm | Parts per million |
| IoT | Internet of Things |
| ISO | International Organization for Standardization |
| WHO | World Health Organization |
| OSHA | Occupational Safety and Health Administration |
| ASHRAE | American Society of Heating, Refrigerating, and Air-Conditioning Engineers |
| MOE | Ministry of the Environment (Republic of Korea) |
| FISIAQ | Finnish Society of Indoor Air Quality and Climate |
| JBSA | Japan Building Standard Act |
References
- Jabareen, Y. Planning the resilient city: Concepts and strategies for coping with climate change and environmental risk. Cities 2013, 31, 220–229. [Google Scholar] [CrossRef]
- Pan, W.J. What type of mixed-use and open? A critical environmental analysis of three neighborhood types in China and insights for sustainable urban planning. Landsc. Urban Plan. 2021, 216, 104221. [Google Scholar] [CrossRef]
- Galderisi, A.; Colucci, A. Chapter 4—Smart, Resilient, and Transition Cities: Commonalities, Peculiarities and Hints for Future Approaches. In Smart Resilient and Transition Cities: Emerging Approaches and Tools for a Climate-Sensitive Urban Development; Elsevier: Amsterdam, The Netherlands, 2018; pp. 29–35. [Google Scholar] [CrossRef]
- Jia, B.S. Concept of Levels in Open Apartment Housing Designs in Europe. Contemp. Archit. 2021, 2, 20–25. [Google Scholar]
- Mischke, J.; Luby, R.; Vickery, B.; Woetzel, L.; White, O.; Sanghvi, A.; Rhee, J.; Fu, A.; Palter, R.; Dua, A.; et al. Empty Spaces and Hybrid Places: The Pandemic’s Lasting Impact on Real Estate; McKinsey Global Institute: Brussels, Belgium, 2023; Available online: https://www.mckinsey.com/mgi/our-research/empty-spaces-and-hybrid-places (accessed on 20 September 2023).
- Yan, S.J.; Wang, L.Z.; Birnkrant, M.J.; Zhai, Z.Q.; Miller, S.L. Multizone Modeling of Airborne SARS-CoV-2 Quanta Transmission and Infection Mitigation Strategies in Office, Hotel, Retail, and School Buildings. Buildings 2023, 13, 102. [Google Scholar] [CrossRef]
- Chen, C.X.; Ou, D.Y. Study on the Acoustic Environment Characteristics of Open-plan Offices with Different Layout Types. Build. Sci. 2024, 40, 236–241+249. [Google Scholar]
- Kwok, H.H.L.; Cheng, J.C.P.; Li, A.T.Y.; Tong, J.C.K.; Lau, A.K.H. Multi-zone indoor CFD under limited information: An approach coupling solar analysis and BIM for improved accuracy. J. Clean. Prod. 2020, 244, 118912. [Google Scholar] [CrossRef]
- Xiao, L.D. Open building is a future-oriented construction mode. Shanghai Real Estate 2017, 2, 63. [Google Scholar] [CrossRef]
- Asadi, E.; Costa, J.J.; da Silva, M.G. Indoor air quality audit implementation in a hotel building in Portugal. Build. Environ. 2011, 46, 1617–1623. [Google Scholar] [CrossRef]
- Liu, H.; Xu, X.X.; Tam, V.W.Y.; Mao, P. What is the “DNA” of healthy buildings? A critical review and future directions. Renew. Sustain. Energy Rev. 2023, 183, 113460. [Google Scholar] [CrossRef]
- Bavaresco, M.; Gnecco, V.; Pigliautile, I.; Piselli, C.; Bracht, M.; Cureau, R.; De Souza, L.; Geraldi, M.; Vasquez, N.; Fabiani, C.; et al. Multi-domain simulation for the holistic assessment of the indoor environment: A systematic review. J. Build. Eng. 2024, 84, 108612. [Google Scholar] [CrossRef]
- Felgueiras, F.; Mourão, Z.; Moreira, A.; Gabriel, M.F. Characterizing indoor environmental quality in Portuguese office buildings for designing an intervention program. Build. Environ. 2024, 254, 111393. [Google Scholar] [CrossRef]
- Ma, N.; Aviv, D.; Guo, H.S.; Braham, W.W. Measuring the right factors: A review of variables and models for thermal comfort and indoor air quality. Renew. Sustain. Energy Rev. 2021, 135, 110436. [Google Scholar] [CrossRef]
- Zhang, Y.P.; Mo, J.H.; Cheng, R. Developing a sustainable indoor air environment: Problems, considerations and suggestions. Chin. Sci. Bull. 2015, 60, 1651–1660. [Google Scholar] [CrossRef]
- Chowdhury, S.; Hamada, Y.; Ahmed, K.S. Prediction and comparison of monthly indoor heat stress (WBGT and PHS) for RMG production spaces in Dhaka, Bangladesh. Sustain. Cities Soc. 2017, 29, 41–47. [Google Scholar] [CrossRef]
- Joseph, G.A.; John, D.M. Healthy Buildings-How Indoor Spaces Drive Performance and Productivity; Harvard University Press: Cambridge, UK, 2020. [Google Scholar]
- Alqarni, Z.; Rezgui, Y.; Petri, I.; Ghoroghi, A. Viral infection transmission and indoor air quality: A systematic review. Sci. Total Environ. 2024, 923, 171308. [Google Scholar] [CrossRef]
- Carslaw, N.; Bekö, G.; Langer, S.; Schoemaecker, C.; Mihucz, V.G.; Dudzinska, M.; Wiesen, P.; Nehr, S.; Huttunen, K.; Querol, X.; et al. A new framework for indoor air chemistry measurements: Towards a better understanding of indoor air pollution. Indoor Environ. 2024, 1, 100001. [Google Scholar] [CrossRef]
- Shum, C.; Alipouri, Y.; Zhong, L.X. Examination of human interaction on indoor environmental quality variables: A case study of libraries at the University of Alberta. Build. Environ. 2022, 207, 108476. [Google Scholar] [CrossRef]
- Zhao, Y.J.; Li, D. Multi-domain indoor environmental quality in buildings: A review of their interactions and combined effects on occupant satisfaction. Build. Environ. 2023, 228, 109844. [Google Scholar] [CrossRef]
- Pan, J.Y.; Chen, S.S.; Bardhan, R. Reinventing hybrid office design through a people-centric adaptive approach. Build. Environ. 2024, 252, 111219. [Google Scholar] [CrossRef]
- Jiang, C.J.; Li, D.D.; Zhang, P.Y.; Li, J.G.; Wang, J.; Yu, J.G. Formaldehyde and volatile organic compound (VOC) emissions from particleboard: Identification of odorous compounds and effects of heat treatment. Build. Environ. 2017, 117, 118–126. [Google Scholar] [CrossRef]
- Chinazzo, G.; Andersen, R.K.; Azar, E.; Barthelmes, V.M.; Becchio, C.; Belussi, L.; Berger, C.; Carlucci, S.; Corgnati, S.P.; Crosby, S.; et al. Quality criteria for multi-domain studies in the indoor environment: Critical review towards research guidelines and recommendations. Build. Environ. 2022, 226, 109719. [Google Scholar] [CrossRef]
- Dai, X.L.; Shang, W.Z.; Liu, J.J.; Xue, M.; Wang, C.C. Achieving better indoor air quality with IoT systems for future buildings: Opportunities and challenges. Sci. Total Environ. 2023, 895, 164858. [Google Scholar] [CrossRef] [PubMed]
- Jung, C.; Alshamasi, S.M. Indoor Air Quality Management in Dubai: Assessing the Efficacy of Air Purifiers, Photocatalysts, and Window Ventilation in Reducing HCHO. Buildings 2024, 14, 2815. [Google Scholar] [CrossRef]
- Li, Y.Q.; Fan, Y.J.; Wei, Y.; Liu, M.Q.; Xu, B.; Ye, W. Can portable air cleaners reconcile conflicting needs for open-door/window autonomy and indoor air quality for occupants in densely populated offices? Appl. Energy 2024, 358, 122548. [Google Scholar] [CrossRef]
- Yang, C.T.; Chen, S.T.; Den, W.; Wang, Y.T.; Kristiani, E. Implementation of an Intelligent Indoor Environmental Monitoring and management system in cloud. Future Gener. Comput. Syst. 2019, 96, 731–749. [Google Scholar] [CrossRef]
- Qian, Y.C.; Leng, J.W.; Zhou, K.; Liu, Y.X. How to measure and control indoor air quality based on intelligent digital twin platforms: A case study in China. Build. Environ. 2024, 253, 111349. [Google Scholar] [CrossRef]
- Yu, C.; Crump, D. A Review of the Emission of VOCs from Polymeric Materials used in Buildings. Build. Environ. 1998, 33, 357–374. [Google Scholar] [CrossRef]
- Jung, C.; Mahmound, N.S.A.; Qassimi, N.A.; Elsamanoudy, G. Preliminary Study on the Emission Dynamics of TVOC and Formaldehyde in Homes with Eco-Friendly Materials: Beyond Green Building. Buildings 2023, 13, 2847. [Google Scholar] [CrossRef]
- Du, J. Project Home Improvement: Movable Upgrades and Community Engagement in Hong Kong’s Subdivided Units. Domus China 2018, 125, 44–53. [Google Scholar]
- Tikul, N.; Hokpunna, A.; Chawana, P. Improving indoor air quality in primary school buildings through optimized apertures and classroom furniture layouts. J. Build. Eng. 2022, 62, 105324. [Google Scholar] [CrossRef]
- Hatif, I.H.; Kamar, H.M.; Kamsah, N.; Wong, K.Y.; Tan, H.Y. Influence of office furniture on exposure risk to respiratory infection under mixing and displacement air distribution systems. Build. Environ. 2023, 239, 110292. [Google Scholar] [CrossRef]
- Wong, S.C.; Chen, H.; Lung, D.C.; Ho, P.L.; Yuen, K.Y.; Cheng, V.C.C. To prevent SARS-CoV-2 transmission in designated quarantine hotel for travelers: Is the ventilation system a concern? Indoor Air 2021, 31, 12870. [Google Scholar] [CrossRef] [PubMed]
- Tham, A. Hotel quarantine guest blogs: Unpacking Scheiner’s spaces of immobility and implications on urban tourism politics. Cities 2023, 134, 104202. [Google Scholar] [CrossRef]
- Fan, N.; Liu, C.; Huang, Y.; Li, J. Research progress and consideration of VOC pollution control in healthy buildings in China. Chin. Sci. Bull. 2020, 65, 263–273. [Google Scholar] [CrossRef]
- Qi, Z.S.; Guo, L.M.; Zhang, Y.; Xu, Y. Distribution and prediction of indoor pollutants in small and medium-sized hotels. J. Jilin Jianzhu Univ. 2022, 39, 51–57. [Google Scholar]
- Li, X.; Hu, C.J.; Huang, B.; Ouyang, C.W. Case analysis of ventilation design strategies on multiple spatial scales of a centralized quarantine community. Heat. Vent. Air Cond. 2022, 52, 34–40. [Google Scholar]
- Zhang, H.F.; Zhu, Y.M.; Sheng, X.J. Clinical analysis of anxiety and depression of entry Hotel isolation personnel during the period of new coronavirus epidemic prevention. Chin. Community Dr. 2021, 37, 70–71. [Google Scholar]
- Leutwiler-Lee, M.J.; Kim, S.; Badu-Baiden, F.; King, B. Dimensionality in the service quality perceptions of quarantine hotel guests. Tour. Manag. Perspect. 2023, 47, 101124. [Google Scholar] [CrossRef]
- Wang, Z.J. Study on the Design Adaptability of Hotel-type Medical Observation and Isolation Places. Chin. Hosp. Archit. Equip. 2023, 24, 73–77. [Google Scholar]
- Li, Y. Healthy Architecture: From Epidemic Prevention to Health Promotion. Archicreation 2020, 4, 10–19. [Google Scholar]
- Liu, Z.W.; Huang, J.J.; Zhang, M.F. Technical Keys Research on Hotel Building Combined Design Aim at Ordinary Times and Epidemic Period. Archit. Cult. 2023, 7, 132–135. [Google Scholar] [CrossRef]
- Liang, H.; Jiu, M.; Li, H.J.; Zhang, L.R.; Huo, Z.W.; Zhang, Q.N.; Wang, D.C. Compilation Interpretation of Guidelines for Emergency Management and Operation of Hotels Used as Temporary Quarantine Centers for COVID-19. Constr. Sci. Technol. 2020, 403, 19–41. [Google Scholar] [CrossRef]
- Meng, C.; Liu, M.L. The Health Code in Buildings; China Architecture & Building Press: Beijing, China, 2023. [Google Scholar]
- Wang, Q.Q.; Deng, Y.C.; Li, G.Z.; Meng, C.; Xie, L.N.; Liu, M.L.; Zeng, L.Y. The current situation and trends of healthy building development in China. Chin. Sci. Bull. 2020, 65, 246–255. [Google Scholar] [CrossRef]
- Schweiker, M.; Ampatzi, E.; Andargie, M.S.; Andersen, R.K.; Azar, E.; Barthelmes, V.M.; Berger, C.; Bourikas, L.; Carlucci, S. Review of multi-domain approaches to indoor environmental perception and behaviour. Build. Environ. 2020, 176, 106804. [Google Scholar] [CrossRef]
- Borowski, M.; Zwolińska, K.; Czerwiński, M. An Experimental Study of Thermal Comfort and Indoor Air Quality—A Case Study of a Hotel Building. Energies 2022, 15, 2026. [Google Scholar] [CrossRef]
- Fathi, A.S.; O’Brien, W. Impact of indoor environmental quality weighting schemes on office architectural design decisions. Build. Environ. 2024, 248, 111075. [Google Scholar] [CrossRef]
- Rothfusz, L.P. The Heat Index Equation (or, More Than You Ever Wanted to Know About Heat Index); NWS Southern Region Headquarters: Fort Worth, TX, USA, 1990; Volume 395. [Google Scholar]
- Gao, J.; Wang, Y.; Wu, X.Z.; Gu, X.H.; Song, X.C. A simplified indoor wet-bulb globe temperature formula to determine acceptable hot environmental parameters in naturally ventilated buildings. Energy Build. 2019, 196, 169–177. [Google Scholar] [CrossRef]
- Meng, X.J.; Xiong, H.H.; Yang, H.G.; Cao, Y.X. Dynamic prediction of indoor wet bulb globe temperature in an industrial workshop. Appl. Therm. Eng. 2021, 195, 117219. [Google Scholar] [CrossRef]
- Salthammer, T. TVOC–Revisited. Environ. Int. 2022, 167, 107440. [Google Scholar] [CrossRef]
- Hou, J.; Sun, Y.X.; Dai, X.L.; Liu, J.J.; Shen, X.; Tan, H.W.; Yin, H.G.; Huang, K.L.; Gao, Y.; Lai, D.Y.; et al. Associations of indoor carbon dioxide concentrations, air temperature, and humidity with perceived air quality and sick building syndrome symptoms in Chinese homes. Indoor Air 2021, 31, 1018–1028. [Google Scholar] [CrossRef]
- Yin, Q.; Wang, J.F. A better indicator to measure the effects of meteorological factors on cardiovascular mortality: Heat index. Environ. Sci. Pollut. Res. 2018, 25, 22842–22849. [Google Scholar] [CrossRef] [PubMed]
- Seong, K.; Jiao, J.; Mandalapu, A. Hourly Associations between Heat Index and Heat-Related Emergency Medical Service (EMS) Calls in Austin-Travis County, Texas. Int. J. Environ. Res. Public Health 2023, 20, 6853. [Google Scholar] [CrossRef] [PubMed]
- OSHA. OSHA Technical Manual (OTM) Section III: Chapter 2—Indoor Air Quality Investigation. Available online: https://www.osha.gov/otm/section-3-health-hazards/chapter-2#rfte (accessed on 1 April 2024).
- OSHA. Using the Heat Index: A Guide for Employers. Occupational Safety and Health Administration. Available online: http://osha.gov/SLTC/heatillness/heat_index/ (accessed on 28 March 2024).
- NWS. The Heat Index Equation; National Oceanic and Atmospheric Administration: Washington, DC, USA; National Weather Service: Silver Spring, MD, USA; Weather Prediction Center: College Park, MD, USA, 2022. Available online: https://www.wpc.ncep.noaa.gov/html/heatindex_equation.shtml (accessed on 20 September 2023).
- Budd, G.M. Wet-bulb globe temperature (WBGT): Its history and its limitations. J. Sci. Med. Sport 2008, 11, 20–32. [Google Scholar] [CrossRef] [PubMed]
- Mizutani, N.; Aqilah, N.; Khadka, S.; Rijal, H.B. Study on WBGT for heat stroke evaluation during summer in Japanese living rooms. Book Proc. Comf. Extrem. 2023, 2023, 330–338. [Google Scholar]
- Moran, D.S.; Pandolf, K.B.; Shapiro, Y.; Heled, Y.; Shani, Y.; Mathew, W.T.; Gonzalez, R.R. An environmental stress index (ESI) as a substitute for the wet bulb globe temperature (WBGT). J. Therm. Biol. 2001, 26, 427–431. [Google Scholar] [CrossRef]
- Alrubaih, M.S.; Zain, M.F.M.; Alghoul, M.A.; Ibrahim, N.L.N.; Shameri, M.A.; Elayeb, O. Research and development on aspects of daylighting fundamentals. Renew. Sustain. Energy Rev. 2013, 21, 494–505. [Google Scholar] [CrossRef]
- Pan, W.J.; Du, J. Impacts of urban morphological characteristics on nocturnal outdoor lighting environment in cities: An empirical investigation in Shenzhen. Build. Environ. 2021, 192, 107587. [Google Scholar] [CrossRef]
- ISO 7726; Ergonomics of the Thermal Environment-Instruments for Measuring Physical Quantities. International Standard Organization (ISO): Geneva, Switzerland, 1998.
- GB 50034-2013; Standard for Lighting Design of Buildings. MOHURD (Ministry of Housing and Urban-Rural Development of the People’s Republic of China); China Architecture & Building Press: Beijing, China, 2014.
- Pan, W.J.; Du, J. Effects of neighbourhood morphological characteristics on outdoor daylight and insights for sustainable urban design. J. Asian Archit. Build. Eng. 2022, 21, 342–367. [Google Scholar] [CrossRef]
- Zhang, Z.W.; Wei, Z.Y.; Lyu, X.B.; Qi, B.; Guang, J.; Zhang, Y.H.; Chen, S.Q. Comprehensive Evaluation on Indoor Environmental Quality of Urban Residences in Hot-summer and Cold-winter Zone: A Case Study of Hangzhou City. Build. Sci. 2022, 38, 54–60. [Google Scholar]
- Lai, K.M.; Lee, K.M.; Yu, W. Air and hygiene quality in crowded housing environments—A case study of subdivided units in Hong Kong. Indoor Built Environ. 2017, 26, 32–43. [Google Scholar] [CrossRef]
- Fang, J.Q.; Xu, Y.Y.; Chen, F. Weisheng Tongjixue (Health Statistics); People’s Medical Publishing House: Beijing, China, 2017. [Google Scholar]
- Cai, N.N.; Wang, B.Q.; Hu, X.X.; Tang, Z.Z.; Jiang, Z.; Yang, J.H.; Li, K.J. Experimental Study of Human Walking-Induced Indoor Particle Resuspension. Res. Environ. Sci. 2021, 34, 766–771. [Google Scholar]
- Yuan, F.; Yao, R.M.; Sadrizadeh, S.; Awbi, H.; Luo, H.; Li, B.Z. The influence of activity patterns and relative humidity on particle resuspension in classrooms. Sci. Total Environ. 2024, 946, 173898. [Google Scholar] [CrossRef] [PubMed]
- Wang, H.D. Study on the Influence of Hot and Wet Environment on Indoor PM2.5 Mass Concentration. Anhui Archit. 2018, 24, 196–198. [Google Scholar]
- Guo, L.M.; Qi, Z.S. Change and correlation analysis of CO2 concentration in hotel rooms in cold area. J. Jilin Jianzhu Univ. 2023, 40, 51–57. [Google Scholar]
- Bai, L.; Wang, X.H.; Cui, Y.B.; Chi, Y.Y.; Liu, X.R. Survey on the Current Situation of Indoor Air Quality in Fitness Establishments and Measures to Improve it. North. Archit. 2023, 8, 52–57. [Google Scholar]
- GB/T 18883-2022; SAFMR and SA. Standards for Indoor Air Quality (by State Administration for Market Regulation and Standardization Administration). China Architecture & Building Press: Beijing, China, 2022.
- GB 50325-2020; Code for Indoor Environmental Pollution Control of Civil Building Engineering. MOHURD (Ministry of Housing and Urban-Rural Development of the People’s Republic of China); China Architecture & Building Press: Beijing, China, 2020.
- GB 3095-2012; MOEE; Ambient Air Quality Standards. Ministry of Ecology and Environment of the People’s Republic of China. China Environmental Press: Beijing, China, 2016.
- WHO. WHO Global Air Quality Guidelines, Particulate Matter (PM2.5 and PM10), Ozone, Nitrogen Dioxide, Sulfur Dioxide and Carbon Monoxide; World Health Organization: Geneva, Switzerland, 2021. [Google Scholar]
- ANSI/ASHRAE 62.1–2016; ASH (American Society of Heating) Refrigerating and Air-Conditioning Engineers. Ventilation for Acceptable Indoor Air Quality: Atlanta, GA, USA, 2016.
- Wolkoff, P. Impact of air velocity, temperature, humidity, and air on long-term VOC emissions from building products. Build. Environ. 1998, 32, 2659–2668. [Google Scholar] [CrossRef]
- Zhang, C.X.; Hu, S.T.; Li, A.G.; Liu, G.D. Influence of Air Relative Humidity on Indoor Air Quality. J. Environ. Health 2008, 25, 840–841. [Google Scholar]
- Gładyszewska-Fiedoruk, K. Correlations of air humidity and carbon dioxide concentration in the kindergarten. Energy Build. 2013, 62, 45–50. [Google Scholar] [CrossRef]
- Wang, Q.F.; Shen, J.; Shao, Y.L.; Dong, H.J.; Li, Z.J.; Shen, X.W. Volatile organic compounds and odor emissions from veneered particleboards coated with water-based lacquer detected by gas chromatography-mass spectrometry/olfactometry. Eur. J. Wood Wood Prod. 2019, 77, 771–781. [Google Scholar] [CrossRef]
- Amorim, C.N.D.; Vasquez, N.G.; Matusiak, B.; Kanno, J.; Sokol, N.; Martyniuk-Peczek, J.; Sibilio, S.; Koga, Y.; Ciampi, G.; Waczynska, M. Lighting conditions in home office and occupant’s perception: An international study. Energy Build. 2022, 261, 111957. [Google Scholar] [CrossRef]
- Wu, Y.T.; Wang, L.X.; Yu, J.; Chen, P.; Wang, A.Y. Improving the Restorative Potential of Living Environments by Optimizing the Spatial Luminance Distribution. Buildings 2023, 13, 1708. [Google Scholar] [CrossRef]
- Kendall, S. Open Building: An Approach to Sustainable Architecture. J. Urban Technol. 1999, 6, 1–16. [Google Scholar] [CrossRef]
- Kendall, S. An Open Building Strategy for Achieving Dwelling Unit Autonomy in Multi-Unit Housing. Hous. Soc. 2004, 31, 89–102. [Google Scholar] [CrossRef]
- Jia, B.S. Open Architecture between Cities, Structures and Interiors. New Archit. 2019, S1, 13–15. [Google Scholar]
- Li, G.P.; Li, Z.B.; Li, Y.B. Open Building as a Design Approach for Adaptability in Chinese Public Housing. World J. Eng. Technol. 2019, 7, 598–611. [Google Scholar] [CrossRef]
- Shenzhen Housing and Construction Bureau. Guidelines for the Scale and Quality Improvement of Affordable Housing in Urban Villages in Shenzhen; Shenzhen Housing and Construction Bureau: Shenzhen, China, 2023. [Google Scholar]
- Jiang, J.R.; Liu, J.J.; Wang, C.H.; Yin, Y.H.; Pei, J.J.; Gao, Y.B.; Wang, Y.S.; Hyun, O.; Park, H. Exploring the long-term performance of air purifiers in removing particulate matter formaldehyde across different residential environments. Environ. Res. 2024, 263, 120194. [Google Scholar] [CrossRef]
- Ma, N.; Waegel, A.; Hakkarainen, M.; Braham, W.W.; Glass, L.; Aviv, D. Blockchain + IoT sensor network to measure, evaluate and incentivize personal environmental accounting and efficient energy use in indoor spaces. Appl. Energy 2023, 332, 120443. [Google Scholar] [CrossRef]
- Wu, X.M.; Han, M.T.; Chen, H. Mitigating aerosol-induced respiratory infections in home quarantine: The role of door dynamics and ventilation in residential design. Heliyon 2024, 10, e37967. [Google Scholar] [CrossRef]
- Zhong, W.J.; Schröder, T.; Bekkering, J. Biophilic design in architecture and its contributions to health, well-being, and sustainability: A critical review. Front. Arch. Res. 2022, 11, 114–141. [Google Scholar] [CrossRef]
- Priya, U.K.; Senthil, R. Enhancing Sustainable Thermal Comfort of Tropical Urban Buildings with Indoor Plants. Buildings 2024, 14, 2353. [Google Scholar] [CrossRef]
- Liu, J.Y.; Xie, H.M.; Pan, W.J. Light Customized Design (LCD): Utilizing the User-Designer Co-Architecting Approach in Establishing Adaptive Home Spaces. In Proceedings of the 14th International Symposium on Architectural Interchanges in Asia (ISAIA 2024), Kyoto, Japan, 10–12 September 2024. [Google Scholar]
- Ozarisoy, B.; Altan, H. Significance of occupancy patterns and habitual household adaptive behaviour on home-energy performance of post-war social-housing estate in the South-eastern Mediterranean climate: Energy policy design. Energy 2024, 244, 122904. [Google Scholar] [CrossRef]


| Monitoring | Zone Name | Function and Location in the Room | Floor Material | Wall Material | Area (m2) | Volume (m3) |
|---|---|---|---|---|---|---|
| Zone A | Transit area | Entryway and corridor | Marble tile | Wood | 3.42 | 10.26 |
| Zone B | Working and dining area | Next to the window, open space for working and dining | Hardwood | Fabric wallpaper, tempered glass | 7.56 | 22.68 |
| Zone C | Living area | Next to the window, Leisure and exercise | Hardwood | Fabric wallpaper, tempered glass | 4.41 | 13.32 |
| Zone D | Breaking area | Next to washing space, Bed space | Hardwood | Fabric wallpaper, tempered glass | 3.15 | 9.45 |
| Zone E | Washing area | Washing space, bath space, and toilet | Marble tile | Glazed tile, tempered glass | 4.56 | 13.68 |
| Examined Index | China Standards | WHO, CIE, Europe Standards | USA Standards | Japan Standards | South Korea Standards |
|---|---|---|---|---|---|
| CO2 | ≤700 ppm | ≤920 ppm (24 h) | ≤1000 ppm | ≤1000 ppm | ≤1000 ppm |
| PM2.5 | ≤75 μg/m3 (24 h avg.) ≤35 μg/m3 (annual avg.) | ≤15 μg/m3 (24 h avg.) | ≤75 μg/m3 (annual avg.) | ≤35 μg/m3 (24 h avg.) ≤15 μg/m3 (annual avg.) | |
| HCHO | ≤80 μg/m3 (1 h avg.) | ≤100 μg/m3 (30 min) | ≤0.1 ppm | ≤100 μg/m3 | ≤100 μg/m3 |
| TVOC | ≤600 μg/m3 (8 h avg.) | 200–600 μg/m3 | ≤500 μg/m3 | 400–1000 μg/m3 | |
| Ta | 22–28 °C (summer) | ||||
| RH | 40–80% (summer) | ||||
| v | ≤0.30 m/s (summer) | ||||
| IL | 75–300 lx (vary from different functional zones) | ||||
| Uo | 0.40–0.60 (vary from different functional zones) | ≥0.70 (core working area) ≥0.50 (surrounding areas) | |||
| HI | ≤32.78 °C | ||||
| WBGT | ≤28.0 °C | ≤26.6 °C |
| Instrument Model | Parameter Type | Parameter | Unit | Range | Accuracy | Photo of Instrument |
|---|---|---|---|---|---|---|
| RoHS Air Quality Detector—H8 | Chemical | CO2 | ppm | 400–5000 ppm | ±5% |  |
| Chemical | PM2.5 | μg/m3 | 0–999 μg/m3 | ±10% | ||
| Chemical (volatile) | HCHO | μg/m3 | 0–9999 μg/m3 | ±10% | ||
| Chemical (volatile) | TVOC | μg/m3 | 0–9999 μg/m3 | ±10% | ||
| Kestrel 5400 Pocket Climatic Meter | Physical | Ta | °C | −29–70 °C | ±0.5 °C | 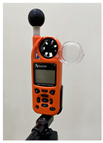 |
| Physical | RH | % | 10–90% | ±2% | ||
| Physical | v | m/s | 0.6–40m/s | ±3% | ||
| Heat stress/ thermal comfort | HI | °C | Complies with ranges of Ta and RH | ±4 °C | ||
| Heat stress/ thermal comfort | WBGT | °C | Complies with Ta, RH, and atmospheric pressure | ±0.7 °C | ||
| DELIXI DLY-1802 Digital Illuminometer | Physical | IL | lx | 0–200,000 lx | ±3% rdg ± 0.5% f.s. (<10,000 lx) and ±4% rdg ± 10 dgts. (>10,000 lx) | 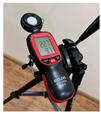 |
| Physical | Uo | 0–1 | -- | -- |
| Period of the Day | Hour | Intensity of Activities | Occupant’s Regular Daily Activities | Staying Zone |
|---|---|---|---|---|
| Before 09:00 | High | Morning exercise, breakfast, temperature measurement | A, B, C, D, E | |
| Morning | 09:00–10:00 | Low | Office work (laptop) | B |
| 10:00–11:00 | Low | Office work (laptop) | B | |
| 11:00–12:00 | Low | Office Work (laptop), and nucleic acid test | B, C | |
| Early Afternoon | 12:00–13:00 | Moderate | Lunch, watching TV | B, C |
| 13:00–14:00 | Quiet | Afternoon nap | C, D | |
| 14:00–15:00 | Low | Afternoon tea, walking around, temperature measurement | A, B, C, D | |
| Late Afternoon | 15:00–16:00 | Low | Work (via laptop) | B |
| 16:00–17:00 | Low | Work (via laptop) | B | |
| 17:00–18:00 | Low | Work (via laptop) | B | |
| Evening | 18:00–19:00 | Moderate | Dinner, watching TV | B, C |
| 19:00–20:00 | Low | Work (remote meeting) | B | |
| 20:00–21:00 | Low | Work (via laptop) | B | |
| 21:00–22:00 | High | Yoga and evening exercise | A, B | |
| Sleeping Time | After 22:00 | Quiet | Bath, sleep | C, D, E |
| Chemical | Physical | Heat Stress | Physical | ||||||
|---|---|---|---|---|---|---|---|---|---|
| CO2 | PM2.5 | HCHO | TVOC | Ta | RH | HI | WBGT | IL | |
| CO2 | -- | −0.310 * | 0.215 | 0.350 ** | 0.235 | −0.317 * | 0.034 | −0.182 | 0.147 |
| PM2.5 | -- | −0.138 | −0.131 | −0.128 | 0.353 ** | 0.057 | 0.255 * | −0.046 | |
| HCHO | -- | 0.632 *** | 0.163 | 0.067 | 0.156 | 0.128 | 0.039 | ||
| TVOC | -- | 0.214 | −0.009 | 0.164 | 0.095 | 0.098 | |||
| Ta | -- | 0.036 | 0.801 *** | 0.411 *** | −0.032 | ||||
| RH | -- | 0.537 *** | 0.910 *** | −0.437 *** | |||||
| HI | -- | 0.832 *** | −0.240 | ||||||
| WBGT | -- | −0.401 *** | |||||||
| IL | -- | ||||||||
| Models | Model a1 | ||
|---|---|---|---|
| Variables | B | SE | Beta |
| Ta | 0.467 * | 0.269 | 0.214 |
| Constant | −6.552 | ||
| R2 | 0.046 | ||
| Adjust R2 | 0.030 * | ||
| F static | 3.009 | ||
| n | 65 | ||
| Models | Model b1 | Model b2 | ||||
|---|---|---|---|---|---|---|
| Variables | B | SE | Beta | B | SE | Beta |
| RH | −0.628 * | 0.237 | −0.317 | −1.744 ** | 0.553 | −0.881 |
| WBGT | – | – | – | 6.611 * | 2.984 | 0.619 |
| Constant | 442.816 *** | 376.406 *** | ||||
| R2 | 0.101 | 0.167 | ||||
| Adjust R2 | 0.086 * | 0.140 ** | ||||
| F static | 7.044 | 6.195 | ||||
| n | 65 | 65 | ||||
| Models | Model c1 | ||
|---|---|---|---|
| Variables | B | SE | Beta |
| RH | 0.150 ** | 0.050 | 0.353 |
| Constant | 18.840 *** | ||
| R2 | 0.125 | ||
| Adjust R2 | 0.111 ** | ||
| F static | 8.973 | ||
| n | 65 | ||
Disclaimer/Publisher’s Note: The statements, opinions and data contained in all publications are solely those of the individual author(s) and contributor(s) and not of MDPI and/or the editor(s). MDPI and/or the editor(s) disclaim responsibility for any injury to people or property resulting from any ideas, methods, instructions or products referred to in the content. |
© 2024 by the authors. Licensee MDPI, Basel, Switzerland. This article is an open access article distributed under the terms and conditions of the Creative Commons Attribution (CC BY) license (https://creativecommons.org/licenses/by/4.0/).
Share and Cite
Wang, H.; Pan, W. Multi-Domain Environmental Quality of Indoor Mixed-Use Open Spaces and Insights into Healthy Living—A Quarantine Hotel Case Study. Buildings 2024, 14, 3443. https://doi.org/10.3390/buildings14113443
Wang H, Pan W. Multi-Domain Environmental Quality of Indoor Mixed-Use Open Spaces and Insights into Healthy Living—A Quarantine Hotel Case Study. Buildings. 2024; 14(11):3443. https://doi.org/10.3390/buildings14113443
Chicago/Turabian StyleWang, Han, and Wenjian Pan. 2024. "Multi-Domain Environmental Quality of Indoor Mixed-Use Open Spaces and Insights into Healthy Living—A Quarantine Hotel Case Study" Buildings 14, no. 11: 3443. https://doi.org/10.3390/buildings14113443
APA StyleWang, H., & Pan, W. (2024). Multi-Domain Environmental Quality of Indoor Mixed-Use Open Spaces and Insights into Healthy Living—A Quarantine Hotel Case Study. Buildings, 14(11), 3443. https://doi.org/10.3390/buildings14113443