


Exploring the Spatial Patterns of Accessibility to Metro Services Considering the Locations of Station Entrances/Exits

Abstract
:1. Introduction
2. Literature Review
2.1. Entrance Space
2.2. Metro Supply-and-Demand Relationship
2.2.1. The Calculation of Supply and Demand
2.2.2. Metro Accessibility Measurement
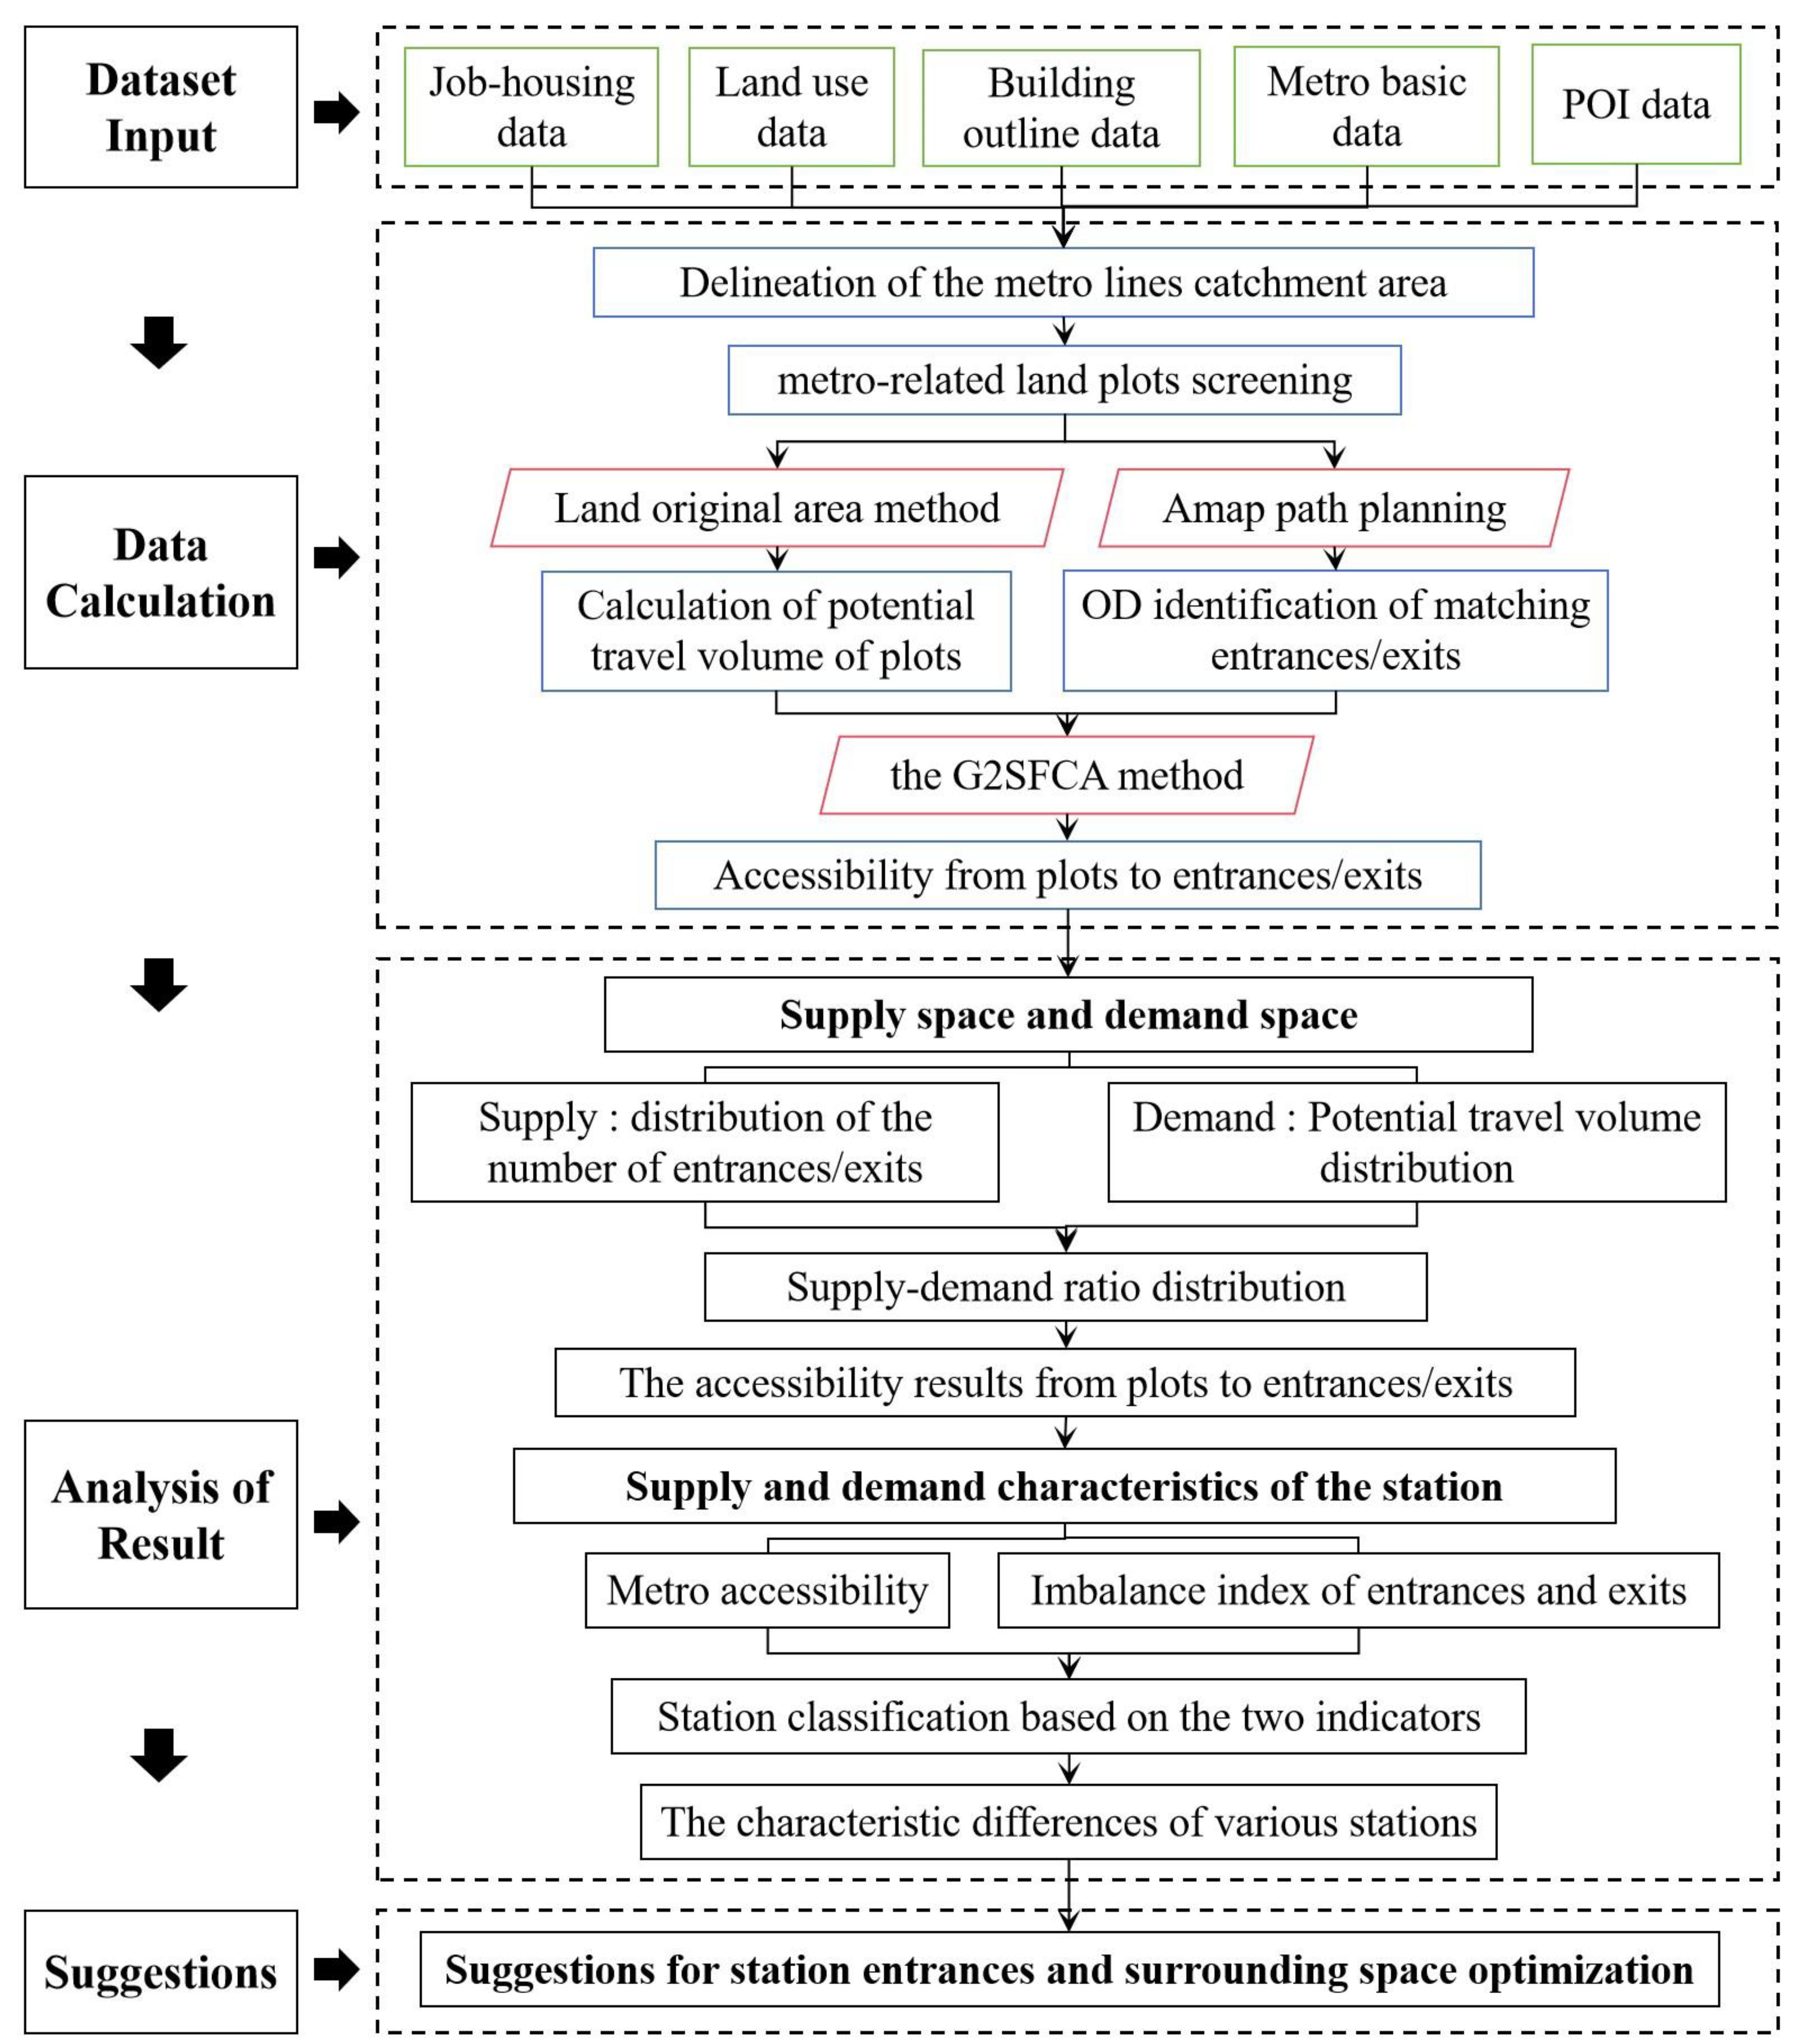
3. Methods and Data
3.1. Study Data
3.2. Methods
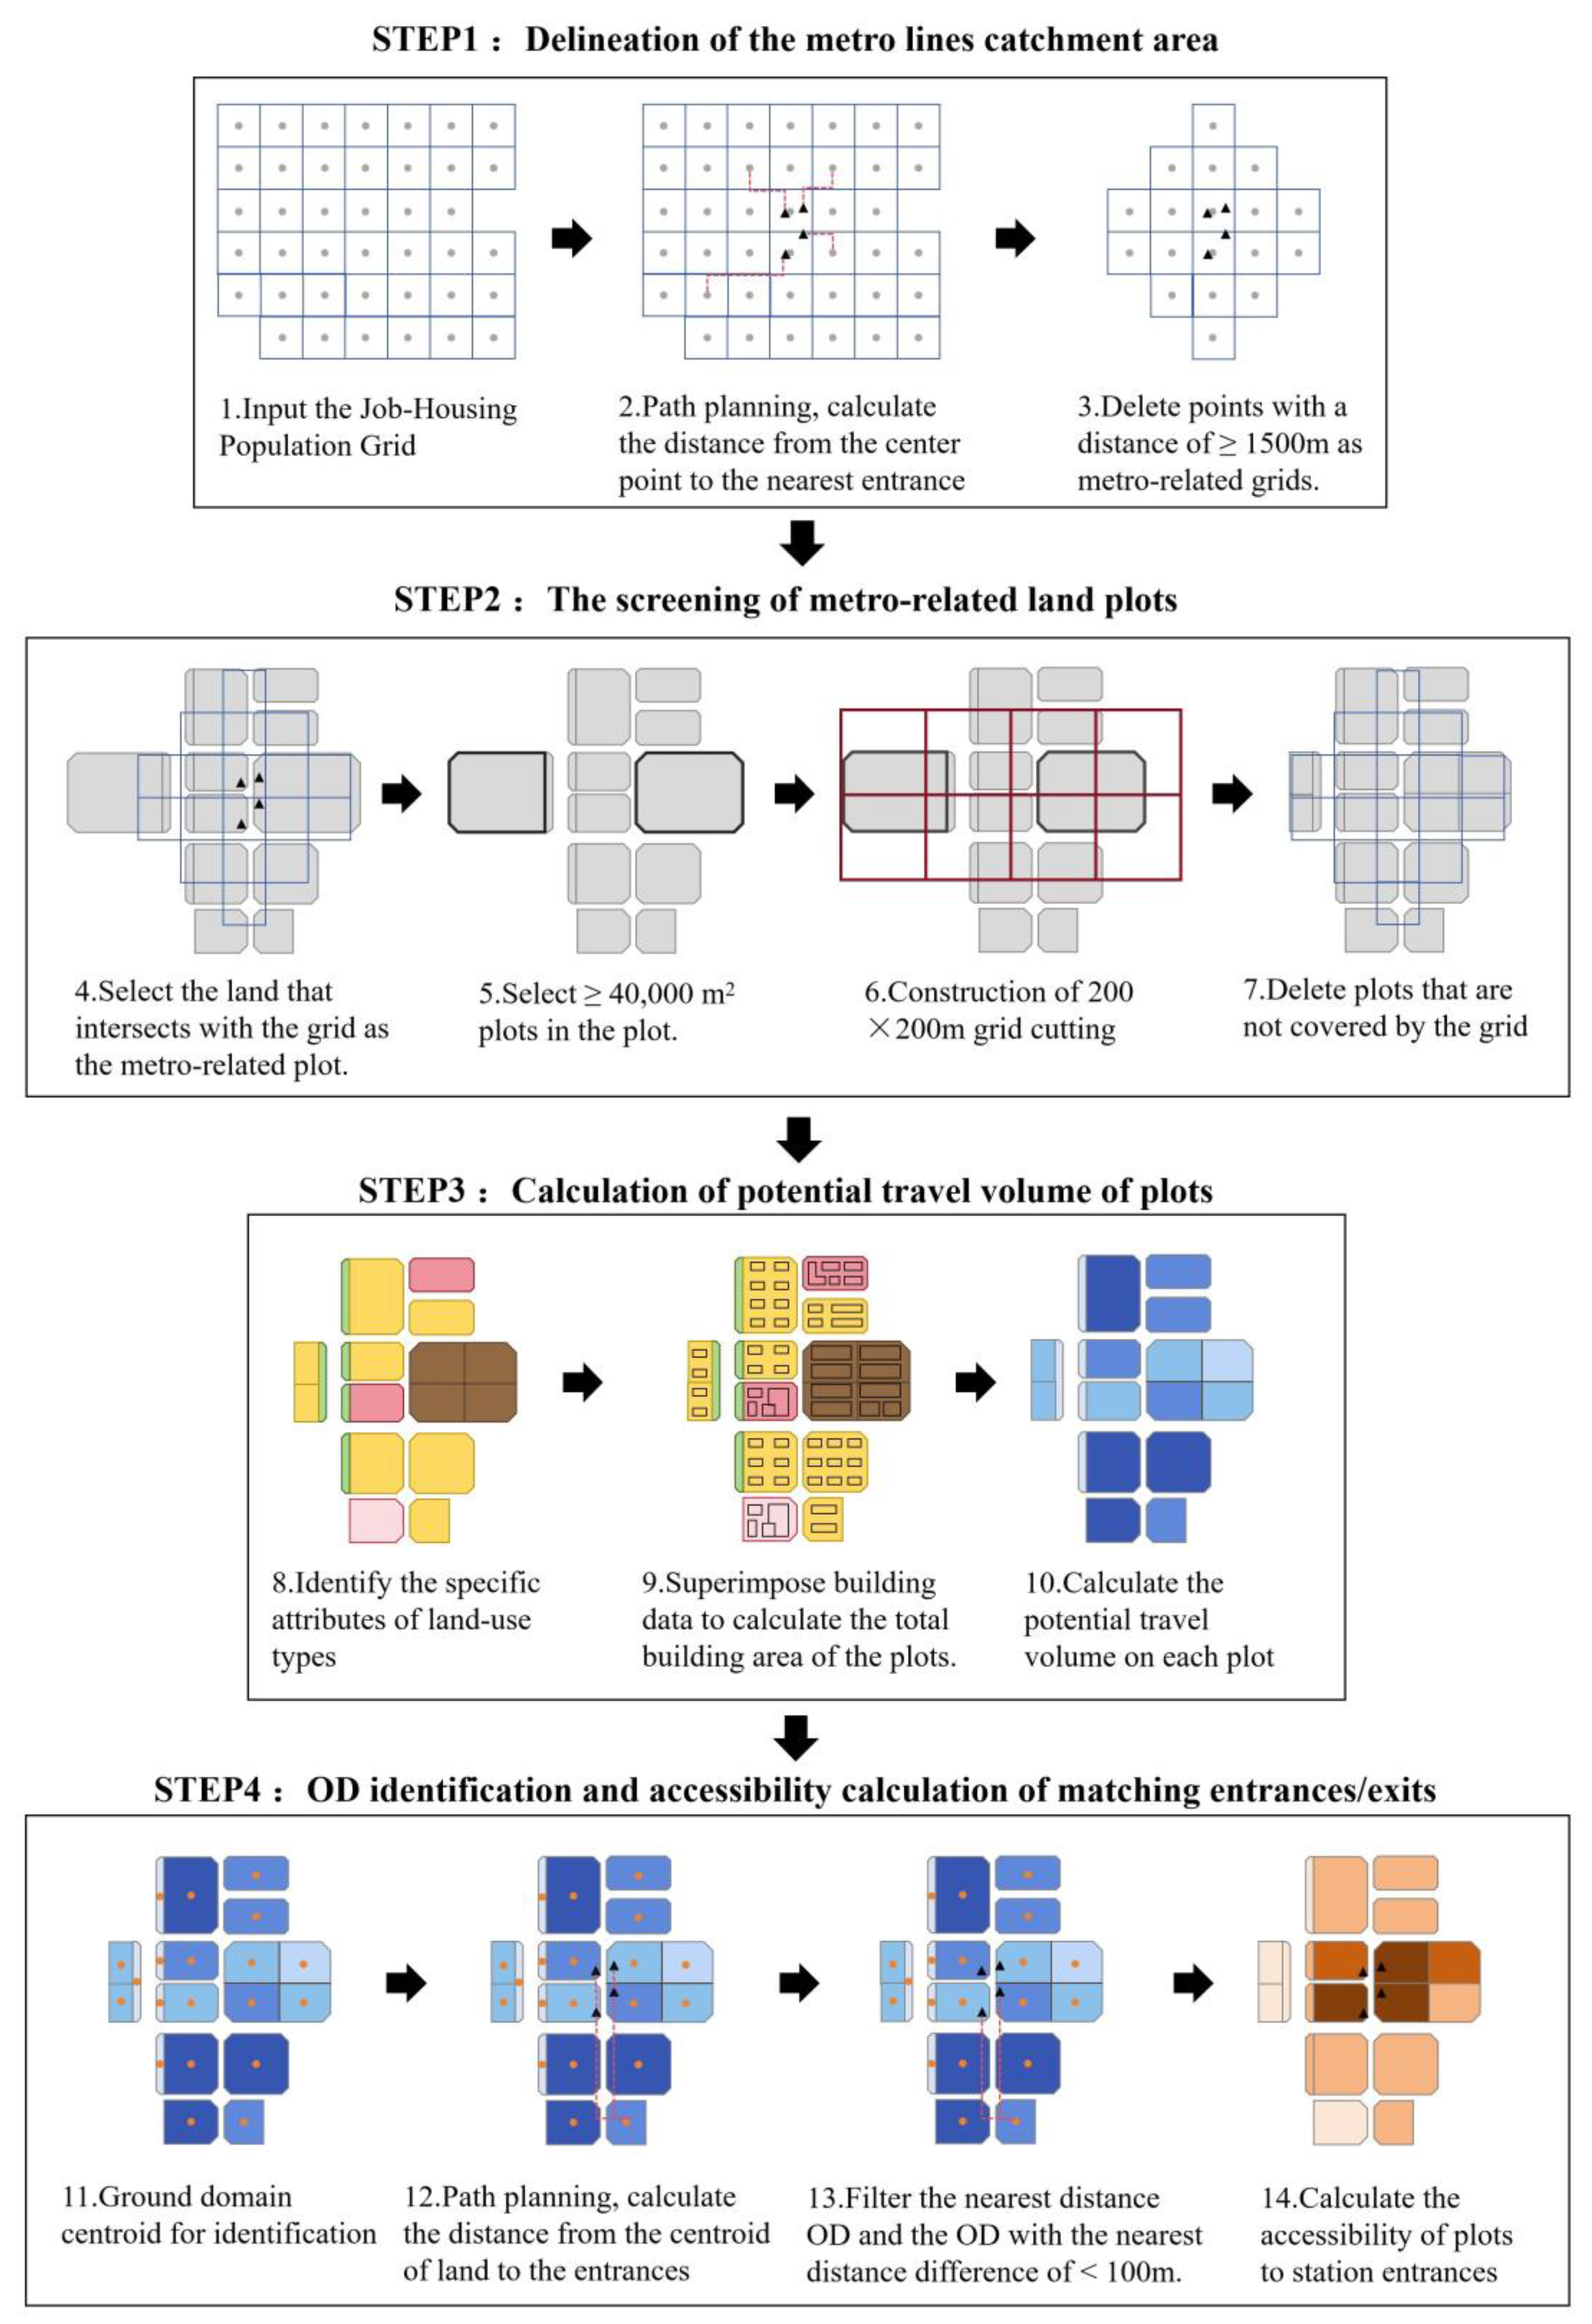
3.2.1. Land-Use Data-Processing Process
3.2.2. Demand Scale Calculation
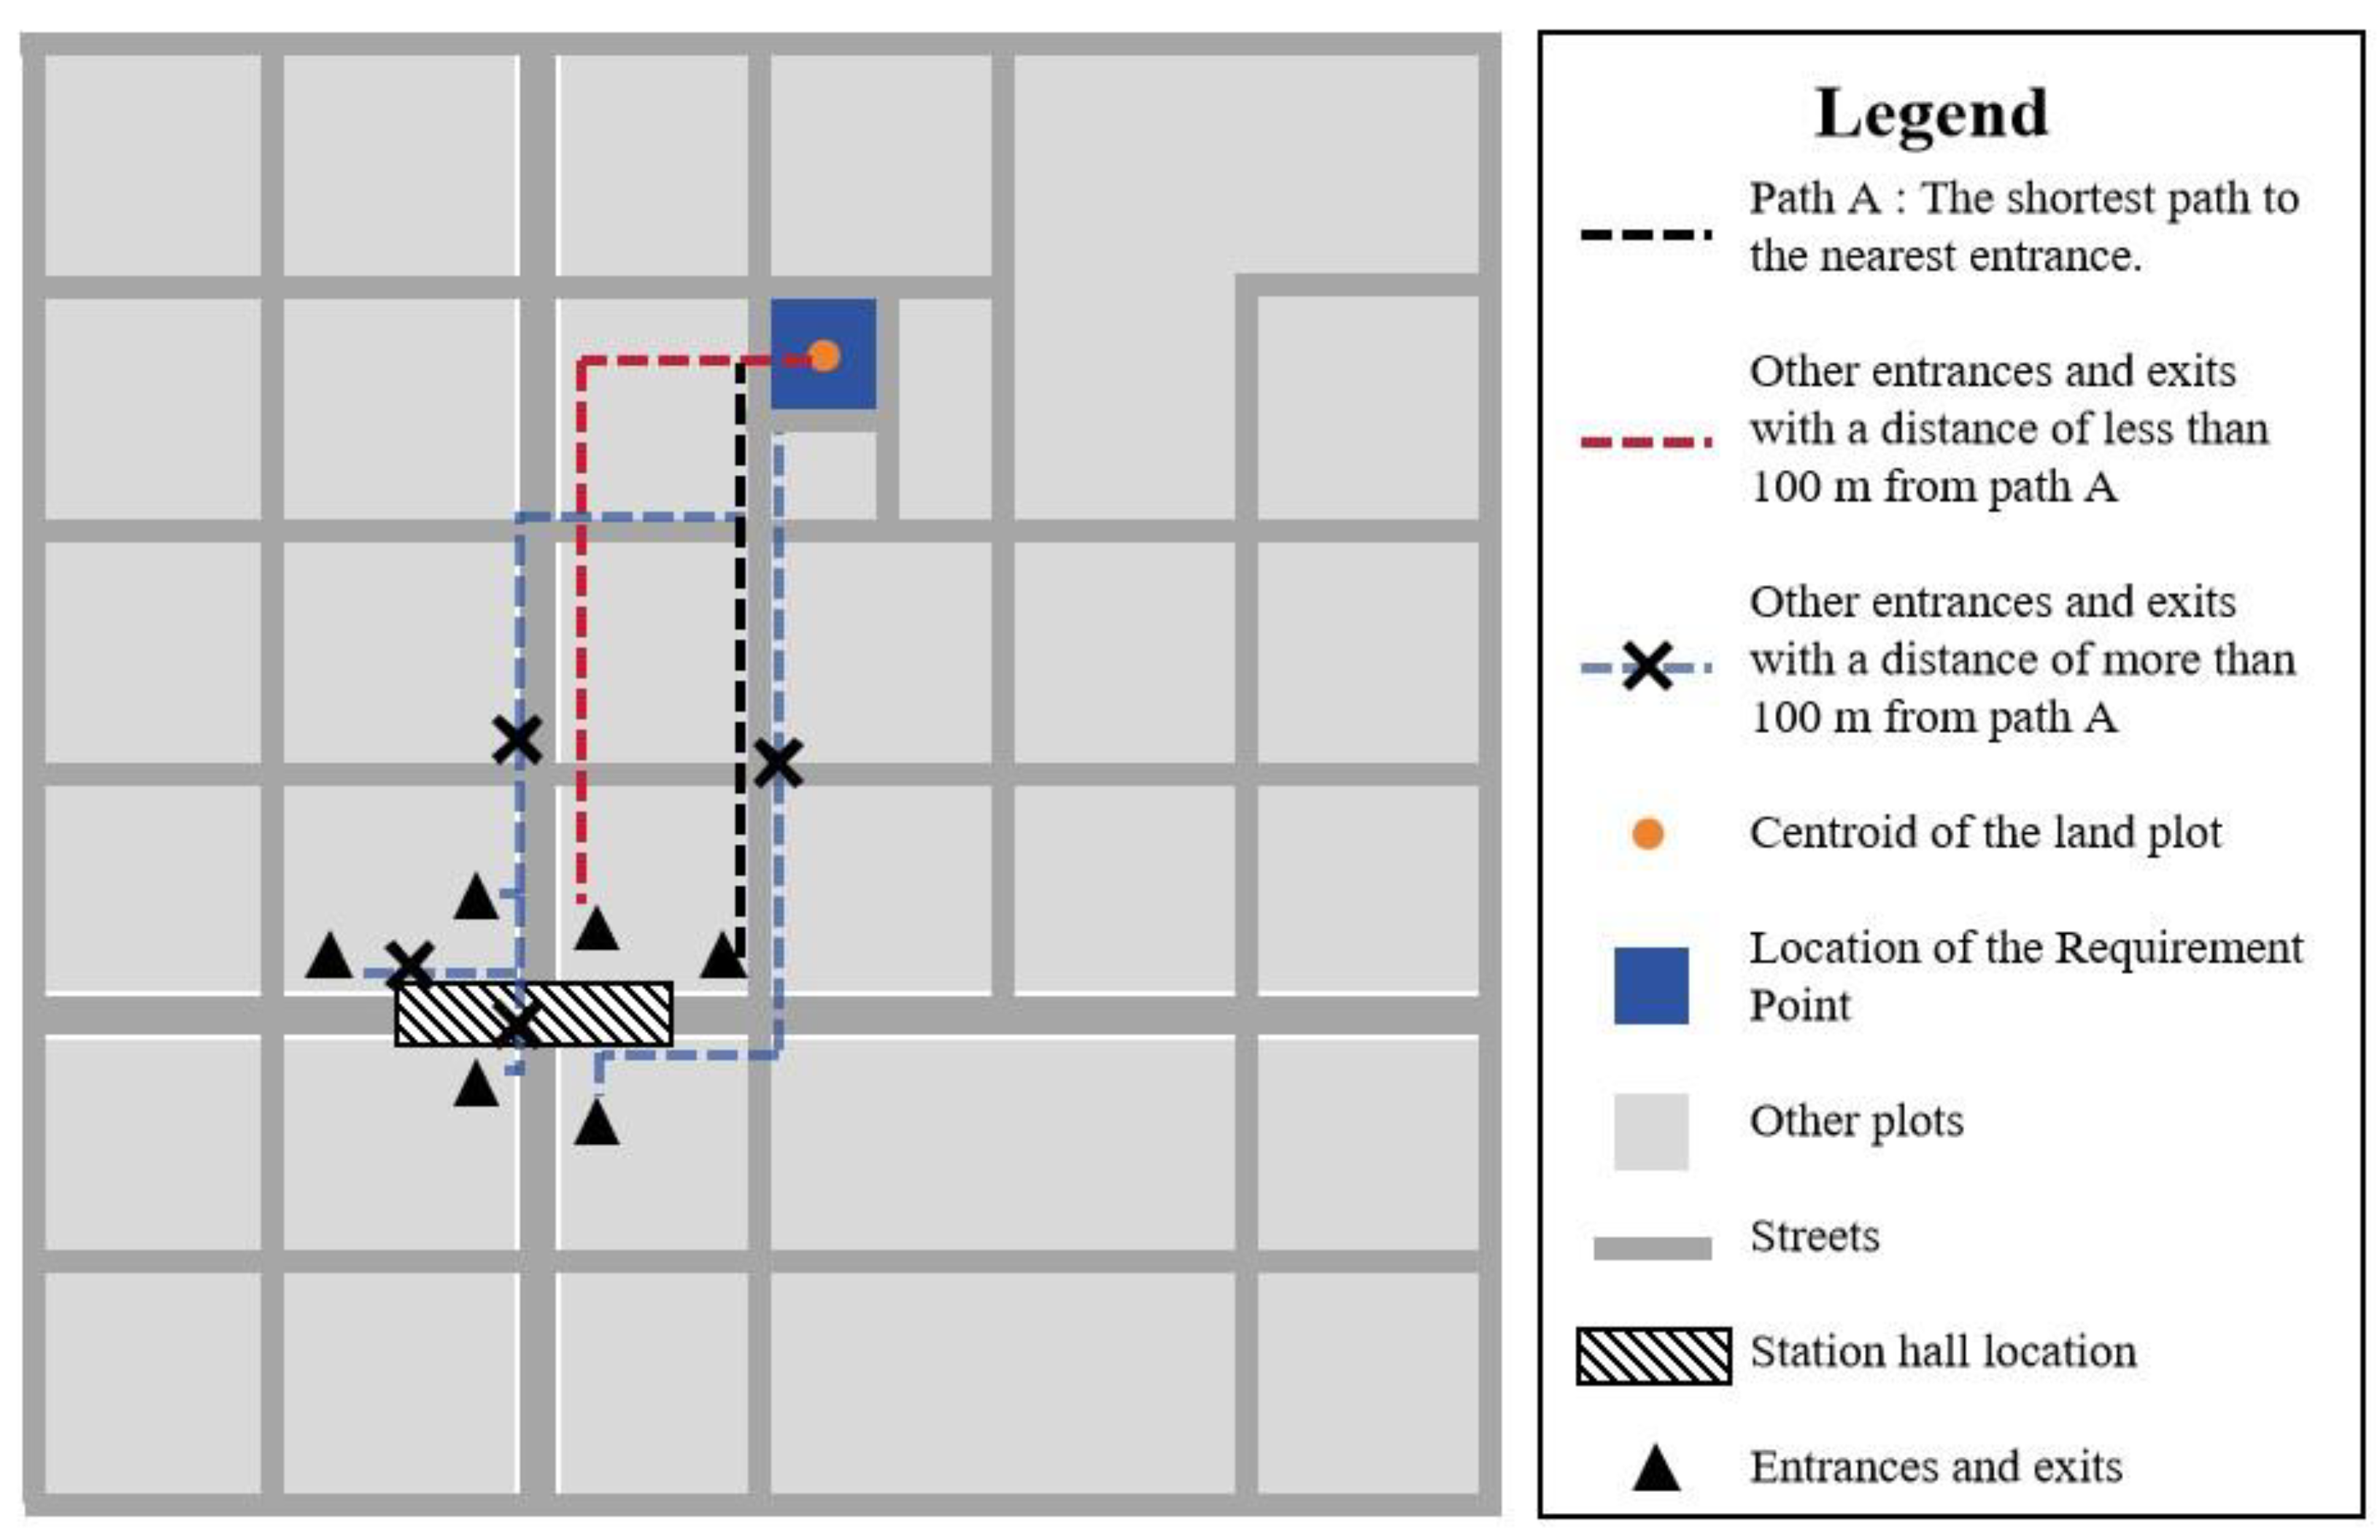
3.2.3. Accessibility Measurement Methodology
3.2.4. Imbalance Index of Entrance and Exit
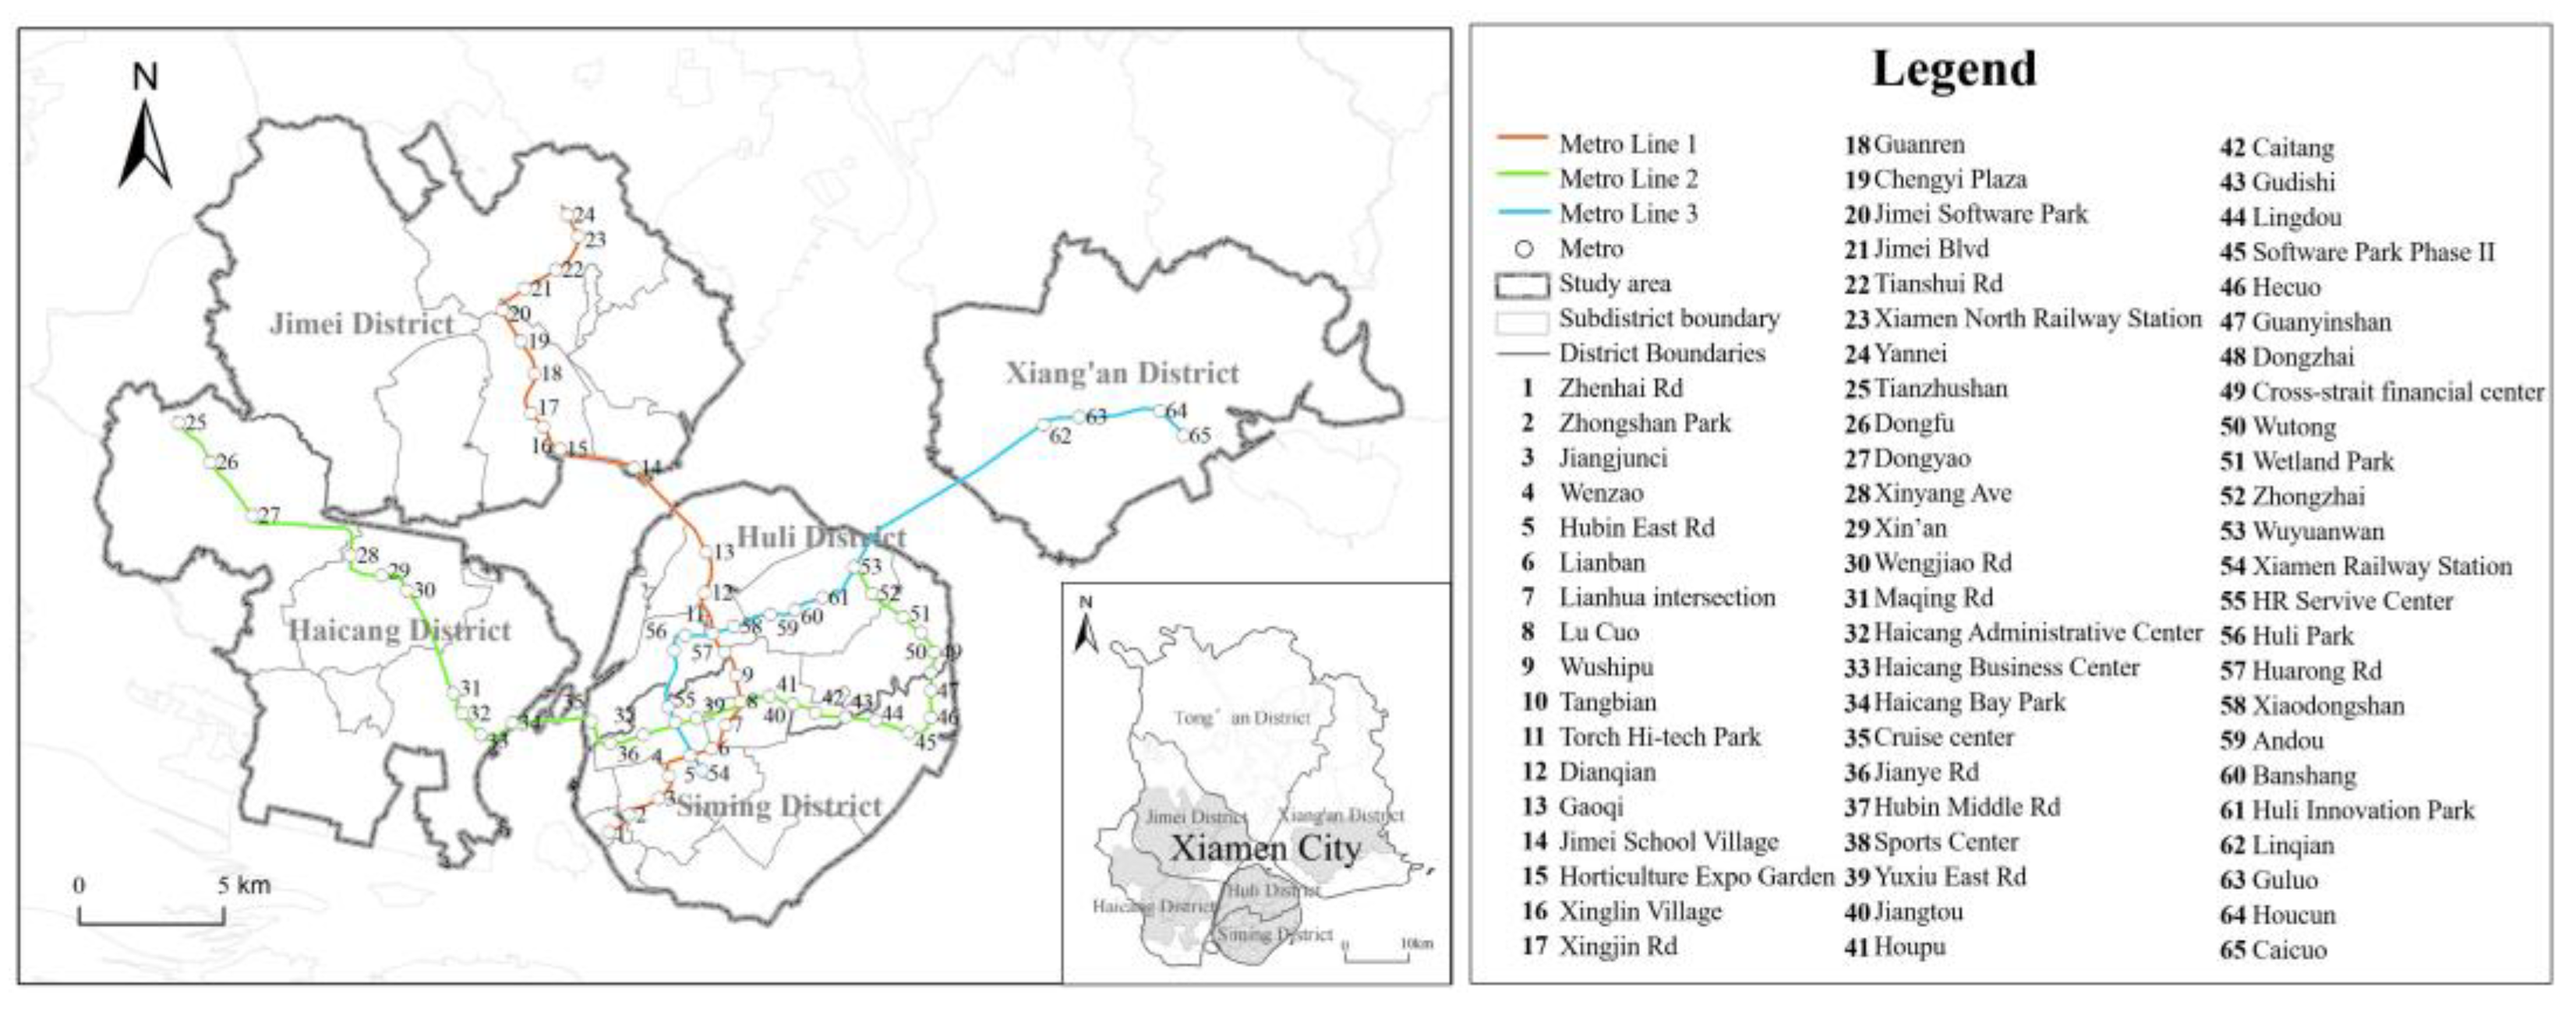
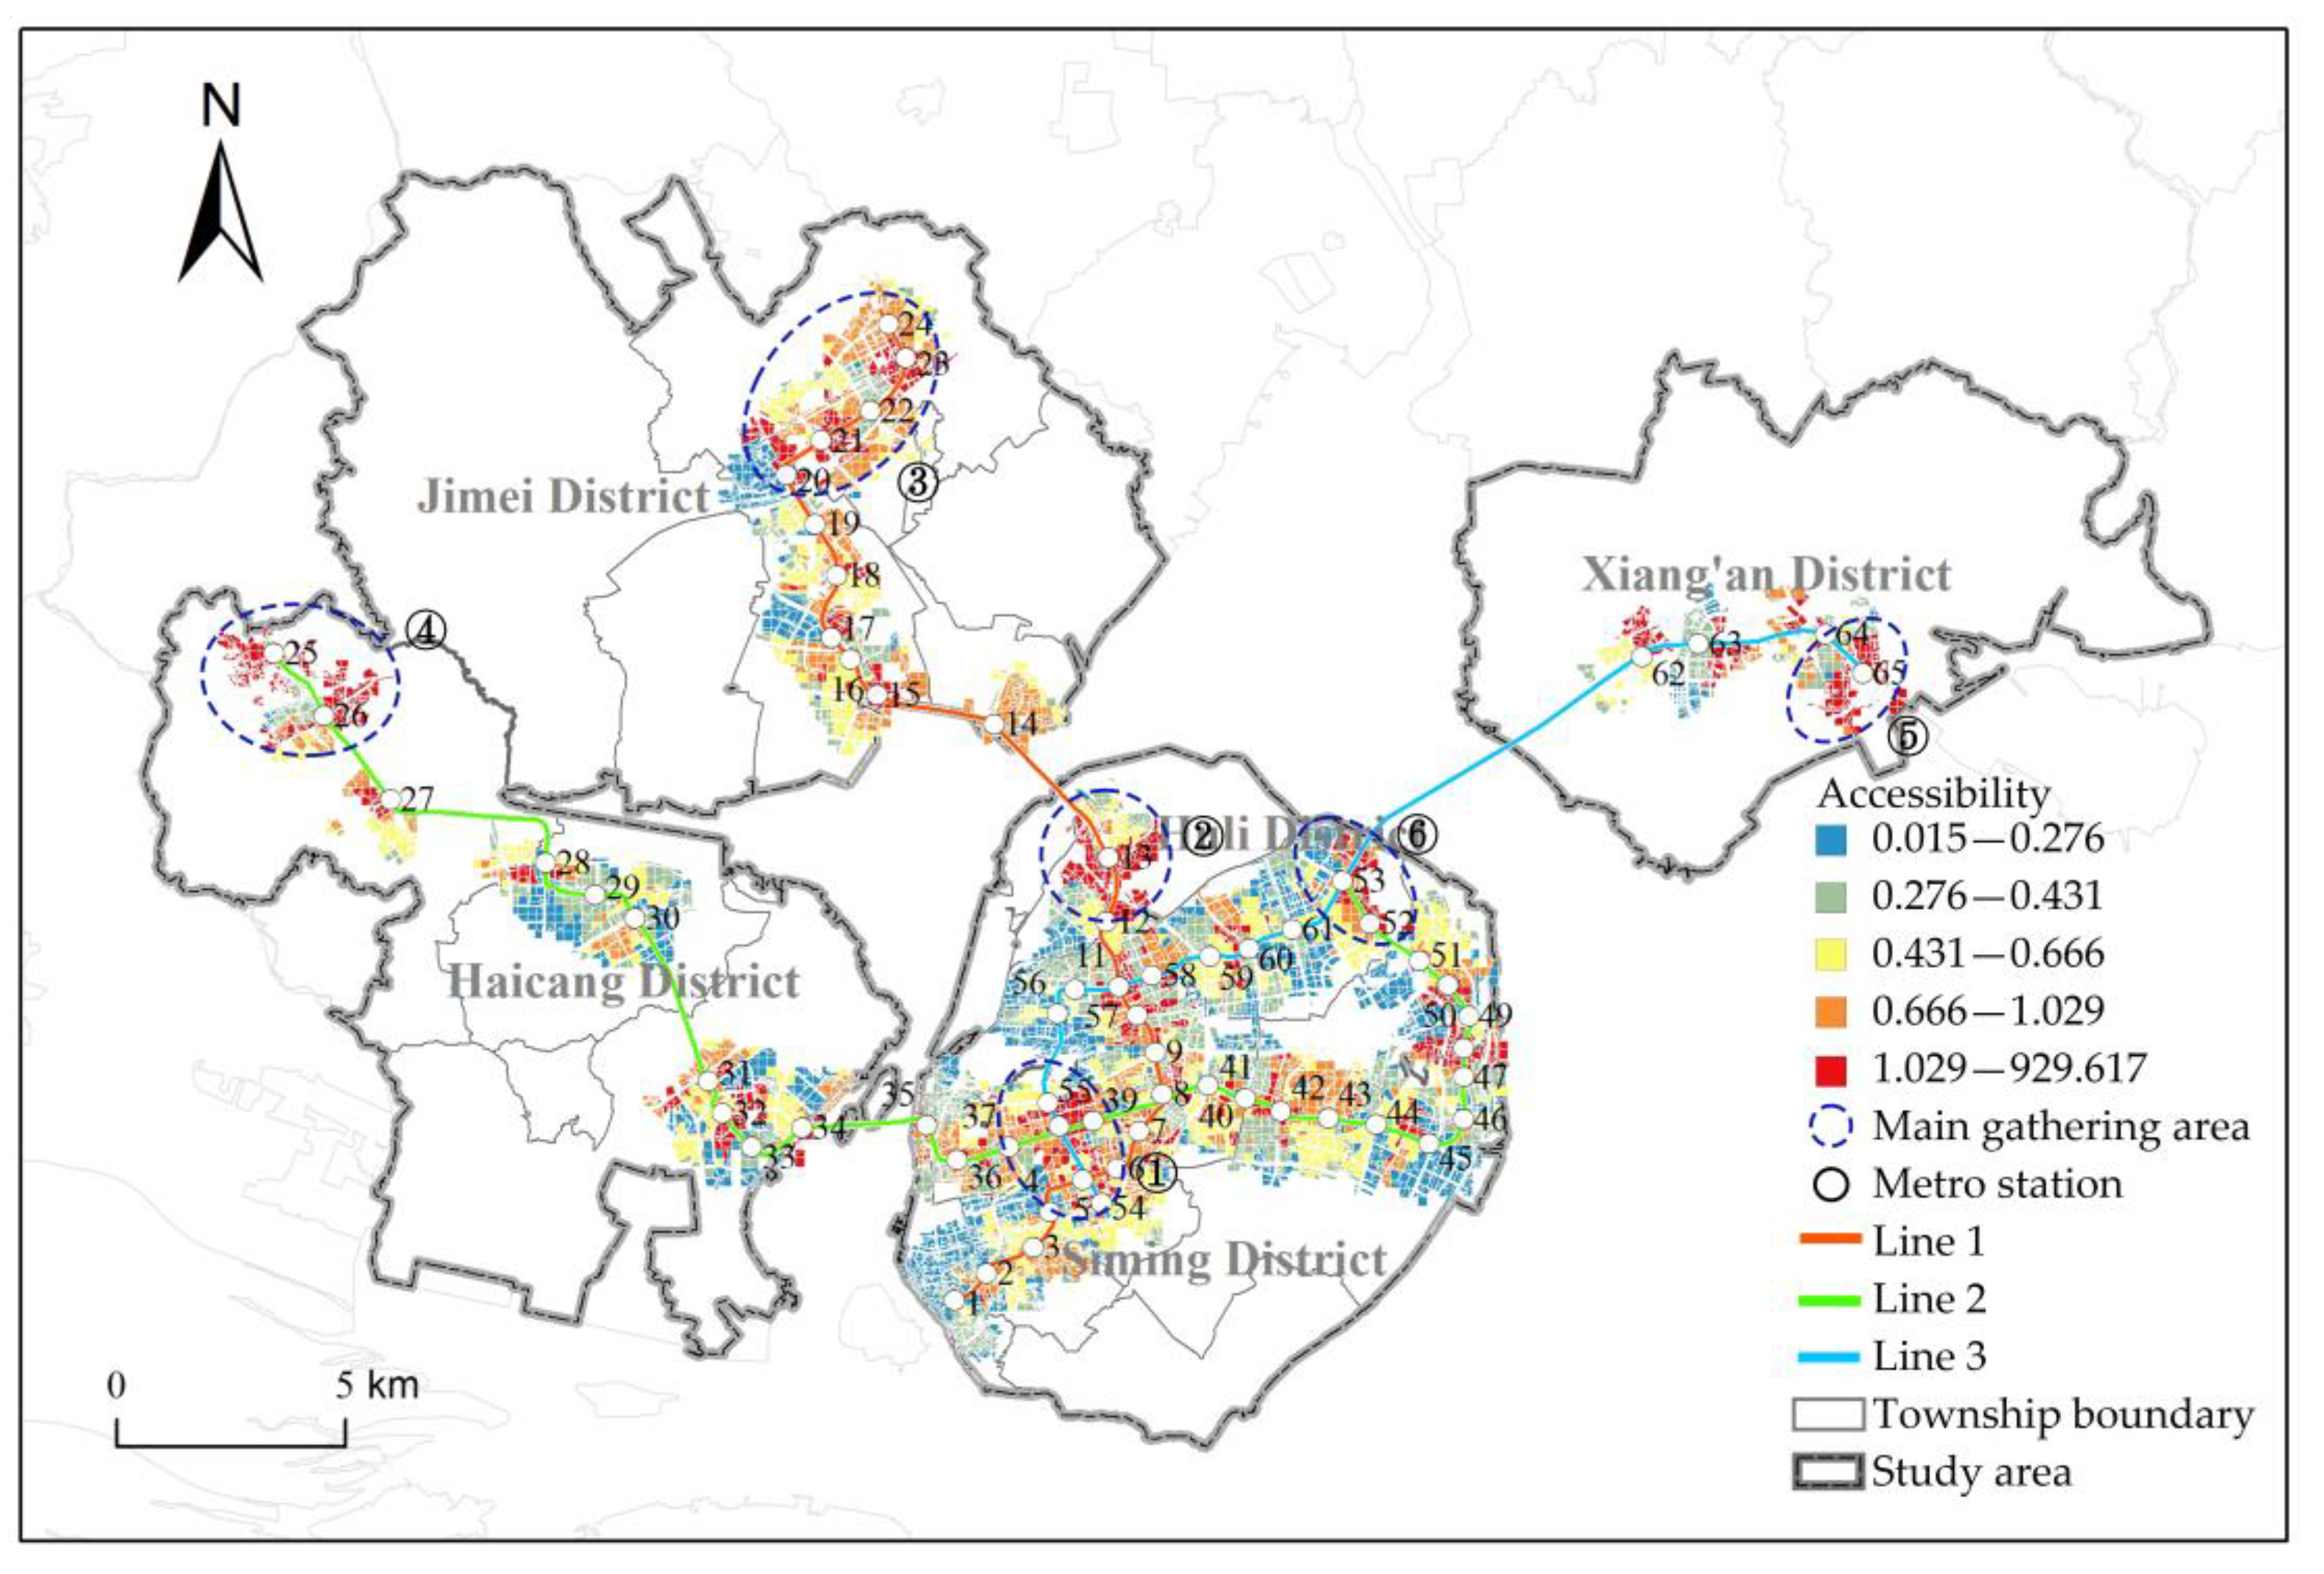
3.3. Study Area
4. Results
4.1. Supply Space and Demand Space
4.2. Spatial Heterogeneity of Accessibility
4.3. Supply and Demand Characteristics of the Station
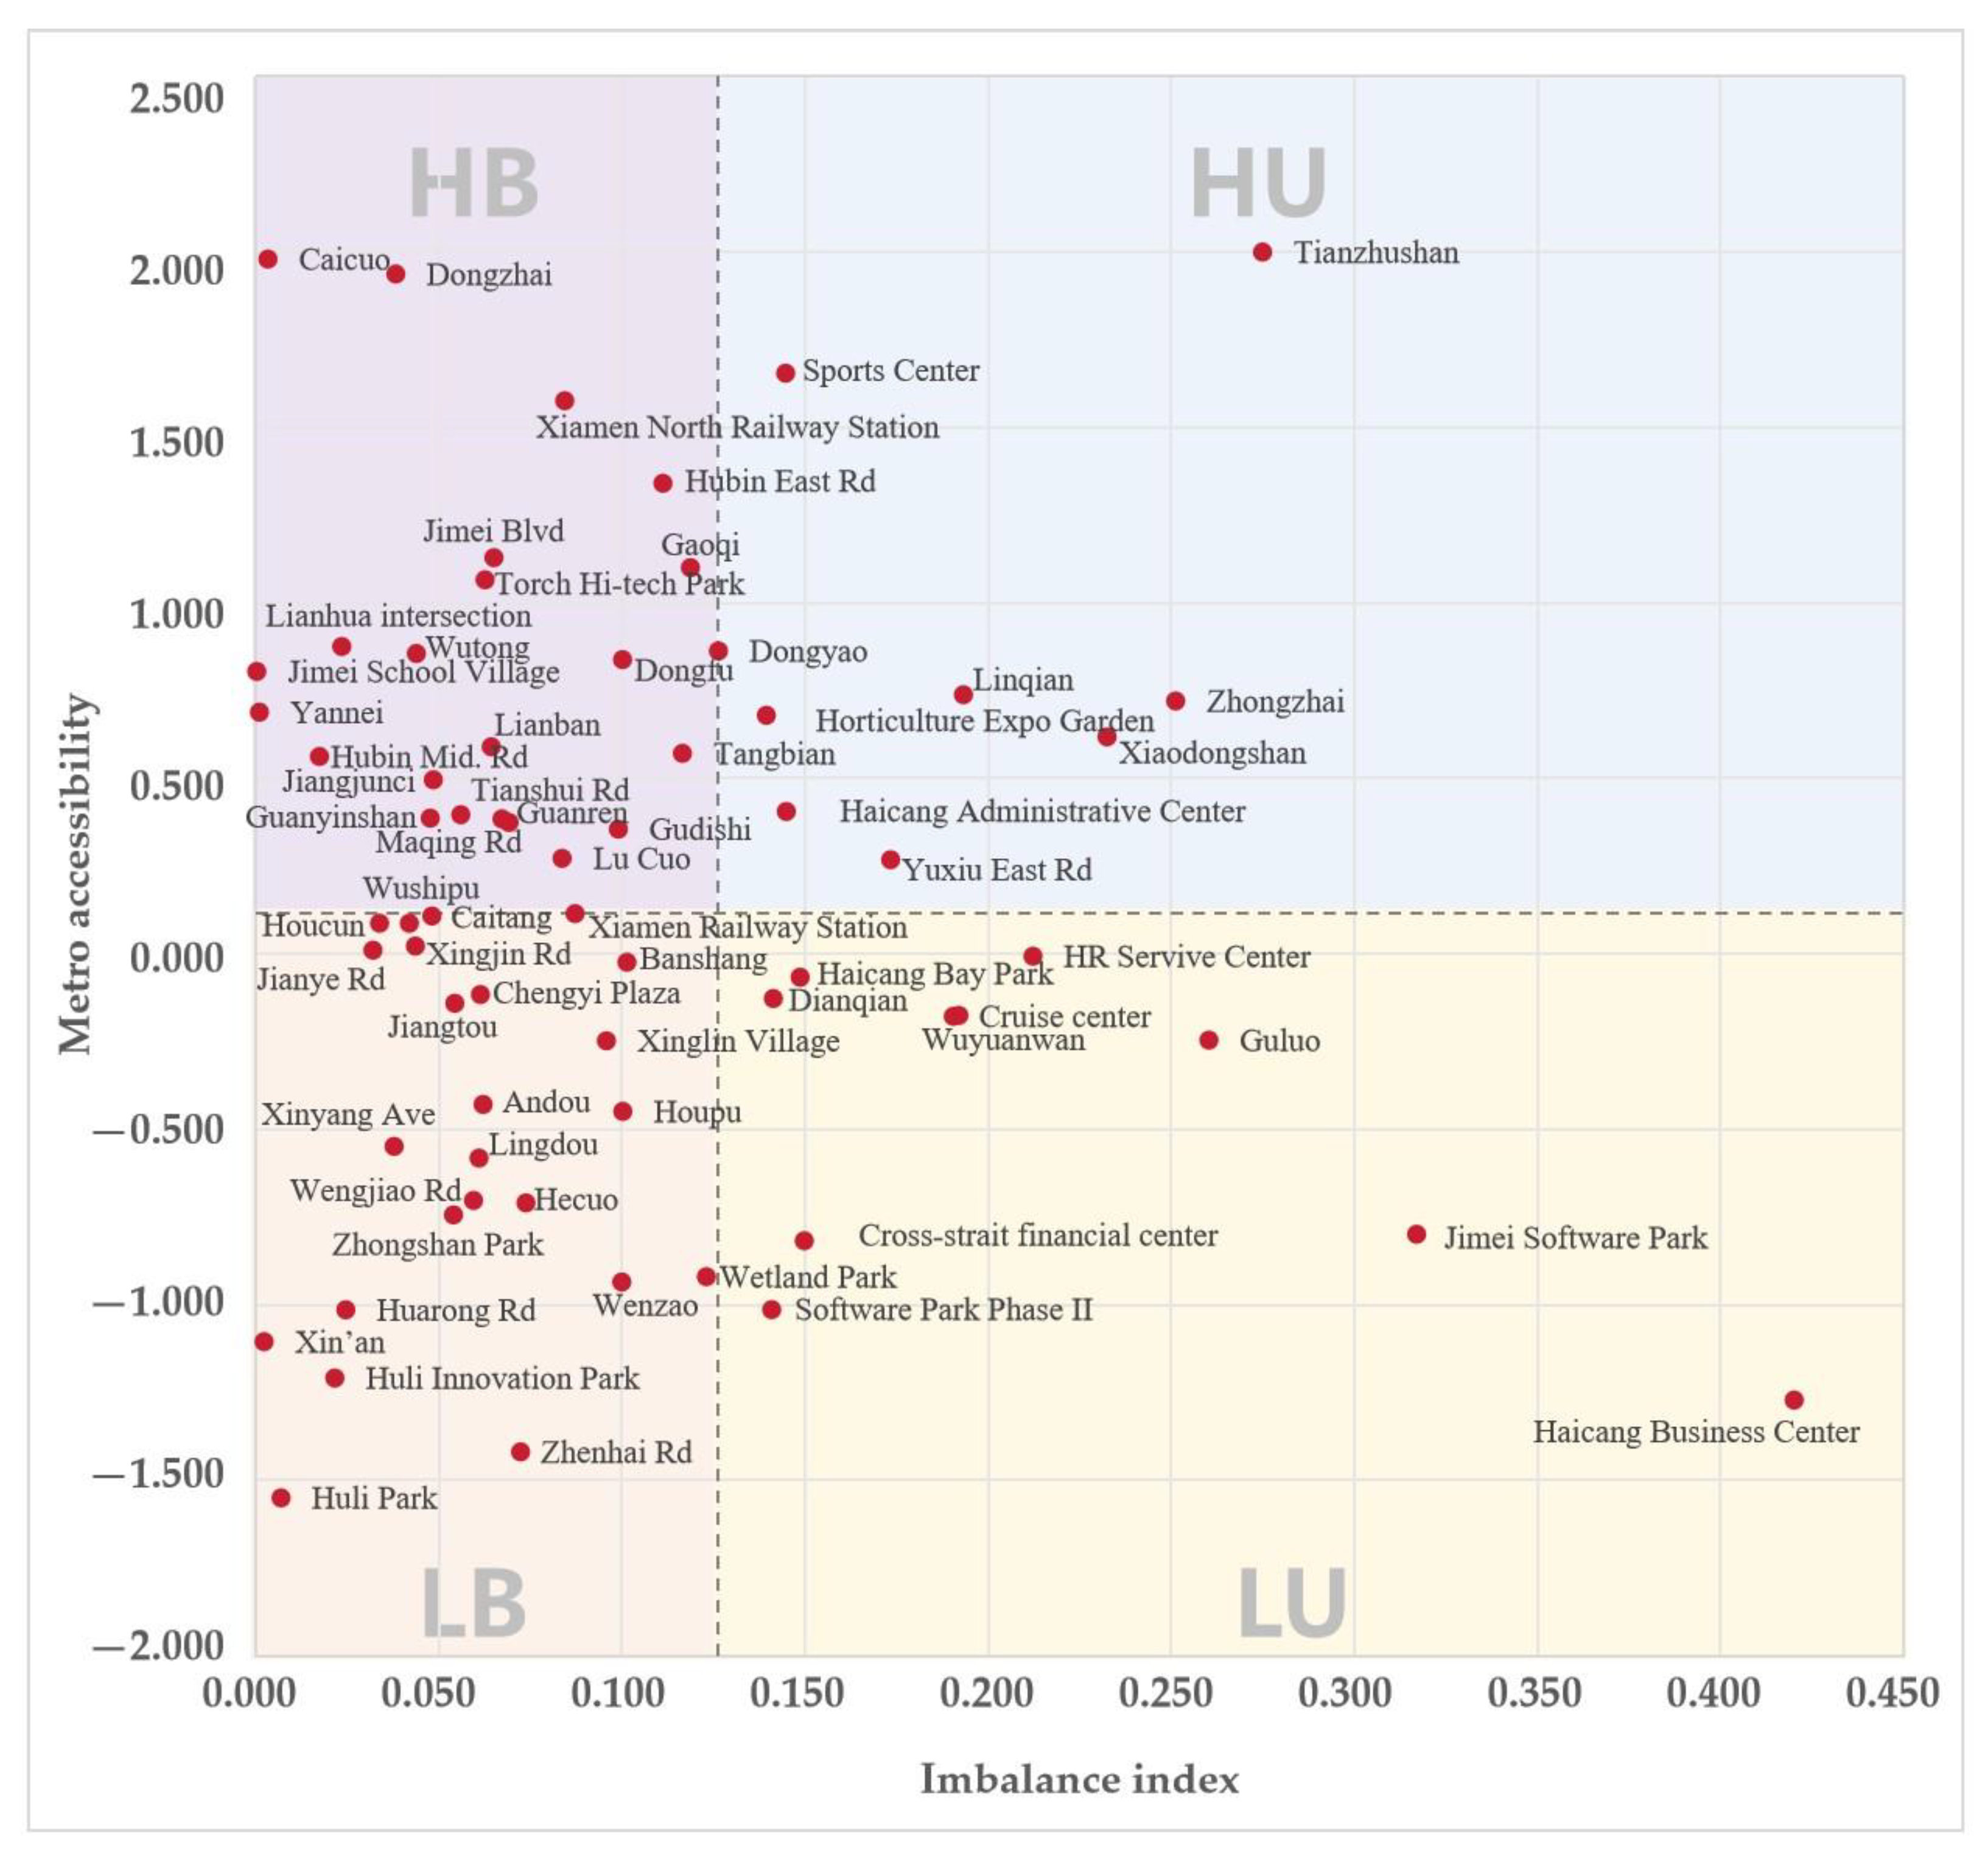
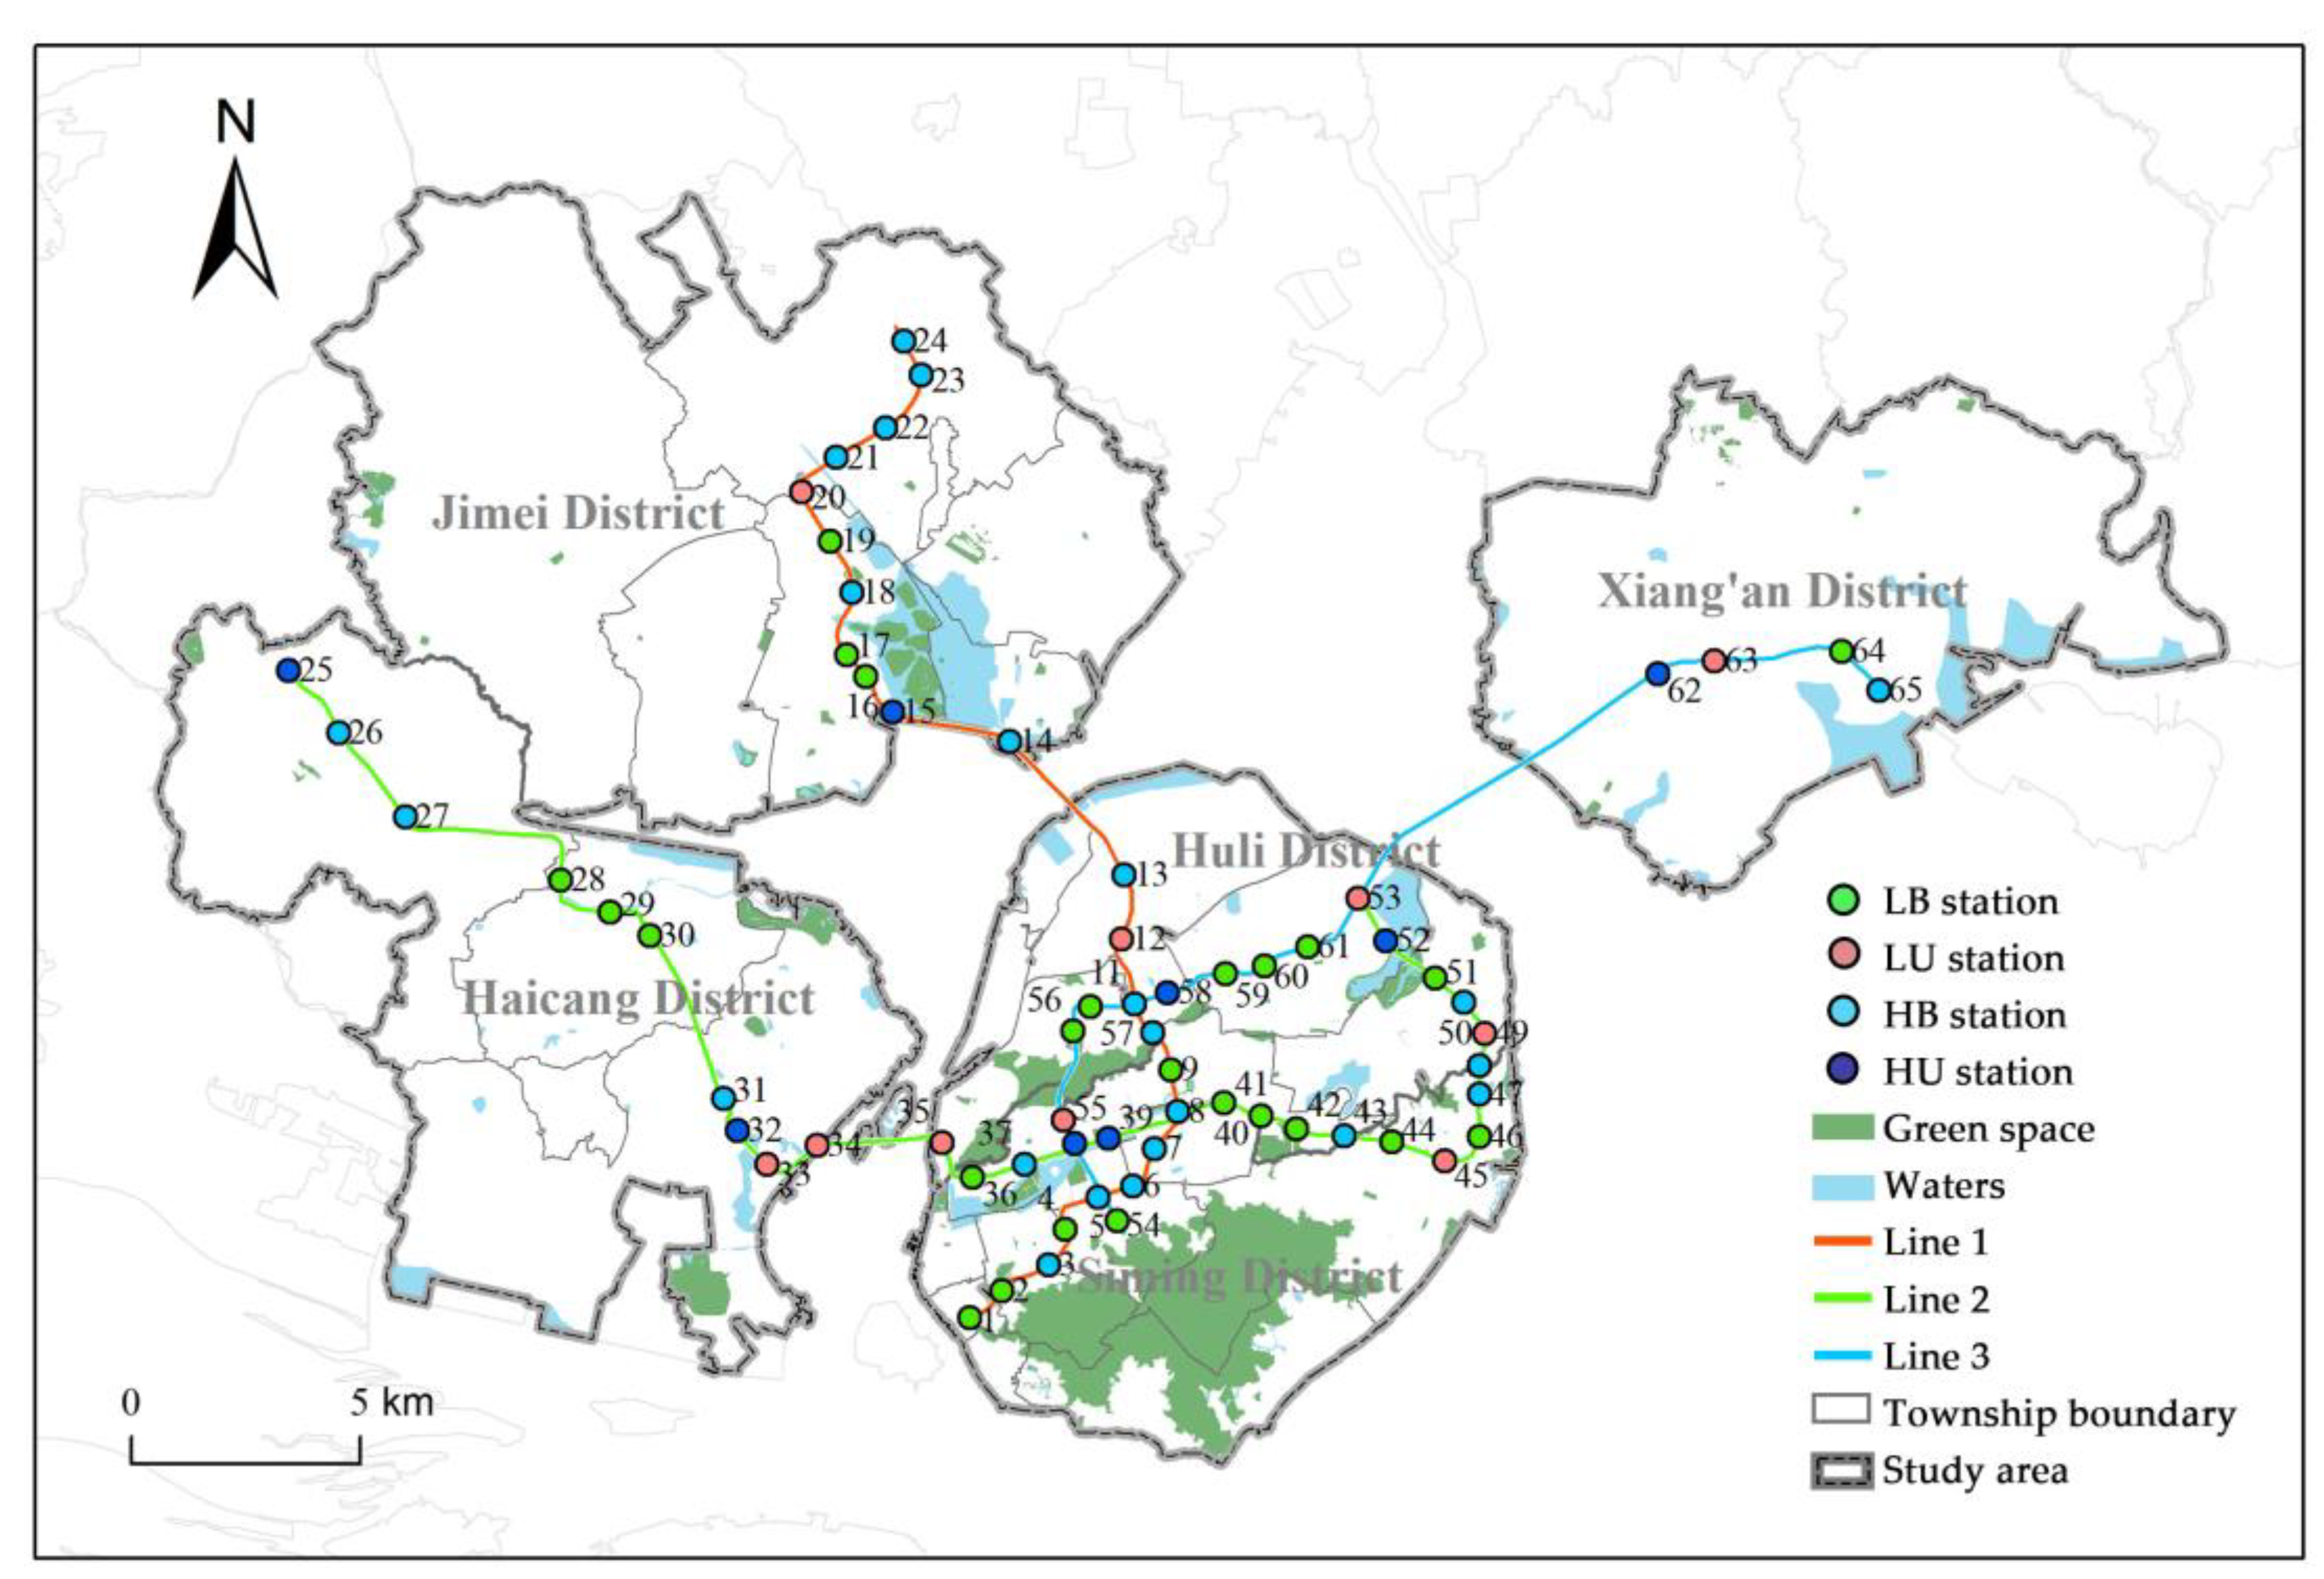
4.4. Station Classification and Characteristics
- (i)
- The LU stations are mainly office function stations with special location environments, and the passenger aggregation at these stations shows a clear direction.
- (ii)
- The entrance density of LB stations is insufficient.
- (iii)
- The HU stations mainly serve public functions, and the connection between the passenger flow channels and entrances/exits of these stations is inadequate.
- (iv)
- The HB stations are associated with a higher level of development, and the potential demand at these stations corresponds well with their entrance/exit settings.
5. Discussion
5.1. The Land-Use Difference Should Be Considered in Metro Service Accessibility
5.2. The Application Potential of Taking Entrances/Exits as the Research Object
6. Conclusions and Suggestion
6.1. Conclusions
6.2. Suggestion
Author Contributions
Funding
Data Availability Statement
Conflicts of Interest
References
- Dou, M.; Wang, Y.; Dong, S. Integrating Network Centrality and Node-Place Model to Evaluate and Classify Station Areas in Shanghai. ISPRS Int. J. Geo-Inf. 2021, 10, 414. [Google Scholar] [CrossRef]
- Lei, K.; Hou, Q.; Duan, Y.; Xi, Y.; Chen, S.; Miao, Y.; Tong, H.; Hu, Z. The Spatiotemporal Matching Relationship between Metro Networks and Urban Population from an Evolutionary Perspective: Passive Adaptation or Active Guidance? Land 2024, 13, 1200. [Google Scholar] [CrossRef]
- Yu, C.; Lin, H.; Dong, W.; Fang, S.; Yuan, Q.; Yang, C. TripChain2RecDeepSurv: A novel framework to predict transit users’ lifecycle behavior status transitions for user management. Transp. Res. Part C Emerg. Technol. 2024, 167, 104818. [Google Scholar] [CrossRef]
- Li, S.; Lyu, D.; Liu, X.; Tan, Z.; Gao, F.; Huang, G.; Wu, Z. The varying patterns of rail transit ridership and their relationships with fine-scale built environment factors: Big data analytics from Guangzhou. Cities 2020, 99, 102580. [Google Scholar] [CrossRef]
- Lin, D.; Zhang, Y.; Zhu, R.; Meng, L. The analysis of catchment areas of metro stations using trajectory data generated by dockless shared bikes. Sustain. Cities Soc. 2019, 49, 101598. [Google Scholar] [CrossRef]
- Wang, C.; Qiu, Z.; Pan, R.; Wang, X.; Yan, Y.; Corazza, M.V. Exploring the Spatial Variation of Access/Egress Distances of Subway Stations Using Mobile Phone Positioning Data in Chengdu, China. J. Adv. Transp. 2023, 2023, 8008667. [Google Scholar] [CrossRef]
- Xu, Y.; Chen, X. Quantitative analysis of spatial vitality and spatial characteristics of urban underground space (UUS) in metro area. Tunn. Undergr. Space Technol. 2021, 111, 103875. [Google Scholar] [CrossRef]
- Lahoorpoor, B.; Levinson, D.M. Catchment if you can: The effect of station entrance and exit locations on accessibility. J. Transp. Geogr. 2020, 82, 102556. [Google Scholar] [CrossRef]
- Du, P.; He, S.-L. Price Analysis of Commercial Real Estate Around Urban Rail Transit Station Based on Spatial Dubin Model. J. Transp. Syst. Eng. Inf. Technol. 2023, 23, 94–100. [Google Scholar] [CrossRef]
- Guo, S.; Pei, T.; Wang, X.; Song, C.; Chen, X.; Chen, J.; Shu, H.; Liu, Y.; Wu, M. Equity of subway accessibility: A perspective from work commute trips. Transp. Res. Part D Transp. Environ. 2022, 113, 103515. [Google Scholar] [CrossRef]
- Wu, T.; Li, M.; Zhou, Y. Measuring Metro Accessibility: An Exploratory Study of Wuhan Based on Multi-Source Urban Data. ISPRS Int. J. Geo-Inf. 2023, 12, 18. [Google Scholar] [CrossRef]
- Zhu, Y.; Jiao, L.; Zhang, Y.; Wu, Y.; Huo, X. Sustainable Development of Urban Metro System: Perspective of Coordination between Supply and Demand. Int. J. Environ. Res. Public Health 2021, 18, 10349. [Google Scholar] [CrossRef] [PubMed]
- Ben-Elia, E.; Benenson, I. A spatially-explicit method for analyzing the equity of transit commuters’ accessibility. Transp. Res. Part A Policy Pract. 2019, 120, 31–42. [Google Scholar] [CrossRef]
- Wang, Z.; Liu, S.; Lian, H.; Chen, X. Investigating the Nonlinear Effect of Land Use and Built Environment on Public Transportation Choice Using a Machine Learning Approach. Land 2024, 13, 1302. [Google Scholar] [CrossRef]
- Izanloo, A.; Rafsanjani, A.K.; Ebrahimi, S.P. Effect of Commercial Land Use and Accessibility Factor on Traffic Flow in Bojnourd. J. Urban Plan. Dev. 2017, 143, 05016016. [Google Scholar] [CrossRef]
- Bahale, S.; Schuetze, T. Sustainable Transportation Assessment Index (SusTAIN) Framework for Mixed-Use Neighborhoods in India. Land 2024, 13, 1325. [Google Scholar] [CrossRef]
- Weerasinghe, O.; Bandara, S. Modified Traffic Analysis Zones Approach for the Estimation of Passenger Flow Distribution in Urban Areas. J. Urban Plan. Dev. 2023, 149, 04022045. [Google Scholar] [CrossRef]
- Gao, Y.E.; Kan, X.X.; Cheng, J.; Zheng, S.; Chen, M.W. Accessibility Evaluation of a Newly Planned High-Speed Railway Station in a Metropolitan Core Area Based on a Modified Two-Step Floating Catchment Area Method. J. Urban Plan. Dev. 2024, 150, 05024012. [Google Scholar] [CrossRef]
- Yuan, H.; Xu, L.; Yan, Y.; Jiang, W. Accessibility to Urban Rail Transit Based on Enhanced Two-step Floating Catchment Area Method. J. Transp. Syst. Eng. Inf. Technol. 2022, 22, 113–119. [Google Scholar] [CrossRef]
- Xu, W.; Ding, Y.; Zhou, J.; Li, Y. Transit accessibility measures incorporating the temporal dimension. Cities 2015, 46, 55–66. [Google Scholar] [CrossRef]
- Xu, H.; Chen, M. Simulation Analysis of the Efficiency of Evacuation Entrances of Strip-like Metro Commercial Streets: A Case Study of Wuhan Business District Metro Station. Buildings 2023, 13, 1826. [Google Scholar] [CrossRef]
- Gan, Z.; Feng, T.; Yang, M.; Timmermans, H.; Luo, J. Analysis of Metro Station Ridership Considering Spatial Heterogeneity. Chin. Geogr. Sci. 2019, 29, 1065–1077. [Google Scholar] [CrossRef]
- Shen, L.; Wang, Y.; Zhang, C.; Jiang, D.; Li, H. Relationship between built environment of rational pedestrian catchment areas and URT commuting ridership: Evidence from 44 URT stations in Beijing. Acta Geogr. Sin. 2018, 73, 2423–2439. [Google Scholar] [CrossRef]
- Li, X.; Du, M.; Yang, J. Factors influencing the access duration of free-floating bike sharing as a feeder mode to the metro in Shenzhen. J. Clean. Prod. 2020, 277, 123273. [Google Scholar] [CrossRef]
- Zhu, Q.; Zhu, X.; Shang, P.; Meng, L.; Esztergár-Kiss, D. Analytical Approximation-Based Approach for Passenger Flow Control Strategy in Oversaturated Urban Rail Transit Systems. J. Adv. Transp. 2023, 2023, 3513517. [Google Scholar] [CrossRef]
- Ricciardi, A.M.; Xia, J.; Currie, G. Exploring public transport equity between separate disadvantaged cohorts: A case study in Perth, Australia. J. Transp. Geogr. 2015, 43, 111–122. [Google Scholar] [CrossRef]
- Peungnumsai, A.; Miyazaki, H.; Witayangkurn, A.; Kim, S.M. A Grid-Based Spatial Analysis for Detecting Supply–Demand Gaps of Public Transports: A Case Study of the Bangkok Metropolitan Region. Sustainability 2020, 12, 10382. [Google Scholar] [CrossRef]
- Delbosc, A.; Currie, G. Using Lorenz curves to assess public transport equity. J. Transp. Geogr. 2011, 19, 1252–1259. [Google Scholar] [CrossRef]
- Shen, Z.; Gao, G.; Wang, Z.; Yao, Z. Accessibility Assessment of Prehospital Emergency Medical Services considering Supply-Demand Differences. J. Adv. Transp. 2021, 2021, 1–16. [Google Scholar] [CrossRef]
- Chen, J.; Wang, C.; Zhang, Y.; Li, D. Measuring spatial accessibility and supply-demand deviation of urban green space: A mobile phone signaling data perspective. Front. Public Health 2022, 10, 1029551. [Google Scholar] [CrossRef]
- Li, L.; Ren, H.; Zhao, S.; Duan, Z.; Zhang, Y.; Zhang, A. Two dimensional accessibility analysis of metro stations in Xi’an, China. Transp. Res. Part A Policy Pract. 2017, 106, 414–426. [Google Scholar] [CrossRef]
- Yu, C.; Lin, H.; Chen, Y.; Yang, C.; Yin, A.; Yuan, Q. Creating most needed customized bus services: A collaborative analysis of user-route dynamics. Transp. Res. Part D: Transp. Environ. 2024, 133, 104312. [Google Scholar] [CrossRef]
- Wu, X.; Lu, Y.; Lin, Y.; Yang, Y. Measuring the Destination Accessibility of Cycling Transfer Trips in Metro Station Areas: A Big Data Approach. Int. J. Environ. Res. Public Health 2019, 16, 2641. [Google Scholar] [CrossRef] [PubMed]
- Song, J.; Abuduwayiti, A.; Gou, Z. The role of subway network in urban spatial structure optimization – Wuhan city as an example. Tunn. Undergr. Space Technol. 2023, 131, 104842. [Google Scholar] [CrossRef]
- Liu, J.M.; Hou, X.H.; Xia, C.Y.; Kang, X.; Zhou, Y.J. Examining the Spatial Coordination between Metrorail Accessibility and Urban Spatial Form in the Context of Big Data. Land 2021, 10, 580. [Google Scholar] [CrossRef]
- Radke, J.; Mu, L. Spatial Decompositions, Modeling and Mapping Service Regions to Predict Access to Social Programs. Ann. GIS 2000, 6, 105–112. [Google Scholar] [CrossRef]
- Luo, W.; Qi, Y. An enhanced two-step floating catchment area (E2SFCA) method for measuring spatial accessibility to primary care physicians. Health Place 2009, 15, 1100–1107. [Google Scholar] [CrossRef]
- Zhai, X.H.; Zhao, J.H.; Chen, Q. Analysis of the public transit accessibility in Changsha City, China, after the introduction of a subway network. Int. J. Mod. Phys. B 2018, 32, 1850354. [Google Scholar] [CrossRef]
- Weng, J.C.; Shen, H.P.; Lin, P.F.; Jing, Y.Q.; Qian, H.M. Exploring the spatiotemporal relationships between built environment and the public transport competitiveness: A case study from Beijing. J. Clean. Prod. 2024, 446, 141333. [Google Scholar] [CrossRef]
- Li, W.; He, J.; Yu, Q.; Chang, Y.; Liu, P. Using POI Data to Identify the Demand for Pedestrian Crossing Facilities at Mid-Block. Sustainability 2021, 13, 13256. [Google Scholar] [CrossRef]
- Fu, F.; Jia, X.; Wu, D.; Zhao, Q.; Fang, H.; Lin, L.; Aye, L. Evolution and prediction of land use around metro stations. Front. Environ. Sci. 2023, 11, 1106019. [Google Scholar] [CrossRef]
- Huang, W.; Kong, L.; Zhang, Y.; Chen, X. A Discussion On Project Transportation Impact Analysis Technique Standard. Planners 2013, 29, 10–14. [Google Scholar]
- Gutiérrez, J.; Cardozo, O.D.; García-Palomares, J.C. Transit ridership forecasting at station level: An approach based on distance-decay weighted regression. J. Transp. Geogr. 2011, 19, 1081–1092. [Google Scholar] [CrossRef]
- Liu, K.; Qiu, P.; Gao, S.; Lu, F.; Jiang, J.; Yin, L. Investigating urban metro stations as cognitive places in cities using points of interest. Cities 2020, 97, 102561. [Google Scholar] [CrossRef]
- GB50180-2018; Ministry of Housing and Urban-Rural Development Announcement. Standard for Urban Residential Area Planning and Design. China Urban Planning and Design Institute: Beijing, China, 2018.
- GB 50157-2013; Code for Design of Metro. Ministry of Housing and Urban-Rural Development of China: Beijing, China, 2013.
- JJ/T141-2010; Technical Standards of Traffic Impact Analysis of Construction Projects. Ministry of Housing and Urban-Rural Development of China: Beijing, China, 2010.
- GB 50137-2011; Code for Classification of Urban Land Use and Planning Standards of Development Land. Ministry of Housing and Urban-Rural Development of China: Beijing, China, 2012.
- Traffic Operation in Xiamen in the First Half of the Year. Available online: https://jt.xm.gov.cn/tzxx/zwdt/202307/t20230724_2775829.htm (accessed on 9 July 2023).
- Qian, T.; Chen, J.; Li, A.; Wang, J.; Shen, D. Evaluating Spatial Accessibility to General Hospitals with Navigation and Social Media Location Data: A Case Study in Nanjing. Int. J. Environ. Res. Public Health 2020, 17, 2752. [Google Scholar] [CrossRef] [PubMed]
- Liu, K.; Liu, R.; Chen, T.; Nie, G. Scale and Accessibility of School System and Its Spatial Differentiation of Elementary Schools in Henan Province. Sci. Geogr. Sin. 2020, 40, 1698–1709. [Google Scholar] [CrossRef]
- Jiang, J.; Wang, Z.; Yong, Z.; He, J.; Yang, Y.; Zhang, Y. Spatial Distribution and Accessibility Analysis of Primary School Facilities in Mega Cities: A Case Study of Chengdu. Sustainability 2024, 16, 723. [Google Scholar] [CrossRef]
- Xiamen, I. Xiamen Software Park Phase 2. Available online: https://www.investxiamen.org.cn/detail/6778.html (accessed on 28 November 2022).
- An, D.; Tong, X.; Liu, K.; Chan, E.H.W. Understanding the impact of built environment on metro ridership using open source in Shanghai. Cities 2019, 93, 177–187. [Google Scholar] [CrossRef]
- Liu, M.; Liu, Y.; Ye, Y. Nonlinear effects of built environment features on metro ridership: An integrated exploration with machine learning considering spatial heterogeneity. Sustain. Cities Soc. 2023, 95, 104613. [Google Scholar] [CrossRef]
- Chan, H.-Y.; Ip, L.-C.; Mansoor, U.; Chen, A. Pedestrian route choice with respect to new lift-only entrances to underground space: Case study of a metro station area in hilly terrain in Hong Kong. Tunn. Undergr. Space Technol. 2022, 129, 104678. [Google Scholar] [CrossRef]


| Method | Basic Principle | Application Scope | Advantages and Limitations | References |
|---|---|---|---|---|
| Space Syntax | Analyzes the geometric and topological relationships of spatial structures to evaluate accessibility and fluidity. | Mainly used to analyze how building interiors or urban-level spatial design affects accessibility. | It analyzes the multi-level impacts of spatial layout on accessibility in depth, primarily focusing on geometric characteristics while neglecting socio-economic factors. | Wu et al. [11], Li et al. [31] |
| The Gravity Model | Based on Newton’s law of gravity, considers the distance decay effect and the service capacity of facilities. | Widely used in geographical research, particularly suitable for evaluating the attractiveness of services and regional accessibility. | It can quantify the distance decay effect and has a wide range of applications, but it mainly relies on the accuracy of assumptions and requires substantial data. | Wu et al. [33], Song et al. [34] |
| The 2SFCA Method | Calculates accessibility in two steps: first, service providers search for demanders within their service area; and, second, demanders search for service providers. | Suitable for evaluating the accessibility of public services such as healthcare and educational institutions. | It balances service supply and demand well, providing a relatively precise accessibility assessment. | Guo et al. [10], Yuan et al. [19], Liu et al. [35] |
| Cumulative Opportunities Model | Based on the number of service facilities that individuals can reach within a certain distance or time frame. | Suitable for evaluating the distribution of public transport facilities within walking distance. | It is simple and intuitive, and easy to understand and implement, but it focuses mainly on quantity rather than quality and ignores the differences in services. | Zhai et al. [38] |
| Spatial Barrier Model | Considers the impact of physical barriers (e.g., rivers and mountains) in geographical space on accessibility. | Suitable for evaluating service accessibility in complex terrain areas. | It quantifies the impeding effect of physical barriers but only considers physical factors and ignores socio-economic factors. | Weng et al. [39] |
| ID | Major Category | Category | Peak Travel Rate | Unit of Calculation | Land-Use Type | Formulae |
|---|---|---|---|---|---|---|
| 1 | Dwelling | Common residential | 2.5 | Person/100 m2 building area | R2, R3 | (1) |
| 2 | Village | 2 | Person/100 m2 building area | R4, H14 | ||
| 3 | Villa | 1.5 | Person/100 m2 building area | R1 | ||
| 4 | Office institutions | Governmental agency | 3 | Person/100 m2 building area | A1, U, A8, H4 | |
| 5 | Scientific research institution | 4 | Person/100 m2 building area | A35, B29 | ||
| 6 | Office | 3.5 | Person/100 m2 building area | B1, B11, B2 | (3) (1) | |
| 7 | Commercial facility | Service nodes | 4 | Person/100 m2 building area | B41, B4, B9 | (1) |
| 8 | Wholesale market | 3.5 | Person/100 m2 building area | B1, B11 | (3) (1) | |
| 9 | Trade market | 7.5 | Person/100 m2 building area | B1, B11 | ||
| 10 | Comprehensive business | 5.5 | Person/100 m2 building area | B1, B11 | ||
| 11 | Hotel | 2 | Person/100 m2 building area | B14, B3, B1, B11 | ||
| 12 | Recreational facility | Park | 0.5 | Person/100 m2 site area | G1, G3, A9, A7 | (2) |
| 13 | Woodland | 0 | Person/100 m2 site area | G2, G22 | (2) | |
| 14 | Waters | 0 | Person/100 m2 site area | E1, E11, E13 | (2) | |
| 15 | Theatre | 5 | Person/100 m2 building area | B3, B31 | (1) | |
| 16 | Stadiums and gymnasiums | 2.7 | Person/100 m2 site area | A4, A41, A42 | (2) | |
| 17 | Library and exhibition hall | 2.8 | Person/100 m2 building area | A2, A21, A22 | (1) | |
| 18 | Hospital | Comprehensive hospital | 8 | Person/100 m2 building area | A5, A51, A52, A53, A59 | (1) |
| 19 | Welfare institutions | 1 | Person/100 m2 building area | A6 | (1) | |
| 20 | School | Elementary and high (school) | 5 | Person/100 m2 building area | A33, A3 | (1) |
| 21 | University | 2 | Person/100 m2 building area | A31 | (1) | |
| 22 | Secondary specialized school | 2 | Person/100 m2 building area | A32, A34 | (1) | |
| 23 | Industry and warehousing | Industry | 1.1 | Person/100 m2 building area | M | (1) |
| 24 | Warehousing | 0.3 | Person/100 m2 building area | W, H23, H2 | (1) | |
| 25 | Traffic facilities | Railway and aviation hubs | 1–2 | 10,000 Person/station | H2 | & |
| 26 | Traffic station | 1.1 | Person/100 m2 building area | S3, S4, S41, S42, S9 | (1) | |
| 27 | Hub port | 0.2–0.4 | 10,000 Person/station | H3 | & | |
| 28 | Buildings over the metro | 2.5 | Person/100 m2 building area | S2 | (1) | |
| 29 | Other non-construction land | 0.1 | Person/100 m2 site area | - | (2) | |
| 30 | Vacant land | 0.1 | Person/100 m2 building area | Vacant land | (1) | |
| Legend |  | |
| Type | The LU stations | |
| Name | Software Park Phase II | Jimei Software Park |
| Example diagram | 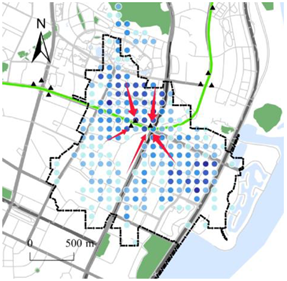 |  |
| Station accessibility | −1.014 | −0.799 |
| Imbalance of entrance/exit | 0.141 | 0.317 |
| Number of entrances/exits | 3/4 | 2/5 |
| Similar feature stations | Haicang Business Center, Talent Center, Guluo | Haicang Bay Park, Cruise Center, Cross-Strait Financial Center, Wuyuan Bay |
| Type | The LB stations | |
| Name | Wushipu | Houpu |
| Example diagram | 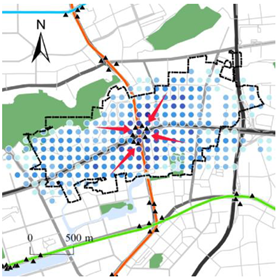 |  |
| Station accessibility | 0.087 | −0.449 |
| Imbalance of entrance/exit | 0.042 | 0.100 |
| Number of entrances/exits | 7/7 | 4/4 |
| Similar feature stations | Xinyang Avenue, Wengjiao Road, Jianye Road, Jiangtou, Xiamen Railway Station | Luozhen Road, Xinglin Village, Xingjin Road, Lingdou, Hecuo, Wetland Park, Huli Park, Huarong Road, Huli Innovation Park |
| Type | The HU stations | |
| Name | Haicang Administrative Center | Sport Center |
| Example diagram | 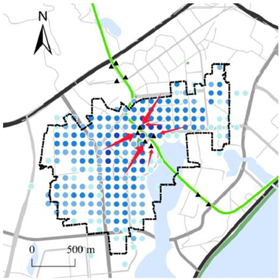 | 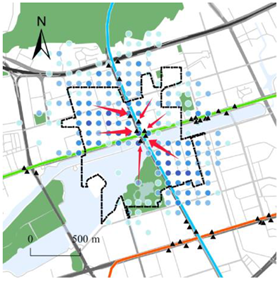 |
| Station accessibility | 0.406 | 1.655 |
| Imbalance of entrance/exit | 0.145 | 0.145 |
| Number of entrances/exits | 5/5 | 6/6 |
| Similar feature stations | Yuxiu East Road, Garden Expo Park | |
| Type | The HB stations | |
| Name | Lu Cuo | Guanren |
| Example diagram | 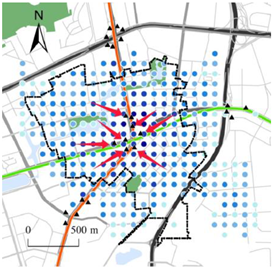 |  |
| Station accessibility | 0.272 | 0.374 |
| Imbalance of entrance/exit | 0.084 | 0.069 |
| Number of entrances/exits | 8/9 | 4/6 |
| Similar feature stations | Hubin East Road, Lianban, Torch Garden, Jimei Avenue, Maqing Road | |
Disclaimer/Publisher’s Note: The statements, opinions and data contained in all publications are solely those of the individual author(s) and contributor(s) and not of MDPI and/or the editor(s). MDPI and/or the editor(s) disclaim responsibility for any injury to people or property resulting from any ideas, methods, instructions or products referred to in the content. |
© 2024 by the authors. Licensee MDPI, Basel, Switzerland. This article is an open access article distributed under the terms and conditions of the Creative Commons Attribution (CC BY) license (https://creativecommons.org/licenses/by/4.0/).
Share and Cite
Yan, C.; Gao, Y.; Yang, Y. Exploring the Spatial Patterns of Accessibility to Metro Services Considering the Locations of Station Entrances/Exits. Buildings 2024, 14, 3532. https://doi.org/10.3390/buildings14113532
Yan C, Gao Y, Yang Y. Exploring the Spatial Patterns of Accessibility to Metro Services Considering the Locations of Station Entrances/Exits. Buildings. 2024; 14(11):3532. https://doi.org/10.3390/buildings14113532
Chicago/Turabian StyleYan, Congxiao, Yueer Gao, and Yifu Yang. 2024. "Exploring the Spatial Patterns of Accessibility to Metro Services Considering the Locations of Station Entrances/Exits" Buildings 14, no. 11: 3532. https://doi.org/10.3390/buildings14113532
APA StyleYan, C., Gao, Y., & Yang, Y. (2024). Exploring the Spatial Patterns of Accessibility to Metro Services Considering the Locations of Station Entrances/Exits. Buildings, 14(11), 3532. https://doi.org/10.3390/buildings14113532