Abstract
Due to its advantages, Building Information Modeling (BIM) technology has been widely accepted and developed globally. BIM is transforming traditional construction methods and enabling the resolution of issues such as labor shortages, overwork, and rising costs, which the Japanese construction industry faces. In Japan, there is an active push to promote the application of BIM technology; however, its widespread adoption is encountering numerous challenges and barriers. Although BIM technology has been applied and developed globally, there is still a lack of systematic analysis on the specific challenges and strategies of its implementation in the Japanese construction industry. This study reviews the literature on the application of BIM worldwide and surveys stakeholders in the Japanese construction industry, examining strengths, weaknesses, opportunities, and threats. By integrating Analytic Hierarchy Process (AHP) and SWOT analysis, this research prioritizes these factors, assesses their impact on the diffusion of BIM technology, and provides in-depth analysis and insights for the promotion and development of BIM technology in Japan.
1. Introduction
Japan is facing a critical labor shortage due to an aging population, a situation that severely impacts the construction industry. According to data released by the Ministry of Land, Infrastructure, Transport and Tourism (MLIT) in 2021, approximately 36% of construction workers are over the age of 55, while only 12% are under 29. This trend has been persistent for decades, and there seems to be no immediate solution to alter this situation [1]. In addition to new constructions, maintaining infrastructure built during the high-growth period has also become a challenge [2], as these structures are nearing the end of their service life. Moreover, frequent natural disasters such as earthquakes, heavy rain, and volcanic activity further challenge the Japanese construction industry [3]. Beyond the shortage of labor, under the backdrop of rising construction costs and labor reforms, improving the execution efficiency of construction projects has become an urgent issue for the industry.
Building Information Modeling (BIM) technology has undergone nearly half a century of development in the Architecture, Engineering, and Construction industry, evolving from its nascent stage to mature applications. BIM is recognized as an effective measure for addressing the Architecture, Engineering & Construction (AEC) industry’s challenges, such as low efficiency, high error rates, and budget and time overruns [4,5]. The United States, the United Kingdom, and Australia, as advanced BIM adopters, demonstrate that vibrant and widespread adoption of BIM requires government involvement [6]. In Japan, apart from the BIM technology used in the construction industry, BIM for social infrastructure development is termed Construction Information Modeling (CIM). Since 2009, the MLIT has been promoting the use and dissemination of BIM and CIM [7,8]. The Japanese construction industry hopes that BIM can address issues such as labor shortages due to an aging population. Despite the spread of BIM in recent years, progress in BIM implementation in Japan has been slow [9]. Surveys indicate challenges such as increased workload due to BIM usage, low return on investment, and difficulties in advancing BIM initiatives promoted by the MLIT. Factors such as implementation, workforce training, technical uncertainties, costs, and time constraints pose significant barriers for small- and medium-sized enterprises. The traditionally conservative nature of Japan’s construction industry also impedes recent progress.
Due to the technical advantages of BIM, its global acceptance, and the various issues encountered in promoting BIM in Japan, the authors of this paper decided to conduct a survey targeting the Japanese construction industry to analyze the current state of BIM in Japan. Using a SWOT analysis to identify the main factors in Japan’s BIM industry, this study also integrates the Analytic Hierarchy Process (AHP) to assess the relative weights of these factors, providing a quantitative analysis to evaluate the current state of BIM in Japan and offer strategic development recommendations.
Following this introduction, the remainder of the paper is organized as follows: Section 2 provides a detailed literature review summarizing related prior research and the state of research on barriers to BIM application. Section 3 describes the methods used in this study, including the analytical framework and survey design. The results are detailed in Section 4. Section 5 provides a discussion of the results and recommendations. The conclusions are presented in Section 6.
2. Literature Review
2.1. SWOT Analysis
Since its inception in the early 1980s, SWOT analysis has gradually matured. It studies the internal strengths and weaknesses of an organization and emphasizes the opportunities and threats presented by the environment in which the organization operates [10]. This holistic qualitative analysis is a valuable tool for strategic planning. By systematically matching strengths with opportunities (SO), weaknesses with opportunities (WO), strengths with threats (ST), and weaknesses with threats (WT), the analysis yields appropriate and rational development strategies.
SWOT analysis has been widely used in various disciplines to investigate issues from a strategic perspective, including in the construction industry and BIM research. For example, Fernández-Mora’s discussion through the SWOT system revealed different trends, weaknesses, and further opportunities in the BIM research field [11]. Zima conducted a SWOT analysis of the BIM industry in Poland and made recommendations [12]. Tekin summarized a BIM modeling roadmap for the Turkish construction industry after a BIM analysis [13]. Additionally, researchers from multiple countries have conducted SWOT analyses on BIM-related aspects in their countries and made certain recommendations [14,15]. However, Japan currently lacks a SWOT analysis specifically addressing BIM, indicating a gap in the strategic exploration of BIM implementation within the Japanese context.
2.2. AHP
The Analytic Hierarchy Process (AHP) is an analytical method used for quantitatively modeling complex problems. This method combines qualitative and quantitative analyses by initially decomposing the problem to be analyzed into multiple criteria and sub-criteria based on logical relationships. By determining the weights of these criteria across different levels and computing pairwise comparison matrices, AHP facilitates the determination of the overall weights for different decision alternatives, ultimately leading to the optimal solution for the target problem [16].
In the construction industry, AHP has been employed to prioritize unresolved challenges [17]. It is also utilized in analyses of construction safety management [18], helping to systematically evaluate various factors that influence safety and decision-making in construction projects. This structured approach allows stakeholders to make more informed and effective decisions by quantifying the relative weights of each factor involved in the construction process.
2.3. SWOT-AHP
SWOT analysis provides fundamental and relevant strategies; however, its capability to assess the importance of each factor is limited, and it does not facilitate quantitative analysis for priority ranking. When combined with the Analytic Hierarchy Process (AHP), however, it becomes possible to quantitatively estimate the importance of each factor in decision-making [19], thereby maximizing the strengths of both analytical methods. SWOT-AHP technology has been widely applied across various sectors in numerous countries and regions globally, demonstrating its extensive utility as a decision support tool. This methodology has been instrumental in identifying key stakeholders involved in decision-making processes and in effectively categorizing the essential factors influencing decisions.
In the manufacturing sector, researchers have identified key company factors through this method [20]. In the aerospace industry, the technique has assisted in pinpointing crucial technological innovations and strategic deployments [21]. The agricultural sector has also seen the application of SWOT-AHP in sustainable development practices to provide insights into its progression [22]. In the construction industry, SWOT-AHP has been used for strategic supply chain management of assembly enterprises, enhancing the accuracy of decision-making [23]. Furthermore, the method has been applied to evaluate the operation strategies of BIM technology in public investment projects, aiding policymakers and project managers in making more scientific decisions [24]. The aforementioned content is summarized in Table 1.

Table 1.
Summary of previous studies using the SWOT-AHP method.
Most of the existing applications of SWOT-AHP involve a two-level analysis, without exploring the relationships between different levels extensively. This study proposes a three-tiered SWOT-AHP analysis that involves various aspects of BIM in Japan, providing a more detailed consideration of each influencing factor to reach conclusive strategies. This multi-level approach allows for a more nuanced and comprehensive analysis, thereby enhancing the effectiveness of strategic planning and decision-making in the context of BIM implementation.
2.4. BIM Technology
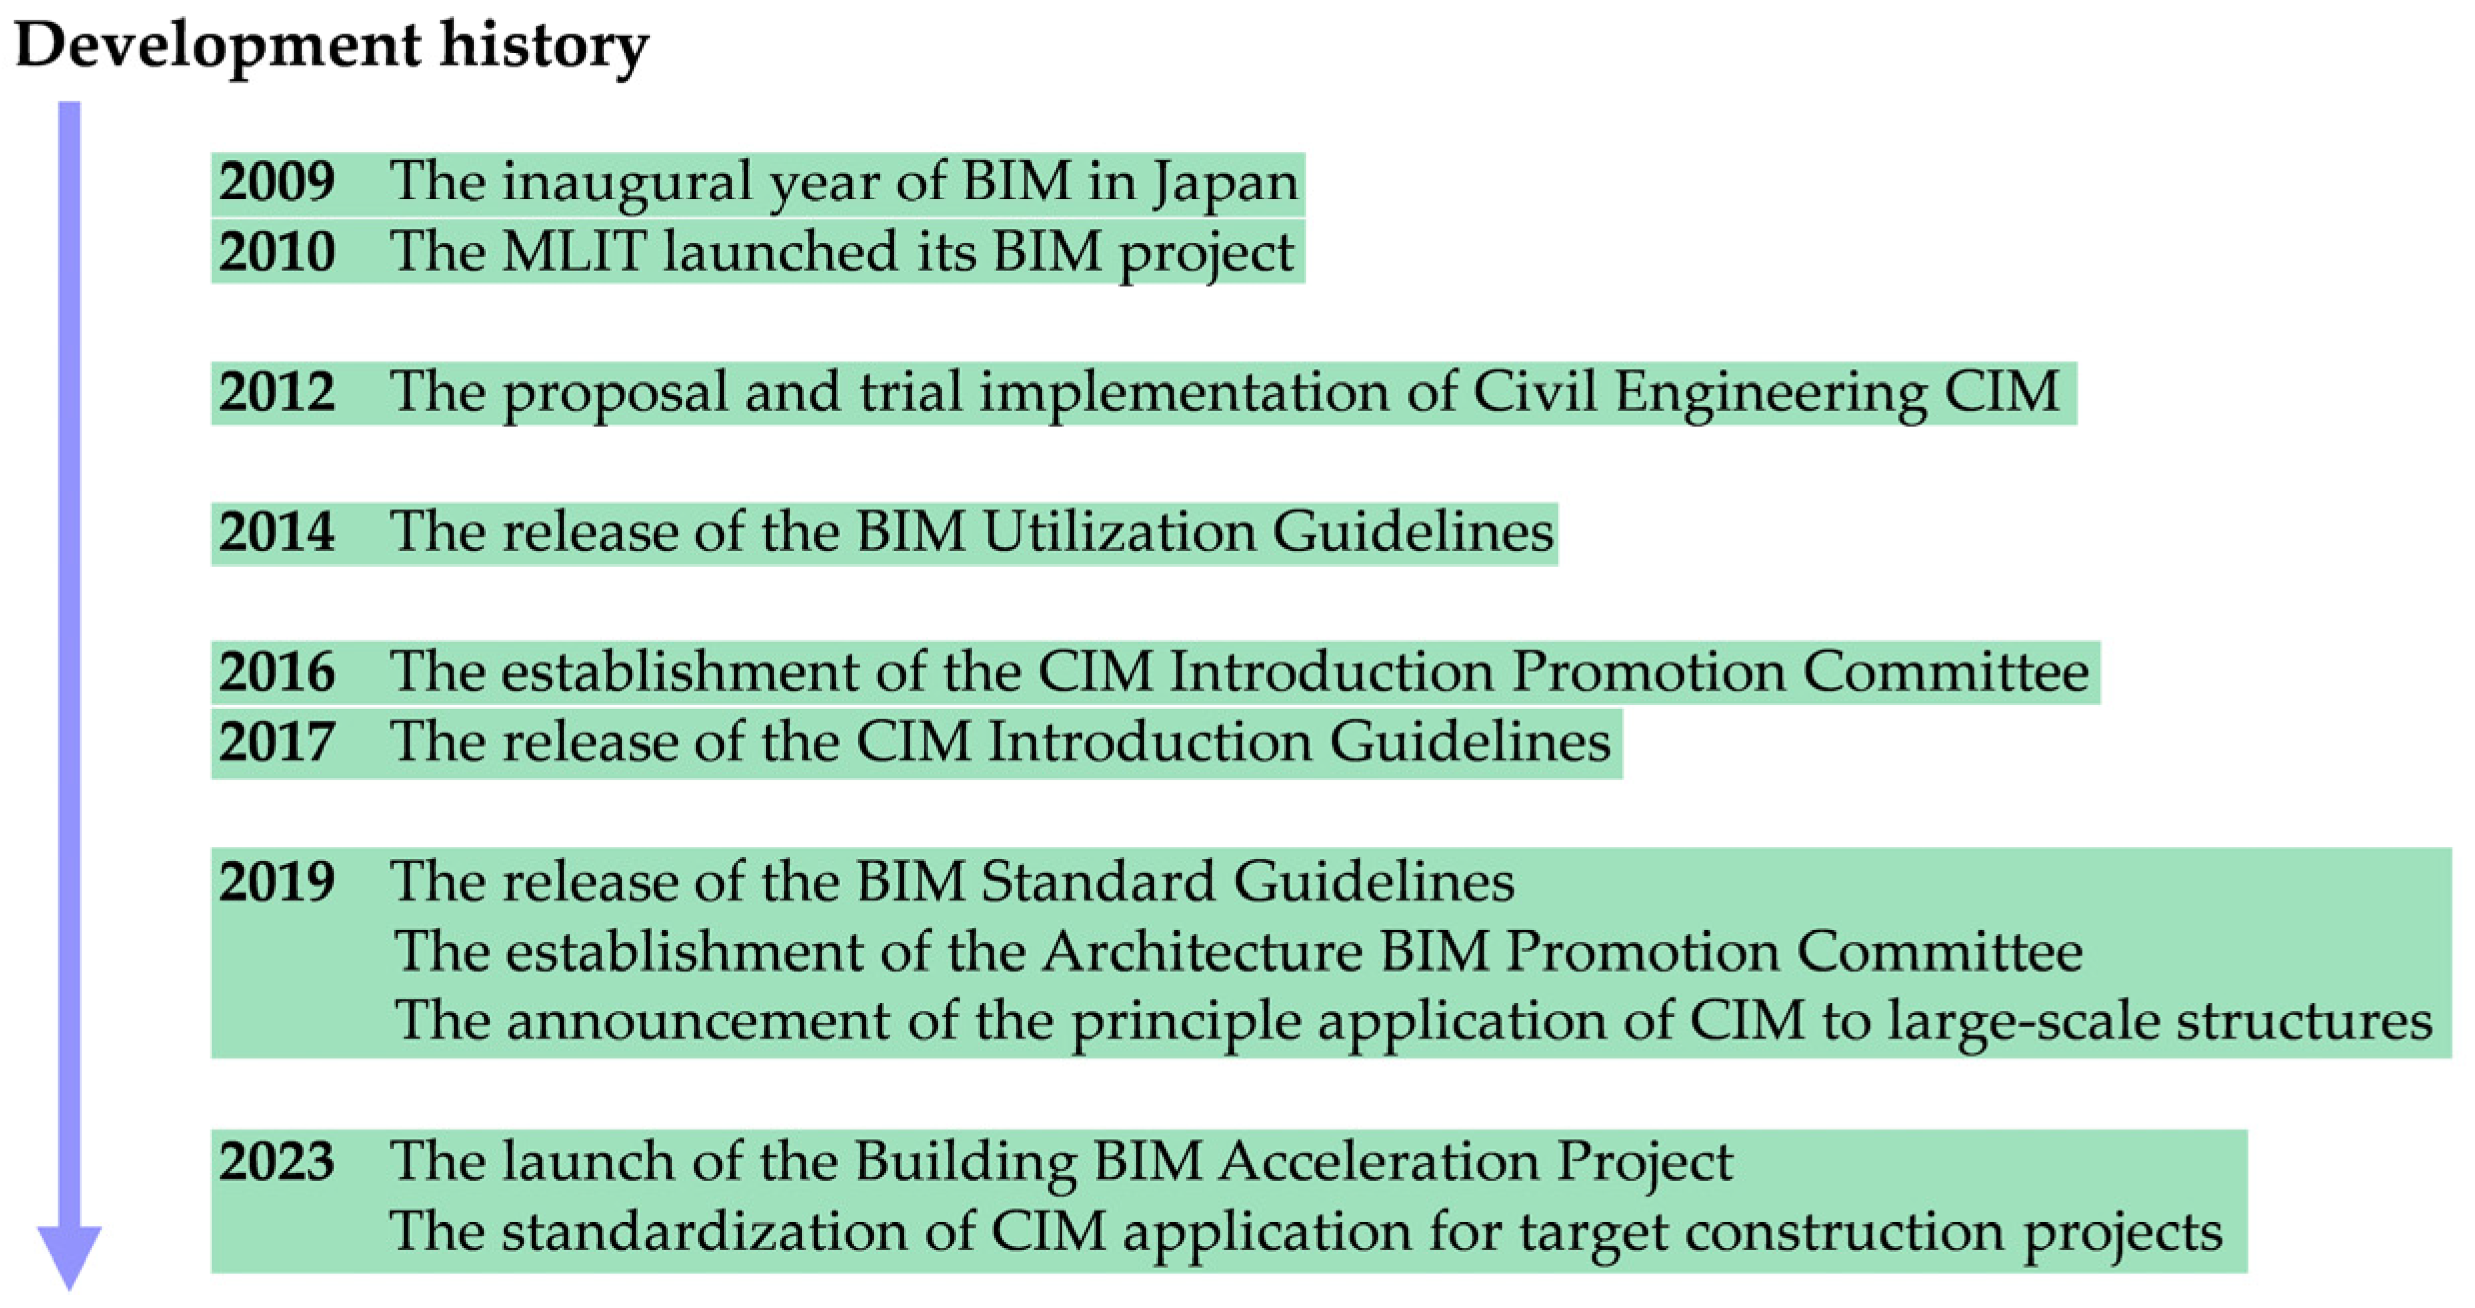
The development of BIM in Japan is shown in Figure 1. Since its introduction in 2009, the development of BIM technology in Japan has significantly accelerated in recent years. Under the promotion of the MLIT, some corresponding standards and reference materials have also been issued. After more than a decade of development, various organizations in the construction industry now have a certain level of understanding of BIM technology, particularly among large enterprises, some of which have implemented BIM deeply. However, some issues still arise during its development. To ensure the rigor and reliability of our research, we collected and reviewed a vast array of both domestic and international research literature and materials. We selected representative documents and gathered information on the advantages and disadvantages of BIM applications, opportunities for development within the industry or society, and recorded the obstacles as follows.
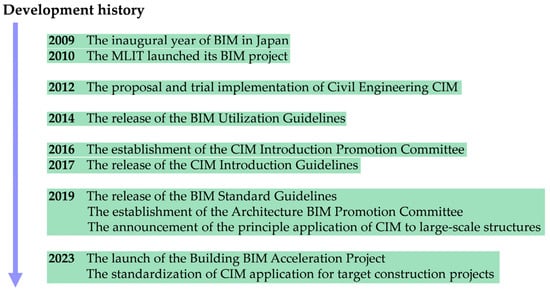
Figure 1.
Development of BIM in Japan.
2.4.1. Strengths
Rational Decision-Making: Utilizing BIM technology allows for the digital management of the entire process—from surveying and design to construction and post-operation management—enabling preemptive discussions and analyses. This enhances the rational progression of the entire project. Moreover, the inherent 3D visualization capabilities of BIM technology provide an intuitive impression and facilitate accurate judgments [25,26].
Streamlined Design: By utilizing BIM technology, after modeling, most software supports the automatic calculation of work quantities and required material amounts. Unlike traditional methods, BIM technology automatically performs interference checks for elements such as rebar and piping, reducing errors and enhancing design efficiency [27,28].
Advanced Construction Management: During construction and post-operation processes, unexpected issues in the design process always arise. Thus, one of the advantages of BIM technology is the ability to discuss construction and operational processes in advance. Furthermore, it is possible to record each construction data point in real time during the construction process and reflect and update this on the 3D model. This enables the measurement and verification of construction results using technologies such as a point cloud [29,30,31].
Integrated Information Management: Construction projects typically require essential communication among clients, designers, contractors, and users. Operating BIM technology enables better comprehension of the construction progress and costs; promotes communication among stakeholders; and facilitates the tracking of design, construction, and post-completion operational data [32,33,34].
2.4.2. Weaknesses
Cost Issues: Not only in Japan but also in other countries, the related costs of BIM-related software, which includes many features, are higher than those of traditional software. Additionally, the wages for employees involved in BIM are high, and the cost of personnel training is also considerable, which restricts the development of BIM [35,36].
Software Quality Issues: Currently, the main common format for BIM-related software is the IFC format, but there are unresolved issues with conversion and compatibility between different software. The development of systems for exchanging and utilizing three-dimensional data is ongoing, and many practitioners struggle with data loss during file conversion [35,37].
Time Requirement Issues: The rapid updates of BIM software and the variety of software types confuse employees in Japan’s construction industry, which has an older demographic. Furthermore, while efficiency improvements were anticipated with complex BIM software and tools and the time-consuming BIM process, data conversion losses and frequent design changes due to various modifications are noted to potentially require even more time [38,39].
Project Management Efficiency Issues: Typically, BIM technology enhances coordination among contractors, but some researchers have raised issues regarding cooperation and communication problems, and the unclear definition of roles and responsibilities [40]. There are also issues with the loss of crucial maintenance data, incorrect feedback to the 3D/BIM models, and the need for effective long-term data updates [41].
2.4.3. Opportunity
Government and MLIT Promotion: As previously mentioned, Japanese government agencies are actively promoting the development of BIM technology. The construction industry in Japan faces several challenges, including a shortage of skilled labor, supply chain issues for materials, low barriers to entry, and stagnation in production efficiency. To address these issues, standardization and comprehensive optimization (for example, standardization of concrete work) have been positioned as top priorities in the i-Construction strategy. He [42] discusses the advantages of standardization and industrialization in construction. The application of BIM technology has improved the efficiency of the construction industry and has been useful in assessing the sustainability of green buildings. It has also enhanced the efficiency in the precast sector [23,43]. Japanese agencies also support these industrial upgrades.
Development of Society and the Construction Industry: Under the promotion of the government and the MLIT, numerous software developers have emerged. Additionally, private companies are actively promoting BIM technology. According to survey results from 2020–2021 [44,45], related industries in Japan have made significant progress.
Global Development of BIM Technology: The BIM industry worldwide has been rapidly developing in recent years, and research related to BIM has increased. This has enabled many projects to learn from related projects in other countries [46,47].
An Excellent Environment for Construction Industry DX (Digital Transformation): An unavoidable external factor is the improvement in computer performance. Companies like Autodesk, as well as Japanese domestic software developers, are intensifying their development of BIM-related software [48,49]. Additionally, modern university education places are increasing the emphasis on digitalization, and new-era construction workers possess relatively strong data processing capabilities.
2.4.4. Threats
Awareness Issues Among Construction Industry Workers: The AEC industry is traditional, and its sensitivity to new technologies is inferior compared to other industries, such as manufacturing. Without support from senior officials or customer demands, there is considerable resistance to industry transformation. Awareness and understanding of BIM, its benefits, and the return on investment in BIM are limited, creating barriers to cooperation across various sectors. These issues need to be resolved through various means [50,51,52].
Problems with Standard Specifications: Some studies indicate that the lack of government support, regulations, and incentive measures, as well as insufficient BIM standards, pose significant threats to the industry’s development [53]. Japan also faces inevitable challenges in the development process of BIM. Some clients still demand the use of traditional drawings based on 2D CAD, which also poses an external threat to the development of BIM [54,55].
Current Issues in the Construction Industry: In the current context, the costs associated with BIM are generally high, and the high costs of implementation and subsequent development are prohibitive for small- and medium-sized enterprises. Without cooperation with external processes, the use of BIM does not lead to improvements in work processes [56,57]. Inappropriate use may increase the time used for changes at the late stage due to external environmental impacts.
Problems with Talent Supply: University students are a vital source for future engineers. Along with the promotion of BIM, delays in related university education become problematic [58]. Although this topic is actively discussed in Japan, there are constraints such as Japan Accreditation Board for Engineering Education (JABEE) accreditation and the number of classes. Additionally, the development of BIM talent within companies faces long training times due to a steep learning curve. These two aspects are the main issues in talent supply [54].
3. Methods
3.1. Research Procedures and Methods
This study gained insights from relevant BIM research (described in Section 2.4) and reports related to BIM in Japan. Additionally, preliminary interviews were conducted with experienced professionals, including BIM educators, employees of architectural consulting firms who deal with BIM on a daily basis, employees of general contractors, and heads of architectural design firms. Based on this, the hierarchical structure of the SWOT-AHP model was constructed. The purpose of this study is to strengthen the strengths and overcome the limitations of Japan’s BIM industry, proposing strategies to accelerate its development. It considers the opinions of construction industry workers as a whole through surveys on various companies in Japan’s construction industry and proposes strategies based on internal and external factors.
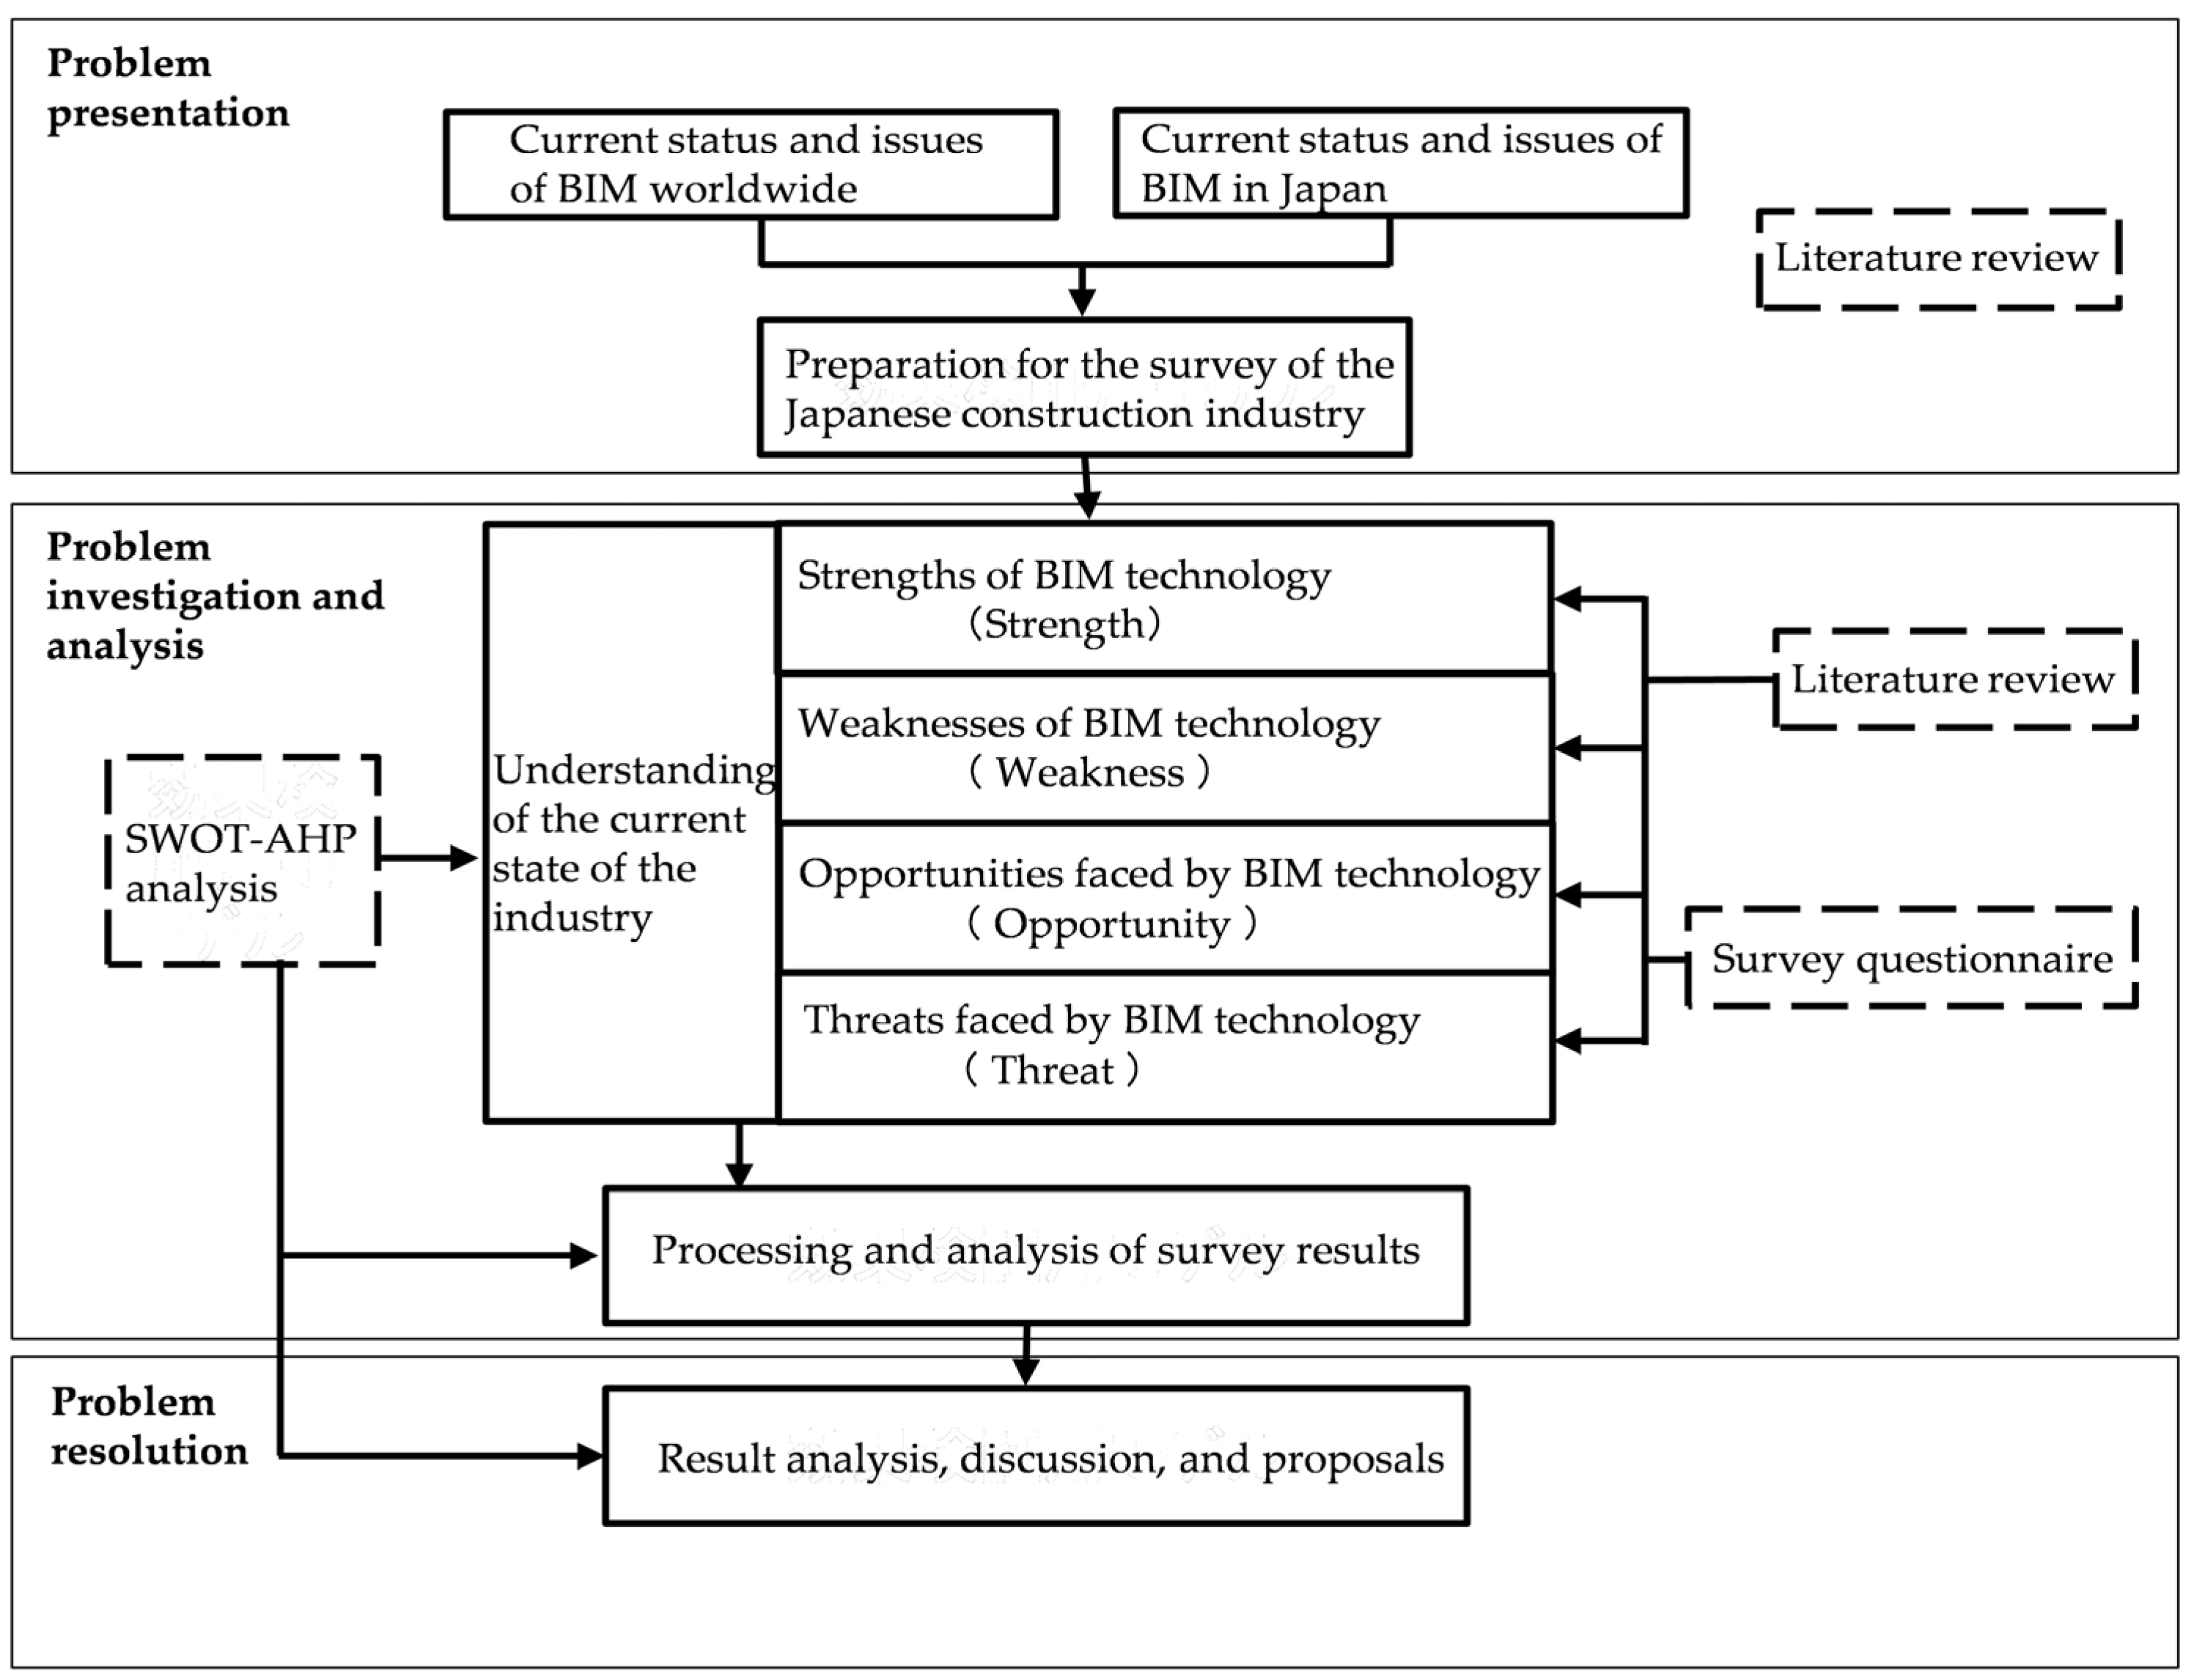
Figure 2 illustrates the research process. First, related research on BIM, both domestic and international, is analyzed to establish the SWOT-AHP analysis model and SWOT factors. Based on this, a survey is designed and conducted. The results are then used to perform AHP analysis to measure the relative weights of each item, and SWOT strategies are derived using the survey results. The final results are presented in Section 4.
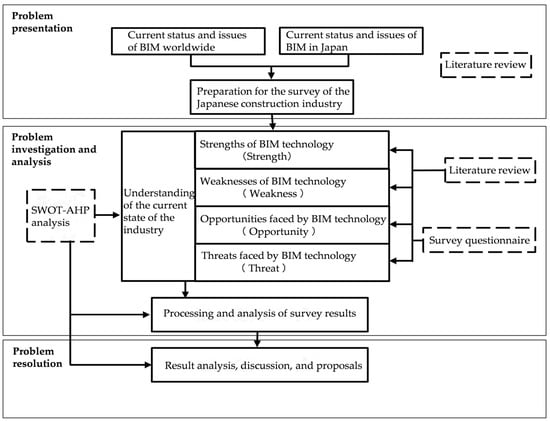
Figure 2.
Research flowchart.
3.2. Hierarchy Configuration
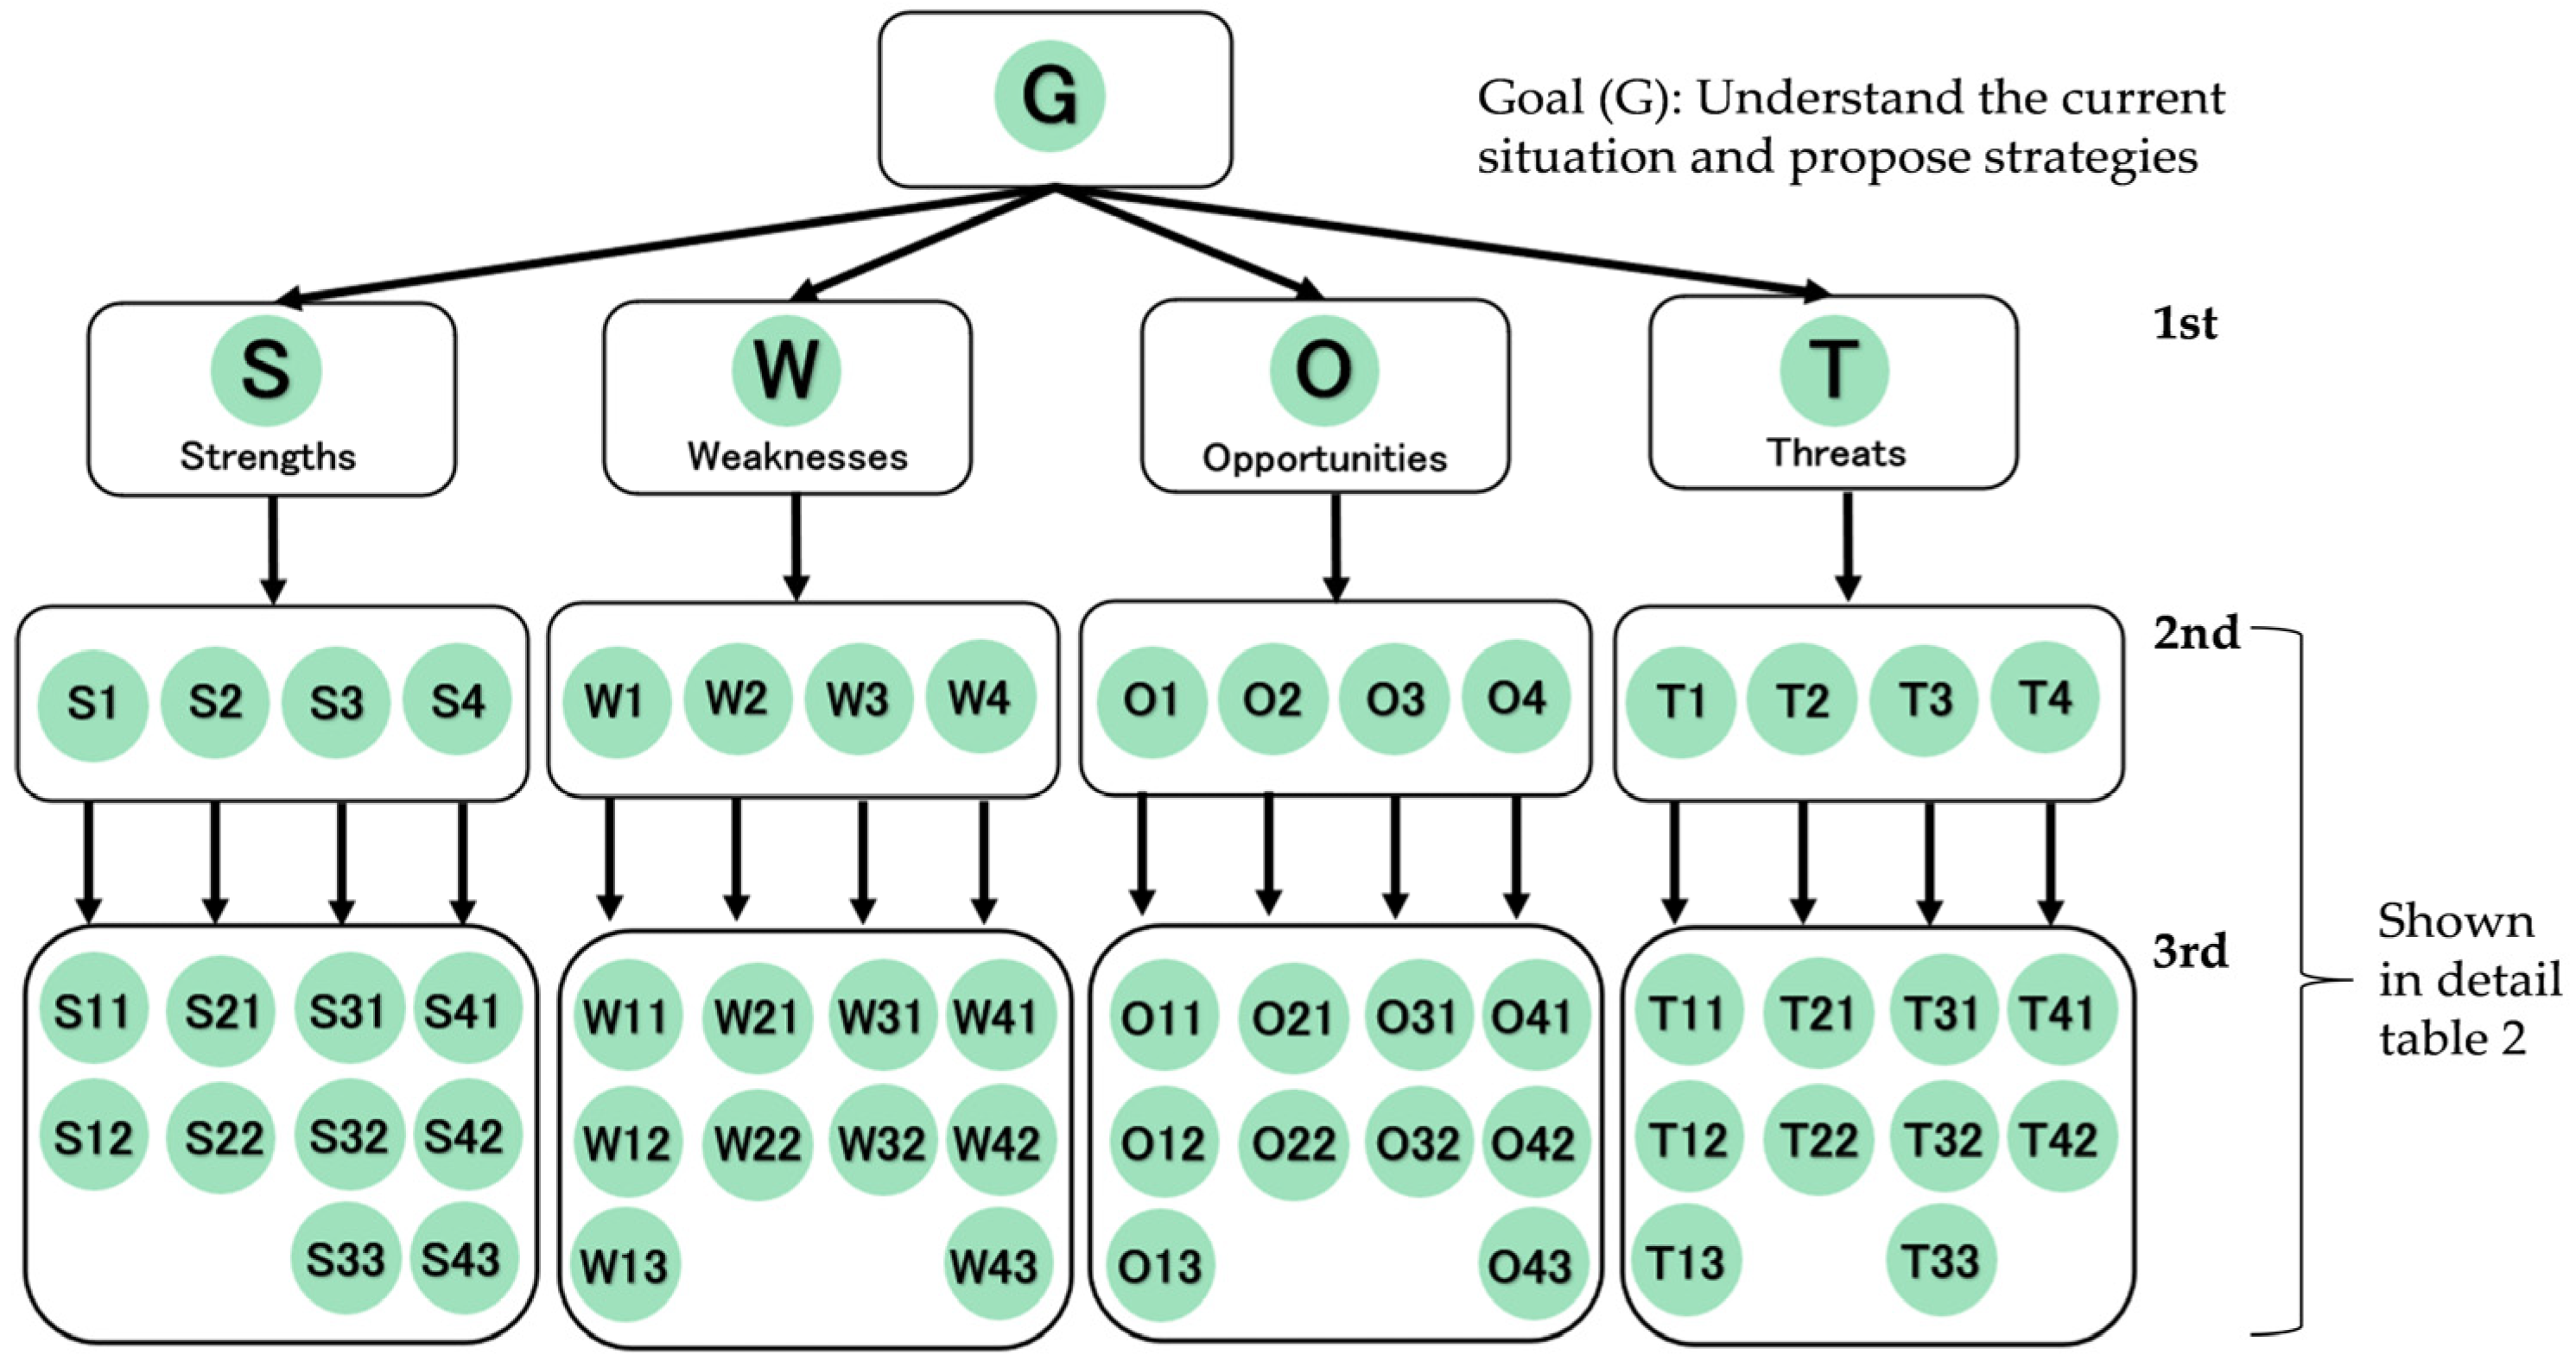
Based on the results of the literature review described in Section 2 and considering the current real-world context and outcomes from expert interviews, the hierarchical structure of SWOT-AHP was designed. As shown in Figure 3, it includes three levels. Specific items are presented in Table 2.
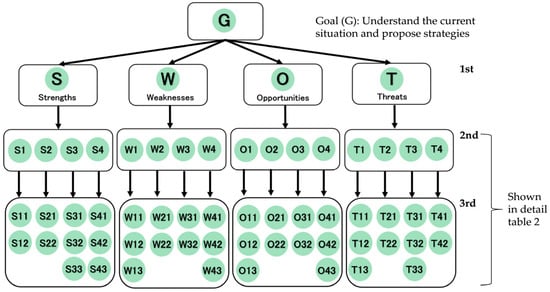
Figure 3.
SWOT-AHP hierarchical structure.
Table 2.
Details of BIM-related influencing factors.
3.3. Conducting a Survey
To assess the status of BIM in the Japanese construction industry, a questionnaire was developed, which included 6 demographic questions (age, years of experience, company type, industry, total employees, and BIM department size) and 56 core questions based on the content above. These questions, using a five-point Likert scale, evaluated the second-level and third-level indicators listed in Table 2 to gauge respondents’ awareness and perceptions of BIM implementation. This study relies on responses from employees who are proficient in BIM and IT or those who are part of a BIM and IT promotion department, and the survey link is sent to them. The survey targeted 700 Japanese construction companies, including general contractors, construction consultants, and architectural firms. The response period was scheduled from early April to the end of June 2024.
3.4. SWOT-AHP Analysis Method
Step 1. Based on Table 3, assignments are made, and the number and proportion of respondents for each option are statistically analyzed. Furthermore, using Equation (1), the average score (X) for each individual indicator is calculated using the geometric mean.
Table 3.
Development strategy indicator allocation table.
Step 2. Using Equations (2)–(4), calculate the judgment matrices () or the secondary and tertiary indicators and determine the relative weights () of each indicator. Then, using Equation (5), consider the impact of the factors between the secondary and tertiary indicators and compute the overall relative weights ().
Step 3. To ensure the accuracy of the AHP analysis, the consistency ratio (CR) of the pairwise comparison survey should be less than 0.1. Therefore, prove consistency in Step 2. The consistency verification process is as follows: Calculate the consistency index (CI) for each matrix using Equations (6)–(8). Refer to the average random index (RI) values from Table 4.
Table 4.
Average random index (RI).
Even after conducting consistency checks at individual levels, the accumulation of errors may lead to inconsistencies in the overall judgment matrix. Therefore, it is necessary to perform a random consistency check on the total relative weights value matrix, which is the result of Step 3, using Equation (9). This process evaluates the overall consistency of the matrix and ensures the reliability of the decision-making process.
Step 4: Based on the calculation results, rank the importance and identify the key indicators.
Step 5: To conduct a sensitivity analysis, the weights of key indicators were adjusted up and down by 10% to assess their impact on the overall SWOT score.
Step 6: Evaluate the strategic positioning and develop and propose strategies for BIM development.
4. Results
4.1. Basic Attributes of the Respondents
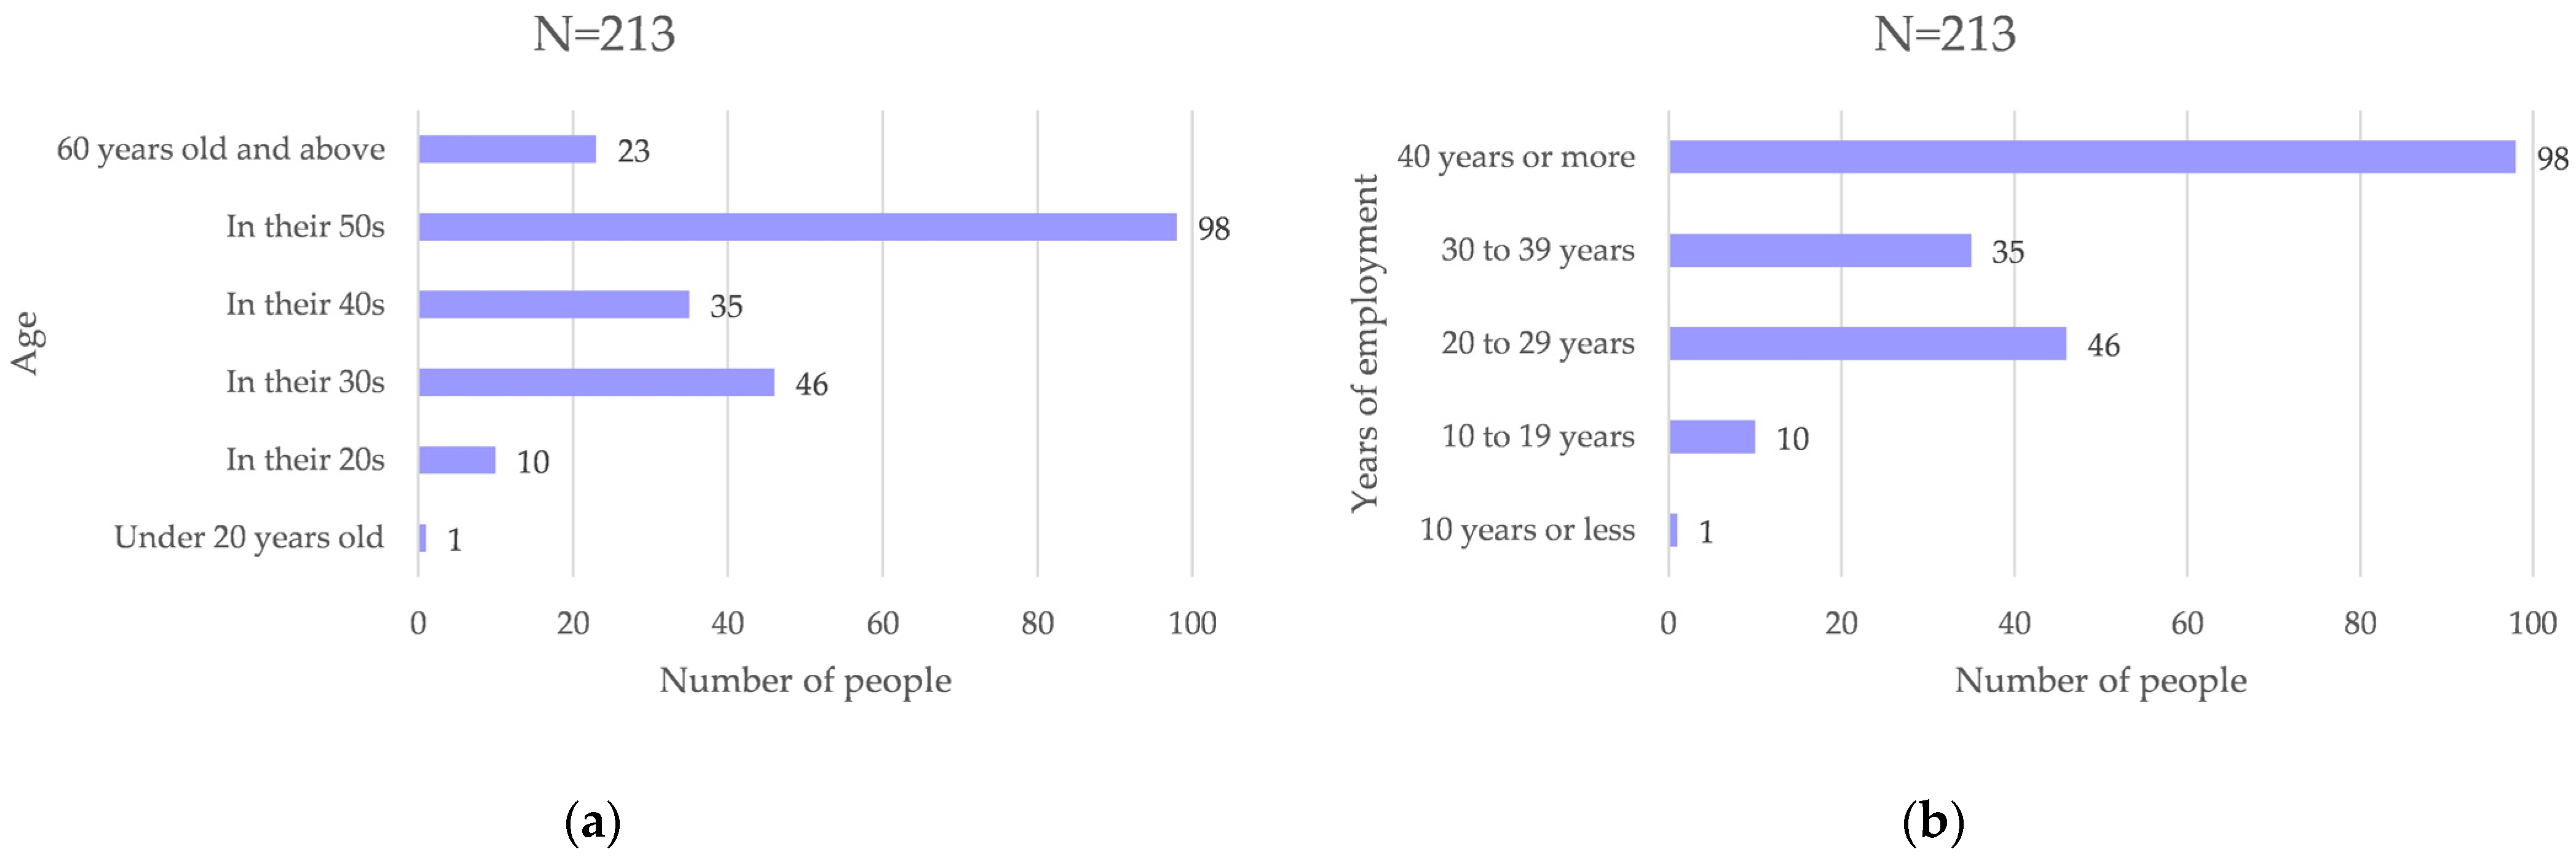
This survey collected 213 effective responses, resulting in a response rate of 30.4%. The breakdown of respondents is as follows: 198 males (93%) and 15 females (7%). As shown in Figure 4, the ages and years of service of the respondents indicate that heads of BIM departments are generally older, with more than half over the age of 50, and have extensive experience in the construction industry.
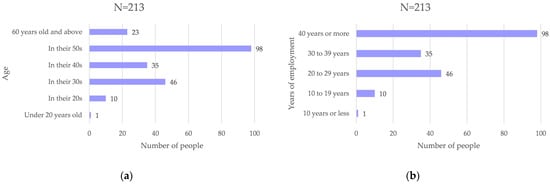
Figure 4.
(a) Respondent age distribution. (b) Respondent years of employment distribution.
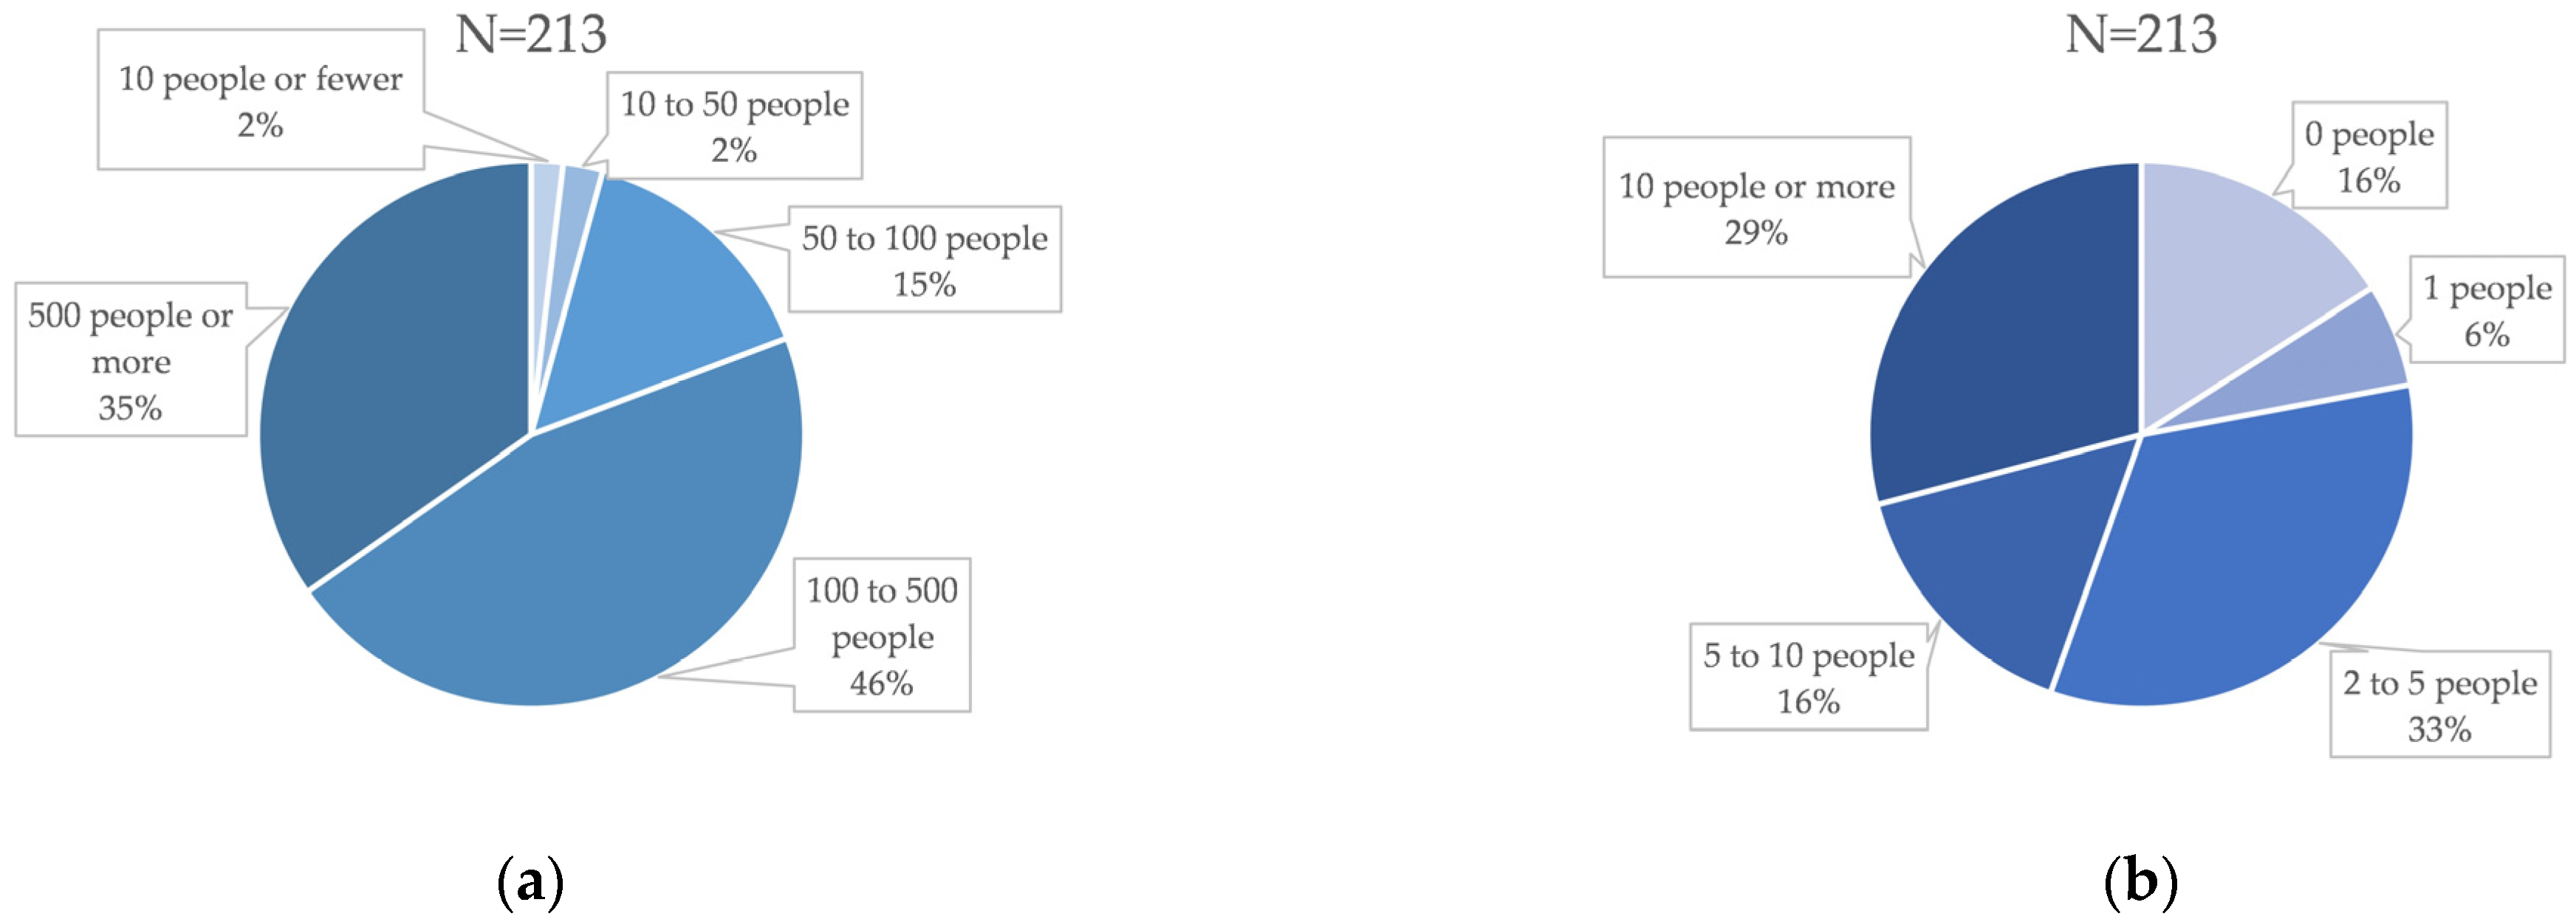
Figure 5 describes the distribution of types of companies surveyed and the distribution of respondents’ professions. Construction consultants related to design constitute the largest group, accounting for 57%, and the most common industry among respondents is building construction. This suggests that the operation of BIM requires a certain level of on-site knowledge. Finally, Figure 6 shows the number of employees in the respondents’ companies and the number of staff in the BIM departments. Since the survey targets are companies ranked high in sales revenue, most have more than 100 employees. While most companies have BIM departments of varying sizes, it was also found that 16% of companies have not yet established a BIM-related department.
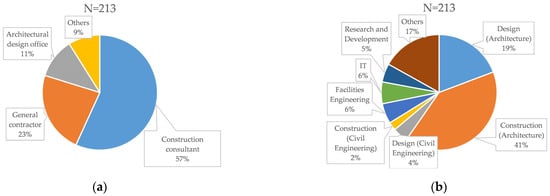
Figure 5.
(a) Respondent company type. (b) Respondent industry type.
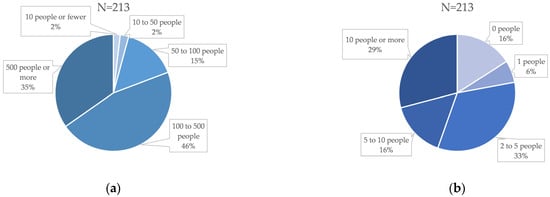
Figure 6.
(a) Respondent company’s number of employees. (b) Respondent company’s BIM department employee count.
4.2. SWOT-AHP Analysis Results
4.2.1. Calculation of the Average Score
Assign values to the options for secondary and tertiary indicators based on the survey results, and statistically analyze the number of respondents for each option and their proportions (as shown in Appendix A). Finally, calculate the geometric mean to determine the average score for each individual indicator (as shown in Table 5 and Table 6), which will be used as the raw values for the indicators. These values are then utilized as the original data for the AHP.
Table 5.
Average score of each individual indicator (2nd).
Table 6.
Average score of each individual indicator (3rd).
4.2.2. Derivation of Importance
By using the average scores of the aforementioned indicators, the relative weights of the secondary and tertiary indicators are calculated through their respective judgment matrices (). Finally, the overall relative weights () of each element of SWOT: Strengths (S), Weaknesses (W), Opportunities (O), and Threats (T) is calculated. The results of this process are presented in Table 7, Table 8, Table 9 and Table 10.
Table 7.
Relative weights of the strengths and overall relative weights.
Table 8.
Relative weights of the weaknesses and overall relative weights.
Table 9.
Relative weights of the opportunities and overall relative weights.
Table 10.
Relative weights of the threats and overall relative weights.
4.2.3. Consistency Verification
In this AHP analysis, the second-level indicators are represented in a 4 × 4 matrix with an RI value of 0.89, while the third-level indicators are in a 3 × 3 matrix with an RI value of 0.58. The calculations for the Consistency Ratio (CR) at each level and the overall Consistency Ratio () are both below 0.1. Therefore, the evaluations within this study are consistent, confirming the validity of the analysis results.
4.2.4. Identification of Key Indicators
As mentioned above, the importance rankings of the four indicators: Strengths, Weaknesses, Opportunities, and Threats were established, employing Pareto’s Principle in the analysis. Pareto’s 80/20 rule suggests that approximately 80% of effects arise from 20% of causes. This principle has been proven effective and useful in the civil construction industry [59,60]. Consequently, the top two indicators were selected as the most critical. The key indicators influencing Japan’s BIM industry are as follows:
Strengths: Accurate decision-making through 3D visualization (S12) and rational project planning through overall informatization (S11). Three-dimensional visualization technology provides a more accurate and intuitive preview of projects, aiding decision-makers in making wiser judgments. Overall informatization enhances transparency and coordination in project management, which is particularly vital in architectural and engineering projects, aiming to reduce errors and misunderstandings and improve efficiency in Japan’s construction industry.
Weaknesses: BIM design takes longer than the existing methods (W31) and inadequate construction and utilization system for 3D data (W22). The initial setup and modeling process may take longer than traditional methods. Additionally, delays in data circulation may lead to information isolation within projects, affecting decision-making efficiency and effectiveness. These are two challenges that must be addressed to promote BIM in Japan.
Opportunities: Rapid development of new technologies related to BIM worldwide (O31) and the active promotion of BIM centers by local governments and private companies (O22). Global technological advancements provide new tools and methods for utilizing BIM, while active participation from local governments and corporations offers a broader platform and resources for the dissemination and application of BIM. These represent favorable external opportunities for the development of BIM in Japan.
Threats: Lack of unified BIM construction standards (T22) and the absence of legal regulations related to BIM (T21). The lack of standards can cause compatibility issues within the industry and potentially hinder the adoption of BIM technology. Unlike other standards that have developed over many years in the construction industry, the ongoing incompleteness of BIM-related standards could lead to legally ambiguous projects, which could increase the obstacles to development.
4.2.5. Sensitivity Analysis
Table 11 displays the process and results of the sensitivity analysis.
Table 11.
Sensitivity Analysis Process and Results.
The primary purpose of sensitivity analysis is to assess the stability of the model under different scenarios by adjusting the weights of key indicators up and down. This analysis helps identify which factors have a significant impact on the overall evaluation of BIM technology applications, thereby verifying the robustness of the model results and providing data support for future strategic recommendations. Based on the results of the SWOT-AHP analysis, the weights of key indicators are adjusted by ±10% to assess their impact on the overall SWOT score.
The sensitivity analysis results indicate that the Scores category shows the most significant variation, followed by the Threats category. S12 (enhancement of communication and understanding through 3D visualization) contributes the most to the overall score. The results emphasize the critical roles of the Strengths and Threats categories, particularly the advantages of 3D visualization in enhancing communication and the external threats posed by the lack of regulations. These should be focal points in the practical advancement of BIM development.
4.3. Results Analysis and Strategy Proposal
Based on the average scores calculated in Table 4 and the eight key indicators identified in Table 5, Table 6, Table 7 and Table 8 (S11, S12, W22, W31, O22, O31, T21, and T22), we compute the average scores for the four categories: Strengths (S), Weaknesses (W), Opportunities (O), and Threats (T) using Equations (10) and (11) and then compare them.
S = 6.43 > W = 6.37
O = 5.49 < T2 = 5.88
The fact that the scores for Strengths exceed those for Weaknesses indicates that, in the process of promoting BIM, companies possess certain competitiveness and the capability to address challenges. However, special attention is necessary for adverse factors in the external environment.
Subsequently, based on Equations (12)–(14), we calculate the Environmental Attractiveness Score (AS) using these four values, determine the Market Position of BIM technology (SP—Internal Strength), and ascertain the Probability of Strategic Success (PSS—Probability of Strategic Success).
The Probability of Strategic Success (PSS) suggests that, while the overall strategic position is nearly balanced, it tends slightly towards a disadvantageous direction, reflecting the current state of BIM development in Japan. This means that, despite numerous obstacles in the development process, the promotion of BIM technology in the Japanese construction industry is unlikely to fail. This is due to the global advancement of BIM in construction and strong domestic support. To enhance the strategic advantages, it is necessary to further strengthen the strengths through improvements in internal management and innovation. Additionally, learning from foreign technologies and advocating for policies to mitigate external threats is also crucial.
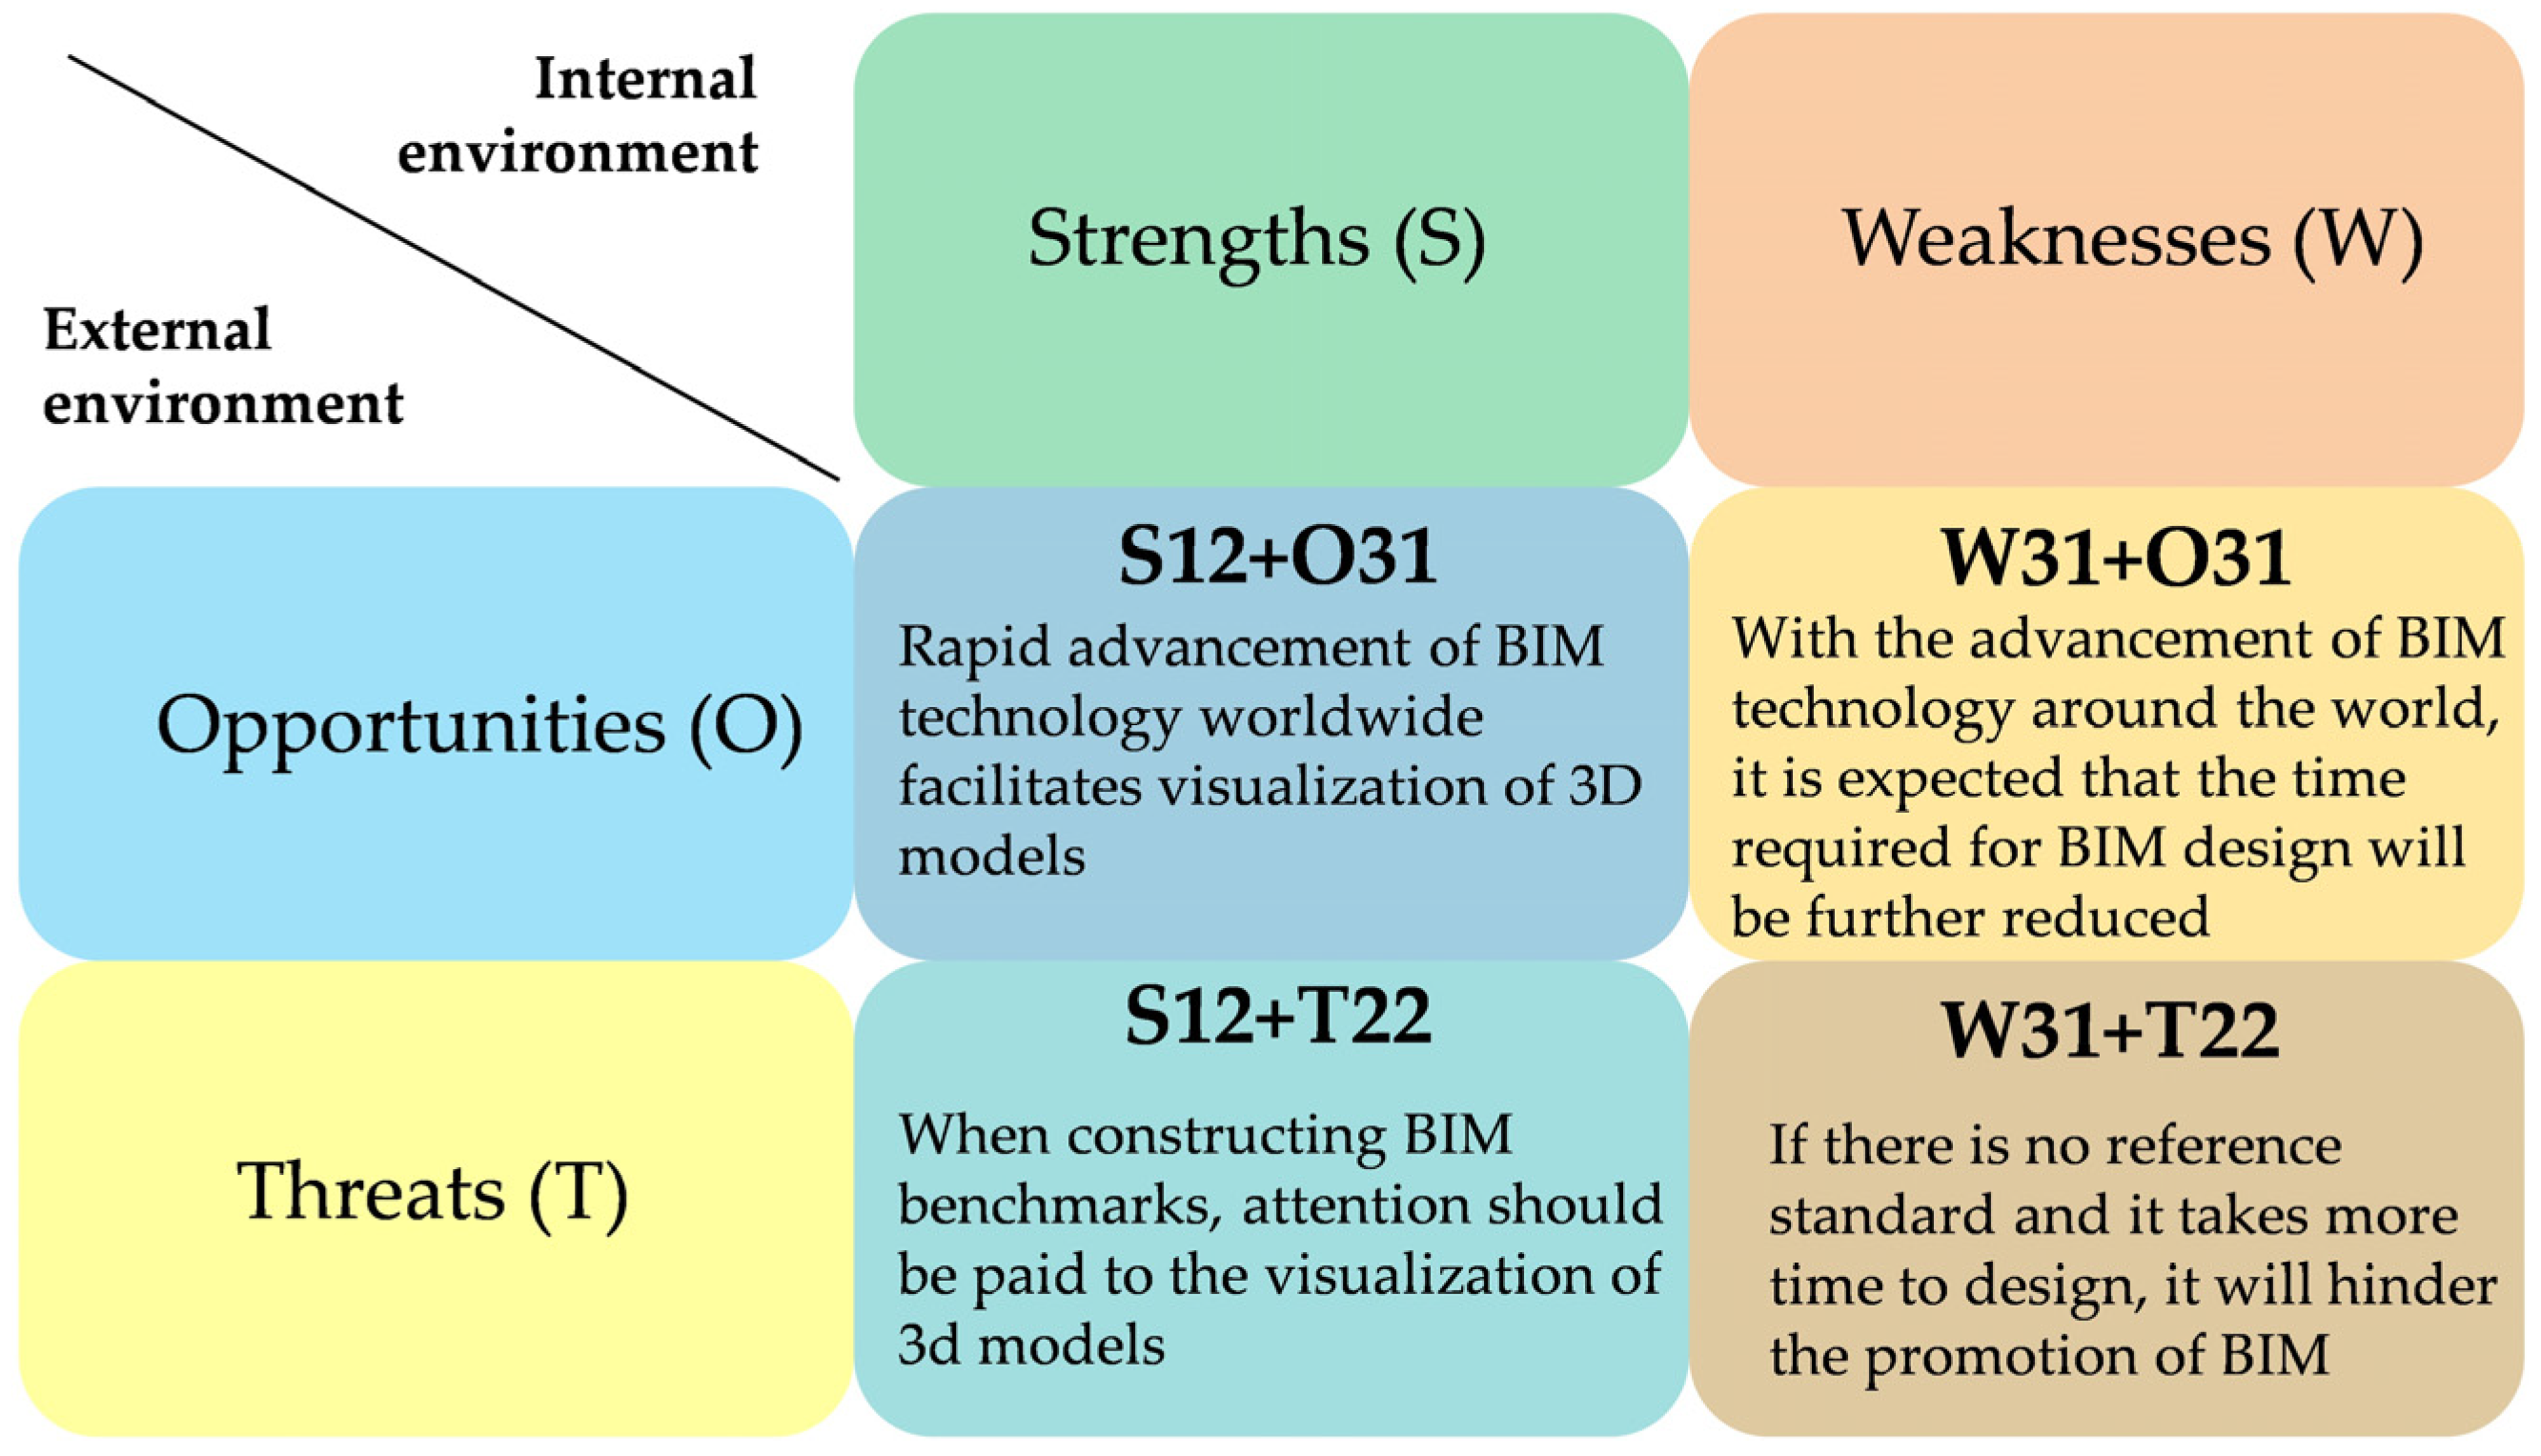
Based on a comprehensive SWOT-AHP analysis, the combined high priority factors present four types of strategic alternatives, and possible strategies for the development of Japan’s BIM industry include Strengths–Opportunities (SO), Weaknesses–Opportunities (WO), Strengths–Threats (ST), and Weaknesses–Threats (WT). The analysis involves highlighting the highest values in each category and discussing their implications. Based on the highest weight values, we will analyze S12O31, S12T22, W31O31, and W31T22, with the results presented in Figure 7.
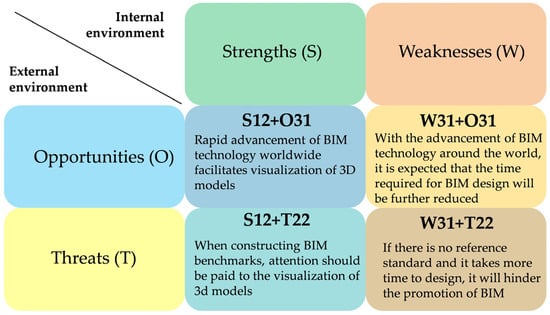
Figure 7.
SWOT strategy analysis diagram.
5. Discussion
This study aims to analyze the BIM industry’s development in Japan and propose strategies from the perspectives of companies in various sectors that utilize BIM technology. It reflects the stance of the Japanese construction industry towards the use of BIM technology, aligning with the ongoing trend among Japanese construction companies to invest in BIM, and quantitatively measures industry challenges. Since a SWOT analysis focused on industry awareness towards BIM has not yet been conducted in Japan, this research holds academic significance. Moreover, compared to traditional SWOT-AHP studies, this research employs a three-tiered design, considering the interplay between various elements more thoroughly, resulting in more effective prioritization of importance. Based on these results, the study aims to make appropriate recommendations to the industry and address the challenges faced by the Japanese construction industry through the dissemination and utilization of BIM technology.
Polish researchers in their SWOT analysis of BIM development also noted that the lack of a unified software platform and BIM regulations or mandatory standards could negatively impact and threaten the development of BIM [12]. Meanwhile, Vietnamese researchers in their SWOT analysis particularly emphasized the importance of establishing comprehensive standards [24], aligning with the critical indicators identified in this study. In 2021, Japan’s Ministry of Land, Infrastructure, Transport and Tourism conducted an actual survey on the application and popularization of BIM in the construction sector [44]. The survey results indicated that the greatest advantage was the improvement of communication and understanding through 3D visualization, while the major disadvantage was the increase in working hours and labor intensity. These findings not only coincide with the conclusions of this study but also validate the accuracy of this analysis.
Three proposals to promote the development of BIM technology in Japan include, firstly, leveraging the rapid global development of BIM technology and integrating it with ongoing advancements in AI and Virtual Reality (VR) technologies both domestically and internationally. This could further enhance BIM’s strength in providing more intuitive and accurate assessments through 3D models. Secondly, with the development of new BIM technologies worldwide, actively adopting foreign technologies and talent and strengthening autonomous design methodologies can address the time-consuming issues associated with BIM design compared to traditional planning. Finally, in constructing related standards, it is significant to capitalize on BIM technology’s strength in making accurate judgments through 3D visualization.
6. Conclusions
Over the past two decades, since the inception of BIM technology, its research and application have experienced rapid growth worldwide, spurred on by the advancement of computer-related industries. Although BIM technology has developed to a certain extent in Japan, when compared to BIM-advanced countries like the United States, the United Kingdom, and Australia in terms of the number of publications and actual use, the research in Japan may not be sufficient, and the recent development pace might also be lagging behind China in Asia. This could be influenced by the construction industry environment, the awareness of the workers, and the scale of the construction industry.
Considering this situation, this study used the SWOT-AHP analysis method to investigate Japan’s construction industry, analyze the development of BIM technology in Japan, and propose strategies. The results of this study indicated that, although the strengths related to the implementation of BIM in the Japanese construction industry outweigh its weaknesses, without significant changes, it would be difficult for Japan to undergo rapid transformation in adopting BIM in the construction sector. In the traditionally rooted Japanese construction industry, it is necessary to keep pace with the rapid global development of BIM technology, actively promote the cultivation of technology and talent, enhance design efficiency using the intuitiveness of 3D models, and establish related standards.
This study is the first to apply the SWOT-AHP method to assess the application of BIM technology in Japan, providing quantitative decision support for relevant policy making and industry practice. In future research, we will continue to focus on the development of BIM within the Japanese construction industry. Plans include the use of various analytical methods, including the Best Worst Method (BWM). Moreover, this study only conducted pairwise comparisons of factors within the same dimensions (Strengths, Weaknesses, Opportunities, and Threats), without exploring the interactions between cross-disciplinary factors. In the future, we consider using the Structural Equation Modeling (SEM) method to further study these interactions, to deepen our understanding of their complex dynamics, and to explore their intricate interactions.
Author Contributions
Conceptualization, S.R. and K.M.; methodology, S.R.; writing—original draft, S.R.; writing—review and editing, K.M.; investigation, S.R., M.F. and Y.M.; project administration, M.F. All authors have read and agreed to the published version of the manuscript.
Funding
This work was supported by JST SPRING, Grant Number JPMJSP2135.
Institutional Review Board Statement
Not applicable.
Data Availability Statement
The original contributions presented in the study are included in the article; further inquiries can be directed to the corresponding authors.
Conflicts of Interest
The authors declare no conflicts of interest.
Appendix A
Table A1.
Survey results on the strengths of BIM (N = 213).
Table A1.
Survey results on the strengths of BIM (N = 213).
| Strength | None | Small | Medium | Large | Huge |
|---|---|---|---|---|---|
| S1 | 4 (1.88%) | 11 (5.16%) | 44 (20.66%) | 104 (48.83%) | 50 (23.47%) |
| S2 | 14 (6.57%) | 38 (17.84%) | 68 (31.92%) | 73 (34.27%) | 20 (9.39%) |
| S3 | 10 (4.69%) | 21 (9.86%) | 84 (39.44%) | 77 (36.15%) | 21 (9.86%) |
| S4 | 9 (4.23%) | 16 (7.51%) | 58 (27.23%) | 101 (47.42%) | 29 (13.62%) |
| S11 | 4 (1.88%) | 29 (13.62%) | 53 (24.88%) | 92 (43.19%) | 35 (16.43%) |
| S12 | 4 (1.88%) | 5 (2.35%) | 19 (8.92%) | 100 (46.95%) | 85 (39.91%) |
| S21 | 15 (7.04%) | 23 (10.80%) | 55 (25.82%) | 88 (41.31%) | 32 (15.02%) |
| S22 | 5 (2.35%) | 11 (5.16%) | 37 (17.37%) | 104 (48.83%) | 56 (26.29%) |
| S31 | 4 (1.88%) | 20 (9.39%) | 51 (23.94%) | 97 (45.54%) | 41 (19.25%) |
| S32 | 14 (6.57%) | 30 (14.08%) | 85 (39.91%) | 58 (27.23%) | 26 (12.21%) |
| S33 | 11 (5.16%) | 17 (7.98%) | 77 (36.15%) | 69 (32.39%) | 39 (18.31%) |
| S41 | 12 (5.63%) | 26 (12.21%) | 99 (46.48%) | 67 (31.46%) | 9 (4.23%) |
| S42 | 1 (0.47%) | 10 (4.69%) | 26 (12.21%) | 115 (53.99%) | 61 (28.64%) |
| S43 | 11 (5.16%) | 33 (15.49%) | 80 (37.56%) | 70 (32.86%) | 19 (8.92%) |
Table A2.
Survey results on the weaknesses of BIM (N = 213).
Table A2.
Survey results on the weaknesses of BIM (N = 213).
| Weakness | None | Small | Medium | Large | Huge |
|---|---|---|---|---|---|
| W1 | 3 (1.41%) | 16 (7.51%) | 41 (19.25%) | 85 (39.91%) | 68 (31.92%) |
| W2 | 3 (1.41%) | 35 (16.43%) | 86 (40.38%) | 61 (28.64%) | 28 (13.15%) |
| W3 | 6 (2.82%) | 21 (9.86%) | 58 (27.23%) | 80 (37.56%) | 48 (22.54%) |
| W4 | 10 (4.69%) | 26 (12.21%) | 98 (46.01%) | 62 (29.11%) | 17 (7.98%) |
| W11 | 2 (0.94%) | 10 (4.69%) | 42 (19.72%) | 80 (37.56%) | 79 (37.09%) |
| W12 | 4 (1.88%) | 20 (9.39%) | 69 (32.39%) | 84 (39.44%) | 36 (16.90%) |
| W13 | 2 (0.94%) | 13 (6.10%) | 56 (26.29%) | 87 (40.85%) | 55 (25.82%) |
| W21 | 4 (1.88%) | 12 (5.63%) | 54 (25.35%) | 72 (33.80%) | 71 (33.33%) |
| W22 | 1 (0.47%) | 9 (4.23%) | 62 (29.11%) | 76 (35.68%) | 65 (30.52%) |
| W31 | 5 (2.35%) | 16 (7.51%) | 57 (26.76%) | 71 (33.33%) | 64 (30.05%) |
| W32 | 8 (3.76%) | 34 (15.96%) | 54 (25.35%) | 63 (29.58%) | 54 (25.35%) |
| W41 | 18 (8.45%) | 39 (18.31%) | 80 (37.56%) | 40 (18.78%) | 36 (16.90%) |
| W42 | 8 (3.76%) | 19 (8.92%) | 94 (44.13%) | 62 (29.11%) | 30 (14.08%) |
| W43 | 5 (2.35%) | 23 (10.80%) | 81 (38.03%) | 77 (36.15%) | 27 (12.68%) |
Table A3.
Survey results on the opportunities of BIM (N = 213).
Table A3.
Survey results on the opportunities of BIM (N = 213).
| Opportunity | None | Small | Medium | Large | Huge |
|---|---|---|---|---|---|
| O1 | 9 (4.23%) | 19 (8.92%) | 55 (25.82%) | 86 (40.38%) | 44 (20.66%) |
| O2 | 2 (0.94%) | 11 (5.16%) | 60 (28.17%) | 107 (50.23%) | 33 (15.49%) |
| O3 | 1 (0.47%) | 10 (4.69%) | 71 (33.33%) | 102 (47.89%) | 29 (13.62%) |
| O4 | 1 (0.47%) | 12 (5.63%) | 56 (26.29%) | 110 (51.64%) | 34 (15.96%) |
| O11 | 6 (2.82%) | 31 (14.55%) | 74 (34.74%) | 69 (32.39%) | 33 (15.49%) |
| O12 | 9 (4.23%) | 22 (10.33%) | 127 (59.62%) | 44 (20.66%) | 11 (5.16%) |
| O13 | 4 (1.88%) | 13 (6.10%) | 79 (37.09%) | 85 (39.91%) | 32 (15.02%) |
| O21 | 11 (5.16%) | 28 (13.15%) | 130 (61.03%) | 37 (17.37%) | 7 (3.29%) |
| O22 | 13 (6.10%) | 33 (15.49%) | 84 (39.44%) | 61 (28.64%) | 22 (10.33%) |
| O31 | 3 (1.41%) | 10 (4.69%) | 72 (33.80%) | 96 (45.07%) | 32 (15.02%) |
| O32 | 8 (3.76%) | 26 (12.21%) | 107 (50.23%) | 57 (26.76%) | 15 (7.04%) |
| O41 | 3 (1.41%) | 9 (4.23%) | 32 (15.02%) | 102 (47.89%) | 67 (31.46%) |
| O42 | 5 (2.35%) | 18 (8.45%) | 68 (31.92%) | 99 (46.48%) | 23 (10.80%) |
| O43 | 2 (0.94%) | 13 (6.10%) | 64 (30.05%) | 91 (42.72%) | 43 (20.19%) |
Table A4.
Survey results on the threats of BIM (N = 213).
Table A4.
Survey results on the threats of BIM (N = 213).
| Threat | None | Small | Medium | Large | Huge |
|---|---|---|---|---|---|
| T1 | 0 (0.00%) | 8 (3.76%) | 37 (17.37%) | 113 (53.05%) | 55 (25.82%) |
| T2 | 3 (1.41%) | 13 (6.10%) | 59 (27.70%) | 85 (39.91%) | 53 (24.88%) |
| T3 | 2 (0.94%) | 13 (6.10%) | 66 (30.99%) | 95 (44.60%) | 37 (17.37%) |
| T4 | 1 (0.47%) | 10 (4.69%) | 24 (11.27%) | 116 (54.46%) | 62 (29.11%) |
| T11 | 10 (4.69%) | 27 (12.68%) | 88 (41.31%) | 57 (26.76%) | 31 (14.55%) |
| T12 | 2 (0.94%) | 17 (7.98%) | 40 (18.78%) | 82 (38.50%) | 72 (33.80%) |
| T13 | 18 (8.45%) | 42 (19.72%) | 63 (29.58%) | 64 (30.05%) | 26 (12.21%) |
| T21 | 4 (1.88%) | 37 (17.37%) | 73 (34.27%) | 72 (33.80%) | 27 (12.68%) |
| T22 | 4 (1.88%) | 18 (8.45%) | 52 (24.41%) | 86 (40.38%) | 53 (24.88%) |
| T31 | 13 (6.10%) | 37 (17.37%) | 96 (45.07%) | 52 (24.41%) | 15 (7.04%) |
| T32 | 2 (0.94%) | 9 (4.23%) | 31 (14.55%) | 103 (48.36%) | 68 (31.92%) |
| T33 | 2 (0.94%) | 20 (9.39%) | 54 (25.35%) | 83 (38.97%) | 54 (25.35%) |
| T41 | 7 (3.29%) | 30 (14.08%) | 54 (25.35%) | 87 (40.85%) | 35 (16.43%) |
| T42 | 1 (0.47%) | 16 (7.51%) | 26 (12.21%) | 100 (46.95%) | 70 (32.86%) |
References
- Ministry of Land, Infrastructure, Transport and Tourism. Recent Conditions Surrounding the Construction Industry [Report]. Available online: https://www.mlit.go.jp/policy/shingikai/content/001428484.pdf (accessed on 1 September 2024).
- Yabuki, N. Applications of AI, BIM, and sensing to bridge maintenance. In Bridge Maintenance, Safety, Management, Life-Cycle Sustainability and Innovations; CRC Press: Boca Raton, FL, USA, 2021; pp. 108–114. [Google Scholar]
- Fujino, Y.; Siringoringo, D.M. Recent research and development programs for infrastructures maintenance, renovation and management in Japan. Struct. Infrastruct. Eng. 2020, 16, 3–25. [Google Scholar] [CrossRef]
- Pereira, V.; Santos, J.; Leite, F.; Escórcio, P. Using BIM to improve building energy efficiency–A scientometric and systematic review. Energy Build. 2021, 250, 111292. [Google Scholar] [CrossRef]
- Parsamehr, M.; Perera, U.S.; Dodanwala, T.C.; Perera, P.; Ruparathna, R. A review of construction management challenges and BIM-based solutions: Perspectives from the schedule, cost, quality, and safety management. Asian J. Civ. Eng. 2023, 24, 353–389. [Google Scholar] [CrossRef]
- Hamma-adama, M.; Kouider, T. Comparative analysis of BIM adoption efforts by developed countries as precedent for new adopter countries. Curr. J. Appl. Sci. Technol. 2019, 36, CJAST.49779. [Google Scholar] [CrossRef]
- NATSPEC. BIM Education-Global 2023 Update Report. 2023. Available online: https://bim.natspec.org/bim-rnd/177-natspec-international-bim-education-report (accessed on 1 September 2024).
- Miyamoto, K. A research study on lifecycle infrastructure management with shared product model on collaborative information systems. In Computing in Civil and Building Engineering (2014); ACSE: Reston, VA, USA, 2014; pp. 1901–1908. [Google Scholar]
- Ishizawa, T.; Xiao, Y.; Ikeda, Y. Analyzing BIM protocols and users surveys in Japan. In Proceedings of the 23rd International Conference on Computer-Aided Architectural Design Research in Asia, Beijing, China, 17–19 May 2018; The Association for Computer-Aided Architectural Design Research in Asia (CAADRIA): Hong Kong, China, 2018; pp. 31–40. [Google Scholar]
- Rauch, P. SWOT analyses and SWOT strategy formulation for forest owner cooperations in Austria. Eur. J. For. Res. 2007, 126, 413–420. [Google Scholar] [CrossRef]
- Fernández-Mora, V.; Navarro, I.J.; Yepes, V. Integration of the structural project into the BIM paradigm: A literature review. J. Build. Eng. 2022, 53, 104318. [Google Scholar] [CrossRef]
- Zima, K.; Plebankiewicz, E.; Wieczorek, D. A SWOT analysis of the use of BIM technology in the Polish construction industry. Buildings 2020, 10, 16. [Google Scholar] [CrossRef]
- Tekin, H.; Atabay, Ş. Building information modelling roadmap strategy for Turkish construction sector. Proc. Inst. Civ. Eng.-Munic. Eng. 2019, 172, 145–156. [Google Scholar] [CrossRef]
- Li, Z.; Guo, F.; Schaefer, D. SWOT analysis for using BIM for infrastructure across the whole lifecycle of transportation projects. In Sustainable Buildings and Structures: Building a Sustainable Tomorrow; CRC Press: Boca Raton, FL, USA, 2019; pp. 351–359. [Google Scholar]
- Arayici, Y.; Kiviniemi, A.O.; Coates, S.P.; Koskela, L.J.; Kagioglou, M.; Usher, C.; O’Reilly, K. BIM Implementation and Adoption Process for An Architectural Practice. In Proceedings of the FIATECH Conference, Chandler, AZ, USA, 1 April 2011. [Google Scholar]
- Saaty, T.L. Decision making with the analytic hierarchy process. Int. J. Serv. Sci. 2008, 1, 83–98. [Google Scholar] [CrossRef]
- Sayed, A.Y.A.; Seth, D.; Hamouda, A.M.S. Prioritisation of lean construction barriers in Qatari context: A fuzzy AHP approach. Int. J. Bus. Excell. 2019, 19, 503–531. [Google Scholar] [CrossRef]
- Swaroop, D.T.; Chandra, D.S.; Asadi, S.S. Application of safety and risk management techniques in construction using analytic hierarchy process (AHP)-A case study. Int. J. Civ. Eng. Technol. 2018, 9, 719–724. [Google Scholar]
- Kurttila, M.; Pesonen, M.; Kangas, J.; Kajanus, M. Utilizing the analytic hierarchy process (AHP) in SWOT analysis—A hybrid method and its application to a forest-certification case. For. Policy Econ. 2000, 1, 41–52. [Google Scholar] [CrossRef]
- Görener, A.; Toker, K.; Uluçay, K. Application of combined SWOT and AHP: A case study for a manufacturing firm. Procedia-Soc. Behav. Sci. 2012, 58, 1525–1534. [Google Scholar] [CrossRef]
- Lee, J.; Kim, I.; Kim, H.; Kang, J. SWOT-AHP analysis of the Korean satellite and space industry: Strategy recommendations for development. Technol. Forecast. Soc. Chang. 2021, 164, 120515. [Google Scholar] [CrossRef]
- Shrestha, R.K.; Alavalapati, J.R.R.; Kalmbacher, R.S. Exploring the potential for silvopasture adoption in south-central Florida: An application of SWOT–AHP method. Agric. Syst. 2004, 81, 185–199. [Google Scholar] [CrossRef]
- Xu, X.; Zhu, L.; Chen, J.; Huang, Y. Research on Construction Supply Chain Management Strategy Selection of the Large-Scale Assembly Enterprises Based on SWOT-AHP. In International Symposium on Advancement of Construction Management and Real Estate; Springer: Singapore, 2019; pp. 2059–2071. [Google Scholar]
- Nguyen, T.A.; Do, S.T.; Nguyen, V.T.; Khuc, T.Q.; Quach, Q.T. Essential strategies for embracing Building Information Modeling (BIM) in public investment projects: A case study in Vietnam. Int. J. Constr. Manag. 2024, 24, 1708–1718. [Google Scholar] [CrossRef]
- Jin, R.; Zhong, B.; Ma Hashemi, A.; Ding, L. Integrating BIM with building performance analysis in project life-cycle. Autom. Constr. 2019, 106, 102861. [Google Scholar] [CrossRef]
- Sun, J.; Mi, S.; Olsson, P.-O.; Paulsson, J.; Harrie, L. Utilizing BIM and GIS for Representation and Visualization of 3D Cadastre. ISPRS Int. J. Geo-Inf. 2019, 8, 503. [Google Scholar] [CrossRef]
- Wu, S.; Wood, G.; Ginige, K.; Jong, S.W. A technical review of BIM based cost estimating in UK quantity surveying practice, standards and tools. J. Inf. Technol. Constr. 2014, 19, 534–562. [Google Scholar]
- Donato, V.; Lo Turco, M.; Bocconcino, M.M. BIM-QA/QC in the architectural design process. Archit. Eng. Des. Manag. 2018, 14, 239–254. [Google Scholar] [CrossRef]
- Chen, C.; Tang, L. BIM-based integrated management workflow design for schedule and cost planning of building fabric maintenance. Autom. Constr. 2019, 107, 102944. [Google Scholar] [CrossRef]
- Chen, L.J.; Luo, H. A BIM-based construction quality management model and its applications. Autom. Constr. 2014, 46, 64–73. [Google Scholar] [CrossRef]
- Skrzypczak, I.; Oleniacz, G.; Leśniak, A.; Zima, K.; Mrówczyńska, M.; Kazak, J.K. Scan-to-BIM method in construction: Assessment of the 3D buildings model accuracy in terms inventory measurements. Build. Res. Inf. 2022, 50, 859–880. [Google Scholar] [CrossRef]
- Li, J.; Hou, L.; Wang, X.; Wang, J.; Guo, J.; Zhang, S.; Jiao, Y. A project-based quantification of BIM benefits. Int. J. Adv. Robot. Syst. 2014, 11, 123. [Google Scholar] [CrossRef]
- Singh, S.; Chinyio, E.; Suresh, S. The Implementation of Stakeholder Management and Building Information Modelling (BIM) in UK Construction Projects; Association of Researchers in Construction Management: London, UK, 2018. [Google Scholar]
- Gao, X.; Pishdad-Bozorgi, P. BIM-enabled facilities operation and maintenance: A review. Adv. Eng. Inform. 2019, 39, 227–247. [Google Scholar] [CrossRef]
- Marzouk, M.; Elsaay, H.; Othman, A.A.E. Analysing BIM implementation in the Egyptian construction industry. Eng. Constr. Archit. Manag. 2021, 29, 4177–4190. [Google Scholar] [CrossRef]
- Cheng, J.C.P.; Lu, Q.; Deng, Y. Analytical review and evaluation of civil information modeling. Autom. Constr. 2016, 67, 31–47. [Google Scholar] [CrossRef]
- Ismail, N.A.A.; Yousof, M.N.M.; Adnan, H. BIM Adoption in Managing Construction Risks Amongst Malaysian Quantity Surveyors: Current Practice and Challenges. Int. J. Sustain. Constr. Eng. Technol. 2021, 12, 166–175. [Google Scholar] [CrossRef]
- Hamada, H.M.; Haron, A.; Zakiria, Z.; Humada, A.M. Factor Affecting of BIM Technique in the Construction Firms in Iraq. Int. Symp. Civ. Environ. Eng. 2017, 103, 03003. [Google Scholar] [CrossRef]
- Oh, M.; Lee, J.; Hong, S.W.; Jeong, Y. Integrated system for BIM-based collaborative design. Autom. Constr. 2015, 58, 196–206. [Google Scholar] [CrossRef]
- Loyola, M.; López, F. An evaluation of the macro-scale adoption of Building Information Modeling in Chile: 2013–2016. Rev. Constr. 2018, 17, 158–171. [Google Scholar] [CrossRef]
- Ahn, D.; Cha, H. Integration of building maintenance data in application of Building Information Modeling (BIM). J. Build. Constr. Plan. Res. 2014, 2014, 47488. [Google Scholar] [CrossRef]
- He, R.; Li, M.; Gan, V.J.L.; Ma, J. BIM-enabled computerized design and digital fabrication of industrialized buildings: A case study. J. Clean. Prod. 2021, 278, 123505. [Google Scholar] [CrossRef]
- Huang, B.; Lei, J.; Ren, F.; Chen, Y.; Zhao, Q.; Li, S.; Lin, Y. Contribution and obstacle analysis of applying BIM in promoting green buildings. J. Clean. Prod. 2021, 278, 123946. [Google Scholar] [CrossRef]
- Ministry of Land, Infrastructure, Transport and Tourism. Survey on the Utilization and Dissemination Status of BIM in the Construction Field (Final Report). 2021. Available online: https://www.mlit.go.jp/jutakukentiku/build/content/001395118.pdf (accessed on 1 September 2024).
- JACIC. Dissemination Status of BIM/CIM–Analysis of the Survey Results Targeting Contractors. 2020. Available online: https://www.cals.jacic.or.jp/CIM/pdf/report_hukyujokyo.pdf (accessed on 1 September 2024).
- Saka, A.B.; Chan, D.W.M. A global taxonomic review and analysis of the development of BIM research between 2006 and 2017. Constr. Innov. 2019, 19, 465–490. [Google Scholar] [CrossRef]
- Mustaffa, N.E.; Salleh, R.M.; Ariffin, H.L.B.T. Experiences of Building Information Modelling (BIM) adoption in various countries. In Proceedings of the 2017 International Conference on Research and Innovation in Information Systems (ICRIIS), Langkawi, Malaysia, 16–17 July 2017; IEEE: New York, NY, USA, 2017; pp. 1–7. [Google Scholar]
- Ferrandiz, J.; Banawi, A.; Peña, E. Evaluating the benefits of introducing “BIM” based on Revit in construction courses, without changing the course schedule. Univers. Access Inf. Soc. 2018, 17, 491–501. [Google Scholar] [CrossRef]
- Wang, Y.; Zhao, B.; Nie, Y.; Jiang, L.; Zhang, X. Challenge for Chinese BIM Software Extension Comparison with International BIM Development. Buildings 2024, 14, 2239. [Google Scholar] [CrossRef]
- Bouguerra, K.; Yaik-Wah, L.; Ali, K.N. A Preliminary Implementation Framework of Building Information Modelling (BIM) in the Algerian AEC Industry. Int. J. Built Environ. Sustain. 2020, 7, 59–68. [Google Scholar] [CrossRef]
- Oraee, M.; Hosseini, M.R.; Edwards, D.J.; Li, H.; Papadonikolaki, E.; Cao, D. Collaboration barriers in BIM-based construction networks: A conceptual model. Int. J. Proj. Manag. 2019, 37, 839–854. [Google Scholar] [CrossRef]
- Van Roy, A.F.; Firdaus, A. Building Information Modelling in Indonesia: Knowledge, Implementation and Barriers. J. Constr. Dev. Ctries. 2020, 25, 199–217. [Google Scholar]
- Rogers, J.; Chong, H.Y.; Preece, C. Adoption of Building Information Modelling technology (BIM): Perspectives from Malaysian engineering consulting services firms. Eng. Constr. Archit. Manag. 2015, 22, 424–445. [Google Scholar] [CrossRef]
- Kamal, Y.Y.; Esa, E.M. Building Information Modelling (BIM) Implementation: Challenges for Quantity Surveyors. Int. Trans. J. Eng. 2019, 13, 13A2R. [Google Scholar]
- Kerosuo, H.; Miettinen, R.; Paavola, S.; Mäki, T.; Korpela, J. Challenges of the expansive. Production 2015, 25, 289–297. [Google Scholar] [CrossRef]
- Enshassi, M.A.; Al Hallaq, K.A.; Tayeh, B.A. Limitation factors of building information modeling (BIM) implementation. Open Constr. Build. Technol. J. 2019, 13. [Google Scholar] [CrossRef]
- Al Hattab, M.; Hamzeh, F. Simulating the dynamics of social agents and information flows in BIM-based design. Autom. Constr. 2018, 92, 1–22. [Google Scholar] [CrossRef]
- Shin, M.H.; Kim, H.Y. Facilitators and barriers in applying building information modeling (Bim) for construction industry. Appl. Sci. 2021, 11, 8983. [Google Scholar] [CrossRef]
- Rosen, K.T.; Resnick, M. The size distribution of cities: An examination of the Pareto law and primacy. J. Urban Econ. 1980, 8, 165–186. [Google Scholar] [CrossRef]
- Barber, P.; Graves, A.; Hall, M.; Sheath, D.; Tomkins, C. Quality failure costs in civil engineering projects. Int. J. Qual. Reliab. Manag. 2000, 17, 479–492. [Google Scholar] [CrossRef]

Disclaimer/Publisher’s Note: The statements, opinions and data contained in all publications are solely those of the individual author(s) and contributor(s) and not of MDPI and/or the editor(s). MDPI and/or the editor(s) disclaim responsibility for any injury to people or property resulting from any ideas, methods, instructions or products referred to in the content. |
© 2024 by the authors. Licensee MDPI, Basel, Switzerland. This article is an open access article distributed under the terms and conditions of the Creative Commons Attribution (CC BY) license (https://creativecommons.org/licenses/by/4.0/).