Article

A Rapid Prediction of Suppressed Vibration in Composite Bridges Equipped with Constrained Layer Damping

State Key Laboratory of Performance Monitoring and Protecting of Rail Transit Infrastructure, East China Jiaotong University, Nanchang 330013, China
*
Author to whom correspondence should be addressed.
Buildings 2024, 14(11), 3621; https://doi.org/10.3390/buildings14113621
Submission received: 15 October 2024 / Revised: 6 November 2024 / Accepted: 12 November 2024 / Published: 14 November 2024
(This article belongs to the Section Building Structures)

Abstract

:
The vibration characteristics of a composite bridge with constrained layer damping (CLD) were investigated using the wave and finite element method (WFEM), and the effects of the material and geometrical parameters of the CLD on the vibration reduction in the bridge were analyzed. Firstly, a numerical model for the dynamic response of a composite steel–concrete bridge using WFEM. The calculated acceleration of the bridge under the wheel–rail force obtained using this model was in good agreement with that obtained using the conventional finite element method and field measurements. Second, a segment model of the bridge with a CLD was established. The equation of motion based on the WFEM was solved to determine the dynamic response of the bridge induced by running trains. Finally, the effects of the covering area and CLD parameters on the vibration mitigation of steel–concrete bridges were analyzed. The results show that a reduction of 5–10 dB of the acceleration level of steel members in the full frequency range can be achieved by installing the CLD. A lower shear modulus of the viscoelastic core is beneficial for low-frequency vibration reduction in the bridge. However, a higher shear modulus of the damping layer is required for vibration mitigation in the high-frequency range. The vibration reduction in the composite bridge was more sensitive to the thickness of the constraining layer than to that of the damping layer.

1. Introduction

The noise from high-speed railways and urban rail transits induced by running trains adversely impacts the health of nearby residents and has received increasing attention. An indispensable part of rail transportation is served by bridges, and in recent years, their vibration and noise have constituted a significant problem that cannot be ignored [1,2,3].
The main methods for obtaining the vibration and noise of bridge structures include testing [4] and numerical simulation. Only the vibration and noise of existing structures can be obtained in the on-site measurement and the testing method is powerless for the design and parameter optimization of bridge structures. Therefore, the numerical simulation method will be discussed in the next. In recent decades, the vibration and noise of bridges have been investigated by employing the boundary element method (BEM) and the finite element method (FEM). The vibration of a concrete bridge was predicted by Ngai and Ng [5] with the application of FEM. They evaluated the transfer function and coherent relationship between noise and vibration by comparing the prediction and measurement results. Crockett and Pyke [6] used the FEM to simulate the viaduct, track, and vehicle and subsequently derived an approximation of the noise emitted to the surrounding area owing to bridge vibration. Alten and Flesch [7] analyzed the vibration characteristics of a segment of a steel truss bridge using the FEM and assessed different design alternatives with respect to the vibration of the bridge. Li et al. [8] applied the FEM to analyze the noise emission from U-shaped and box concrete girders, and the computed results agree well with the measured ones. The hybrid FEM–BEM was used to investigate the noise from a 32 m simply supported prestressed box girder [9] and the transient noise of a steel bridge during its service, which is caused by the vehicle–bridge coupled vibration [10]. Song and Li [11] used a two-and-a-half dimensional BEM-based acoustic model to calculate the sound radiation from a U-shaped girder and investigated the effect of three mitigation measures on controlling the noise of a bridge. Zhang et al. [12] analyzed the change in the total noise of a box-girder bridge by thickening the top plate using the acoustic BEM model.
Using the statistical energy analysis (SEA) method, Remington and Wittig [13] developed an analytical model to calculate the transmission of vibrations from the rail to the sleepers and deck steel plate girder and analyzed the noise generated by the steel bridge. Janssens and Thompson [14] calculated the input power of a bridge through the forces exerted on the bridge through rail fasteners and the real part of the bridge point mobility. In addition, they derived the velocity level ratio of different components of the bridge using SEA. Bewes et al. [15] developed a rapid calculation model to assess the transmission of vibration power from track to bridge. They then evaluated the noise and vibration characteristics of a steel–concrete composite viaduct. Poisson and Margiocchi [16] analyzed the noise emanating from a simply supported steel bridge using FEM and SEA. Liu et al. [17] used the FEM–BEM method to calculate the vibration and noise of the bridge below 200 Hz, and SEA to obtain the vibration and noise at 200–1000 Hz. Si et al. [18] calculate the vibration response of the steel–concrete bridge below 100 Hz utilizing FEM, and its high-frequency noise with the SEA method.
Liang et al. [19] carried out on-site measurements on a long-span steel cable-stayed bridge of urban rail transit. Subsequently, they built a SEA-based noise prediction model for this bridge. Liu et al. [20] employed receptance and SEA-based approach to investigate the structure-borne noise of a steel–concrete composite railway bridge. The vehicle–track–bridge dynamic coupling was applied to ascertain the vibration response of a bridge during high-speed train crossings by Gu et al. [21]. The full-frequency band noise radiated by the bridge was predicted by combining the BEM and SEA. The dynamic response of steel box girder with periodic ribs was calculated by Luo et al. [22] using SEA involving indirect coupling in the high-frequency range. Liu et al. [23] built a SEA model above 200 Hz and an FEM model of a composite bridge below 200 Hz to determine the noise and vibration from the bridge, in which the excitation to the bridge was from the vehicle-track coupling model based on the symplectic-spectral element method.
Both the FEM and BEM can reflect the complex geometry of bridges in determining structure-borne noise from viaducts and railway bridges. However, the computation is somewhat time-consuming for high-frequency vibrations of large-scale structures. Medium- and high-frequency vibration can be analyzed by using the SEA method and its available frequency is significantly broader than that of the BEM and FEM. However, the accuracy of calculating with the SEA method depends on the estimation of the coupling loss factor, damping loss factor, and modal density, which are difficult to obtain exactly.
The wave characteristics and vibration responses of waveguide structures can be determined by the Wave and Finite Element Method (WFEM) which was proposed in 1973. Starting from the equation of motion of a repeated segment of a waveguide structure, this method fully utilizes the advantages of commercial software of FEM and efficiently predicts the dynamic response of the structure [24,25]. Mace et al. [26] used the WFEM to investigate the dispersion characteristics and modes of waves in waveguide structures, such as uniform viscoelastic laminates. Renno et al. [27] used the WFEM to model free-wave propagation in a waveguide and determined the response of the waveguide to time-harmonic base excitations. In previous studies, the WFEM was primarily used to examine the vibration characteristics of tires, beams, and shells. Waki et al. [28] investigated the dispersion curves of propagating waves and the vibration characteristics of tires using the WFEM. An approximately uniform bridge can be regarded as a type of waveguide structure [29]. The WFEM is also available for vibration analysis of such structures, achieving a balance between computational accuracy and efficiency.
Concrete bridges are the main focus of previous research on bridge structure-borne noise. Due to its lightweight and good seismic performance, the steel–concrete composite bridge is also a type of bridge often encountered in rail transit. However, the vibration and noise problems in concrete bridges are less severe than those of steel–concrete composite bridges. The noise generated by steel–concrete composite bridges is 5–20 dB louder than that produced by plain tracks [20].
Currently, the commonly used vibration reduction measure is to install a Tuned Mass Damper (TMD), among which Zhang [30] used the active rotary inertia drive system to control the vibrations of long-span bridges under the action of wind loads and earthquake loads. However, the TMD can only control the vibration at a single frequency.
Constrained layer damping (CLD) is effective in suppressing the vibration and noise of thin-walled structures and has been widely used in automobiles, aircrafts, and ships [31,32]. CLD can also reduce the vibration and noise of composite bridges induced by moving trains [33]. However, studies on CLD focused on the dynamic characteristics of beam and shell-like structures [34,35], and no efficient model for predicting the vibration response of bridges damped with CLD has been established.
In this study, a WFEM-based model was developed to analyze the vibration characteristics and spectral properties of steel–concrete composite bridges. Based on the receptance of the contact spring, track, and wheel, the wheel-rail forces in the frequency domain were computed with the application of the moving roughness model. The computed and measured results were compared to verify the accuracy of the WFEM-based model, and the computational efficiency of the WFEM and FEM models was discussed. The vibration response of the bridge with CLD was also calculated, and the results with and without the CLD treatment were compared. Subsequently, the effects of the covering area, material parameters, and thickness of the CLD on the mitigation of bridge vibration were investigated.

2. Equation of Motion Based on WFEM

The equation of motion of a structure can be expressed as follows [24]:
( K + i ω C ω 2 M ) q = f
where M, C, and K are the mass, damping, and stiffness matrices, respectively. f and q are the force and nodal displacement vectors, respectively. ω is the angular frequency, and I denotes the imaginary unit. D = K + iωCω2M is the dynamic stiffness matrix.
Because of the uniformity of the waveguide structure in the longitudinal direction y, e−iky can be used to represent the propagation coefficient of the structural vibration wave, where k is the wavenumber. The waveguide structure can be divided into N segments along the y-axis (Figure 1), yielding the equation of motion for one segment from Equation (1).
D LL D LR D RL D RR q L q R = f L f R
In Equation (2), subscripts R and L are the right- and left-hand-side cross-sections of the segment, respectively. The structure is uniform along the y-axis, leading to symmetry in the dynamic stiffness matrix:
D LL T = D LL D LR T = D RL D RR T = D RR
where the superscript, T, denotes the transpose of a matrix.
If no external force is exerted on the internal nodes, as shown in Figure 1, the equation of motion for the two continuous segments of the waveguide structure can be expressed as follows:
D LL D LI 0 D IL D II D IR 0 D RL D RR q L q I q R = f L 0 f R
where subscript I represents the intermediate section and 0 is a zero-matrix.
q I = D II 1 ( D LI q L + D IR q R )
Eliminating the degrees of freedom of the intermediate cross-section yields Equation (6):
D LL D LI D II 1 D IL D LI D II 1 D IR D RI D II 1 D IL D RR D RI D II 1 D IR q L q R = f L f R
which can be rewritten as follows.
D ˜ LL D ˜ LR D ˜ RL D ˜ RR q L q R = f L f R
The global dynamic stiffness matrix of the waveguide structure can be derived by eliminating the degrees of freedom of the nodes in the internal cross-sections where no external forces act. After introducing the boundary conditions and external forces, the vibration response of the structure is obtained by solving the equation of motion.

2.1. Dispersion Characteristics

The structure vibration can be regarded as the propagation of elastic waves. At the boundary of the structure, elastic waves will be reflected many times. Then, wave interference will occur, forming guided waves which have a variety of waveforms, called guided wave modes, such as torsional waves, bending waves, and longitudinal waves. In the wave propagation along the structure, the wavenumber of the guided waves will vary with the frequency, resulting in a variety of waveforms, which are called the dispersion characteristics of the guided waves.
When the structural vibration propagates in the form of e−jky, the force and displacement at the left and right sections satisfy the following relationship
q R = λ q L f R = λ f L
If the structure is not subject to external forces, the force balance and the continuity of the displacement at the adjacent boundary of the nth l and the n + 1th cells yields
q L n + 1 = q R n f L n + 1 = f R n
The transfer matrix T is introduced,
T q L n f L n = q L n + 1 f L n + 1 = q R n f R n
It can be deduced by combining Equations (2) and (10).
T = D LR 1 D LL D LR 1 D RL + D RR D LR 1 D LL D RR D LR 1
Thus, the propagation of free waves in the waveguide structure can be described as
T q L f L = λ q L f L
The eigenvalues and eigenvectors of Equation (12) are the solutions used to express the dispersion characteristics of the guided wave. If the cross-section has NS degrees of freedom, the NS pairs of the eigenvalues and eigenvectors ( λ i , φ i + ) , ( 1 / λ i , φ i ) can be obtained, where φ i + and φ i represent the forward and backward propagating waves, respectively. The eigenvalue λi describes the propagation of the ith guided wave over distance l along the y-axis within the structure.
λ i = e - j k i l
where ki denotes the wavenumber of the ith guided wave, and the corresponding eigenvector is denoted as
φ i = q λ i f ( λ i )
The nodal displacement vector q(λi) represents the mode of the ith guided wave.

2.2. Solution to Eigenvalue Equation

When a wave propagates through a waveguide structure, the eigenvalue equation of a segment with length Δ can be expressed as follows:
  T λ I q L f L = 0 , T = D LR 1 D LL D LR 1 D RL + D RR D LR 1 D LL D RR D LR 1
where T is the transfer matrix, f is the force vector, q is the nodal displacement vector, and λ is the propagation constant. Insight into the dispersion properties of waves propagating in the waveguide structure can be obtained by evaluating the eigenvalues of T.
However, the transfer matrix T in Equation (15) may be ill-conditioned, yielding extremely large and small eigenvalues. Zhong’s method [24] is used to rebuild the eigen-equation to prevent this problem.
D RL 0 0 D LR q L λ q L = 1 λ + ( 1 / λ ) ( D LL + D RR ) ( D LR D RL ) ( D LR D RL ) ( D LL + D RR ) q L λ q L
The above is a double-eigenvalue problem. If the two eigenvectors related to the eigenvalues (λi + 1/λi) are expressed as [ q 1 H λ i q 1 H ] H and [ q 2 H λ i q 2 H ] H , where superscript H denotes the Hermitian transpose, the eigenvector corresponding to λi can be expressed as follows.
φ i = α q 1 λ i q 1 + β q 2 λ i q 2
The values of α and β can be calculated using Equation (18).
A α β = 0 ,   A = λ i D RL D RL D RL D LL + D RR + λ i D LR q 1 q 2 λ i q 1 λ i q 2
Singular value decomposition is applied to matrix A such that A = USVH, which is written as follows.
A v 11 v 12 v 21 v 22 = U σ 1 0 0 0 0 σ 2 0 0 T
Because σ2 ≈ 0, Equation (20) is valid.
A v 12 v 22 0
The combination of Equations (18) and (20) yields
  α β = v 12 v 22

2.3. Response of Waveguide Structure

An infinite waveguide structure subjected to an external excitation fext generates negative and positive waves of amplitudes e and e+, respectively, as shown in Figure 2. The displacement continuity and force equilibrium conditions at the excitation point yield
φ q + φ q φ f + φ f e + e = 0 f e x t
where e and e+ are the amplitudes of the negative and positive excitation waves, respectively, and fext is the harmonic external force.
The values of e+ and e can be expressed by
e + e = φ q + φ q φ f + φ f 0 f e x t
The inverse of the matrix in Equation (23) is ill-conditioned, which can be avoided using the orthogonality between the right and left eigenvectors.
ψ f + ψ q + ψ f ψ q φ q + φ q φ f + φ f e + e = ψ f + ψ q + ψ f ψ q 0 f e x t ψ + φ + ψ + φ ψ φ + ψ φ e + e = ψ q + f e x t ψ q f e x t
As ψ ± ϕ ± = I and ψ ± ϕ = 0 , Equation (25) is obtained.
e + e = ψ q + f e x t ψ q f e x t
All of the above equations are used to calculate the wave amplitude of the infinite structure. Furthermore, the response amplitude of a finite waveguide can be determined by applying the boundary conditions.
In actual situations, waves get reflected at the boundary of a structure. Suppose the amplitudes of the incident wave and the reflected wave are a+ and a, respectively.
a = R a +
where R is the reflection coefficient matrix.
The boundary condition yields Equation (27):
A f + B q = 0
where q and f are the boundary the degrees and nodal forces and the degrees of freedom, respectively. A = 0 and B = I for fixed boundaries, and A = I and B = 0 for free boundaries. Based on this wave relationship, the reflection coefficient matrix can be written as follows.
R = ( A φ f + B φ q ) 1 ( A φ f + + B φ q + )
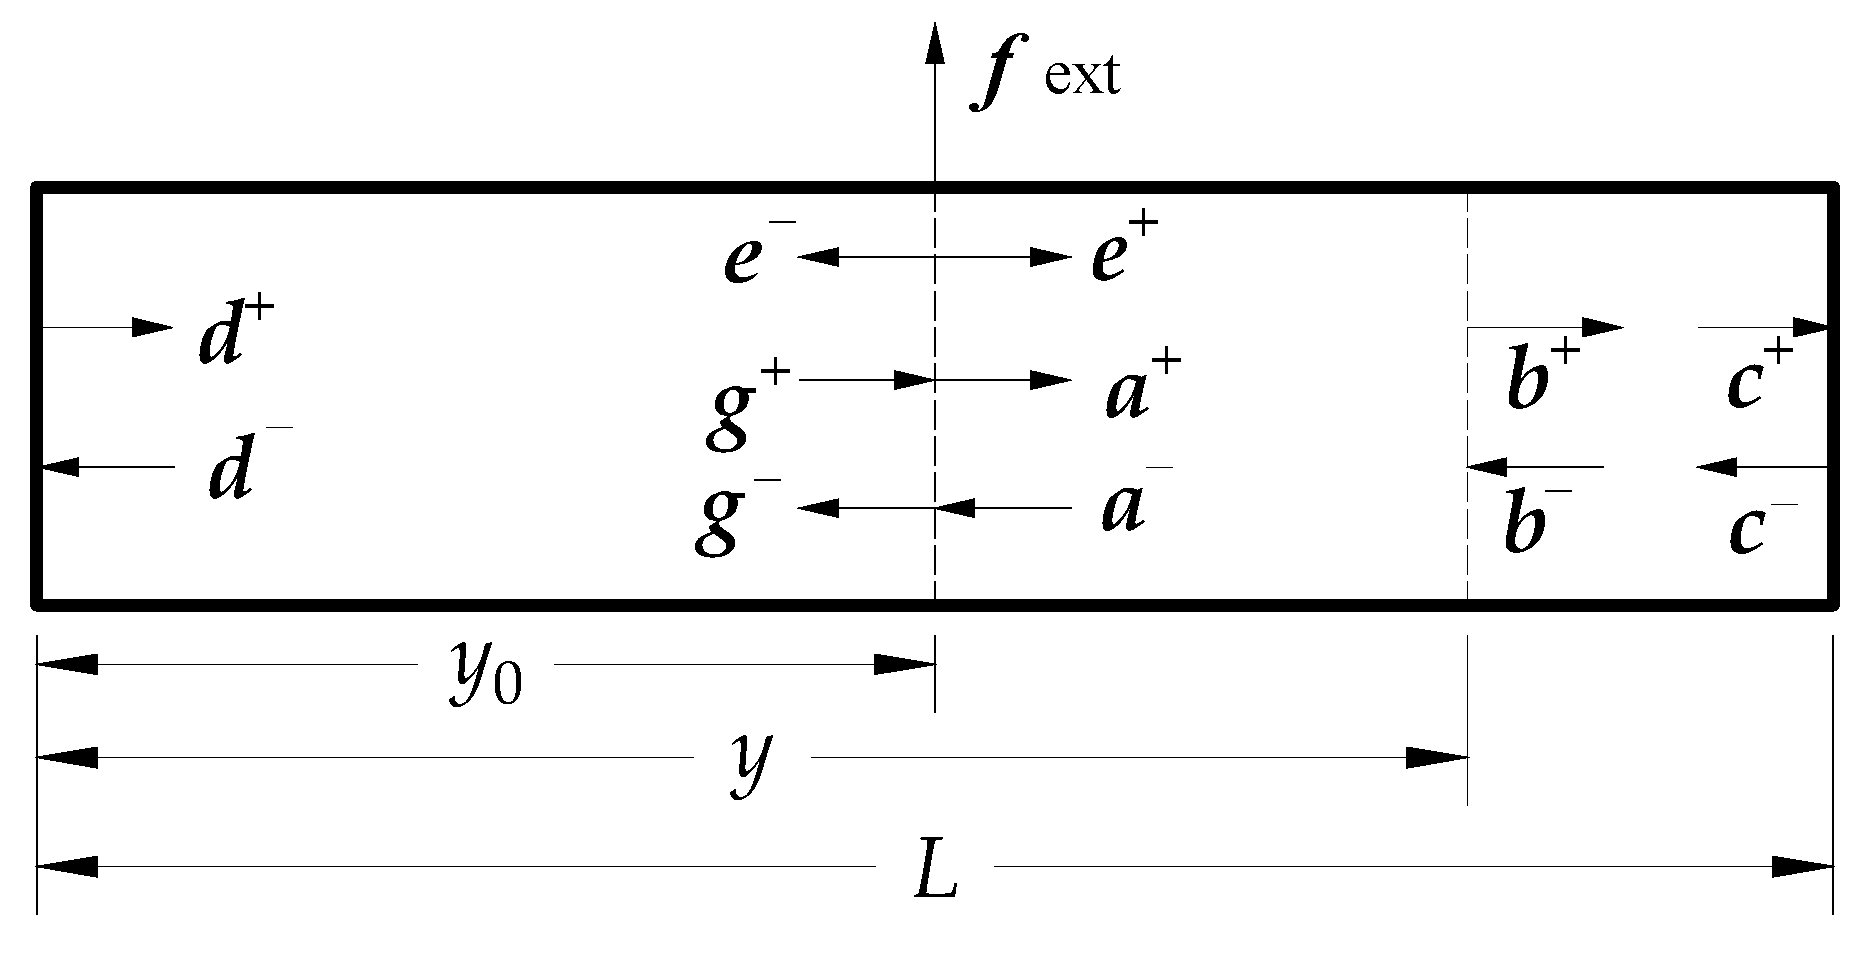
The waveguide structure with length L is taken for an example (Figure 3), and the structure is subjected to force fext at y0, and the amplitudes g and a+ are the sum of the direct excitation waves e and a and the incident waves e+ and g+.
g = e + a , a + = e + + g + ,
The wave propagation matrix Γ(y) expressed by Equation (30) is introduced.
Γ ( y ) = e j k 1 y 0 0 0 e j k 2 y 0 0 0 e j k N s y
The reflection and propagation relationship can be expressed as follows.
d = Γ ( y 0 ) g , c + = Γ ( L y 0 ) a +  
Waves c+ and d are reflected at the left- and right-side boundaries, respectively. If RR and RL are the reflection coefficient matrices of the right- and left-side boundaries, respectively, the reflected waves d+ and c can be expressed as follows.
d + = R L d , c = R R c +  
a = Γ ( L y 0 ) c ,   g + = Γ ( y 0 ) d +
Based on the above relationship, a and a+ can be expressed as follows.
a + = I Γ ( y 0 ) R L Γ ( L ) R R Γ L y 0 1 e + + Γ ( y 0 ) R L Γ ( y 0 ) e
a = Γ ( L y 0 ) R R Γ ( L y 0 ) a +
By analogy, the amplitudes b and b+ at any position y can be written as follows.
b = Γ ( L y ) R R Γ ( L y ) b +
b + = Γ ( y y 0 ) a +

3. Case Study

3.1. Model of Bridge

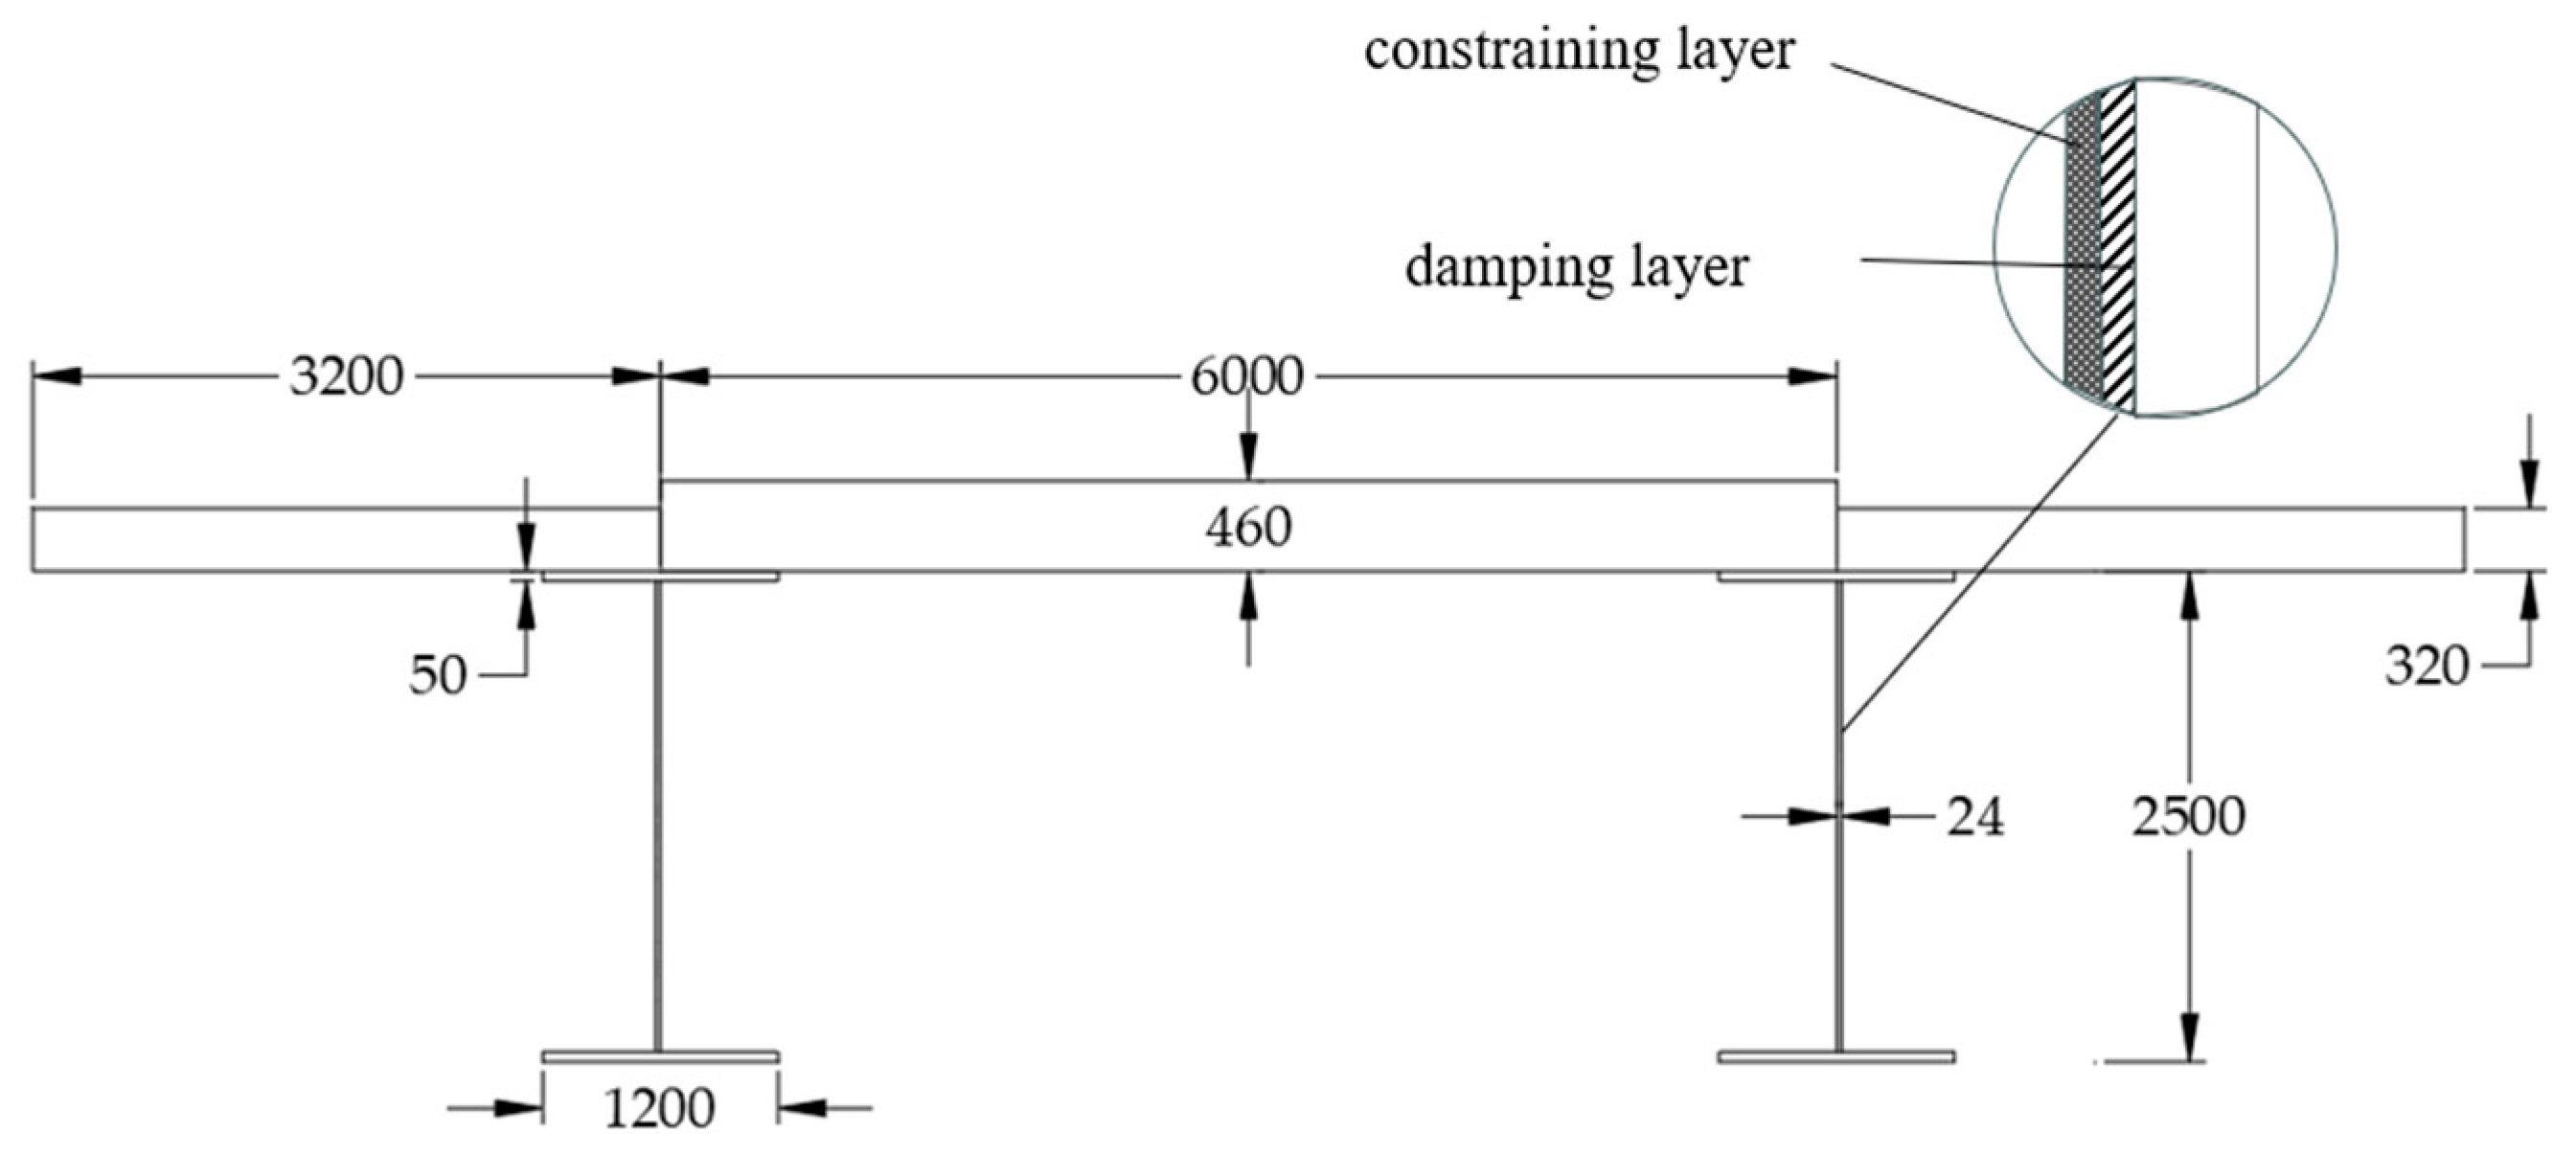
The structure-borne noise generated from a steel−concrete composite bridge induced by a running train is close to the rolling noise. Hence, it is effective to reduce the vibrations of composite bridges to relieve the adverse impacts of noise. The stringer of the simply supported bridge was an H-shaped steel girder with a height of 2.5 m. The top flanges of the girders were fixed to the bridge deck using shear studs. The thickness values of the concrete deck ranged between 0.2 and 0.487 m. The dimensions of the bridge cross-section are shown in Figure 4.
A four-node shell element considering transverse shear deformation was employed to establish the FEM model of the bridge. It was assumed that no slippage occurred between the top flange of the stringer and the concrete deck. Therefore, the nodes of the top flange shared identical displacements with the corresponding nodes of the deck. The nonuniform deck was equivalent to a uniform deck according to the principle of equal moment of inertia and area of the section to simplify the procedure for bridge modeling. If the bridge is damaged, the propagated wave will be reflected in the crack and the dispersion characteristics of the bridge will be changed [36]. In this situation, WFEM can not be used to solve this kind of issue. Therefore, it is assumed that the bridge is undamaged. The equivalent thickness of the wing deck was 0.32 m, and that of the middle deck was 0.46 m. The masses of the ballast and ancillary facilities were added to the deck elements. The material parameters of the bridge components are listed in Table 1.
In addition, the ballast dual-track line had a spacing of 4.6 m. The rail was modeled using a beam element. The track bed and rail pad were equivalent to a series of parallel springs supporting the rail. Table 2 lists the ballast–track parameters.
The element size determined by the cutoff frequency of the numerical simulation was required not to exceed 1/6 of the minimum wavelength. The flexural wave velocity cb in the plate is expressed as follows:
c b = E h 2 12 ρ ( 1 μ 2 ) 0.25 ω
where ρ is the material density, E is Young’s modulus, μ is Poisson’s ratio, ω is the angular frequency, and h is the plate thickness.
A higher frequency results in a larger number of elements and higher computational cost. If the cutoff frequency is the upper frequency of the 1/3 octave band with a center frequency of 1600 Hz (that is 1778 Hz), the minimum wavelength of the bending wave was 0.672 m, according to Equation (31). Therefore, the maximum element size of the FEM model should not exceed 0.112 m. The constructed WFEM model of the composite bridge is illustrated in Figure 5. The numbers of elements and nodes in the WFEM model of the bridge are 370 and 390, respectively.

3.2. Dispersion Characteristics of Bridge

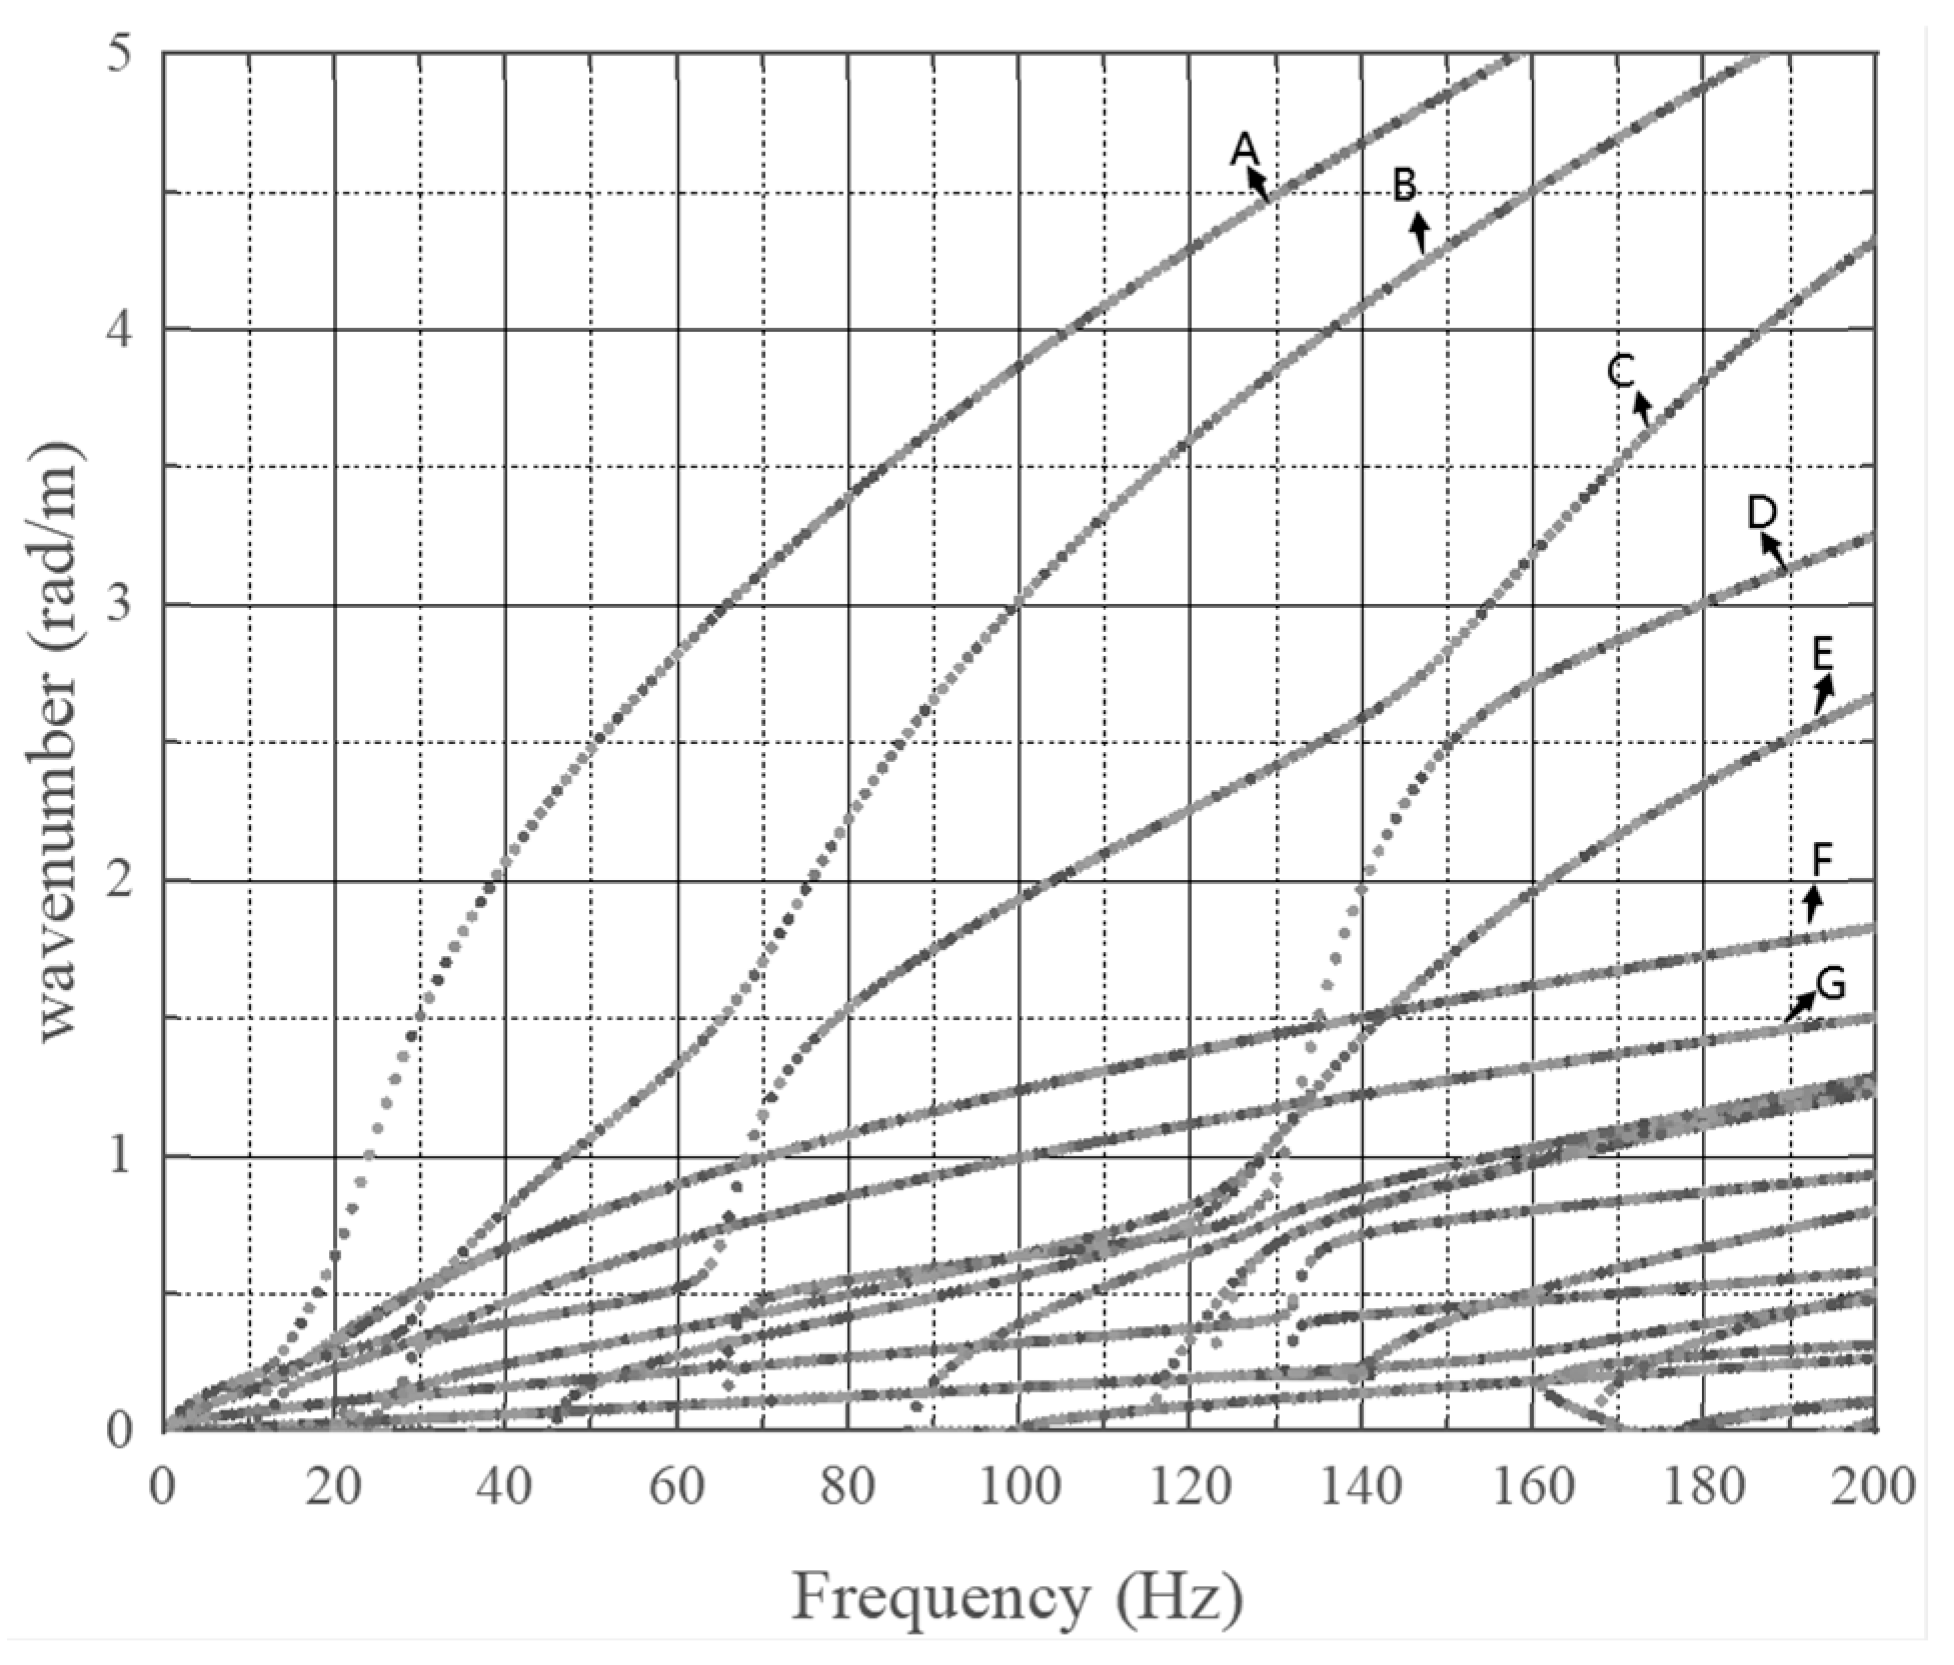
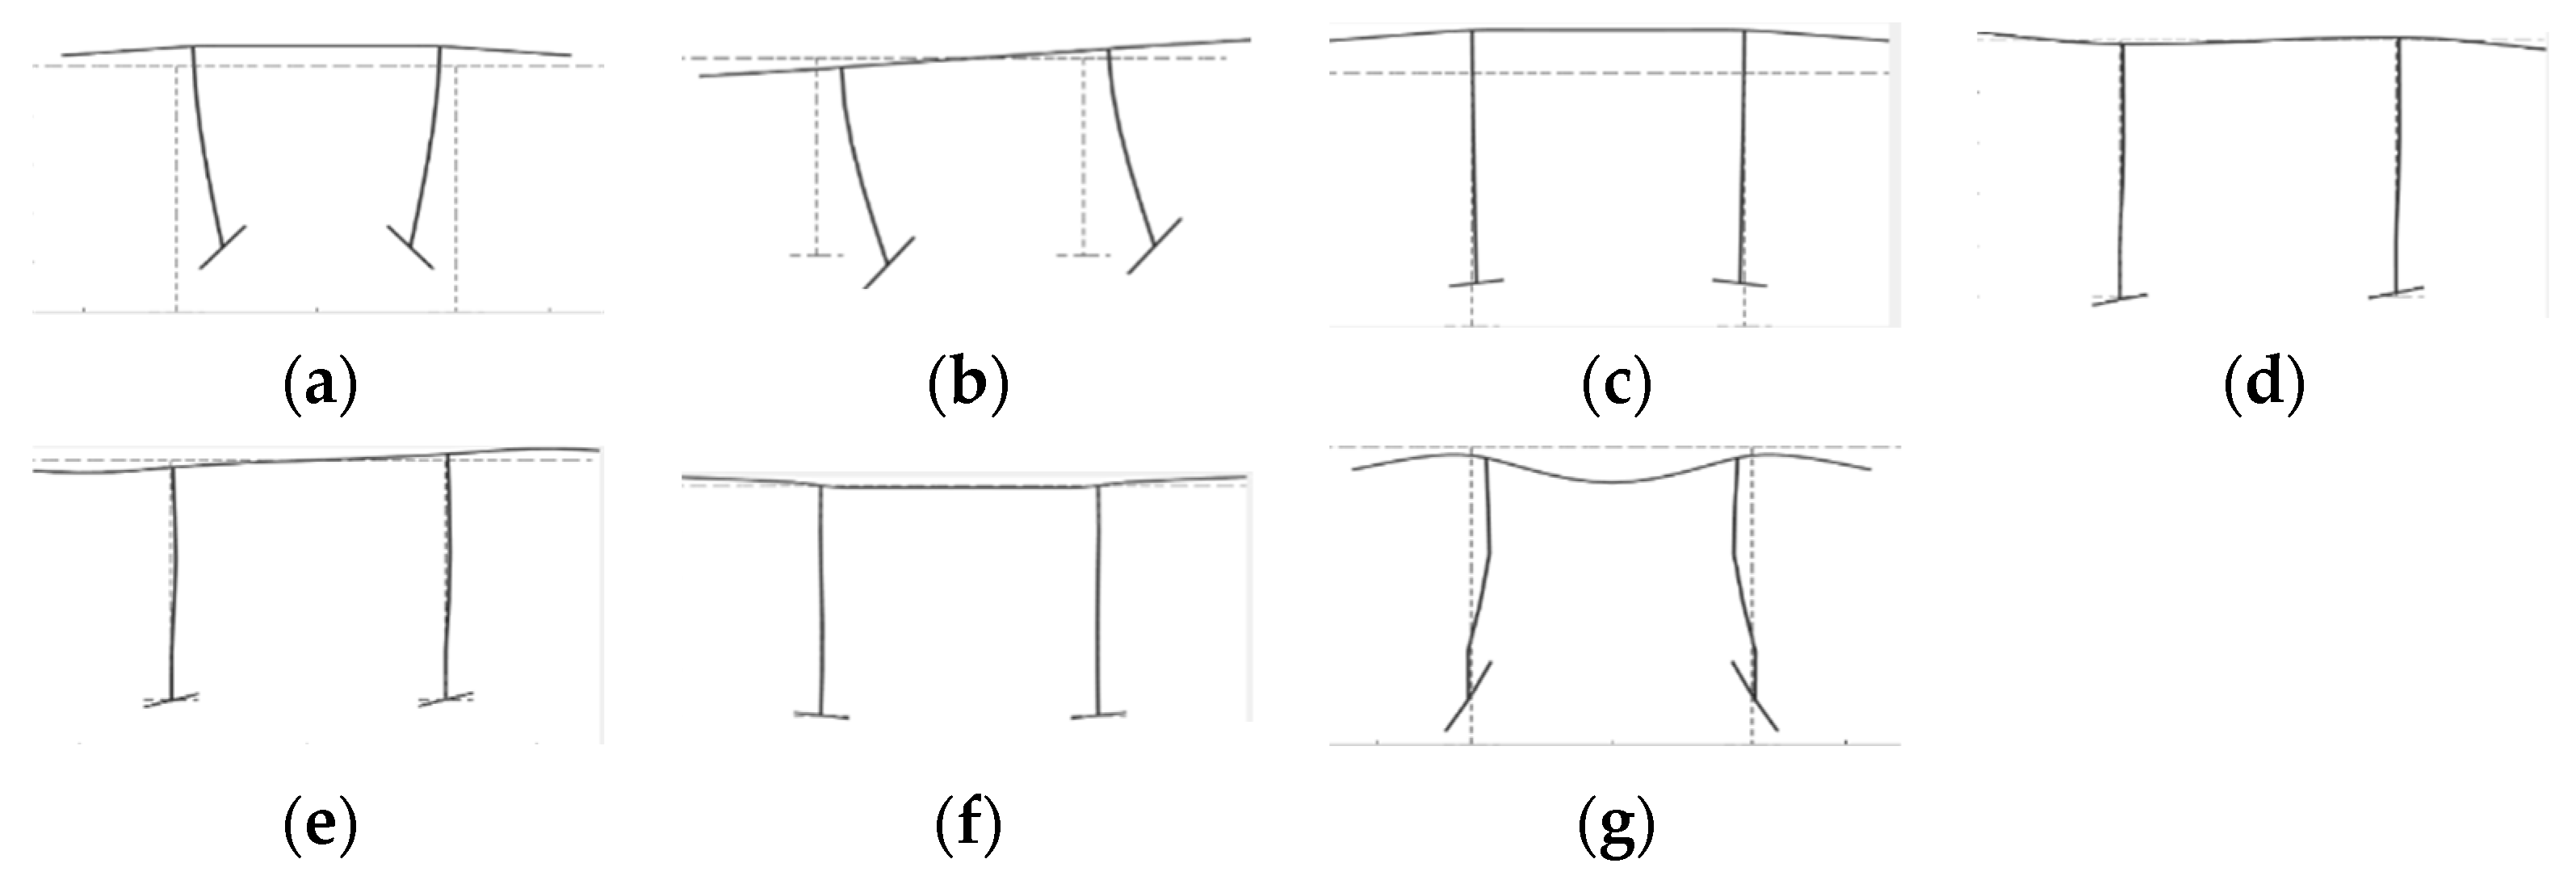
Figure 6 shows the dispersion curves of the bridge below 200 Hz, as the curves at higher frequencies were numerous to be identified. The wave modes represented by each dispersion curve were plotted, and several typical wave modes denoted A–G were identified (Figure 7). The deformation of the cross-section in the mode at 25 Hz was a combination of the vertical bending and torsional motions of the deck and stringers. The wavenumber was small in the low-frequency band; thus, the wavelength was large. As the frequency increased, higher-order modal patterns of these modes appeared, which were modes of fundamental shapes with shorter wavelengths. In the high- and medium-frequency bands, the wavelength gradually decreased and the number of waves in the bridge increased; thus, the medium- and high-frequency wave modes were significantly denser than the low-frequency wave modes. The shapes were dominated by the deformation of the cross-section.

3.3. Model of Bridge with CLD

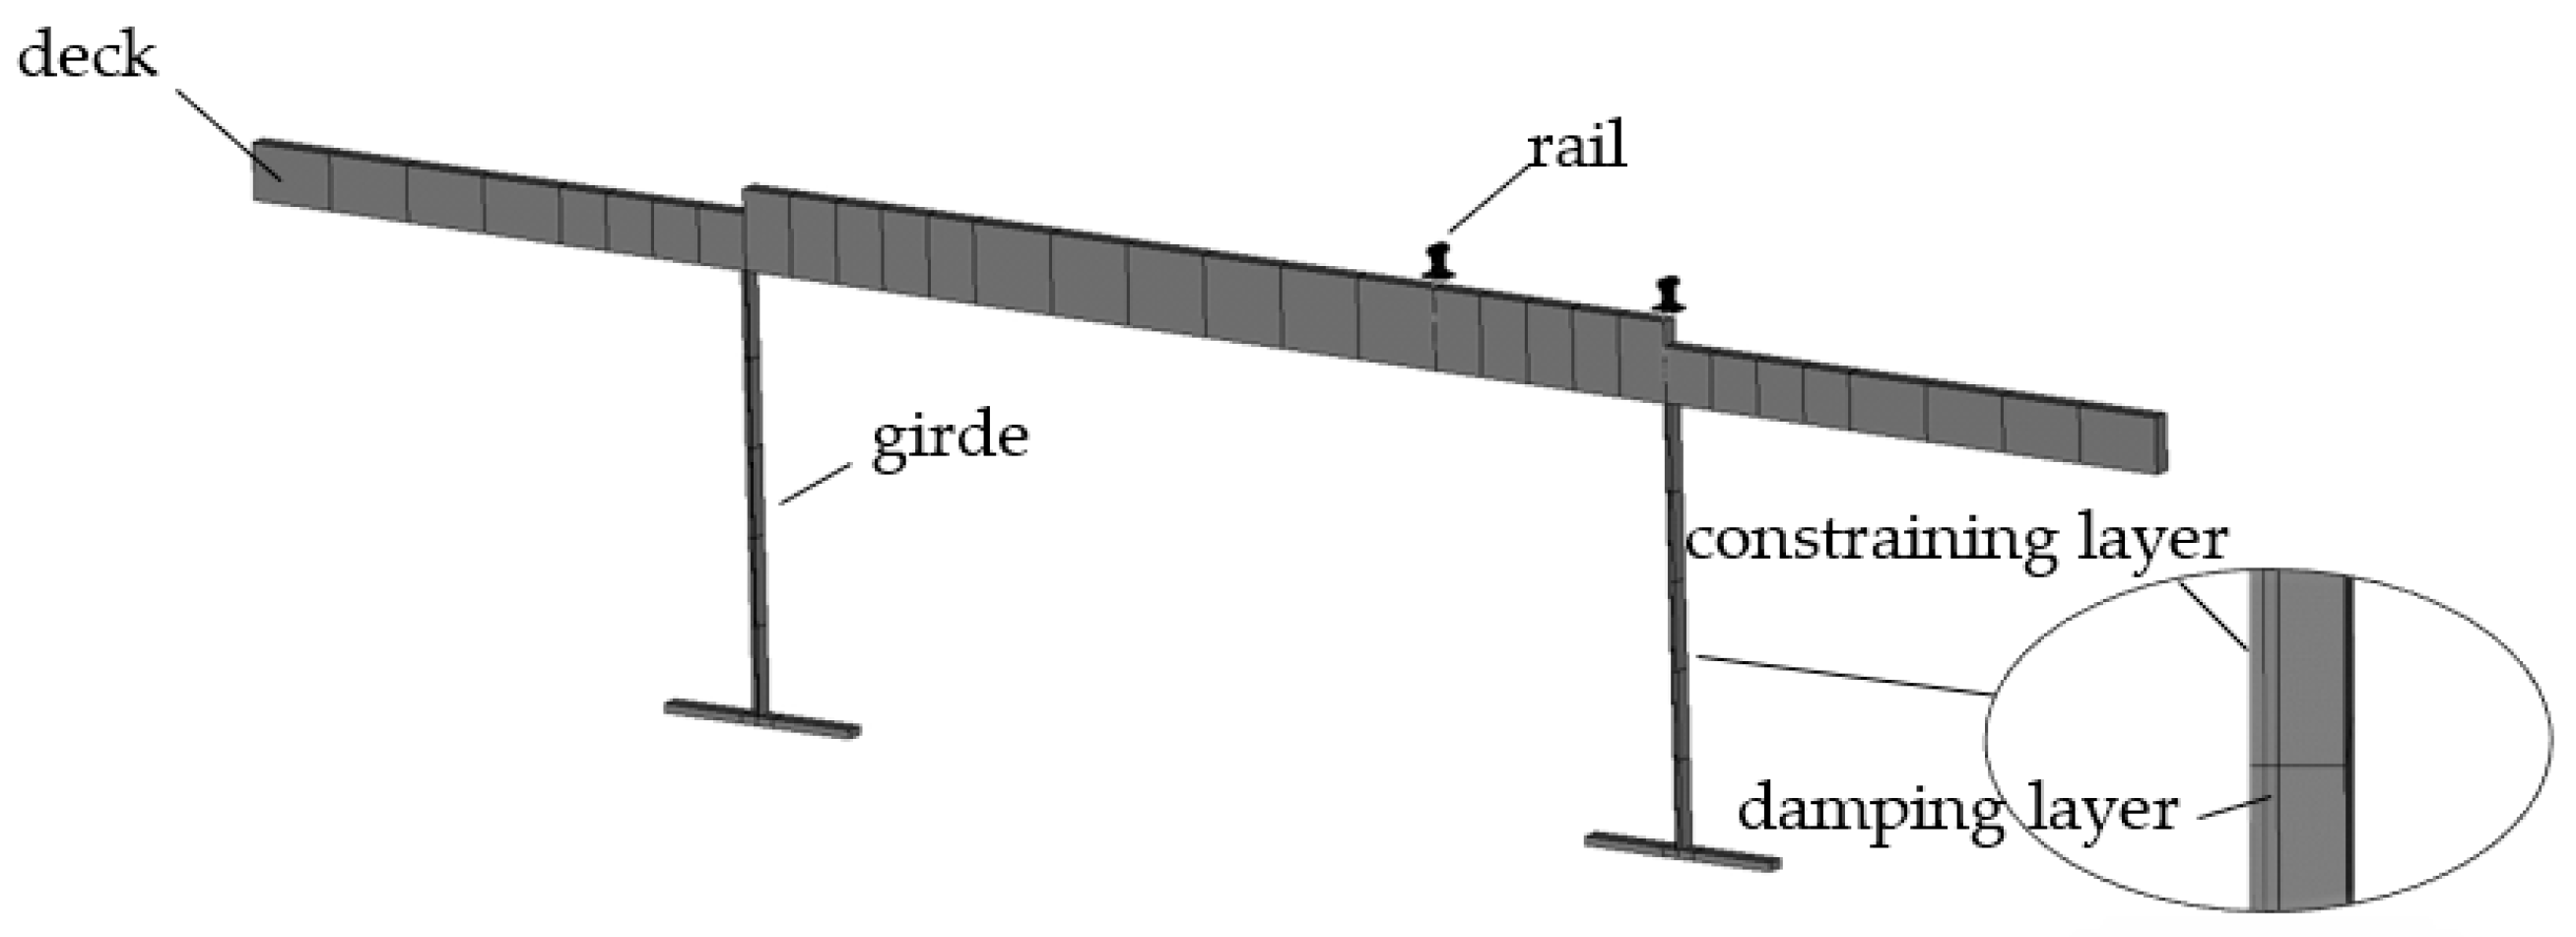
The noise emanating from the webs of the composite bridge was dominant in the medium- and high-frequency bands; therefore, the best effect could be achieved by installing the CLD on the webs, as shown in Figure 8. Because the CLD attached to the steel beam served in the natural environment, a viscoelastic material whose maximum loss factor occurred at normal atmospheric temperatures was adopted to mitigate the vibration of the bridge in service. When establishing the vibration analysis model of the bridge damped with CLD, the material parameters of the viscoelastic damping material at 20 °C were used. The CLD parameters are listed in Table 3. The frequency-dependent material shear modulus and loss factor of the viscoelastic layer are shown in Figure 9.
The constraining layer was simulated using a four-node shell element, and the damping layer was simulated using a spatial eight-node solid element, where the complex damping model was adopted to simulate the damping of the viscoelastic core layer [37]. The model for predicting the vibration of the steel-concrete composite bridge damped with CLD was built using the WFE method, as shown in Figure 10.

3.4. Model Validation

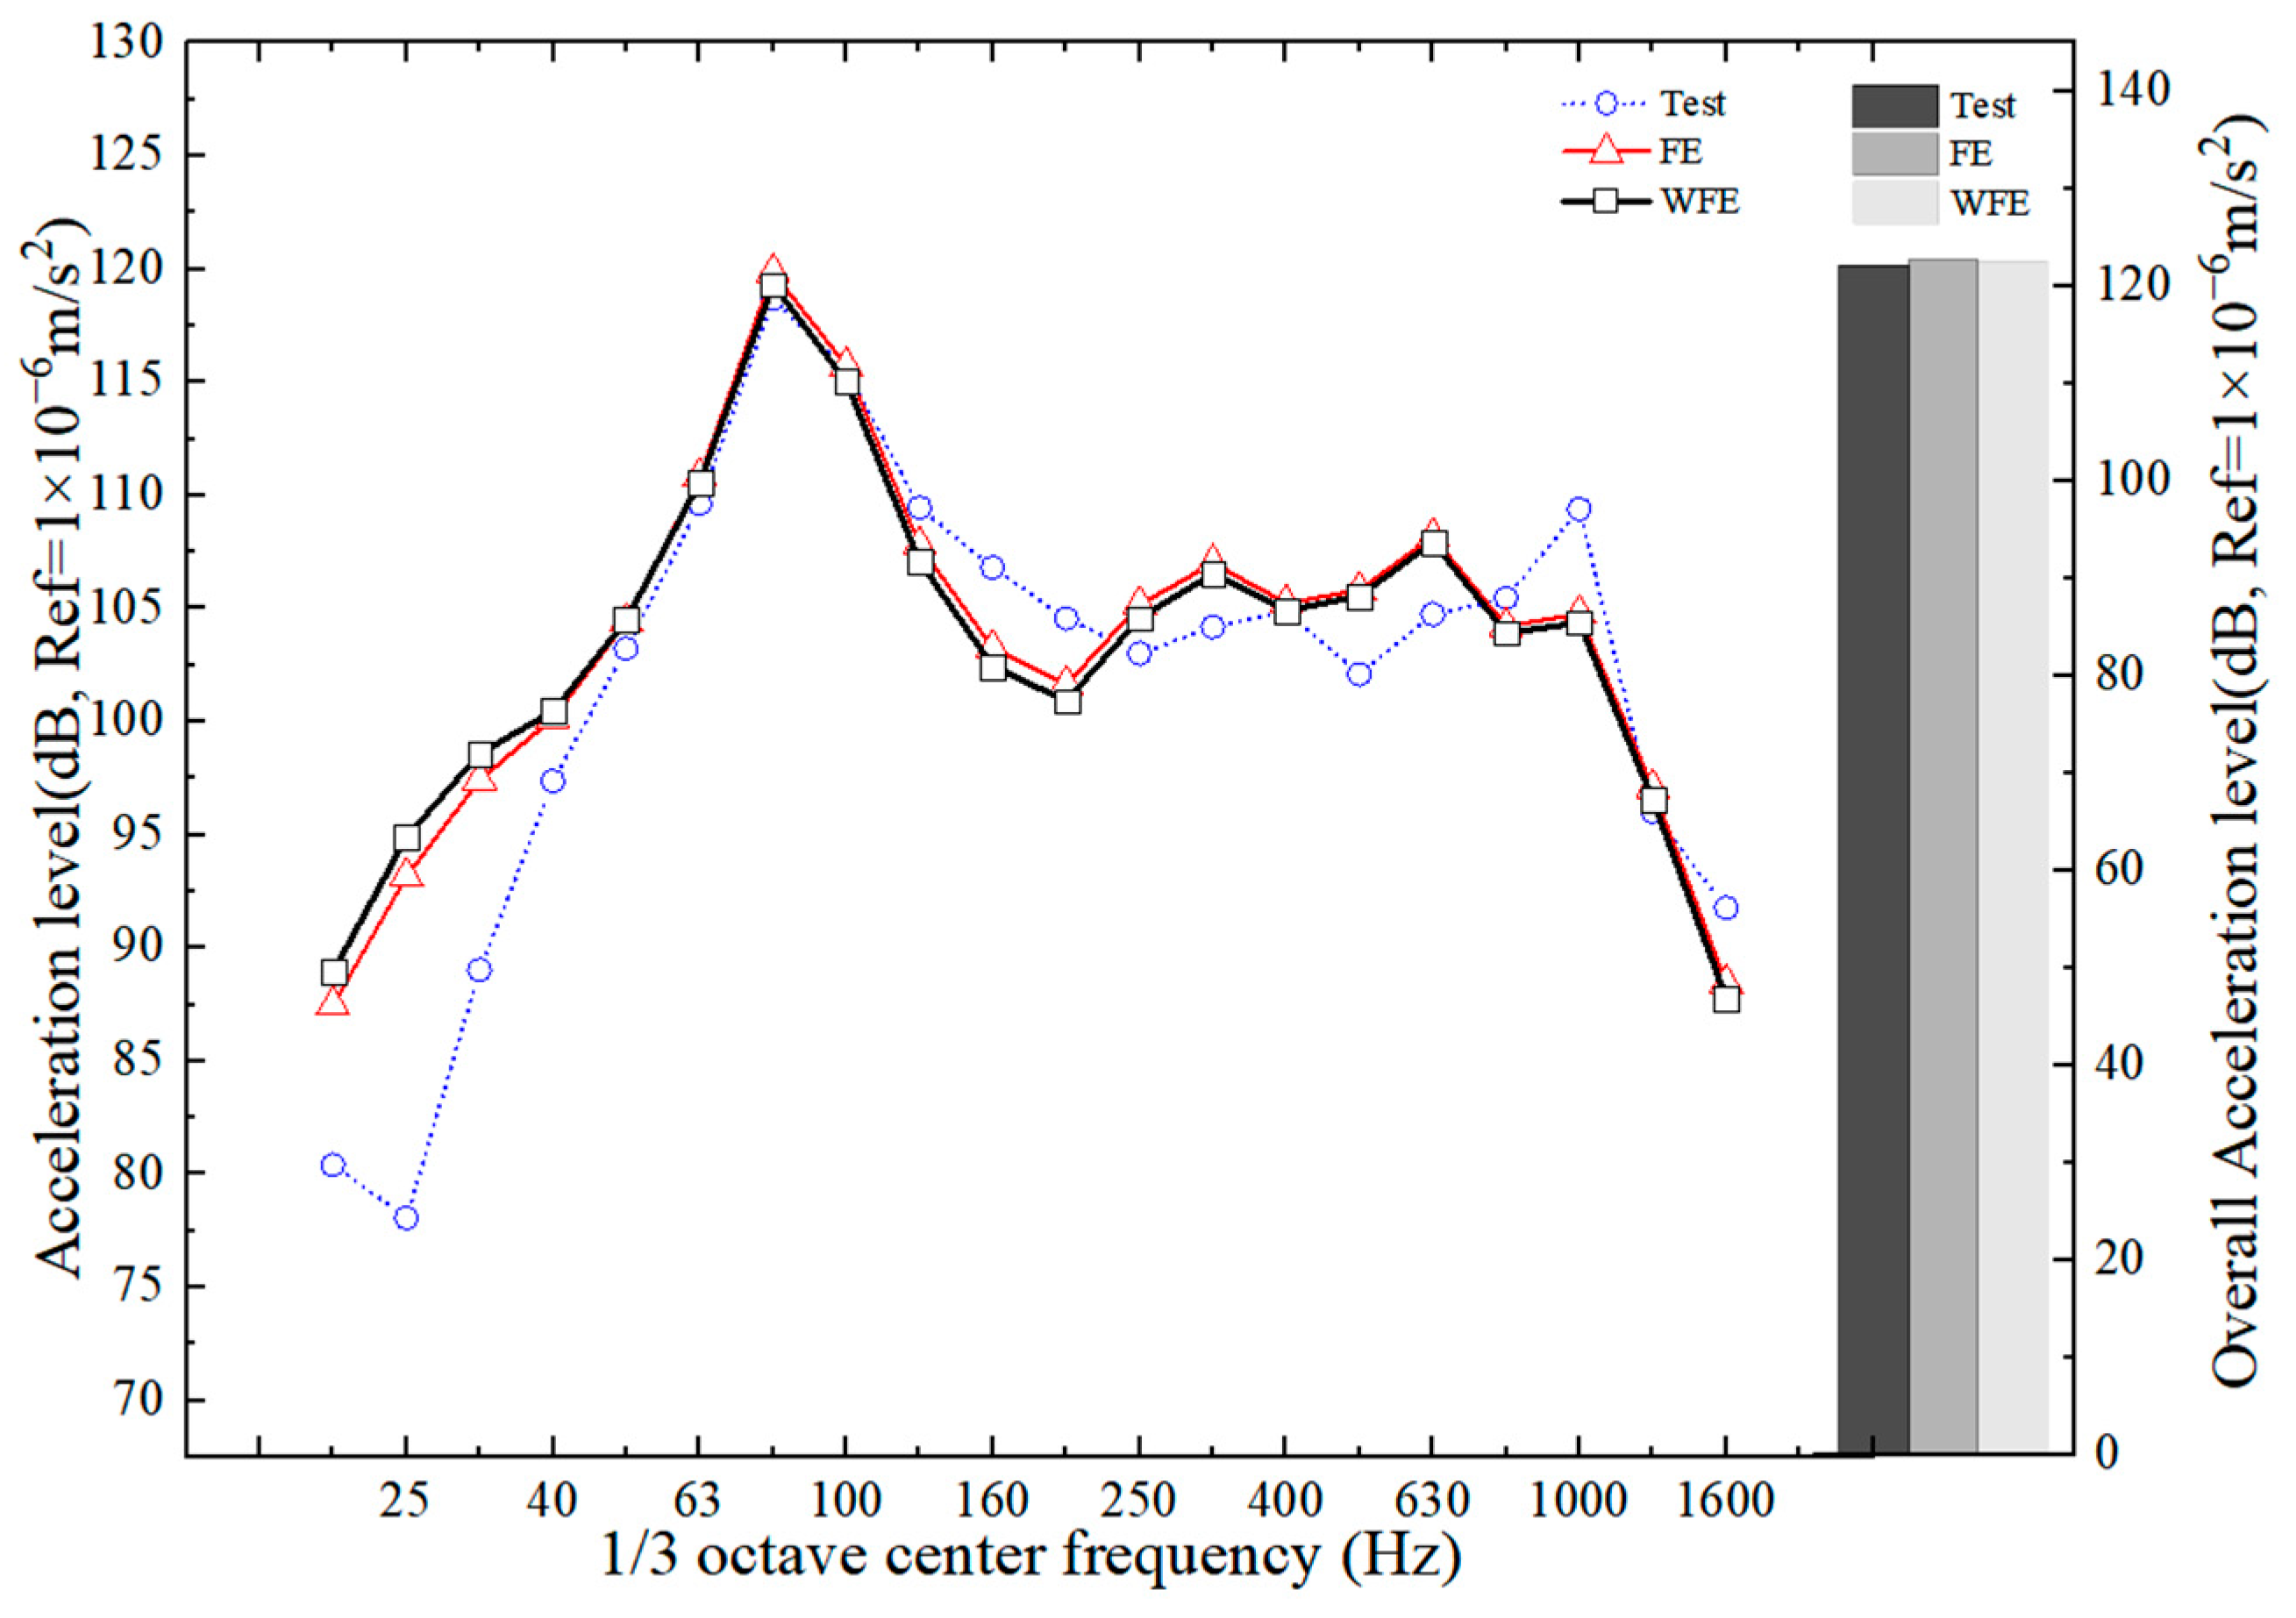
The wheel–rail interaction forces determined using the receptance method described in the literature [33] were exerted on the rail of the model. The train speed was 200 km/h, and a measured track irregularity was adopted. In this study, the dynamic response of the bridge excited by multiple wheelsets was computed by employing the superposition principle. In Figure 11, the acceleration level of the bottom flange is presented. The measured acceleration of a bridge analyzed in the literature [33] was used to verify the established WFEM model. The results obtained using the WFEM and conventional FEM were consistent with the measured results, except for the discrepancy in several frequency bands. The dominant frequencies of the acceleration of the bottom flange ranged from 63 to 1000 Hz, and the peak acceleration was reached at 80 Hz.
Table 4 lists the calculation costs of the two methods for the acceleration of the composite bridge induced by a train obtained using the same computer. The WFEM model has a significant advantage over the conventional FEM model in terms of memory space and computational efficiency.
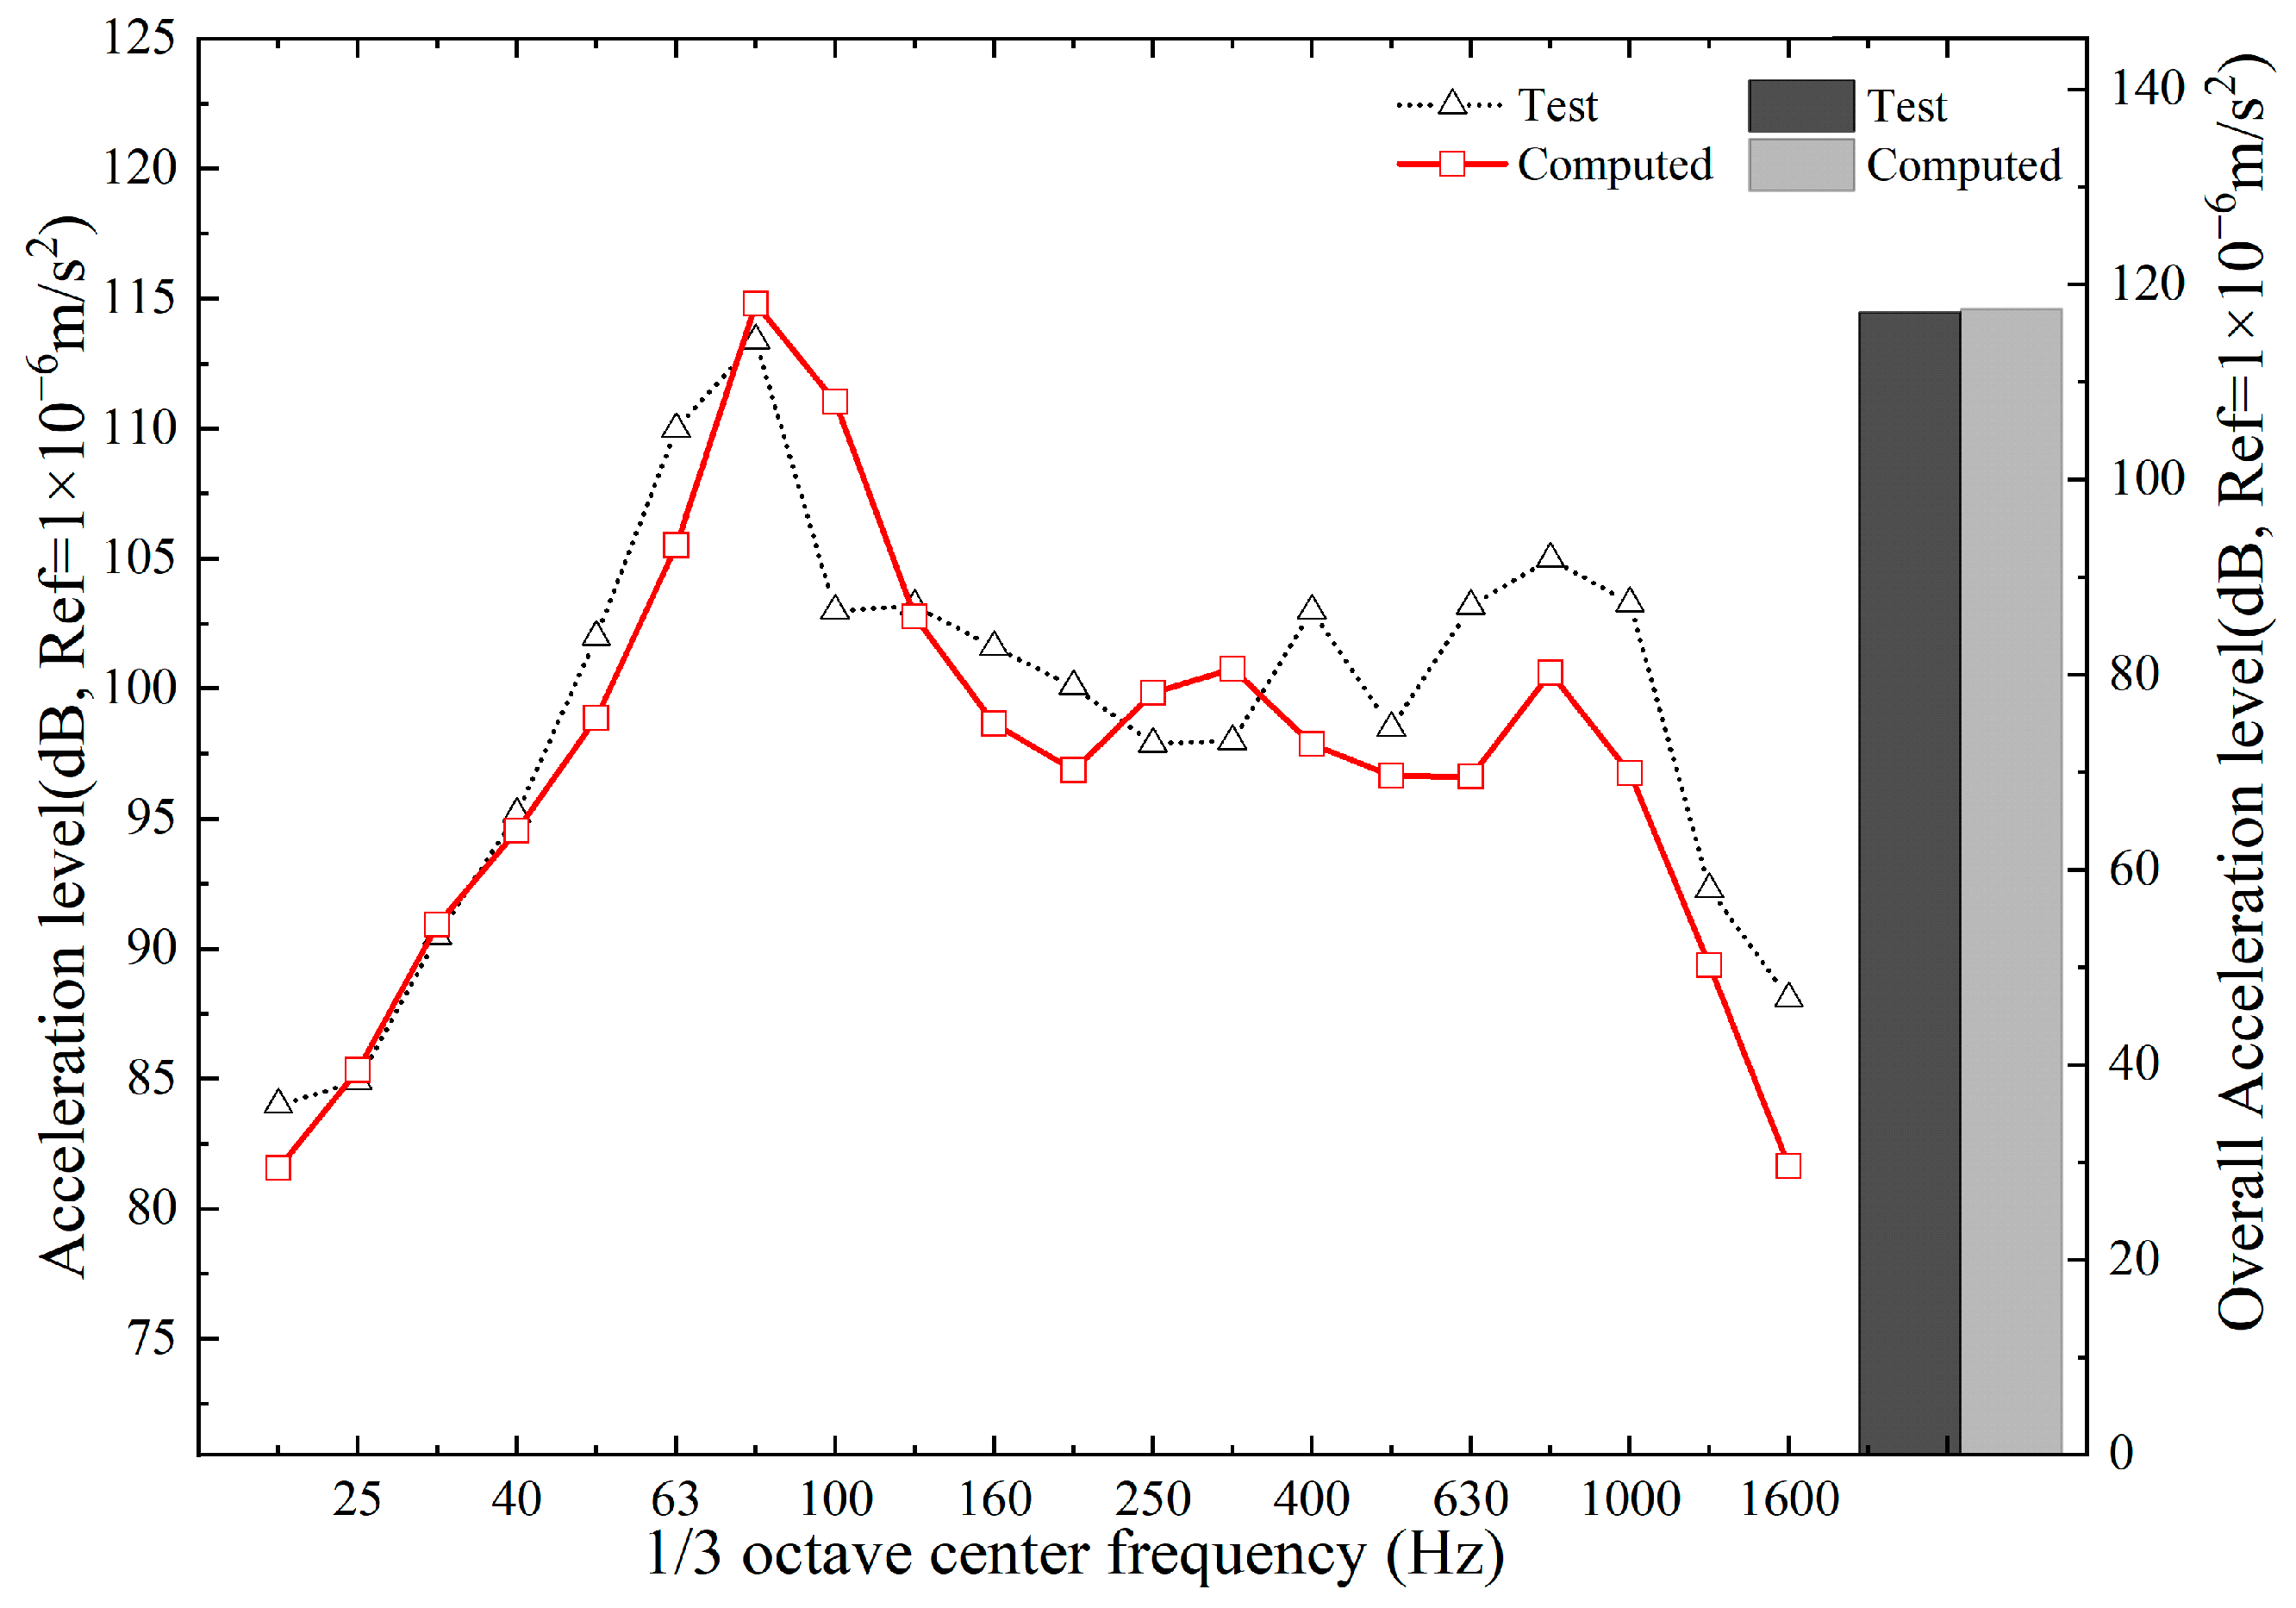
The measured acceleration levels of the bridge after the webs were covered by CLD are shown in Figure 12. The calculation results obtained using the WFEM model are consistent with those measured in most frequency bands.
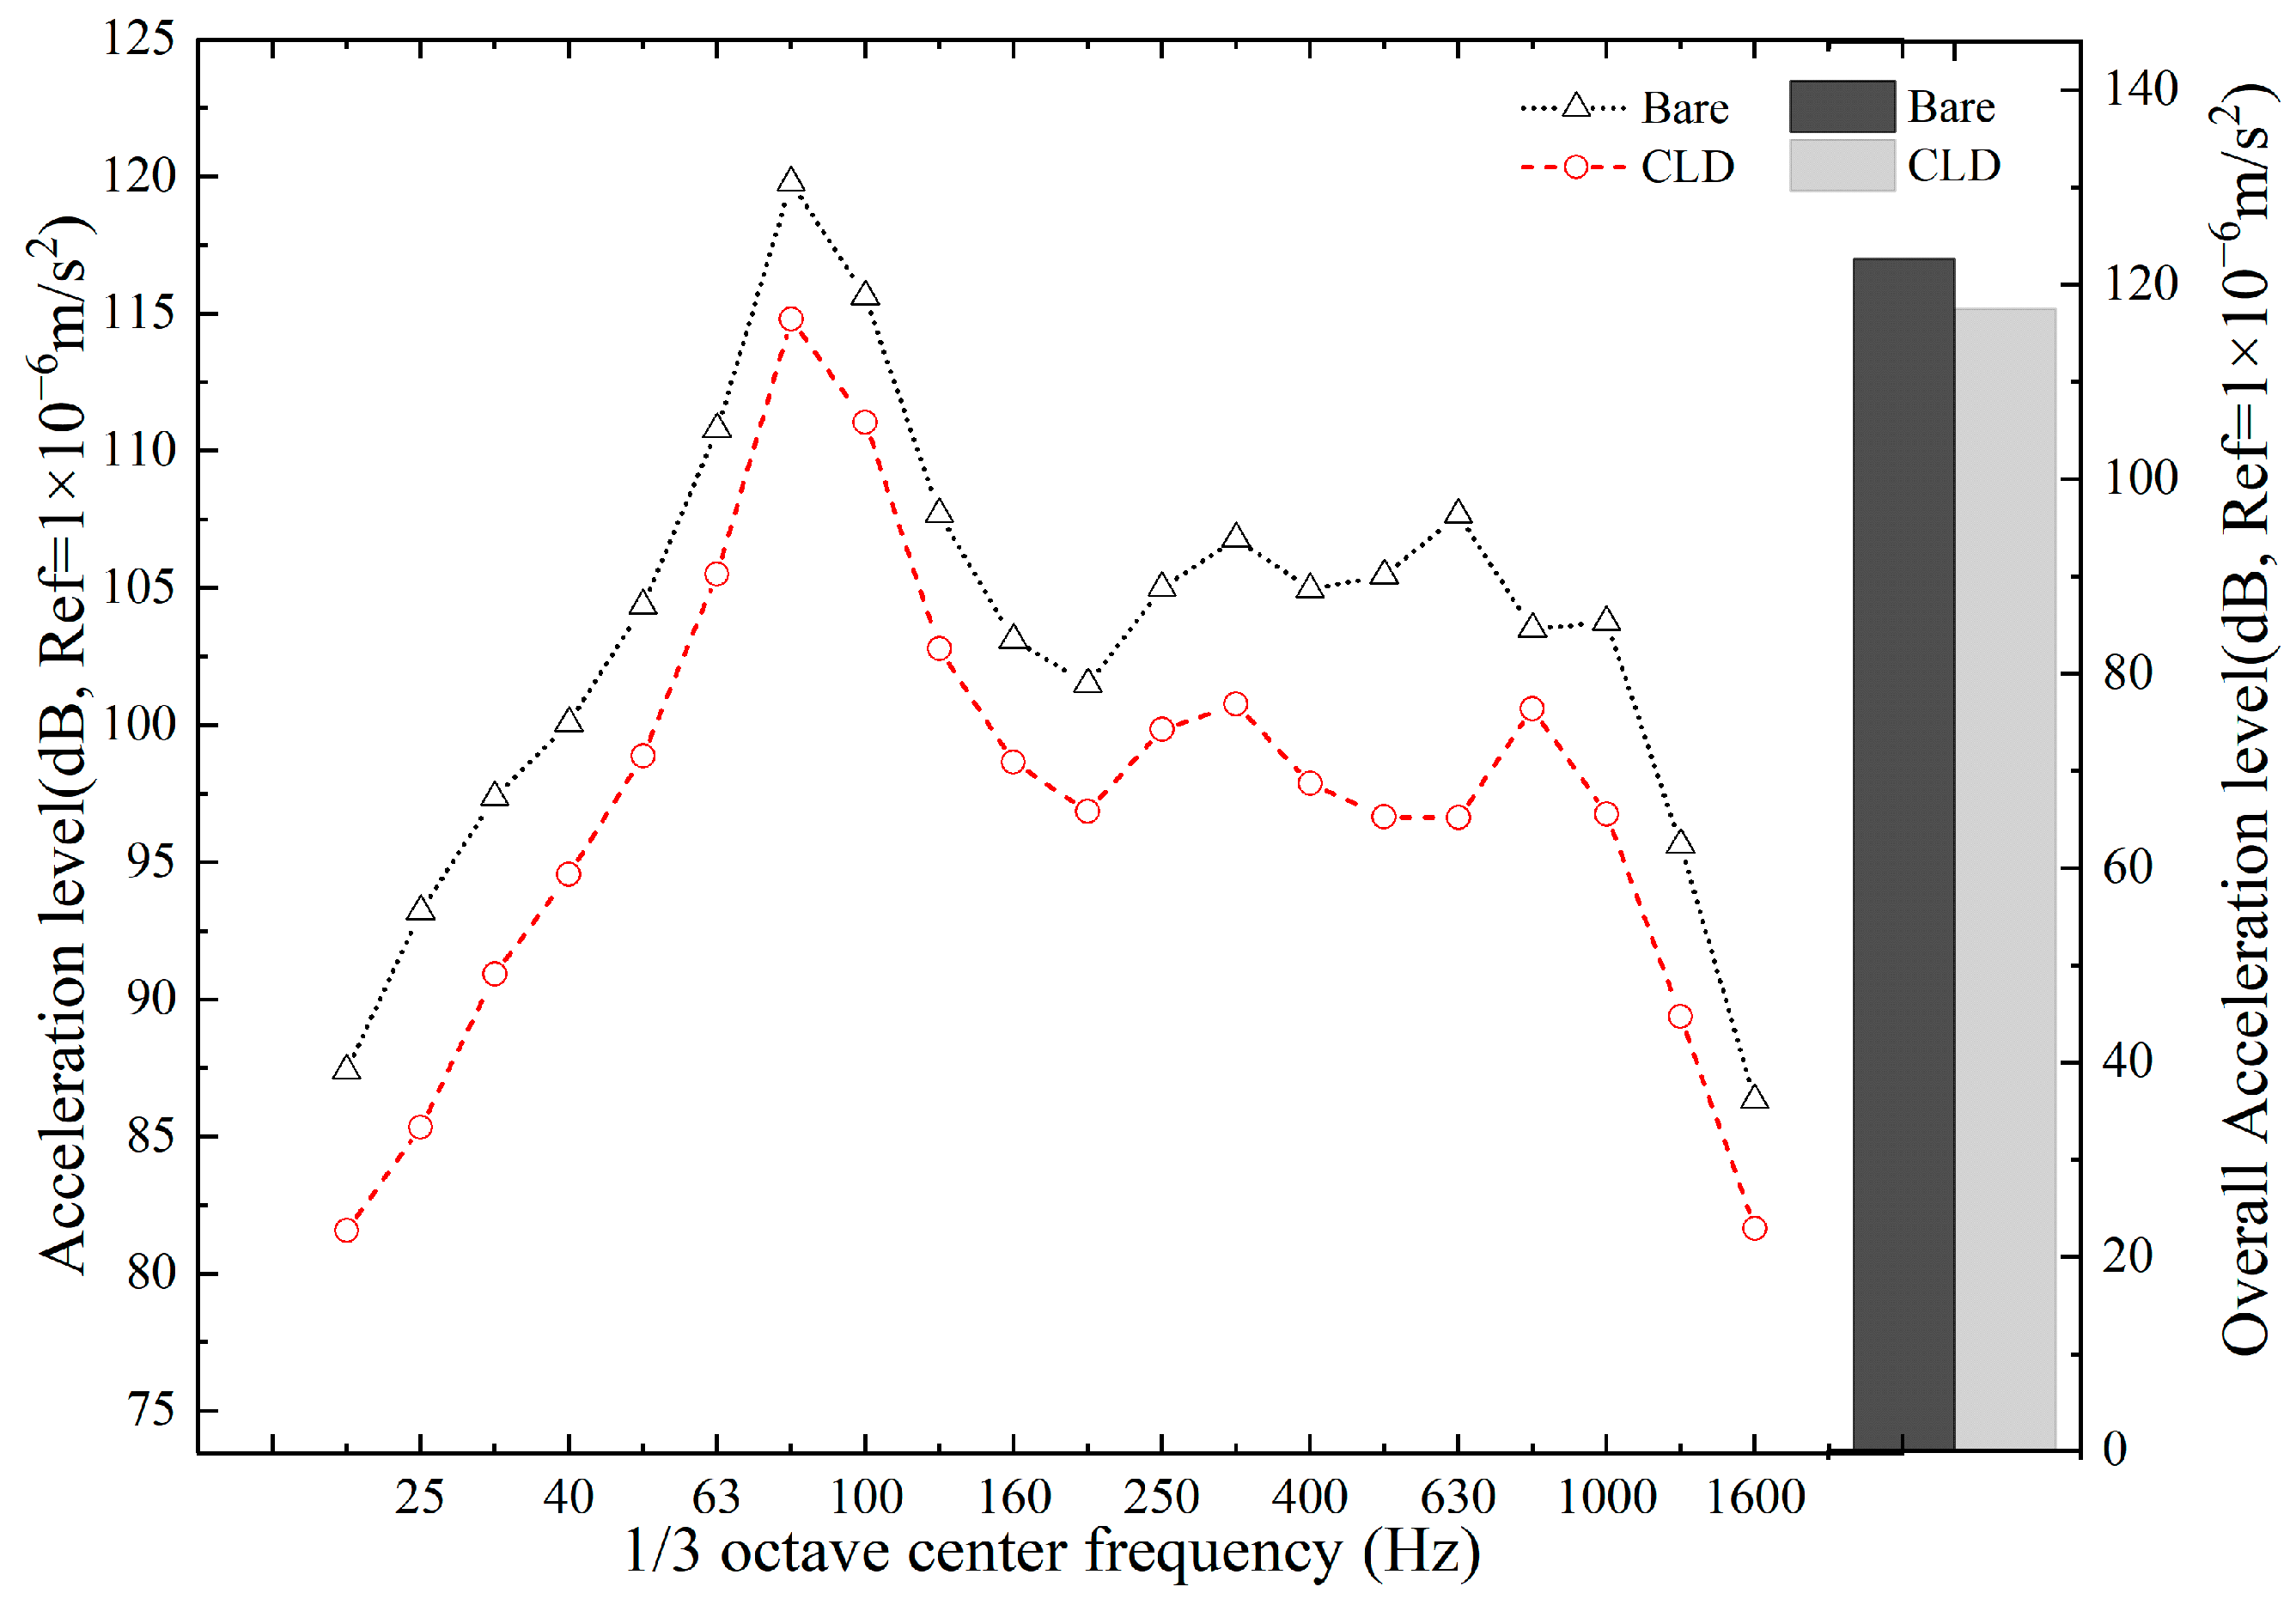
The acceleration levels before and after subjecting the webs of the bridge to CLD are shown in Figure 13. Treatment with CLD reduces vibration in all frequency bands, indicating that CLD effectively decreases the vibration of composite bridges.

4. Parametric Study

The vibration-reducing effect of the CLD depends on its geometric and material parameters. Understanding the effect of these parameters on the vibration reduction in the structure is crucial for improving the mitigation capacity of CLD. Therefore, the effects of the laying area, material properties, and thickness of the CLD attached to the web on the vibration reduction in the bridge were investigated using the WFEM-based model.

4.1. Laying Area of CLD on Web

The additional damping of a bridge is related to the area and location of the CLD installation. In this study, vibrations at the center of the bridge flange when the web of the bridge was subjected to CLD at area ratios of 0%, 50%, 80%, and 100% were analyzed. The material parameters of the damping layer at 20 °C (Figure 9) were selected. The thickness of the constraining and damping layers was 2 mm. The CLD installation locations are shown in Figure 14.
The simulation models of the above cases were established. The vibration response of the flange is shown in Figure 15, where Bare indicates that the web of the bridge is not covered by the CLD.
CLD installation can significantly mitigate bridge vibrations. As the installation area increased, the vibration acceleration of the bridge flange decreased over the entire analysis frequency range. The vibration acceleration level was reduced by approximately 5–10 dB after the bridge webs were fully covered with CLD. Even with an installation area ratio of only 50%, a reduction of 3 dB could be achieved, and the reduction in the frequency range of 100–250 Hz reached approximately 5 dB. When the installation area of the CLD reached 80% of the web area, the acceleration level of the bridge flange decreased by 4–8 dB. The laying area of a CLD depends on the requirements for vibration reduction. An additional benefit is that the weight of the covering CLD is sufficiently light compared to the self-weight of the bridge, without increasing the structural stress and deflection.

4.2. Shear Modulus of Damping Layer

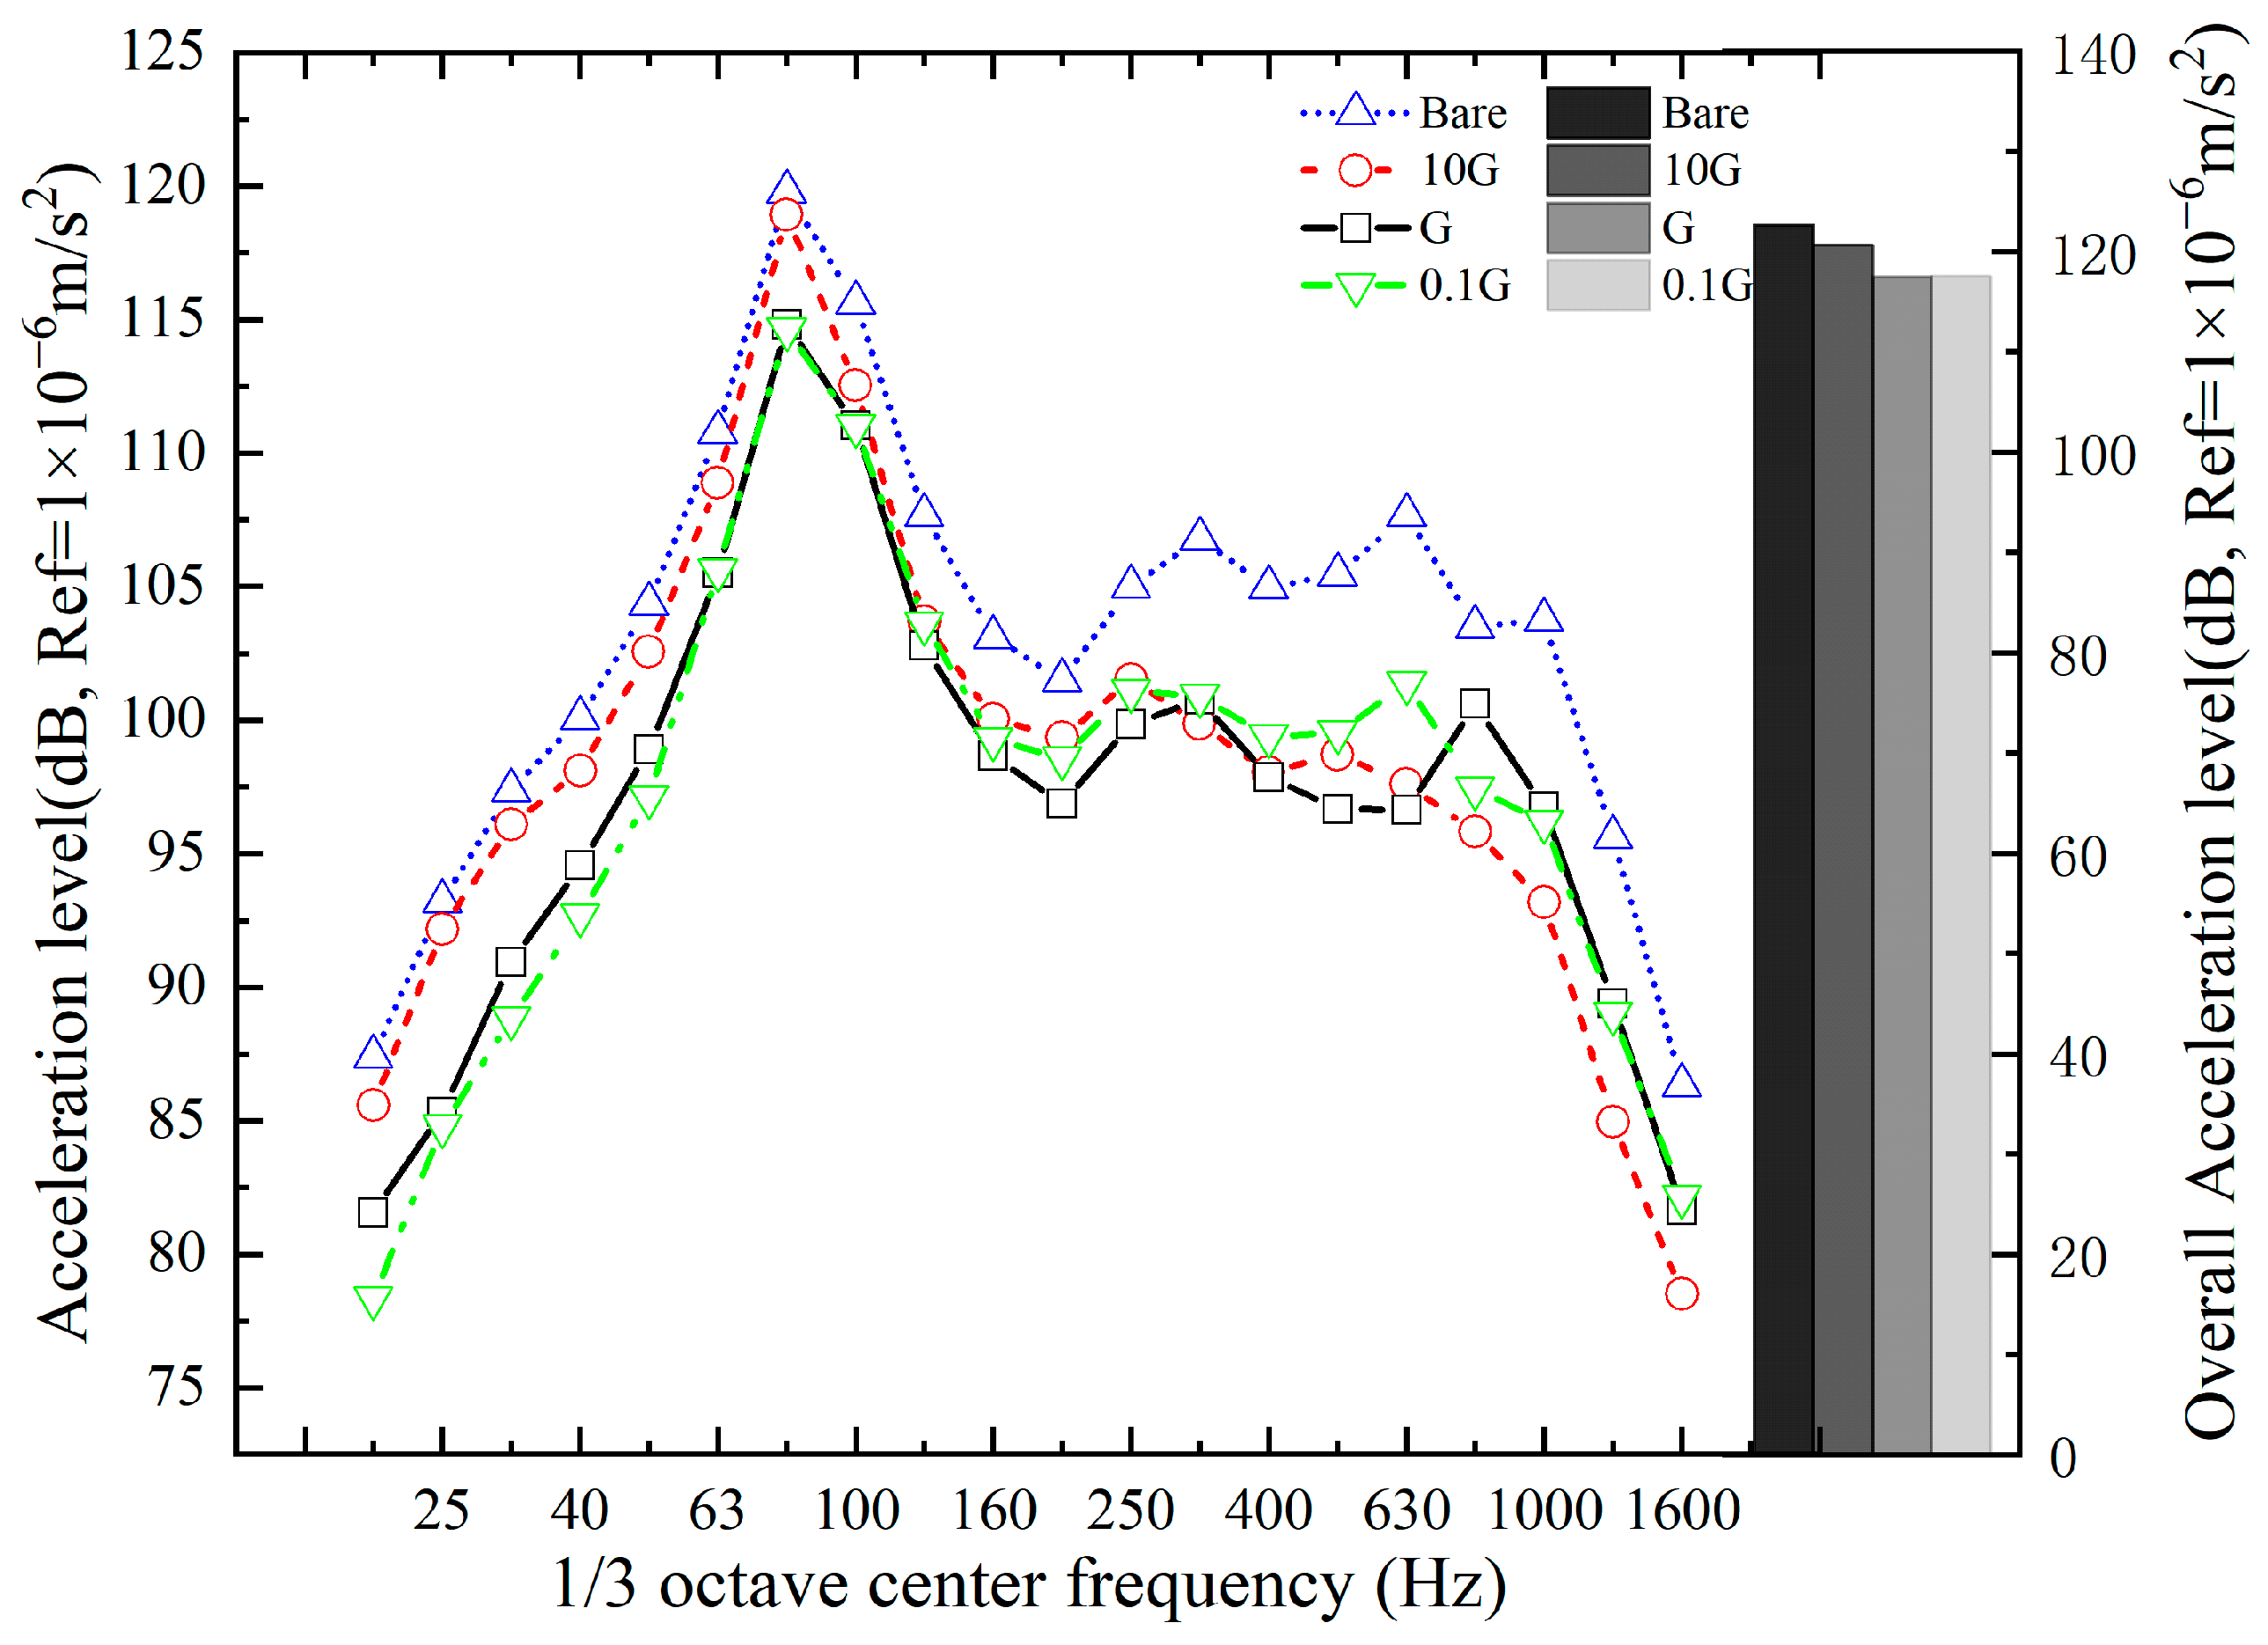
When the web of a bridge damped with CLD is subjected to bending vibration, the viscoelastic material of the damping layer undergoes shear deformation owing to the confinement effect of the constraining layer and consumes a large amount of vibration energy. The shear modulus of the damping layer is directly related to the dissipated energy and is thus significant for the vibration reduction effect of the CLD. Therefore, the effect of the shear modulus of the damping layer on vibrations is presented in this section. It was assumed that a web with an area of 80% was covered by the CLD, as defined in Section 4.1.
As shown in Figure 16, the mitigation effect varied significantly with the shear modulus of the damping layer. Taking G = 22.4 MPa as the reference shear modulus, the CLD with a viscoelastic core of a lower shear modulus achieved greater mitigation for the bridge in the frequency range below 63 Hz. When a damping layer with a shear modulus of 0.1 G was used, the acceleration level of the bridge flange could be reduced by approximately 10 dB. When the shear modulus of the viscoelastic layer was 10 G, the reduction effect of the bridge vibration was insignificant in the low-frequency range below 100 Hz. As the frequency increased, the CLD with a damping layer having a higher shear modulus began to achieve a larger mitigation effect on the bridge. Overall, a CLD with a damping layer having a high shear modulus is more effective than that having a low shear modulus in the high-frequency range. However, an excessive shear modulus of the viscoelastic core results in a small shear deformation in the damping layer and poor energy dissipation in the low-frequency range. Therefore, the shear modulus of the damping layer should be determined based on the dominant frequency range of the vibrations of structures.

4.3. Thickness of Damping Layer

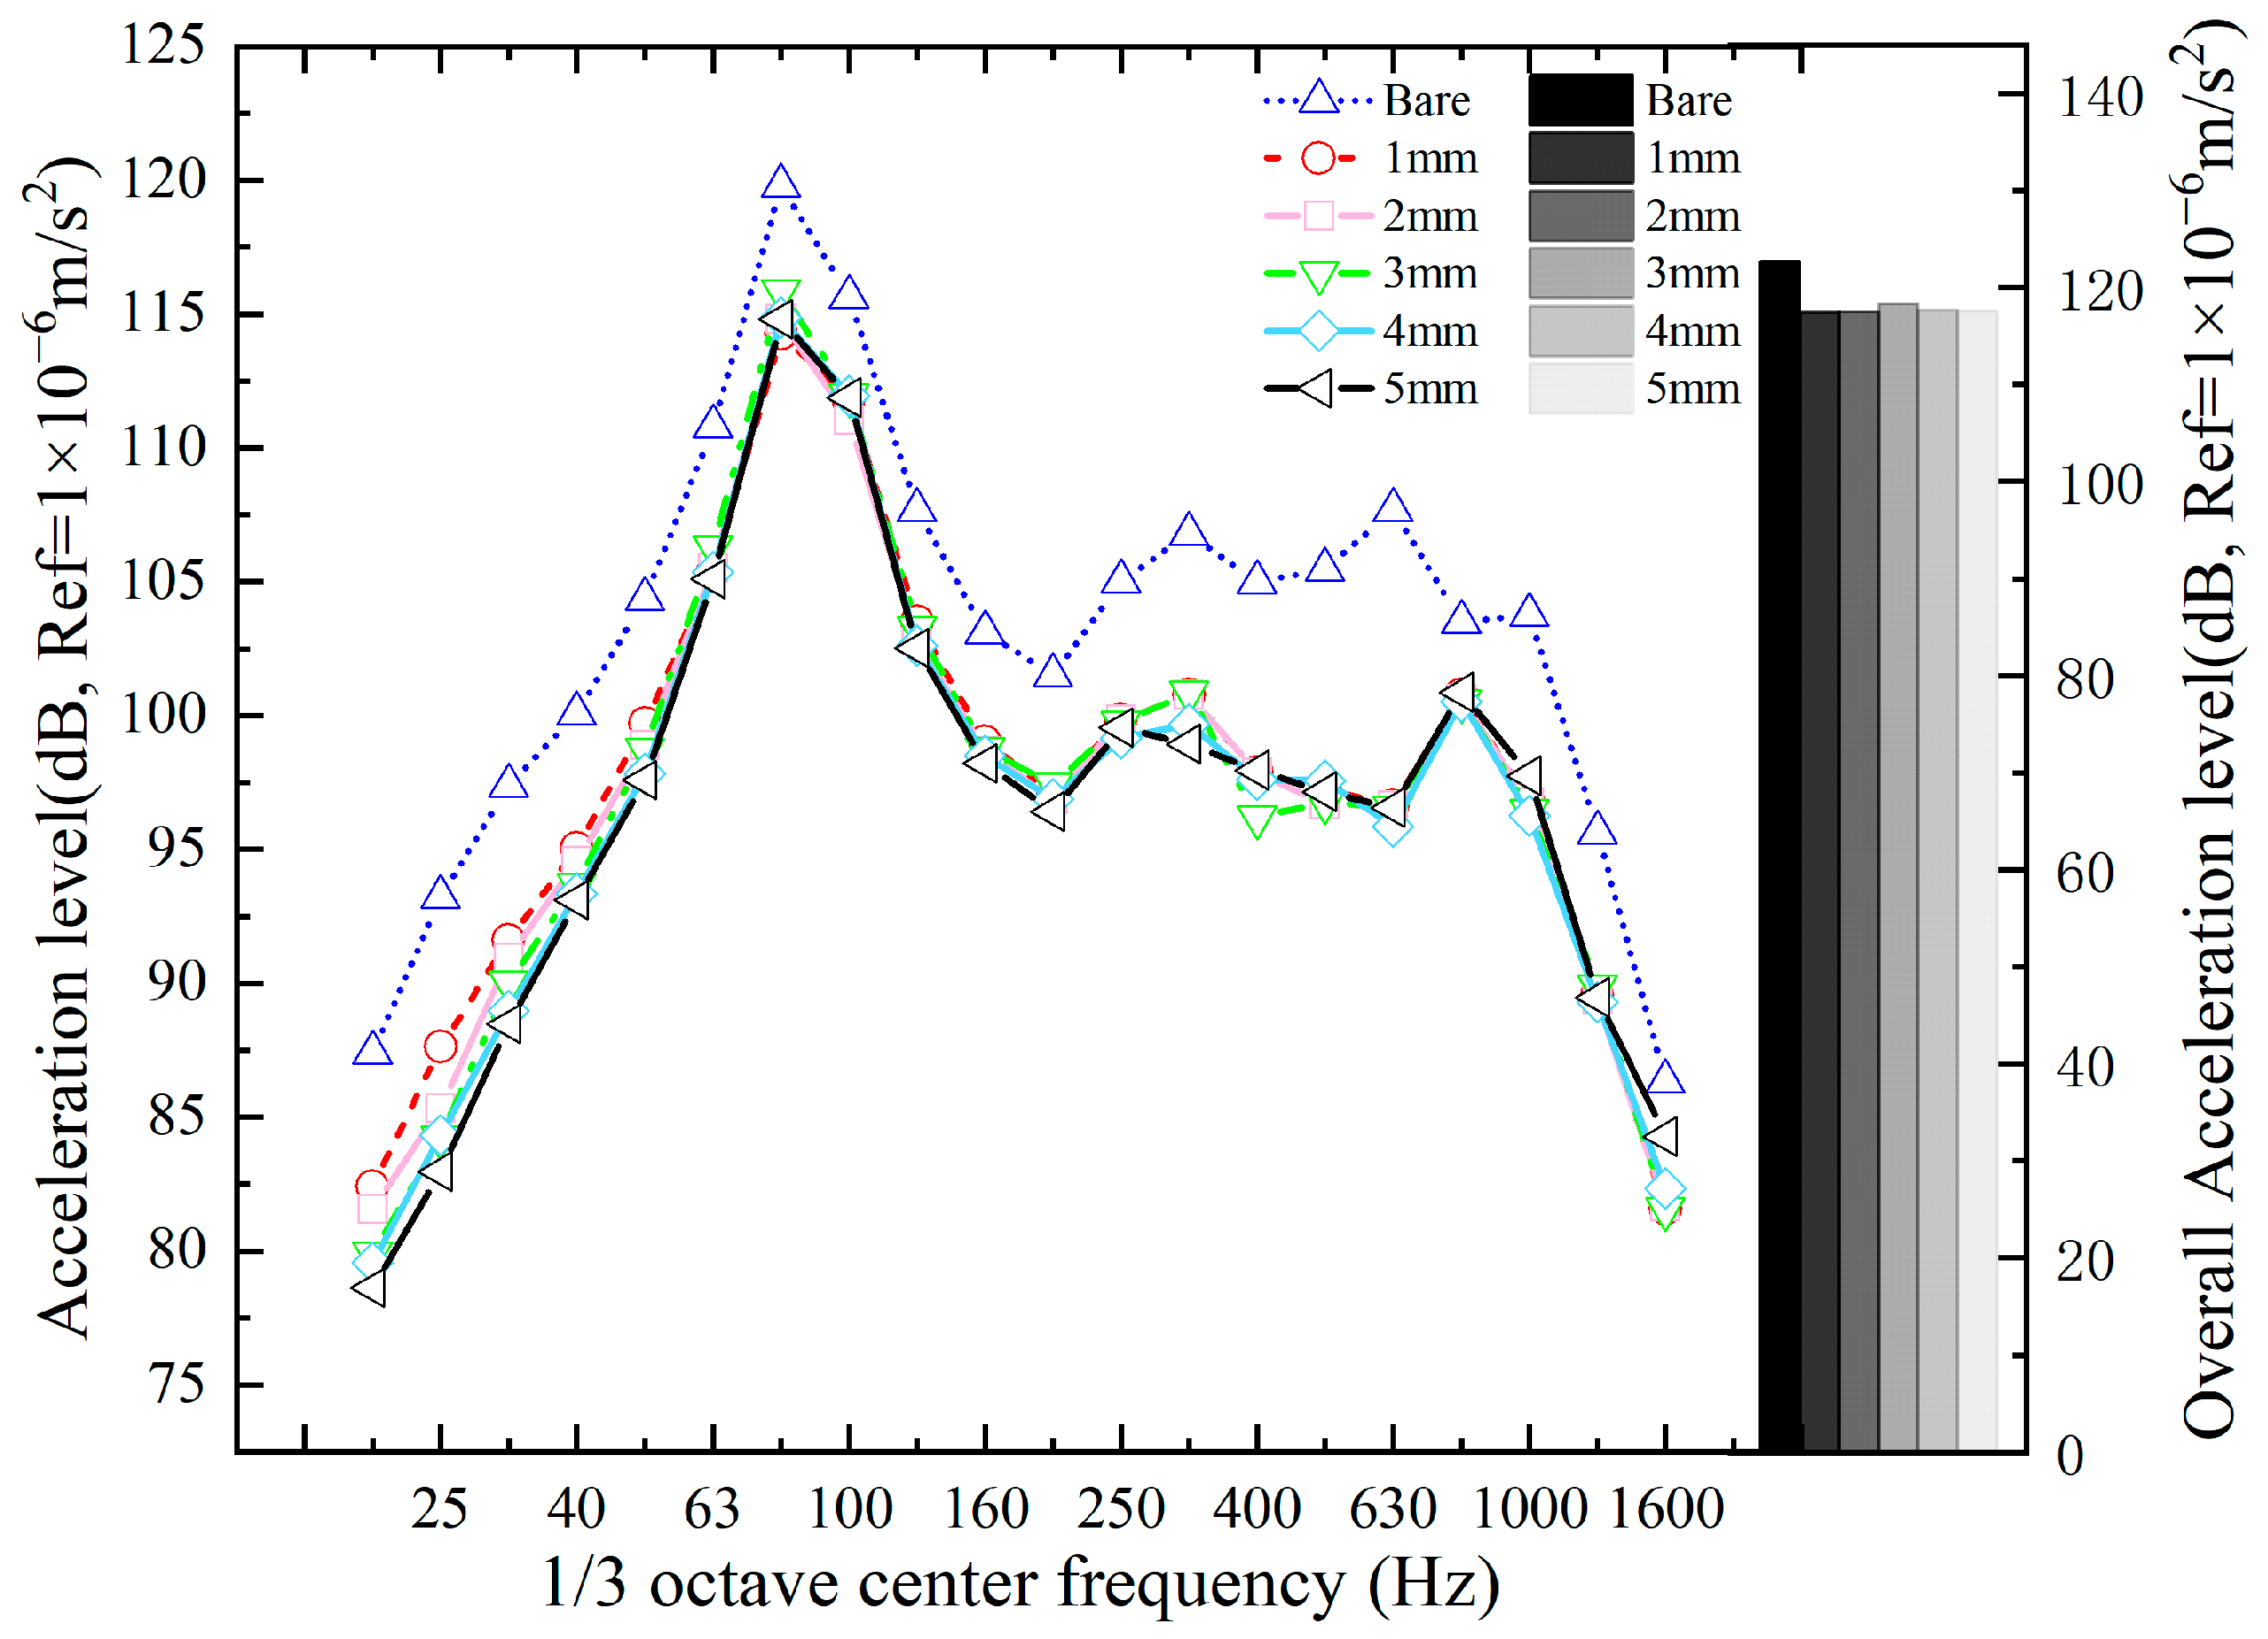
After the shear modulus of the viscoelastic material of the damping layer is determined, several options are available for determining the damping layer thickness. Assuming that the constant thickness of the constraining layer is 2 mm and the thicknesses of the damping layers are 1, 2, 3, 4, and 5 mm, the vibration response of the bridge was determined, as shown in Figure 17.
As shown in Figure 17, thickening the damping layer reduced the vibration response of the bridge in the low-frequency range. However, the amount of vibration mitigation was independent of the thickness of the damping layer in most frequency bands. Therefore, improving the mitigation effect by increasing the thickness of the damping layer is inefficient.

4.4. Material of Constraining Layer

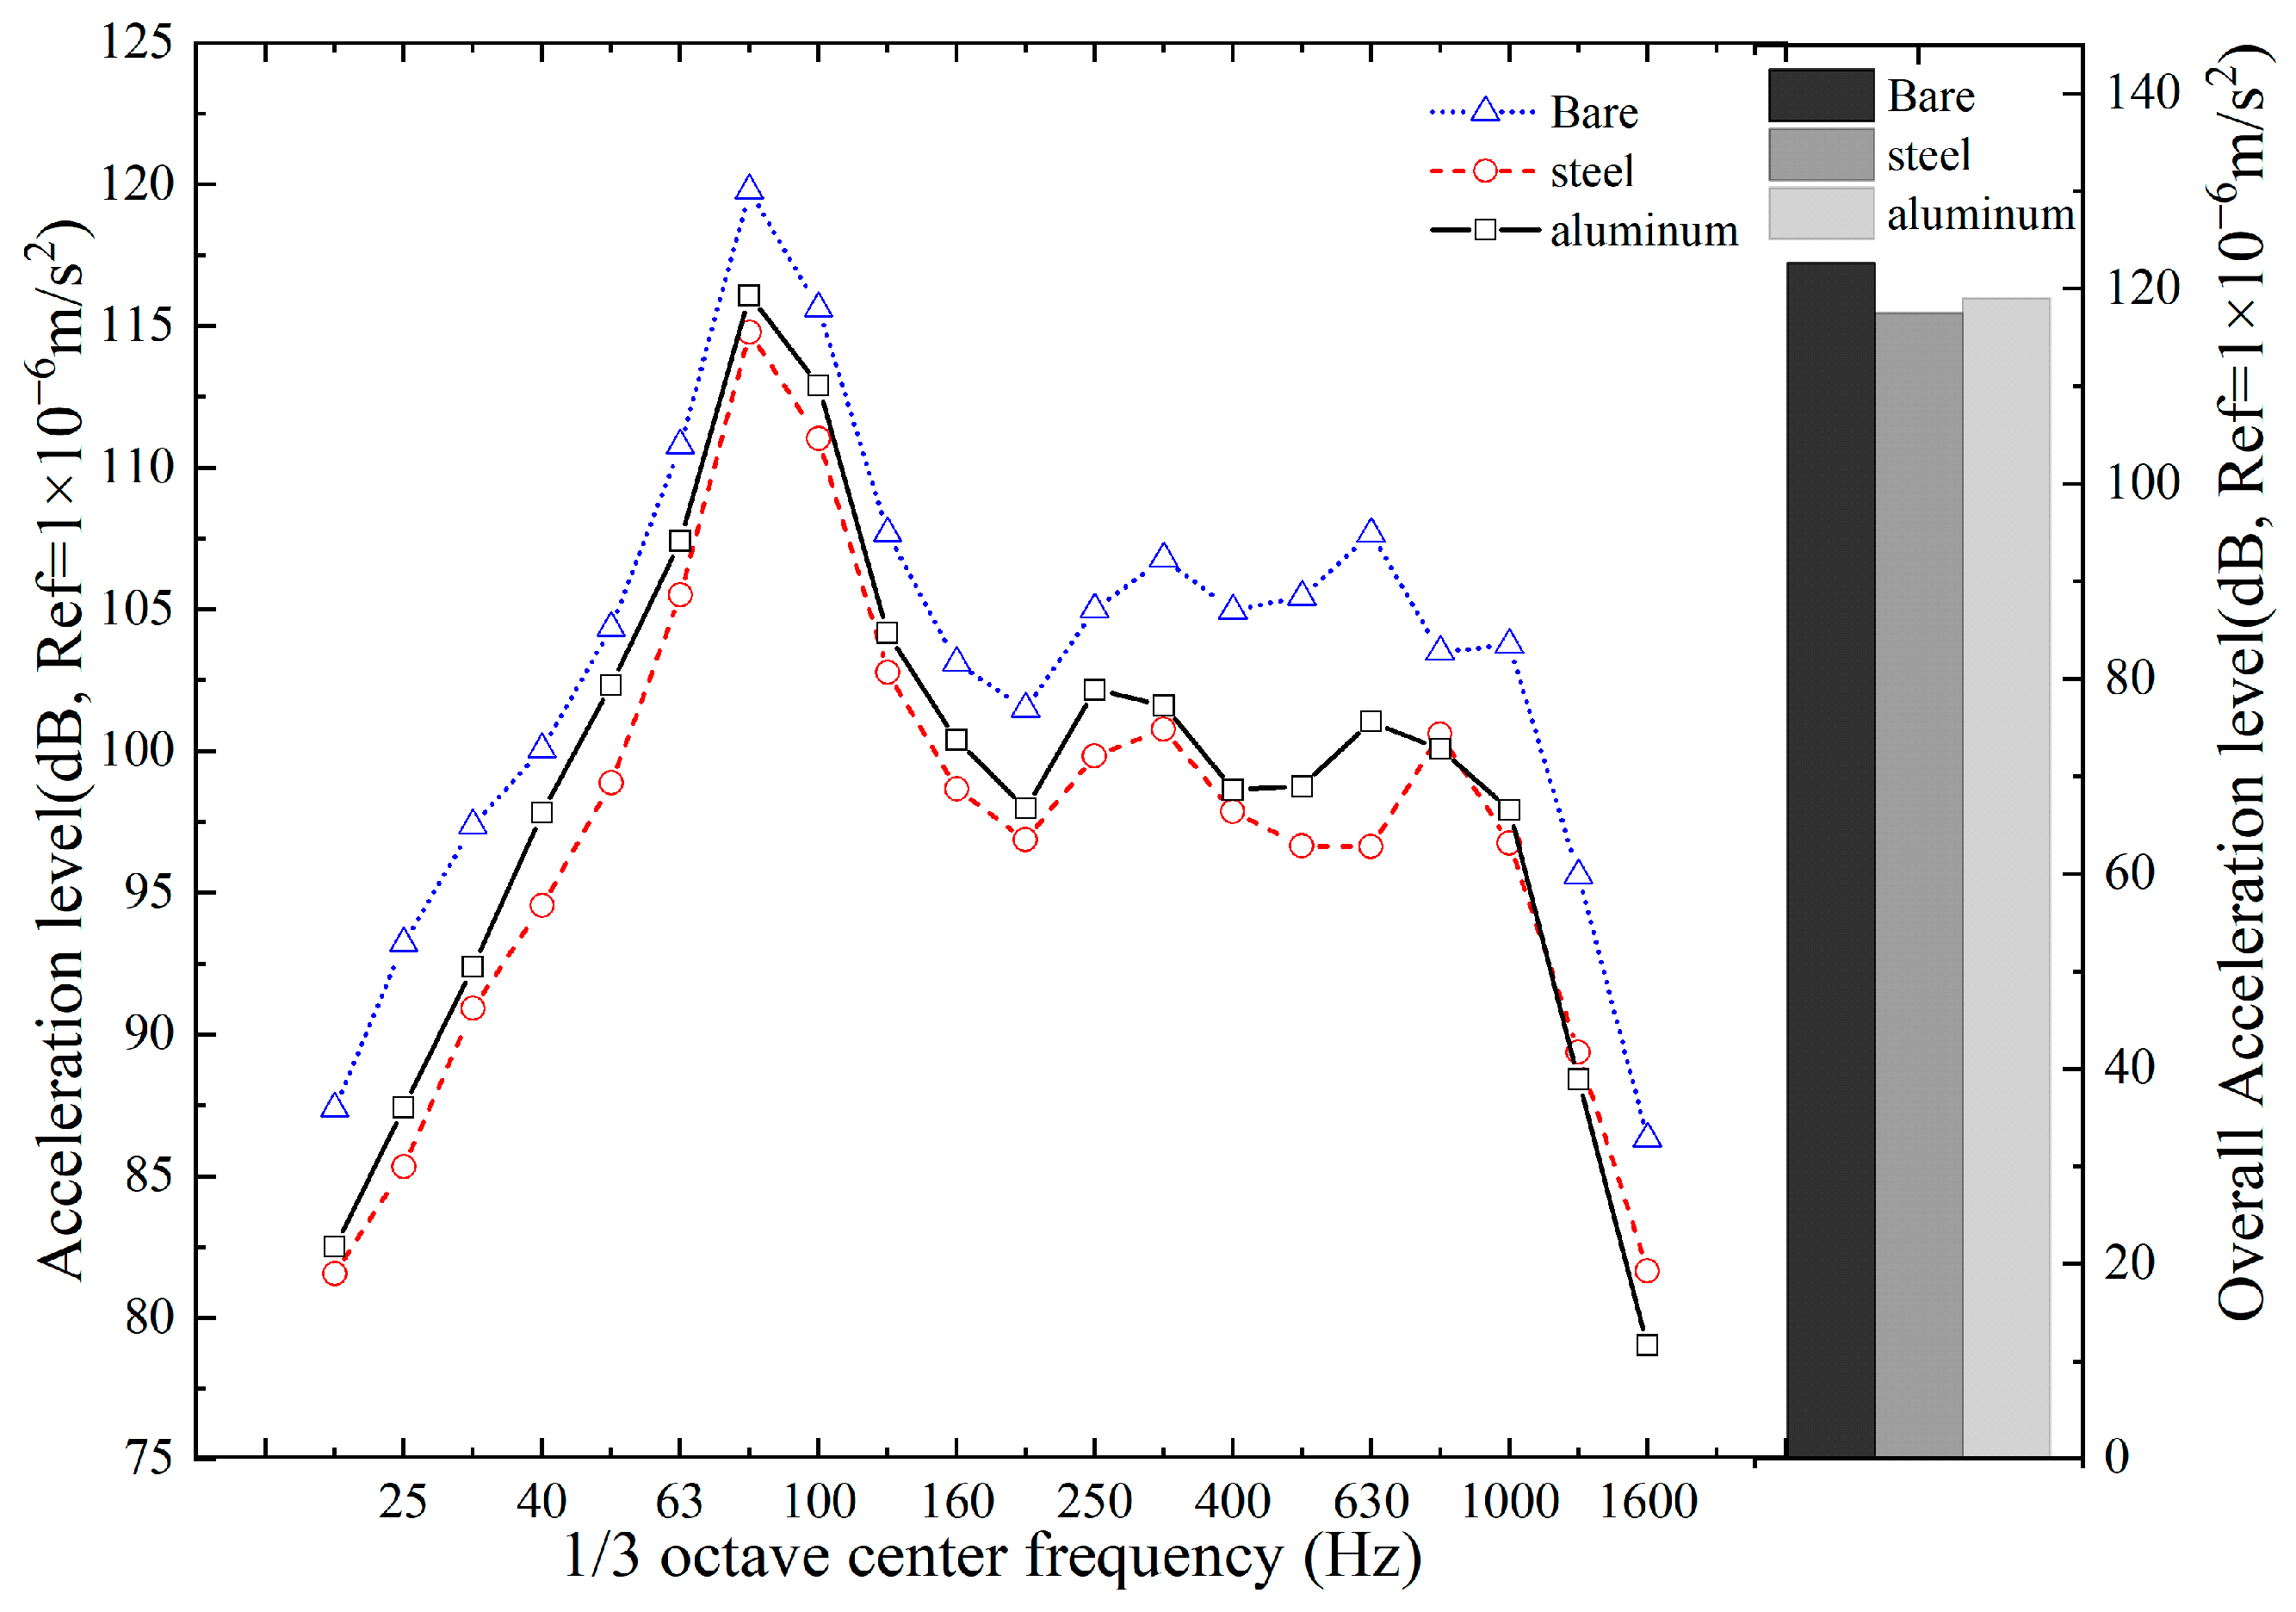
The constraining layer on the exterior of the damping layer must have a high elastic modulus to confine the extension and compression of the viscoelastic material. When the plate damped with the CLD is subjected to bending vibration, the damping layer mainly undergoes shear deformation owing to the confinement effect of the constraining layer rather than extension and compression deformation, leading to the dissipation of more vibration energy. Therefore, the material of the constraining layer is crucial for the capacity of the viscoelastic layer to dissipate vibration energy owing to the differences in the elastic modulus and stiffness. Steel and aluminum are widely used to constrain the damping layer in practice. As shown in Figure 18, the acceleration level of the bridge covered by the CLD with steel- and aluminum-constraining layers was obtained. The thicknesses of the constraining and damping layers were 5 and 2 mm, respectively.
CLD configurations with steel- and aluminum-constraining layers induced a significant mitigation effect for the bridge. At a constant thickness, the CLD containing the steel-constraining layer mitigated vibration more than that with the aluminum-constraining layer, particularly in the middle- and low-frequency ranges below 400 Hz. In addition, steel is cheaper than aluminum; however, the latter is lightweight, corrosion-resistant, and easy to process and mold. Therefore, determining the material for the constraining layer of the CLD in actual situations requires comprehensive considerations.

4.5. Thickness of Constraining Layer

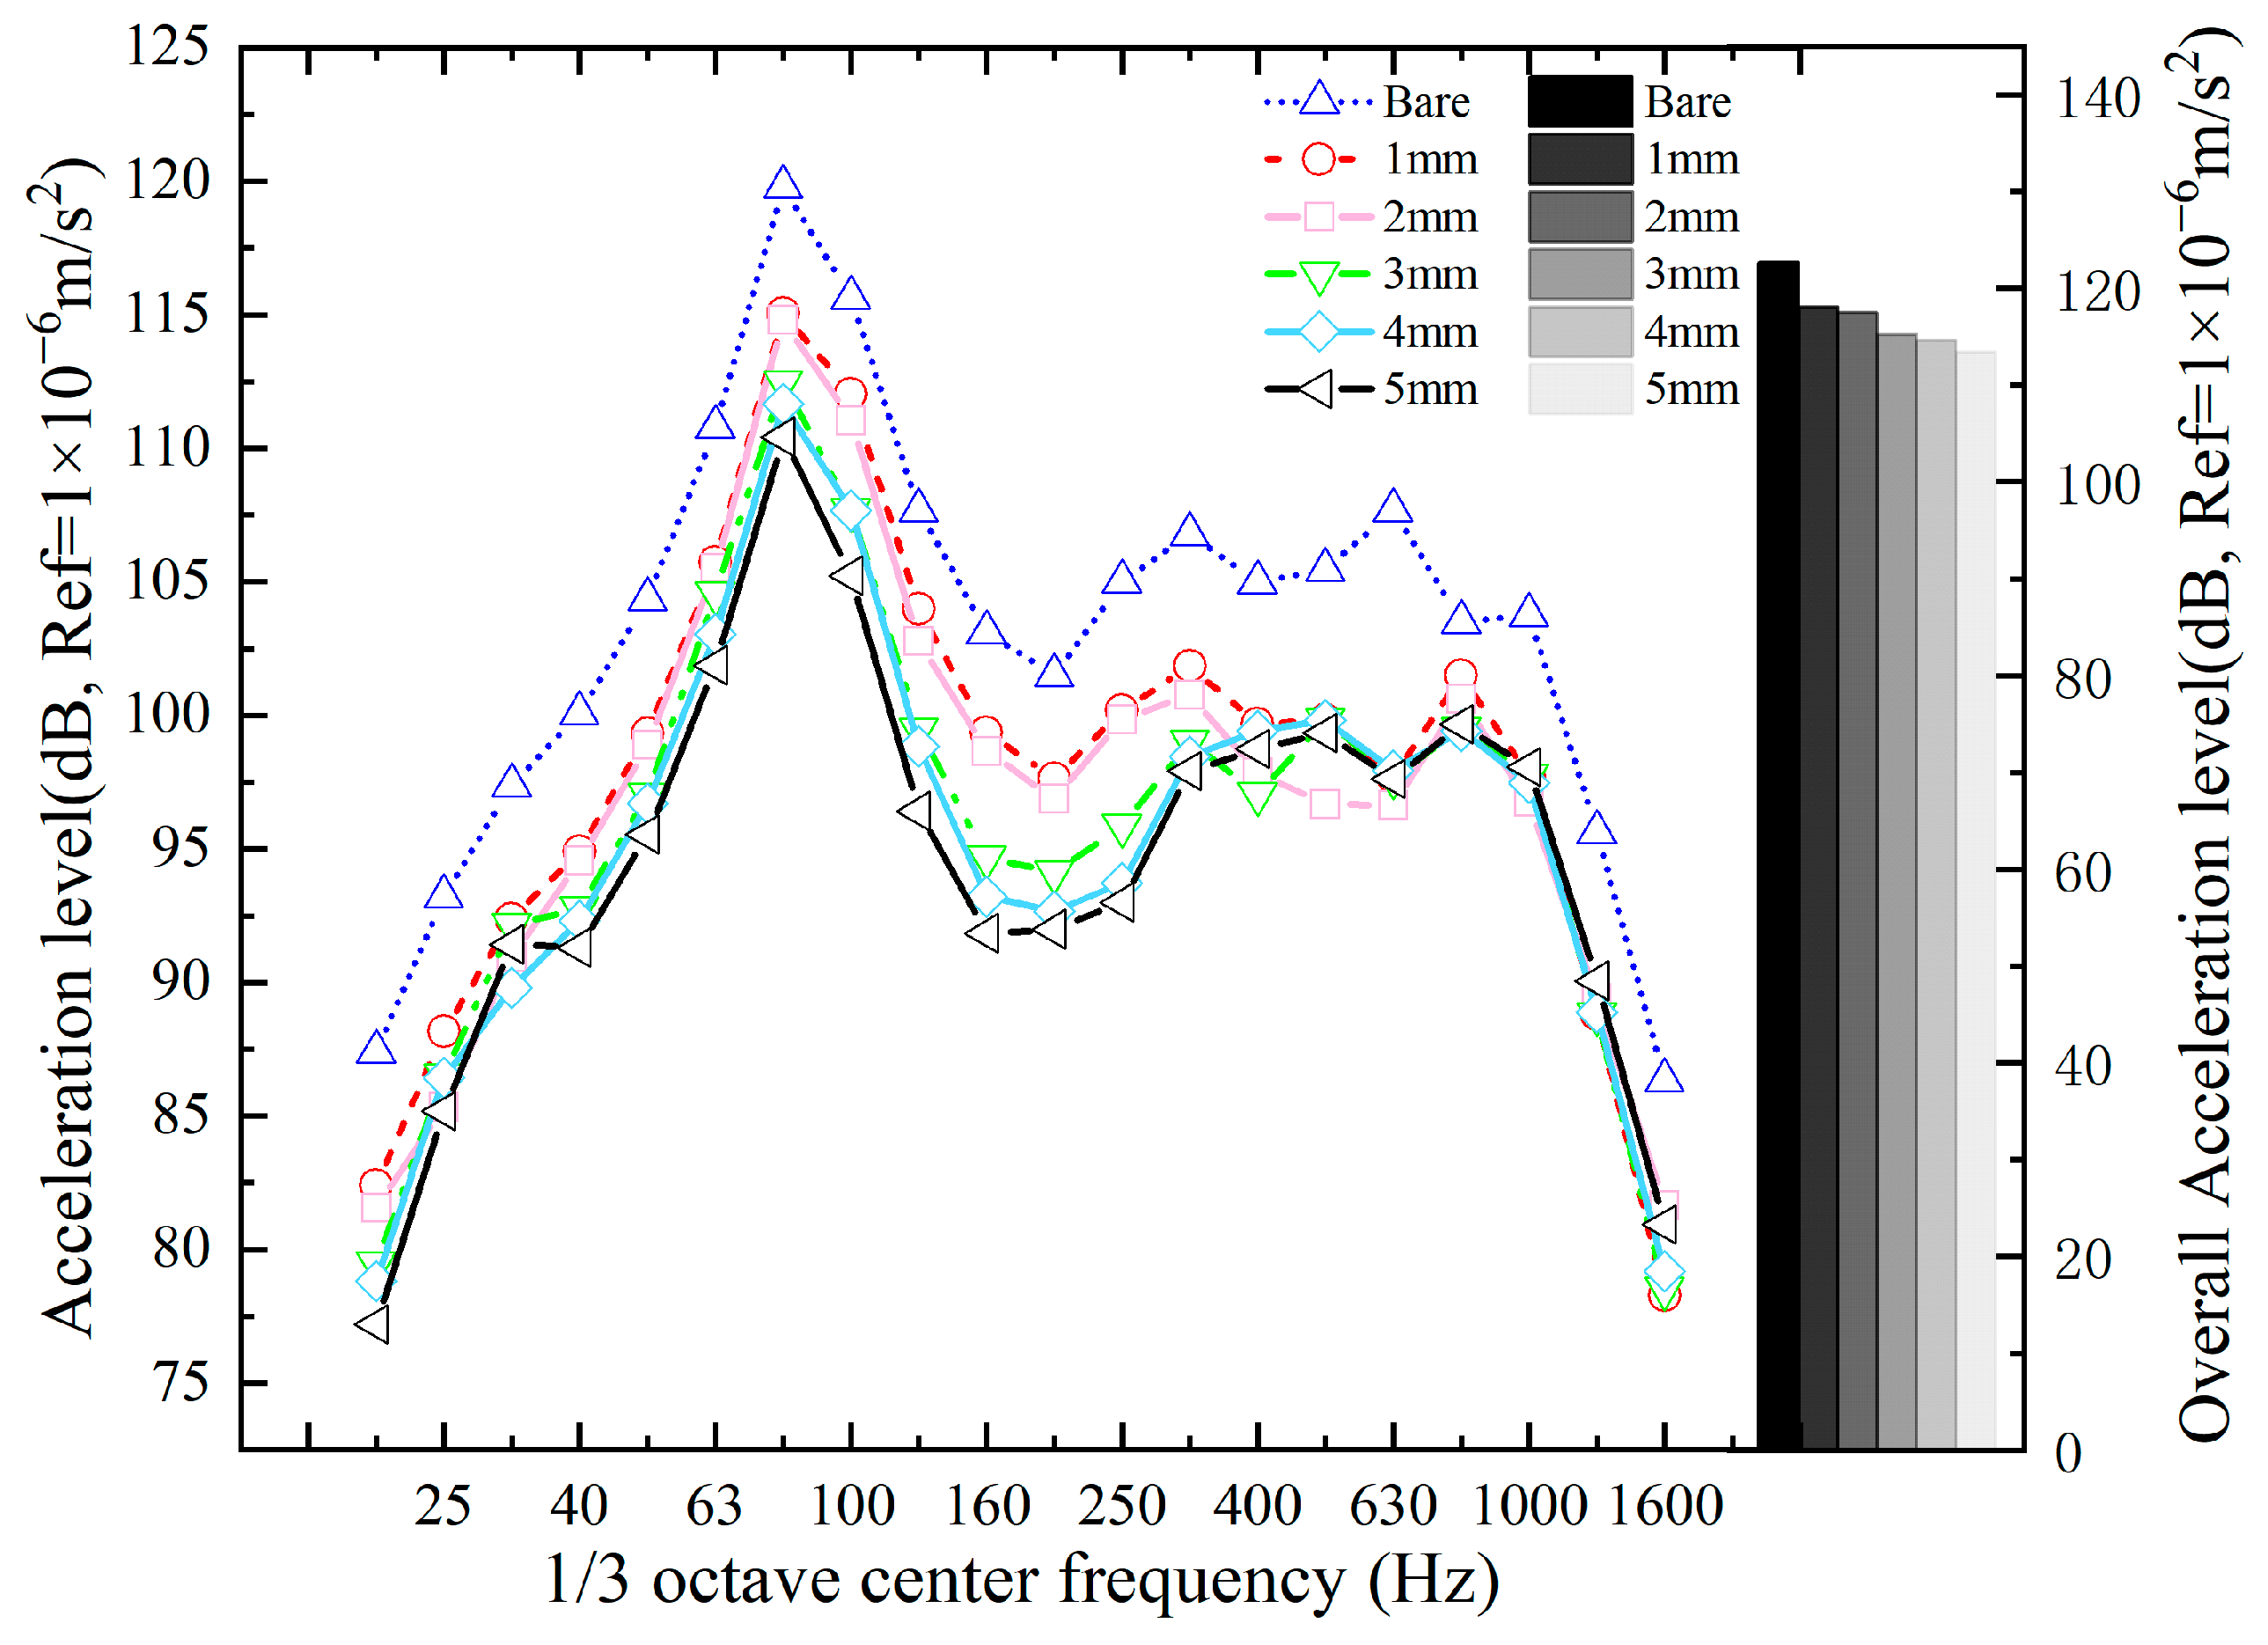
As mentioned above, the thickness of the constraining layer is related to the constraint effect on the viscoelastic layer, and thus, changes the vibration reduction in the CLD to the structure. Figure 19 depicts the vibration response of the bridge covered by the CLD with a steel-constraining layer with thicknesses of 1–5 mm.
By increasing the thickness of the constraining layer, the mitigation effect was improved in the frequency range below 315 Hz, and the vibration acceleration level of the bridge was reduced by up to 12 dB in the middle-frequency range. However, the thickness of the constraining layer minimally influenced the vibration reduction in the higher-frequency range. From an engineering perspective, a constraining layer with a thickness of 3 mm can be used in the vibration reduction in the bridge.

5. Conclusions

Based on the WFEM, a framework for predicting the vibration responses of bridges with CLD was developed in this study. The established model was verified by comparing the computed vibration response with the measured response. The effects of the covering area and CLD parameters on the vibration mitigation of bridge stringers were analyzed. The conclusions drawn from this study are as follows.
(1)
The calculation efficiency of WFEM is improved by several times with no loss of accuracy compared with the conventional FEM.
(2)
Treatment with CLD can significantly reduce vibration in all frequency bands and is suitable for controlling the vibration of steel structures.
(3)
The dominant frequency range of the vibration acceleration of the steel–concrete composite bridge with CLD induced by a moving train was 63–100 Hz, and the peak appeared at approximately 80 Hz.
(4)
The shear modulus of the damping layer was closely related to the mitigation effect. A lower shear modulus of the viscoelastic core resulted in a lower acceleration of the bridge in the low-frequency range. In the high-frequency range, a damping layer with a higher shear modulus is required for vibration mitigation.
(5)
The reduction in the vibration of the composite bridge was more sensitive to the thickness of the constraining layer than to that of the damping layer.
In this paper, the vibration of a 30 m steel-concrete composite bridge with CLD was predicted. In practice, the multi-span bridge is also widely used to cross roads and rivers. There are more sections of supports and external forces in the multi-span bridge. The prediction for the vibration of a multi-span bridge deserves further exploration in the future.

Author Contributions

Conceptualization, Q.L. and L.S.; methodology, L.S.; software, P.X.; validation, W.F., K.G. and Q.L.; formal analysis, Q.L.; investigation, P.X.; resources, L.S.; data curation, W.F.; writing—original draft preparation, W.F.; writing—review and editing, Q.L.; visualization, L.S.; supervision, Q.L.; project administration, Q.L.; funding acquisition, Q.L. All authors have read and agreed to the published version of the manuscript.

Funding

This work was supported by the National Natural Science Foundation of China (Grant Numbers: 52068030, 52372328 and 52378450).

Data Availability Statement

The original contributions presented in this study are included in the article; further inquiries can be directed to the corresponding author.

Conflicts of Interest

The authors declare no conflicts of interest.

References

  1. Thompson, D.J. Railway Noise and Vibration: Mechanisms, Modeling and Means of Control; Elsevier Ltd.: Oxford, UK, 2009. [Google Scholar]
  2. Li, X.Z.; Liu, Q.M.; Pei, S.L.; Song, L.Z.; Zhang, X. Structure-borne noise of railway composite bridge: Numerical simulation and experimental validation. J. Sound Vib. 2015, 353, 378–394. [Google Scholar] [CrossRef]
  3. He, W.; He, K.W.; Zou, C.; Yu, Y.L. Experimental noise and vibration characteristics of elevated urban rail transit considering the effect of track structures and noise barriers. Environ. Sci. Pollut. Res. 2021, 28, 45903–45919. [Google Scholar] [CrossRef] [PubMed]
  4. Sun, R.Y.; Wang, S.; Li, M.; Zhu, Y. An algorithm for large-span flexible bridge pose estimation and multi-keypoint vibration displacement measurement. Measurement 2025, 240, 115582. [Google Scholar] [CrossRef]
  5. Ngai, K.W.; Ng, C.F. Structure-borne noise and vibration of concrete box structure and rail viaduct. J. Sound Vib. 2002, 255, 281–297. [Google Scholar] [CrossRef]
  6. Crockett, A.R.; Pyke, J.R. Elevated design for minimization of direct and structure-radiated train noise. J. Sound Vib. 2000, 231, 883–897. [Google Scholar] [CrossRef]
  7. Alten, K.; Flesch, R. Finite element simulation prior to reconstruction of a steel railway bridge to reduce structure-borne noise. Eng. Struct. 2012, 35, 83–88. [Google Scholar] [CrossRef]
  8. Li, Q.; Dai, B.R.; Zhu, Z.H.; Thompson, D.J. Comparison of vibration and noise characteristics of urban rail transit bridges with box-girder and U-shaped sections. Appl. Acoust. 2022, 186, 108494. [Google Scholar] [CrossRef]
  9. Zhang, X.; Li, X.Z.; Liu, Q.M.; Wu, J.F.; Li, Y.D. Theoretical and experimental investigation on bridge-borne noise under moving high-speed train. Sci. China Technol. Sci. 2013, 56, 917–924. [Google Scholar] [CrossRef]
  10. Zhang, H.; Xie, X.; Jiang, J.Q.; Yamashita, M. Assessment on transient sound radiation of a vibrating steel bridge due to traffic loading. J. Sound Vib. 2015, 336, 132–149. [Google Scholar] [CrossRef]
  11. Song, X.D.; Li, Q. Numerical and experimental study on noise reduction of concrete LRT bridges. Sci. Total Environ. 2018, 643, 208–224. [Google Scholar] [CrossRef]
  12. Zhang, X.A.; Zhang, X.Y.; Yang, J.J.; Zhu, S.Y.; He, Q.L. Mechanism of noise reduction caused by thickening top plate for high-speed railway box-girder bridge. Structures 2023, 57, 105148. [Google Scholar] [CrossRef]
  13. Remington, P.J.; Witting, L.E. Prediction of the effectiveness of noise control treatments in urban rail elevated structures. J. Acoust. Soc. Am. 1985, 78, 2017–2033. [Google Scholar] [CrossRef]
  14. Janssens, M.H.A.; Thompson, D.J. A calculation model for the noise from steel railway bridges. J. Sound Vib. 1996, 193, 295–305. [Google Scholar] [CrossRef]
  15. Bewes, O.G.; Thompson, D.J.; Jones, C.J.C.; Wang, A. Calculation of noise from railway bridges and viaducts: Experimental validation of a rapid calculation model. J. Sound Vib. 2006, 293, 933–943. [Google Scholar] [CrossRef]
  16. Poisson, F.; Margiocchi, F. The use of dynamic dampers on the rail to reduce the noise of steel railway bridges. J. Sound Vib. 2006, 293, 944–952. [Google Scholar] [CrossRef]
  17. Liu, X.; Zhang, N.; Sun, Q.K.; Wu, Z.Z. Experimental and numerical study on vibration and structure-borne noise of composite box-girder railway bridges. Int. J. Rail Transp. 2024, 12, 134–152. [Google Scholar] [CrossRef]
  18. Si, J.; Zhu, L.; Ma, W.; Meng, B.; Dong, H.; Ning, H.; Zhao, G. Study on Vibration and Noise of Railway Steel–Concrete Composite Box Girder Bridge Considering Vehicle–Bridge Coupling Effect. Buildings 2024, 14, 2509. [Google Scholar] [CrossRef]
  19. Liang, L.; Li, X.Z.; Zheng, J.; Lei, K.N.; Gou, H.Y. Structure-borne noise from long-span steel truss cable-stayed bridge under damping pad floating slab: Experimental and numerical analysis. Appl. Acoust. 2020, 157, 106988. [Google Scholar] [CrossRef]
  20. Liu, Q.M.; Liu, L.Y.; Chen, H.P.; Zhou, Y.L.; Lei, X.Y. Prediction of vibration and noise from steel/composite bridges based on receptance and statistical energy analysis. Steel Compos. Struct. 2020, 37, 291–306. [Google Scholar] [CrossRef]
  21. Gu, Y.W.; Nie, X.; Yan, A.G.; Zeng, J.H.; Liu, Y.F.; Jiang, Y.X. Experimental and numerical study on vibration and structure-borne noise of high-speed railway composite bridge. Appl. Acoust. 2022, 192, 108757. [Google Scholar] [CrossRef]
  22. Luo, H.; Cao, Z.Y.; Zhang, X.; Li, C.; Kong, D.R. Combining different forms of statistical energy analysis to predict vibrations in a steel box girder comprising periodic stiffening ribs. Steel Compos. Struct. 2022, 45, 119–131. [Google Scholar] [CrossRef]
  23. Liu, X.; Zhang, N.; Sun, Q.K.; Cheng, Z.N. A symplectic-spectral element method for high frequency vibration analysis and its application in structure-borne noise prediction. Int. J. Struct. Stab. Dy. 2023, 23, 2350137. [Google Scholar] [CrossRef]
  24. Waki, Y.; Mace, B.R.; Brennan, M.J. Numerical issues concerning the wave and finite element method for free and forced vibrations of waveguides. J. Sound Vib. 2009, 327, 92–108. [Google Scholar] [CrossRef]
  25. Duhamel, D. A scaled wave finite element method for computing scalar wave radiation and scattering in exterior domains. Comput. Methods Appl. Mech. Eng. 2022, 392, 114676. [Google Scholar] [CrossRef]
  26. Mace, B.R.; Duhamel, D.; Brennan, M.J.; Hinke, L. Finite element prediction of wave motion in structural waveguides. J. Acoust. Soc. Am. 2005, 117, 2835–2843. [Google Scholar] [CrossRef]
  27. Renno, J.; Sassi, S.; Alnahhal, W.I. Calculating the response of waveguides to base excitation using the wave and finite element method. J. Vib. Control 2022, 28, 652–664. [Google Scholar] [CrossRef]
  28. Waki, Y.; Mace, B.R.; Brennan, M.J. Free and forced vibrations of a tyre using a wave/finite element approach. J. Sound Vib. 2009, 323, 737–756. [Google Scholar] [CrossRef]
  29. Song, L.Z.; Li, X.Z.; Hao, H.; Zhang, X. Medium- and high-frequency vibration characteristics of a box-girder by the waveguide finite element method. Int. J. Struct. Stab. Dyn. 2018, 18, 1850141. [Google Scholar] [CrossRef]
  30. Zhang, C. The active rotary inertia driver system for flutter vibration control of bridges and various promising applications. Sci. China Tech. Sci. 2023, 66, 390–405. [Google Scholar] [CrossRef]
  31. Gao, P.X.; Yu, T.; Zhang, Y.L.; Wang, J.; Zhai, J.Y. Vibration analysis and control technologies of hydraulic pipeline system in aircraft: A review. Chin. J. Aeronaut. 2021, 34, 83–114. [Google Scholar] [CrossRef]
  32. Zhu, Q.Y.; Han, Q.K.; Liu, J.G. Topological optimization design on constrained layer damping treatment for vibration suppression of thin-walled structures via improved BESO method. Aerosp. Sci. Technol. 2023, 142, 108600. [Google Scholar] [CrossRef]
  33. Liu, Q.M.; Thompson, D.J.; Xu, P.P.; Feng, Q.S.; Li, X.Z. Investigation of train-induced vibration and noise from a steel-concrete composite railway bridge using a hybrid finite element-statistical energy analysis method. J. Sound Vib. 2020, 471, 115197. [Google Scholar] [CrossRef]
  34. Lu, P.P.; Wang, P.; Lu, J. Decentralized vibration control of smart constrained layer damping plate. J. Vib. Control 2021, 27, 529–542. [Google Scholar] [CrossRef]
  35. Zhao, J.H.; Sun, F.F.; Yin, W.H.; Le, Z.J.; Song, J.; Cai, X.Y.; He, Y.M. Damping performance and its influencing factors of wind turbine towers with constrained layer damping treatment. Structures 2023, 57, 105322. [Google Scholar] [CrossRef]
  36. Zhang, C.G.; Shu, J.P.; Zhang, H.; Ning, Y.J.; Yu, Y.T. Estimation of load-carrying capacity of cracked RC beams using 3D digital twin model integrated with point clouds and images. Eng. Struct. 2024, 310, 118126. [Google Scholar] [CrossRef]
  37. Wang, S.X.; He, J.J.; Fan, J.; Sun, P.X.; Wang, D.W. A time-domain method for free vibration responses of an equivalent viscous damped system based on a complex damping model. J. Low Freq. Noise Vib. Act. Control 2023, 42, 1531–1540. [Google Scholar] [CrossRef]
Figure 1. Segments of waveguide structure.
Buildings 14 03621 g001
Figure 2. Excitation diagram of an infinite waveguide structure.
Buildings 14 03621 g002
Figure 3. Waves amplitudes in a finite waveguide structure.
Buildings 14 03621 g003
Figure 4. Cross-section dimensions (unit: mm).
Buildings 14 03621 g004
Figure 5. WFE model of composite bridge.
Buildings 14 03621 g005
Figure 6. Dispersion curves of steel−concrete composite bridge.
Buildings 14 03621 g006
Figure 7. Typical wave modes at 25 Hz. The solid line means the wave mode and the dot line is the initial shape. (a) wave A; (b) wave B; (c) wave C; (d) wave D; (e) wave E; (f) wave F; and (g) wave G.
Buildings 14 03621 g007
Figure 8. Layout of CLD.
Buildings 14 03621 g008
Figure 9. Material loss factor and real shear modulus of viscoelastic layer at 20 °C.
Buildings 14 03621 g009
Figure 10. WFE model of composite bridge with CLD.
Buildings 14 03621 g010
Figure 11. Measured and computed acceleration levels of bottom flange of bridge without CLD.
Buildings 14 03621 g011
Figure 12. Measured and computed acceleration levels of bottom flange of bridge with CLD.
Buildings 14 03621 g012
Figure 13. Acceleration levels of bottom flange of bridge with and without CLD.
Buildings 14 03621 g013
Figure 14. Arrangement of CLD on web of bridge. (a) Laying area ratio of 50%; (b) Laying area ratio of 80%; (c) Laying area ratio of 100%.
Buildings 14 03621 g014
Figure 15. Vibration response of bridge at various laying area ratios.
Buildings 14 03621 g015
Figure 16. Vibration responses of bridge under various shear moduli.
Buildings 14 03621 g016
Figure 17. Vibration response of bridge with damping layer of various thicknesses.
Buildings 14 03621 g017
Figure 18. Vibration response of the bridge under different materials of constraining layer.
Buildings 14 03621 g018
Figure 19. Vibration response of bridge with constraining layer of various thicknesses.
Buildings 14 03621 g019
Table 1. Bridge parameters.
ParameterBridge DeckStringer
Elastic modulus (Pa)3.55 × 10102.1 × 1011
Damping ratio0.030.0003
Density (kg/m3)40677850
Poisson’s ratio0.20.3
Table 2. Track parameters.
ParameterValue
Density of rail (kg/m3)7850
Mass of rail (kg/m)60.64
Cross-sectional area of rail (m2)7.745 × 10⁻³
Elastic modulus of rail (Pa)2.06 × 10¹¹
Area moment of inertia of rail (m4)3.217 × 10⁻⁵
Poisson’s ratio of rail0.3
Fastener vertical stiffness (MN/m)60
Rail loss factor0.01
Fastener vertical damping (kN·s/m)80
Fastener spacing (m)0.6
Fastener loss factor0.25
Table 3. CLD parameters.
ParameterDamping LayerConstraining Layer
MaterialViscoelastic damping materialSteel
Thickness (mm)22
Elastic modulus (Pa)*2.1 × 10¹¹
Density (kg/m3)15007850
Poisson’s ratio0.4990.3
Damping ratio*0.0002
Note: The parameters indicated by * are presented in Figure 9.
Table 4. Comparisons between FEM and WFEM models.
ModelNumber of NodesNumber of ElementsResult File (kB)Model File (kB)Computation Time (min)
FEM15,95315,7024,012,147101,63283
WFEM390370126429
Disclaimer/Publisher’s Note: The statements, opinions and data contained in all publications are solely those of the individual author(s) and contributor(s) and not of MDPI and/or the editor(s). MDPI and/or the editor(s) disclaim responsibility for any injury to people or property resulting from any ideas, methods, instructions or products referred to in the content.