Article

Paraphrase the Obstacles to the Recycling of Construction and Demolition Waste: A Perspective of the Evolutionary Game of Three Stakeholders

1
Faculty of Civil Engineering and Mechanics, Jiangsu University, Zhenjiang 212013, China
2
Cranfield Tech Futures Graduate Institute, Jiangsu University, Zhenjiang 212013, China
3
State Key Laboratory of Pollution Control and Resource Reuse, School of the Environment, Nanjing University, Nanjing 210023, China
*
Author to whom correspondence should be addressed.
These authors contributed equally to this work.
Buildings 2024, 14(11), 3664; https://doi.org/10.3390/buildings14113664
Submission received: 23 September 2024 / Revised: 8 November 2024 / Accepted: 11 November 2024 / Published: 18 November 2024
(This article belongs to the Section Building Materials, and Repair & Renovation)

Abstract

:
With China’s urbanization, the construction industry has generated massive construction and demolition waste (C&DW), leading to severe environmental pollution and social problems. However, the currently proposed policies have not promoted the sustainable development of the C&DW recycling market. This paper constructs a tripartite evolutionary game model of construction production enterprises, construction enterprises, and the government. The decision-making evolution laws of relevant stakeholders at different stages of the development of the C&DW recycling market are identified through equilibrium stability analysis. The results show that in the initial stage, the government can help encourage enterprises to participate in C&DW recycling through appropriate subsidy and penalty measures. As the recycling market matures, enterprises achieve profits through market mechanisms and the proportion of enterprises participating in recycling increases. At this time, the government no longer plays a leading role, and the strategy evolves into non-supervision. In addition, the government should design carbon emission reduction policies for carbon quota and trading according to the market status to exert positive effects. Hence, this study provides a theoretical basis for the governments of developing countries to effectively manage C&DW market development.

1. Introduction

According to statistics released by the United Nations Environment Programme (UNEP), about 7 billion to 10 billion tons of waste will be generated per annum in the world [1,2]. Among them, construction and demolition waste (C&DW) accounts for 30–40% of the total solid waste [3]. As the largest developing country, China produces the most C&DW [4]. Driven by China’s urbanization policy, a large number of old buildings have been constructed, renovated, and demolished over a large area, consuming huge resources and generating billions of tons of C&DW [5]. Currently, about 75% of Chinese cities are surrounded by a large number of C&DW [6]. The vast majority of C&DW are directly landfill or stacked in open space without proper treatment, which causes a lot of resource loss and environmental pollution [7,8,9] and aggravates the health risks of residents [10]. At the same time, C&DW that cannot be reasonably buried is often dumped or incinerated illegally, which further damages the environment, resulting in a large amount of CO2 emissions and high environmental remediation costs [11,12]. Therefore, it is urgent to alleviate various social problems caused by C&DW through government management.
Previous studies have pointed out that C&DW recycling is a strategy to reduce the generation of C&DW from the source by transforming C&DW into new materials for reuse, considered the most environmentally friendly and effective construction waste management strategy [13,14]. In China, about 80 percent of C&DW can be recycled and processed into secondary building materials [15]. So, the Chinese government has been exploring strategies to improve the sustainable development of the C&DW recycling market over the past few years [16]. In May 2020, the Chinese government issued the Guidelines of the Ministry of Housing and Urban-Rural Development on Promoting the Reduction of Construction Waste. The policy emphasizes the promotion of innovation in construction waste reduction management and the promotion of fine construction. Simultaneously, appropriate incentive policies have been proposed for C&DW recycling in many different cities in China [6]. However, these policies have not substantially improved the low efficiency of C&DW recycling [17]. Many policies achieve only short-term gains and have no long-term impact on the number of C&DW [18]. Currently, the recycling efficiency of C&DW in some developed countries may be as high as 86%, but in some cities in developing countries such as China, the recycling efficiency may be less than 8% [3]. The main reason lies in the lack of theoretical understanding of the decision-making behavior of stakeholders involved in C&DW management [19].
At present, stakeholders associated with C&DW management are defined as individuals or organizations involved in the waste management process [6]. The main stakeholders involved in the waste recovery process can usually be divided into three groups: government agencies, construction enterprises, and building materials production enterprises [20]. Among them, the role of the Chinese government in promoting C&DW recycling is important [19,21]. The government, as the overseer of waste management [22], can develop policies and provide financial subsidies to other C&DW stakeholders to encourage the development of the C&DW recycling industry [6]. For construction enterprises, there are several ways to deal with C&DW, including dumping C&DW in landfills, recycling, and incineration [1]. Among them, the most environmentally friendly treatment is recycling, followed by incineration, and finally landfill [23]. For building materials production enterprises, compared with directly using natural materials to produce building materials, recycling C&DW needs to collect construction waste from construction sites and transport it to reprocessing sites for reprocessing of construction waste, which is bound to increase the recycling cost of recyclers [21]. Moreover, the sale of recycled building materials is also a problem that recyclers need to consider. Hence, in pursuit of profit, recyclers can choose whether or not to recycle construction waste. Only when both the manufacturer and the recyclers choose C&DW recycling, the recycling closed-loop can be formed and the expected environmental benefits can be achieved.
In order to improve the efficiency of C&DW recycling and promote the sustainable development of the C&DW recycling market, the researchers discussed from multiple perspectives. Some experts focus on improving the efficiency of recycling different types of construction waste. Qiao et al. evaluated the full life cycle recycling of masonry bricks, permeable bricks, and thermal insulation blocks, quantifying the benefits in terms of environment, economy, and carbon emissions [24]. Patra et al. and Abera analyze the mechanical properties of compressive, tensile, and flexural strength of the concrete box made of recycled aggregate from construction waste [25,26]. Other studies focus on analyzing the behaviors and phenomena of research subjects in different scenarios in the C&DW market. L. Ma and Zhang analyzed empirical data on 260 responses from different builders in the construction industry in two major Indian cities [27]. The results show that the behavioral intention of recycling C&DW is mainly driven by individual motivation, regulatory pressure, and environmental awareness. Yuan et al. analyzed the effect of government subsidy policies on the reverse channel decisions of competitors and dominant retailers [28]. Subsidies to construction companies are key to promoting the recycling of construction waste. Chen et al. identify the decision-making behavior of contractors and government departments through the game theory decision model and identify the key factors that affect their behaviors [19].
However, these studies focus on the life-cycle recycling behavior of a single stakeholder or the impact of government intervention on the decision-making of a single stakeholder. They do not fully pay attention to the cooperation between multiple key stakeholders and the synergistic development impact of government incentive policies on other stakeholders. Therefore, this paper simulates the decision-making behaviors of three key stakeholders in the C&DW recycling market based on the evolutionary game method in this study, aiming to solve the following three problems: First, what is the direction of behavior evolution of the government, construction enterprises, and building materials production enterprises? Second, what are the key factors that affect the collaborative development of construction enterprises and building materials production enterprises? Third, how does the government promote the coordinated development of construction enterprises and building materials production enterprises through various incentive means to maximize social, economic, and environmental benefits? In order to solve the above problems, this paper first analyzes the key factors affecting the stakeholder group and establishes a three-party evolutionary game model of construction enterprises, building materials production enterprises, and the government. Then, the evolutionarily stable strategy (ESS) is obtained by calculating the dynamic equation of the replicator. Finally, the validity of the research results is verified by numerical simulation. In September 2020, as the world’s largest carbon emitter, China officially announced that it will peak carbon emissions before 2030 and achieve carbon neutrality before 2060 [29]. It is worth mentioning that in the context of China’s 3060 plan, this paper incorporated carbon trading parameters into the game model to obtain the impact of carbon reduction policies on the C&DW recycling market.
The rest of the paper is organized as follows. Section 2 establishes the research framework and constructs the tripartite evolution model of stakeholders in the C&DW recycling market. Section 3 shows four influencing factors and illustrates the possible evolution process in the future through numerical simulation. Section 4 proposes a development mechanism for the C&DW recycling market based on simulation results. Finally, Section 5 summarizes and analyzes the research and discusses the future research directions.

2. The Evolutionary Game Model

Game theory is a mathematical method for evaluating and predicting the strategic interactions of stakeholders [30]. Traditional game theory emphasizes complete rationality and fails to effectively consider practical problems. In contrast, evolutionary game theory assumes that participants have bounded rationality and obtain evolutionarily stable strategies through continuous imitation and learning, which is more in line with the characteristics of decision-makers in real life [31]. Currently, evolutionary game theory is widely used to analyze the influencing factors of systems [32]. In China, the C&DW recycling industry is a complex system, and its development is a dynamic process. Stakeholders such as the government, construction enterprises, and building material production enterprises in this system are boundedly rational and constantly adjust their decisions according to changes in the cooperation environment, making the evolutionary game model suitable for understanding the strategic evolution process of all parties. Therefore, this study chooses the evolutionary game model to analyze the behavioral strategies of stakeholders in the C&DW recycling industry.

2.1. Three-Party Evolution Analysis of Stakeholders

In this section, this paper describes the relationship and evolutionary decisions among the three stakeholders in the C&DW recycling market, as shown in Figure 1. In China’s C&DW recycling industry chain, the government, construction enterprises, and building materials production enterprises are important participants. The government plays the role of supervisor and aims to increase the recycling and utilization of C&DW and promote pollution reduction and carbon reduction through reward and punishment mechanisms. Construction enterprises and building materials production enterprises are, respectively, the producers and recyclers in the C&DW recycling industry, and their main goal is to pursue maximum benefits. If enterprises choose the “not implement” strategy, C&DW may be transported to landfills or illegally dumped [33], which will lead to environmental damage and increase the government’s environmental governance costs [34]. In China, buildings make great contributions to the total energy consumption of a cities [35], and carbon emissions from the construction industry account for 28–34% of total carbon emissions [36], and 73% of carbon emissions are generated in the building materials manufacturing stage [37]. Considering the constraints of administrative means, China emphasizes carbon emission reduction through market methods such as carbon trading under the leadership of the government [38]. In this context, due to carbon emission control, if enterprises choose the “not implement” strategy, it will increase their additional costs for carbon emission reduction. In addition, if either construction enterprises or building materials production enterprises choose the “not implement” strategy, the effect of C&DW recycling cannot be achieved.
To sum up, as the government, construction enterprises, and building materials production enterprises are key stakeholders in the market, the strategic choice of any one party will affect the final strategy of the other two parties. So, this study constructs a three-way evolutionary game model based on these three parties.

2.2. Problem Description and Parameter Setting

According to the costs and benefits of the government, contractors, and recycling plants in the whole life cycle of C&DW, the following hypotheses are proposed:
Hypothesis 1.
The government, construction enterprises and building materials production enterprises are all rational groups seeking to maximize their own profits in the market. Since stakeholders are not completely rational, they usually reach the evolutionarily stable strategy (ESS) through trial and error. This study hypothesizes that the recycling market is regarded as a consistent whole. To simplify the model, regional differences are not considered.
Hypothesis 2.
There are two kinds of strategies for government management departments: regulation and non-regulation. The probability of selecting a regulation strategy is z (0 ≤ z ≤ 1), and the probability of a non-regulation strategy is 1 − z. The probability of construction enterprises participating in C&DW recycling is x (0 ≤ x ≤ 1), and the probability of not participating in C&DW recycling is 1 − x. The proportion of building materials production enterprises choosing the “implement” strategy is y (0 ≤ y ≤ 1), and the probability of “not implement” is 1 − y.
Hypothesis 3.
If the government implements the utilization of C&DW recycling for the benefit of both enterprises, the government will punish the construction enterprises that directly landfill the waste and the building materials enterprises that do not accept the waste. The government’s punishment for construction enterprises and building materials enterprises is b1 and b2, respectively (b1 > 0, b2 > 0).
Hypothesis 4.
The cost of recovery management is an important factor that affects whether an enterprise implements C&DW recycling utilization. Therefore, the government gives subsidies to the enterprises that choose to implement C&DW recycling to reduce the resource cost of enterprises on the whole. The subsidies to construction enterprises and building materials production enterprises are β1 and β2, respectively (β1 > 0, β2 > 0). This study hypothesizes that when the government imposes penalties on construction enterprises that directly landfill waste and building material enterprises that do not participate in recycling, the profits of both enterprises will be reduced. The original profit of construction enterprises without participation in recycling is  p l   ( p l < 0 ) , and then the government penalty is  b 1 p l > 0 . The original profit of building material production enterprises is  p j   ( p j > 0 ) , and at this time the government penalty is  b 2 p j > 0 . When C&DW recycling implementation benefits both enterprises, the net profit after their participation in recycling is higher than that without participation.
Based on the above analysis and research, Table 1 describes all the parameters.

2.3. The Establishment of Tripartite Evolutionary Game Model

According to the model assumptions and parameter definitions, a payoff matrix of government, building materials production enterprises and construction enterprises was obtained, as shown in Table 2.
According to Table 2, the expected utility and average expected revenue of the government choosing to actively regulate or not regulate can be calculated. Denoted by E 11 , E 12 , and E 1 ¯ , respectively, the replicator dynamic equations for the government management department can be expressed as follows:
E 11 = x y   [ R g C g β 1 k δ β 2 ( C k δ ) ] + x ( 1 y ) ( G 1 + b 2 p j β 1 k δ C g C E ) + ( 1 x ) y [ G 1 b 1 p l β 2 ( C k δ ) C E C g ] + ( 1 x ) ( 1 y )   [ G 1 b 1 p l + b 2 p j C E C g ]
E 12 = x y R g x ( 1 y ) C E ( 1 x ) y C E ( 1 x ) ( 1 y ) C E
E ¯ 1 = z E 11 + 1 z E 12
F ( z ) = d z d t = z ( 1 z )   [ x y ( G 1 + R g R g ) + x ( β 1 k δ b 1 p l ) + y ( b 2 p j + β 2 C β 2 k δ ) + ( C g G 1 + b 1 p l b 2 p j ) ]
Then, the research can calculate the expected utility and average expected revenue of the construction enterprises, denoted by E 21 , E 22 , and E 2 ¯ , respectively. The dynamic replication equation of the construction enterprises is obtained by Equation (8).
E 21 = y z   [ λ ( R + φ P ) k δ + β 1 k δ ] + y ( 1 z ) ( λ ( R + φ P ) k δ ) + ( 1 y ) z ( p s + β 1 k δ ) + ( 1 y ) ( 1 z ) p s
E 22 = y z ( p l b 1 p l ) + y ( 1 z ) p l + z ( 1 y ) ( p l b 1 p l ) + ( 1 y ) ( 1 z ) p l
E ¯ 2 = x E 21 + ( 1 x ) E 22  
F ( x ) = d x d t = x 1 x y λ R + λ φ P p s k δ + z β 1 k δ b 1 p l + p s p j
Finally, the research can calculate the expected utility and the average expected revenue of the building materials production enterprises, denoted by E 31 ,   E 32 , a n d   E 3 ¯ , respectively. The average expected benefit of the building materials production enterprises is Equation (12).
E 31 = x z   [ ( 1 λ ) ( R + φ P ) ( C k δ ) + β 2 ( C k δ ) ] + x ( 1 z )   [ ( 1 λ ) ( R + φ P ) ( C k δ ) ] + ( 1 x ) z [ p m + β 2 ( C k δ ) ] + ( 1 x ) ( 1 z ) p m
E 32 = x z ( p j b 2 p j ) + x ( 1 z ) p j + z ( 1 x ) ( p j b 2 p j ) + ( 1 x ) ( 1 z ) p j
E ¯ 3 = y E 31 + ( 1 y ) E 32
F ( y ) = d y d t = y ( 1 y )   [ x ( ( 1 λ ) ( R + φ P ) ( C k δ ) p m ) + z ( β 2 C β 2 k δ + b 2 p j ) + p m p j ]
So, the 3D dynamic system of the evolutionary game is obtained from Equations (4), (8) and (12) namely:
F ( x ) = x ( 1 x )   [ y ( λ R + λ φ P p s k δ ) + z ( β 1 k δ b 1 p l ) + ( p s p j ) ] F ( y ) = y ( 1 y )   [ x ( ( 1 λ ) ( R + φ P ) ( C k δ ) p m ) + z ( β 2 C β 2 k δ + b 2 p j ) + p m p j ] F ( z ) = z ( 1 z )   [ x y ( G 1 + R g R g ) + x ( β 1 k δ b 1 p l ) + y ( b 2 p j + β 2 C β 2 k δ ) + ( C g G 1 + b 1 p l b 2 p j ) ]
Let F(x) = 0, F(y) = 0, F(z) = 0, the research can obtain eight pure strategy solutions of the three-dimensional dynamic system, which are (0,0,0), (0,1,0), (0,0,1), (0,1,1), (1,0,0), (1,0,1), (1,1,0), (1,1,1), respectively. These eight equilibrium points form the boundary of the solution of the three-way evolutionary game. In addition, there exists a mixed strategy solution x * , y * , z * in the system and x * , y * , z * 0,1 ; detailed analysis and calculations are provided in Appendix A.
Taking Q x * , y * , z * = D x * , y * , z * = Z x * , y * , z *
Q ( x * , y * , z * ) = x * y * A + x * B + y * C + D D ( x * , y * , z * ) = y * E + z * F + G Z ( x * , y * , z * ) = x * H + z * I + J
Through calculation, the research can obtain:
x * = z C J H , y * = G z B E , z * = E C G + B F G E A H D I B ± E C G + B F G E A H D I B 2 4 E B G A D G D I C + F C G F A H 2 E B G
Among them, A = G 1 , B = β 1 k δ b 1 p l , C = β 2 C k δ b 2 p j , D = G 1 + b 1 p l + b 2 p j C g , E = λ R + φ P k δ p s , F = β 1 k δ + b 1 p l , G = p s p l , H = 1 λ R + φ P C k δ p m , I = β 2 C k δ + b 2 p j , J = p m p j .

3. Stability Analysis of Equilibrium

3.1. Equilibrium Point Analysis

In this section, the research conducts stability analysis on these eight equilibrium points and then determines the evolutionary game strategy of the system. This study uses Friedman’s theory to analyze the asymptotic stability of these points [39]. By copying the dynamic equations to compute the Jacobian matrix of the system. The different equilibrium points are brought into the Jacobian matrix to calculate the eigenvalues and judge whether the equilibrium point is ESS according to the following criteria: (1) If all three eigenvalues are greater than 0, the equilibrium point is unstable and a source; (2) If the three eigenvalues are all less than 0, the equilibrium point is asymptotically stable, so it is ESS; (3) If there exists at least one eigenvalue less than 0 and one eigenvalue greater than 0, then the equilibrium point is unstable and a saddle point. The specific judgment results and stability conditions are shown in Table 3 and Table 4.
J = d F ( x ) d x d F ( x ) d y d F ( x ) d z d F ( y ) d x d F ( y ) d y d F ( y ) d z d F ( z ) d x d F ( z ) d y d F ( z ) d z
Among them:
d F ( x ) d x = 1 2 x y λ R + φ P k δ p s + z β 1 k δ b 1 p l + p s p l
d F ( x ) d y = x 1 x λ R + φ P k δ p s
d F ( x ) d z = x 1 x β 1 k δ + b 1 p l
d F ( y ) d x = y 1 y 1 λ R + φ P C k δ p m
d F y d y = 1 2 y x 1 λ R + φ P C k δ p m + z β 2 C k δ + b 2 p j + p m p j
d F ( y ) d z = y 1 y β 2 C k δ + b 2 p j
d F ( z ) d x = z z 1 y G 1 + R g R g + β 1 k δ b 1 p l
d F ( z ) d y = z z 1 x G 1 + R g R g + b 2 p j + β 2 C k δ
d F z d z = ( 2 z 1 ) x y G 1 + R g R g + x β 1 k δ b 1 p l + y ( b 2 p j + β 2 C k δ ) + ( C g G 1 + b 1 p l b 2 p j

3.2. Analysis of Evolutionary Stability Strategy

According to the stability conditions of the above eight equilibrium points, the difference between income and cost determines the choice of the three subjects. Based on the circular economy theory [40], the evolution process of C&DW disposal can be divided into three stages: the initial stage, the development stage, and the mature stage; in this section, the stability of equilibrium points at different stages is analyzed.
Initial stage: According to Table 4, the initial stage needs to be satisfied p s < p l ;   p m < p j ;   C g G 1 + b 1 p l b 2 p j > 0 . At this stage, the government tends not to supervise because the imperfect laws and policies, regional economic benefits, regulatory costs, and other factors. Due to the high cost of producing recycled products and the lack of quality assurance of recycled products, building materials production enterprises also tend not to implement the strategy of building waste recycling. At this time, most construction enterprises mainly transport C&DW to landfills for treatment. Therefore, the high cost of government supervision and the low profit of construction enterprises and building materials production enterprises become the main factors that hinder stakeholders from participating in resource utilization.
Developmental stage: Enterprises focus on profit maximization, and most choose not to implement C&DW recycling, which leads to an increase in carbon emissions. With the increasingly serious environmental pollution and the increasing cost of environmental governance, the government will take an active part in the supervision. As a result of unsound government supervision channels and other factors, construction enterprises and building materials production enterprises still choose not to participate in the recycling of C&DW. Therefore, this phase corresponds to the equilibrium point A (0,0,1).
So, in order to promote cooperation between construction enterprises and building materials production enterprises, the government has increased the penalties and subsidies for construction enterprises and building materials production enterprises. To pursue the maximization of benefits and realize the sustainable development of the construction industry, the decision-making of the enterprises will tend to the recycling and utilization of C&DW. In the developmental stage of industry development, the C&DW recycling industry has begun to take shape and the corresponding optimal ESS is F (1,1,1).
Mature stage: After a long period of development, the C&DW recycling market tends to mature and the basic market has been fully established. At this time, recycling C&DW can bring even more benefits, so the willingness of construction enterprises and building materials production enterprises to participate in recycling is gradually increasing. In the absence of regulatory oversight, the two sides of the cooperation slowly formed and the strategy of the three parties reached stability at point F (0,1,1). In this case, all three parties satisfy λ R + φ P k δ > p l , 1 λ R + φ P C k δ > p j , R g R g + β 1 k δ + C g + C k δ β 2 > 0 . Therefore, the government should balance the interests, grasp the strength of rewards and punishments to promote the sustainable development of the system.

4. Numerical Simulation

To illustrate the above analysis, this study uses MATLAB 2021a for numerical simulation to show the resource-based decision-making process of the three parties in a more intuitive way. Since the C&DW recycling industry is in the initial stage of development in most developing countries, government policy regulation is considered to be an effective approach. Therefore, this research analyzes the impact of changes in government-related parameters on the tripartite participants in the early development stage, analyzes the influence of different parameters on the evolution results and verifies the correctness of the conclusions in this section. It provides theoretical guidance for the government to effectively promote the development of the C&DW recycling industry.

4.1. Tripartite Participants’ Evolution Path Graph Industry Development

According to the stability analysis above, on the premise of meeting the stability conditions of each stage, we set the following parameters for simulation analysis (Table 5).

4.1.1. Initial Stage

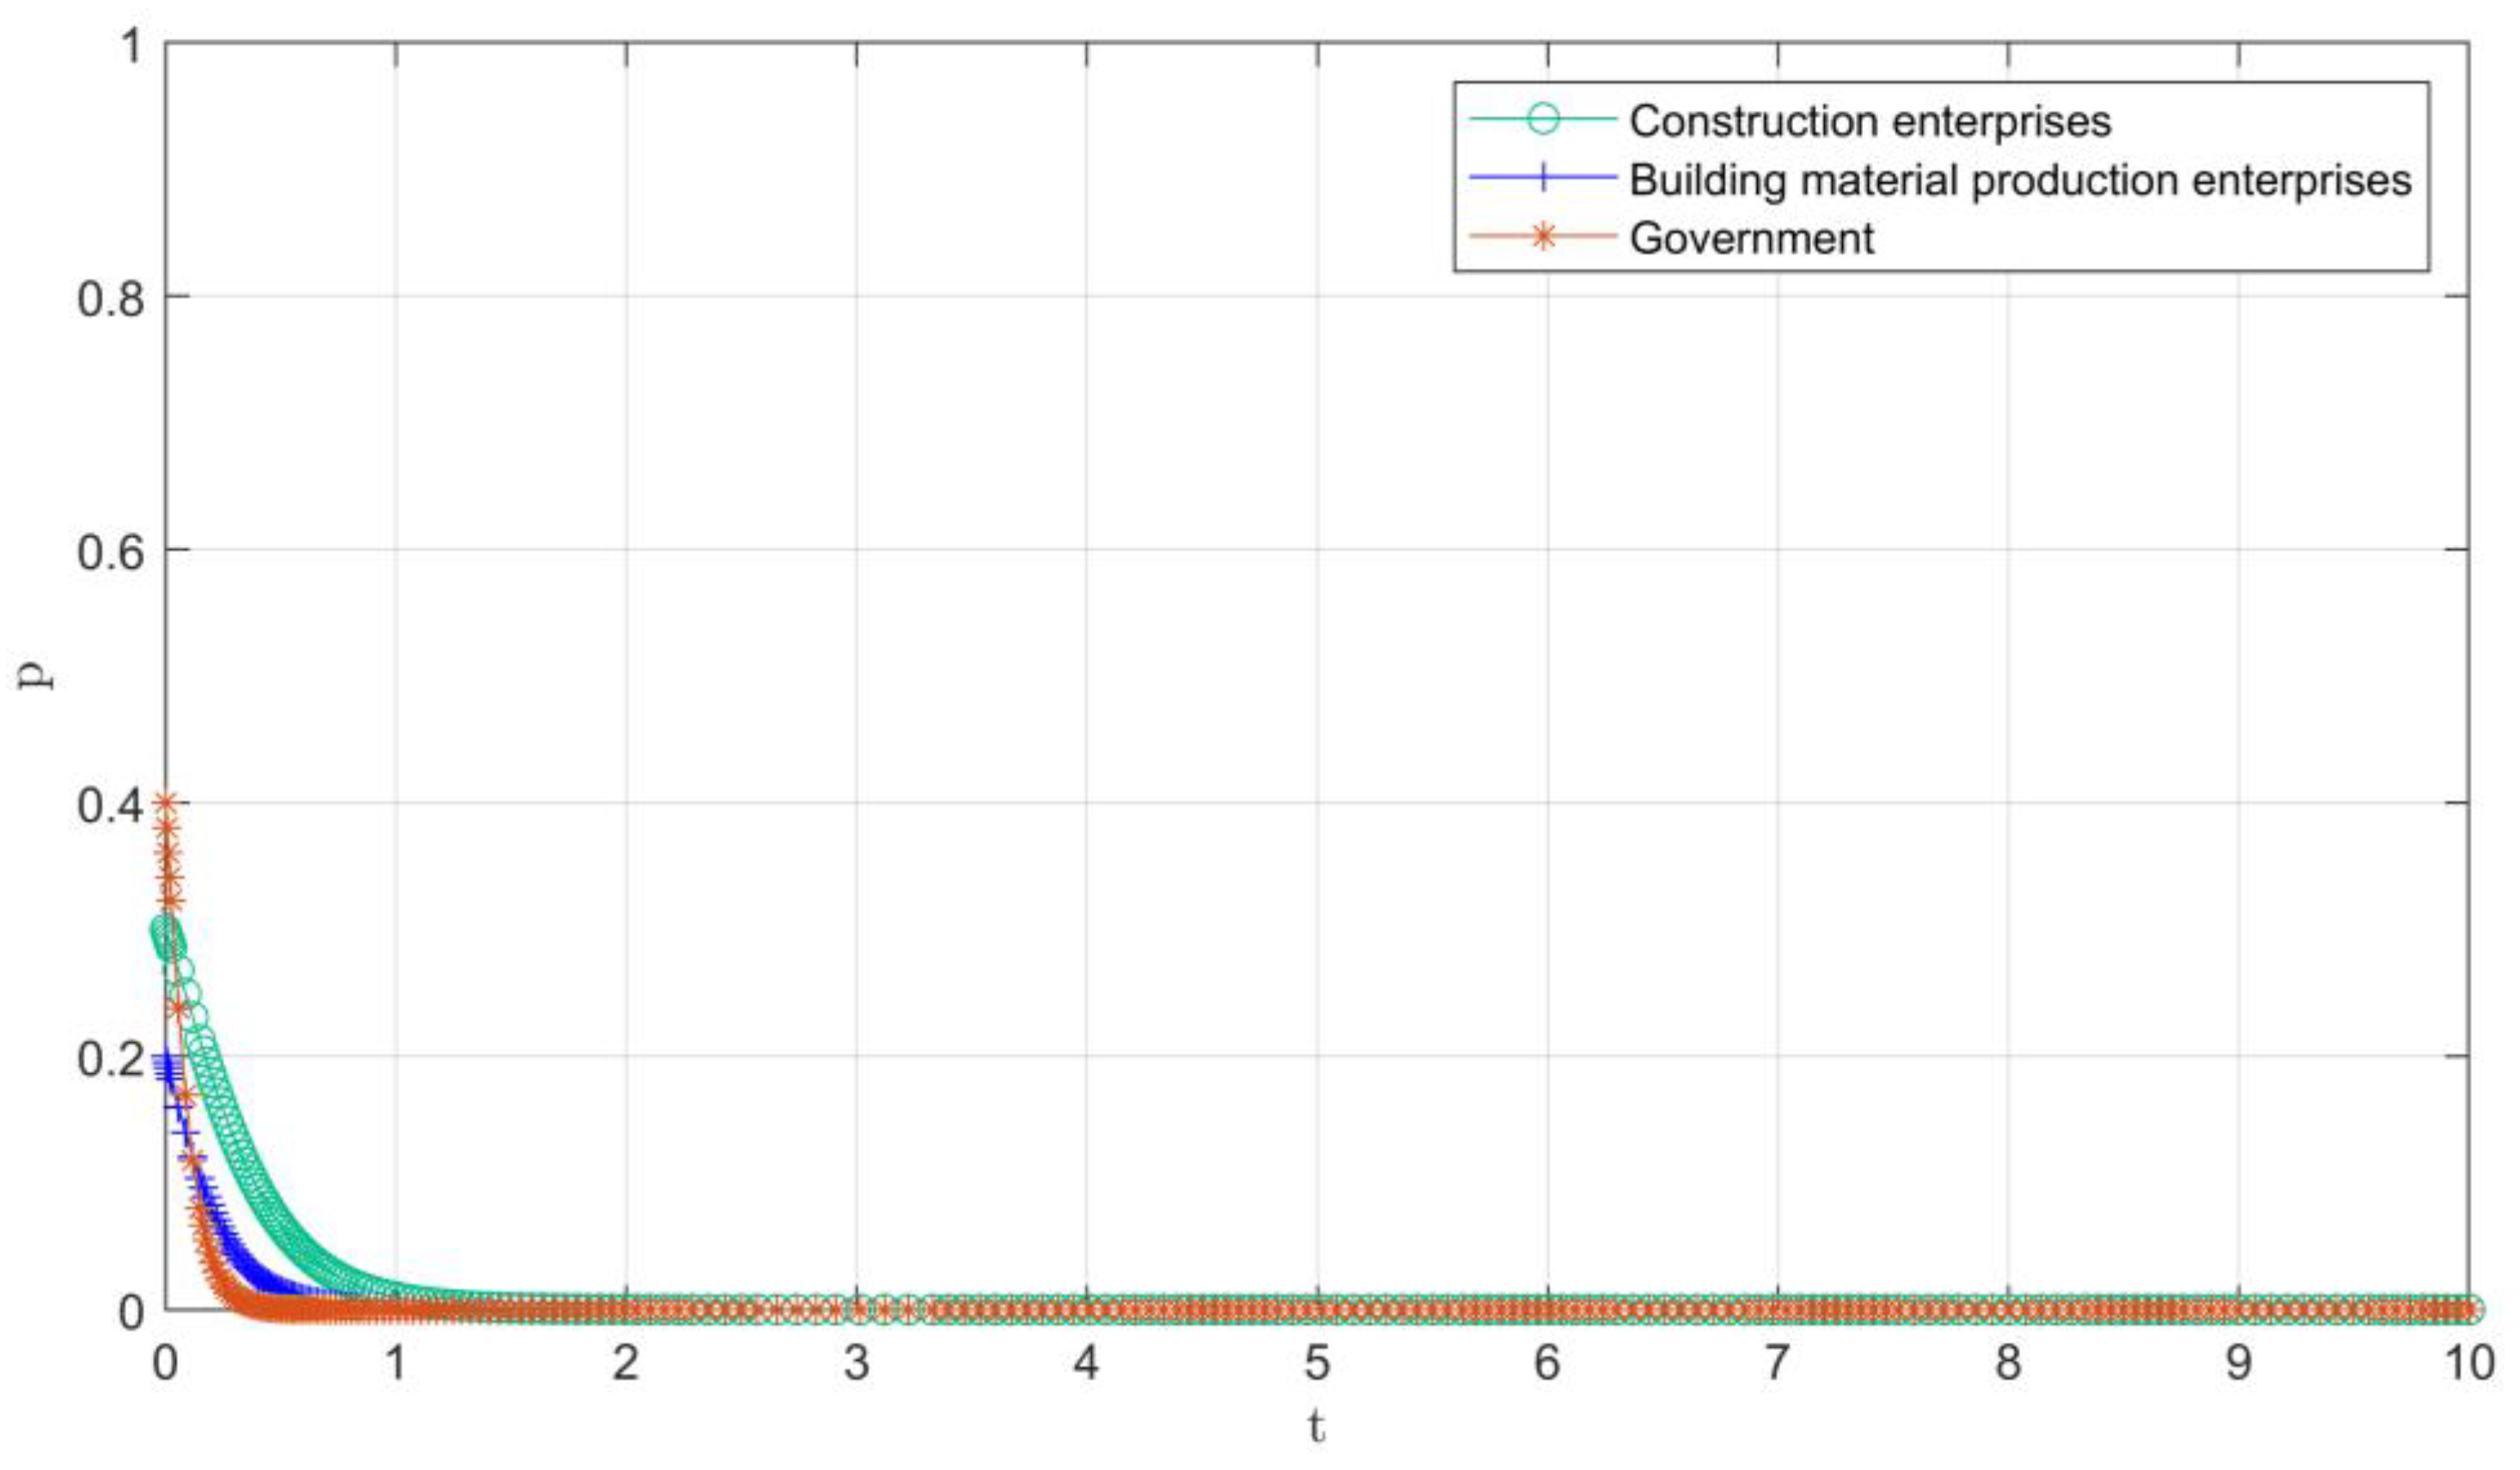
To study how to make trade-offs among stakeholders of C&DW recycling in the initial stage, the setting parameters should meet p s < p l ;   p m < p j ;   C g G 1 + b 1 p l b 2 p j > 0 and x = 0.3, y = 0.2, z = 0.4. So, in this stage, this paper selects the parameter set in Table 4 to fit the current situation of China’s C&DW recycling industry. The final evolution path is shown in Figure 2. It can be found that with the passage of time, all three parties of the evolutionary game evolve to the point (0,0,0), which indicates that all three parties tend not to enter the C&DW recycling market. The government tends to end up not supervising because of the high cost of regulation. However, the profit of C&DW recovery for construction enterprises and building materials enterprises is smaller than that of not implementing recovery, and the risk of unilateral choice for enterprises to enter the market is too high. Hence, neither of the three parties chose to implement this strategy in the end.

4.1.2. Developmental Stage

In the early development stage, the probability of government supervision, construction enterprises and building materials enterprises participating in C&DW recycling is set as 0.4, 0.3, and 0.6, and request, β 1 k δ + p s < p l + b 1 p l , β 2 C k δ + p m < p j b 2 p j , C g G 1 + b 1 p l b 2 p j < 0 . This paper selects the set of parameters in Table 4, and the final evolution path is shown in Figure 3. Due to various social problems caused by the massive accumulation of C&DW, the government will actively participate in the regulation and control of the C&DW market, including rewarding and punishing measures for construction enterprises and building materials production enterprises to guide enterprises to recycle C&DW. So, the government arrives at “1” very quickly in a very short period of time. However, due to the influence of various factors such as the unsound regulatory channels in the early stage of the government, and high cost risks and the constraints of immature recycling technology, the enterprise finally stabilized at the “0” point after a long time of evolution. Finally, the three parties reach equilibrium at (0,0,1).

4.1.3. Mid-Term Development Stage

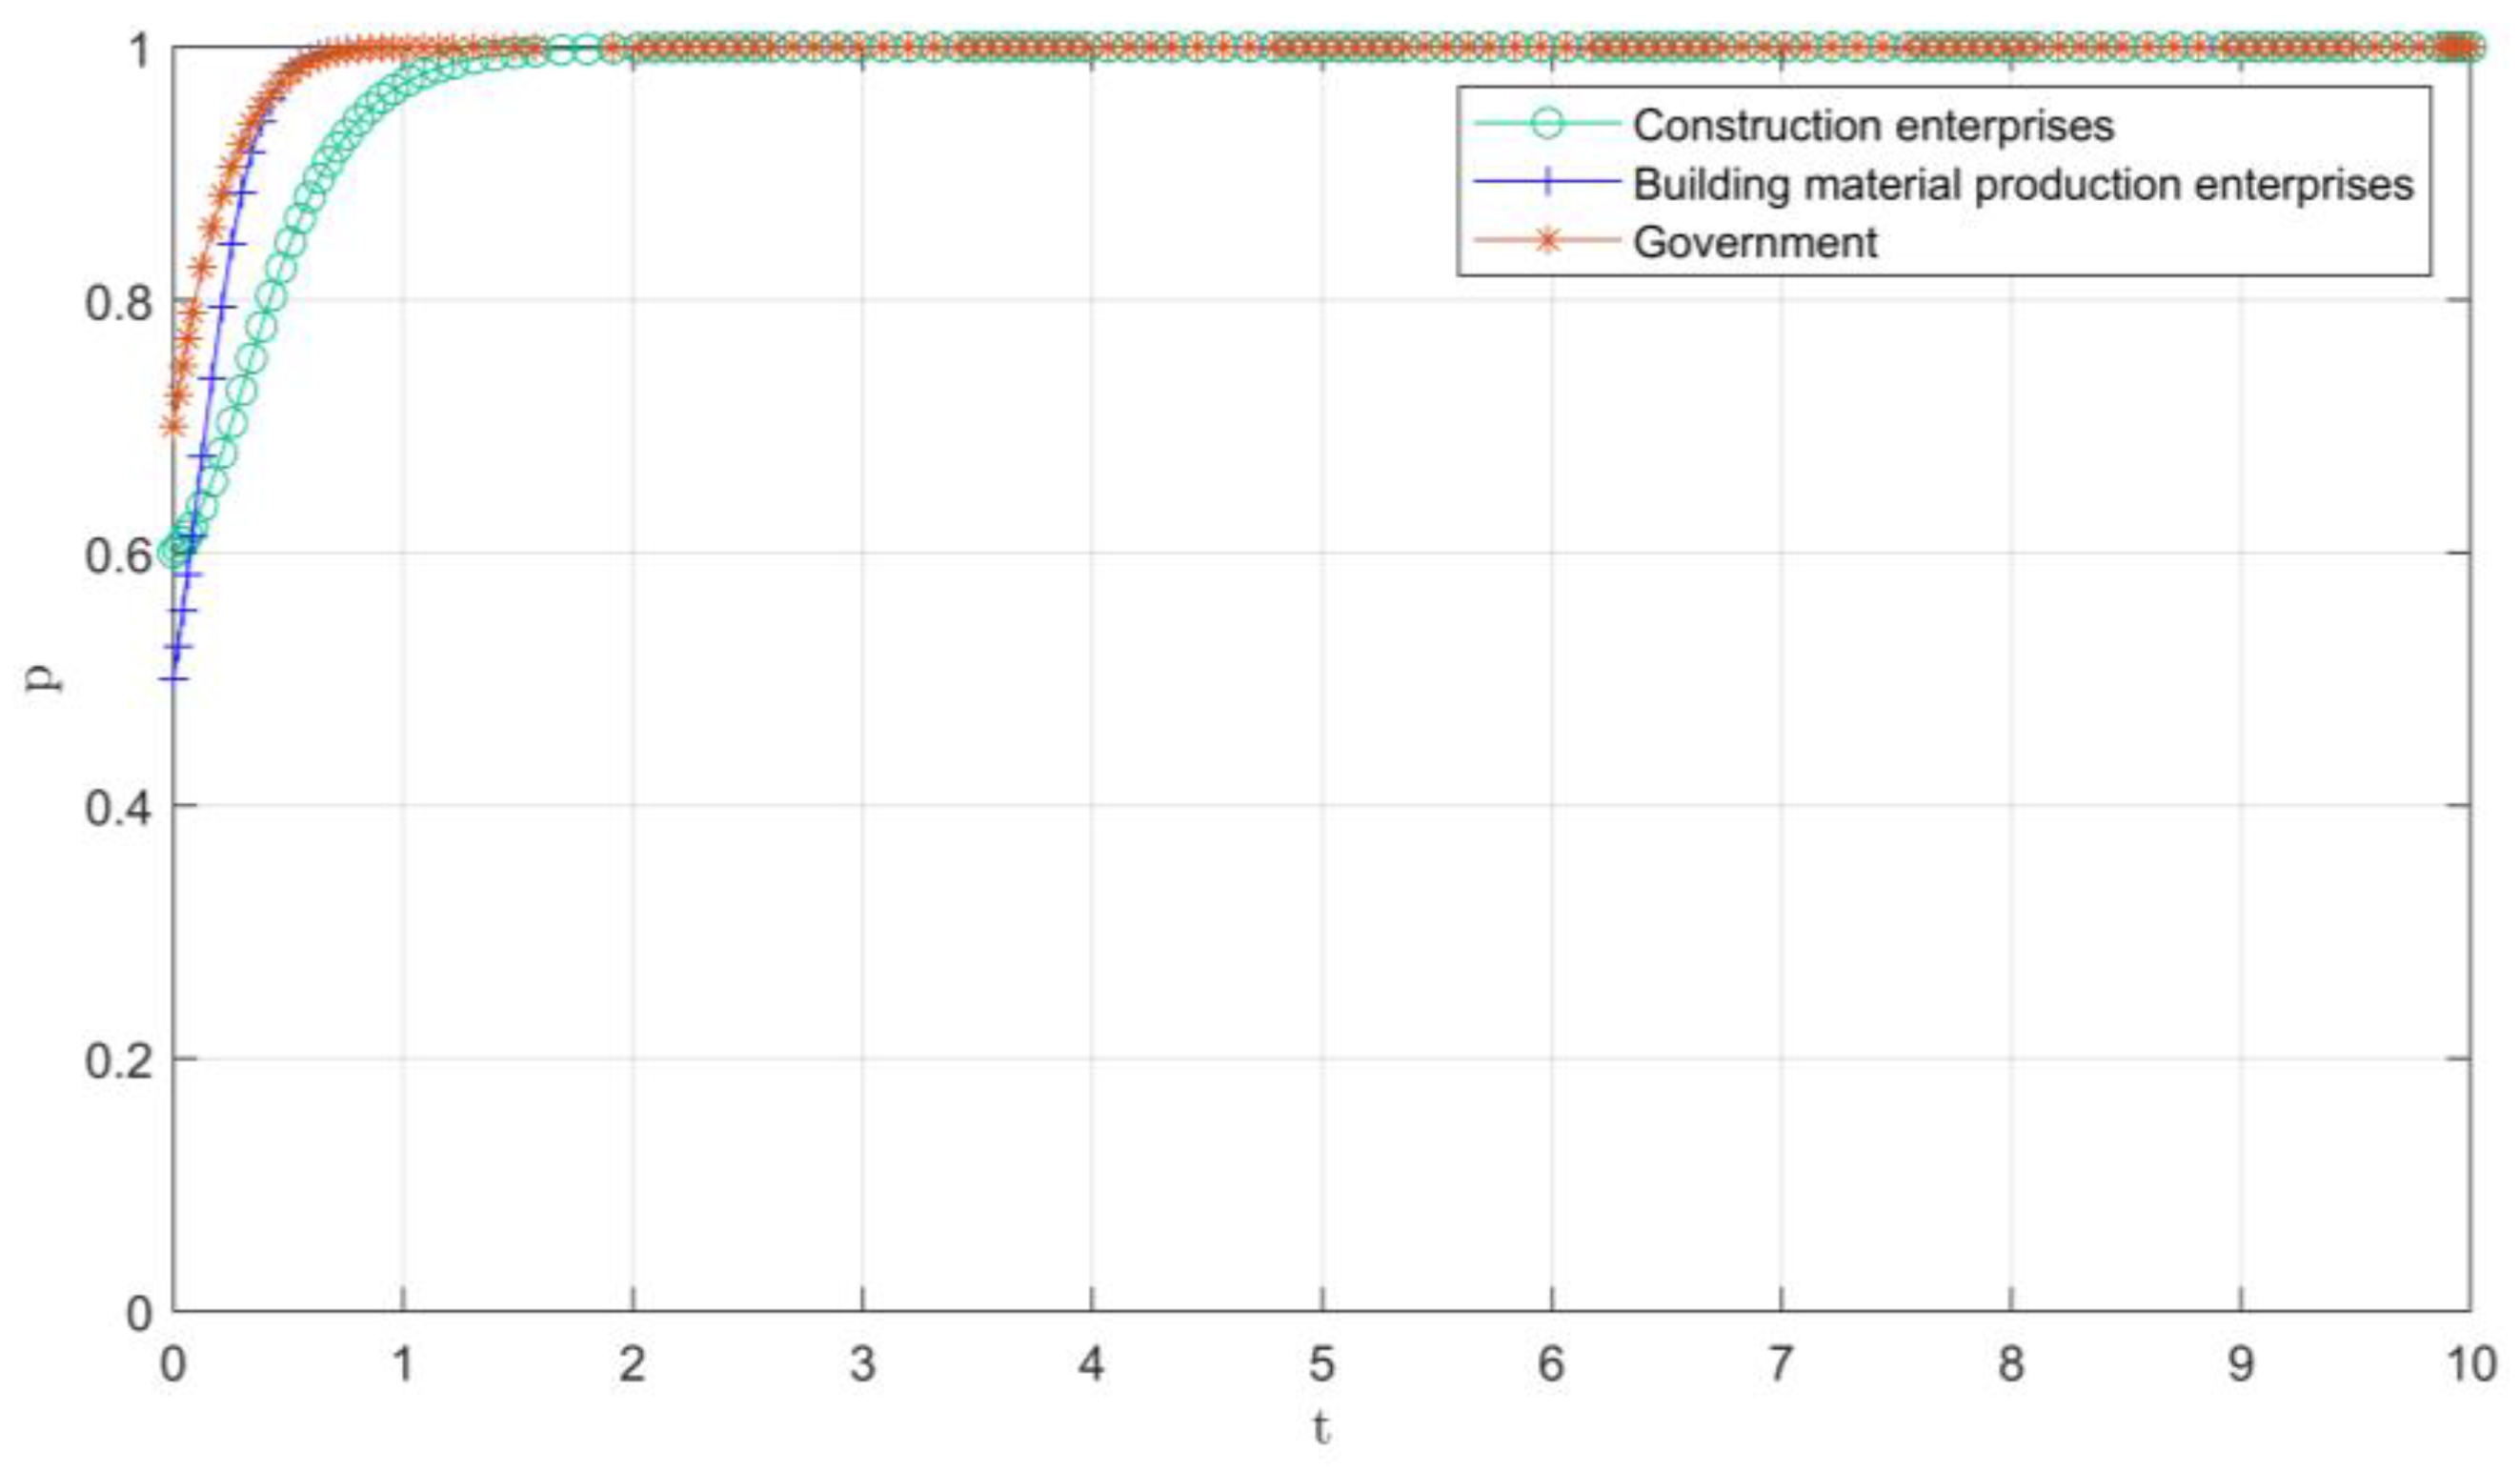
In the mid-term development stage, the research set the probability of active government supervision and participation of construction enterprises and building materials enterprises in C&DW recycling as 0.6, 0.5, and 0.7. In order to satisfy the system evolution path (1,1,1) in the development stage, the research should satisfy the condition λ R + φ P k δ + β 1 k δ b 1 p l p l > 0 , 1 λ R + φ P C k δ + β 2 C k δ > p j b 2 p j , R g R g + C g + β 1 k δ + C k δ β 2 < 0 . We select the set of parameters in Table 4, and the final evolution path is shown in Figure 4. With the passage of time, the government, construction enterprises, and building materials production enterprises have evolved at a fast speed and stabilized to the “1” point. This shows that the government actively participates in market supervision at this stage. At the same time, construction enterprises and building materials production enterprises also actively enter the recycling market. Finally, all three parties will actively promote the development of C&DW recycling and reach a cooperation strategy at point (1,1,1).

4.1.4. Mature Stage

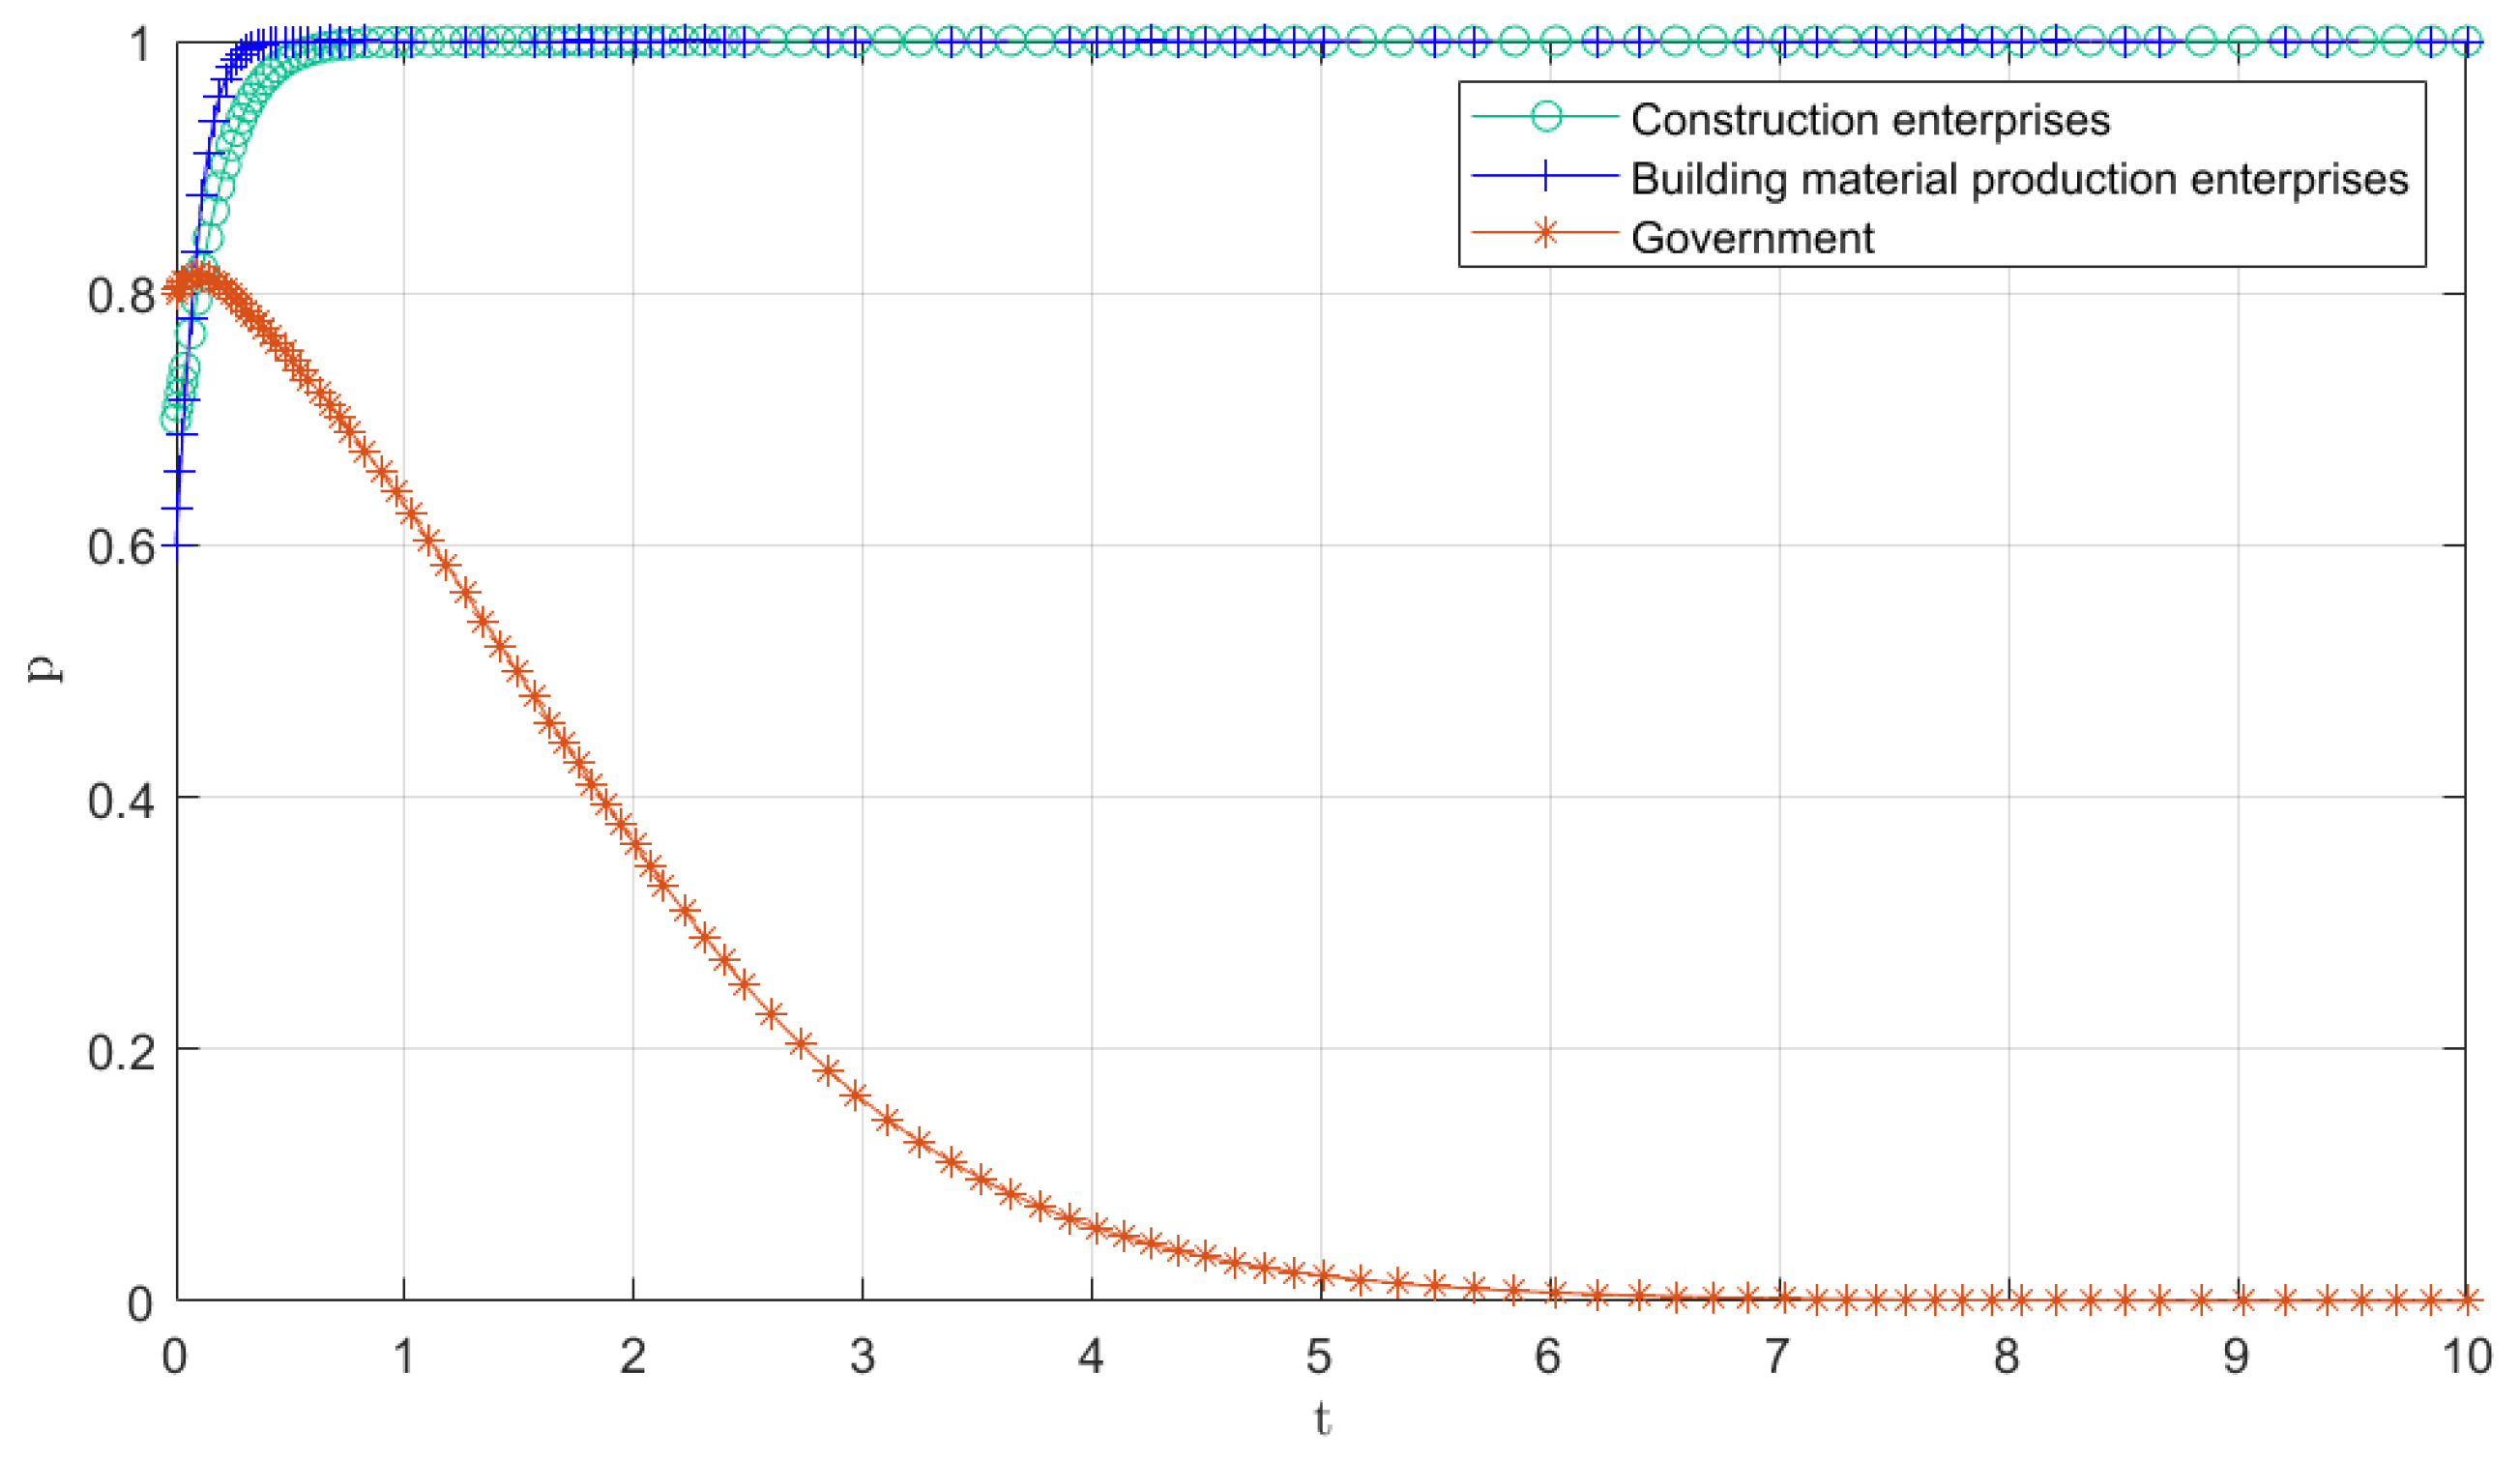
In the mature stage, the probability of active government supervision and participation of construction enterprises and building materials enterprises in C&DW recovery is set as 0.7, 0.6, and 0.8. To satisfy the system evolution path (0,1,1) in the mature stage, the parameter needs to satisfy the condition that λ R + φ P k δ + β 1 k δ b 1 p l p l > 0 , 1 λ R + φ P C k δ + β 2 C k δ > p j b 2 p j , R g R g + C g + β 1 k δ + C k δ β 2 > 0 . So, the research chooses the parameters set in Table 4, and the final evolution path is shown in Figure 5. At this stage, construction enterprises and building materials manufacturers reached cooperation in a short time and participated in the recycling market, while the government gradually withdrew from the market after a long period of evolution, and finally evolved into a “0” point. This shows that in the mature stage of the C&DW recycling industry, the proportion of enterprises choosing to cooperate and implement recycling strategies is increasing since C&DW recycling can bring more benefits. However, because of the perfection of the market, the probability of government regulation first rises and then slowly declines, and finally, the government behavior strategy evolves into non-regulation. Eventually, the three parties reach equilibrium at (1,1,0).

4.2. Sensitivity Analysis

According to the stability condition ( λ R + φ P k δ + β 1 k δ b 1 p l p l > 0 ;   1 λ R + φ P C k δ + β 2 C k δ > p j b 2 p j ;   R g R g + C g + β 1 k δ + C k δ β 2 < 0 ) of the ideal point, only when the benefits of C&DW recovery, which are implemented by construction enterprises, building materials production enterprises, and the government are greater than the benefits of non-implementation, the behaviors of each subject will gradually evolve into (implementation, implementation, and supervision). Therefore, according to the scenarios and conditions in China, the research explores the impact of key parameters on the system evolution results.

4.2.1. Impact of Cost of Government Regulation on Evolutionary Results

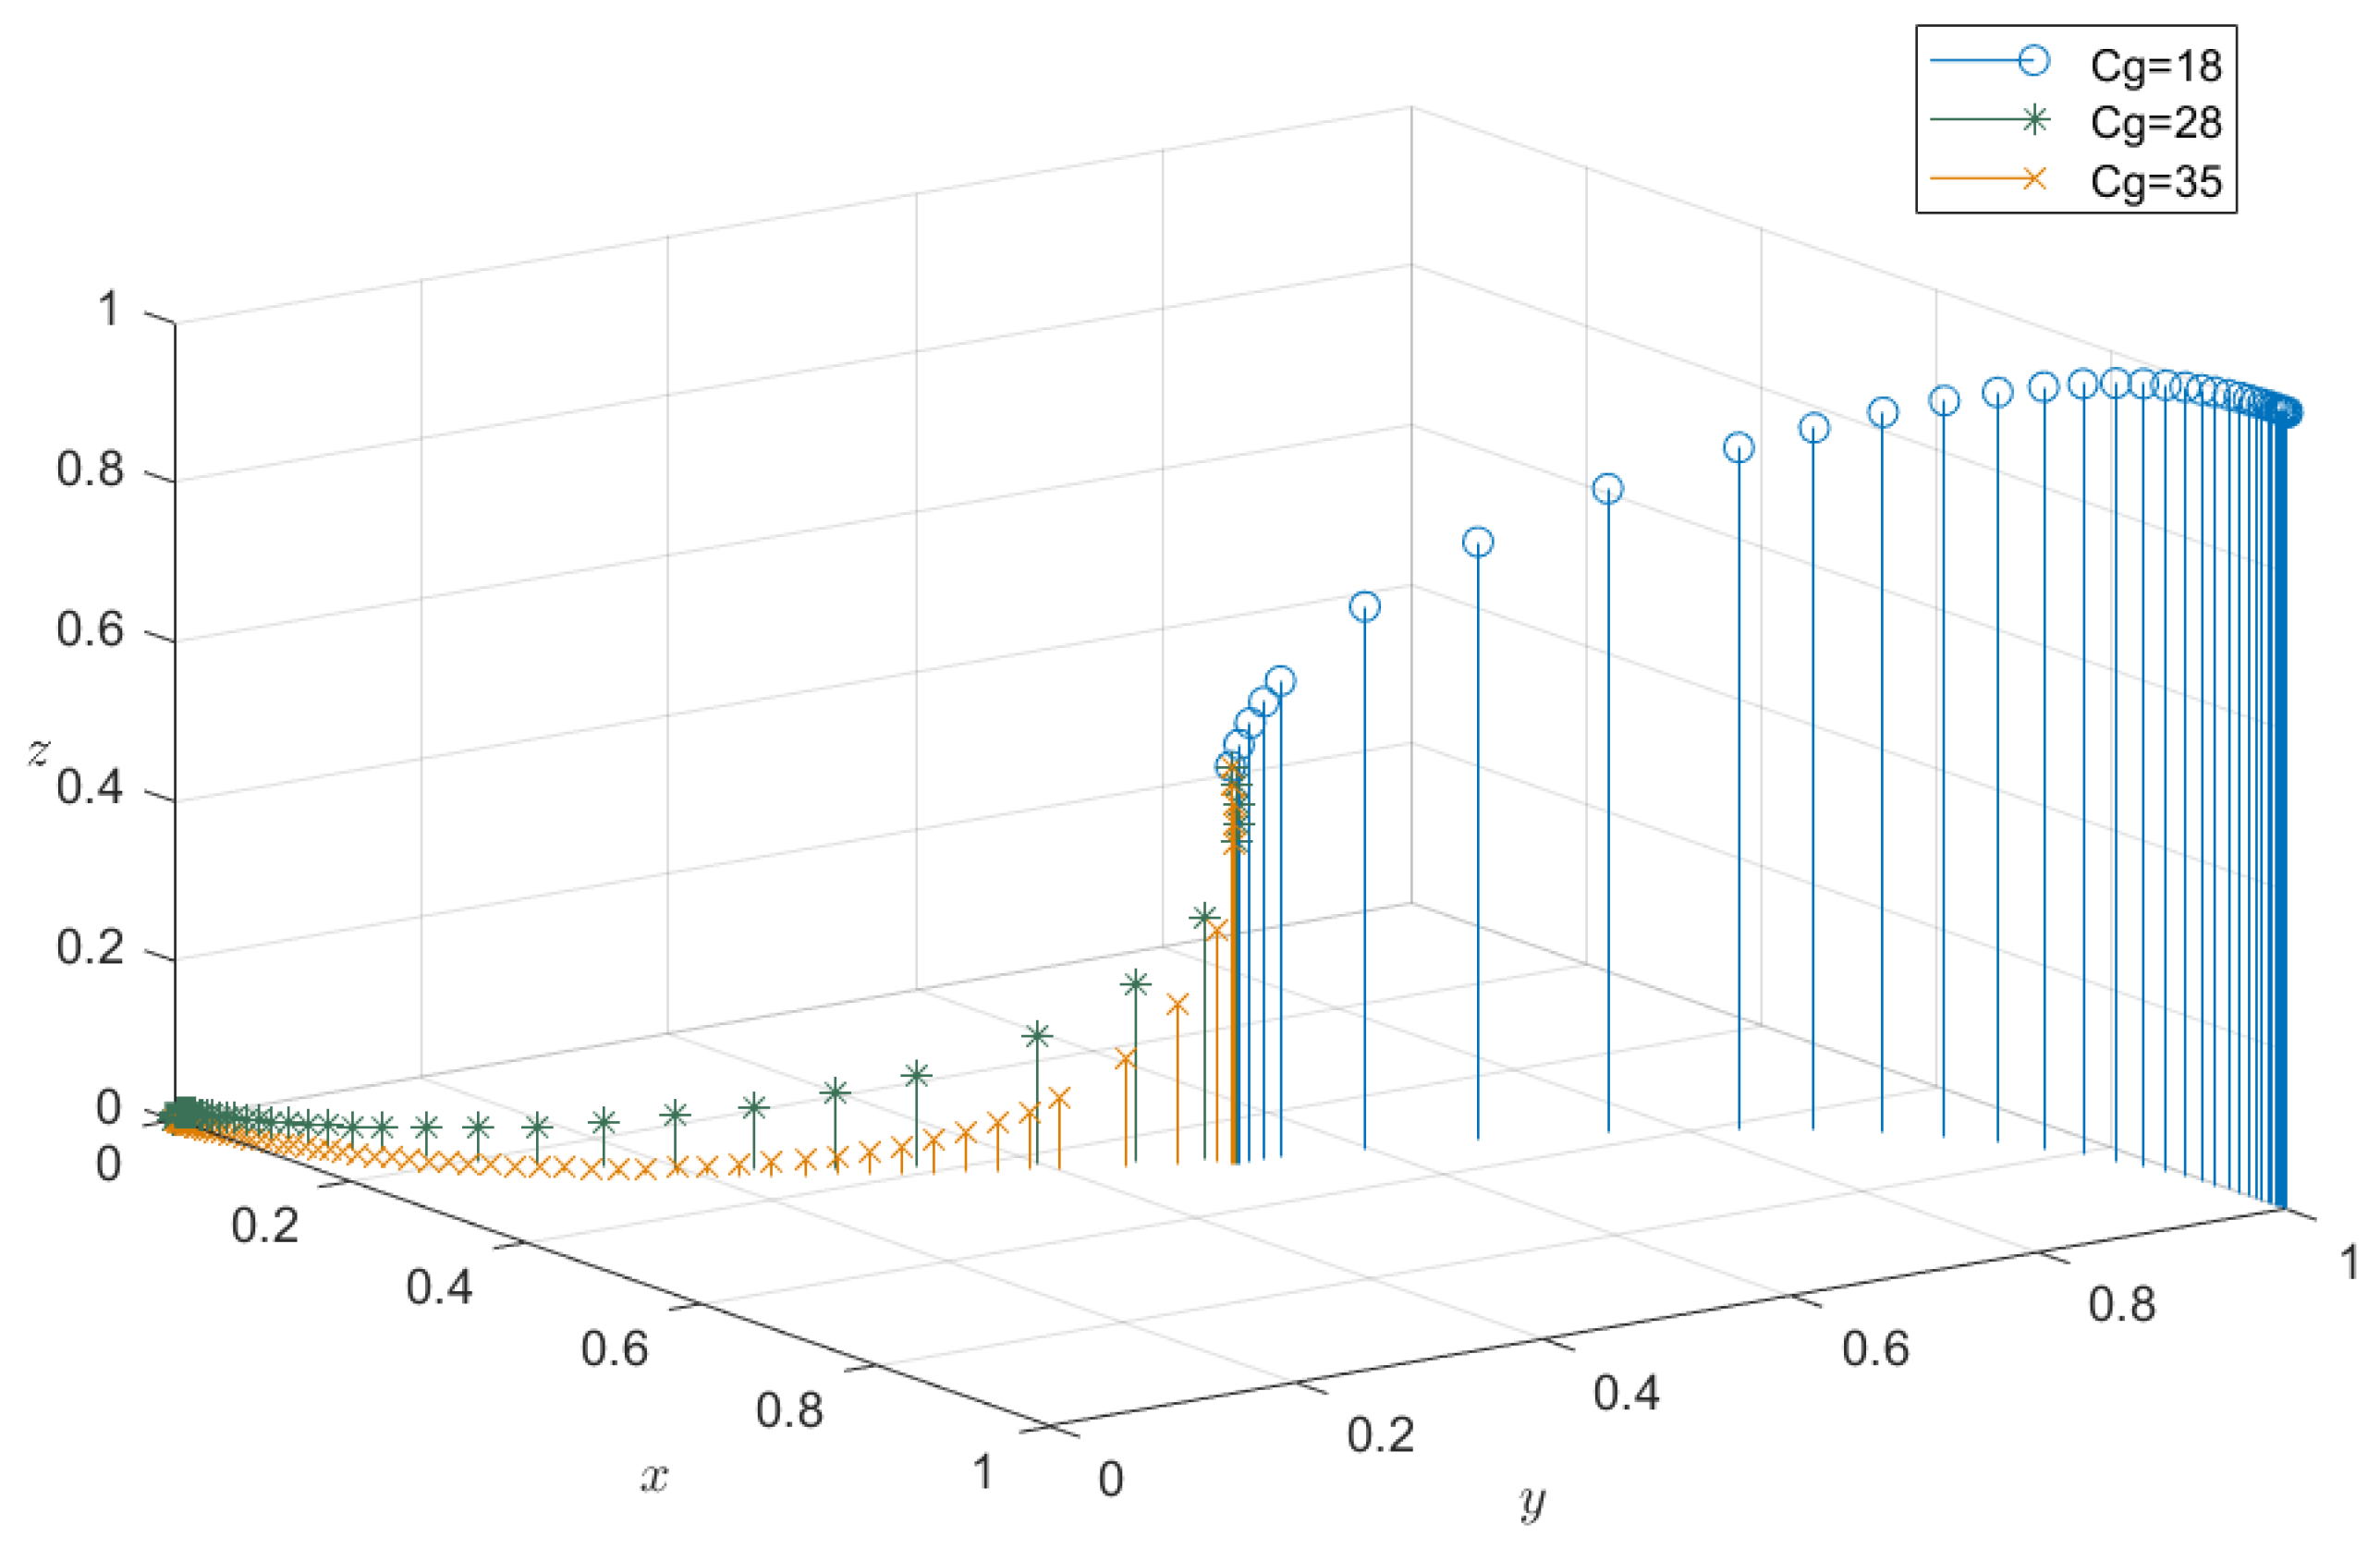
For the cost of government regulation, the values set are 18, 28, and 35, respectively. The evolution results of the system dynamics equation are shown in Figure 6. When C g = 18 , the government, construction enterprises, and building material production enterprises all smoothly evolve to the “1” point, which indicates that when the government takes some measures to intervene in the C&DW recycling market, enterprises will be promoted to participate in recycling. When the cost of government regulation ( C g ) increases to 28 and 35, the development speed of the government’s stabilization strategy gradually slows down until it evolves to “0”. At the same time, the development of enterprises also gradually tends not to implement the strategy. At this point, construction enterprises and building materials production enterprises tend not to implement the C&DW recycling strategy. This indicates that excessive cost of government regulation may reduce government supervision and hinder the willingness of construction enterprises and building materials production enterprises to implement recycling strategies.

4.2.2. Impact of Coefficient of Subsidies on Evolutionary Results

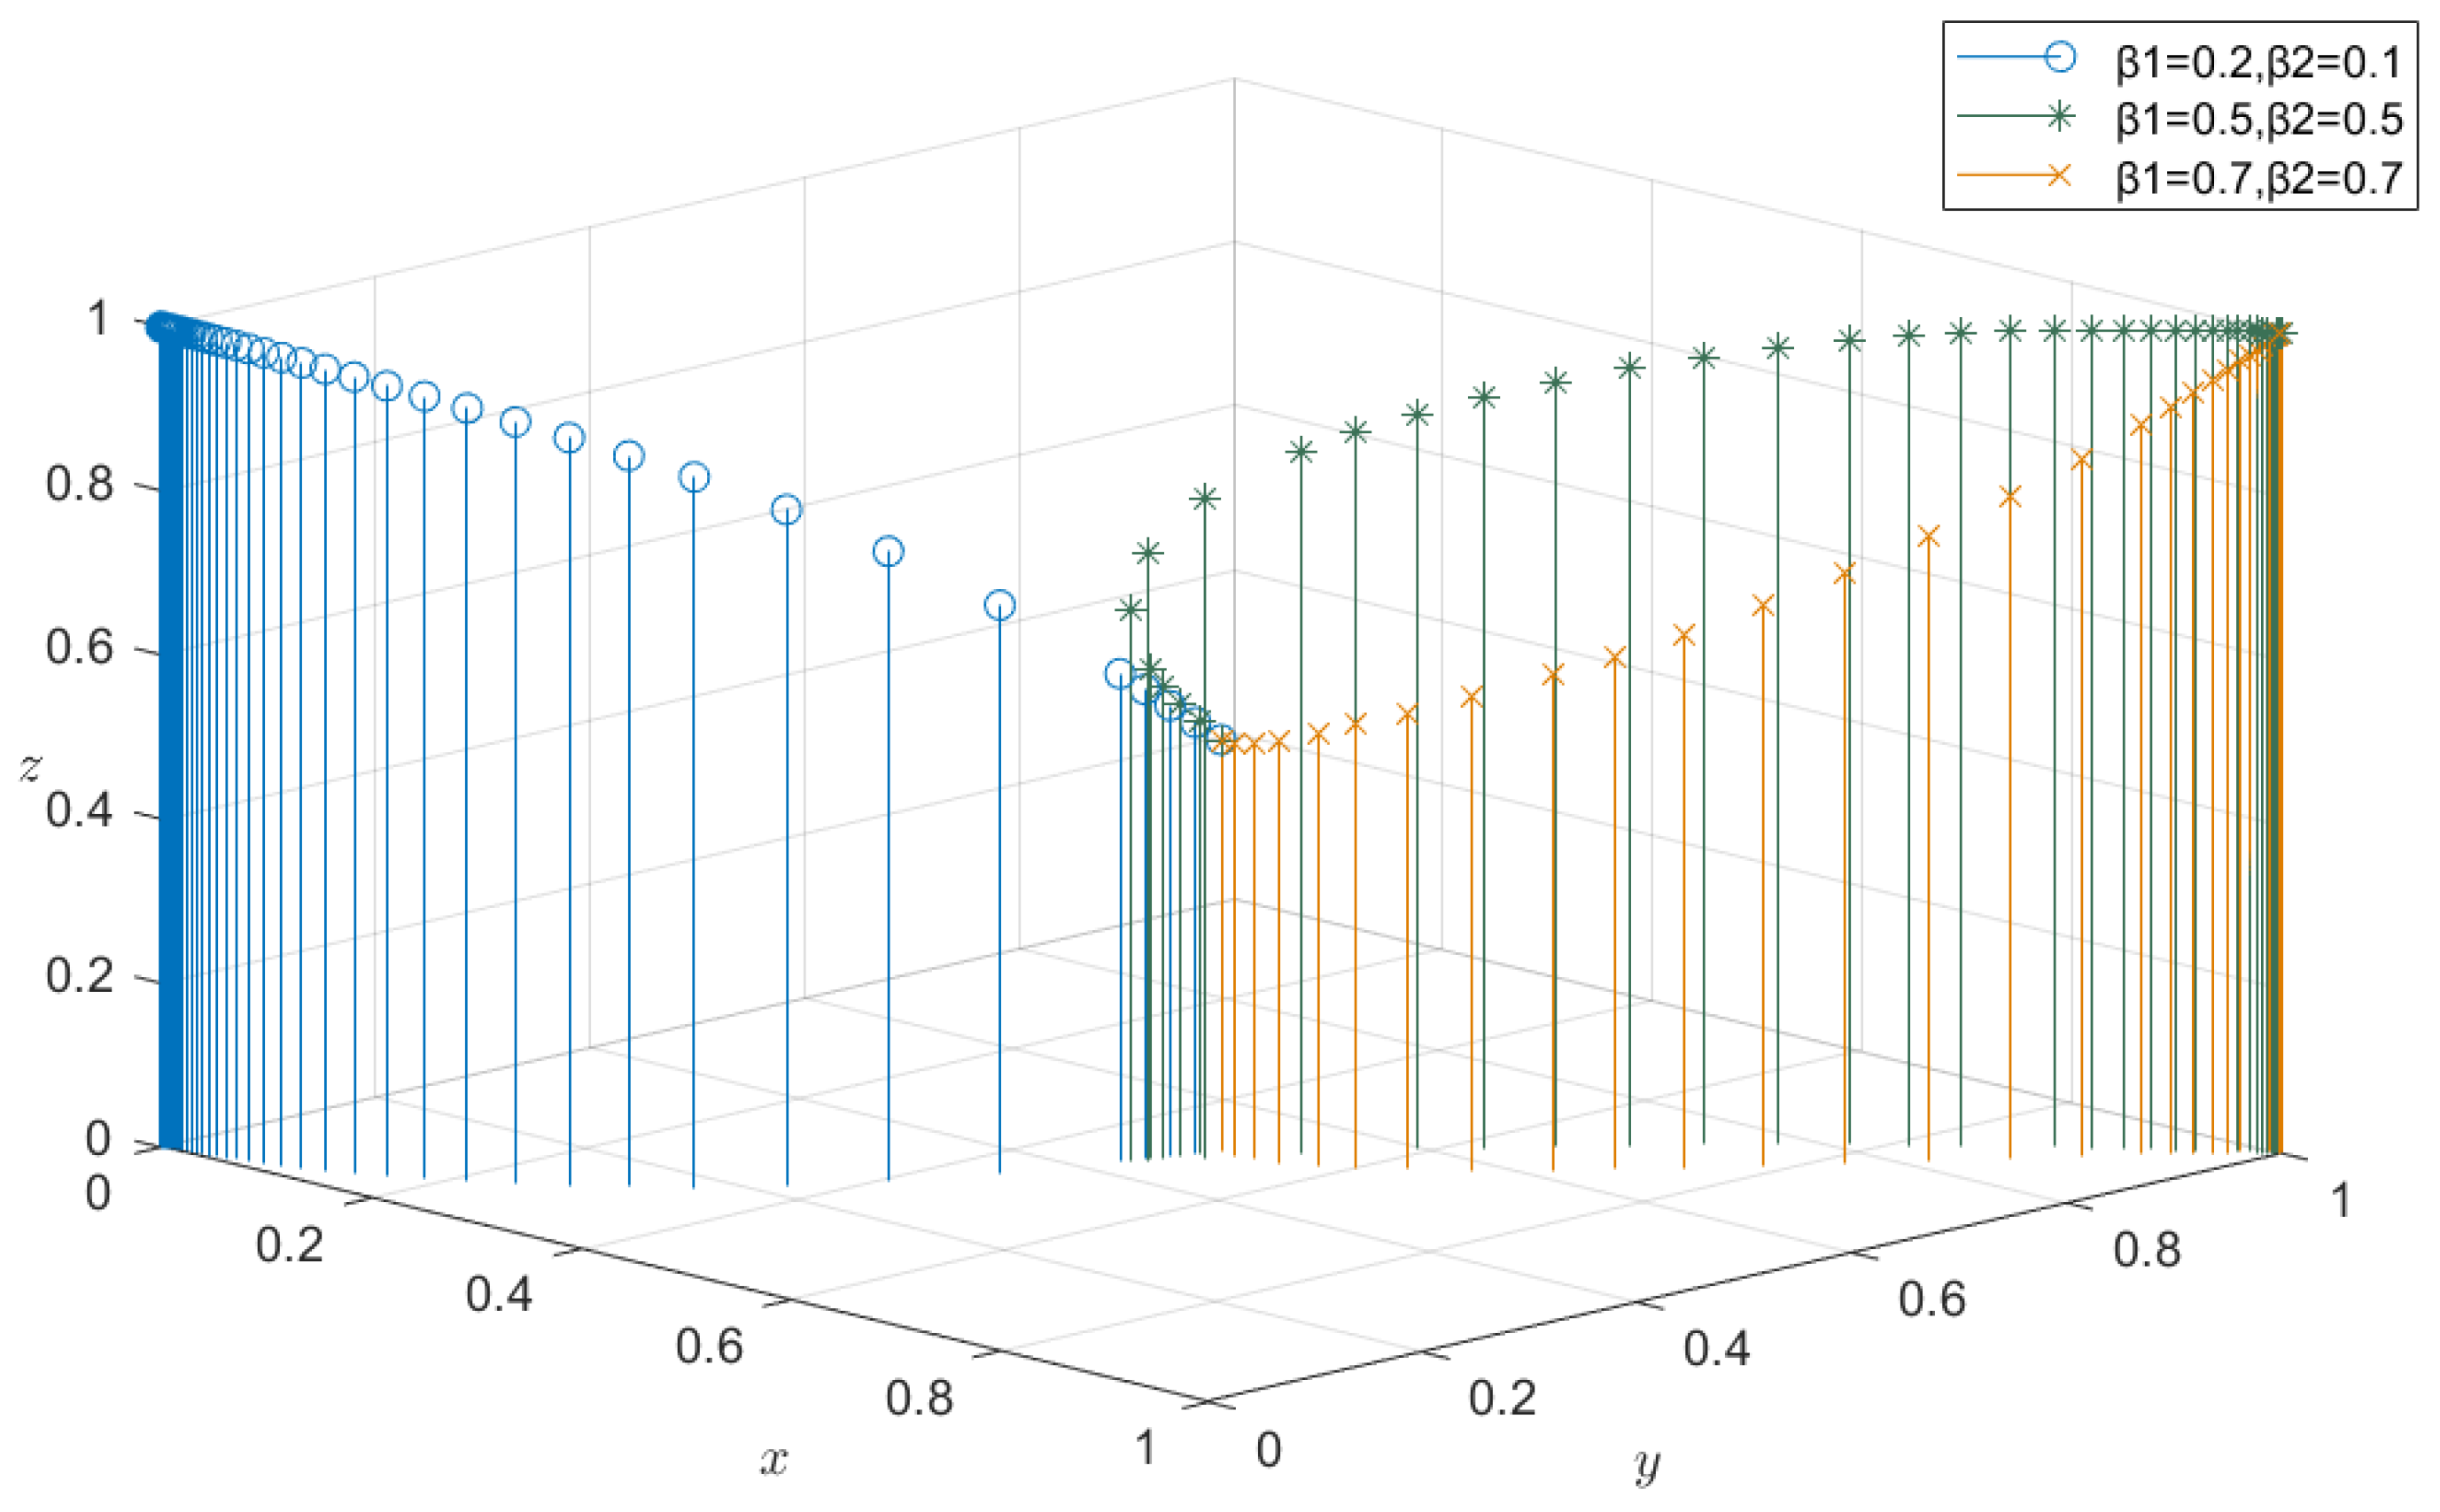
The government encourages construction enterprises and building materials production enterprises to participate in C&DW recycling through subsidy policies. Therefore, the subsidy intensity of construction enterprises and building materials production enterprises are, respectively, set as β 1 = 0.2 ,   0.5 ,   0.7 and β 2 = 0.1 ,   0.5 ,   0.7 . Figure 7 shows the impact of subsidy intensity on stakeholders. When β 1 = 0.2 ,   β 2 = 0.1 , the government eventually evolves into a stable strategy of implementing supervision, but construction enterprises and building materials enterprises eventually do not implement C&DW recycling. This indicates that when the subsidy is too small, building materials production enterprises and building materials production enterprises are less willing to participate in C&DW recycling. When the subsidy coefficient increases by β 1 = 0.5 and β 2 = 0.5 , the government subsidy is larger, and recycling can bring higher benefits to enterprises. Construction enterprises and building materials production enterprises will actively participate in recycling. Finally, when the subsidy coefficient increases by β 1 = 0.7 and β 2 = 0.7 , the subsidy coefficient is too large. So, if it exceeds the fiscal expenditure, the government’s willingness to regulate will become low. All in all, considering the long-term development of the country, the government is more inclined to subsidize to promote the coordinated development of the enterprise. However, the intensity of subsidy policy should be moderate to establish a good industrial chain.

4.2.3. Impact of Coefficient of Penalties on Evolutionary Results

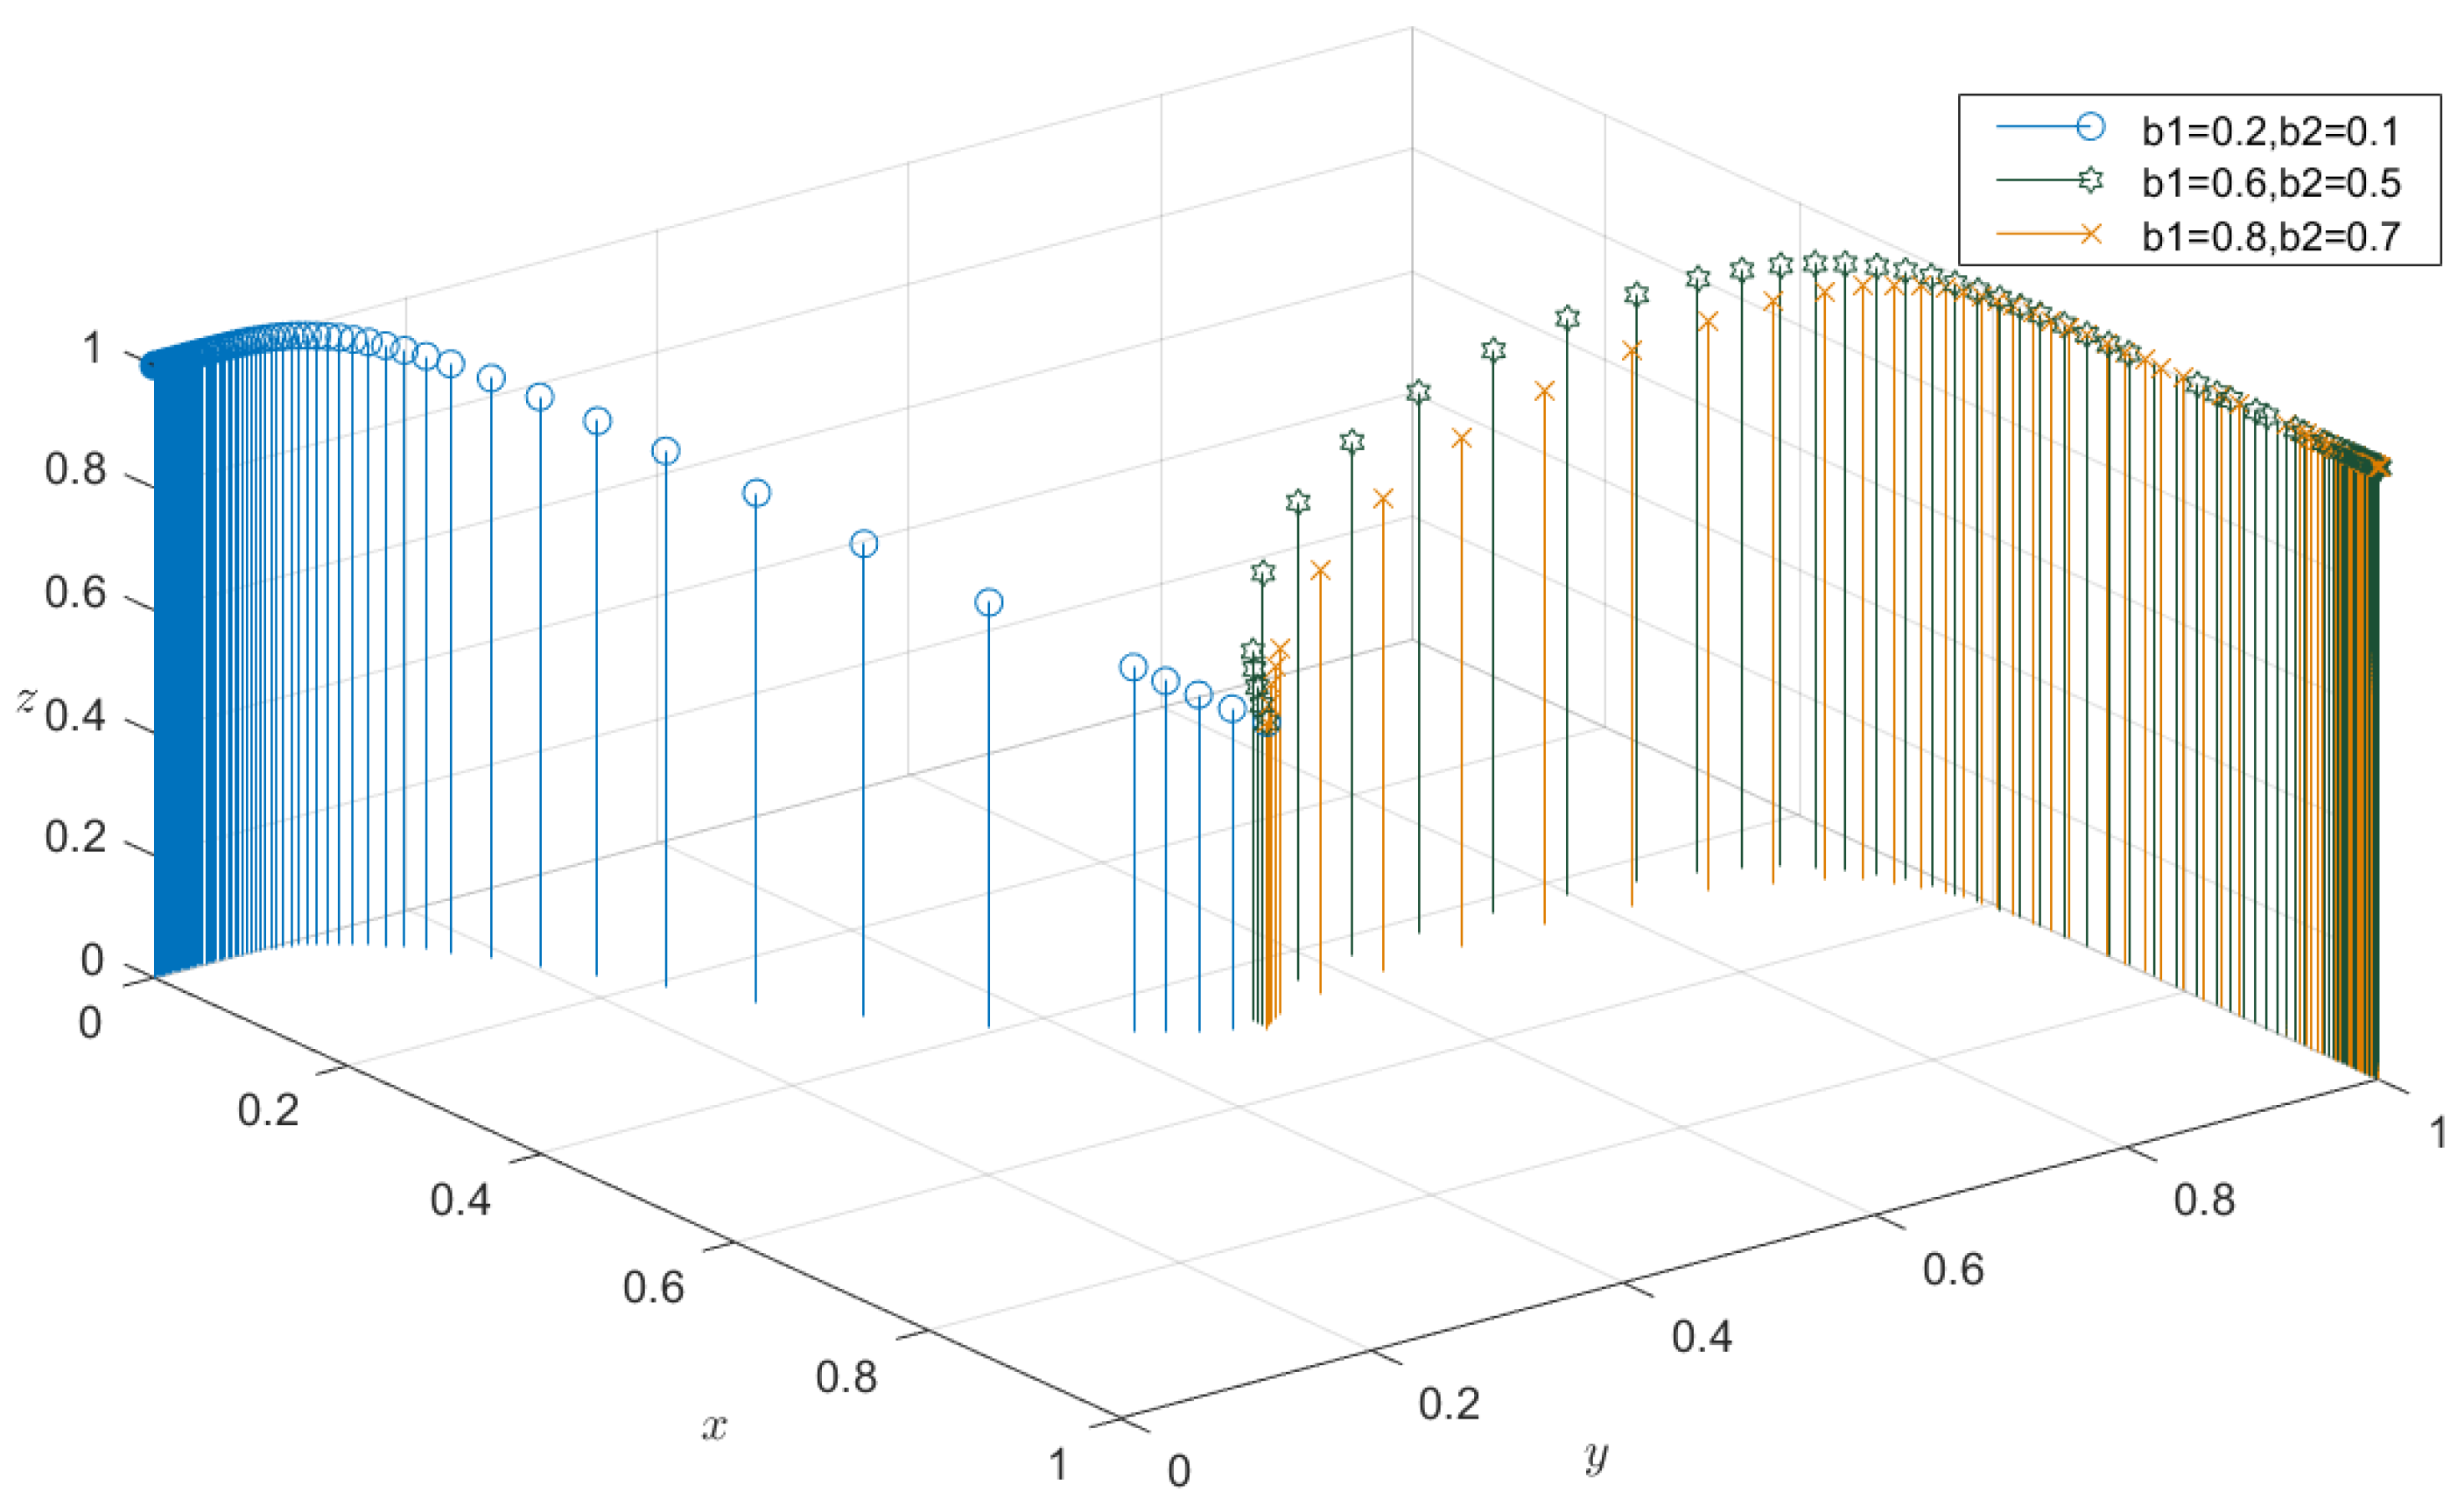
To force the enterprises to increase the willingness to participate in recycling, the administrative departments of the government impose certain punitive measures on construction enterprises and building materials production enterprises. Here, set b 1 = 0.2 ,   b 2 = 0.1 ; b 1 = 0.6 , b 2 = 0.6 ; and b 1 = 0.8 , b 2 = 0.8 to the corresponding value of the penalty coefficient. In this case, the government’s punishment is relatively small, and construction enterprises tend to choose illegal disposal of C&DW for their own interests. For building materials production enterprises, the profits from the production of natural building materials are enough to offset the fines for not implementing resource recycling. Figure 8 shows the impact of coefficient of penalties on stakeholders. When the penalty coefficient increases to b 1 = 0.6 and b 2 = 0.6 , the stable strategy of construction enterprises and building materials production enterprises gradually becomes implemented. Moreover, with the increase in government punishment, the effect is more obvious.

4.2.4. Impact of Revenue from Carbon Trading on Evolutionary Results

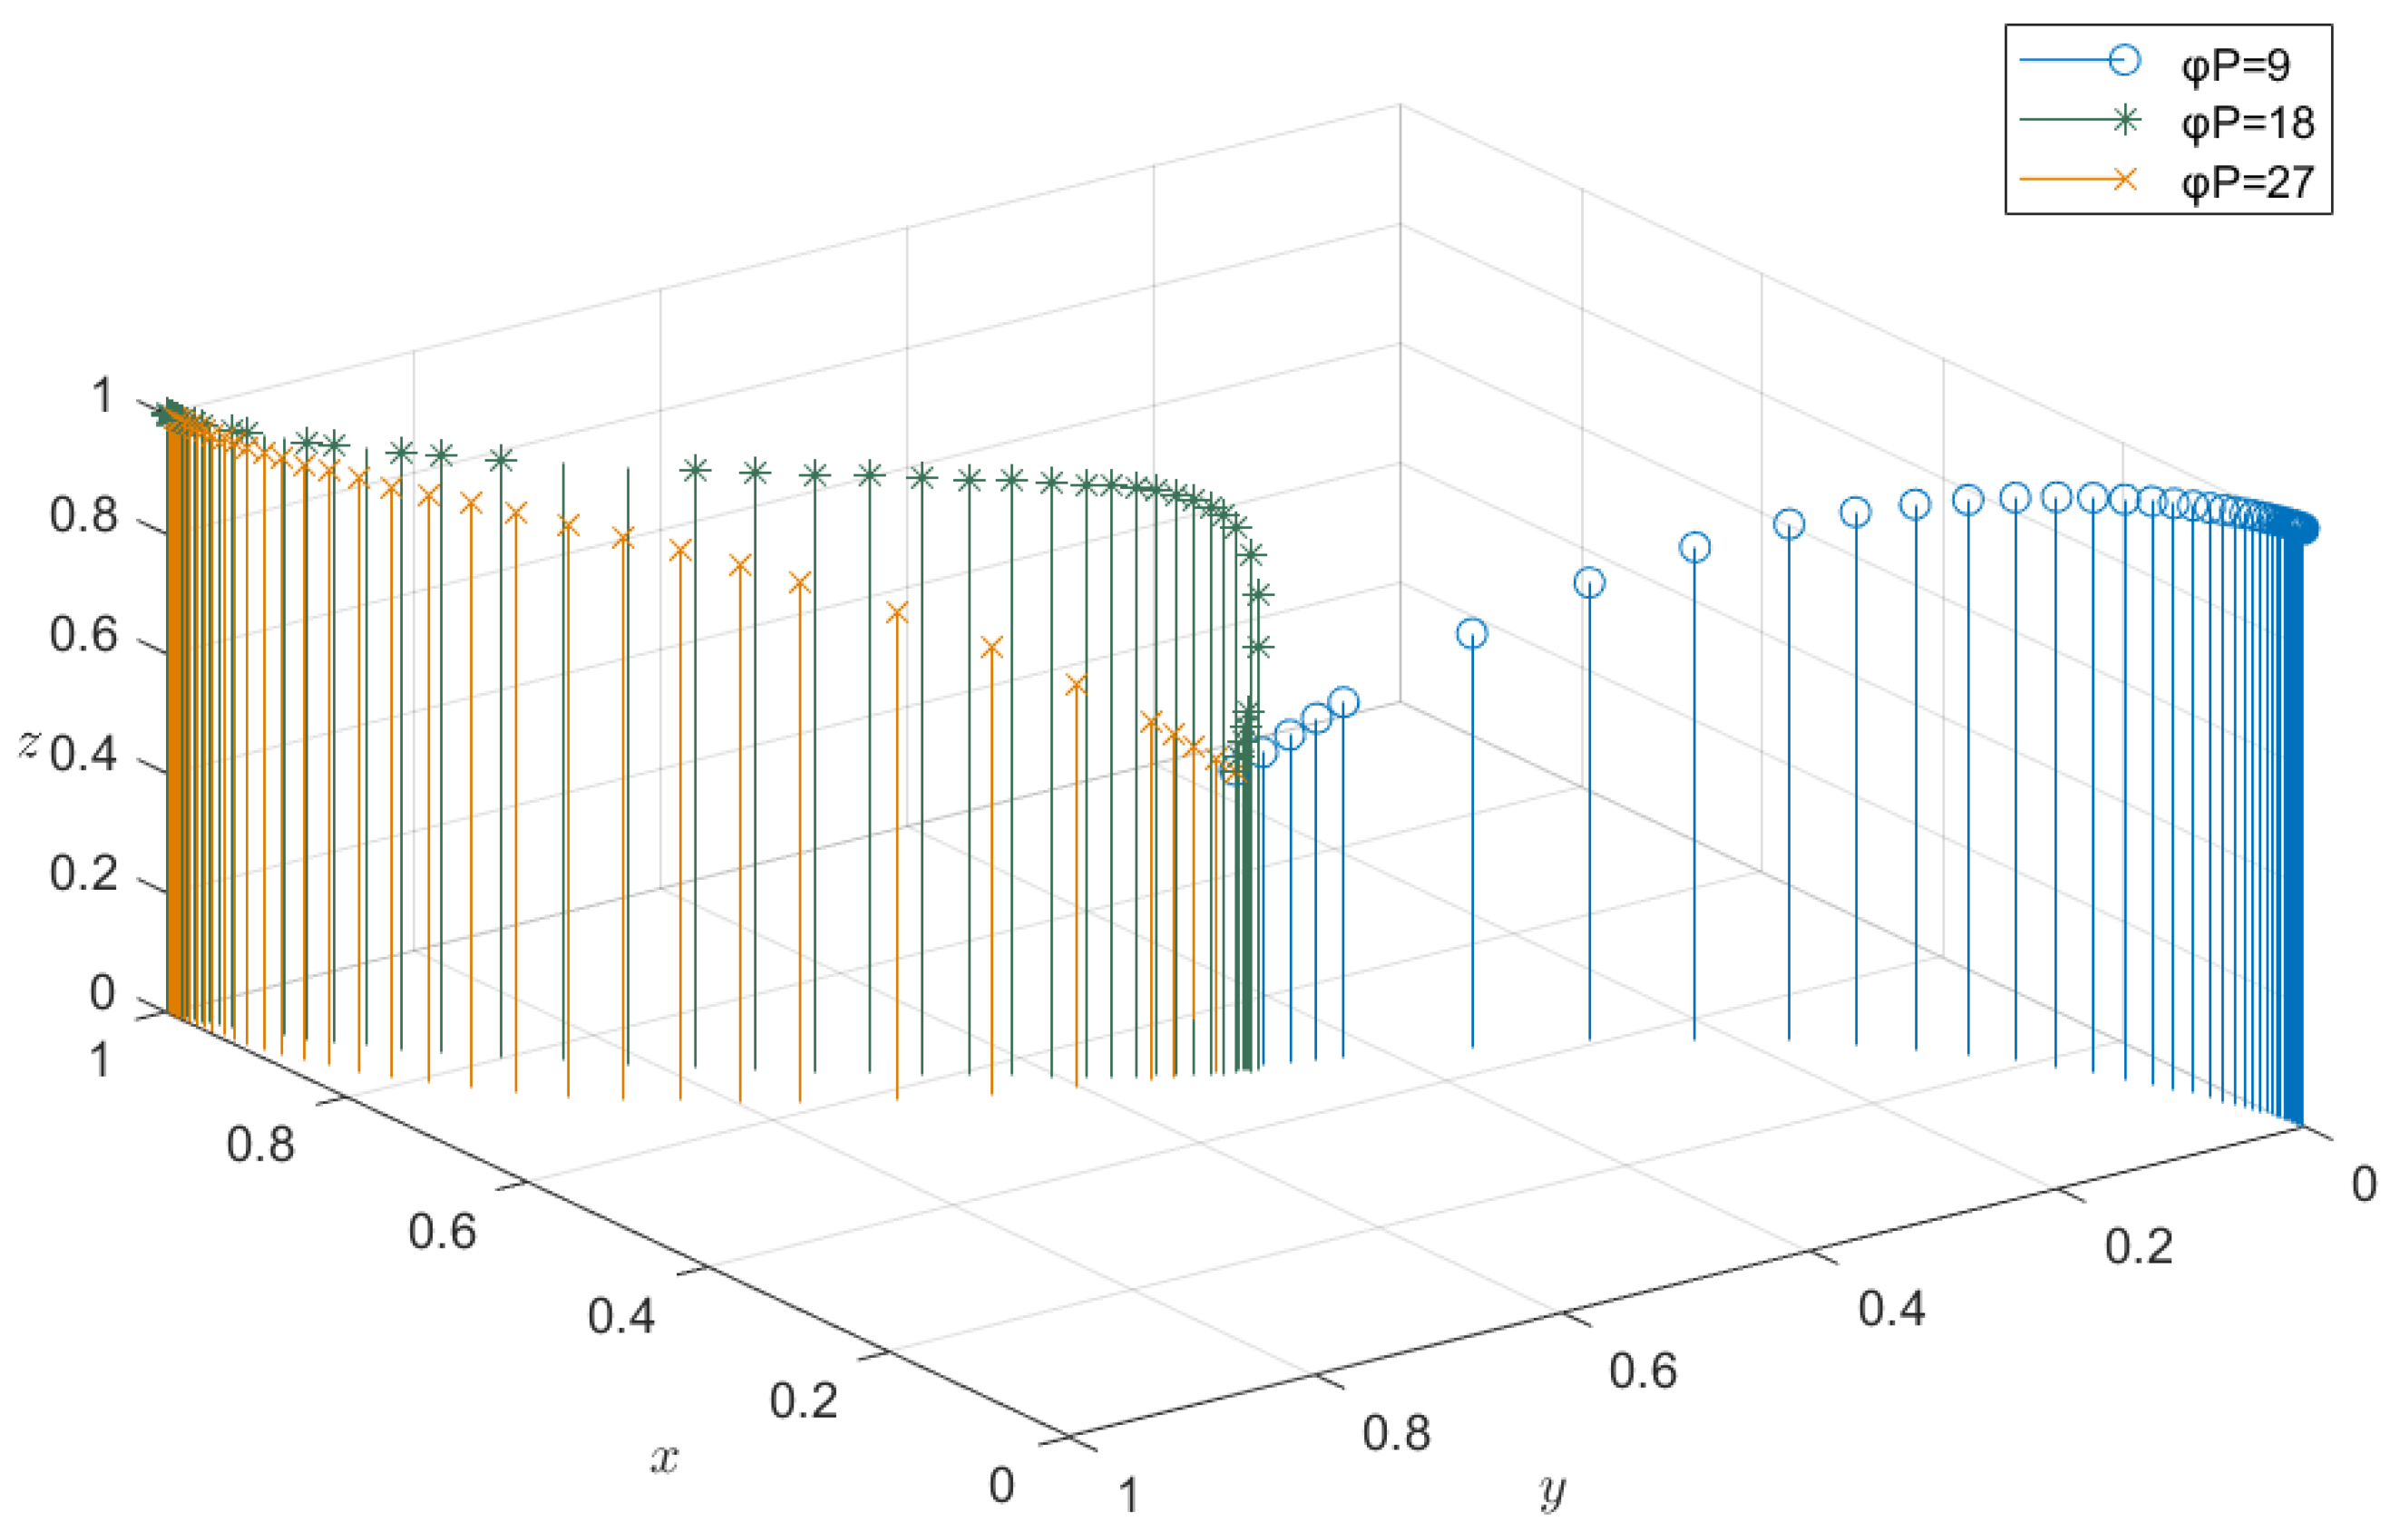
Government regulators reduce carbon dioxide production by implementing carbon trading policies. This section demonstrates the impact of carbon trading policy on construction enterprises and building materials production enterprises. The carbon trading price is, respectively, set as 0.3; 0.6; 0.9, and the evolution result is shown in Figure 9. It can be observed that when φ P = 9, construction enterprises and building materials enterprises do not participate in the trend of C&DW recycling. However, when φ P = 18 and φ P   = 27, with the increase of carbon trading price, the benefits of construction enterprises and building materials enterprises participating in C&DW recycling are increased compared with illegal waste disposal. Therefore, enterprises will actively cooperate with the government to participate in recycling. This indicates that with the increase in carbon trading price, construction enterprises and building materials production enterprises are more active in the recycling and utilization of C&DW.

5. Conclusions and Policy Implications

An evolutionary game model about construction enterprises, building material manufacturers, and government is constructed in this study. Then, the research analyzes the evolution of the behavior of construction enterprises and building materials enterprises under the condition of government intervention. The study aims to explore how the government promotes the collaborative development of the C&DW recycling path of construction enterprises and building materials production enterprises through incentive policies, so as to achieve the purpose of reducing CO2 emissions and effective utilization of resources.
The results show that in the initial stage, the government, as the regulator, plays a leading role in the C&DW recycling market. Under the joint effect of reasonable government subsidies and penalties, it can promote construction enterprises and building materials production enterprises to actively participate in recycling, and the behaviors of all subjects will gradually evolve into (implementation, implementation, and supervision). Among them, compared with construction enterprises, building materials production enterprises are more affected by the penalty coefficient than the subsidy coefficient, and the opposite is true for the subsidy coefficient. With the formation of the C&DW recycling industry chain, reducing regulatory costs and subsidies can increase the government’s willingness to supervise. At the same time, increasing carbon trading income is conducive to enhancing the enthusiasm of building materials production enterprises to participate in recycling.
Unlike Jianguo Chen et al. (2019) [19] and Jiayuan Zheng et al. (2024) [41] who used the game model to analyze the impact of the government on the strategy of a single subject, this study incorporates the key multi-party stakeholders involved in C&DW recycling into the evolutionary game model, considering the strategic interaction of multiple participating subjects. Meanwhile, similar to Yangyue Su (2020) [1] and Su et al. (2024) [42], the same conclusion is reached that, compared with a single punishment or subsidy, the government intervention policy of combining subsidy and punishment is more reasonable and effective for the recycling industry. In addition, based on their research, this study takes into account the carbon emission reduction benefits of C&DW recycling and incorporates the carbon trading income parameter into the key factors affecting the strategies of various stakeholders. It is found that carbon trading income greatly affects the recycling willingness of building materials production enterprises. The research results can improve the promotion policies for the resource management of C&DW and provide possible management methods and countermeasures for solving the social problems of C&DW resource-based utilization.
Based on the above conclusions, this paper puts forward the following policy recommendations.
(1)
Before the C&DW recycling market becomes mature, the government should increase the C&DW charging standard for landfills and implement measures such as fines, production suspension for rectification, and forced closure for enterprises that illegally dump waste, thus, forcing construction enterprises to participate in recycling. In addition, the government should reduce the recycling cost of building material production enterprises through subsidies and technical and facility support. For example, providing tax deductions and preferential loans for factory leasing and equipment procurement; establishing a government-led C&DW recycling technology research and development institution and holding relevant training and industry technology exchange meetings; in the face of the reality of lacking C&DW recycling facilities [43], actively plan and layout relevant infrastructure and recycling vehicles. At present, China’s C&DW recycling industry is still in its infancy [44]. In implementing these suggestions, the government may encounter some challenges, such as the unreasonable setting of subsidy and penalty proportions and some enterprises cheating on government subsidies. Therefore, before formulating policies, the government should conduct in-depth investigations on the operating conditions of building material production enterprises and the actual needs of construction enterprises in the recycling market. After the implementation of policies, the tracking and monitoring of C&DW treatment should be increased to ensure policy effects as much as possible. At the same time, the government can establish a C&DW recycling association with the participation of three parties to coordinate and communicate the demands of relevant stakeholders.
(2)
After the waste recycling market has matured, as the recycling industrial chain has been formed and enterprises can make profits through market mechanisms, the government should reduce subsidies. This can not only relieve the government’s financial pressure and supervision costs but also prevent enterprises from relying too much on government subsidies and ensure that recycling activities are dominated by market mechanisms. During this period, the government will mainly improve the laws and regulations of the recycling market and formulate industry standards for C&DW recycling, thereby promoting the healthy development of the C&DW recycling industry.
(3)
The government should propose targeted carbon emission-reduction policies including carbon quotas and trading according to the stage characteristics of the C&DW recycling market. For example, in the early stage, the government can grant sufficient carbon quotas to building materials production enterprises based on their recycling situations and make up for the relatively high recycling costs by increasing their carbon-trading income. In the mature period of the recycling market, the government can moderately reduce the carbon quota of enterprises to stimulate them to produce and sell more renewable products. In addition, consumers’ purchase intention has a great impact on the development of the C&DW industry [45]. The government can actively use recycled building materials in public construction projects to eliminate the public’s concerns about the quality of C&DW recycled products. The government can also effectively promote C&DW recycled building materials through public welfare lectures and helping enterprises hold exhibitions of renewable products, so as to enhance the public’s confidence and support for recycled building materials and stimulate market demand.

6. Limitations and Future Research

Based on the evolutionary game model, this study explores the behaviors and strategies of stakeholders in possible future development scenarios of the C&DW recycling management industry. However, it is undeniable that the C&DW recycling and utilization management system may be affected by external factors such as enterprise culture and values. In addition, the evolutionary game model constructed in this study does not take into account the regional differences within China. This study only considers the main influencing factors that affect the decision-making behaviors of the government, construction enterprises, and building materials production enterprises, and these influencing factors are very limited. Therefore, future research will combine reality, and more elements will be incorporated into the evolutionary model to solve more specific problems.

Author Contributions

Conceptualization, P.W. and Z.C.; Methodology, Z.C.; Software, K.L.; Validation, K.L., Z.C. and P.W.; Formal Analysis, K.L., Z.C and H.T.; Investigation, K.L. and Z.C.; Resources, H.T., J.L. and X.W.; Data Curation, H.T., J.L. and X.W.; Writing—Original Draft Preparation, K.L.; Writing—Review and Editing, P.W., Z.C. and K.L.; Visualization, H.T. and J.L.; Supervision, P.W.; Project Administration, P.W.; Funding Acquisition, P.W. All authors have read and agreed to the published version of the manuscript.

Funding

This work was funded by the National Natural Science Foundation of China [Grant Nos. 42477499, 51908249], the National Key R&D Program of China [Grant Nos. 2023YFE0121500, 2023YFC3205703], the Natural Science Foundation of Jiangsu Province [Grant No. BK20231327], the Natural Science Foundation of the Jiangsu Higher Education Institutions of China [Grant No. 19KIB560012], the High-level Scientific Research Foundation for the introduction of talent for Jiangsu University [Grant No. 18JDG038], and the Science and Technology Planning Project of Suzhou [Grant No. ST202218].

Data Availability Statement

The datasets analyzed during the current study are available from the corresponding author on reasonable request.

Conflicts of Interest

The authors declare no conflict of interest.

Appendix A

Prove A1.
When  F x = 0 , F y = 0 , F z = 0 , According to formula (13), eight system equilibrium points can be obtained: (0,0,0,), (0,0,1), (0,1,0), (0,1,1), (1,0,0), (1,0,1), (1,1,0), (1,1,1); And there are six pure strategy equilibrium points where a single population adopts: (0, D C , J I ), ( D B , 0 , G F ), ( G H , G E , 0 ), (1, ( B + D ) A + C , J + H I ), ( D + C A + B , 1 , G + E F ), ( J + I H , G + F E , 1 ), moreover, the first point satisfies the condition.  0 < J I < 1 , 0 < D C < 1 , the restriction conditions of the remaining points are in the following proof.
Proof of Prove A1.
Let A = G 1 ,   B = β 1 k δ b 1 p l ,   C = β 2 C k δ b 2 p j ,   D = G 1 + b 1 p l + b 2 p j C g ,   E = λ R + φ P k δ p s ,   F = β 1 k δ + b 1 p l ,   G = p s p l ,   H = 1 λ R + φ P C k δ p m ,   I = β 2 C k δ + b 2 p j , J = p m p j , the following formula can be obtained:
F z = z 1 z x y A + x B + y C + D
F x = x 1 x y E + z F + G
F y = y 1 y x H + z I + J
When x = 0 , 0 < y < 1 , 0 < z < 1 , z I + J = 0 , y C + D = 0 , if 0 < z = J I < 1 , 0 < y = D C < 1 , (0, D C , J I ), there F x = 0 , F y = 0 , F z = 0 , (0, D C , J I ) is the equilibrium point of system.
When y = 0 , 0 < x < 1 , 0 < z < 1 , z F + G = 0 , x B + D = 0 , if 0 < z = G F < 1 , 0 < x = D B < 1 , ( D B , 0 , G F ), there F x = 0 , F y = 0 , F z = 0 , ( D B , 0 , G F ) is the equilibrium point of system.
When z = 0 , 0 < x < 1 , 0 < y < 1 , y E + G = 0 , x H + J = 0 , if 0 < x = J H < 1 , 0 < y = G E < 1 , ( J H , G E , 0 ), there F x = 0 , F y = 0 , F z = 0 , ( G H , G E , 0 ) is the equilibrium point of system.
When x = 1 , 0 < y < 1 , 0 < z < 1 , y A + B + y C + D , H + z I + J = 0 , if 0 < z = J + H I < 1 , 0 < y = ( B + D ) A + C < 1 , (1, ( B + D ) A + C , J + H I ), there F x = 0 , F y = 0 , F z = 0 , (1, ( B + D ) A + C , J + H I ) is the equilibrium point of system.
When y = 1 , 0 < x < 1 , 0 < z < 1 , x A + x B + C + D = 0 , E + z F + G = 0 , if 0 < z = G + E F < 1 , 0 < x = D + C A + B < 1 , ( D + C A + B , 1 , G + E F ), there F x = 0 , F y = 0 , F z = 0 , ( D + C A + B , 1 , G + E F ) is the equilibrium point of system.
When z = 1 , 0 < x < 1 , 0 < y < 1 , y E + F + G = 0 , x H + I + J = 0 ,if 0 < x = J + I H < 1 , 0 < y = < 1 , ( J + I H , G + F E , 1 ), there F x = 0 , F y = 0 , F z = 0 , ( J + I H , G + F E , 1 ) is the equilibrium point of system. □
Prove A2.
There may be a mixed strategy equilibrium point in the system  x * , y * , z * , and  x * , y * , z * ( 0,1 ) .
Proof of Prove A2.
When 0 < x < 1 , 0 < y < 1 , 0 < z < 1 , if Q x * , y * , z * = D x * , y * , z * = Z x * , y * , z * , be equivalent to F x = 0 , F y = 0 , F z = 0 . According to the replication dynamic Equation (13), the following formula can be obtained:
Q x * , y * , z * = x * y * A + x * B + y * C + D D x * , y * , z * = y * E + z * F + G Z x * , y * , z * = x * H + z * I + J            
According to the above Prove A1, its solution has been obtained. If x * , y * , z * ( 0,1 ) , then x * , y * , z * is the equilibrium point. □

References

  1. Su, Y.; Si, H.; Chen, J.; Wu, G. Promoting the sustainable development of the recycling market of construction and demolition waste: A stakeholder game perspective. J. Clean. Prod. 2020, 277, 122281. [Google Scholar] [CrossRef]
  2. Wilson, D.C.; Rodic, L.; Modak, P.; Soos, R.; Carpintero, A.; Velis, K.; Iyer, M.; Simonett, O. Global Waste Management Outlook; UNEP: Nairobi, Kenya, 2015. [Google Scholar]
  3. Islam, R.; Nazifa, T.H.; Yuniarto, A.; Uddin, A.S.; Salmiati, S.; Shahid, S. An empirical study of construction and demolition waste generation and implication of recycling. Waste Manag. 2019, 95, 10–21. [Google Scholar] [CrossRef] [PubMed]
  4. Ma, M.; Tam, V.W.; Le, K.N.; Li, W. Challenges in current construction and demolition waste recycling: A China study. Waste Manag. 2020, 118, 610–625. [Google Scholar] [CrossRef] [PubMed]
  5. Duan, H.; Miller, T.R.; Liu, G.; Tam, V.W. Construction debris becomes growing concern of growing cities. Waste Manag. 2019, 83, 1–5. [Google Scholar] [CrossRef]
  6. Huang, B.; Wang, X.; Kua, H.; Geng, Y.; Bleischwitz, R.; Ren, J. Construction and demolition waste management in China through the 3R principle. Resour. Conserv. Recycl. 2018, 129, 36–44. [Google Scholar] [CrossRef]
  7. Li, G.; Liu, J.; Giordano, A. Robust optimization of construction waste disposal facility location considering uncertain factors. J. Clean. Prod. 2022, 353, 131455. [Google Scholar] [CrossRef]
  8. Seror, N.; Portnov, B.A. Identifying areas under potential risk of illegal construction and demolition waste dumping using GIS tools. Waste Manag. 2018, 75, 22–29. [Google Scholar] [CrossRef]
  9. Udawatta, N.; Zuo, J.; Chiveralls, K.; Zillante, G. Improving waste management in construction projects: An Australian study. Resour. Conserv. Recycl. 2015, 101, 73–83. [Google Scholar] [CrossRef]
  10. Wang, C.; Sheng, Y.; Wang, J.; Wang, Y.; Wang, P.; Huang, L. Air Pollution and Human Health: Investigating the Moderating Effect of the Built Environment. Remote Sens. 2022, 14, 3703. [Google Scholar] [CrossRef]
  11. Guo, F.; Wang, J.; Song, Y. How to promote sustainable development of construction and demolition waste recycling systems: Production subsidies or consumption subsidies? Sustain. Prod. Consum. 2022, 32, 407–423. [Google Scholar] [CrossRef]
  12. Zhao, X.; Ma, X.; Chen, B.; Shang, Y.; Song, M. Challenges toward carbon neutrality in China: Strategies and countermeasures. Resour. Conserv. Recycl. 2022, 176, 105959. [Google Scholar] [CrossRef]
  13. Gyurkó, Z.; Jankus, B.; Fenyvesi, O.; Nemes, R. Sustainable applications for utilization the construction waste of aerated concrete. J. Clean. Prod. 2019, 230, 430–444. [Google Scholar] [CrossRef]
  14. Li, L.; Liu, Q.; Huang, T.; Peng, W. Mineralization and utilization of CO2 in construction and demolition wastes recycling for building materials: A systematic review of recycled concrete aggregate and recycled hardened cement powder. Sep. Purif. Technol. 2022, 298, 121512. [Google Scholar] [CrossRef]
  15. Ding, T.; Xiao, J. Estimation of building-related construction and demolition waste in Shanghai. Waste Manag. 2014, 34, 2327–2334. [Google Scholar] [CrossRef] [PubMed]
  16. Wang, T.-K.; Wu, Z.; Luo, C. Multi-participant construction waste demolition and transportation decision-making system. Resour. Conserv. Recycl. 2021, 170, 105575. [Google Scholar] [CrossRef]
  17. Jin, R.; Li, B.; Zhou, T.; Wanatowski, D.; Piroozfar, P. An empirical study of perceptions towards construction and demolition waste recycling and reuse in China. Resour. Conserv. Recycl. 2017, 126, 86–98. [Google Scholar] [CrossRef]
  18. Yu, S.; Awasthi, A.K.; Ma, W.; Wen, M.; Di Sarno, L.; Wen, C.; Hao, J.L. In support of circular economy to evaluate the effects of policies of construction and demolition waste management in three key cities in Yangtze River Delta. Sustain. Chem. Pharm. 2022, 26, 100625. [Google Scholar] [CrossRef]
  19. Chen, J.; Hua, C.; Liu, C. Considerations for better construction and demolition waste management: Identifying the decision behaviors of contractors and government departments through a game theory decision-making model. J. Clean. Prod. 2019, 212, 190–199. [Google Scholar] [CrossRef]
  20. Sarkis, J. A comparative analysis of DEA as a discrete alternative multiple criteria decision tool. Eur. J. Oper. Res. 2000, 123, 543–557. [Google Scholar] [CrossRef]
  21. Su, Y. Multi-agent evolutionary game in the recycling utilization of construction waste. Sci. Total Environ. 2020, 738, 139826. [Google Scholar] [CrossRef]
  22. Soltani, A.; Hewage, K.; Reza, B.; Sadiq, R. Multiple stakeholders in multi-criteria decision-making in the context of municipal solid waste management: A review. Waste Manag. 2015, 35, 318–328. [Google Scholar] [CrossRef] [PubMed]
  23. Marzouk, M.; Azab, S. Environmental and economic impact assessment of construction and demolition waste disposal using system dynamics. Resour. Conserv. Recycl. 2014, 82, 41–49. [Google Scholar] [CrossRef]
  24. Qiao, L.; Tang, Y.; Li, Y.; Liu, M.; Yuan, X.; Wang, Q.; Ma, Q. Life cycle assessment of three typical recycled products from construction and demolition waste. J. Clean. Prod. 2022, 376, 134139. [Google Scholar] [CrossRef]
  25. Patra, I.; Al-Awsi, G.R.L.; Hasan, Y.M.; Almotlaq, S.S.K. Mechanical properties of concrete containing recycled aggregate from construction waste. Sustain. Energy Technol. Assess. 2022, 53, 102722. [Google Scholar] [CrossRef]
  26. Abera, Y.S.A. Performance of concrete materials containing recycled aggregate from construction and demolition waste. Results Mater. 2022, 14, 100278. [Google Scholar] [CrossRef]
  27. Ma, L.; Zhang, L. Evolutionary game analysis of construction waste recycling management in China. Resour. Conserv. Recycl. 2020, 161, 104863. [Google Scholar] [CrossRef]
  28. Yuan, H.; Lu, W.; Hao, J.J. The evolution of construction waste sorting on-site. Renew. Sustain. Energy Rev. 2013, 20, 483–490. [Google Scholar] [CrossRef]
  29. Wang, Y.; Guo, C.-H.; Chen, X.-J.; Jia, L.-Q.; Guo, X.-N.; Chen, R.-S.; Zhang, M.-S.; Chen, Z.-Y.; Wang, H.-D. Carbon peak and carbon neutrality in China: Goals, implementation path and prospects. China Geol. 2021, 4, 720–746. [Google Scholar] [CrossRef]
  30. Eissa, R.; Eid, M.S.; Elbeltagi, E. Current applications of game theory in construction engineering and management research: A social network analysis approach. J. Constr. Eng. Manag. 2021, 147, 04021066. [Google Scholar] [CrossRef]
  31. Jiang, S.; Wei, X.; Jia, J.; Ma, G. Toward sustaining the development of green residential buildings in China: A tripartite evolutionary game analysis. Build. Environ. 2022, 223, 109466. [Google Scholar] [CrossRef]
  32. Babu, S.; Mohan, U. An integrated approach to evaluating sustainability in supply chains using evolutionary game theory. Comput. Oper. Res. 2018, 89, 269–283. [Google Scholar] [CrossRef]
  33. Yuan, H.; Shen, L.; Hao, J.J.; Lu, W. A model for cost–benefit analysis of construction and demolition waste management throughout the waste chain. Resour. Conserv. Recycl. 2011, 55, 604–612. [Google Scholar] [CrossRef]
  34. Di Maria, A.; Eyckmans, J.; Van Acker, K. Downcycling versus recycling of construction and demolition waste: Combining LCA and LCC to support sustainable policy making. Waste Manag. 2018, 75, 3–21. [Google Scholar] [CrossRef] [PubMed]
  35. Wang, P.; Yang, Y.; Ji, C.; Huang, L. Influence of built environment on building energy consumption: A case study in Nanjing, China. Environ Dev Sustain. 2024, 26, 5199–5222. [Google Scholar] [CrossRef]
  36. Chuai, X.; Huang, X.; Lu, Q.; Zhang, M.; Zhao, R.; Lu, J. Spatiotemporal changes of built-up land expansion and carbon emissions caused by the Chinese construction industry. Environ. Sci. Technol. 2015, 49, 13021–13030. [Google Scholar] [CrossRef]
  37. Zhang, Z.; Wang, B. Research on the life-cycle CO2 emission of China’s construction sector. Energy Build. 2016, 112, 244–255. [Google Scholar] [CrossRef]
  38. Guo, J.; Li, C. Does China’s carbon emissions trading policy improve enterprise green Innovation? Financ. Res. Lett. 2024, 69, 106214. [Google Scholar] [CrossRef]
  39. Friedman, D. Evolutionary games in economics. Econom. J. Econom. Soc. 1991, 59, 637–666. [Google Scholar] [CrossRef]
  40. Li, X.; Alam, K.M.; Wang, S. Trend analysis of Pakistan railways based on industry life cycle theory. J. Adv. Transp. 2018, 2018, 2670346. [Google Scholar] [CrossRef]
  41. Zheng, J.; Tan, R.; Yu, M.; Tang, Z.; Zhang, J. Optimal decisions of construction and demolition waste recycling based on reference green effect under different subsidy models. Comput. Ind. Eng. 2024, 196, 110479. [Google Scholar] [CrossRef]
  42. Su, Y.; Xu, Y.; Bao, Z.; Ng, S.T.; Gao, Q. Stakeholder interactions of government intervention in construction and demolition waste recycling market: A game theory approach. Dev. Built Environ. 2024, 18, 100391. [Google Scholar] [CrossRef]
  43. Jia, S.; Yan, G.; Shen, A.; Zheng, J. Dynamic simulation analysis of a construction and demolition waste management model under penalty and subsidy mechanisms. J. Clean. Prod. 2017, 147, 531–545. [Google Scholar] [CrossRef]
  44. Ma, W.; Hao, J.L.; Zhang, C.; Guo, F.; Di Sarno, L. System dynamics-life cycle assessment causal loop model for evaluating the carbon emissions of building refurbishment construction and demolition waste. Waste Biomass Valorization 2022, 13, 4099–4113. [Google Scholar] [CrossRef]
  45. Xu, Y.; Liu, C.; Wei, F.; Zhao, S.; Mao, H. The influence of government subsidies on remanufacturers’ production decisions, considering product quality, customer purchase intention, and carbon emissions. J. Clean. Prod. 2024, 443, 141130. [Google Scholar] [CrossRef]
Figure 1. Stakeholder game framework of the C&DW recycled products market.
Buildings 14 03664 g001
Figure 2. Evolutionary stability point (0,0,0).
Buildings 14 03664 g002
Figure 3. Evolutionary stability point (0,0,1).
Buildings 14 03664 g003
Figure 4. Evolutionary stability point (1,1,1).
Buildings 14 03664 g004
Figure 5. Evolutionary stability point (0,1,1).
Buildings 14 03664 g005
Figure 6. Impact of Cost of government regulation on evolutionary results.
Buildings 14 03664 g006
Figure 7. Impact of coefficient of subsidies on evolutionary results.
Buildings 14 03664 g007
Figure 8. Impact of coefficient of penalties on evolutionary results.
Buildings 14 03664 g008
Figure 9. Impact of Revenue from carbon trading on evolutionary results.
Buildings 14 03664 g009
Table 1. Parameters and variables symbol descriptions.
ParametersDescriptions
k δ The cost for construction enterprises to participate in C&DW recycling
λ R The benefits for construction enterprises to participate in C&DW recycling
δ The effort level of the construction enterprises in the implementation of waste recycling
KThe sorting cost of legally disposing of C&DW by the construction enterprises
p l The construction enterprises profits from shipping C&DW to landfills for disposal
p s When the construction enterprises choose to “implement C&DW recycling”, while the building materials production enterprises choose “non-implement”, the possible income of the construction enterprises.
λ Construction enterprises and building materials production enterprises choose the income distribution coefficient of “implement C&DW recycling”.
C k δ C&DW recovery cost of building materials production enterprises
1 λ R Earnings of building materials production enterprises participating in C&DW recycling
CTotal cost of C&DW sorting recycling
RTotal income of construction enterprises and building materials production enterprises choosing “implementation” strategy.
p m When the construction enterprise chooses “non-implement” and the building materials production enterprise chooses “implement”, the building materials production enterprise suffers the loss.
p j Profits of building materials production enterprises using natural materials to produce building materials.
CtThe cost of upgrading equipment or investing in technology in order to recycle C&DW by building materials manufacturers.
φPφ is used to represent the carbon trading quota brought by the production of recycled products, and P is the carbon trading revenue.
C g The government regulates the cost of C&DW recycling.
R g The government regulates the proceeds from C&DW recycling.
R g The government does not regulate the proceeds of C&DW recycling
G 1 Although the government’s supervision has not effectively avoided the discharge of C&DW, the government has won a good reputation.
C E Enterprises do not participate in C&DW recycling, and the government needs to pay the environmental governance cost.
b 1 p l Construction enterprises that do not participate in C&DW recycling will be fined.
b 2 p j The building materials production enterprises that do not participate in C&DW recycling shall be fined.
β 1 k δ Subsidy coefficient for construction enterprises involved in C&DW recycling.
β 2 C k δ The subsidy coefficient of the construction materials production enterprises involved in C&DW recycling.
Table 2. Payoff matrix of government, construction enterprises, and building materials production enterprises.
Game Players Construction Enterprises (x)Construction Enterprises (1 − x)
Government (z)Building materials production enterprises (y)G: R g C g β 1 k δ β 2 C k δ G: G 1 b 1 p l β 2 C k δ C E C g
C: λ R + φ P k δ + β 1 k δ C: p l + b 1 p l
B: 1 λ R + φ P C k δ + β 2 C k δ B: p j + b 2 p j
Building materials production enterprises (1 − y)G: G 1 + b 2 p j β 1 k δ C E C g G: G 1 b 1 p l + b 2 p j C E C g
C: p s + β 1 k δ C: p l + b 1 p l
B: p j b 2 p j B: p j + b 2 p j
Government (1 − z)Building materials (y)G: R g ( R g )G: C E
C: λ R + φ P k δ C: p l
B: 1 λ R + φ P C k δ B: p m
Building materials (1 − y)G: C E G: C E
C: p s C: p l
B: p j B: p j
Table 3. The eigenvalues of Jacobian matrix at eight equilibrium points.
Equilibrium PointsEigenvalue 1Eigenvalue 2Eigenvalue 3
O (0,0,0) p s p l p m p j C g G 1 + b 1 p l b 2 p j
A (0,0,1) β 1 k δ b 1 p l + p s p l β 2 C k δ + b 2 p j + p m p j C g G 1 + b 1 p l b 2 p j
B (0,1,0) λ R + φ P k δ p l p m p j [ ( β 2 C k δ ) + ( C g G 1 + b 1 p l )]
C (0,1,1) λ R + φ P k δ + β 1 k δ b 1 p l p l β 2 C k δ + b 2 1 λ φ P + R + p m p j β 2 C k δ + C g G 1 + b 1 p l
D (1,0,0) p s p l 1 λ R + φ P C k δ p j β 1 k δ + C g G 1 b 2 p j
E (1,0,1) β 1 k δ b 1 p l + p s p l 1 λ R + φ P C k δ + β 2 C k δ + b 2 1 λ φ P + R p j β 1 k δ + C g G 1 b 2 p j
F (1,1,0) λ R + φ P k δ p l 1 λ R + φ P C k δ p j R g R g + β 1 k δ + C g + C k δ β 2
G (1,1,1) λ R + φ P k δ + β 1 k δ b 1 p l p l 1 λ R + φ P C k δ + β 2 C k δ + b 2 p j p j R g R g + β 1 k δ + C g + C k δ β 2
Table 4. The judgment conditions of the Jacobian matrix at eight equilibrium points.
Equilibrium PointsStable Condition Stability
O (0,0,0) p s < p l p m < p j C g G 1 + b 1 p l b 2 p j < 0 Asymptotic stability point
A (0,0,1) β 1 k δ + p s < p l + b 1 p l β 2 C k δ + p m < p j b 2 p j C g G 1 + b 1 p l b 2 p j < 0 Asymptotic stability point
B (0,1,0) λ R + φ P k δ p l p m p j [ β 2 C β 2 k δ + C g G 1 + b 1 p l ] Unstable point
C (0,1,1)   [ λ R + φ P k δ ] + β 1 k δ < p l + b 1 p l β 2 C k δ + p m > p j b 2 p j   [ β 2 C k δ ] + C g G 1 + b 1 p l < 0 Asymptotic stability point
D (1,0,0) p s p l < 0 1 λ R + φ P C k δ p j > 0 β 1 k δ + C g G 1 b 2 p j < 0 Asymptotic stability point
E (1,0,1) β 1 k δ + p s > p l + b 1 p l 1 λ R + φ P C k δ + β 2 C k δ < p j b 2 p j β 1 k δ + C g G 1 b 2 p j < 0 Asymptotic stability point
F (1,1,0)   [ λ R + φ P k δ ] > p l 1 λ R + φ P C k δ > p j R g R g + β 1 k δ + C g + C k δ β 2 < 0 Asymptotic stability point
G (1,1,1)   [ λ R + φ P k δ ] + β 1 k δ b 1 p l p l > 0 1 λ R + φ P C k δ + β 2 C k δ > p j b 2 p j R g R g + C g + β 1 k δ + C k δ β 2 < 0 Asymptotic stability point
Table 5. Different stage parameter values.
Parameters C g b 1 b 2 β 1 β 2 G 1 R g R g p s p l p m p j R λ C k δ
Initial stage350.20.10.20.1205518−5−1713180.220130.5
Developmental stage200.30.20.30.2205518−5−1713180.220130.5
Mid-term development stage180.60.60.50.5205518−5−1713180.220130.5
Mature stage180.60.60.70.7204418−5−2713240.213100.5
Disclaimer/Publisher’s Note: The statements, opinions and data contained in all publications are solely those of the individual author(s) and contributor(s) and not of MDPI and/or the editor(s). MDPI and/or the editor(s) disclaim responsibility for any injury to people or property resulting from any ideas, methods, instructions or products referred to in the content.