
Seismic Resistance of Reinforced Concrete Building Frames Based on Interval Assessment of the Coefficient of Permissible Damage

Abstract
1. Introduction
- K1 = 0.25—buildings with RC walls;
- K1 = 0.3—buildings of RC panel-block constructions;
- K1 = 0.35—RC frame without shear walls or steel bracing;
- K1 = 0.4—RC frame with masonry infills;
- K1 = 0.3—RC frame with shear walls or steel bracing.
2. Models and Methods
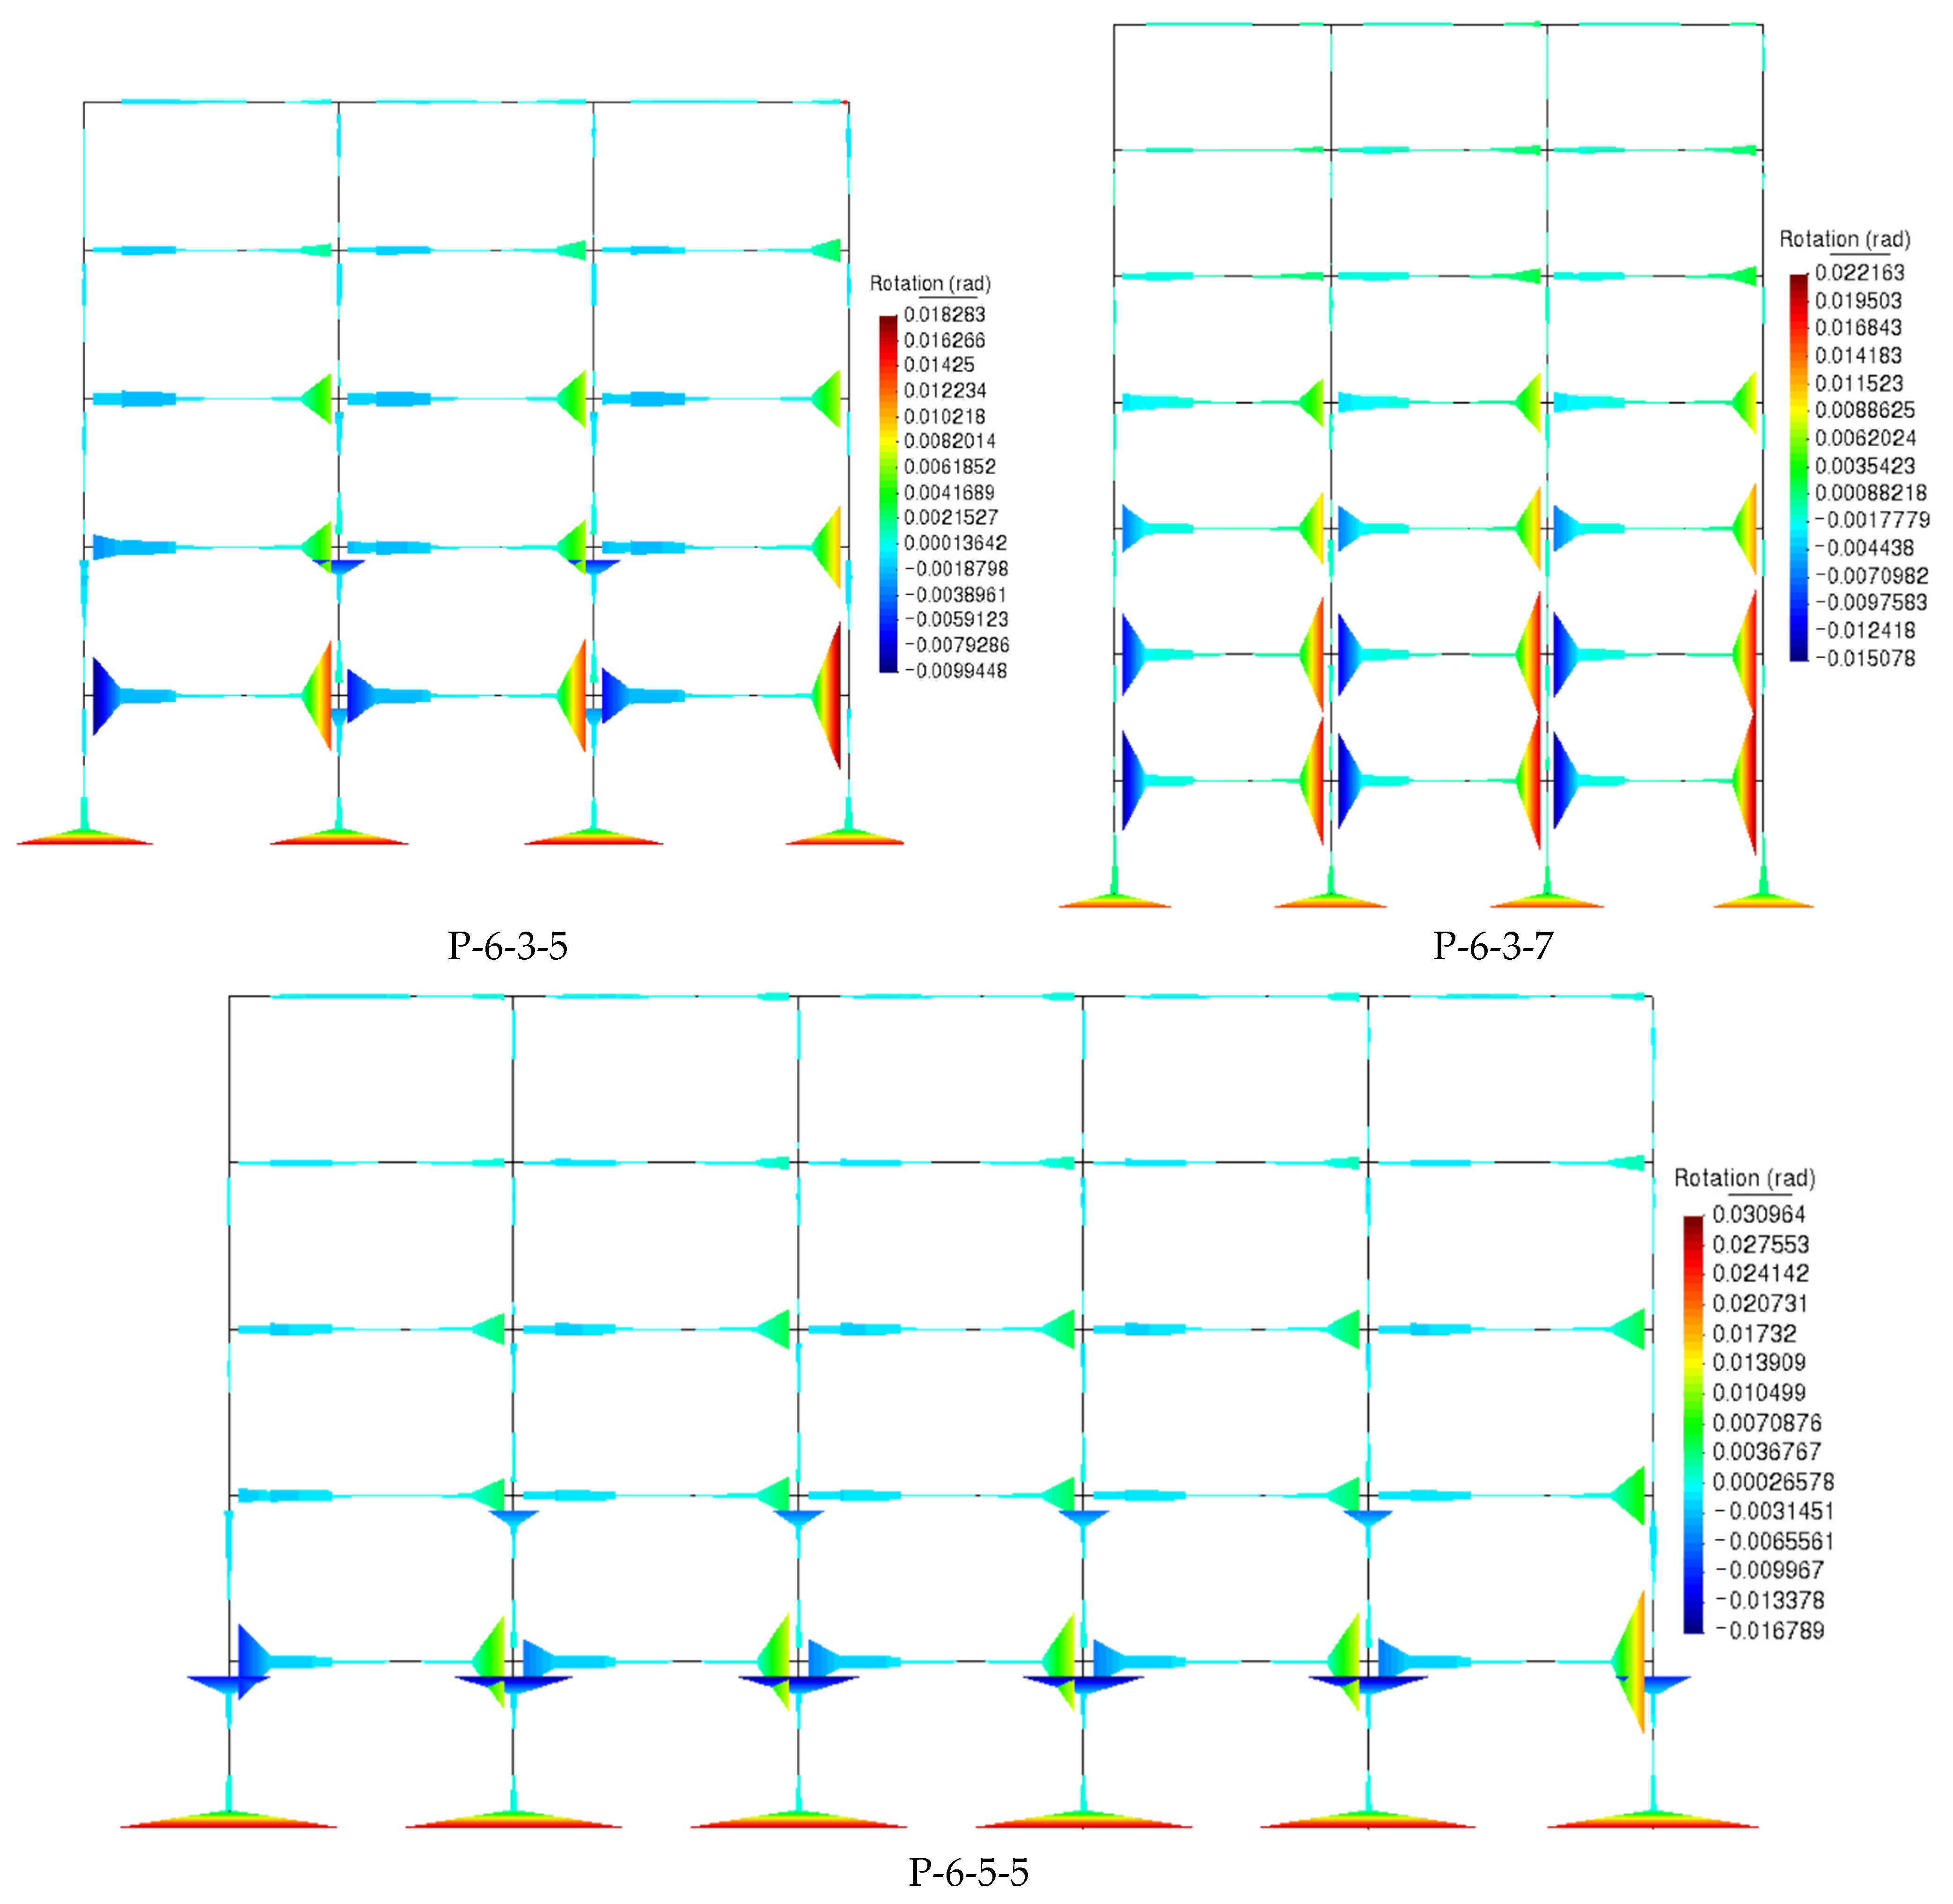
- P-6-3-5 M1,f = 97.3 ton and Mtot = 486.5 ton;
- P-6-3-7 M1,f = 97.3 ton and Mtot = 681.1 ton;
- P-6-5-5 M1,f = 156.5 ton and Mtot = 782.7 ton;
- P-7.5-3-5 M1,f = 118.0 ton and Mtot = 590.0 ton;
- P-7.5-3-5 M1,f = 118.0 ton and Mtot = 826.0 ton;
- P-7.5-3-5 M1,f = 191.1 ton and Mtot = 955.7 ton.
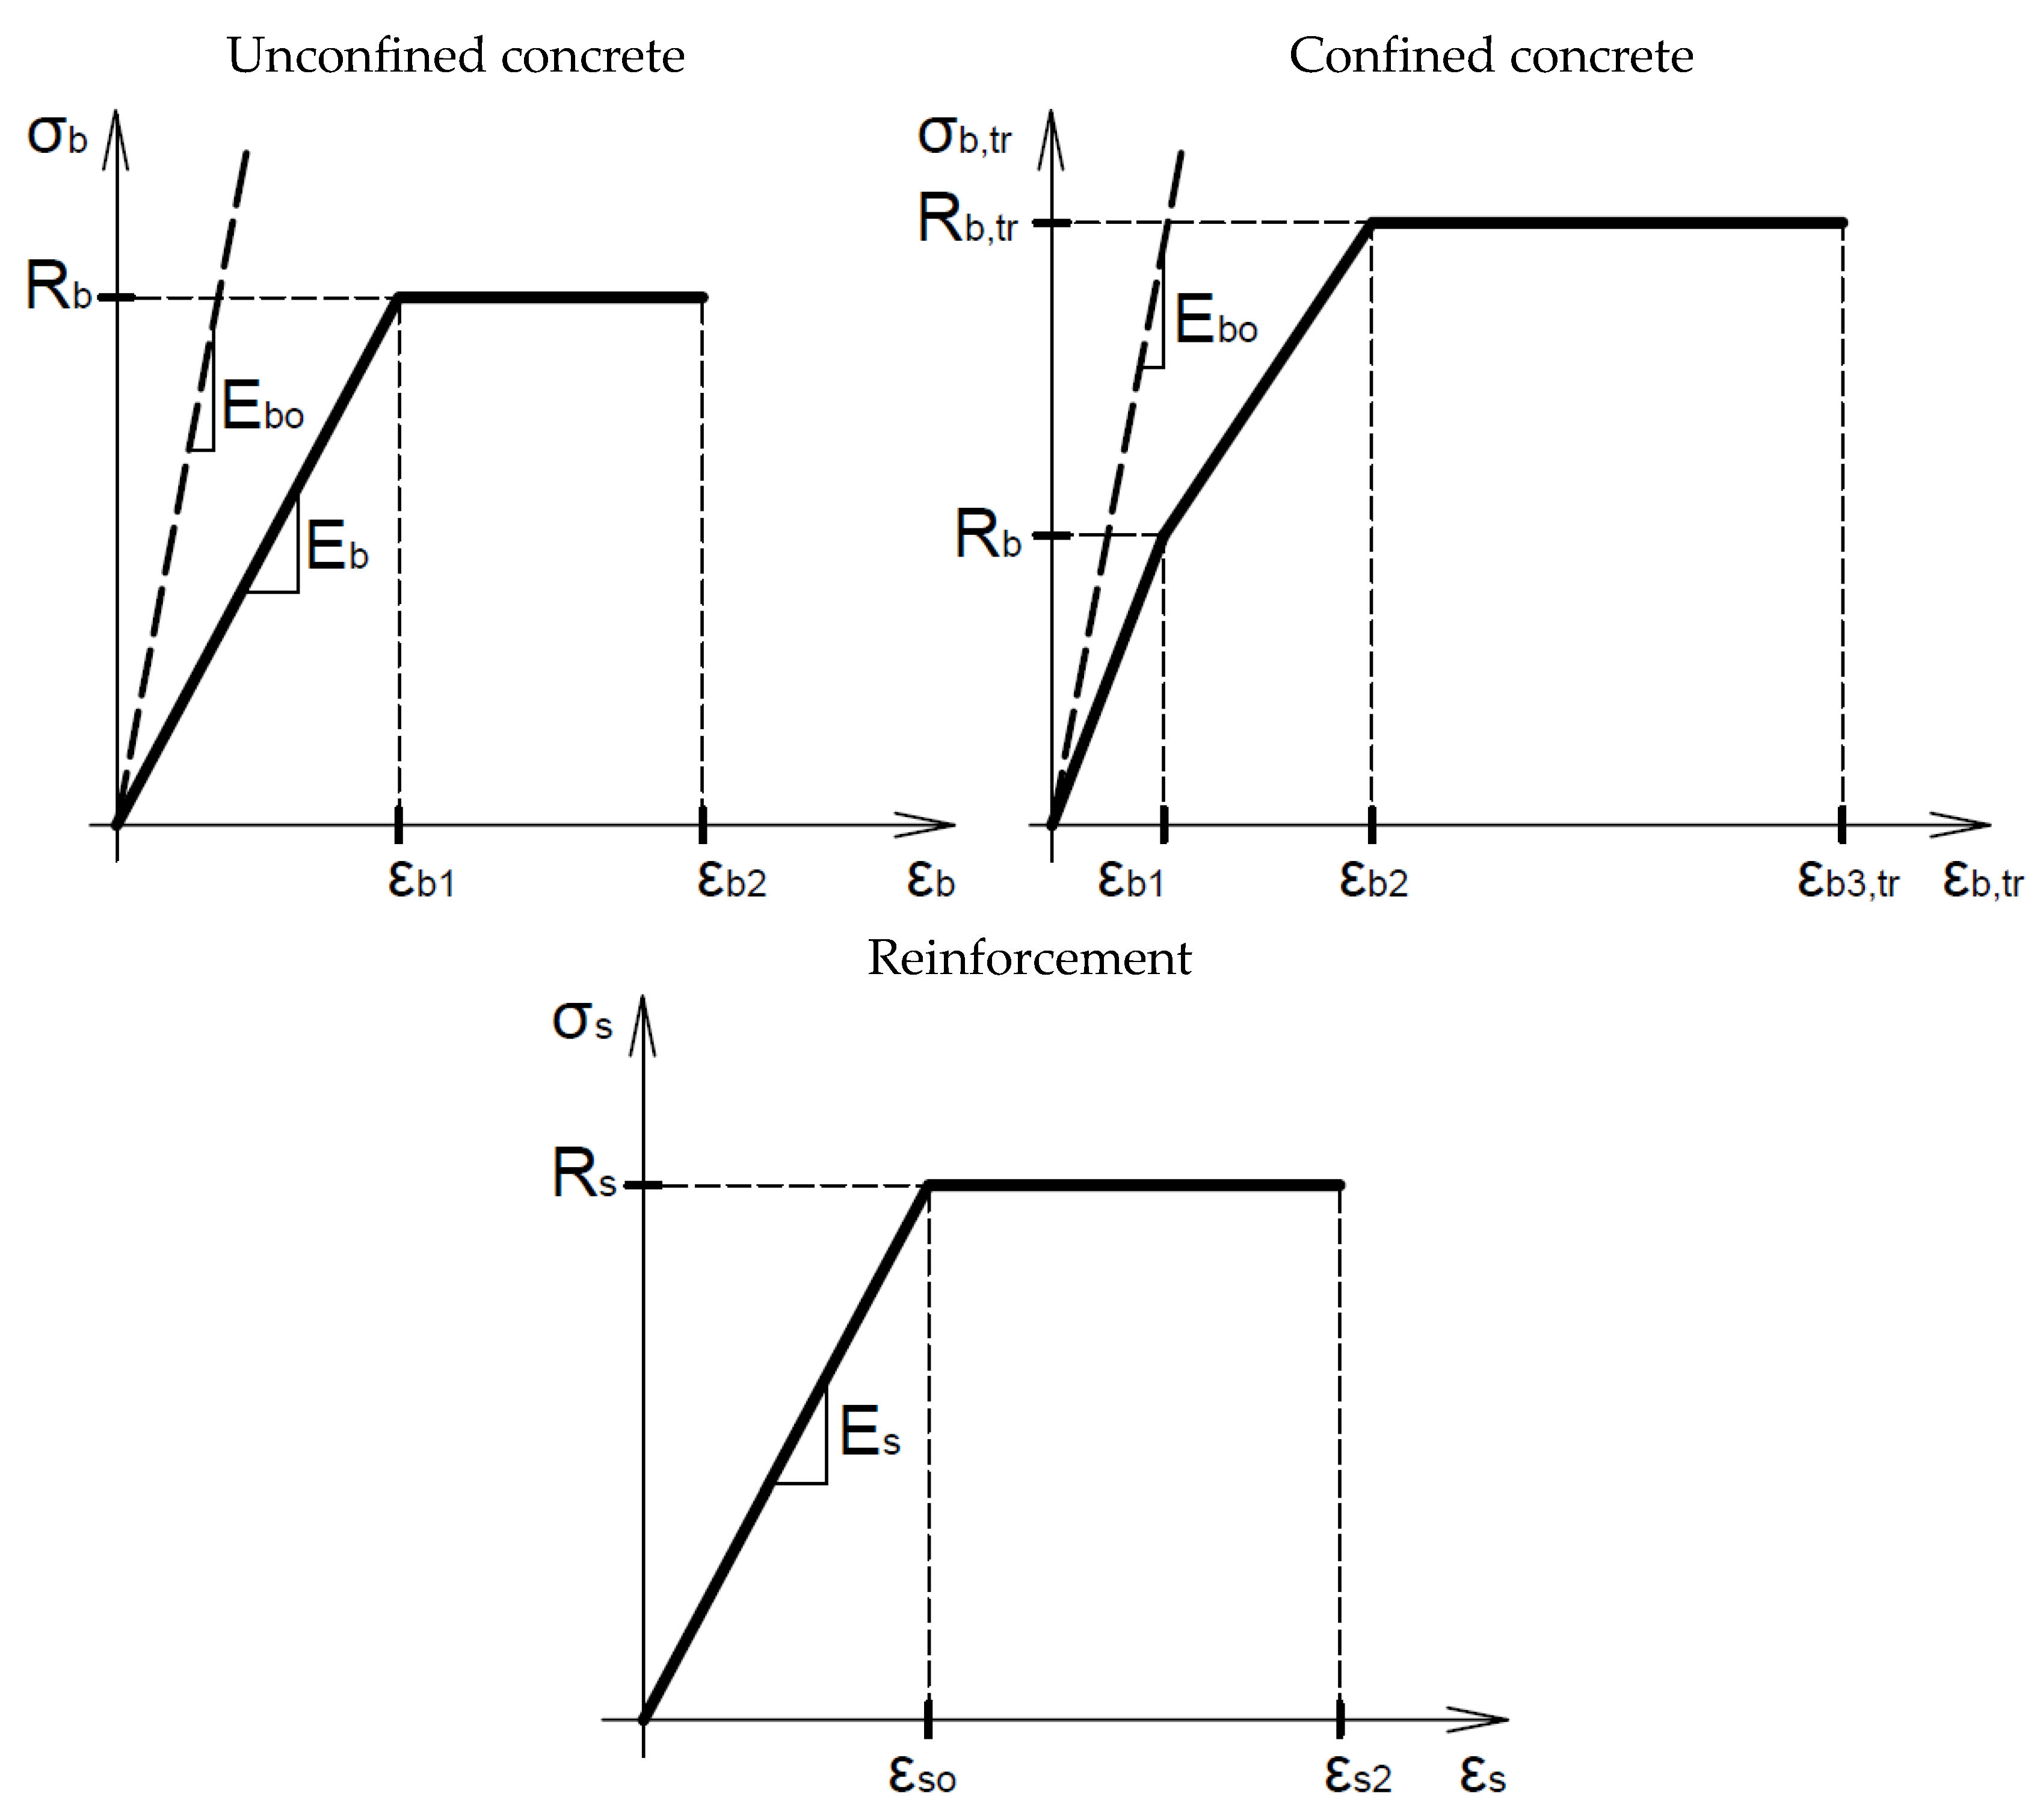
- ordinary (unconfined) concrete: Rb = 14.5 MPa, Eb = 9667 MPa, εb1 = 0.0015, εb2 = 0.0035;
- confined concrete: Rb,tr = 18,91 MPa, εb3,tr = 0.00504;
- reinforcement: Rs = 435 MPa, Es = 200,000 MPa, εso = 0.002175, εs2 = 0.025.
3. Results
4. Discussion
5. Conclusions
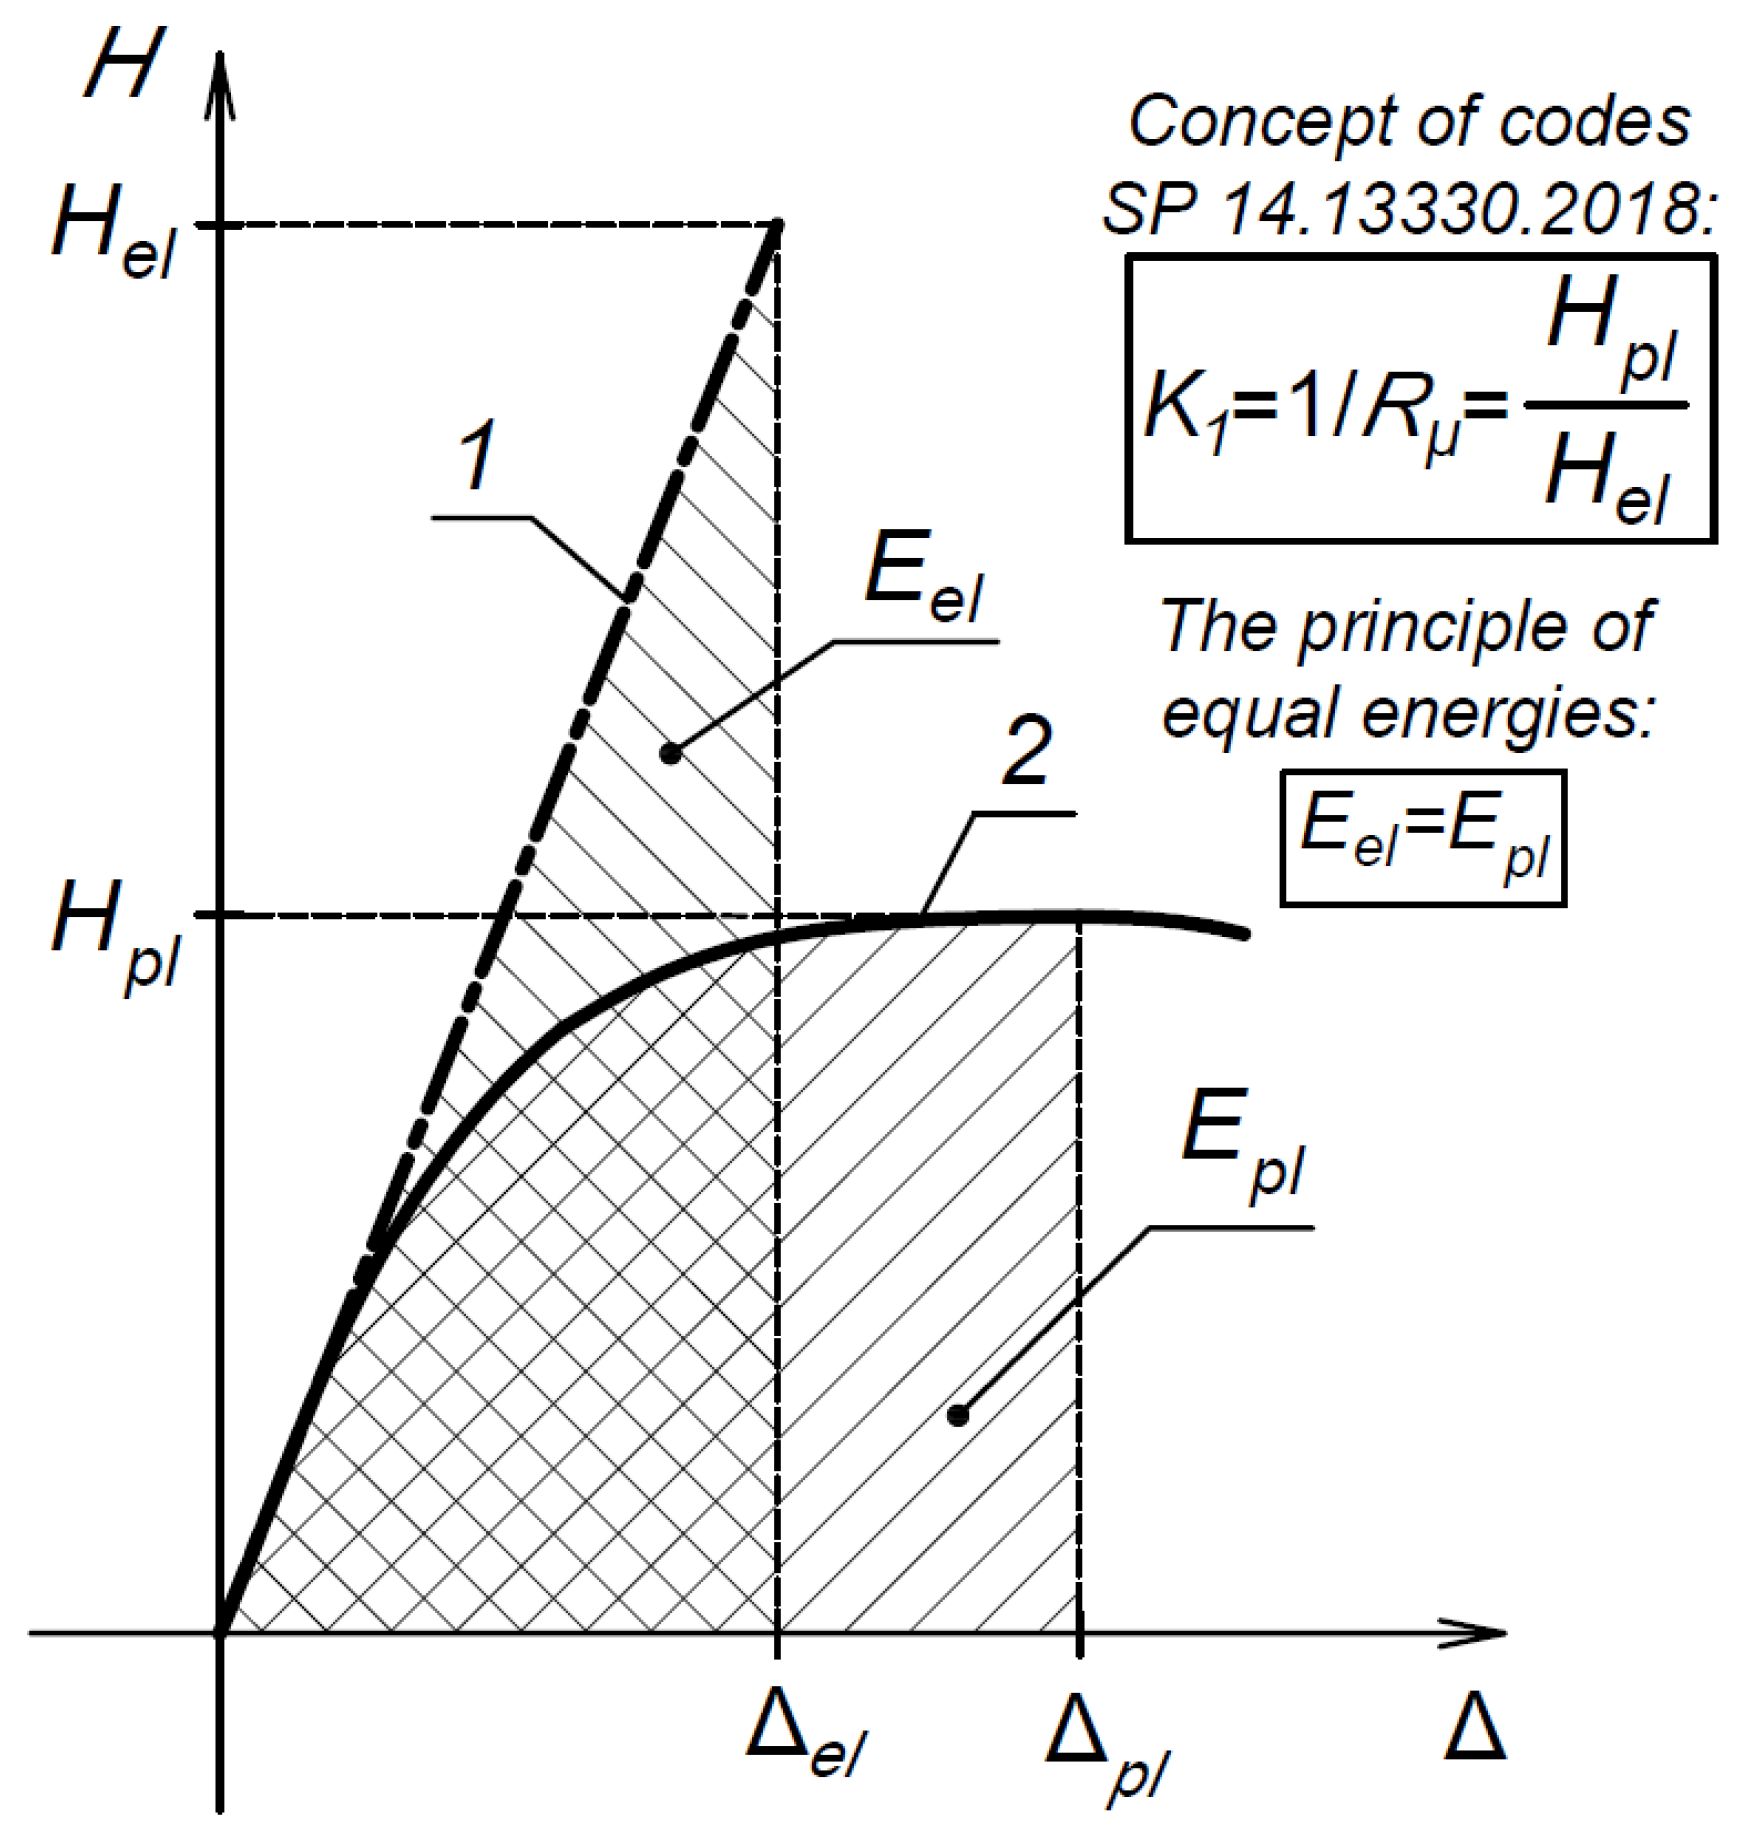
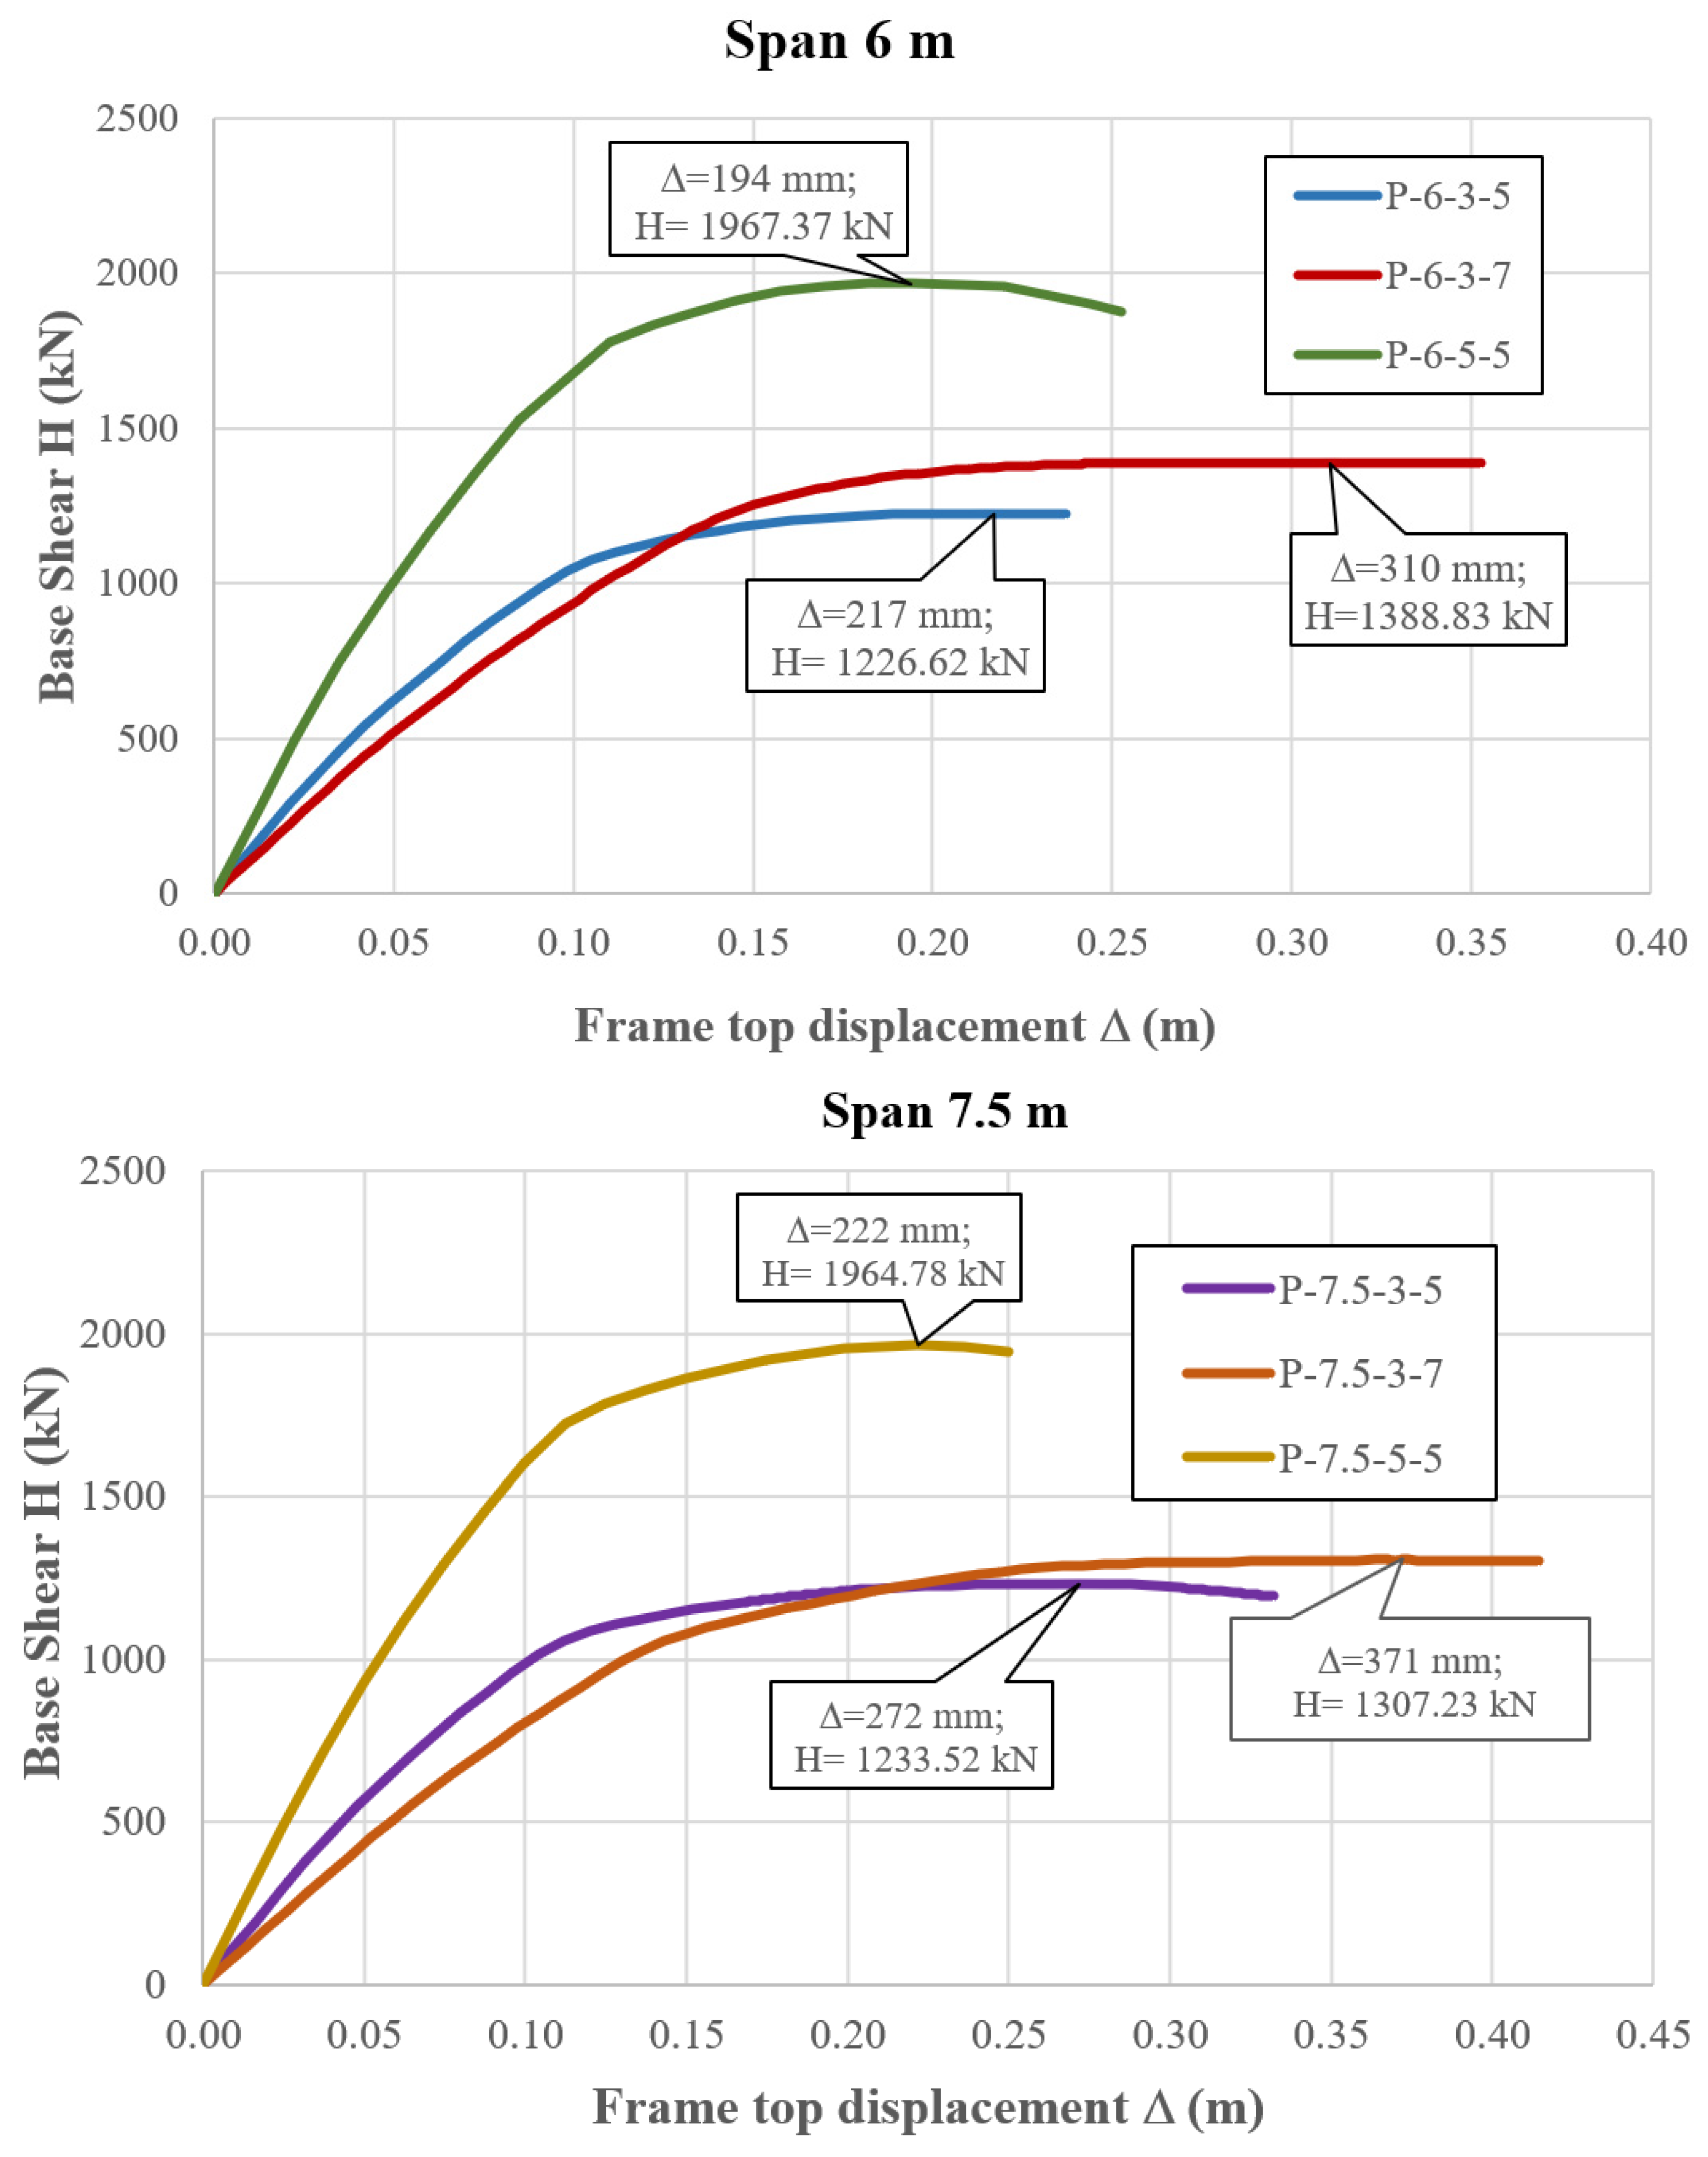
- To calculate the coefficient K1, a calculation was performed using the pushover analysis, and the bearing capacity curves were constructed. The obtained values of the coefficients K1 exceed the values of the coefficient according to SP 14.13330.2018 (K1 = 0.35) by 1.4-1.49 times for the 3-span frames P-6-3-5, P-6-3-7, P-7.5-3-5, and P-7.5-3-7, and by 1.58-1.62 times for the 5-span frames P-6-5-5 and P-7.5-5-5. Thus, the design standards overestimate the plastic behavior of reinforced concrete frames;
- The 3-span frames (P-6-3-5, P-6-3-7, P-7.5-3-5, and P-7.5-3-7), which have greater flexibility in the horizontal direction, demonstrate a more plastic behavior than 5-span frames (P-6-5-5 and P-7.5-5-5). The ductility coefficient µ for the former was, on average, 13.8% higher;
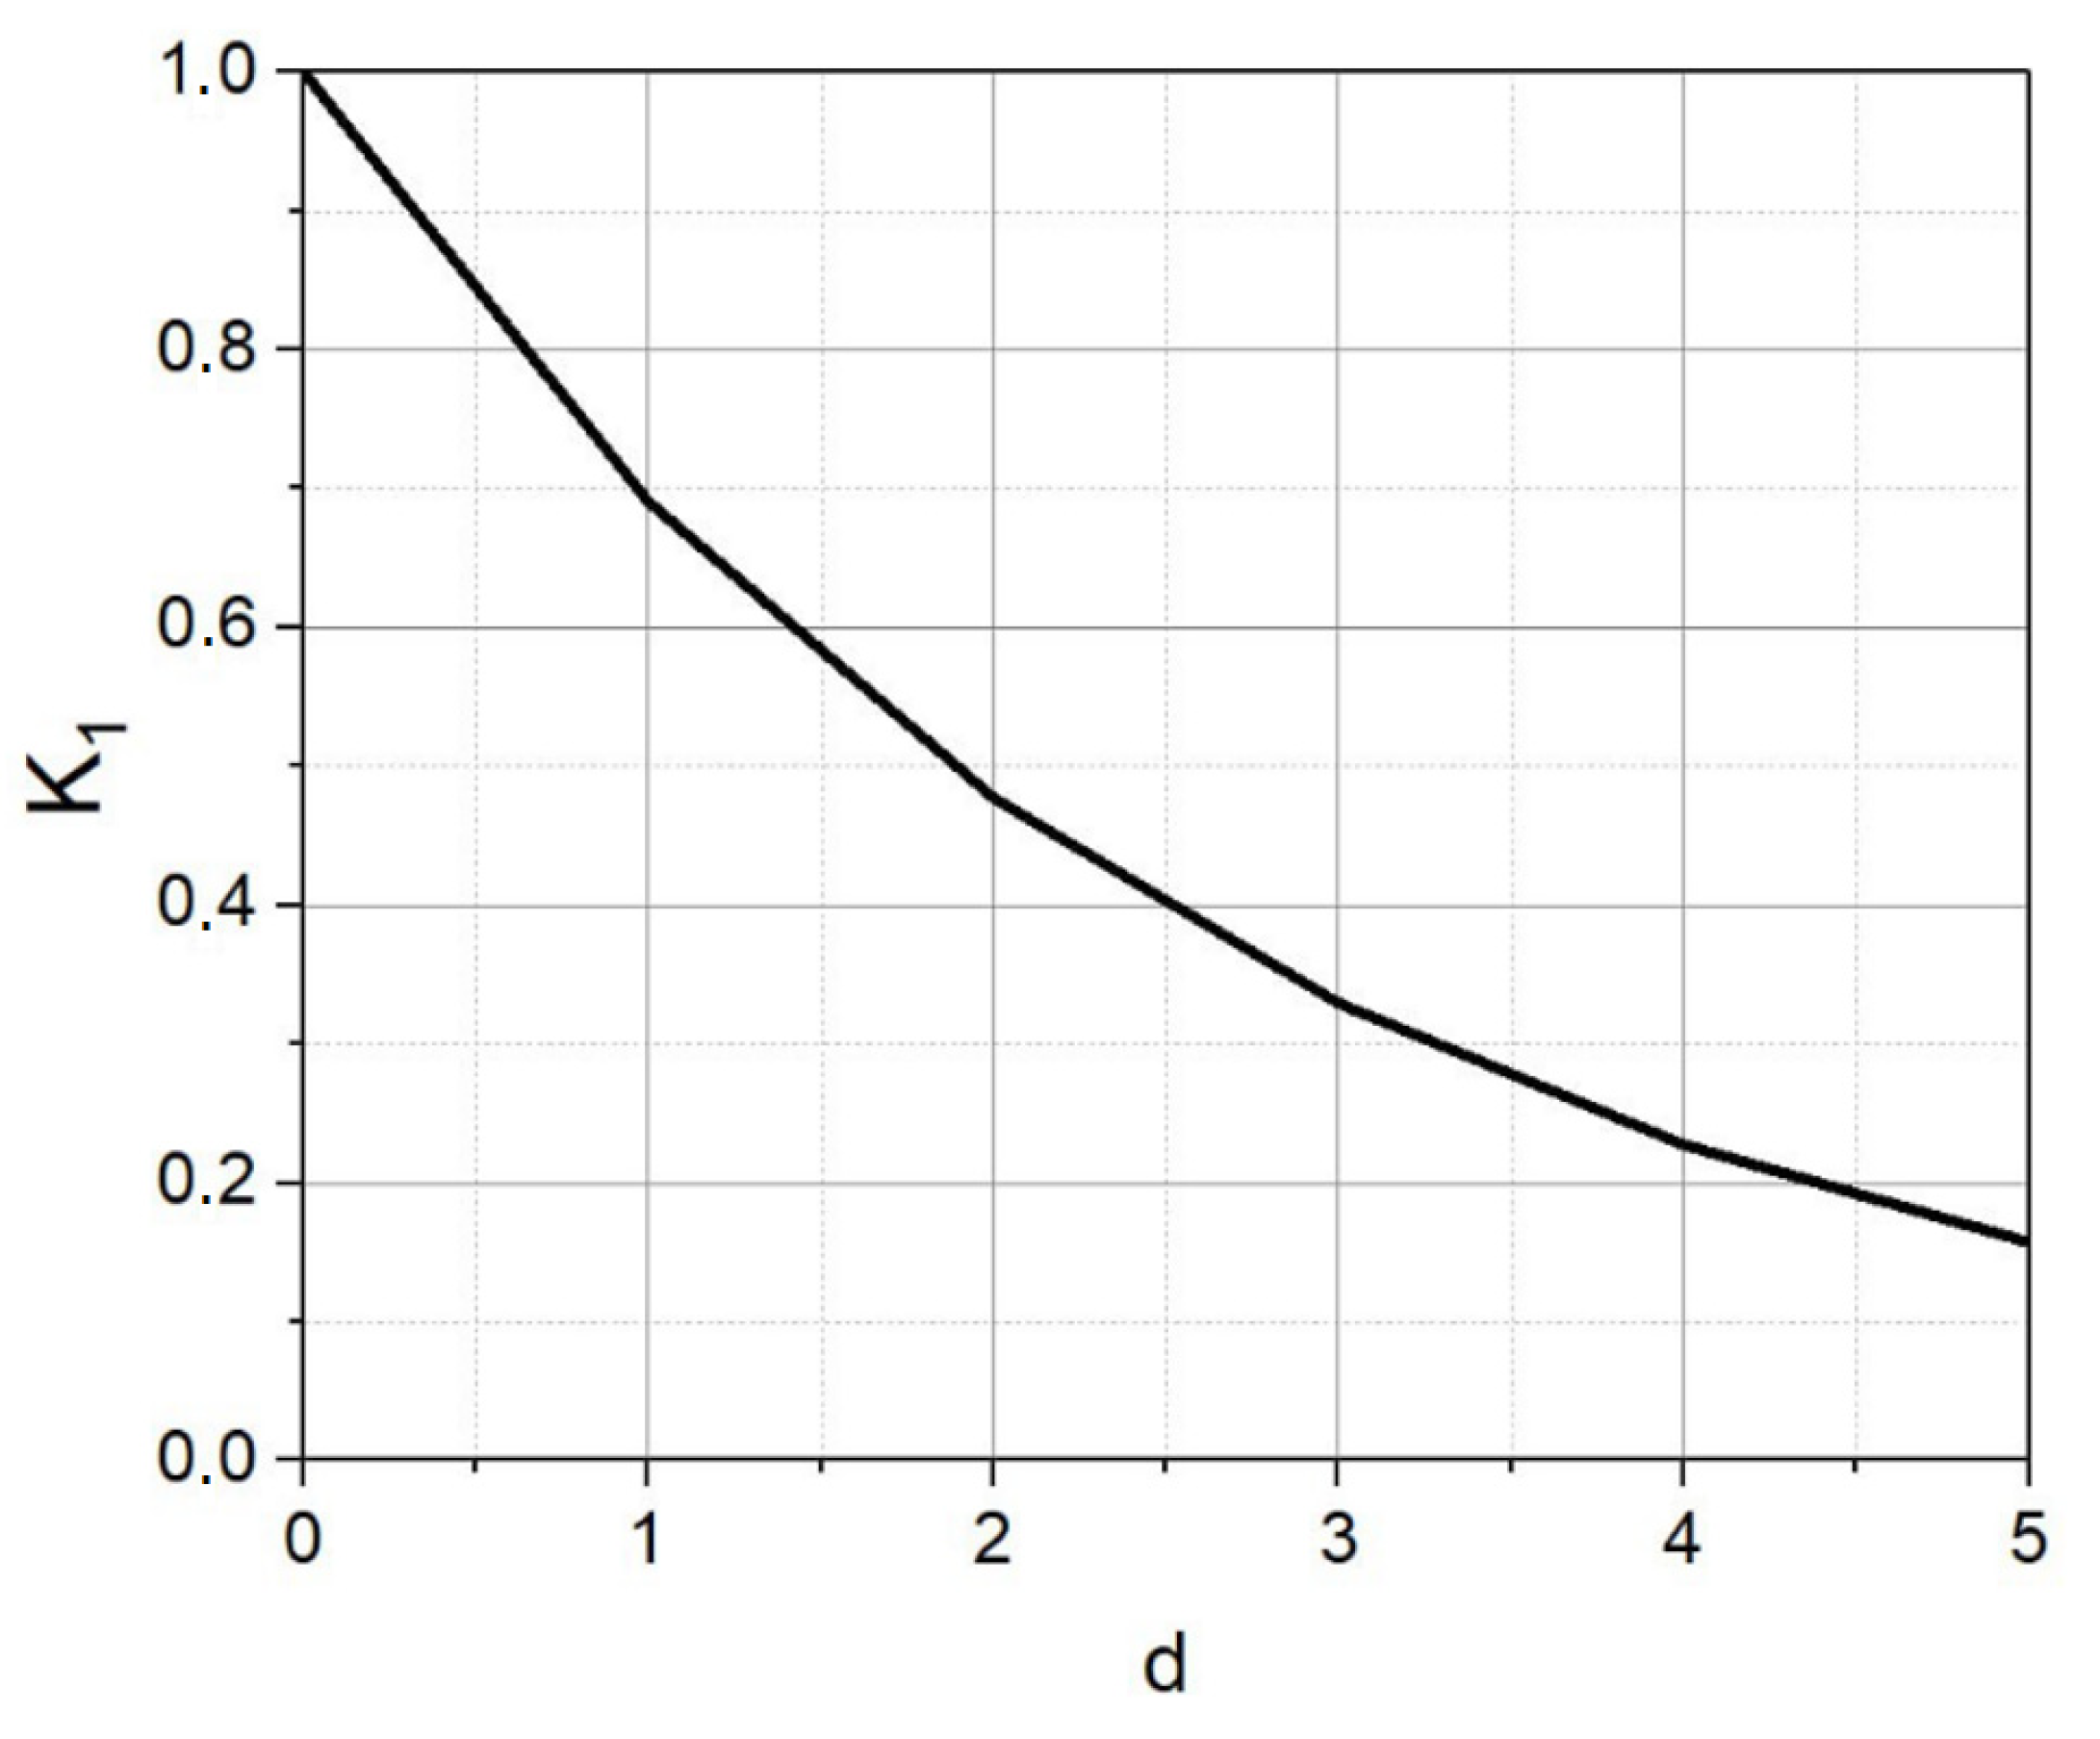
- A fairly accurate correspondence was obtained between the values of the K1 coefficients based on the pushover analysis and the K1 coefficients obtained using the relationship between the values of the average degree of damage d according to the MMSK-86 scale for frames of different types. The average K1 value found by the pushover analysis was 0.526, and the average K1 value, taking into account the dependence on d, was 0.51;
- The obtained values of the coefficients of permissible damage K1 indicate the need to revise the suggested values of K1 for frames according to the current standards of SP 14.13330.2018 towards an increase. It is proposed to increase the coefficient K1 for reinforced concrete frames to a value of at least K1 = 0.5 with mandatory clarification of the actual level of reduction using a nonlinear static method. This recommendation should be imposed in case frames are not designed according to the capacity concept.
Author Contributions
Funding
Data Availability Statement
Conflicts of Interest
References
- Eisenberg, Y.M. Spitak earthquake on December 7, 1988. Some lessons and conclusions (in Russian) «Spitakskoe zemletryasenie 7 dekabrya 1988 goda. Nekotorye uroki i vyvody» // Earthquake-resistant construction. Saf. Struct. 1999, 1, 6–9. [Google Scholar]
- Tamrazyan, A.G.; Kudryavtsev, M.V. Influence of Damage Level on Dynamic Characteristics of Reinforced Concrete Structures when Assessing their Seismic Resistance. Struct. Mech. Eng. Constr. Build. 2024, 20, 255–264. [Google Scholar] [CrossRef]
- Tamrazyan, A.; Matseevich, T. The Criteria for Assessing the Safety of Buildings with a Reinforced Concrete Frame during an Earthquake after a Fire. Buildings 2022, 12, 1662. [Google Scholar] [CrossRef]
- Tamrazyan, A.; Kabantsev, O.; Matseevich, T.; Chernik, V. Estimation of the Reduction Coefficient When Calculating the Seismic Resistance of a Reinforced Concrete Frame Building after a Fire. Buildings 2024, 14, 2421. [Google Scholar] [CrossRef]
- Maksimovna, S.A.; Aleksandrovich, T.V.; Vladimirovna, Z.O.; Aleksandrovich, R.V. Russian and foreign standards of seismic design of buildings and structures. Alfabuild 2018, 4, 92–114. [Google Scholar]
- EN 1998-1; Eurocode 8: Design of Structures for Earthquake Resistance—Part 1: General Rules, Seismic Actions and Rules for Buildings. British Standard Institution: Milton Keynes, UK, 2004.
- Kuramoto, H. Seismic Design Codes for Buildings in Japan. J. Disaster Res. 2006, 1, 314–356. [Google Scholar] [CrossRef]
- American Concrete Institute and International Organization for Standardization. ACI 318-11; Building Code Requirements for Structural Concrete. ISO: Geneva, Switzerland, 2011.
- American Society of Civil Engineers. ASCE 7-22; Minimum Design Loads for Buildings And Other Structures. American Society of Civil Engineers: Reston, VA, USA, 2022.
- Set of Rules SP 14.13330.2018; Construction in Seismic Areas. SNiP II7-81* (in Russian) «Svod Pravil SP 14.13330.2018. Stroitel’stvo v Sejsmicheskih Rajonah. SNiP II7-81*». Ministry of Construction of Russia: Moscow, Russia, 2018; 122p.
- Amar, L.; Abed, A. Evaluation of the seismic behavior factor of reinforced concrete frame structures based on comparative analysis between non-linear static pushover and incremental dynamic analyses. Bull. Earthq. Eng. 2015, 13, 1773–1793. [Google Scholar] [CrossRef]
- Martin, D.; Ambrosini, D.; Curadelli, O. Nonlinear dynamic numerical analysis of a RC frame subjected to seismic loading. Eng. Struct. 2017, 138, 410–424. [Google Scholar] [CrossRef]
- Kuria, K.K.; Kegyes-Brassai, O.K. Pushover Analysis in Seismic Engineering: A Detailed Chronology and Review of Techniques for Structural Assessment. Apl. Sci. 2024, 14, 151. [Google Scholar] [CrossRef]
- Sullivan, T.J.; Saborio-Romano, D.; O’Reilly, G.J.; Welch, D.P.; Landi, L. Simplified Pushover Analysis of Moment Resisting Frame Structures. J. Earthq. Eng. 2018, 25, 621–648. [Google Scholar] [CrossRef]
- Sosnin, A.V. About a Refinement Procedure of Seismic Force Reduction Factor K1 using a Pushover Curve for Earthquake Resistance Estimation of RC LSC Frame Buildings. Zhilishchnoe Stroit. 2017, 1, 60–70. (In Russian) [Google Scholar]
- Sung, Y.C.; Lin, T.K.; Hsiao, C.C.; Lai, M.C. Pushover analysis of reinforced concrete frames considering shear failure at beam-column joints. Earthq. Eng. Eng. Vib. 2013, 12, 373–383. [Google Scholar] [CrossRef]
- Zou, X.-K.; Chan, C.M. Optimal seismic performance-based design of reinforced concrete buildings using nonlinear pushover analysis. Eng. Struct. 2005, 27, 1289–1302. [Google Scholar] [CrossRef]
- Panyakapo, P. Pushover Analysis procedure to estimate seismic demands for buildings. Eng. Struct. 2014, 66, 10–23. [Google Scholar] [CrossRef]
- Abakanov, M.; Dyussembayev, I.; Nigmetov, M. Identifying the effect of low-cycle fatigue of reinforced concrete structures on the properties of the reducing coefficient under the action of a seismic type load. East.-Eur. J. Enterp. Technol. 2024, 129, 26–37. [Google Scholar] [CrossRef]
- Hussein, S.; Alaa, M.; Ola, Q.; Baydaa, M.; Hussein, A. Ductility Factor Evaluation of Concrete Moment Frame Retrofitted by FRP Subjected to Seismic Loads. Int. Rev. Civ. Eng. (IRECE) 2020, 11, 8. [Google Scholar] [CrossRef]
- Erkmen, B. Effects of unbonded steel layout on seismic behavior of post-tensioned precast concrete shear walls December. Bull. Earthq. Eng. 2020, 19, 1–23. [Google Scholar] [CrossRef]
- Ruggieri, S.; Uva, G. Extending the concepts of response spectrum analysis to nonlinear static analysis: Does it make sense? Innov. Infrastruct. Solut. 2024, 9, 235. [Google Scholar] [CrossRef]
- Ruggieri, S.; Uva, G. Accounting for the spatial variability of seismic motion in the pushover analysis of regular and irregular RC buildings in the new Italian building code. Buildings 2020, 10, 177. [Google Scholar] [CrossRef]
- Kabantsev, O.; Umarov, K. Features of Elastic-plastic Deformation of Reinforced Concrete Shear-wall Structures under Earthquake Excitations. Earthq. Eng. Constr. Saf. 2020, 1, 18–28. [Google Scholar] [CrossRef]
- Newmark, N. Fundamentals of Earthquake-Resistant Construction; Eisenberg, Y.M., Ed.; John Wiley & Sons: Hoboken, NJ, USA, 1980; 344p. (In Russian) [Google Scholar]
- Chernov, Y.T.; Kbeyli, D. Assessment of seismic forces with structural schemes changed during vibrations. Struct. Mech. Eng.Struct. Struct. 2021, 4, 391–403. (In Russian) [Google Scholar]
- Mkrtychev, O.V.; Andreev, M.I. Estimation of the Value of the Coefficient of Permissible Damages for a Frame-Bonded Reinforced Concrete Frame under Earthquake. Ind. Civ. Eng. 2020, 9, 34–40. (In Russian) [Google Scholar] [CrossRef]
- Dzhinchvelashvili, G.A.; Bulushev, S.V.; Kolesnikov, A.V. Nonlinear static method of analysis of seismic resistance of buildings and structures [Nelinejny`j staticheskij metod analiza sejsmostojkosti zdanij i sooruzhenij]. Earthquake engineering. Constr. Saf. 2016, 5, 39–47. (In Russian) [Google Scholar]
- Kabantsev, O.; Perelmuter, A. Plastic Behavior Particularities of Structures Subjected to Seismic Loads. Mag. Civ. Eng. 2021, 5, 10513. [Google Scholar] [CrossRef]
- Getachew, K.; Chen, D.H.; Peng, G. Seismic Performance Evaluation of RC Frame Designed Using Ethiopian and Chinese Seismic Codes. Adv. Civ. Eng. 2020, 24, 8493495. [Google Scholar] [CrossRef]
- Papanikolaou, V.K.; Kartalis-Kaounis, T.; Protopapadakis, E.; Papadopoulos, T. A new graphical user interface for OpenSees. In Proceedings of the 1st European Conference on OpenSees, Porto, Portugal, 19–20 June 2017; pp. 73–76. Available online: http://eosd2017.weebly.com/ (accessed on 15 October 2024).
- Mander, J.B.; Priestley, J.N.; Park, R. Theoretical stress-strain model for confined concrete. Eng. Struct. 1989, 116, 1804–1825. [Google Scholar] [CrossRef]
- Set of Rules SP 63.13330.2018; Concrete and Reinforced Concrete Structures. General Provisions. SNiP 52-01-2003 (in Russian) «Betonnyè i Zhelezobetonnyè Konstrukcii Osnovnyè Polozheniya. SNiP 52-01-2003». Ministry of Construction of Russia: Moscow, Russia, 2018; 124p. (In Russian)
- Shebalin, N.V.; Ershov, I.A.; Shestoperov, G.S. Uluchshennyy variant shkaly seysmicheskoy intensivnosti (MMSK-86) na baze shkal MSK-64 i MSSSS-73 (zaklyuchitel’nyy) [Improved Version of the Seismic Activity Scale (MMSK-86) Based on the Scales MSK-64 and MCCCC-73 (Final Version)]; MSSSS, IFZ Publ.: Moscow, Russia, 1986; 61p. [Google Scholar]
- Drumea, A.V.; Shebalin, N.V.; Scladnev, N.N.; Graphova, S.S.; Oizerman, V.I. The Carpathian Earthquake of 1986; Shtiinets: Kishinev, Moldova, 1990; 334p. [Google Scholar]


| Frame | Parameters | Model Number | ||||
|---|---|---|---|---|---|---|
| 1 | 2 | 3 | 4 | 5 | ||
| P-6-3-5 | Ti (s) | 0.707 | 0.224 | 0.124 | 0.082 | 0.062 |
| βi | 1.88 | 2.5 | 2.5 | 2.23 | 1.93 | |
| P-6-3-7 | Ti (s) | 0.990 | 0.320 | 0.180 | 0.121 | 0.088 |
| βi | 1.59 | 2.5 | 2.5 | 2.5 | 2.32 | |
| P-6-5-5 | Ti (s) | 0.705 | 0.225 | 0.125 | 0.083 | 0.064 |
| βi | 1.88 | 2.5 | 2.5 | 2.25 | 1.96 | |
| P-7.5-3-5 | Ti (s) | 0.846 | 0.265 | 0.143 | 0.092 | 0.069 |
| βi | 1.72 | 2.5 | 2.5 | 2.38 | 2.04 | |
| P-7.5-3-7 | Ti (s) | 1.186 | 0.380 | 0.212 | 0.140 | 0.100 |
| βi | 1.45 | 2.5 | 2.5 | 2.5 | 2.5 | |
| P-7.5-5-5 | Ti (s) | 0.845 | 0.267 | 0.145 | 0.095 | 0.071 |
| βi | 1.72 | 2.5 | 2.5 | 2.43 | 2.07 | |
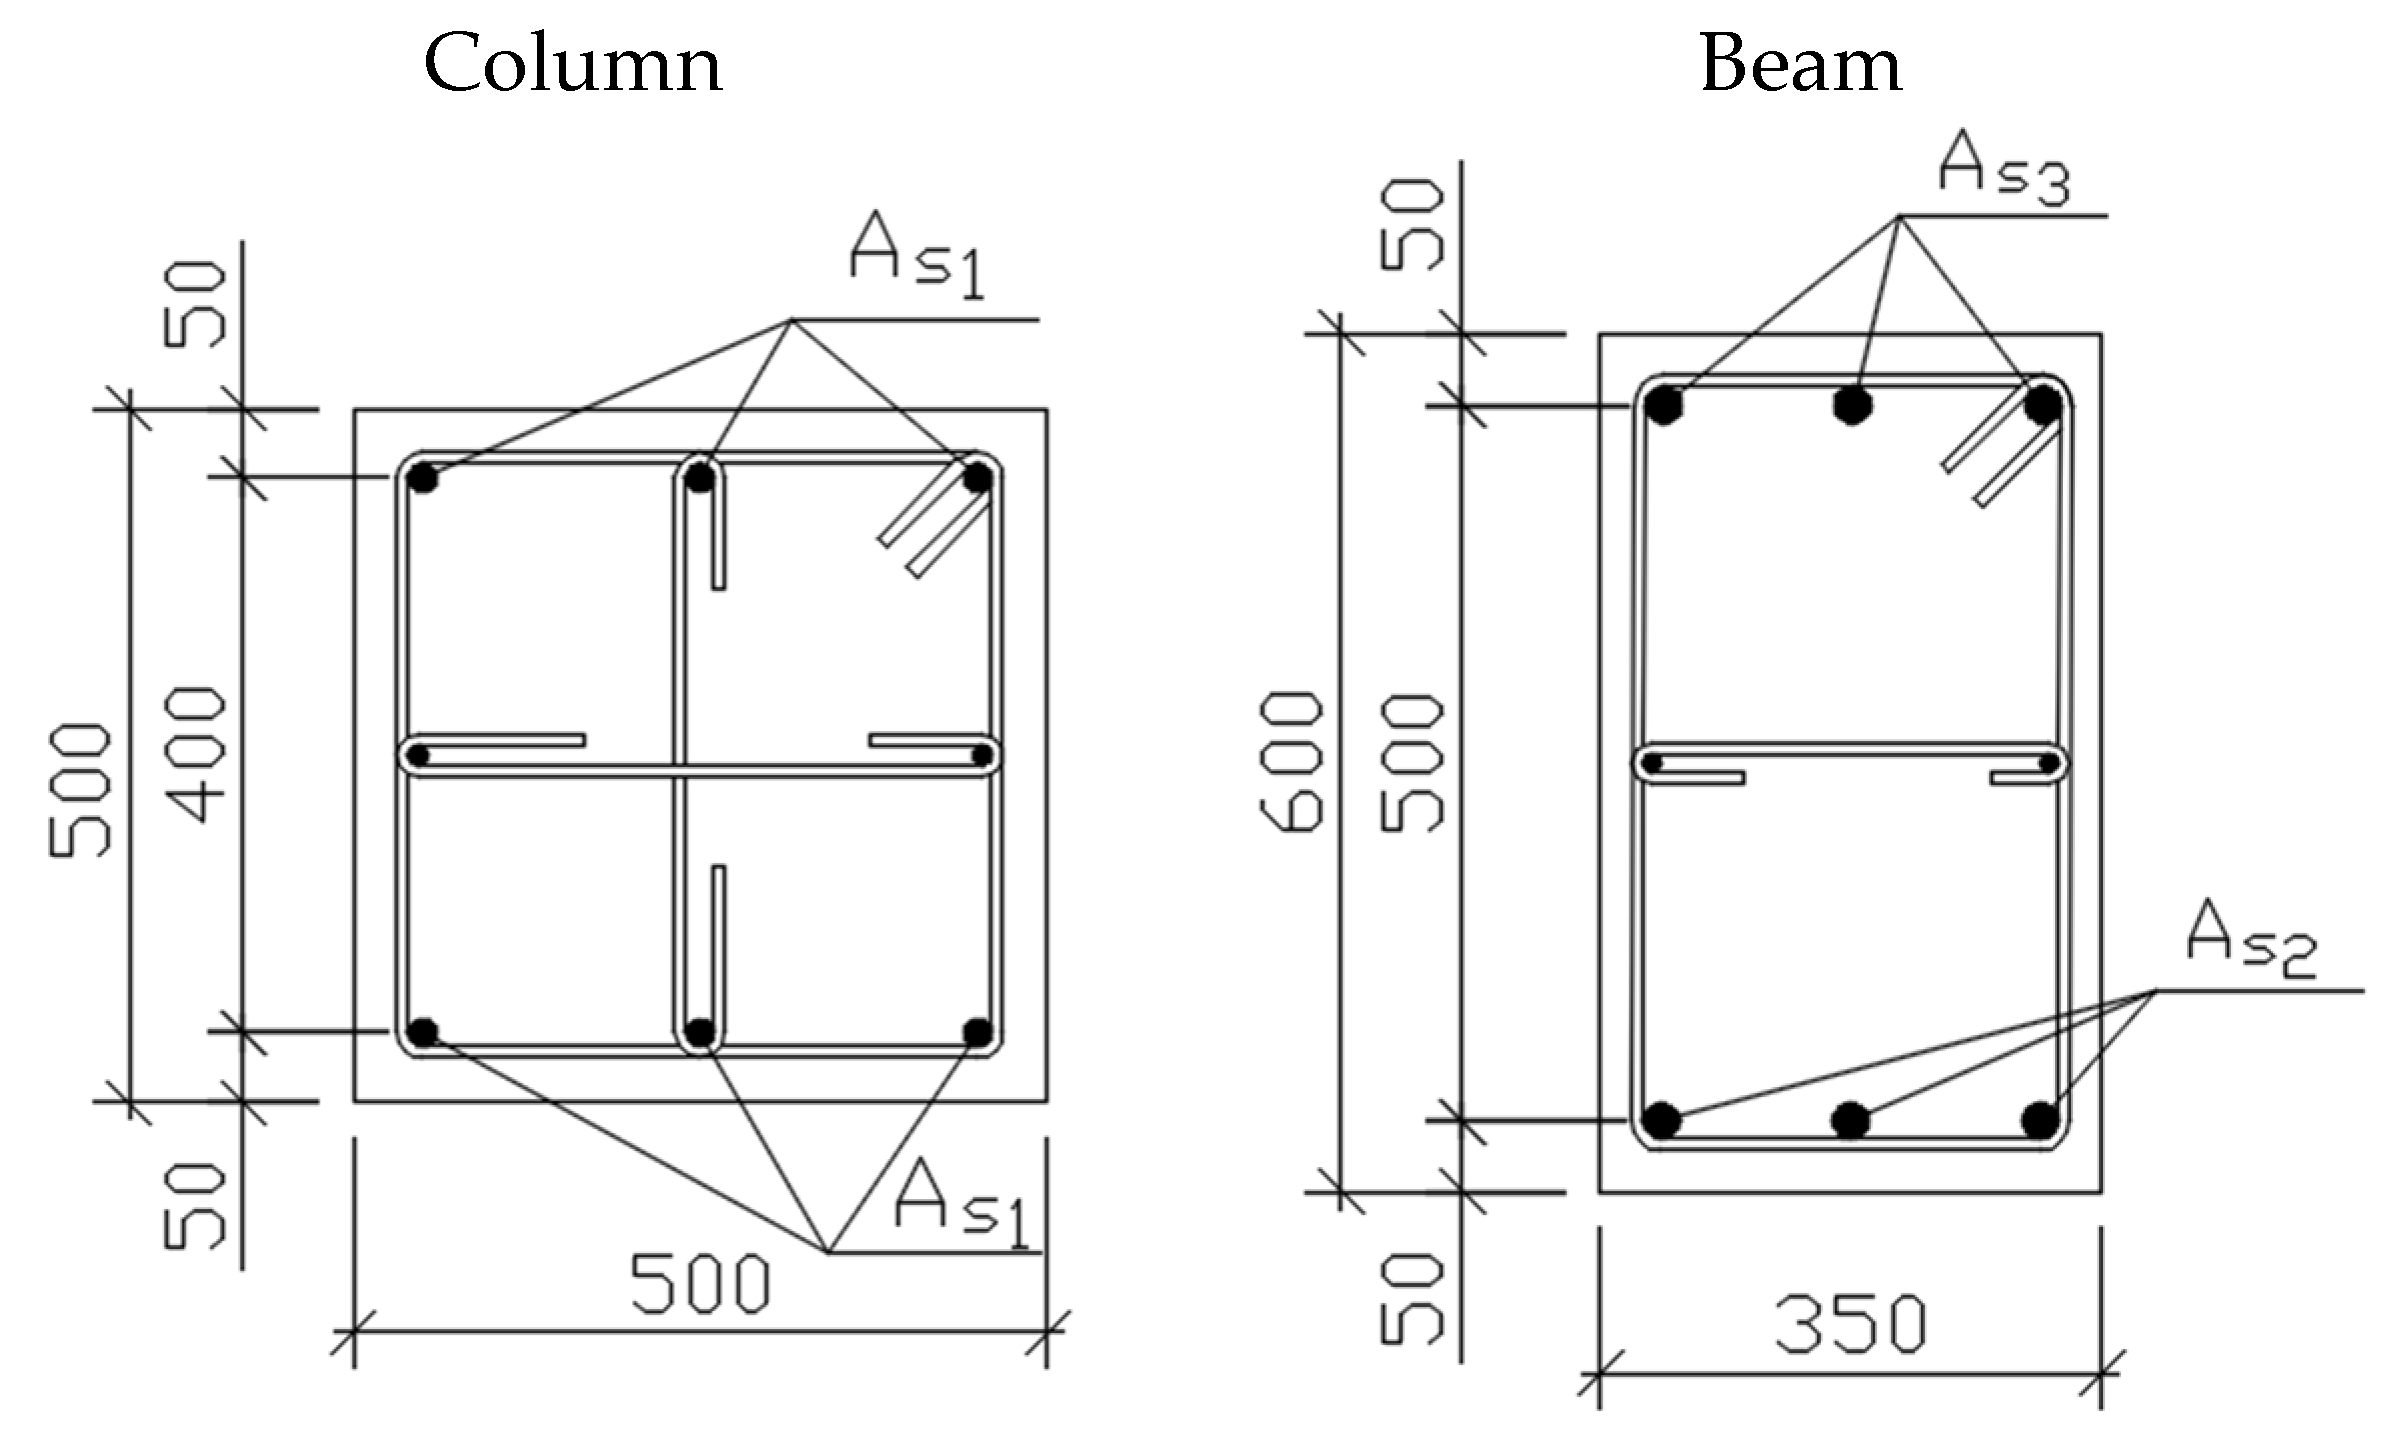
| Frame | Span, m | Number of Spans | Number of Floors | Period T1, s | As1 | Floor | As2 | As3 |
|---|---|---|---|---|---|---|---|---|
| P-6-3-5 | 6 | 3 | 5 | 0.707 | 3ø28 | 1,2 | 3ø25 | 3ø32 |
| 3 | 3ø18 | 3ø28 | ||||||
| 4,5 | 3ø16 | 3ø25 | ||||||
| P-6-3-7 | 6 | 3 | 7 | 0.990 | 3ø36 | 1,2,3 | 3ø25 | 3ø36 |
| 4,5 | 3ø20 | 3ø32 | ||||||
| 6,7 | 3ø16 | 3ø25 | ||||||
| P-6-5-5 | 6 | 5 | 5 | 0.705 | 3ø28 | 1,2 | 3ø25 | 3ø32 |
| 3 | 3ø18 | 3ø28 | ||||||
| 4,5 | 3ø16 | 3ø25 | ||||||
| P-7.5-3-5 | 7.5 | 3 | 5 | 0.846 | 3ø28 | 1,2 | 3ø25 | 3ø36 |
| 3 | 3ø20 | 3ø32 | ||||||
| 4,5 | 3ø16 | 3ø28 | ||||||
| P-7.5-3-7 | 7.5 | 3 | 7 | 1.186 | 3ø36 | 1,2,3 | 3ø25 | 3ø36 |
| 4,5 | 3ø20 | 3ø32 | ||||||
| 6,5 | 3ø16 | 3ø28 | ||||||
| P-7.5-5-5 | 7.5 | 5 | 5 | 0.846 | 3ø28 | 1,2 | 3ø25 | 3ø36 |
| 3 | 3ø20 | 3ø32 | ||||||
| 4,5 | 3ø16 | 3ø28 |
| Frame | Period T1, s | Hpl, kN | Hel, kN | Δpl, mm | Δel, mm | Δy, mm | E, kN·m | μ | K1 f. (3) | K1 f. (4) |
|---|---|---|---|---|---|---|---|---|---|---|
| P-6-3-5 | 0.707 | 1226.6 | 2359.5 | 217 | 167 | 112 | 197.1 | 1.93 | 0.520 | 0.516 |
| P-6-3-7 | 0.990 | 1388.8 | 2693.6 | 310 | 240 | 153 | 323.2 | 2.02 | 0.516 | 0.494 |
| P-6-5-5 | 0.705 | 1967.4 | 3464.2 | 194 | 158 | 110 | 273.7 | 1.76 | 0.568 | 0.568 |
| P-7.5-3-5 | 0.846 | 1233.5 | 2519.4 | 272 | 204 | 128 | 257.0 | 2.12 | 0.490 | 0.470 |
| P-7.5-3-7 | 1.186 | 1307.2 | 2576.9 | 371 | 285 | 181 | 478.0 | 2.05 | 0.507 | 0.488 |
| P-7.5-5-5 | 0.845 | 1964.8 | 3546.9 | 222 | 177 | 123 | 313.9 | 1.81 | 0.554 | 0.552 |
| Type of Buildings | Initial Values [35] | Received Values | ||||
|---|---|---|---|---|---|---|
| Moderate Damage d | Standard σ | Coefficient of Variation ν | Average Value of Average Damage Degree <d> | Average Value of Standard σ’ | Average Value of the Variation Coefficient ν’ | |
| Frame civil buildings type IIS-04 | 2.2 | 0.83 | 0.38 | 1.81 | 0.53 | 0.26 |
| Frame industrial buildings type IIS-04 | 2.2 | 0.97 | 0.44 | 1.82 | 0.57 | 0.30 |
| Frame civil buildings type IIS-20 | 2.3 | 0.86 | 0.38 | 1.83 | 0.54 | 0.29 |
| J-Jc | Degree of Damage | |||||
|---|---|---|---|---|---|---|
| 0 | 1 | 2 | 3 | 4 | 5 | |
| 0 | 0.9 | 0.1 | - | - | - | - |
| 1 | 0.4 | 0.5 | 0.1 | - | - | - |
| 2 | 0.1 | 0.3 | 0.5 | 0.1 | - | - |
Disclaimer/Publisher’s Note: The statements, opinions and data contained in all publications are solely those of the individual author(s) and contributor(s) and not of MDPI and/or the editor(s). MDPI and/or the editor(s) disclaim responsibility for any injury to people or property resulting from any ideas, methods, instructions or products referred to in the content. |
© 2024 by the authors. Licensee MDPI, Basel, Switzerland. This article is an open access article distributed under the terms and conditions of the Creative Commons Attribution (CC BY) license (https://creativecommons.org/licenses/by/4.0/).
Share and Cite
Tamrazyan, A.; Matseevich, T. Seismic Resistance of Reinforced Concrete Building Frames Based on Interval Assessment of the Coefficient of Permissible Damage. Buildings 2024, 14, 3776. https://doi.org/10.3390/buildings14123776
Tamrazyan A, Matseevich T. Seismic Resistance of Reinforced Concrete Building Frames Based on Interval Assessment of the Coefficient of Permissible Damage. Buildings. 2024; 14(12):3776. https://doi.org/10.3390/buildings14123776
Chicago/Turabian StyleTamrazyan, Ashot, and Tatiana Matseevich. 2024. "Seismic Resistance of Reinforced Concrete Building Frames Based on Interval Assessment of the Coefficient of Permissible Damage" Buildings 14, no. 12: 3776. https://doi.org/10.3390/buildings14123776
APA StyleTamrazyan, A., & Matseevich, T. (2024). Seismic Resistance of Reinforced Concrete Building Frames Based on Interval Assessment of the Coefficient of Permissible Damage. Buildings, 14(12), 3776. https://doi.org/10.3390/buildings14123776