
The Time-Dependent Method for Probabilistic Fault Displacement Hazard Analysis (PFDHA-td)

Abstract
1. Introduction
2. Methods
2.1. Annual Incidence of Earthquakes
2.2. Fault Displacement Probability
2.3. Relationship Between Surface Displacement and Earthquake Magnitude
3. Results
3.1. Assessment Results of Holocene Active Faults of Different Degrees
- (1)
- For Holocene faults with different TRP, the possibility and distance of future surface displacements are significantly different. The surface displacement distance of strong active faults in the Holocene may have reached 2–3 times the surface displacement distance of extremely weak active faults in the same condition. For faults with the same TRP, under different tet, the assessment results of surface displacements also differed by 20% to 40%. This means that when correctly assessing the future surface displacement distance of active faults, it is necessary to consider the TRP and tet of the faults.
- (2)
- The possibility of surface displacement caused by extremely weak Holocene active faults is very low. The hazard of surface displacement needs to be considered only when the return period of the ground motion of concern in a project is close to or exceeds 10,000 years (1% exceedance probability over 100 years). This conclusion is in good agreement with the regulation in many seismic design codes in mainland China that “the hazard of surface displacement on late Pleistocene faults does not need to be considered”.
- (3)
- Since the return period of ground motion focused on in linear engineering is mostly no more than 2000 a, we do not need to consider the surface displacement hazard of extremely weak Holocene active faults and weakly active faults (an active fault with a TRP ≥ 5000 a).
- (4)
- When the tet of the active fault is close to or longer than the TRP, the hazard of surface displacement will increase significantly: Faults that would not otherwise cause surface displacement also have the possibility of generating surface displacement (e.g., the intensely Holocene active fault, when the exceedance probability is 10% over 100 years); faults that originally have the hazard of producing surface displacement may produce greater surface displacement with the same exceedance probability.
3.2. Analysis of Influencing Factors
- (1)
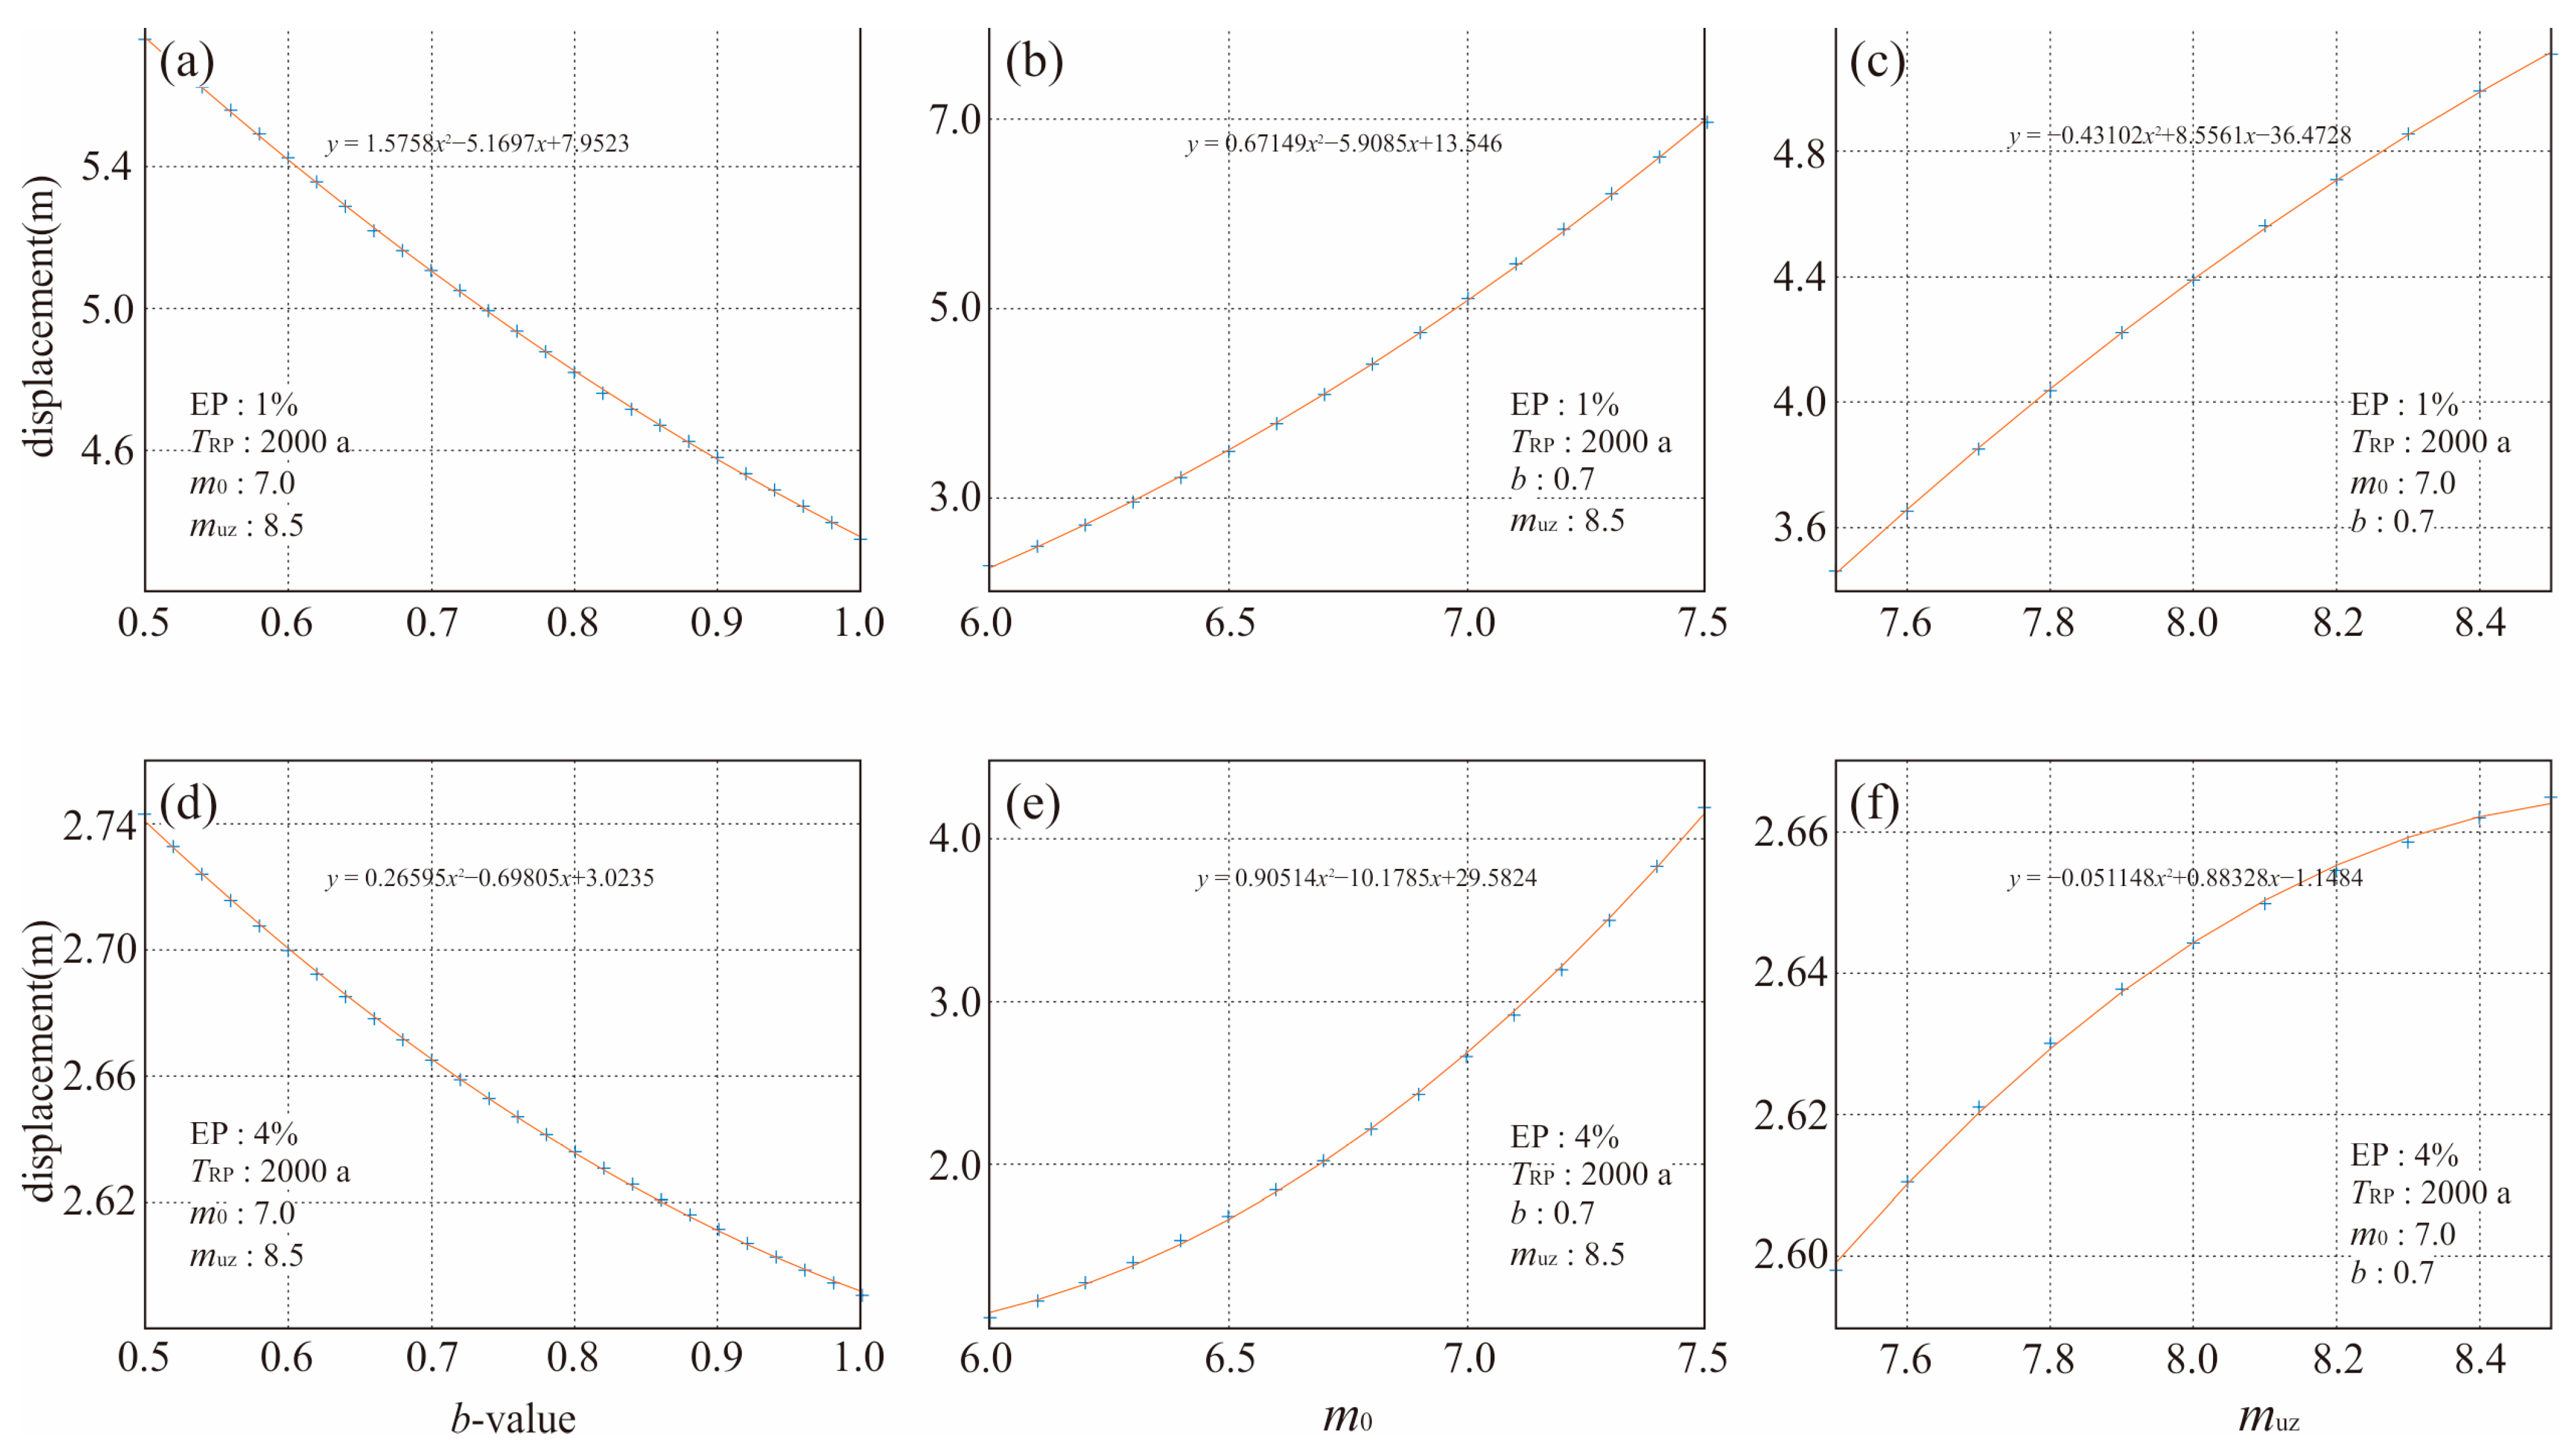
- The impact of b-values
- (2)
- The minimum earthquake magnitude m0 that generates surface displacement
- (3)
- Upper magnitude limit muz of a fault
- (4)
- Statistical relationship between magnitude and surface displacement distance
- (5)
- Sensitivity of the results to the b-value, m0, muz
4. Discussion
4.1. Comparison with Other Methods
4.2. Applicability of the PFDHA-td Method in Other Countries and Regions
4.3. Limitations and Future Studies of PFDHA-td
4.4. Reproducibility
5. Usage and Example (Western Mainland China and the World)
5.1. Usage in Western Mainland China
- (1)
- The recurrence period (TRP) and elapsed time (tet) of strong earthquakes are obtained through trenching, geological surveys, or other methods.
- (2)
- Based on the rake angle (slip direction), given by striations on the fault, the ratio of the horizontal displacement to the vertical displacement of the fault was obtained.
- (3)
- The average annual occurrence rate of strong earthquakes is calculated based on the TRP data.
- (4)
- The annual occurrence rate of strong earthquakes is calculated based on the average occurrence rate of strong earthquakes and the tet data.
- (5)
- The return period considered for the project is determined and the return period to the exceedance probability over 100 years is converted.
- (6)
- To find the intersection points of the annual occurrence rate curve and the exceedance probability in Figure 4, the horizontal displacement and vertical displacement of the fault can be calculated according to the value of the vertical axis corresponding to the intersection point.
- (7)
- The total displacement is calculated based on the horizontal displacement and vertical displacement; according to the rake angle given by striations on fault, the total displacement is decomposed into the horizontal direction and the vertical direction.
- (8)
- For buildings such as railways and oil pipelines that are directly laid on the ground, we can directly use the displacement values we have calculated. For bridges and other structures that span active faults in the air, methods like RSA (Response Spectrum Analysis) need to be employed to calculate the response displacement of the bridges [65,66,67].
5.2. Example
- (1)
- Calculation of the average annual occurrence rate of strong earthquakes
- (2)
- Calculation of the annual occurrence rate of strong earthquakes
- (3)
- Query the horizontal displacement and vertical displacement using Figure 4
- (4)
- Calculate the total displacement and decompose the total displacement into the horizontal and vertical directions according to the rake angle.
5.3. Usage in Other Countries and Regions Around the World
6. Conclusions
Author Contributions
Funding
Data Availability Statement
Acknowledgments
Conflicts of Interest
References
- Gazetas, G.; Garini, E.; Anastasopoulos, I.; Georgarakos, T. Effects of Near-Fault Ground Shaking on Sliding Systems. J. Geotech. Geoenviron. Eng. 2009, 135, 1906–1921. [Google Scholar] [CrossRef]
- Kenawy, M.; McCallen, D.; Pitarka, A. Characteristics and selection of near-fault simulated earthquake ground motions for nonlinear analysis of buildings. Earthq. Spectra 2023, 39, 2281–2322. [Google Scholar] [CrossRef]
- Nakamura, T.; Sawada, M. Evaluation of Near-Source Ground Displacements During the 2008 Iwate-Miyagi Nairiku Earthquake Simulated Using Stochastic Slip Distributions and the Reciprocity Theorem. Pure Appl. Geophys. 2023, 180, 1989–2006. [Google Scholar] [CrossRef]
- Scholz, C.H. The Mechanics of Earthquakes and Faulting; Cambridge University Press: New York, NY, USA, 2002. [Google Scholar]
- Cui, P.; Chen, X.Q.; Zhu, Y.Y.; Zhu, Y.Y.; Su, F.H.; Wei, F.Q.; Han, Y.S.; Liu, H.J.; Zhuang, J.Q. The Wenchuan Earthquake (May 12, 2008), Sichuan Province, China, and resulting geohazards. Nat. Hazards 2011, 56, 19–36. [Google Scholar] [CrossRef]
- Boncio, P.; Galli, P.; Naso, G.; Pizzi, A. Zoning surface rupture hazard along normal faults: Insight from the 2009 MW 6.3 L’ Aquila, Central Italy, earthquake and other global earthquakes. Bull. Seismol. Soc. Am. 2012, 102, 918–935. [Google Scholar] [CrossRef]
- Zhou, Z.; Xia, C.; Li, Z.; Qi, C. Co-seismic surface displacement field caused by the Menyuan Qinghai Ms6.9 earthquake in 2022. China Earthq. Eng. J. 2022, 44, 727–734. [Google Scholar] [CrossRef]
- Wang, L.; Xie, H.; Yuan, D.; Li, Z.; Xue, S.; Su, R.; Wen, Y.; Su, Q. The surface rupture characteristics based on the GF-7 images interpretation and the field investigation of the 2022 Menyuan Ms6.9 earthquake. Seismol. Geol. 2023, 45, 401–421. [Google Scholar] [CrossRef]
- Yin, X.; Zhan, B.; Yao, S.; Yu, N.; Xu, W. The earthquake sequence, surface rupture characteristics and engineering effects of the MS6.9 Qinghai Menyuan earthquake on January 8, 2022. Prog. Earthq. Sci. 2024, 54, 57–64. [Google Scholar] [CrossRef]
- Youngs, R.R.; Arabasz, W.J.; Anderson, R.E.; Ramelli, A.R.; Ake, J.P.; Slemmons, D.B.; McCalpin, J.P.; Doser, D.I.; Fridrich, C.J.; Swan, F.H.; et al. A Methodology for Probabilistic Fault Displacement Hazard Analysis (PFDHA). Earthq. Spectra 2003, 19, 191–219. [Google Scholar] [CrossRef]
- Inoue, N.; Kitada, N.; Shibuya, N.; Omata, M.; Takahama, T.; Tonagi, N.; Irikua, K. Probabilistic Evaluation of Off-Fault Displacements of the 2016 Kumamoto Earthquake. Pure Appl. Geophys. 2019, 177, 2007–2019. [Google Scholar] [CrossRef]
- Testa, A.; Valentini, A.; Boncio, P.; Pace, B.; Visini, F.; Mirabella, F.; Pauselli, C. Probabilistic fault displacement hazard analysis of the Anghiari—Città di Castello normal fault (Italy). Ital. J. Geosci. 2021, 140, 327–346. [Google Scholar] [CrossRef]
- Gao, J.; Chan, C.; Ma, K.; Lee, C. Probabilistic Fault Displacement Hazards along the Milun Fault. Bull. Seismol. Soc. Am. 2022, 112, 2745–2757. [Google Scholar] [CrossRef]
- Zhou, Q.; Zhuang, R. Method of co-seismic fault displacement estimate based on peak ground acceleration. Vibroeng. Procedia 2023, 53, 7–12. [Google Scholar] [CrossRef]
- Jibson, R.W. Regression models for estimating coseismic landslide displacement. Eng. Geol. 2007, 91, 209–218. [Google Scholar] [CrossRef]
- Xu, X.; Guo, T.; Liu, S.; Yu, G.; Chen, G.; Wu, X. Discussion on issues associated with setback distance from active fault. Seismol. Geol. 2016, 38, 477–502. [Google Scholar] [CrossRef]
- Zhang, Y.; Ren, S.; Guo, C.; Yao, X.; Zhou, N. Research on engineering geology related with active fault zone. Acta Geol. Sin. 2019, 93, 763–775. [Google Scholar] [CrossRef]
- Guo, E.; Shao, G.; Bo, J.; Shi, Z. A method for earthquake rupture analysis of overlying soil site. Earthq. Eng. Eng. Vib. 2002, 22, 122–126. [Google Scholar] [CrossRef]
- Liu, C.; Li, C.; Chan, P.; Hung, C.; Lin, M. 3D sandbox and numerical modeling of coseismic surface rupture induced by oblique-slip faulting and its interaction with embedded shallow foundation. Eng. Geol. 2021, 282, 105990. [Google Scholar] [CrossRef]
- Huang, J.; Bo, J.; Shen, C.; Zhang, J. Progress in research on engineering evaluation of surface ruptures in strong earthquakes. J. Nat. Disasters 2016, 25, 94–104. [Google Scholar] [CrossRef]
- Bo, J.; Huang, J.; Zhang, J.; Wang, F. A prediction method of surface rupture in strong earthquakes based on logistic regression analysis. Earthq. Eng. Eng. Dyn. 2019, 39, 1–7. [Google Scholar] [CrossRef]
- Bo, J.; Li, Q.; Qi, W.; Wang, Y.; Zhan, X.; Zhang, Y. Research Progress and Discussion of Site Condition Effect on Ground Motion and Earthquake Damage. J. Jilin Univ. 2021, 51, 1295–1305. [Google Scholar] [CrossRef]
- McCalpin, J.P. Paleoseismology, 2nd ed.; Academic Press: Cambridge, MA, USA, 2009. [Google Scholar]
- Deng, Q.; Chen, L.; Ran, Y. Quantitative studies and applications of active tectonics. Earth Sci. Front. 2004, 11, 383–392. [Google Scholar] [CrossRef]
- Deng, Q.; Wen, X. A review on the research of active tectonics: History, progress and suggestion. Seismol. Geol. 2008, 30, 1–30. [Google Scholar] [CrossRef]
- Zhang, P.Z.; Deng, Q.D.; Zhang, Z.Q.; Li, H.B. Active faults, earthquake hazards and associated geodynamic processes in continental China. Sci. Sin. Terrae 2013, 43, 1607–1620. [Google Scholar]
- Zhou, Q.; Li, X.; Chang, Y.; Yu, J.; Luo, W.; Bai, X. Strong earthquake recurrence interval in the southern segment of the Red River Fault, southwestern China. Front. Earth Sci. 2023, 11, 1280787. [Google Scholar] [CrossRef]
- Mark; Matthews, V.; Ellsworth, W.L.; Reasenberg, P.A. A Brownian Model for Recurrent Earthquakes. Bull. Seismol. Soc. Am. 2002, 92, 2233–2250. [Google Scholar] [CrossRef]
- Shao, Z.; Wu, Y.; Ji, L.; Diao, F.; Shi, F.; Li, Y.; Long, F.; Zhang, H.; Wang, W.; Wei, W.; et al. Assessment of strong earthquake risk in the Chinese mainland from 2021 to 2030. Earthq. Res. Adv. 2022, 3, 100177. [Google Scholar] [CrossRef]
- Zhang, Y.H.; Pan, H.; Cheng, J.; Zhang, M. Research on Paleoearthquake and Recurrence Characteristics of Strong Earthquakes in Active Faults of Mainland China. Appl. Geophys. 2024, 21, 1–26. [Google Scholar] [CrossRef]
- Goel, S.M.J.R.; Malasi, S.K.; Moharir, P.S.; Wason, H.R.; Khattri, K.N.; Gaur, V.K. Estimation of the waiting time distributions of earthquakes. Proc. Indian Acad. Sci. 1983, 92, 223–237. [Google Scholar] [CrossRef]
- Greenhough, J.; Main, I.G. A Poisson model for earthquake frequency uncertainties in seismic hazard analysis. Geophys. Res. Lett. 2008, 35, L19313. [Google Scholar] [CrossRef]
- Cornell, C.A. Engineering seismic risk analysis. Bull. Seismol. Soc. Am. 1968, 58, 1583–1606. [Google Scholar] [CrossRef]
- Gutenberg, B.; Richter, C.F. Frequency of earthquakes in California. Bull. Seismol. Soc. Am. 1944, 34, 185–188. [Google Scholar] [CrossRef]
- Aki, K. Magnitude-frequency relation for small earthquakes: A clue to the origin of ƒmax of large earthquakes. J. Geophys. Res. Solid Earth 1987, 92, 1349–1355. [Google Scholar] [CrossRef]
- Huang, J. Research on the Method for Evaluating the Earthquake Surface Rupture; Institute of Engineering Mechanics, China Earthquake Administration: Harbin, China, 2016.
- Wu, Z.; Hu, M. Definitions, Classification Schemes for Active Faults, and Their Application. Geosciences 2024, 14, 68. [Google Scholar] [CrossRef]
- Aki, K. Maximum likelihood estimate of b in the formula logN = a − bM and its confidence limits. Bull. Earthq. Res. Inst 1965, 43, 237–239. [Google Scholar] [CrossRef]
- Bender, B. Maximum likelihood estimation of b-values for magnitude grouped data. Bull. Seismol. Soc. Am. 1983, 73, 831–851. [Google Scholar] [CrossRef]
- Zúñiga, F.R.; Wyss, M. Inadvertent changes in magnitude reported in earthquake catalogs: Their evaluation through b-value estimates. Bull. Seismol. Soc. Am. 1995, 85, 1858–1866. [Google Scholar] [CrossRef]
- Zúñiga, F.R.; Figueroa-Soto, A. Converting Magnitudes Based on the Temporal Stability of a- and b-Values in the Gutenberg–Richter Law. Bull. Seismol. Soc. Am. 2012, 102, 2116–2127. [Google Scholar] [CrossRef]
- Godano, C.; Petrillo, G. Estimating the Completeness Magnitude mc and the b-Values in a Snap. Earth Space Sci. 2023, 10, e2022EA002540. [Google Scholar] [CrossRef]
- Chung, J.W.; Rogers, J.D. Influence of Assumed Groundwater Depth on Mapping Liquefaction Potential. Environ. Eng. Geosci. 2013, 19, 377–389. [Google Scholar] [CrossRef]
- Forcellini, D. The Role of the Water Level in the Assessment of Seismic Vulnerability for the 23 November 1980 Irpinia–Basilicata Earthquake. Geosciences 2020, 10, 229. [Google Scholar] [CrossRef]
- Wells, D.; Coppersmith, K.J. New empirical relationships among magnitude, rupture length, rupture width, rupture area, and surface displacement. Bull. Seismol. Soc. Am. 1994, 84, 974–1002. [Google Scholar] [CrossRef]
- Leonard, M. Earthquake Fault Scaling: Self-Consistent Relating of Rupture Length, Width, Average Displacement, and Moment Release. Bull. Seismol. Soc. Am. 2010, 100, 1971–1988. [Google Scholar] [CrossRef]
- Malakar, S.; Rai, A.K.; Kannaujiya, V.K.; Gupta, A.K. Revised Empirical Relations Between Earthquake Source and Rupture Parameters by Regression and Machine Learning Algorithms. Pure Appl. Geophys. 2023, 180, 3477–3494. [Google Scholar] [CrossRef]
- Xu, X.; Sun, X.; Tan, X.; Li, K.; Yu, G.; Etchebes, M.; Klinger, Y.; Tapponnier, P.; Woerd, J. Fuyun fault: Long-term faulting behavior under low crustal strain rate. Seismol. Geol. 2012, 34, 606–617. [Google Scholar] [CrossRef]
- Yu, H. Rupture Dynamics and Strong Ground Motion Simulation of Destructive Earthquakes in the Sichuan-Yunnan Region; University of Science and Technology of China: Hefei, China, 2020. [Google Scholar]
- Tang, R.; Wen, D.; Deng, T.; Huang, S. A preliminary study on the characteristics of the ground fractures during the Lu-huo M=7.9 earthquake, 1973 and the origin of the earthquake. Acta Geophys. Sin. 1976, 19, 18–27. [Google Scholar]
- Li, H.; Deng, Z.H.; Chen, L.W.; Zhou, Q.; Ran, H.L.; Xing, C.Q. Simulation study on the influencing factors of surface rupture zone distribution of strike-slip fault:take Luhuo Ms7.6 earthquake in 1973 for example. Chinese. J. Geophys. 2019, 62, 2871–2884. [Google Scholar] [CrossRef]
- Yu, W.; Cai, T.; Hou, X. Deformation zone of M=7.6 Lanchang earthquake. Seismol. Geol. 1991, 13, 343–352. [Google Scholar]
- Chen, J.; Chen, Y.; Ding, G.; Tian, Q.; Wang, Z.; Shan, X.; Ren, J.; Zhao, R.; Wang, Z. Surface rupture zones of the 2001 earthquake Ms 8.1 west of kunlun pass, northern Qinghai-Xizang plateau. Quat. Sci. 2003, 23, 629–639. [Google Scholar] [CrossRef]
- Li, Y.; Huang, R.Q.; Densmore, A.L.; Zhou, R.; Cao, S. Basic features and research progresses of Wenchuan Ms 8.0 earthquake. J. Sichuan Univ. 2009, 41, 7–25. [Google Scholar]
- Wang, G. Probabilistic Hazard Assessment of Permanent Fault Displacement and Mitigation Countermeasures for Line Engineering; Southwest Jiaotong University: Chengdu, China, 2016. [Google Scholar]
- Zeng, C. Probabilistic Fault Displacement Hazard Analysis Based on Dislocation Theory in a Half-Space; Southwest Jiaotong University: Chengdu, China, 2018. [Google Scholar]
- Cai, X. Characteristics of Fault Activity and Assessment on the Tectonic Stability of Milin, Tibet; Chengdu University of Technology: Chengdu, China, 2014. [Google Scholar]
- Xie, C. A Study on Tectonic Geomorphology of Namche Barwa and Activity of the Faults; Institute of Geology, China Earthquake Administration: Beijing, China, 2018.
- Jiang, S.; Li, P.; Lin, Z. Design Strategies of Breaking Resistance of Tunnels Crossing Active Faults Zone. J. Chongqing Jiaotong Univ. 2008, 27, 1034–1041. [Google Scholar]
- Cao, J.; Cui, Z.; Zhang, X.; Zhang, J. Method and model experiment of resisting dislocation of tunnel based on the brittle buffer concept. J. Tsinghua Univ. 2024, 64, 1116–1125. [Google Scholar] [CrossRef]
- Liu, X.; Lin, L.; Wang, X.; Li, X. Deformation Characteristics of Tunnel with Flexible JointsAffected by Normal Fault Stick-slip Dislocation. Chin. J. Rock Mech. Eng. 2013, 32, 3545–3551. [Google Scholar]
- Liu, X.; Guo, B.; Li, X.; Sang, Y. Model Experiment Study on Effect of Deformation Joints on Road Tunnel Resisting Destruction by Thrust Fault Stick-Slip Dislocation. Chin. J. Rock Mech. Eng. 2015, 34, 3837–3843. [Google Scholar] [CrossRef]
- Yan, G.; Shen, Y.; Gao, B.; Zheng, Q.; Fan, K.; Huang, H. Damage evolution of tunnel lining with steel reinforced rubber joints under normal faulting: An experimental and numerical investigation. Tunn. Undergr. Space Technol. 2020, 97, 103223. [Google Scholar] [CrossRef]
- Zhang, Y.; Zhang, Z.; Yin, C.; Wei, R.; Zhang, H. Experimental study on forced response characteristics and anti-dislocation performance of articulated tunnel structure under dislocation action of normal fault. Structures 2023, 48, 867–881. [Google Scholar] [CrossRef]
- Goel, R.K.; Chopra, A.K. Linear Analysis of Ordinary Bridges Crossing Fault-Rupture Zones. J. Bridge Eng. 2009, 14, 203–215. [Google Scholar] [CrossRef]
- Goel, R.K.; Chopra, A.K. Nonlinear Analysis of Ordinary Bridges Crossing Fault-Rupture Zones. J. Bridge Eng. 2009, 14, 216–224. [Google Scholar] [CrossRef]
- Yang, S.; Mavroeidis, G.P. Validation of the fault rupture-response spectrum analysis method for ordinary and seismically isolated bridges crossing strike-slip fault rupture zones. Eng. Struct. 2022, 273, 115026. [Google Scholar] [CrossRef]


| Activity Level | Deformation Rate (R) (mm/a) | In Situ Recurrence Interval (T) (ka) | Overall Characteristics | ||
|---|---|---|---|---|---|
| Strike-Slip Fault | Normal Fault | Reverse Fault | |||
| AA | R > 15 | R > 2 | R > 10 | T ≤ 0.5 | The faults constitute boundaries of plates or large active blocks/fault blocks and feature large size, good regional continuity, high slip rate, and strong earthquake frequency. |
| A | 5 ≤ R < 15 | 0.5 ≤ R < 2 | 2 ≤ R < 10 | 0.5 < T ≤ 2.5 | The faults often constitute boundaries of large intraplate active blocks/fault blocks and feature large size, good regional continuity, relatively high slip rate, and strong earthquake frequency. |
| B | 0.5 ≤ R < 5 | 0.1 ≤ R < 0.5 | 0.2 ≤ R < 2 | 2.5 < T ≤ 10 | The faults are often intraplate faults, of which some constitute boundaries of moderate to large active blocks/fault blocks, and feature moderate or relatively large size, relatively good regional continuity, moderate slip rate, and strong earthquake frequency. |
| C | R < 0.5 | R < 0.1 | R < 0.2 | 10 < T | The faults often lie inside active blocks/fault blocks and feature relatively small size, poor regional continuity, low slip rate, and the ability to induce destructive earthquakes. However, strong earthquake frequency is low. |
| Strong Earthquake Recurrence Period (a) | Horizontal Dislocation (m) | Vertical Dislocation (m) | ||||||
|---|---|---|---|---|---|---|---|---|
| 100a 1% | 100a 2% | 100a 5% | 100a 10% | 100a 1% | 100a 2% | 100a 5% | 100a 10% | |
| 10,000 | 2.40–3.39 | 0~2.40 | / | / | 1.41–2.00 | 0–1.41 | / | / |
| 5000 | 3.39–4.68 | 2.40–3.39 | / | / | 2.00–2.75 | 1.41–2.00 | / | / |
| 2000 | 5.13–6.76 | 3.76–5.13 | 2.40–3.39 | 0–2.40 | 2.99–3.80 | 2.24–2.99 | 1.41–2.00 | 0–1.41 |
| 1000 | 6.76–7.76 | 5.13–6.76 | 3.39–4.62 | 2.40–3.39 | 3.80–4.57 | 2.99–3.80 | 2.00–2.75 | 1.41–2.00 |
| Source | Exceedance Probability (over 100 a) | ||
|---|---|---|---|
| 4% | 2% | 1% | |
| Wang, 2016 * [55] | 1.39 | 2.39 | 3.13 |
| Zeng, 2018 * [56] | 1.29 | 2.15 | 2.93 |
| PFDHA-td (tet = 0.5) | 1.65 | 2.17 | 2.69 |
| PFDHA-td (tet = 1) | 2.16 | 2.69 | 3.15 |
| Deterministic methods | 3.61 | ||
Disclaimer/Publisher’s Note: The statements, opinions and data contained in all publications are solely those of the individual author(s) and contributor(s) and not of MDPI and/or the editor(s). MDPI and/or the editor(s) disclaim responsibility for any injury to people or property resulting from any ideas, methods, instructions or products referred to in the content. |
© 2024 by the authors. Licensee MDPI, Basel, Switzerland. This article is an open access article distributed under the terms and conditions of the Creative Commons Attribution (CC BY) license (https://creativecommons.org/licenses/by/4.0/).
Share and Cite
Zhou, Q.; Yuan, X. The Time-Dependent Method for Probabilistic Fault Displacement Hazard Analysis (PFDHA-td). Buildings 2024, 14, 3867. https://doi.org/10.3390/buildings14123867
Zhou Q, Yuan X. The Time-Dependent Method for Probabilistic Fault Displacement Hazard Analysis (PFDHA-td). Buildings. 2024; 14(12):3867. https://doi.org/10.3390/buildings14123867
Chicago/Turabian StyleZhou, Qingyun, and Xiaoxiang Yuan. 2024. "The Time-Dependent Method for Probabilistic Fault Displacement Hazard Analysis (PFDHA-td)" Buildings 14, no. 12: 3867. https://doi.org/10.3390/buildings14123867
APA StyleZhou, Q., & Yuan, X. (2024). The Time-Dependent Method for Probabilistic Fault Displacement Hazard Analysis (PFDHA-td). Buildings, 14(12), 3867. https://doi.org/10.3390/buildings14123867