Article

Systematic Rehabilitation Techniques and Dynamic Analysis of Bridge Deck System with Concrete-Filled Steel Tube Arches

School of Civil Engineering, Architecture and Environment, Hubei University of Technology, Wuhan 430068, China
*
Author to whom correspondence should be addressed.
Buildings 2024, 14(12), 3891; https://doi.org/10.3390/buildings14123891
Submission received: 15 November 2024 / Revised: 29 November 2024 / Accepted: 2 December 2024 / Published: 5 December 2024
(This article belongs to the Special Issue Inspection, Maintenance and Retrofitting of Existing Buildings)

Abstract

:
Due to prolonged heavy traffic, the Wuhan Changfeng Bridge has experienced extensive cracking in its main girder structure. Of the bridge’s 60 crossbeams, 51 (85%) have developed cracks, while the deck pavement over the steel beams has accumulated a total of 648.8 m of transverse cracks. Additionally, two T-beams exhibit structural vertical cracks of 0.3 mm at the mid-span, exceeding the maximum allowable width of 0.2 mm. This recurrent pavement damage not only compromises driving safety and comfort but also increases maintenance costs. To address these issues, this paper proposes a systematic upgrade plan for the bridge deck system. The plan involves welding additional high transverse beams onto the existing steel transverse beams, removing the original deck slab and replacing it entirely with an orthotropic steel deck. Additionally, two new steel longitudinal beams will be installed. The original simply supported concrete longitudinal beams in the deck will be transformed into an integrally connected continuous steel structure deck system. Using Midas/Civil finite element software, 3D models of Changfeng Bridge, pre and post renovation, were created to analyze the overall dynamic characteristics under five loading scenarios. The ambient vibration test and vehicle field test were conducted to measure the bridge’s natural frequency and impact factor, verifying the dynamic performance and driving comfort of the bridge after the upgrade. The results indicate that the retrofitted bridge experienced a 19.9% increase in overall stiffness. The dynamic performance of the bridge structure was significantly enhanced, and the most notable improvement was observed in dynamic stress, which decreased by 19.4% to 76.9%. Additionally, the steel deck reduced the bridge’s dead load, and the driving comfort on the bridge deck improved.

1. Introduction

Concrete-filled steel tube tied-arch bridges have gained widespread application in global highway construction due to their esthetic appeal and economic advantages. In the maintenance of these bridges, the upkeep of the bridge deck system is a critical aspect. Damage to the bridge deck can arise from construction defects, material degradation, traffic overloading, and improper design, all of which pose significant safety risks. The bridge deck directly bears the vehicle load and undergoes lateral bending deformation under this load. The substantial lateral tensile stress caused by traffic overloading, coupled with the weak connection between transverse and longitudinal beams, often leads to longitudinal cracking in the middle of the deck. As the bridge deck is an integral component of the concrete main beam cross-section, it contributes to the overall load-bearing capacity of the bridge [1]. Damage to the bridge deck structure reduces the bridge’s integrity and impairs its load-carrying performance. Therefore, the timely repair and rehabilitation of the bridge deck structure are crucial for ensuring the normal operation of the bridge.
Recently, in the field of concrete bridge deck repair and renovation, Ningyi Su et al. [2] conducted a comprehensive review of effective repair materials for concrete bridge decks. They highlighted that there are various repair products available on the market, with significant differences in their mechanical properties and durability. Choosing the appropriate repair materials can not only slow down the deterioration process but also reduce maintenance costs. However, the performance of repair materials alone does not fully represent the performance of the composite system of repair materials and substrate concrete. L. Orta [3] provided a parametric and sensitivity analysis of cracking in concrete overlays cast on composite steel substrates of varying thicknesses under restrained shrinkage strain. The study quantified the importance of factors such as substrate materials, overlay materials, construction practices, shrinkage parameters, creep parameters, environmental humidity, and modeling variables. A range index was used to identify the key variables in the sensitivity analysis. Matthew A. Haynes et al. [4] developed a waterproof asphalt mixture with high crack resistance and rutting resistance. This mixture can prevent the infiltration of water and deicing salts into concrete bridge decks, thereby sealing and protecting them. Guoji Xu et al. [5] studied the hydrodynamic characteristics of T-shaped bridge decks and box-type bridge decks under different abnormal wave parameters. They recommended that, in bridge design, the offshore load-bearing capacity of box-type bridge decks and the onshore load-bearing capacity of T-shaped bridge decks should be reinforced to account for the impact of abnormal waves. Amir Hajibabaee [6] quantitatively compared the effects of different curing methods on the drying rate, subsequent limewater permeability, and chloride permeability of concrete. The study confirmed that wet curing methods are more effective in reducing the intrusion of external chemicals and emphasized the importance of wet curing for the long-term durability of concrete. Junichiro Niwa et al. [7] conducted an experimental study on the interface shear transfer between concrete of different ages (new and old bridge decks). The study involved double shear tests with parameters including the initial prestress level, rebar connection method, reinforcement ratio, and surface roughness. The results showed that the initial prestress level, reinforcement ratio, and interface surface roughness significantly influence the interface failure behavior.
In the context of repairing and renovating steel structure bridge decks, Young-Soo Jeong’s study [8] analyzed and evaluated the structural response of corroded orthotropic steel bridge decks to determine the impact of corrosion damage on the structural behavior of the bridge deck. Benjin Wang [9] conducted a multi-scale study on the fatigue testing of ribbed welded joints in orthotropic steel bridge decks. The study found that intergranular fracture in the heat-affected zone of the welds is the primary cause of crack initiation. To address the issue of pothole repairs on steel bridge decks, Leilei Chen [10] developed a cold mix repair material based on a fast-curing thermosetting adhesive. This material has the capability to reopen traffic within three hours and demonstrates good mechanical and structural performance when used for repairing potholes on steel bridge decks. Modified overlays are commonly used for reinforcing orthotropic steel bridge decks. To compare the mechanical performance and stability of different reinforcement schemes for a simply supported steel box girder bridge, Shilei Wang [11] employed a sandwich plate system and reactive powder concrete reinforcement scheme. The research results indicated that the stress performance and deformation of the longitudinal ribs and longitudinal deck were significantly improved. Stephen J. Kennedy [12] found in his study that compared to concrete bridge decks, prefabricated sandwich panel systems can reduce static load by up to 70%, enabling bridges to bear greater live loads without the need for reinforcing beams or piers. Deck replacement can be performed while retaining the steel or concrete beams in place, and when installation speed is critical, prefabricated longitudinal bridge deck units can be utilized(The relevant contributions in rehabilitation of bridge decks as shown in Table 1).
Traditional bridge deck repair methods, such as patching, steel plate bonding, and adding composite materials, aim to enhance or prolong the lifespan of existing materials locally. However, these methods do not fundamentally address structural deterioration in the deck system, often failing to prevent recurring fatigue cracks and corrosion. This study advances a complete transformation to an integrated, continuous steel deck structure, structurally enhancing fatigue resistance and durability. This approach circumvents repeat repairs post restoration, filling a critical research gap in fundamental bridge deck renovation. Moreover, in existing research, most studies focus on the static performance of bridges under dead loads, while there is limited research on the performance and repair effects of bridges under dynamic loads. This paper, from the perspective of dynamic loads, primarily investigates the dynamic performance of the retrofitted bridge under dynamic loading conditions.
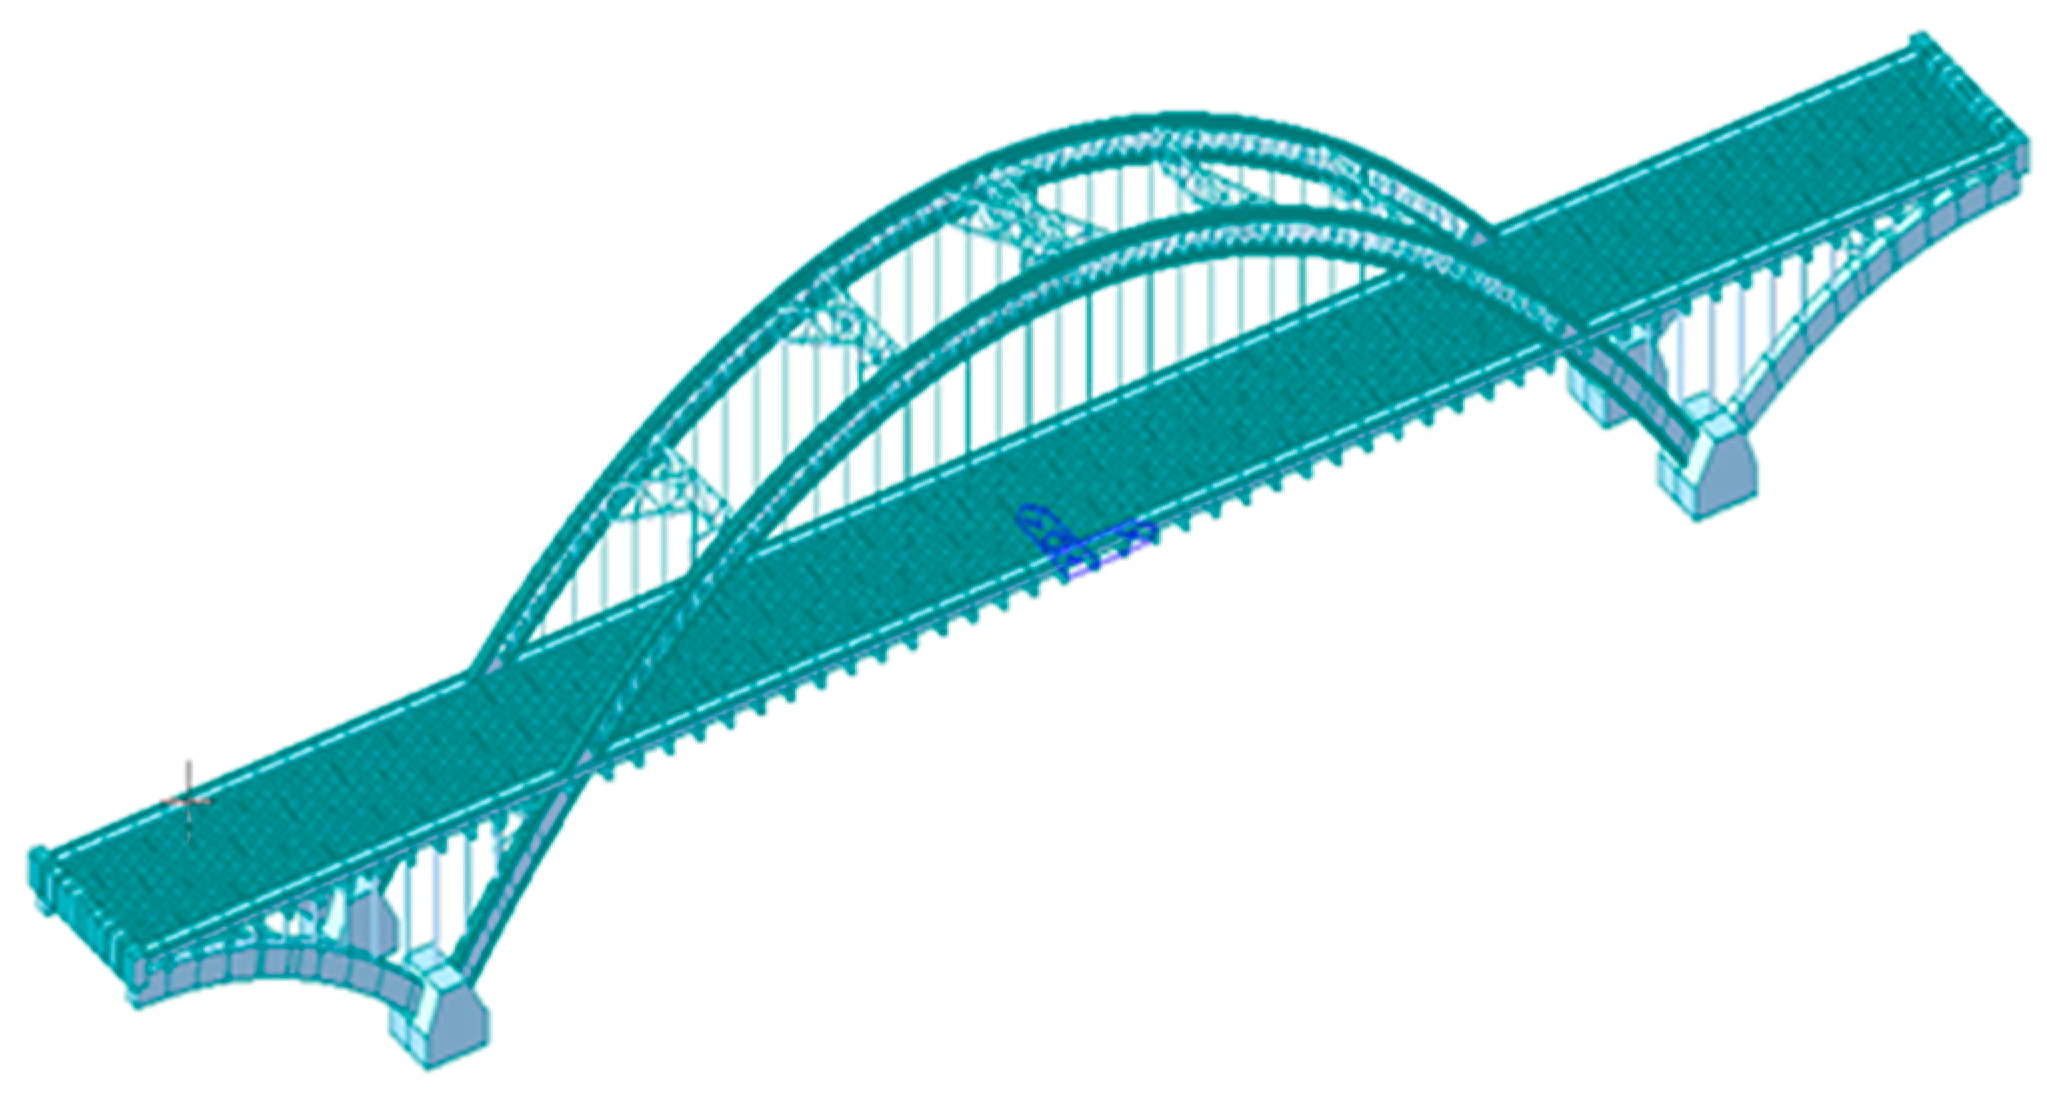
In this paper, we first introduce the bridge and bridge deck system renovation scheme. Subsequently, a detailed three-dimensional finite element model is established using the finite element software Midas/Civil. The simplified simulation method for the triangular load in the moving load test is thoroughly described. A comparative analysis of the natural frequencies of the bridge before and after the renovation is conducted, and the dynamic response of the bridge structure under different vehicle speeds is simulated, along with an analysis of the stress in various components. Such a Midas/Civil finite element analysis and the dynamic performance evaluation of bridges are commonly applied in beam reinforcement and bridge stability analysis. Finally, a field dynamic load test on the main bridge is carried out to examine the dynamic response of key structural parts under actual vehicle load and to analyze the stress state of the bridge structure under dynamic loading (The schematic diagram as shown in Figure 1). The final results indicate that the retrofitted bridge experienced a 19.9% increase in overall stiffness. The dynamic performance of the bridge structure was significantly enhanced; the most notable improvement was observed in dynamic stress, which decreased by 19.4% to 76.9%. Additionally, the steel deck reduced the bridge’s dead load, and the driving comfort on the bridge deck improved.

2. Description of the Bridge

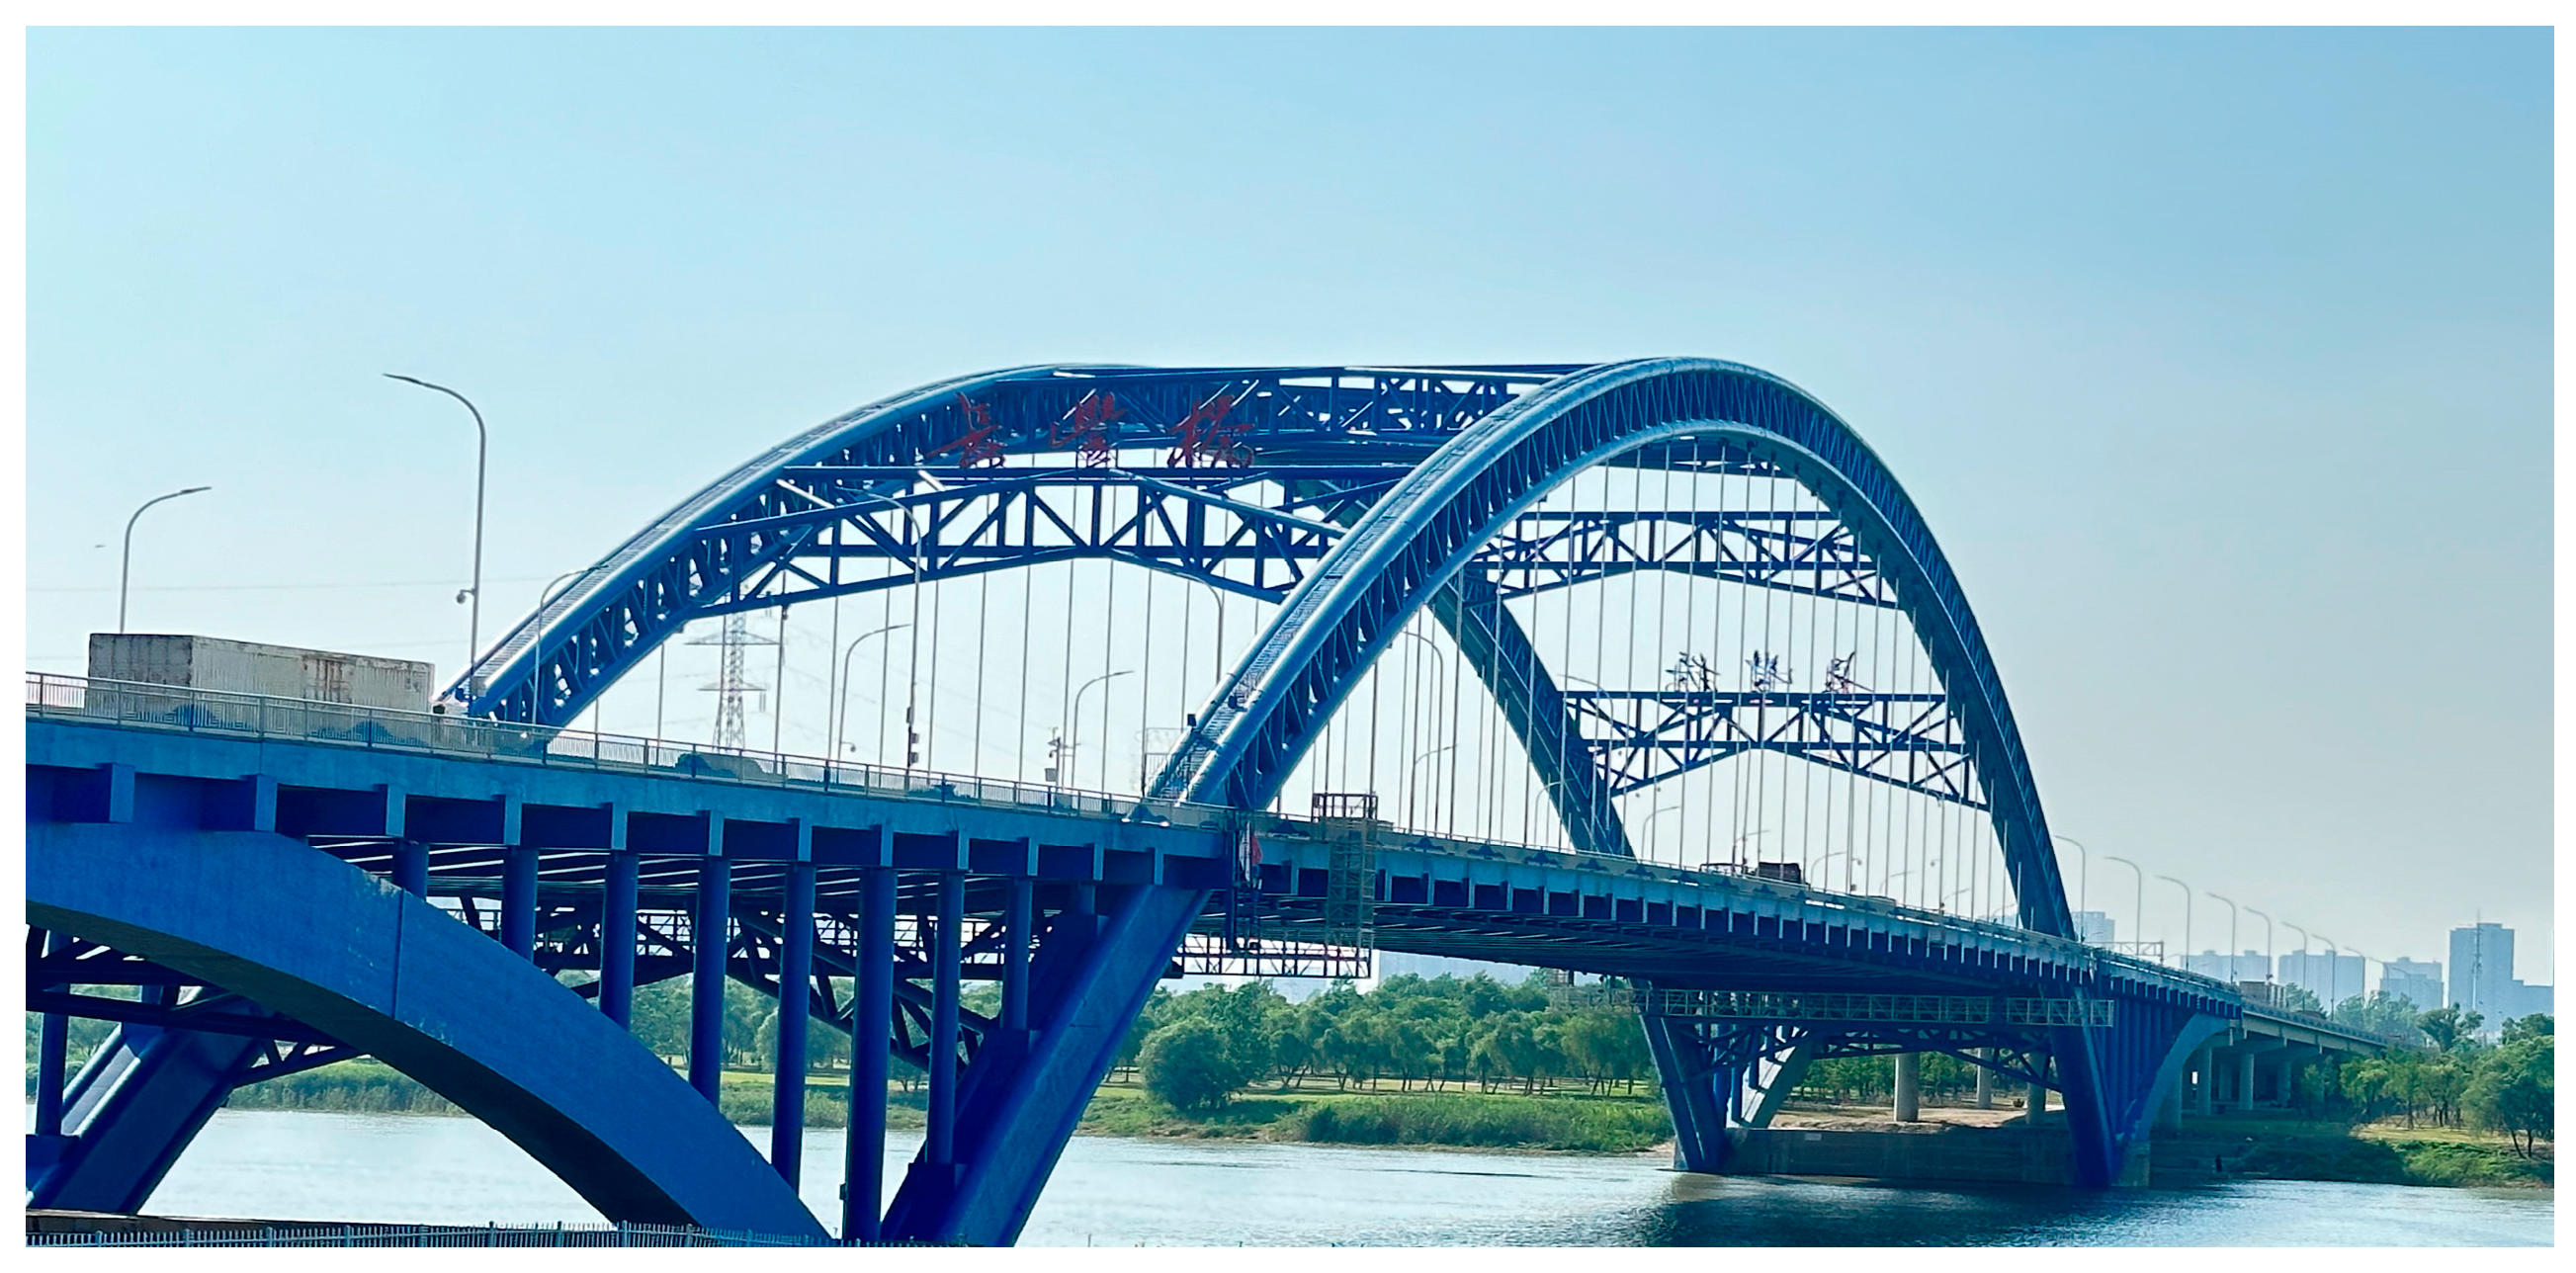
The Changfeng Bridge is located in Wuhan, the capital city of Hubei Province in China. The main bridge is composed of three spans of 60.5 m, 251 m and 60.5 m, with a total length of 372 m (as shown in Figure 2). The main bridge is a half-through concrete-filled steel tubular (CFST) tied-arch bridge, with both side spans utilizing half-span reinforced concrete arches, creating a unique design. The main span has a clear span of 240 m, with a rise-to-span ratio of 1/5. The arch axis follows a catenary shape, with an arch axis coefficient (m = 1.5). The main arch ring is constructed as a truss, composed of steel tubular chord members and web members. The upper and lower chord members each consist of two steel tubes with a diameter of 1 m and a wall thickness of 14 mm, filled with grade 50 concrete and arranged side by side. The web members are hollow steel tubes with a diameter of 500 mm and a wall thickness of 10 mm.
The main arch ring is composed of a truss structure made up of steel pipe concrete chords and steel pipe web members. The upper and lower chords each consist of two 1 m diameter steel pipes with a wall thickness of 14 mm, filled with 50# concrete and arranged side by side. The web members are hollow steel pipes with a diameter of 500 mm and a wall thickness of 10 mm. Since the arch rib at the arch foot section will be submerged in water by about 6–7 m during the flood season, considering the need for collision protection and the significant forces on the arch foot section, the arch ribs below the bridge deck are designed as solid steel pipe concrete structures. The main span bridge deck includes flexible suspenders, crossbeams, deck slabs, and prestressed tie rods to balance the thrust of the main arch. The prestressed tie rods are anchored at the ends of the half arches in the side spans. There are 32 pairs (64 in total) of suspenders spaced 6 m apart, using M5-151 parallel steel wire finished cables. The deck slabs consist of reinforced concrete beams, which are simply supported initially and then continuously supported by suspended crossbeams. The tie rods are in a freely slidable state, anchored at the ends of the side spans using clip-type group anchors, and transfer the tensile force through the side spans to the arch foot of the main span to balance the main span thrust (The description of the bridge as shown in Table 2).

3. Technical Plan for the Structural Renovation of the Main Bridge Deck System

To enhance the overall stiffness and risk resistance of the deck system of the Wuhan Changfeng Bridge, reduce the dynamic response of the bridge during vehicle passage, and improve driving comfort on the bridge deck, a comprehensive analysis of various inspection indicators was conducted. The final renovation plan involves welding additional high crossbeams onto the original steel crossbeams, removing the existing bridge deck slabs and replacing them entirely with orthotropic steel deck panels. Additionally, two steel longitudinal beams will be added. The original concrete longitudinal beams of the bridge deck, which were part of a structurally simply supported and continuous deck system (as shown in Figure 3), will be adjusted to form an integrally fixed continuous steel deck system (as shown in Figure 4).

3.1. Additional Steel Crossbeams

The main bridge deck system adopts an integrated continuous steel structure deck plan, utilizing the existing steel crossbeams by extending them upwards and welding them to the new beams, thus forming an integrated steel structure deck system. Two additional small crossbeams are added to the original steel crossbeam span of 6 m. The standard width of the main bridge deck system is 31.9 m, and the deck layout remains unchanged. The pedestrian walkway steel longitudinal beams on both sides will continue to be used, and the π-shaped concrete beams on the tie box will be replaced with continuous steel beams for maintenance pathways.

3.2. Removal and Replacement of Deck Slabs

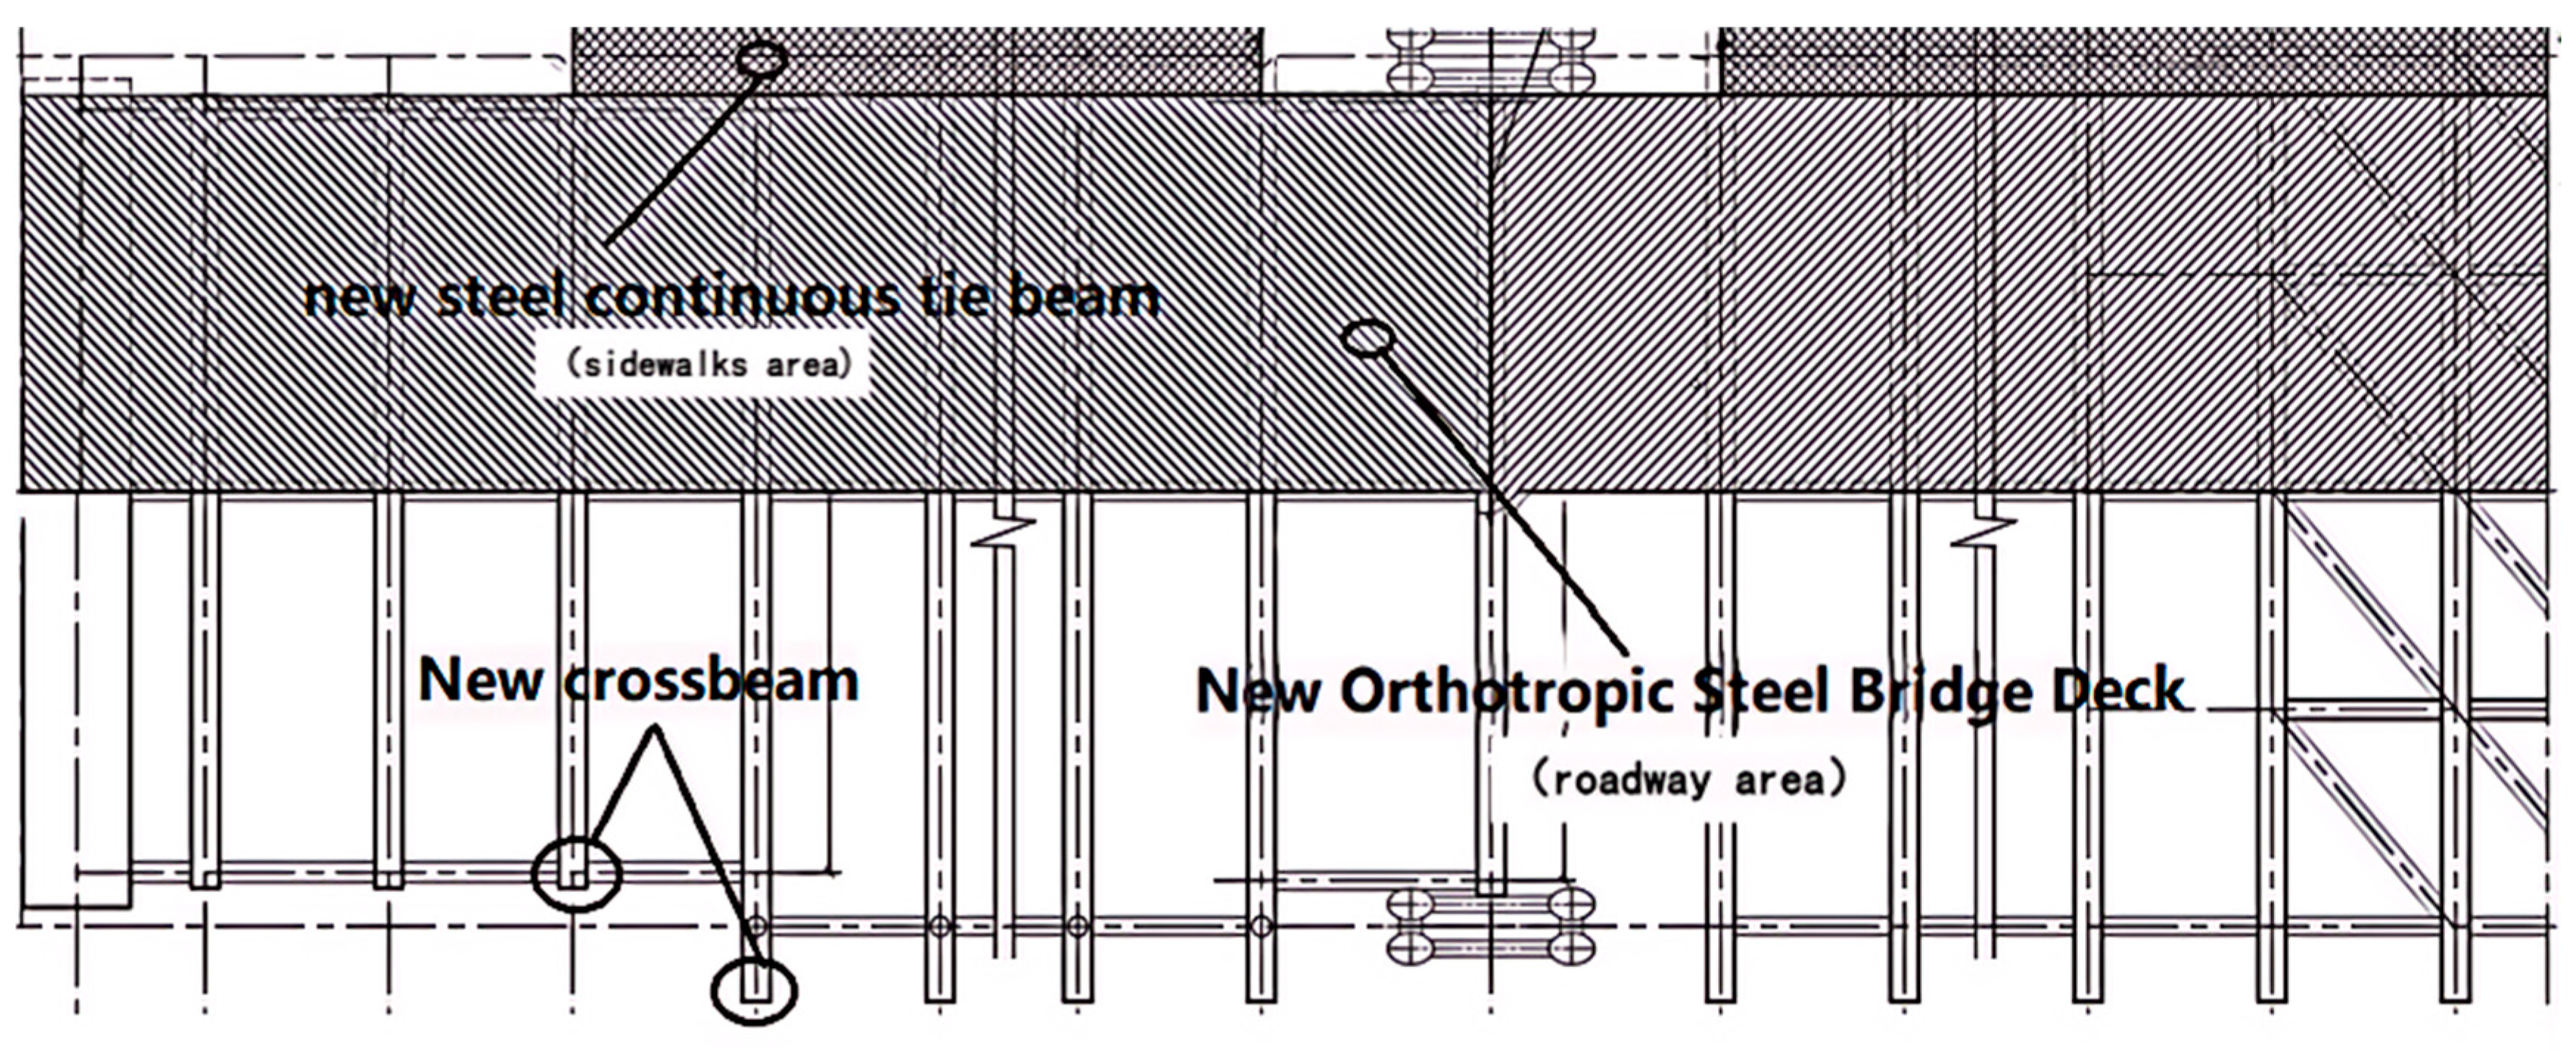
The new bridge deck within the roadway area adopts orthotropic steel deck panels. The carriageway spans a total width of 25 m across the bridge and is designed with an I-beam structure. The beam height is 650 mm, and the I-shaped steel beams are primarily composed of a top plate, web plate, and bottom plate welded together. The steel beams are made of Q345qD material. The top plate thickness at the mid-span of the steel deck is 16 mm, while at the crossbeam, it is 30 mm. The web plate thickness is 16 mm, with a lateral spacing of 1.7 m and 2.6 m, respectively. The bottom plate is 20 mm thick and 400 mm wide. The top plate of the bridge deck is reinforced with U-shaped stiffeners, with dimensions of 300 mm (width) × 300 mm (height) × 8 mm (thickness), and the standard transverse spacing of the stiffeners is 600 mm [13]. Along the longitudinal direction of the bridge deck, two small crossbeam structures are set between the existing steel crossbeams, with a longitudinal spacing of 1760 mm to 2120 mm. The small crossbeams are inverted T-shaped, composed of a web plate and a bottom plate. The web plate height is 650 mm and it is 12 mm thick, while the bottom plate is 400 mm wide and 20 mm thick(The schematic diagram of new bridge deck as shown in Figure 5).

3.3. Additional Steel Longitudinal Beams

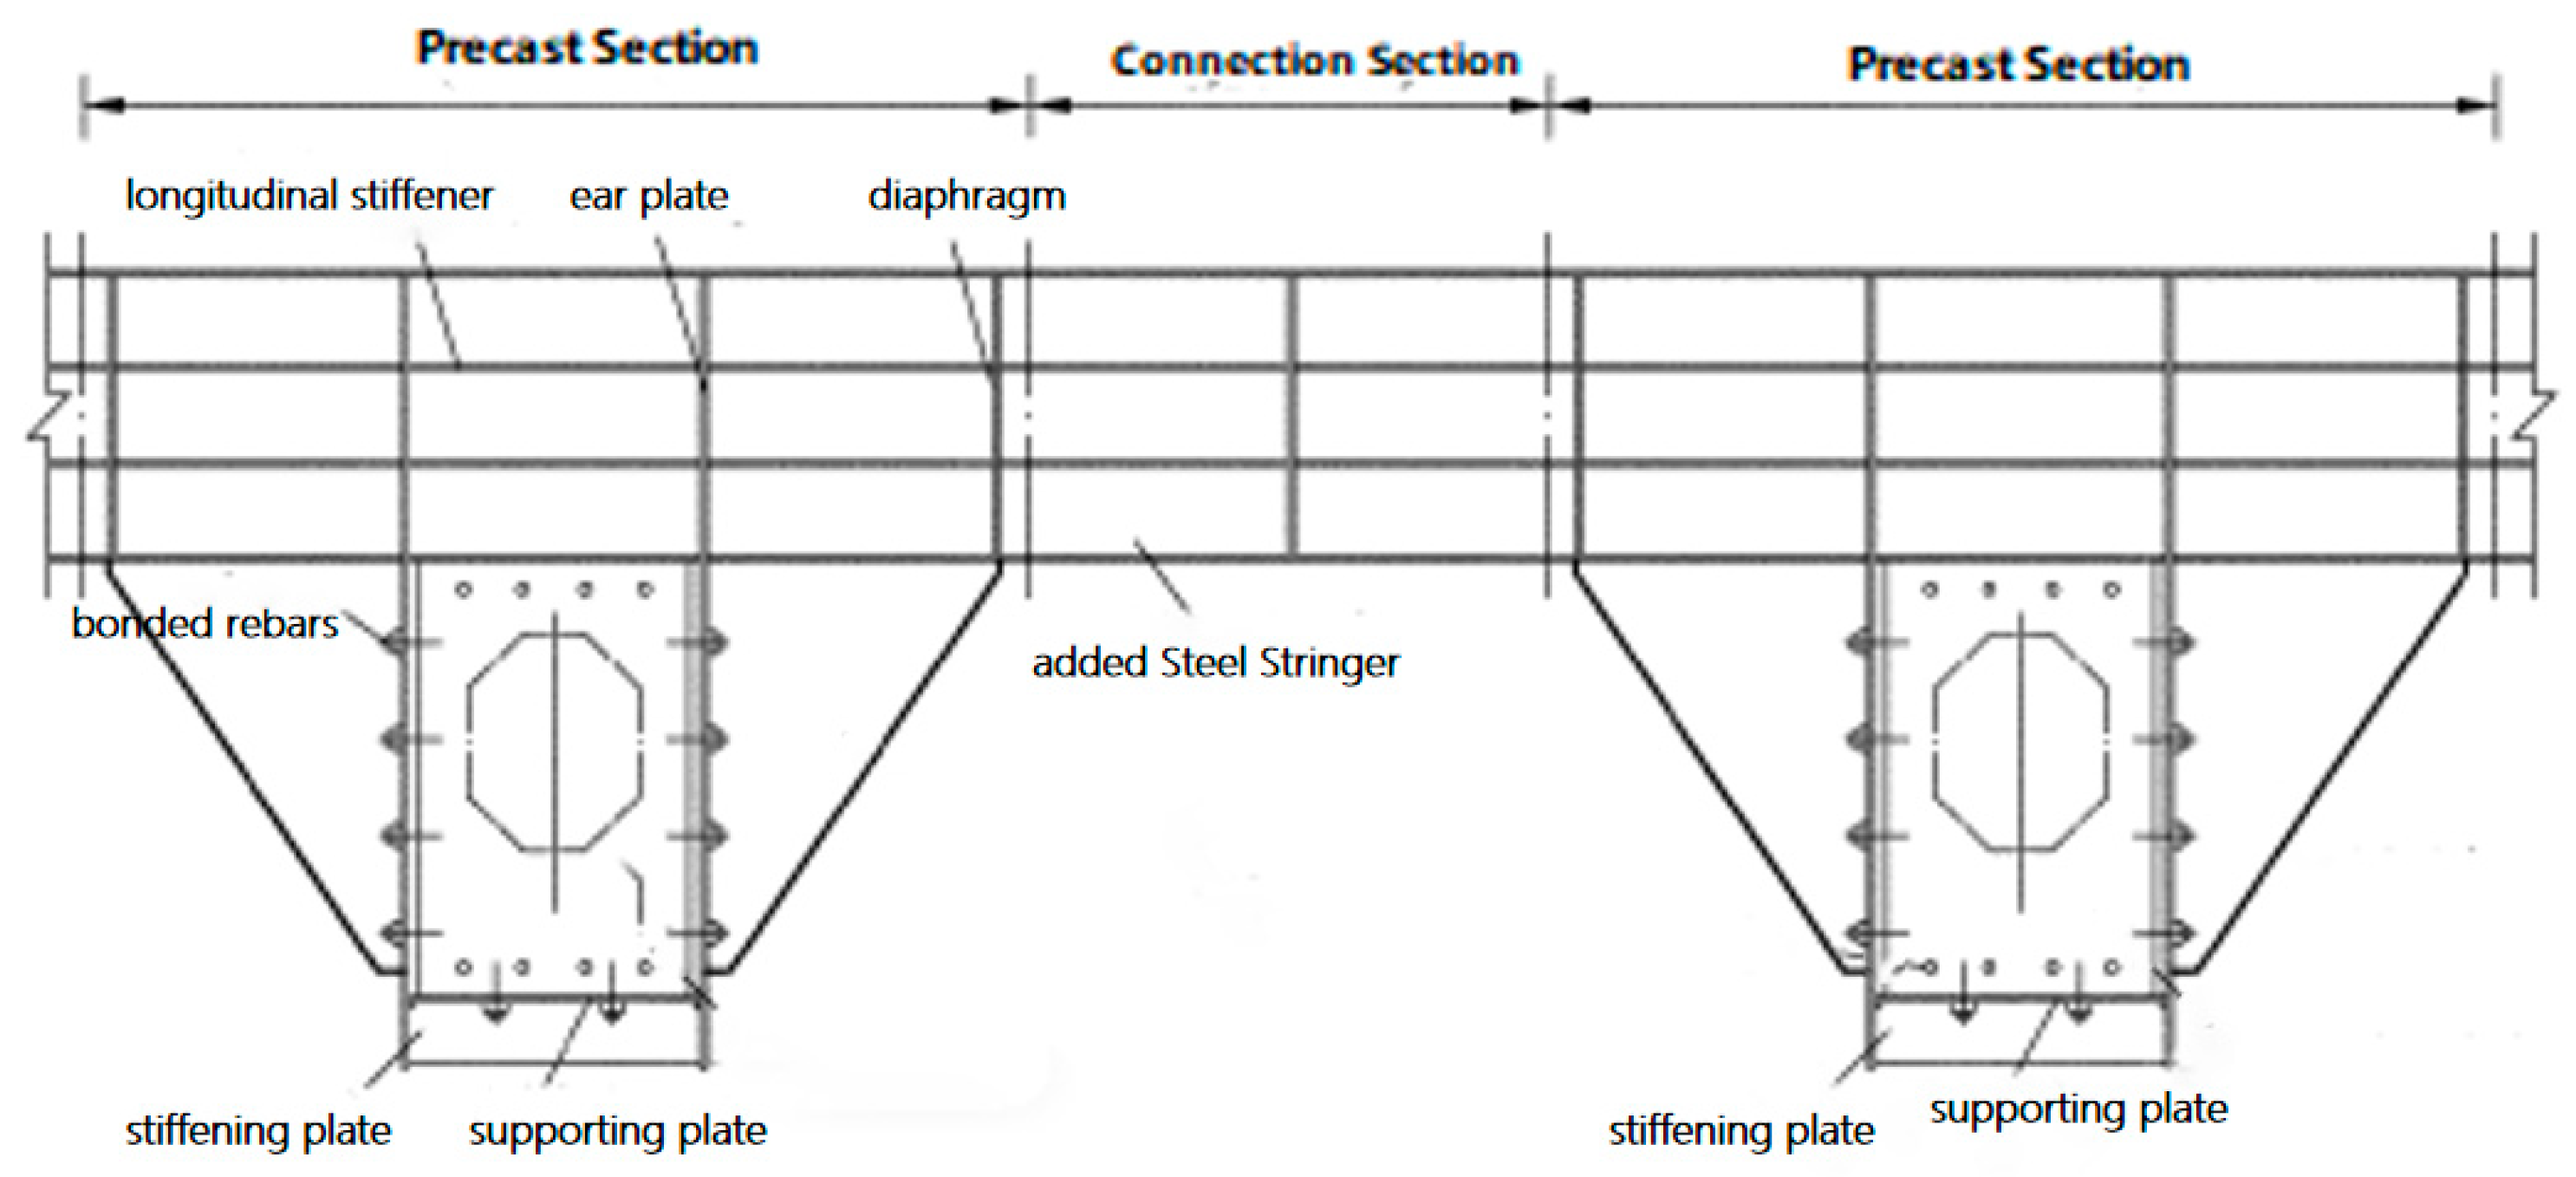
The newly added steel longitudinal beams are welded and fixed onto the existing steel crossbeams. These longitudinal beams are connected to the crossbeams through ear plates and clamping plates attached to the crossbeam bottom plates. Longitudinal and transverse stiffening ribs are installed inside the steel longitudinal beams. The configuration of the newly added steel longitudinal beams is illustrated in Figure 6. Each steel longitudinal beam spans the entire length of a single bridge span and is interrupted at expansion joints. In the event of the temporary removal or breakage of a single suspender rod, the steel longitudinal beam at that location can bear the dead and live loads of the bridge deck, distributing the load to the suspender rods on both sides. The steel longitudinal beams can thus serve as load-distributing beams for the subsequent replacement of suspender rods. The steel longitudinal beam consists of a top plate, web plates, and a bottom plate. To adapt to Wuhan’s humid climate conditions, the material of the steel longitudinal beam is selected as Q345. The top plate has a full width of 2420 mm and a thickness of 16 mm, with plate-type stiffening ribs measuring 120 mm × 10 mm (height × thickness) installed. The two web plates are 1050 mm in height and 16 mm in thickness. The bottom plate is 400 mm wide and 20 mm thick. Vertical stiffening ribs are installed every 1320 mm along the longitudinal direction of the tie beam.

4. Finite Element Analysis

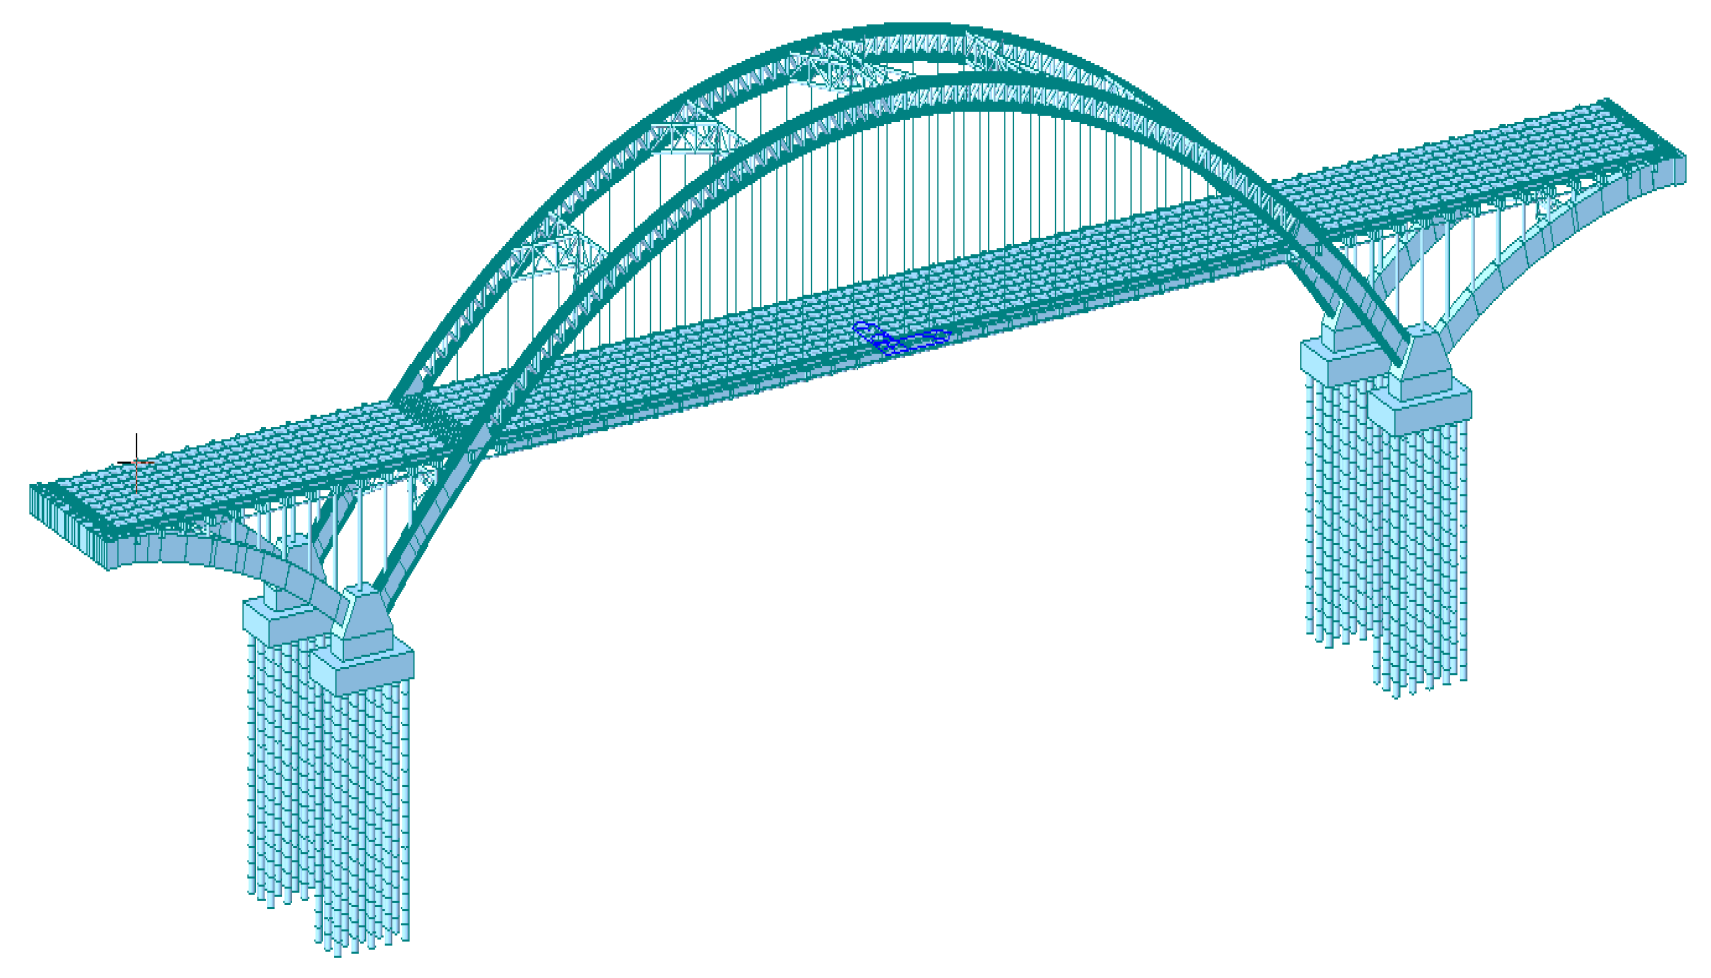
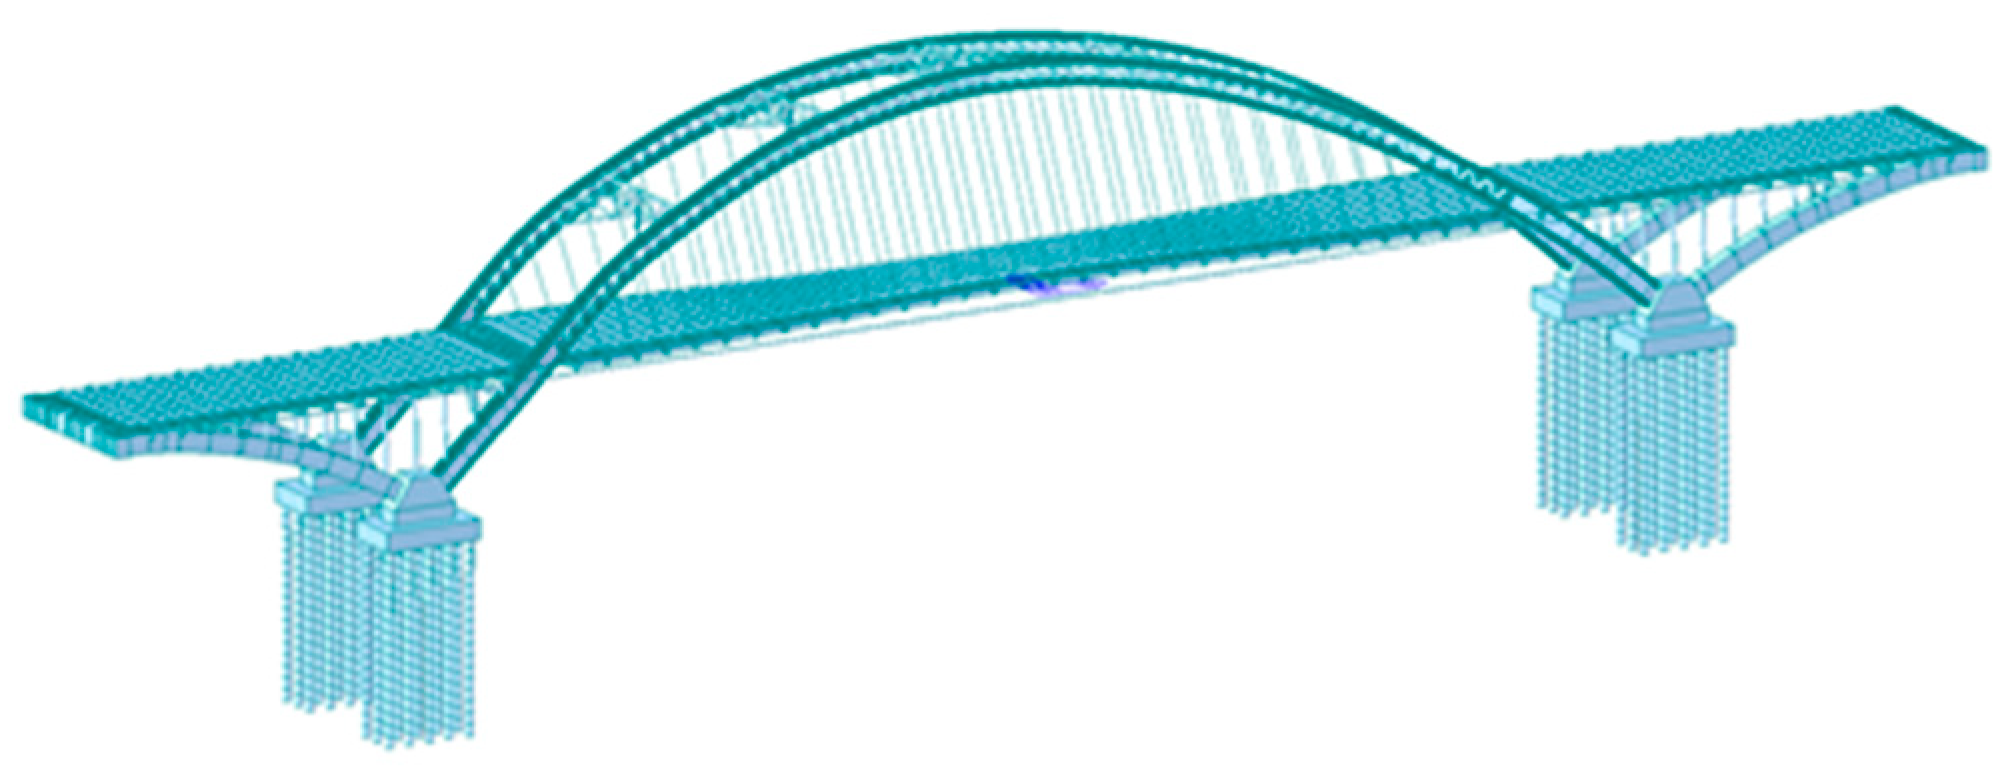
Using the bridge structural finite element analysis software Midas/Civil, a spatial finite element model of the entire bridge is established—Model 1 (as shown in Figure 7). Tension-only truss elements are used for suspender cables and suspender rods, while other components utilize spatial beam elements. The main arches are simulated using composite steel–concrete sections, and the carriageway is simulated using virtual beam elements. Beam sections, arch rib sections, tie rod sections, dead loads, cable forces, and boundary conditions were all input into the model according to the construction drawings. The main bridge is discretized into 5601 elements, comprising 64 cable elements and 5537 beam elements, with 3422 nodes. The mesh is configured with line elements of the quadrilateral type, with a mesh size of 1000 mm. Boundary conditions include fixed constraints at the bottom of the arch abutments, longitudinal sliding bearings at the bridge deck supports, and constraints on the vertical and transverse displacements of the main beams [14]. The fixed boundary condition assumes that the bottom of the pier is fully constrained, with no displacement or rotation between the pier and the foundation. This simplification helps streamline the calculation and analysis process, making it suitable for cases where the pier is rigidly connected to the foundation structure. The longitudinal movable support allows the bridge to expand or contract along the longitudinal direction under loading, which aligns with the deformation characteristics of the actual structure. Additionally, by constraining the vertical and transverse displacements of the main girder, the bearing effect provided by the pier support is effectively simulated, which helps reduce the computational complexity. However, this approach may overlook the effects of friction or minor constraints that exist in real bridge supports.
Refer to Table 3 for details on the materials and performance parameters of the main structure (The data in the table are derived from the recommended values in the Midas/Civil user manual).
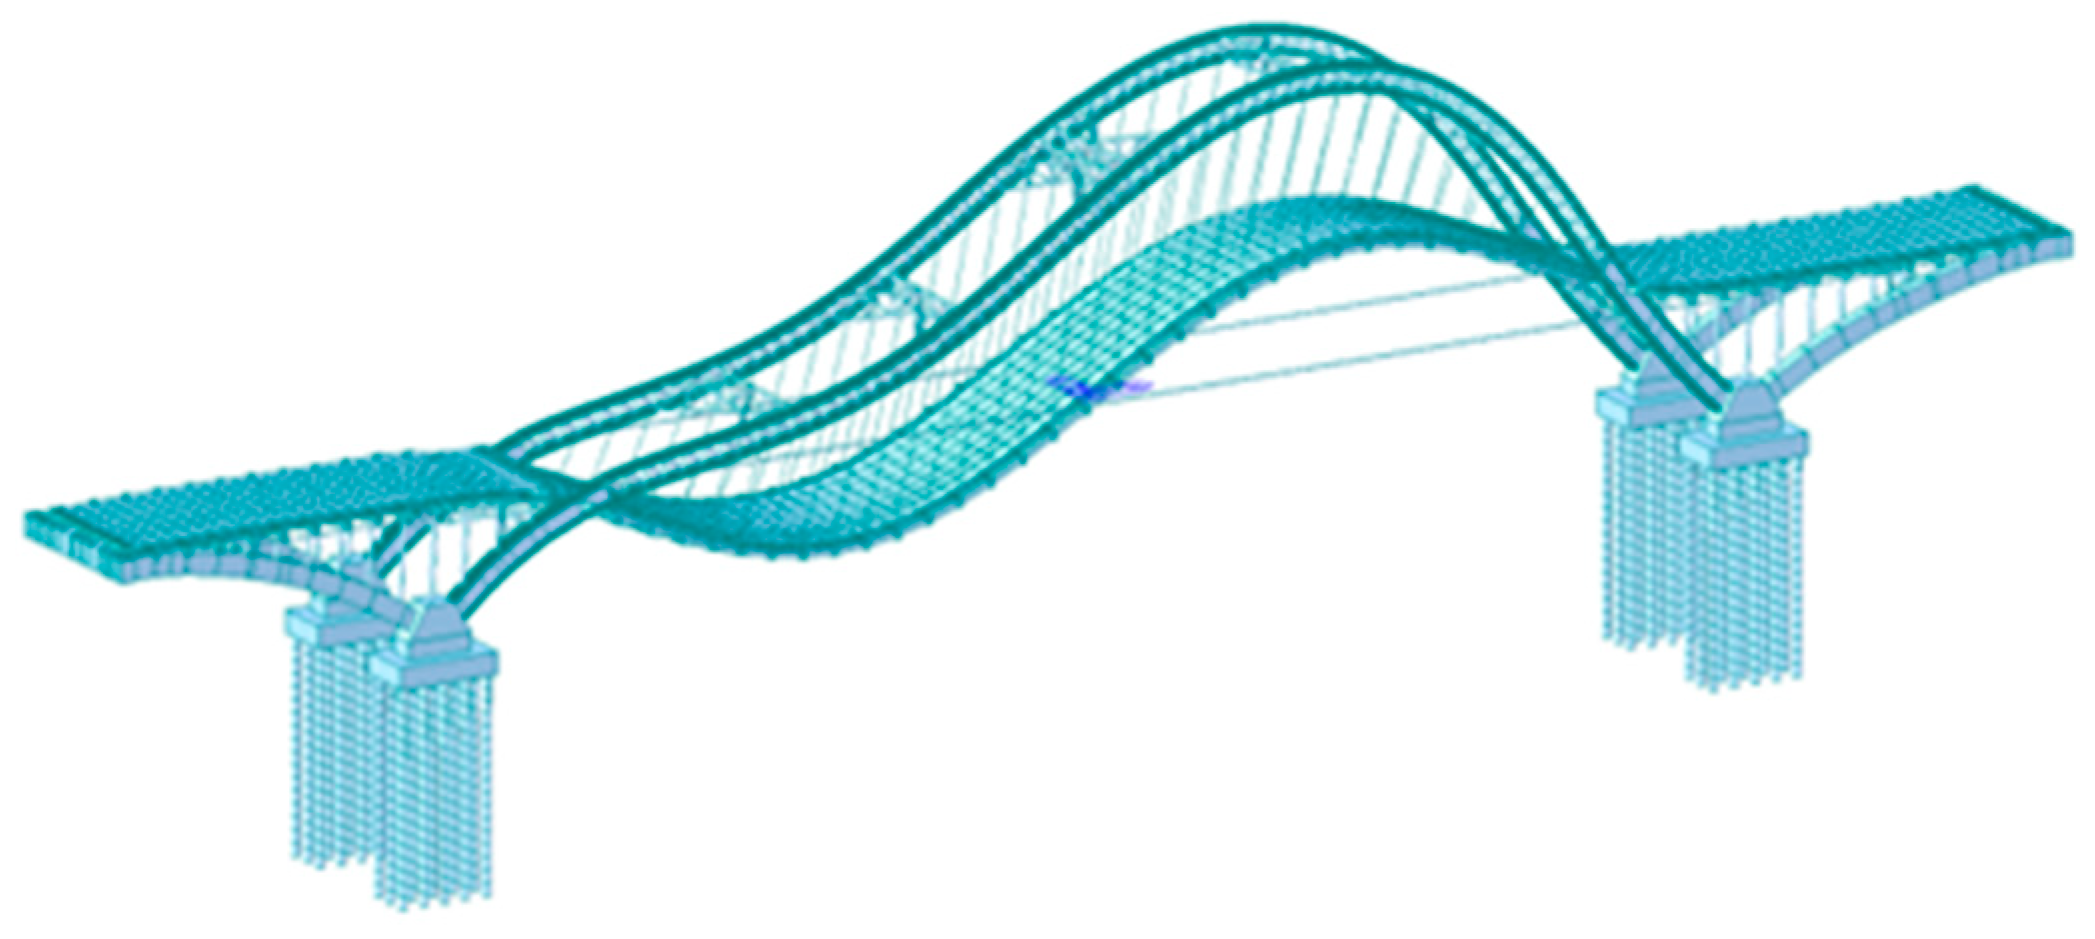
To compare and analyze the performance improvement of the steel structure bridge deck system after retrofitting, another finite element model, Model 2, based on Model 1, was established with the original bridge deck system as concrete (as shown in Figure 8). The structural configuration and boundary condition settings of Model 2 are identical to those of Model 1.

4.1. Finite Element Model Validation

Using the Multiple Ritz Vector Method [15] in the finite element analysis software Midas/Civil 2022, the natural frequencies of the bridge were calculated. The Multiple Ritz Vector Method considers structural dynamics as a function of spatial load distribution. By accounting for the spatial distribution of dynamic loads in the x, y, and z directions and utilizing eigenvalues that reflect the characteristics of these loads, this method can achieve more accurate results than the traditional eigenvalue vector method with fewer modes. For practical engineering problems such as bridges, low-order modes (corresponding to lower frequencies) typically dominate. The Multiple Ritz Vector Method directly generates basis vectors with the greatest energy contribution by weighting common load patterns or initial displacement conditions, thereby focusing on capturing low-order modes and neglecting the influence of high-order modes on the system’s dynamic characteristics. For Model 1, the computed first three natural frequencies are 0.734 Hz, 1.157 Hz, and 1.891 Hz. These closely match the measured structural natural frequencies of 0.825 Hz, 1.263 Hz, and 2.331 Hz, demonstrating good agreement. This indicates that the model accurately reflects the actual behavior of the structure [16].

4.2. Finite Element Simulation and Discussion

To transform the original concrete longitudinal beams of the bridge from a simply supported structure with a continuous deck system into a fully integral continuous steel structure, and to analyze the enhancement effects of this transformation on the steel–concrete tie-rod arch bridge deck system, Midas/Civil was used to compute the bridge’s natural frequencies before and after the modification, as well as to simulate the dynamic responses under various vehicle loading speeds post modification [17].
The natural frequency is closely related to the stiffness of the structure. Natural frequency can be accurately measured, making it a reliable indicator for evaluating a bridge’s stiffness. When structural components exhibit defects, the natural frequency typically decreases, and the vibration modes show variations.
Data from Table 4 indicate that converting the bridge deck system from concrete to steel has significantly increased the bridge’s natural frequencies across various modes. The primary vertical frequency rose from 0.612 Hz to 0.734 Hz, an improvement of 19.9%. This notable increase in first-mode frequency suggests that the steel deck structure provides enhanced stiffness and deformation resistance in lower vibration modes. Since first-mode vertical vibration is typically the bridge’s primary response under external excitation, this improvement enhances stability and resistance to low-frequency vibrations in dynamic responses. The second vertical frequency increased from 1.010 Hz to 1.157 Hz, a rise of 14.6%, indicating that the steel structure enhances vibration resistance even in more complex dynamic environments. This frequency gain improves stability across multiple vibration modes, reducing second-mode impacts on the bridge. The third vertical frequency rose from 1.791 Hz to 1.891 Hz, a 5.6% increase, which, though smaller, strengthens resistance to higher-order vibrations. This trend shows the upgrade improves stability across both low- and high-frequency vibration modes, enhancing overall bridge durability.
The increase in natural frequencies across all vibration modes demonstrates that the steel structure upgrade has improved the bridge’s overall stiffness, enhancing its vibration resistance in various vertical modes. This increase in stiffness and frequency will help reduce resonance risks when vibration frequencies approach the bridge’s natural frequency, ultimately extending the bridge’s lifespan and ensuring safety under diverse loads and complex environmental conditions.
When analyzing enhancement and renovation strategies, changes in the structural natural frequencies alone do not suffice to infer specific renovation effects [18]. Therefore, it is necessary to consider the vehicle and bridge as an integrated system, taking into account their mutual interaction to analyze the dynamic response of the bridge under loaded vehicles traveling at different speeds. This approach allows for the assessment and evaluation of renovation effects. Vehicle passage across the bridge induces structural vibrations, which in turn affect vehicle vibrations. This interaction, where each affects the other, constitutes the coupled vibration problem between vehicles and bridges. A vehicle field test involves solving vehicle–bridge-coupled vibration system equations to address typical vehicle-induced bridge vibration issues [19]. Currently, the main vehicle field test simulation methods include the following: Moving constant force simulation: This method does not account for the coupling effect of the vehicle system. It simulates the vehicle using a moving constant force while ignoring the vehicle’s inertia forces, leading to some discrepancies from actual conditions. Moving harmonic force simulation: this method considers the vehicle’s inertia force and simulates the behavior of the vehicle system, but the harmonic force does not accurately reflect the true vehicle–bridge coupling effect. The vehicle–spring model: In this method, the vehicle is modeled as a spring and mass block, providing an approximate solution for vehicle-induced vibrations on simply supported beam bridges. However, this method does not consider the effects of road surface smoothness. Vehicle–bridge-coupled vibration considering road roughness, smoothness, and multi-axle vehicle simulation: this method requires numerous parameters to solve the approximate vibration equations, relying on high-performance computers and large-scale finite element software, making it suitable for high-precision simulations.
All these methods require the development of complex vehicle–bridge-coupled models for vehicle field test simulations, which are not suitable for a rapid bridge inspection and assessment [20]. Therefore, this paper adopts a simplified vehicle field test simulation method based on triangular loads [21]: due to the very small mass ratio of car/bridge and the much smaller vehicle wheelbase relative to the bridge span, inertia and damping forces of vehicles are not considered in finite element simulations. Firstly, the vehicle load is simplified to a moving short-term impact load applied to unit nodes. To ensure that the total weight of the vehicle load on the unit is unchanged in any position, a triangular load is used to simulate the impact load (the numerical value is used to simulate the vehicle weight and the shape is used to simulate the vehicle moving speed); then, the loading process is determined based on the length of the finite element and the speed of the test vehicle; and finally, the program sequence when the triangular load is loaded into the car-to-bridge motion equation and the bridge structure dynamic theory to derive the dynamic response of the bridge structure achieve a fast simulation of the car test.
A triangular load can realistically simulate the time-varying force of a moving vehicle on a bridge, closely approximating the dynamic load distribution. In contrast, point loads assume an instantaneous force at a fixed location, ignoring the vehicle’s movement and failing to capture the bridge’s dynamic response accurately [22]. Additionally, a triangular load adapts flexibly to different vehicle speeds by representing the load’s full distribution over time, enabling an effective analysis of the bridge’s dynamic response at varying speeds—something point loads struggle to adjust for accurately. Using triangular loading enables a more comprehensive simulation of the actual load distribution from moving vehicles and its dynamic effects on the bridge. This approach yields a more reliable structural analysis results by closely mirroring the real impact of vehicular loads throughout the transit process.
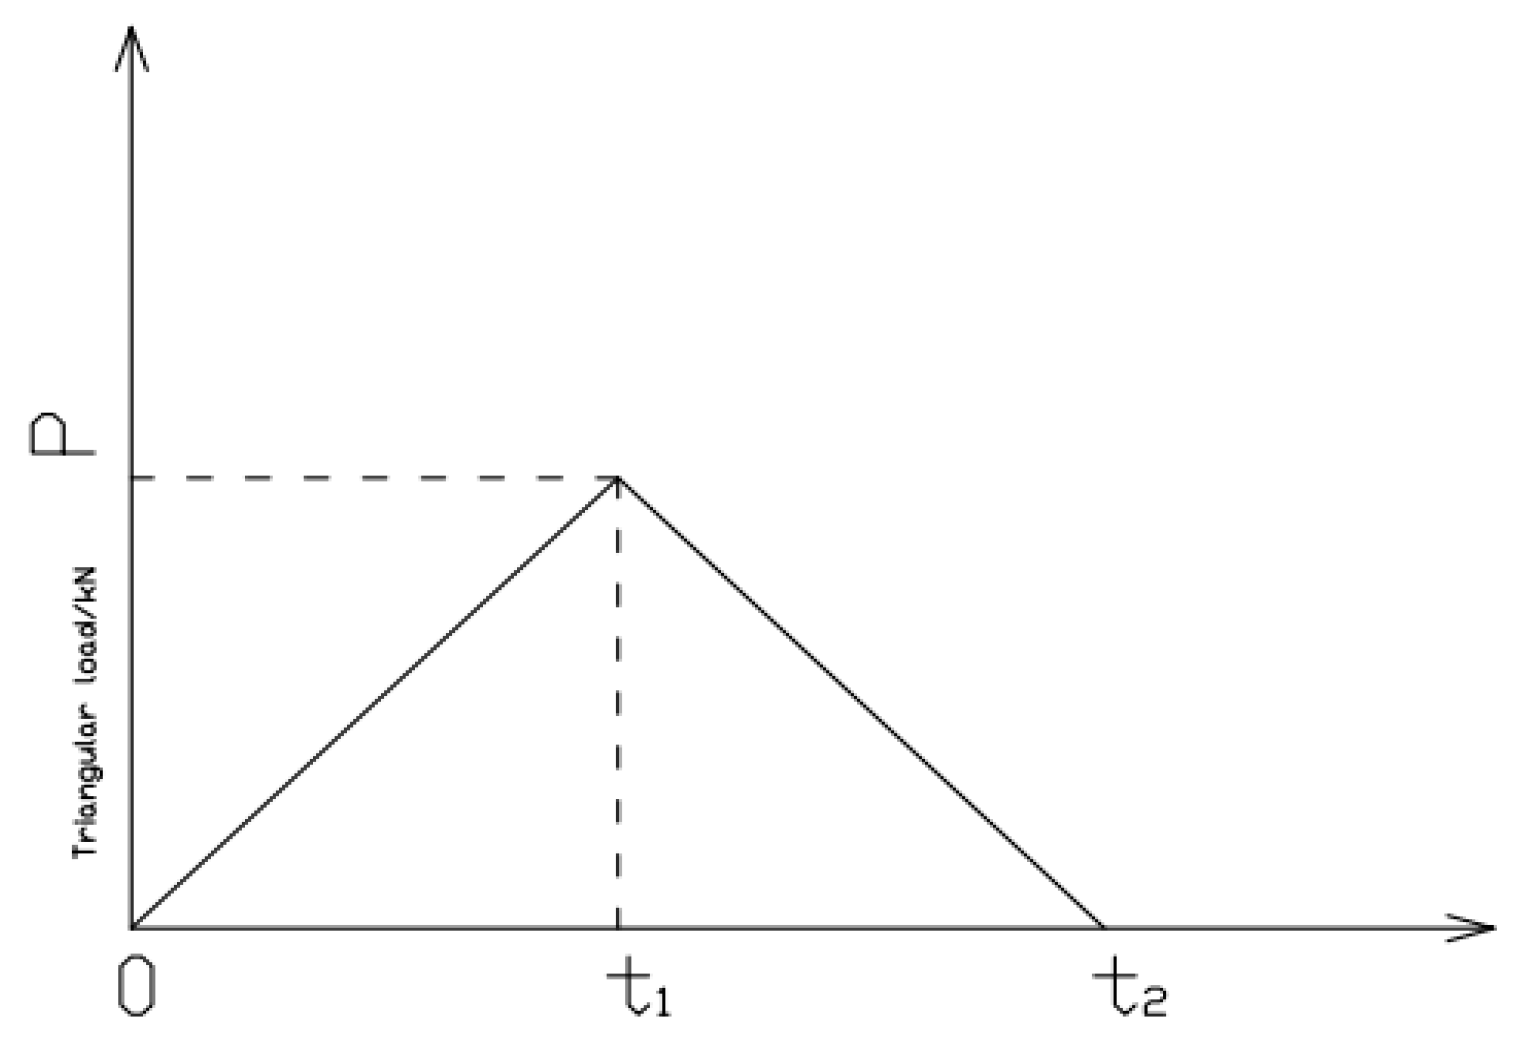
This is time history function expression of the triangular load:
F ( t ) = { P ( t t 1 ) 0 t t 1 P ( t 2 t 1 t 1 ) t 1 t t 2
In the equation, P ( KN ) represents the total weight of the vehicle, which is a constant value. t ( s ) denotes the time during which the vehicle is loaded on the element, with t 1 ( s ) and t 2 ( s ) representing the durations of loading on the element. These durations are determined by the length t of the divided element and the average vehicle speed v ( km / h ) , specifically t = l v , which is a variable value. At t 1 moment, the vehicle must be driven to the node position of the unit. Under specific circumstances, when adjacent unit lengths and speeds are the same, t 2 = 2 t 1 ; otherwise, t 2 2 t 1 (The time history function of triangular load as shown in Figure 9).
Using the Midas/Civil finite element software to simulate the vehicle field test process, when simulating vehicle loads, two loading vehicles are placed side by side (illustrated in Figure 10) and pass over the bridge at constant speeds of 20, 30, 40, 50, and 60 km/h. The dynamic response of the bridge under different vehicle speeds is then calculated. Analyzing these speed variations enables a comprehensive assessment of the bridge’s dynamic performance, covering typical traffic speeds and flow conditions. By testing multiple speeds, the dynamic response from low to mid-high speed ranges is evaluated, ensuring that the results align closely with real-world bridge usage conditions.
The bridge exhibits distinct dynamic response characteristics at various speeds. At lower speeds, vehicles remain on the bridge longer, emphasizing static load and gradual deformation. As the speed increases, inertial forces and dynamic loads intensify, amplifying vibration amplitude and frequency. Testing across speeds helps capture these effects, and certain speeds (e.g., 30, 40 km/h) may approach the bridge’s natural frequency, potentially inducing resonance. Resonance can significantly increase vibration amplitude, accelerating structural fatigue and elevating damage risks, making this analysis essential for long-term bridge safety.
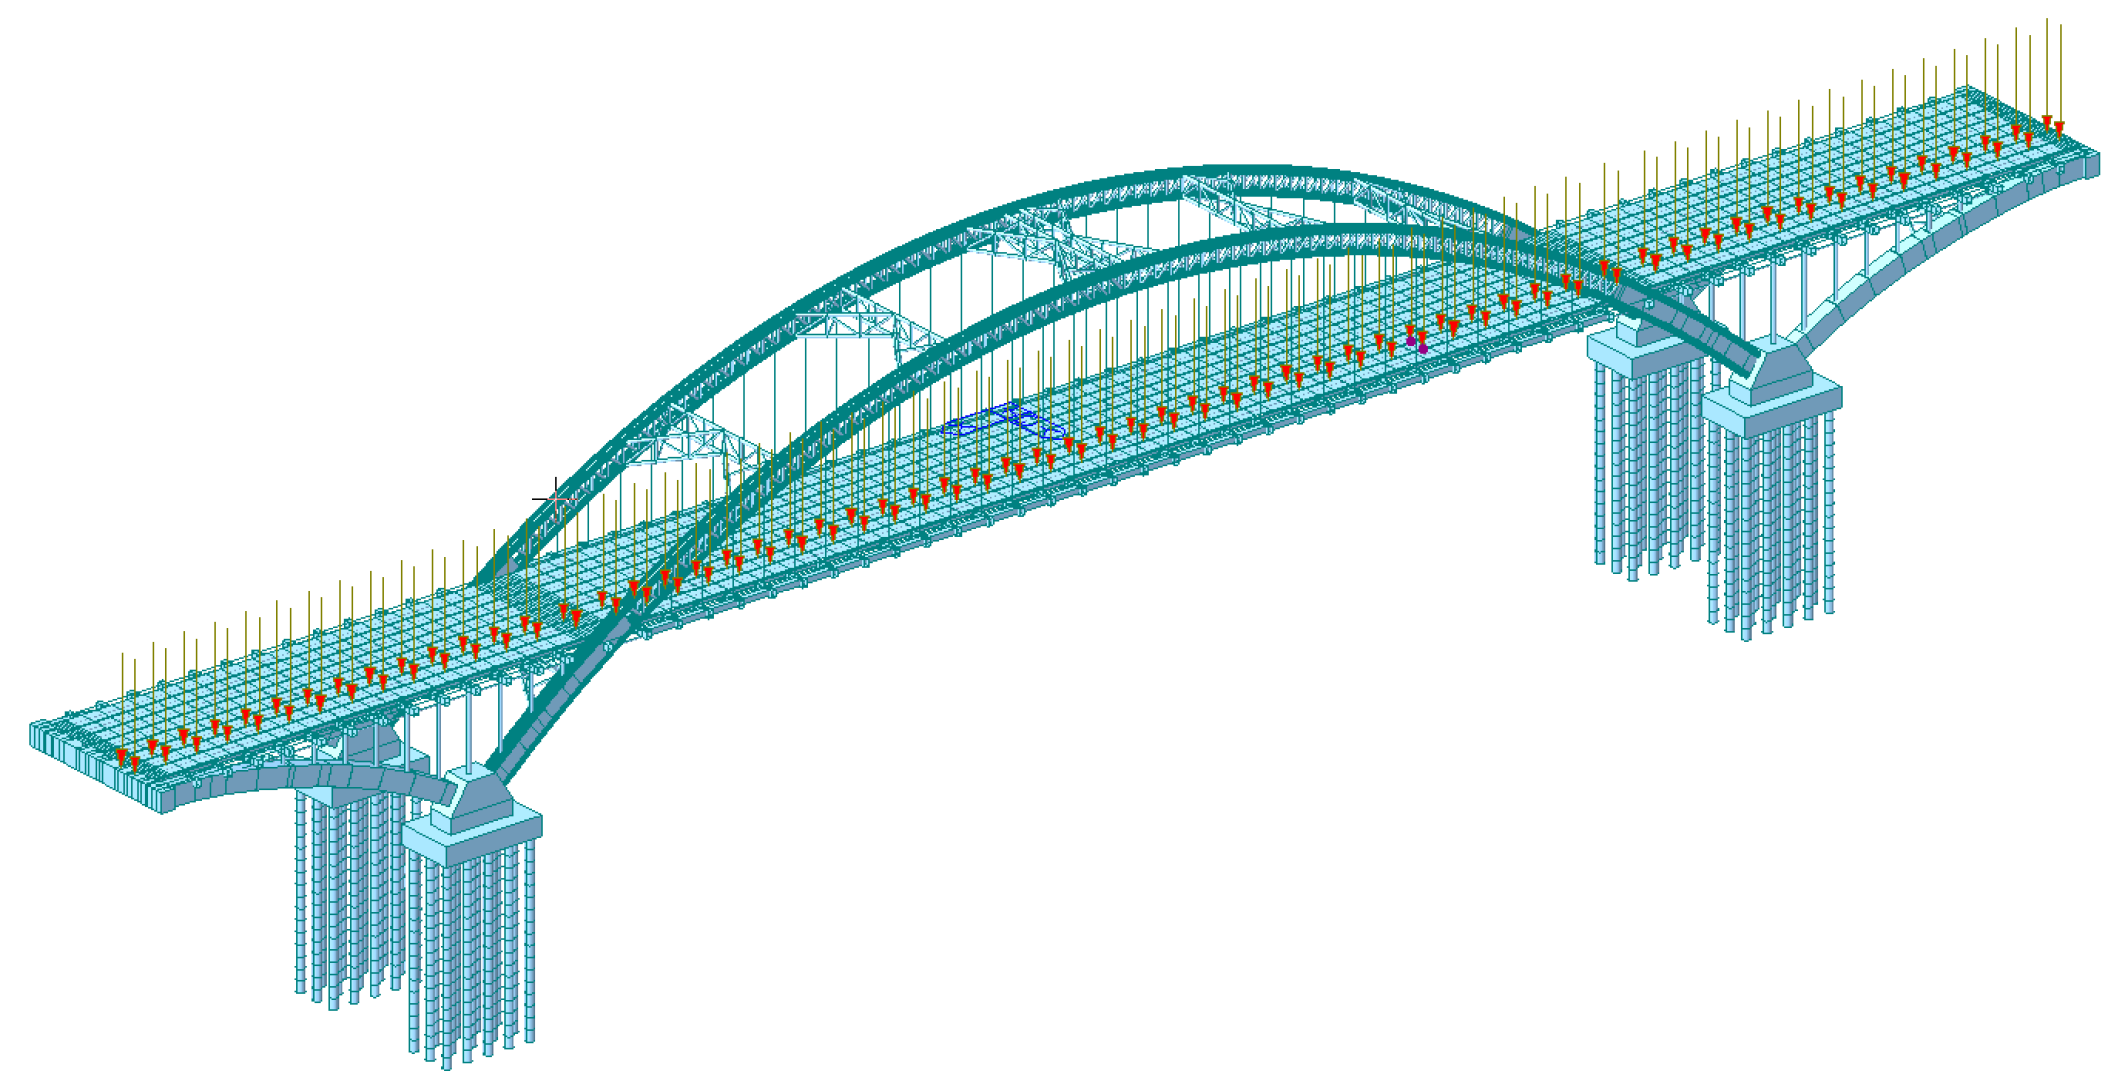
The main beam model segments are each 6 m long. Following the previously mentioned triangular load application process, a triangular load is applied to the bridge finite element model to simulate the passage of the test vehicle. The magnitude of the load applied at each node varies over time according to the time history function, with the vehicle weight P = 300 kN (as shown in Figure 11). To better reflect real-world traffic conditions, the load is applied to the right two lanes in the longitudinal direction of the bridge. The parameters for simulating the moving vehicle load are provided in Table 5.
From Figure 12, it can be observed that in terms of bridge dynamic deflection, the deflection increases with increasing vehicle speed after the renovation, which aligns with real-world scenarios. When the vehicle speed is less than 50 km/h, the dynamic deflection after the renovation is consistently smaller compared to before, particularly evident when the speed is 30 km/h, where the maximum deflection decreases from 3.82 mm to 2.42 mm, a reduction of 26.2%. For vehicle speeds greater than 50 km/h, the maximum dynamic deflection of the bridge increases slightly compared to before the renovation, but the increase is not significant. This increase in deflection is attributed to the transformation of the bridge deck system from the original prestressed concrete T-beams to a steel structure, which, due to its lightweight nature, is more susceptible to vibration under vehicle loads [23]. This phenomenon is inherent to the material characteristics and difficult to avoid. It indicates that the vibration of the bridge deck is significantly reduced at lower vehicle speeds after the renovation.
Post renovation, the dynamic deflection at low speeds (20 km/h and 30 km/h) significantly decreased, indicating enhanced bridge stiffness. For instance, at 20 km/h, the maximum dynamic deflection dropped from 21.4 mm to 17.9 mm, and at 30 km/h, it decreased from 38.2 mm to 24.2 mm. This shows reduced deformation due to the improved steel structure. However, at higher speeds (50 km/h and 60 km/h), dynamic deflection increased (e.g., from 25.4 mm to 31.7 mm at 60 km/h), likely due to the steel structure’s greater sensitivity to dynamic loads at high speeds.
Comparing the contour lines of deflection displacement before and after the renovation (as shown in Figure 13), it is evident that the deformations of the bridge deck after the renovation are more balanced. Significant deformations occur predominantly at the one-third and two-third points of the main beam, without abrupt changes in deflection. This suggests that the steel structure of the renovated bridge deck is more closely interconnected, demonstrating higher overall integrity.
In terms of bridge dynamic moments, according to Figure 14, it is evident that the dynamic moments after the modification are consistently lower than those before when the vehicle speed is less than 60 km/h. Specifically, at a speed of 30 km/h, the maximum dynamic moment decreased from 1.13 × 10⁴ kN·m to 8.77 × 10³ kN·m, marking a reduction of 22.4%. Additionally, from Figure 15, it is observed that the maximum dynamic moment occurs at the connection between the bearing and the bridge pier. The reduction in moment effectively improves the bending fatigue at the connection point [24].
After the renovation, the dynamic bending moment at low speeds showed a slight decrease, such as at 20 km/h, where it reduced from 6.76 × 10³ kN·m to 6.44 × 10³ kN·m, indicating improved moment distribution at lower speeds. However, at higher speeds, the bending moment increased, rising from 1.24 × 10⁴ kN·m to 1.82 × 10⁴ kN·m at 60 km/h. This suggests that the steel structure tends to accumulate bending moments under high-speed dynamic impacts, likely due to heightened vibration intensity associated with the material’s dynamic response characteristics.
Regarding bridge dynamic stress, reductions were observed across all speeds post renovation, with decreases ranging from 19.4% to 76.9%, most notable at lower speeds. For example, at 20 km/h, dynamic stress fell from 72.7 MPa to 58.6 MPa, indicating more uniform stress distribution in the steel structure. Even at higher speeds, such as 60 km/h, stress significantly reduced from 155.9 MPa to 103.5 MPa (The before and after bridge renovation dynamic stress as shown in Figure 16 and Figure 17). This suggests improved load-bearing capacity, which mitigates cracking risk for the steel deck and reduces operational stress under heavy loads, enhancing the bridge’s resilience to overloading.
Overall, the renovated steel bridge deck significantly reduces dynamic deflection, bending moment, and stress at low speeds, enhancing stability due to its high strength and even stress distribution. Under high-speed conditions, dynamic deflection and dynamic bending moment show a slight increase. This is due to the lightweight nature of the steel structure, which makes it more susceptible to vibrations under vehicle loading. To reduce the coupling vibrations between the vehicle and the bridge, TMD dampers can be installed after the bridge retrofitting is completed. The dynamic stress at different vehicle speeds remains lower than before the retrofit, indicating that the steel structure is capable of withstanding higher dynamic stresses, thereby extending the bridge’s service life. This upgrade positively impacts durability and impact resistance, though the pronounced vibration response at high speeds suggests further structural optimization could improve high-speed stability.

4.3. Stress of Suspenders

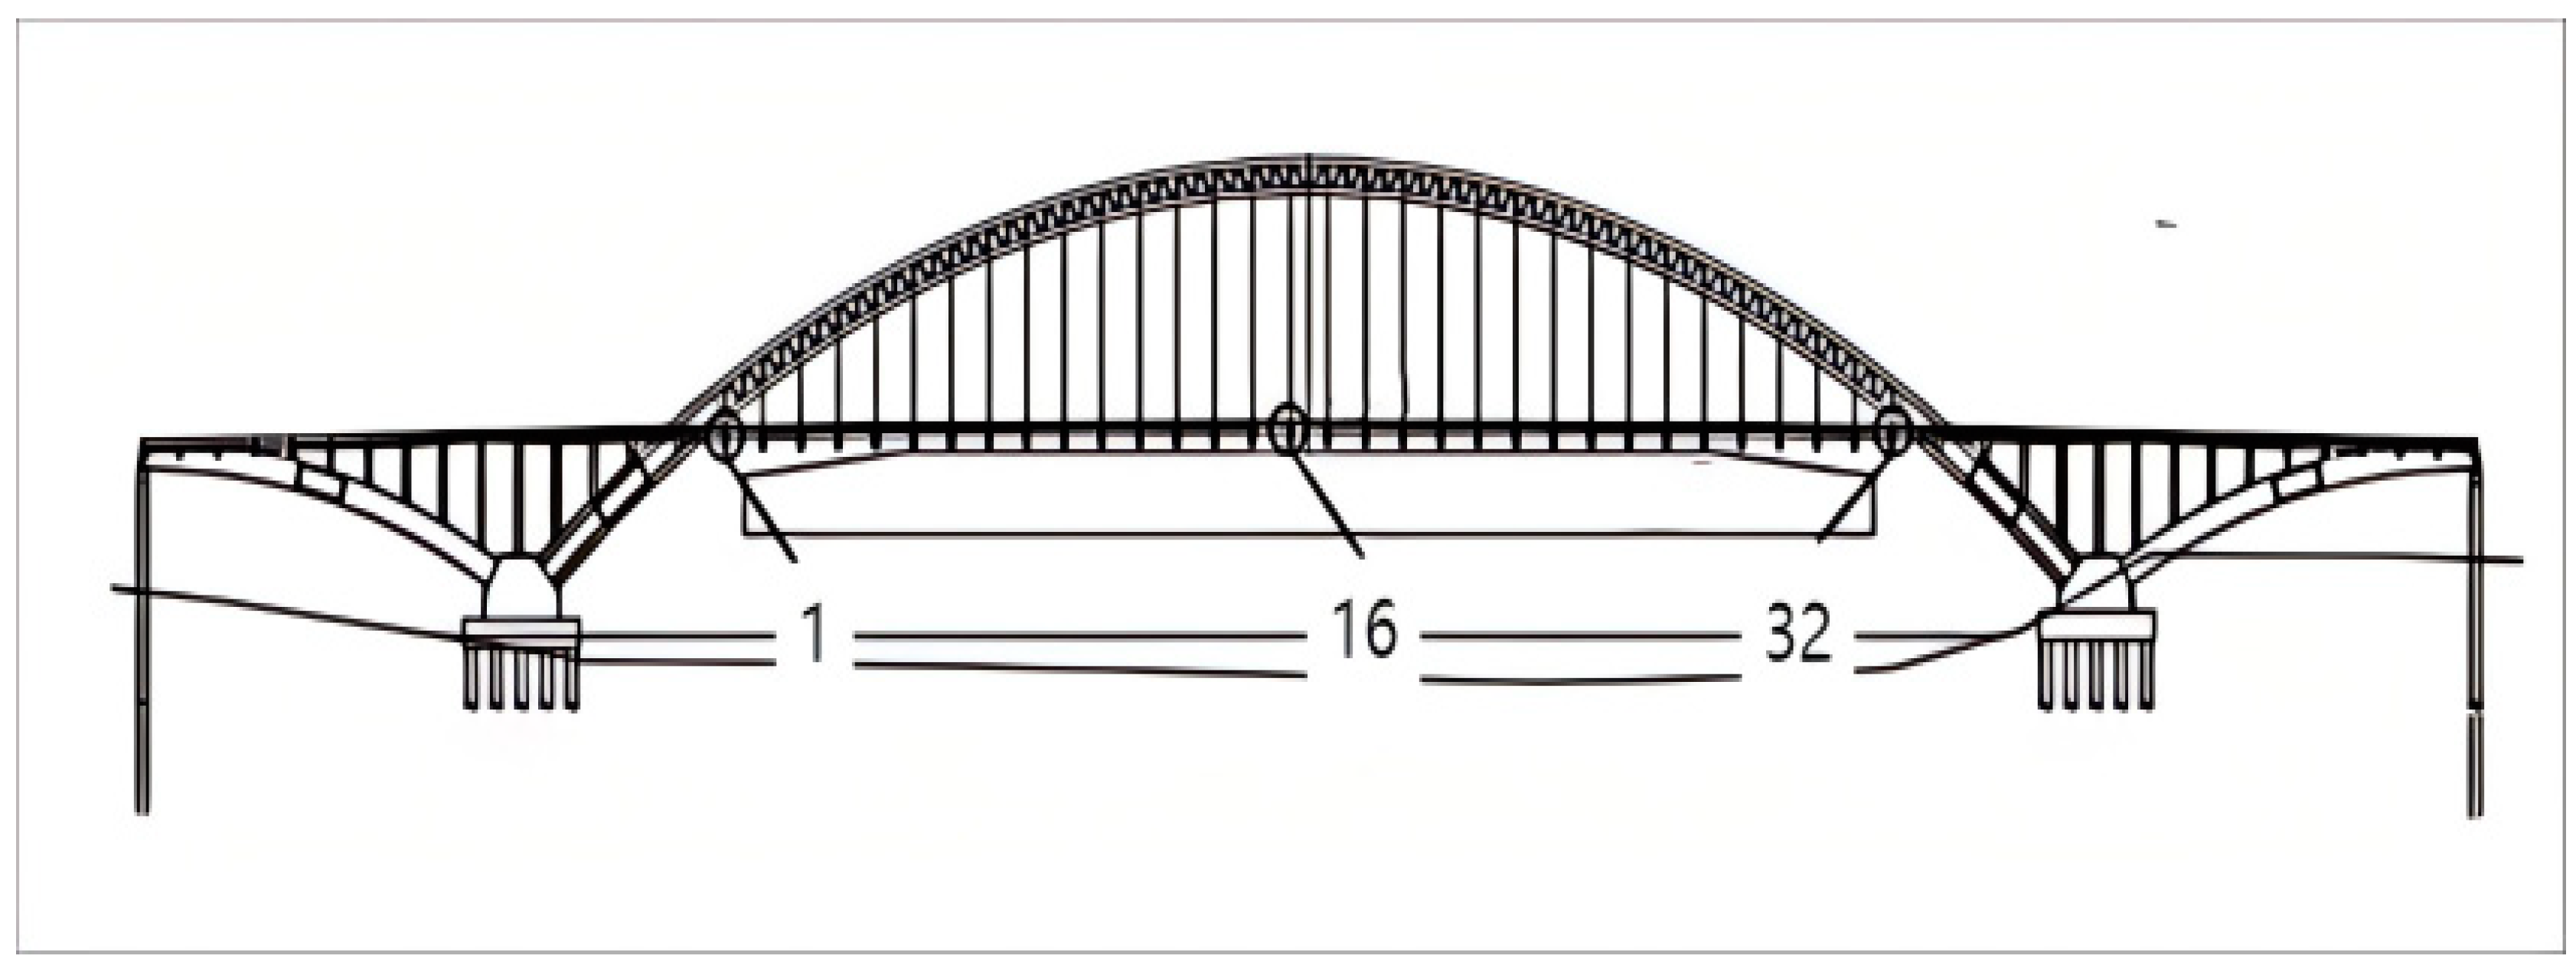
Under the five loading conditions, stress levels in suspenders 1 and 16 (as shown in Figure 18) of Changfeng Bridge are the highest, ranging between 513.2 and 560.6 MPa, well below the tensile strength standard of 1950 MPa. Design requirements specify a minimum safety factor of 2.5, meaning the suspender stress must remain under 40% of the tensile limit (780 MPa) (as shown in Table 6). The analysis shows that actual safety factors range from 3.5 to 3.8, significantly exceeding the minimum requirement, indicating a robust margin of safety in all conditions.
This higher-than-standard safety factor indicates that even under the most adverse conditions (such as conditions 4 and 5), the stress levels in the suspenders remain within the safe design range, demonstrating a sufficient tensile capacity under load. Notably, with maximum stress reaching 560.6 MPa, the safety factor of 3.5 still ensures that the suspender material and structural redesign effectively secure the bridge’s safety [25].
Compared to design standards, the maximum stress in the suspenders remains around 30% of the tensile strength limit, indicating a high safety margin and stability under various complex loads. This reserve not only ensures operational safety but also enhances the structure’s durability, allowing it to better withstand unexpected overloading or environmental changes.

4.4. Stress of Arch Ribs

Under five loading conditions, the arch ribs exhibit maximum stress at the positions of suspenders 1 and 32, with values ranging from 155.2 to 163.2 MPa, as shown in Table 7. According to design standards, an allowable stress increase factor of 1.25 is applied for suspender conditions, raising the allowable stress from 200 MPa to 250 MPa. This requirement ensures that the maximum stress in the arch ribs during operation must remain below 250 MPa to maintain safety.
The calculation results indicate that the maximum stress in the arch ribs under all conditions remains below 250 MPa, meeting design standards. This low-stress level shows that the renovated arch ribs not only ensure safety but also possess additional tensile capacity. For instance, at the peak stress of 163.2 MPa, the arch rib stress only reaches about 65% of the allowable limit, indicating substantial safety redundancy [26]. Additionally, stress fluctuations across conditions are minimal, with a range under 8 MPa, highlighting the structure’s consistent stress distribution and stability under various loads, ensuring safety even during high loads like truck passage.
Overall, the post-renovation stress levels in the arch ribs are significantly below the allowable stress limit, reflecting the structural design’s robustness and the material’s tensile capacity. This lower stress level not only meets the original design standards but also enhances bridge safety under unexpected or extreme loading conditions, improving durability and extending the bridge’s lifespan.

5. Dynamic Load Text of Bridge

The finite element simulation analysis reveals that the bridge’s dynamic performance and structural integrity have improved following the deck system retrofit. The following sections will explore the effectiveness of the deck system retrofit from the perspective of field testing. After upgrading the bridge deck system from the original prestressed concrete T-beams to a steel structure, the overall structural performance of the bridge benefits. However, in terms of dynamics, due to the lightweight nature of steel main beams, they are prone to vibration under vehicle loads. Excessive bridge deck vibrations can lead to resonance between vehicles and the bridge, causing discomfort during travel and potentially compromising the overall structural integrity, posing safety hazards [27]. Therefore, it is necessary to conduct dynamic load testing on the main bridge to assess the dynamic response of critical structural components under actual traffic loads, including bridge structural frequencies, amplitudes, and impact factors reflecting overall dynamic effects. Through an extensive analysis of measured data signals, the intrinsic vibration patterns of the bridge structure are revealed, facilitating a comprehensive evaluation of its dynamic performance, overall stiffness, and traffic suitability.

5.1. Ambient Vibration Test

There are several methods for conducting resonant vibration tests on bridges, including the free vibration method, forced vibration method, and ambient vibration test. For this resonant vibration test, the ambient vibration test was chosen. Also known as the ambient random excitation method, the ambient vibration test has increasingly become a primary approach for bridge resonant vibration tests [28]. Under the influence of environmental disturbances such as natural wind, ground pulsations, water flow, or disturbances caused by vehicles, the structural vibrations induced are extremely small in amplitude. However, the pulsation response contains a rich spectrum of frequency components. This method requires no specific excitation equipment and is not limited by the form or size of the structure, making it particularly suitable for measuring the overall resonant characteristics of structures.
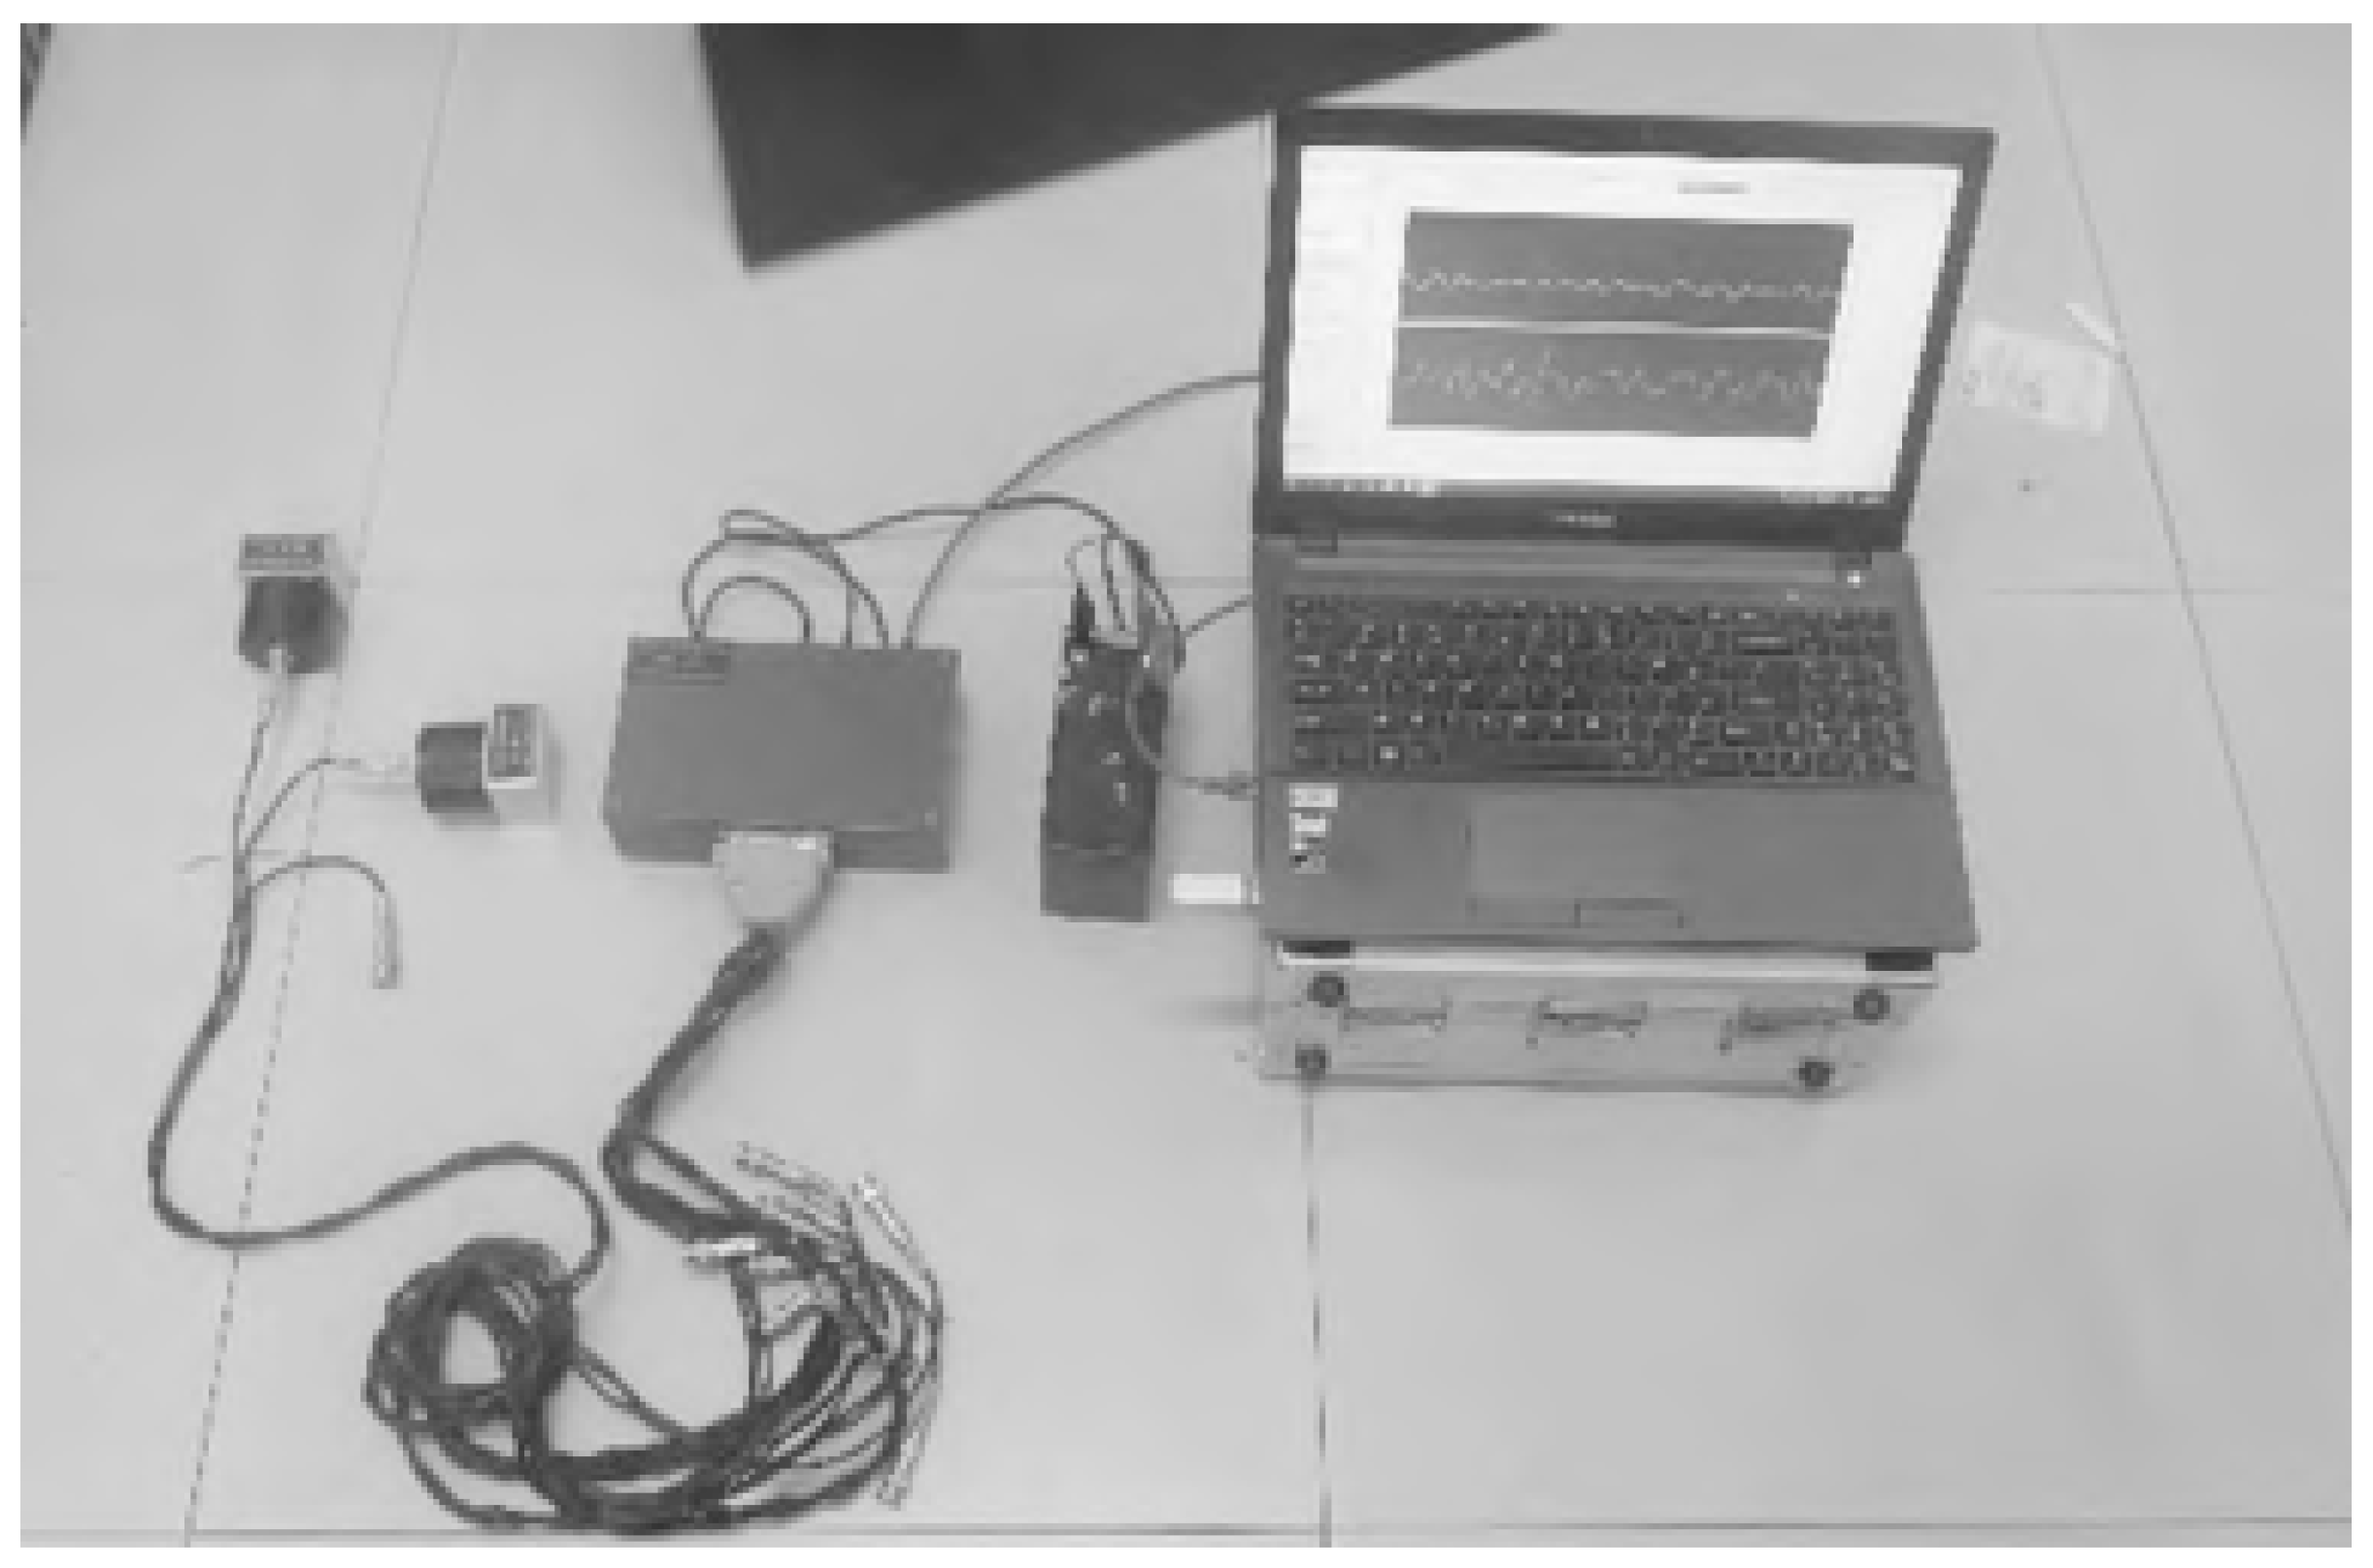
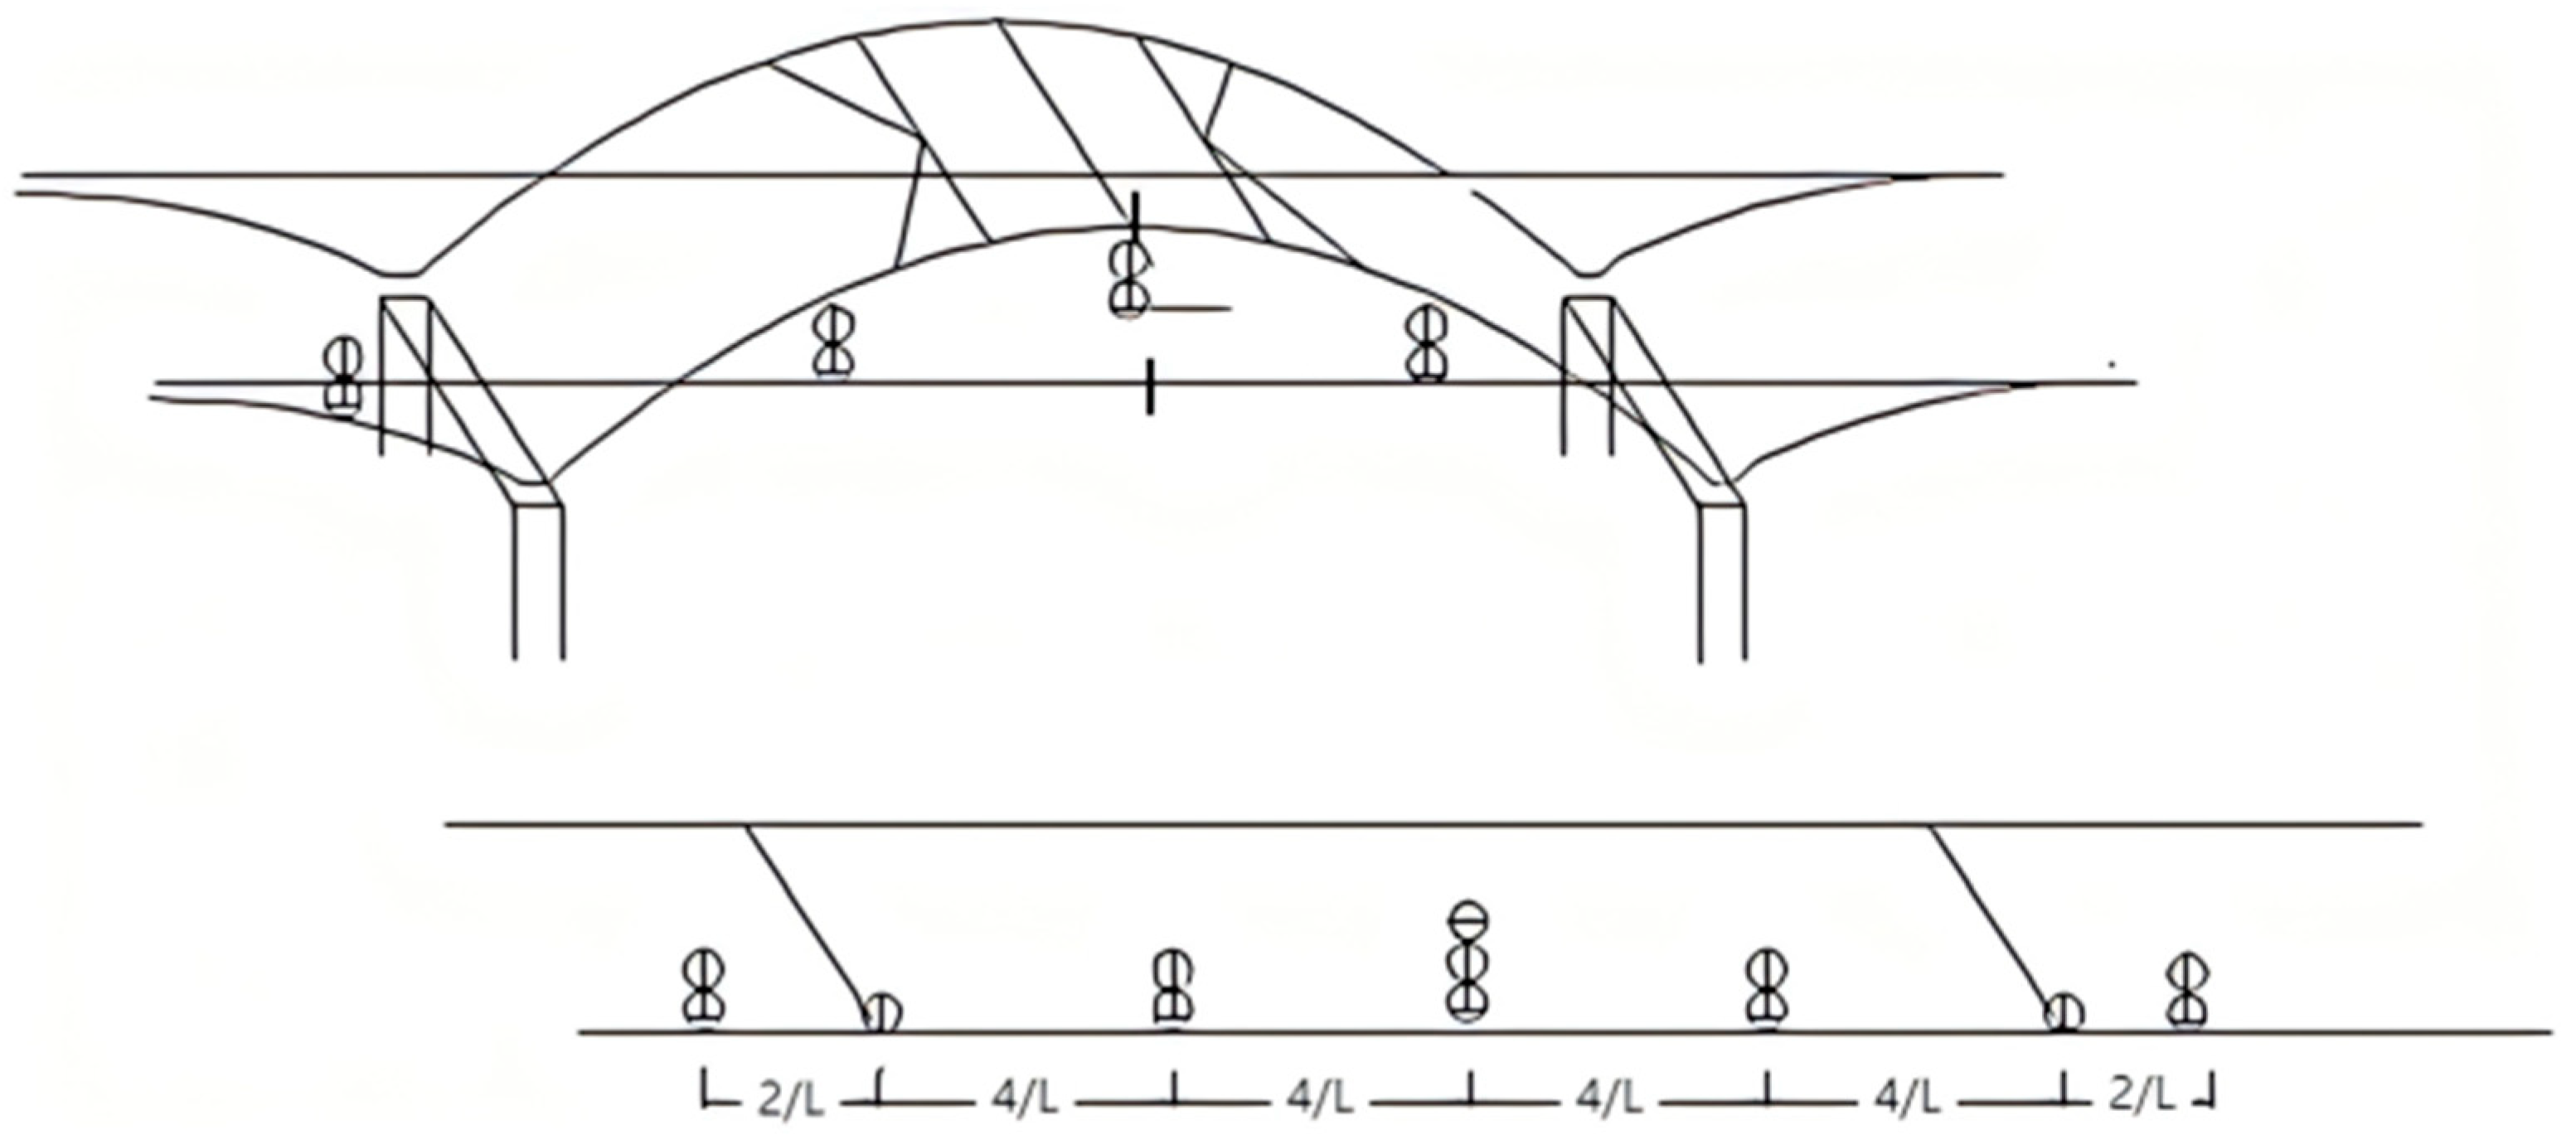
The layout diagram of measurement points for ambient vibration test as shown in Figure 19. By processing the pulsation signals collected from the main span of Changfeng Bridge through shear, filtering, windowing, and refinement techniques, and conducting frequency domain and time domain analyses(The instruments and equipment for ambient vibration test as shown in Figure 20), the vertical low-order bending vibration frequencies of the bridge were determined (as shown in Table 8) along with their corresponding modes (as shown in Figure 21 and Figure 22). An analysis of the results reveals that the measured first-order lateral vibration frequency of Changfeng Bridge is 0.375 Hz compared to a calculated value of 0.366 Hz. The measured first-order vertical vibration frequency is 0.825 Hz compared to a calculated value of 0.734 Hz. The measured vibration frequencies are higher than the calculated values, indicating that the structural dynamic stiffness of the bridge is adequate and meets design requirements, with a lower likelihood of cracking or other abnormal phenomena. Field measurements indicate a slight reduction in the bridge’s natural frequency under heavy traffic loads. However, as the impact of vehicle loads on the bridge is transient, the natural frequency returns to its original level when the loads are absent or minimal. This demonstrates that the stability of the modified bridge is not affected by heavy traffic loads.

5.2. Vehicle Field Test

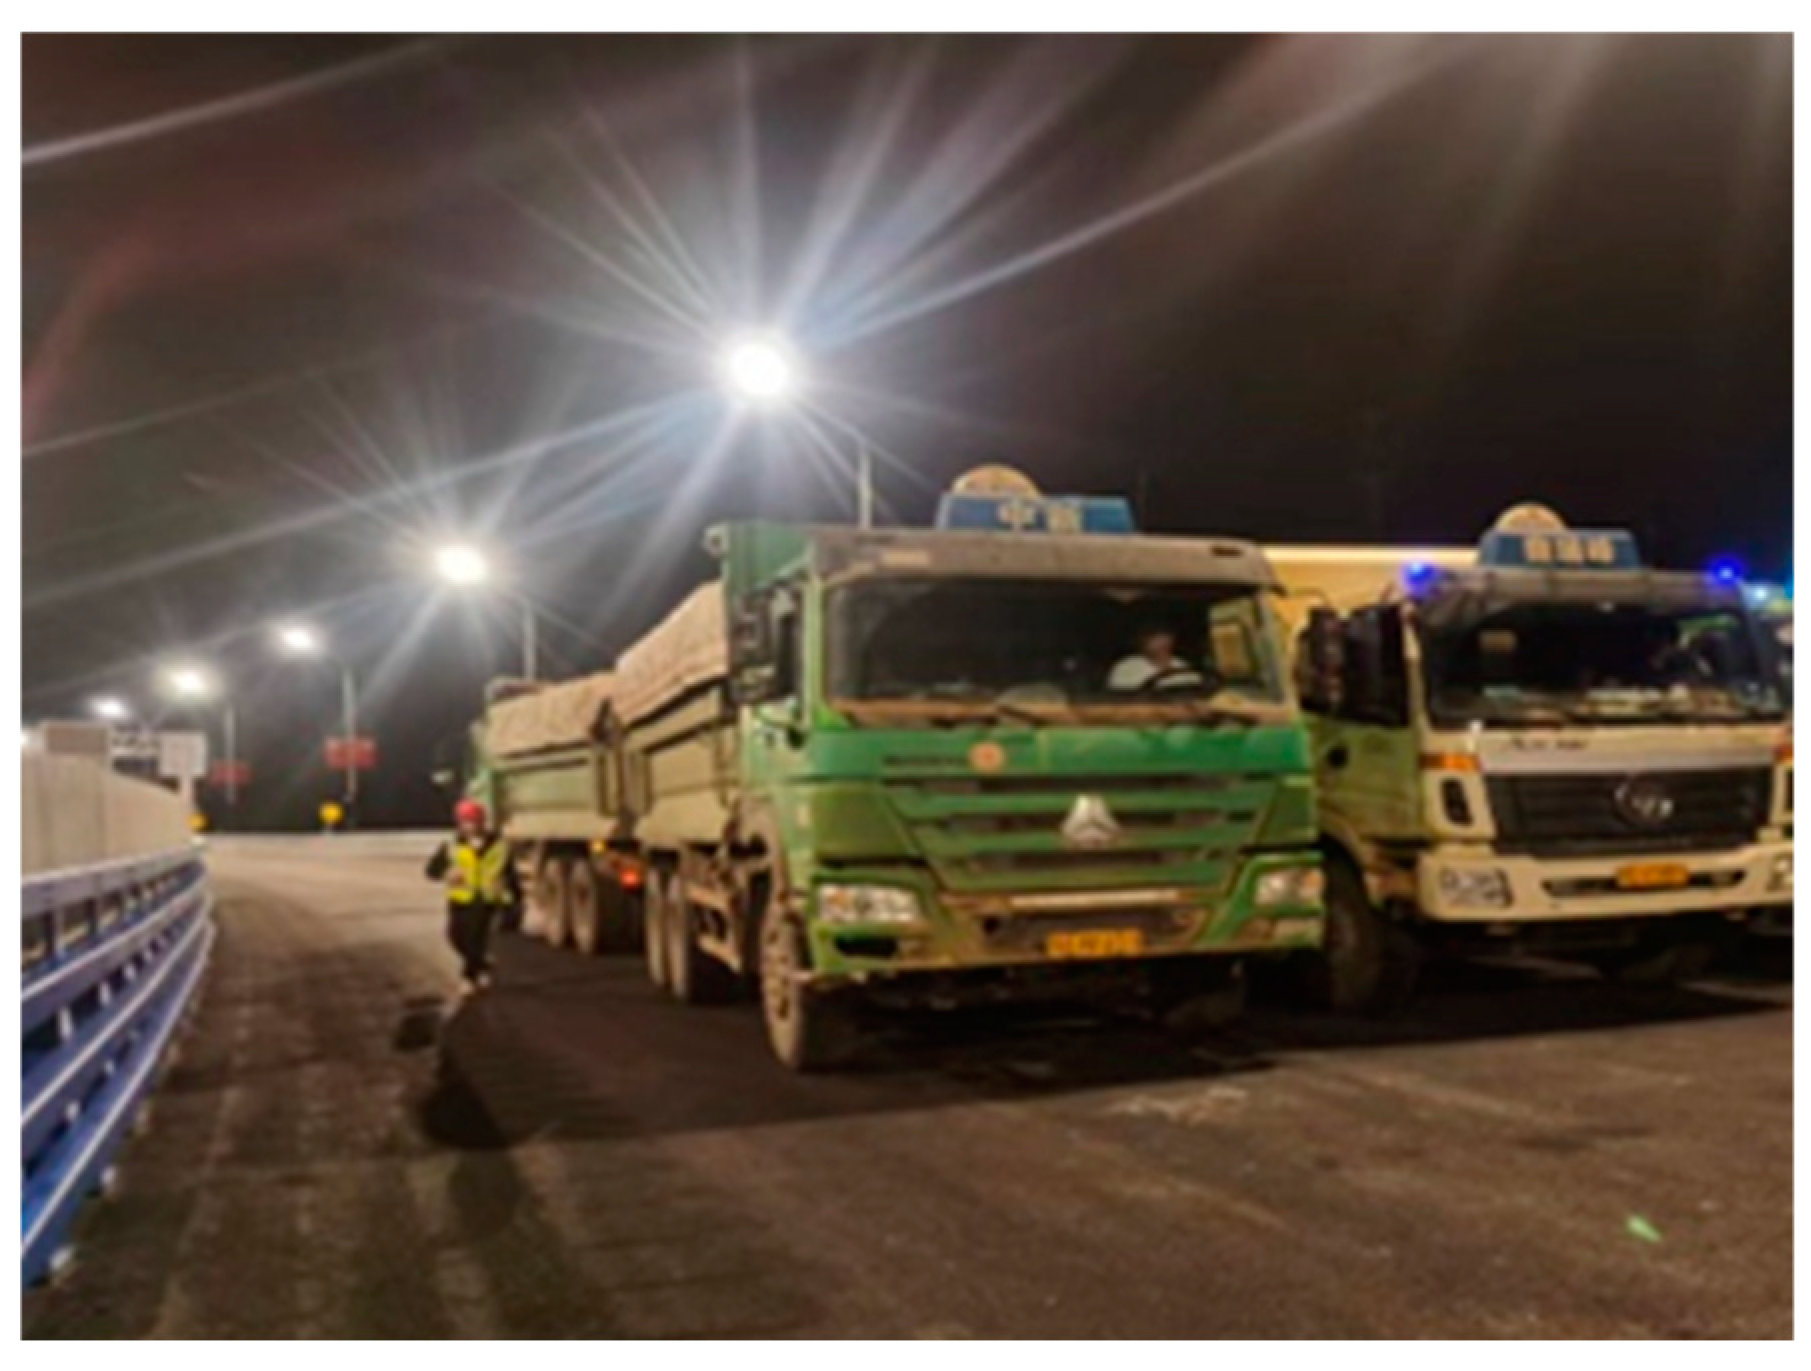
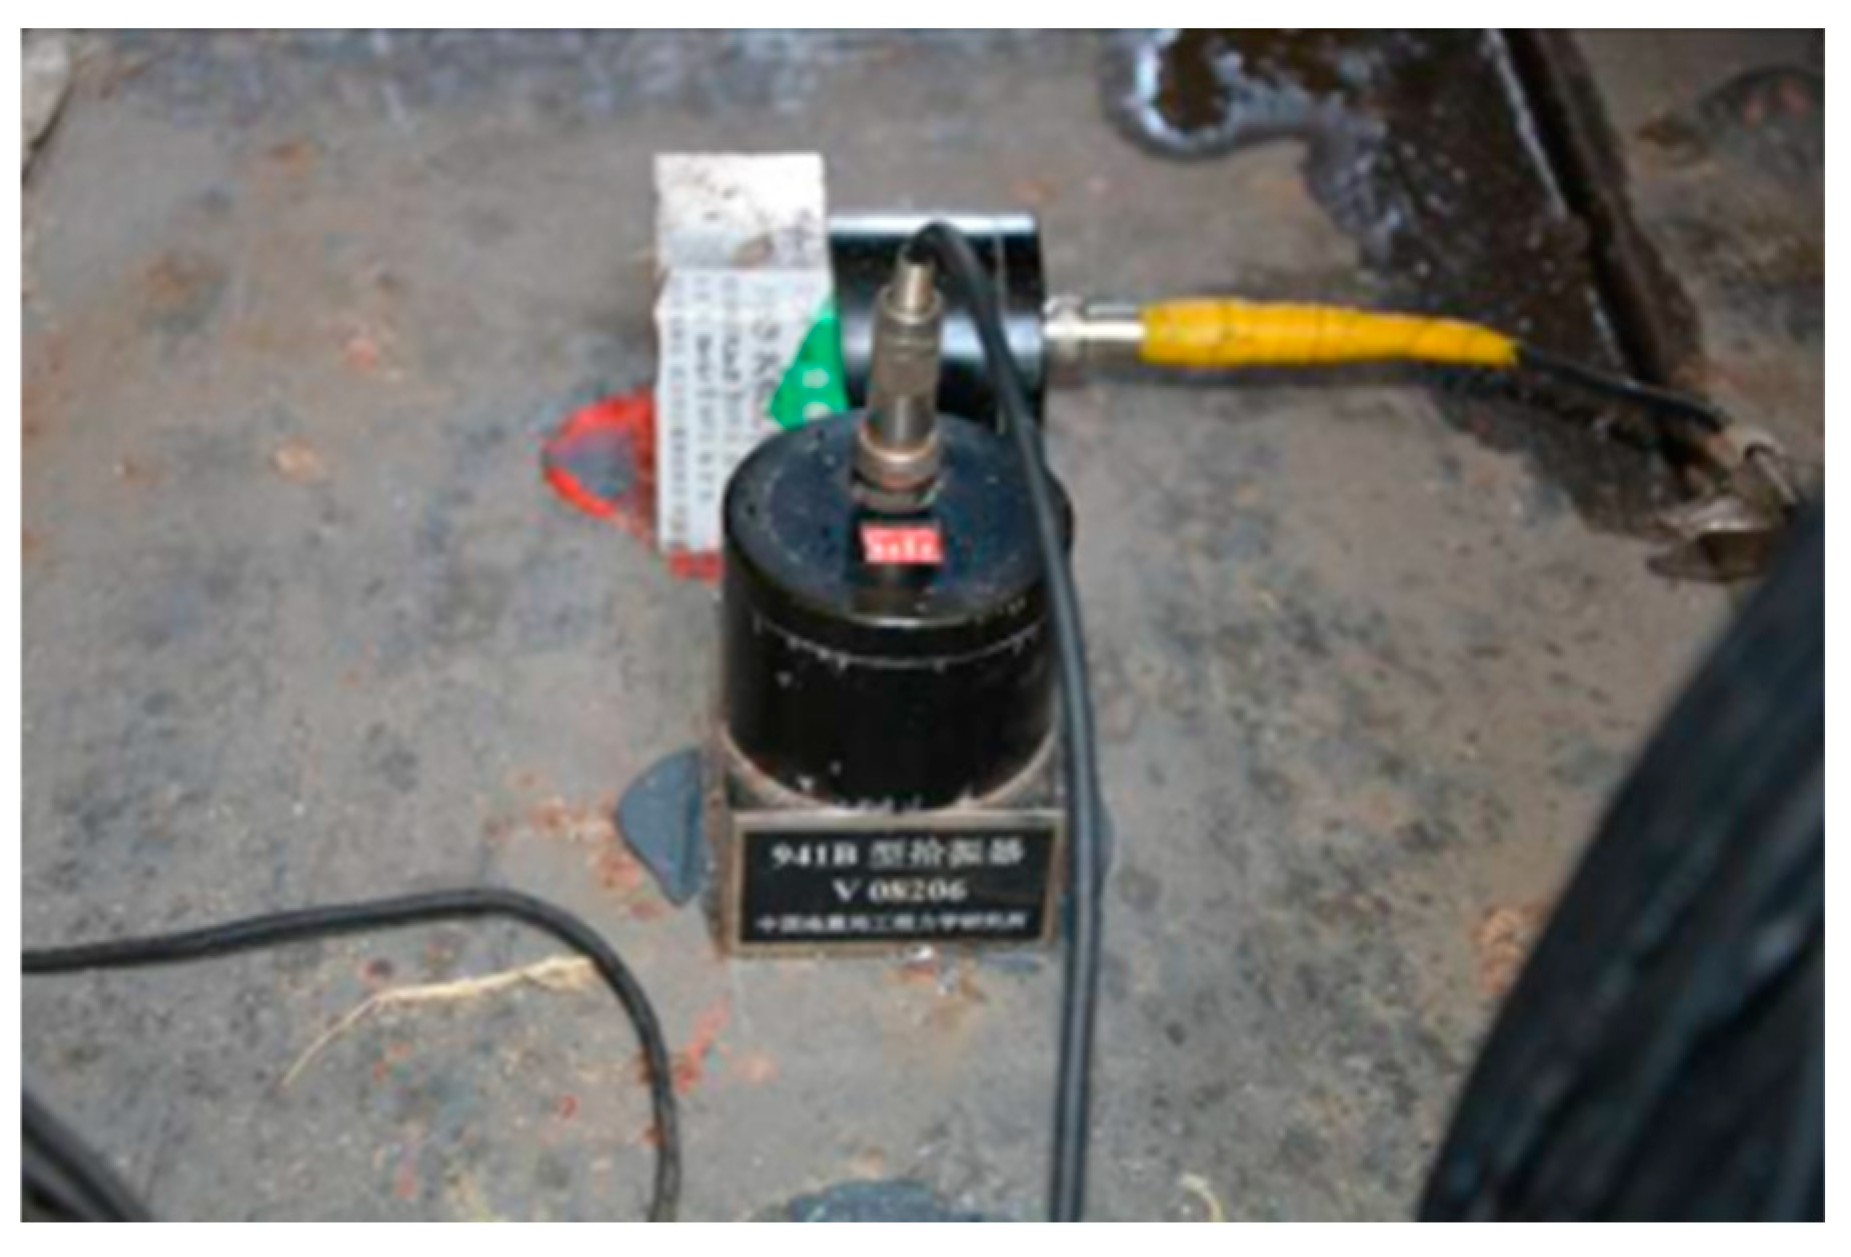
A vehicle field test was conducted on the main bridge(The layout diagram of measurement points for vehicle field test as shown in Figure 23), employing two loading vehicles each weighing approximately 30 tons, arranged side by side to travel synchronously (as shown in Figure 24). They passed through the bridge at steady speeds of 20, 30, 40, 50, and 60 km/h to test the dynamic vibration amplitudes of the bridge at different speeds. The dynamic vibration amplitudes were used to derive the impact coefficient of the vehicle load on the bridge structure. Based on the measured values (The amplitude sensor as shown in Figure 25) of the dynamic impact coefficient, the performance of the bridge structure during vehicle operation was evaluated.
The vehicle field test results at various measurement points for the road test are presented in Table 9.
From the table above, it can be observed that the maximum vertical amplitude at the measurement points reaches 1.62 mm, occurring at the mid-span of the main beam during the 60 km/h vehicle test. The average amplitude here is 1.34 mm, with a minimum of 1.05 mm. The measured vertical amplitudes show a slight increasing trend with higher vehicle speeds, although not prominently. Regarding horizontal bridge measurements, the maximum amplitude reaches 0.46 mm during the 60 km/h vehicle test at the mid-span of the main beam. Horizontal amplitudes also show a slight increasing trend with higher vehicle speeds, albeit not significantly. An analysis of the table data indicates a dynamic variation in the displacements of the main beam and main arch, with their relationship to vehicle speed not showing clear mutual dependencies. This suggests a lower likelihood of resonance occurring between vehicles and the bridge.
Based on measurements conducted on the main span of Changfeng Bridge, the measured first-order vertical frequency is 0.825 Hz. According to the provisions of the ‘Load Test Methods for Highway Bridge’ (JTG/TJ21-01-2015) [29], the calculated impact coefficient for the bridge is 0.05.
The value of the impact coefficient is taken as
μ = { 0.05   ( f < 1.5   Hz ) 0.1767 ln f 0.0157   ( 1.5   Hz f 14   Hz ) 0.45   ( f   >   14   Hz )
The measured impact coefficients for Changfeng Bridge under unobstructed road conditions are shown in Table 10.
Based on the experiments, the maximum measured impact coefficient for the main bridge during the vehicle field test is 0.03. The theoretical impact coefficient is 0.05. The overall measured result is less than the theoretical impact coefficient, indicating that the bridge stiffness meets the design requirements. The magnitude of the impact coefficient can reflect the structural loading characteristics, bridge deck smoothness, and dynamic properties, thereby indicating the bridge’s resistance to impact [30]. The measured impact coefficients for the bridge span are all lower than the calculated values, indicating that the conversion of the bridge deck system from the original prestressed concrete T-beams to a steel structure has improved the actual dynamic performance of the bridge structure, resulting in a more comfortable driving experience on the bridge deck.

6. Discussion

Post renovation, reductions in dynamic deflection and bending moments have minimized the overall deformation and stress concentration, slowing fatigue damage. Key components like suspenders and arch ribs operate with high safety factors, reducing crack and wear risks and extending maintenance intervals from 5 to an estimated 10 years or more. This decrease in maintenance frequency cuts costs and limits operational disruptions. The enhanced safety margin provides greater fatigue and overload resistance, ensuring stability during unexpected overloads or extreme weather, thereby reducing emergency repair costs.
Dynamic performance evaluations such as natural frequency and impact factor tests in the renovation process ensures that improvements meet safety and serviceability standards. Future projects should integrate such testing as a feedback loop for optimizing designs. The methodology of replacing concrete deck systems with steel decks can be adapted for prestressed concrete bridges, providing a lighter, more durable alternative while addressing issues like deck cracking.
During the renovation, the original bridge deck was replaced with Q345qD steel plates, a high-quality steel specifically designed for bridge construction. Q345qD steel is a low-alloy, high-strength steel with high yield strength, making it suitable for heavy-load structures like bridges. Its strength allows for thinner cross-sections, providing a sufficient load-bearing capacity while reducing the bridge’s self-weight. This lighter structure not only decreases the overall gravitational load but also helps minimize bridge deformation, contributing to a more efficient and stable design. In bridge renovation, weld quality is crucial for structural stability and load-bearing capacity. Q345qD steel, with its excellent weldability, allows for high-quality joints that enhance deck integrity and rigidity, minimizing welding defects and ensuring stability under prolonged loads. For deck materials, dynamic deflection and stress capacity are key to fatigue resistance. Q345qD reduces stress concentration across various speeds and loads, delaying fatigue and cracking and extending the bridge’s fatigue life. The bridge renovation incorporates new materials to enhance the bridge’s performance. However, it is equally important to ensure that the connection between the old and new materials meets the required performance standards. The original main bridge deck’s transverse beam is made of low-alloy high-strength steel 16 Mn, while the steel used in the newly constructed bridge deck structure is Q345qD steel. The two materials are connected through a load-strengthening welding process. After welding, tensile tests are conducted to assess the mechanical properties of the welds. The results show that both the yield strength and tensile strength meet or exceed the standard values of the base material, confirming the welds are acceptable.

7. Conclusions

In response to the recurrent issues of bridge deck deterioration caused by long-term heavy traffic loads, this study focuses on the Changfeng Bridge in Wuhan and proposes a systematic bridge deck upgrading and renovation technology solution. The proposed method involves welding additional high transverse beams onto the existing steel beams, removing the original bridge deck panels and replacing them entirely with orthotropic steel bridge deck panels. Additionally, two steel longitudinal beams are added to the tie girder box. The original bridge deck system, which consisted of structurally simply supported concrete longitudinal beams with a continuous deck system, is reconfigured into an integrally fixed continuous steel structure deck system. By combining finite element analysis with field testing, the dynamic performance of the bridge before and after reinforcement is analyzed, leading to the following conclusions:
(1)
Post renovation, the maximum dynamic deflection at low speeds, specifically 20 km/h and 30 km/h, significantly decreased. At 20 km/h, it dropped from 21.4 mm to 17.9 mm (a 16.4% reduction), and at 30 km/h, from 38.2 mm to 24.2 mm (a 36.6% reduction). This shows that the steel deck structure has enhanced stiffness, reducing deformation. The decreases in dynamic deflection, bending moments, and stress indicate that the upgraded steel deck system performs dynamically better than the original, achieving the intended renovation outcomes.
(2)
Under high-speed vehicle conditions, the bridge deck modification shows limited effectiveness as the steel deck induces more pronounced vibration responses. Future work should focus on further optimizing the bridge structure to improve stability at higher speeds. To reduce the coupling vibrations between the vehicle and the bridge, TMD dampers can be installed after the bridge retrofitting is completed.
(3)
The calculated natural frequencies of the bridge structure closely match the measured values, demonstrating that the established finite element model effectively reflects the actual structural conditions. The slightly higher measured values compared to the calculated ones suggest that the post-renovation bridge structure exhibits increased dynamic stiffness, meeting the design requirements.
(4)
Steel structure bridge deck systems offer advantages such as lightweight, high strength, and structural integrity. However, due to the lightweight nature of steel structures, significant dynamic performance issues may arise under vehicle dynamic loading. Therefore, conducting dynamic load tests on bridges is essential. Through these tests, it is confirmed that the renovated bridge exhibits good dynamic performance, resulting in improved comfort for vehicles traveling on the bridge deck.

Author Contributions

Conceptualization, Z.Z. and J.C.; methodology, Z.Z.; software, Z.W.; validation, Z.Z.; formal analysis, Z.Z.; investigation, J.C.; resources, Z.Z.; data curation, Z.Z.; writing—original draft preparation, Z.Z.; writing—review and editing, Z.Z.; visualization, Z.Z.; supervision, J.C.; project administration, J.C. All authors have read and agreed to the published version of the manuscript.

Funding

This research received no external funding.

Data Availability Statement

Data are contained within the article..

Conflicts of Interest

The authors declare no conflicts of interest.

References

  1. Zhang, J.; Qu, C.; Yi, T.; Li, H.; Wang, Y.; Mei, X. Detecting deck damage in concrete box girder bridges using mode shapes constructed from a moving vehicle. Eng. Struct. 2024, 305, 117726. [Google Scholar] [CrossRef]
  2. Su, N.; Lou, L.; Amirkhanian, A.; Amirkhanian, S.N.; Xiao, F. Assessment of effective patching material for concrete bridge deck -A review. Constr. Build. Mater. 2021, 293, 123520. [Google Scholar] [CrossRef]
  3. Orta, L.; Bartlett, F.M. Sensitivity analysis of restrained shrinkage stresses of concrete deck overlays. Eng. Struct. 2020, 210, 110396. [Google Scholar] [CrossRef]
  4. Haynes, M.A.; Coleri, E.; Sreedhar, S. Impermeable Asphalt Concrete Layer to Protect and Seal Concrete Bridge Decks. Transp. Res. Rec. 2019, 2673, 355–367. [Google Scholar] [CrossRef]
  5. Xu, G.; Xie, W.; Xu, Y.; Xue, S.; Chen, X.; Ma, G. Comparative study on hydrodynamic characteristics of T-deck and box-deck bridges under freak waves. Ocean Eng. 2024, 299, 117301. [Google Scholar] [CrossRef]
  6. Hajibabaee, A.; Khanzadeh Moradllo, M.; Behravan, A.; Ley, M.T. Quantitative measurements of curing methods for concrete bridge decks. Constr. Build. Mater. 2018, 162, 306–313. [Google Scholar] [CrossRef]
  7. Niwa, J.; Fakhruddin; Matsumoto, K.; Sato, Y.; Yamada, M.; Yamauchi, T. Experimental study on shear behavior of the interface between old and new deck slabs. Eng. Struct. 2016, 126, 278–291. [Google Scholar] [CrossRef]
  8. Jeong, Y.; Kainuma, S.; Ahn, J. Structural response of orthotropic bridge deck depending on the corroded deck surface. Constr. Build. Mater. 2013, 43, 87–97. [Google Scholar] [CrossRef]
  9. Wang, B.; Nagy, W.; De Backer, H.; Chen, A. Fatigue process of rib-to-deck welded joints of orthotropic steel decks. Theor. Appl. Fract. Mech. 2019, 101, 113–126. [Google Scholar] [CrossRef]
  10. Chen, L.; Zhang, X.; Ma, W.; Zhang, X. Development and evaluation of a pothole patching material for steel bridge deck pavement. Constr. Build. Mater. 2021, 313, 125393. [Google Scholar] [CrossRef]
  11. Wang, S.; Ke, Z.; Gao, Y.; Zhang, Y. Long-Term In Situ Performance Investigation of Orthotropic Steel Bridge Deck Strengthened by SPS and RPC Solutions. J. Bridge Eng. 2019, 24, 04019054. [Google Scholar] [CrossRef]
  12. Kennedy, S.J.; Martino, A.E. SPS bridge decks for new bridges and strengthening of existing bridge decks. Steel Constr. 2015, 8, 21–27. [Google Scholar] [CrossRef]
  13. Tang, X.B. Analysis of Structural Load Bearing Condition of Orthotropic Steel Plate Deck of a Bridge. World Bridge 2015, 43, 32–37. [Google Scholar]
  14. Ozakgul, K.; Yilmaz, M.F.; Caglayan, B.O. Assessment of an old reinforced concrete open-spandrel arch railway bridge. Structures 2022, 44, 284–294. [Google Scholar] [CrossRef]
  15. Wang, Z.; Der Kiureghian, A. Multiple-support response spectrum analysis using load-dependent Ritz vectors. Earthq. Eng. Struct. Dyn. 2014, 43, 2283–2297. [Google Scholar] [CrossRef]
  16. Wang, Z.L.; Wang, C.H. Analysis and transformation of the causes of vibration disease of Danjiang Bridge in YilanMu. J. China Foreign Highw. 2006, 26, 108–113. [Google Scholar]
  17. Tan, K. Research on the Application of MIDAS in Bridge Load Test. Theory Pract. Contemp. Educ. 2014, 6, 159–162. [Google Scholar]
  18. Doebling, S.W.; Farrar, C.R.; Prime, M.B.; Shevitz, D.W. Damage Identification and Health Monitoring of Structural and Mechanical Systems from Changes in Their Vibration Characteristics: A Literature Review; U.S. Department of Energy Office of Scientific and Technical Information: Oak Ridge, TN, USA, 1996. [Google Scholar] [CrossRef]
  19. Chen, L.; Qian, Z.; Wang, J. Multiscale Numerical Modeling of Steel Bridge Deck Pavements Considering Vehicle–Pave ment Interaction. Int. J. Geomech. 2016, 16, B4015002. [Google Scholar] [CrossRef]
  20. Wei, Y.; Ji, R.; Li, Q.; Song, Z. Mechanical Performance Prediction Model of Steel Bridge Deck Pavement System Based on XGBoost. Appl. Sci. 2023, 13, 2048. [Google Scholar] [CrossRef]
  21. Li, C. Simplified Simulation Method for Vehicle Running Test Based on Triangular Load and Application. Bridge Constr. 2019, 49, 98–103. [Google Scholar]
  22. Qiao, L.; Wu, F.; Zhou, X.; Chen, Y.; Zhang, Y. Research on Point Load Correction Factor Based on Electro-hydraulic Servo Point Load Meter. Rock Mech. Rock Eng. 2024, 57, 5705–5725. [Google Scholar] [CrossRef]
  23. Miao, B.R.; Luo, Y.X.; Peng, Q.M.; Qiu, Y.Z.; Chen, H.; Yang, Z.K. Multidisciplinary design optimization of lightweight carbody for fatigue assessment. Mater. Des. 2020, 194, 108910. [Google Scholar] [CrossRef]
  24. Jia, D.; Zhang, Q.; Xiong, L.; Li, J.; Bu, Y.; Bao, Y. A unified evaluation method for fatigue resistance of riveted joints based on structural stress approach. Int. J. Fatigue 2022, 160, 106871. [Google Scholar] [CrossRef]
  25. Hou, J.; Xu, W.; Chen, Y.; Zhang, K.; Sun, H.; Li, Y. Typical diseases of a long-span concrete-filled steel tubular arch bridge and their effects on vehicle-induced dynamic response. Front. Struct. Civ. Eng. 2020, 14, 867–887. [Google Scholar] [CrossRef]
  26. Liu, Y.; Zhang, Q.; Bu, Y.; Bao, Y. Static and fatigue performance of steel bridge decks strengthened with air-cured UHPC. Structures 2022, 41, 203–214. [Google Scholar] [CrossRef]
  27. Cheynet, E.; Daniotti, N.; Jakobsen, J.B.; Snæbjörnsson, J. Improved long-span bridge modeling using data-driven identification of vehicle-induced vibrations. Struct. Control Health Monit. 2020, 27, e2574. [Google Scholar] [CrossRef]
  28. Su, X.; Mao, J.; Wang, H.; Gao, H.; Guo, X.; Zong, H. Vortex-Induced Vibration of Long Suspenders of a Long-Span Suspension Bridge and Its Effect on Local Deck Acceleration Based on Field Monitoring. Struct. Control Health Monit. 2024, 2024, 1472626. [Google Scholar] [CrossRef]
  29. JTG/T J21-01-2015; Load Test Methods for Highway Bridge. Ministry of Transport of the People’s Republic of China: Beijing, China, 2015.
  30. Deng, L.; Yu, Y.; Zou, Q.; Cai, C.S. State-of-the-Art Review of Dynamic Impact Factors of Highway Bridges. J. Bridge Eng. 2015, 20, 04014080. [Google Scholar] [CrossRef]
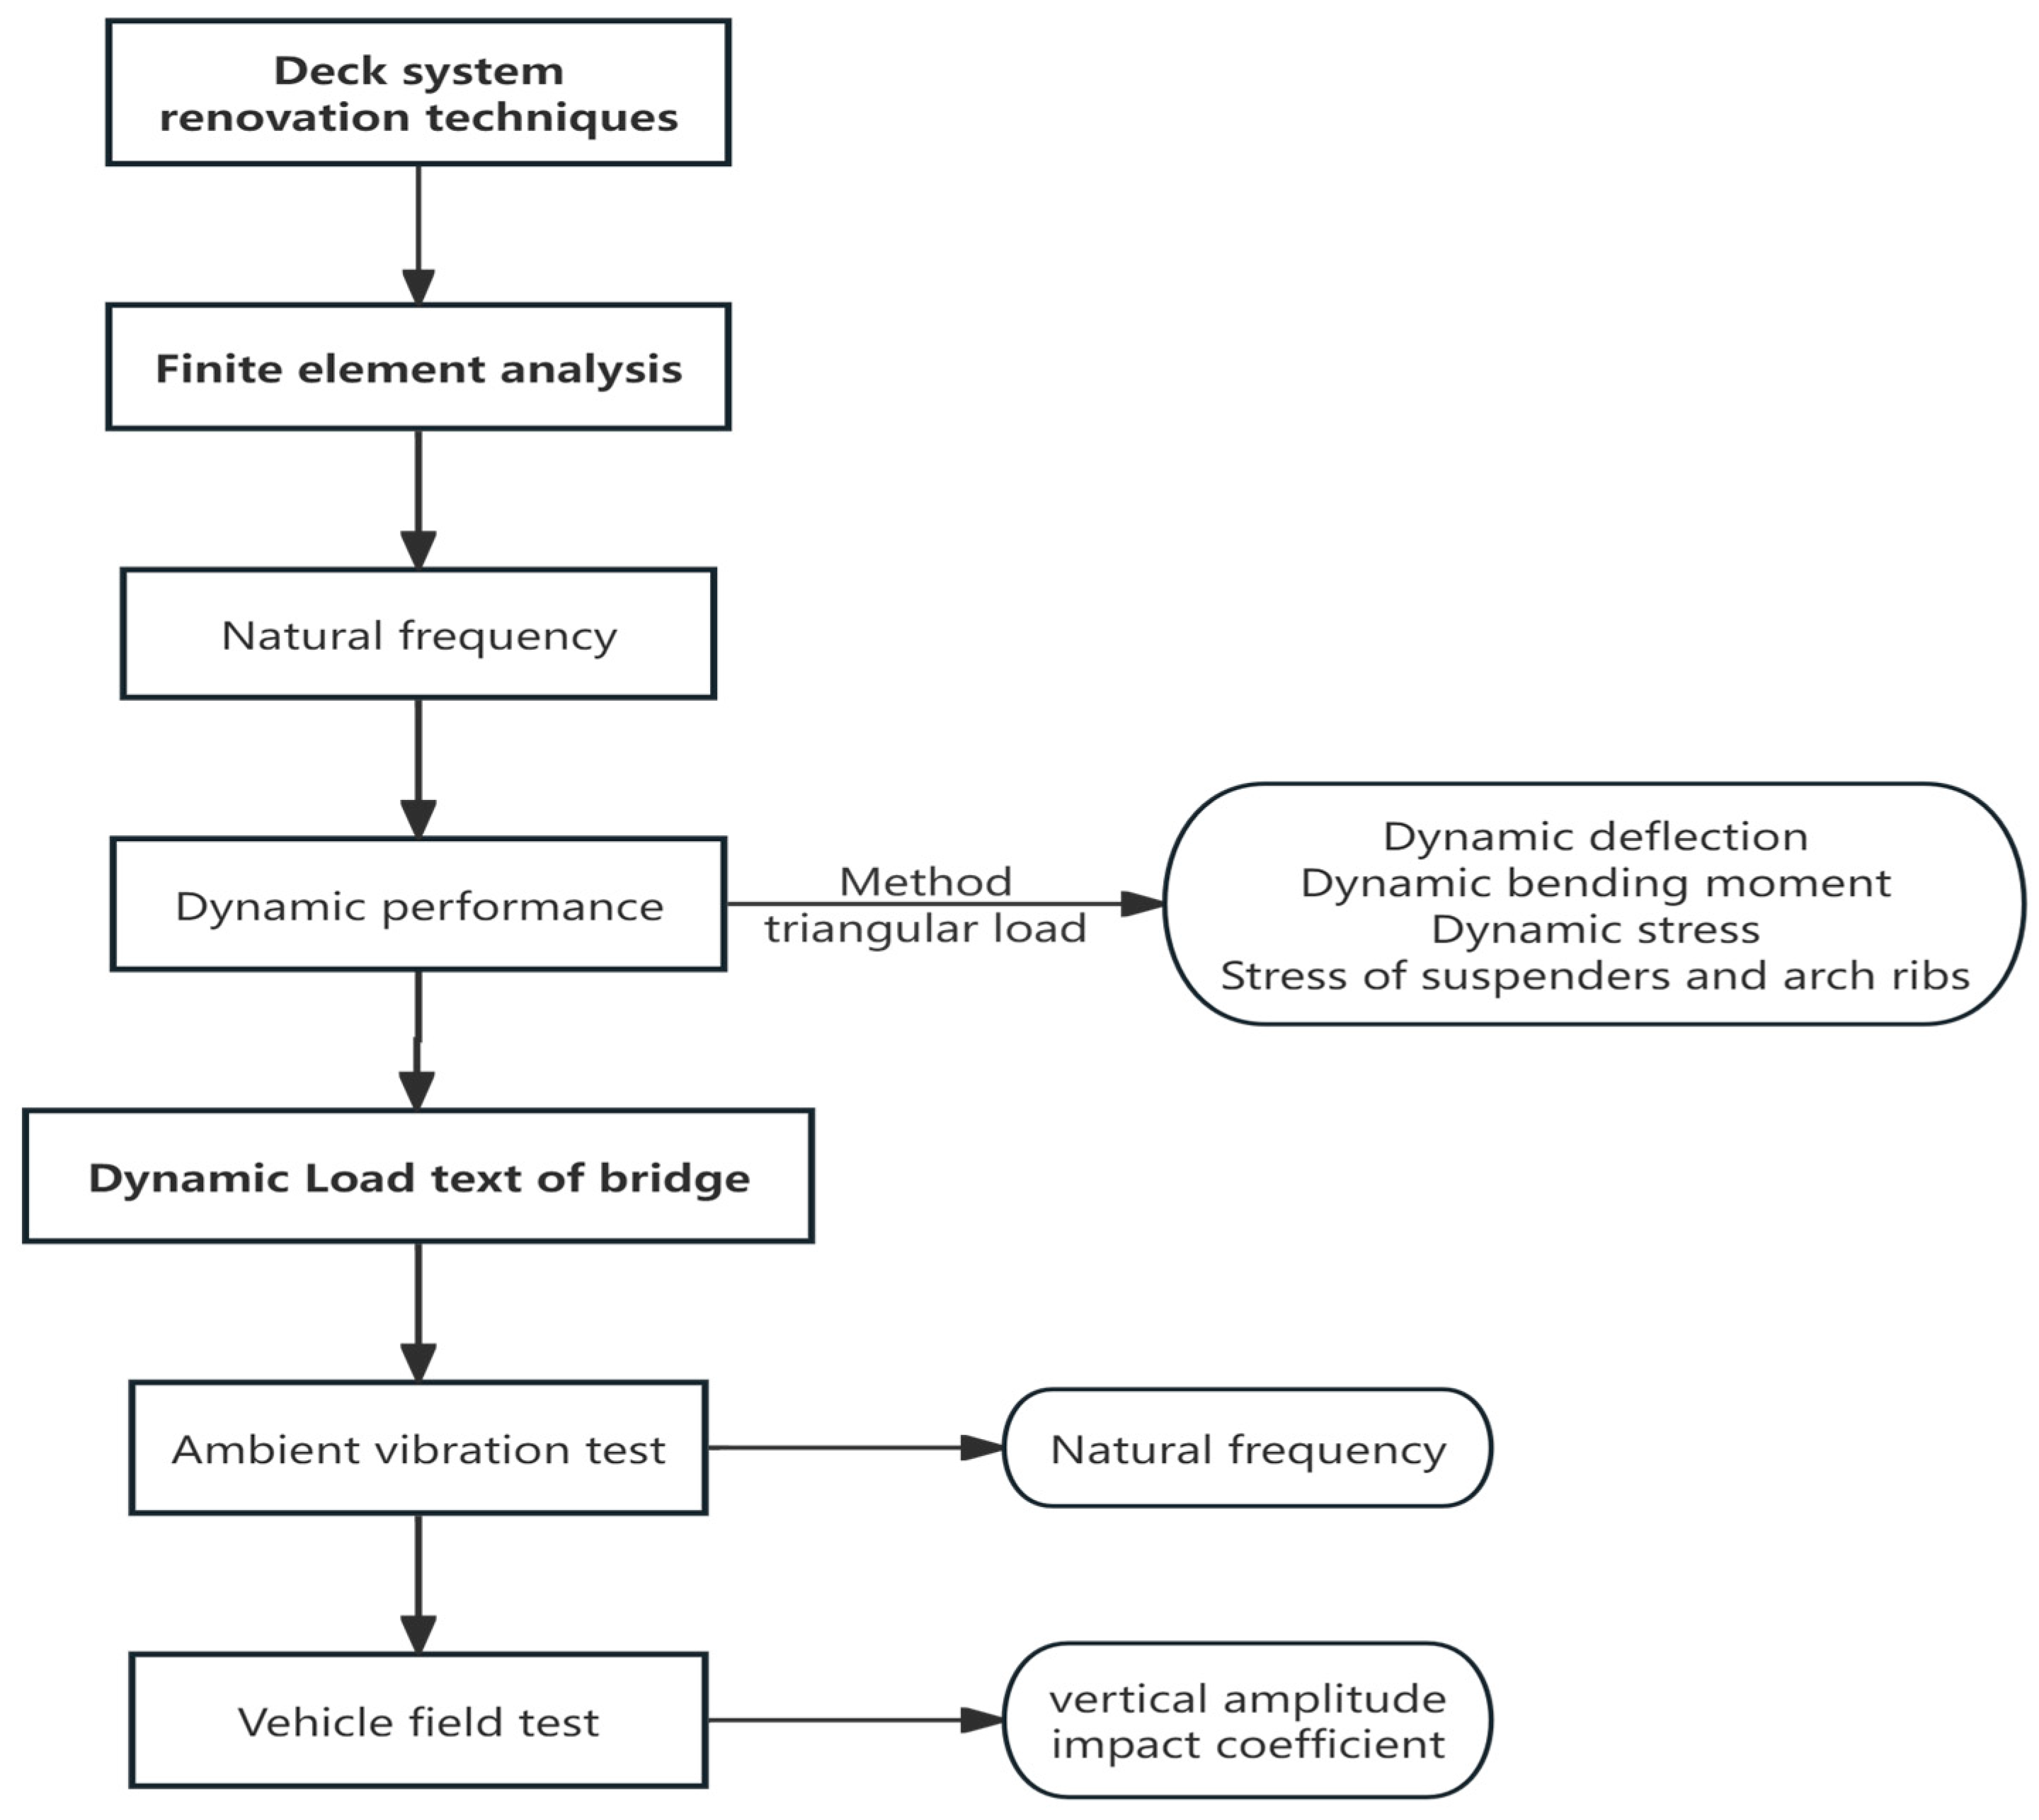
Figure 1. Schematic diagram.
Buildings 14 03891 g001
Figure 2. Overview of the bridge.
Buildings 14 03891 g002
Figure 3. Schematic diagram of crack distribution in the original bridge.
Buildings 14 03891 g003
Figure 4. Renovation design plan.
Buildings 14 03891 g004
Figure 5. The 1/4 top surface of the bridge deck. (The shaded areas in the figure represent the newly constructed sections of the bridge deck system in this project).
Buildings 14 03891 g005
Figure 6. Structure of added steel stringer.
Buildings 14 03891 g006
Figure 7. Model 1.
Figure 7. Model 1.
Buildings 14 03891 g007
Figure 8. Model 2.
Figure 8. Model 2.
Buildings 14 03891 g008
Figure 9. Time history function of triangular load.
Buildings 14 03891 g009
Figure 10. Diagram of vehicle arrangement.
Buildings 14 03891 g010
Figure 11. Vehicle load simulation on Midas/Civil.
Buildings 14 03891 g011
Figure 12. Before and after bridge renovation dynamic deflection at different vehicle speeds.
Buildings 14 03891 g012
Figure 13. Contour lines of displacement—dynamic deflection. (a) Before renovation; (b) after renovation.
Buildings 14 03891 g013
Figure 14. Before and after bridge renovation dynamic bending moment at different vehicle speeds.
Buildings 14 03891 g014
Figure 15. Internal force diagram of beam elements.
Buildings 14 03891 g015
Figure 16. Before and after bridge renovation dynamic stress at different vehicle speeds.
Buildings 14 03891 g016
Figure 17. Contour lines of displacement—dynamic stress. (a) Before renovation. (b) After renovation.
Buildings 14 03891 g017
Figure 18. Suspender numbering diagram.
Buildings 14 03891 g018
Figure 19. Layout diagram of measurement points for ambient vibration test.
Buildings 14 03891 g019
Figure 20. Instruments and equipment for ambient vibration test.
Buildings 14 03891 g020
Figure 21. Lateral 1st-order vibration (0.375 Hz).
Buildings 14 03891 g021
Figure 22. Vertical 1st-order vibration (0.825 Hz).
Buildings 14 03891 g022
Figure 23. Layout diagram of measurement points for vehicle field test.
Buildings 14 03891 g023
Figure 24. Vehicle field test.
Buildings 14 03891 g024
Figure 25. Photo of amplitude sensor layout.
Buildings 14 03891 g025
Table 1. Relevant contributions in rehabilitation of bridge decks.
StudyFocus AreaKey Contributions
Ningyi Su et al. [2]Repair Materials for Concrete Bridge DecksComprehensive review of repair materials, highlighting variability in mechanical properties and durability. Emphasis on composite system performance.
L. Orta [3]Cracking in Concrete Overlays on Steel SubstratesParametric and sensitivity analysis of cracking under restrained shrinkage. Identified critical variables affecting cracking behavior.
Matthew A. Haynes et al. [4]Waterproof Asphalt MixtureDeveloped a high crack- and rutting-resistant waterproof asphalt mixture to prevent water and deicing salt infiltration.
Guoji Xu et al. [5]Hydrodynamic Characteristics of Bridge DecksStudied hydrodynamics under abnormal wave parameters; recommended reinforcing offshore and onshore load capacities for specific deck types.
Amir Hajibabaee [6]Curing Methods for Concrete DurabilityCompared curing methods; emphasized wet curing’s effectiveness in reducing chemical intrusion and enhancing long-term durability.
Junichiro Niwa et al. [7]Interface Shear Transfer in Concrete Bridge DecksExamined parameters affecting shear transfer between new and old concrete. Highlighted the influence of prestress, reinforcement, and surface roughness.
Young-Soo Jeong [8]Corrosion in Steel Bridge DecksEvaluated structural response of corroded orthotropic steel bridge decks, linking corrosion damage to altered structural behavior.
Leilei Chen [10]Pothole Repairs on Steel Bridge DecksDeveloped a fast-curing cold mix repair material for steel bridge decks, enabling traffic reopening within three hours.
Benjin Wang [9]Pothole Repairs on Steel Bridge DecksDeveloped a fast-curing cold mix repair material for steel bridge decks, enabling traffic reopening within three hours.
Shilei Wang [11]Reinforcement of Steel Bridge DecksCompared reinforcement schemes (sandwich plate system vs. reactive powder concrete); found significant improvement in stress and deformation.
Stephen J. Kennedy [12]Prefabricated Systems for Deck ReplacementDemonstrated up to 70% static load reduction using prefabricated sandwich panel systems; emphasized speed and efficiency in deck replacement.
Table 2. Description of the bridge.
ComponentDescription/Dimensions
LocationWuhan, Hubei Province, China
Main Bridge StructureHalf-through concrete-filled steel tubular (CFST) tied-arch bridge
Total Length/
Rise-to-Span Ratio
372 m/1:5
Main Arch DesignUpper and lower chords: 2 steel pipes each, diameter: 1 m, wall thickness: 14 mm, filled with grade 50 concrete
Arch Rib at Arch FootSolid steel pipe concrete structure (6–7 m submerged during floods for collision protection and strength)
Tie RodsPrestressed, freely slidable, anchored at side span ends with clip-type anchors
Deck Slab SupportInitially simply supported; later continuously supported by suspended crossbeams
Table 3. Material parameter table.
IndexStructure NameMaterialElastic Modulus (MPa)Poisson’s RatioThermal Expansion CoefficientMass Density (kg/m3)Material Type
1PierC503.45 × 1040.21.00 × 10−52.5493 × 10³Isotropic
2SuspenderStand18601.95 × 1050.31.20 × 10−58.0048 × 10³Isotropic
3Arch Rib16 Mn2.00 × 1050.31.20 × 10−57.8498 × 10³Isotropic
4Tie RodStand18601.95 × 1050.31.20 × 10−58.0048 × 10³Isotropic
5Original Abdominal RodComposite material2.06 × 1050.31.20 × 10−57.8498 × 10³Isotropic
6Original Steel Transverse and Longitudinal BeamsQ3452.06 × 1050.31.20 × 10−57.8498 × 10³Isotropic
7Original Bridge
Diagonal Strut
Q3452.06 × 1050.31.20 × 10−57.8498 × 10³Isotropic
8New CrossbeamQ3452.06 × 1050.31.20 × 10−57.8498 × 10³Isotropic
9New Steel Bridge DeckQ345qD2.00 × 1050.31.20 × 10−57.8498 × 10³Isotropic
10New Steel Tie BeamQ3452.06 × 1050.31.20 × 10−57.8498 × 10³Isotropic
Table 4. Natural frequency characteristics table.
IndexBeforeAfterImprovement RateMode of Vibration
10.612 Hz0.734 Hz19.9%Vertical First
Mode Vibration
21.010 Hz1.157 Hz14.6%Vertical Second Mode Vibration
31.791 Hz1.891 Hz5.6%Vertical Third
Mode Vibration
Table 5. Simulation of moving vehicle loads.
Operating ConditionSpeed (km/h)t1 (s)t2 (s)Analysis Time (s)Analysis Time Step (s)
1200.1070.214100.007
2300.0720.14470.005
3400.0540.10860.004
4500.0430.08650.004
5600.0360.07240.003
Table 6. Maximum stress of suspenders.
Operating ConditionPositionStress (σ/MPa)Safety Coefficient (fpk/σ)
1No. 1 Suspender 513.23.8
No. 16 Suspender 516.53.8
2No. 1 Suspender 533.63.7
No. 16 Suspender 529.63.7
3No. 1 Suspender 538.43.6
No. 16 Suspender 540.23.6
4No. 1 Suspender555.13.5
No. 16 Suspender 560.63.5
5No. 1 Suspender 551.63.5
No. 16 Suspender 552.33.5
Table 7. Maximum stress of arch ribs.
Operating ConditionPositionStress (σ/MPa)
1No. 1 Suspender of Side Span159.2
No. 32 Suspender of Mid-Span157.7
2No. 1 Suspender of Side Span159.6
No. 32 Suspender of Mid-Span155.2
3No. 1 Suspender of Side Span161.3
No. 32 Suspender of Mid-Span158.7
4No. 1 Suspender of Side Span158.3
No. 32 Suspender of Mid-Span161.2
5No. 1 Suspender of Side Span156.4
No. 32 Suspender of Mid-Span163.2
Table 8. Natural frequency characteristics table of Changfeng bridge.
IndexMeasured Value (Without Vehicle Load)Measured Value (Vehicle Load = 70 t)Calculated ValueMode of VibrationDamping Ratio (%)
10.382 Hz0.375 Hz0.366 HzLateral 1st-Order Vibration 1.70
20.692 Hz0.681 Hz0.649 HzLateral 2nd-Order Vibration 1.20
30.856 Hz0.825 Hz0.734 HzVertical 1st-Order Vibration 1.48
41.274 Hz1.263 Hz1.157 HzVertical 2nd-Order Vibration1.45
52.339 Hz2.331 Hz1.891 HzVertical 3rd-Order Vibration /
63.17 Hz3.15 Hz2.53 HzVertical 4th-Order Vibration /
Table 9. Vehicle field test results at various measurement points.
PositionSpeed (km/h)AverageMaximum
102030405060
VerticalUpstreamL/4 Main Arch0.200.180.220.240.220.230.210.24
L/2 Main Arch0.240.250.300.300.290.340.290.34
3L/4 Main Arch0.140.150.200.210.180.210.180.21
L/4 Main Beam0.740.840.950.960.860.990.890.99
L/2 Main Beam1.151.001.311.321.351.541.281.54
3L/4 Main Beam0.660.680.860.910.820.910.800.91
DownstreamL/4 Main Arch0.190.190.220.220.200.250.210.25
L/2 Main Arch0.290.240.330.310.340.370.310.37
3L/4 Main Arch0.200.190.230.230.240.280.230.28
L/4 Main Beam0.770.840.930.980.921.140.931.14
L/2 Main Beam1.051.181.411.411.331.621.341.62
3L/4 Main Beam0.790.760.990.990.961.060.921.06
HorizontalUpstreamL/2 Main Arch0.090.100.100.120.120.120.110.12
L/4 Main Beam0.240.240.260.320.310.280.270.32
L/2 Main Beam0.320.350.370.370.390.460.380.46
3L/4 Main Beam0.170.190.220.260.230.240.220.26
DownstreamL/4 Main Beam0.150.180.180.210.200.200.190.21
L/2 Main Beam0.320.300.350.410.430.420.370.43
3L/4 Main Beam0.170.180.210.250.240.230.210.25
Table 10. The measured impact coefficients (μ) from the vehicle field test.
TypeSpeed (km/h)Maximum
102030405060
Impact
Coefficient
0.010.030.020.020.020.030.03
0.010.030.030.030.020.03
Disclaimer/Publisher’s Note: The statements, opinions and data contained in all publications are solely those of the individual author(s) and contributor(s) and not of MDPI and/or the editor(s). MDPI and/or the editor(s) disclaim responsibility for any injury to people or property resulting from any ideas, methods, instructions or products referred to in the content.