Article

Disparities Between Older Adults’ Potential and Realized Access to Community-Based Care: A Multilevel Analysis of Geo-Referenced Check-In Data from Senior Centers in Nanjing, China

1
The Bartlett School of Architecture, University College London, London WC1E 6BT, UK
2
School of Architecture, Southeast University, Nanjing 210096, China
*
Author to whom correspondence should be addressed.
Buildings 2024, 14(12), 3900; https://doi.org/10.3390/buildings14123900
Submission received: 22 October 2024 / Revised: 13 November 2024 / Accepted: 14 November 2024 / Published: 6 December 2024
(This article belongs to the Section Architectural Design, Urban Science, and Real Estate)

Abstract

:
Community-based care services offered by senior centers are vital for supporting older adults’ independent living. The number of senior centers has escalated in China in recent years. Despite scholarly interest in the potential accessibility of senior centers, research on older adults’ realized access remains scarce. Using the geo-referenced check-in data of 2382 users of senior centers in Nanjing, China, this study aims to fill this gap by examining the disparities between older adults’ potential and realized access to senior centers and the influence of multilevel spatial and non-spatial factors. This study indicates that potential access is often significantly overestimated compared with the actual accessibility of senior centers, with older adults’ distances of realized access (mean = 1319 m) being considerably greater than potential access (mean = 325 m). Spatial and regression analyses confirm that older adults living in newly built, lower-priced houses in the inner city are more likely to travel longer distances to reach senior centers. Spatial proximity is less effective in predicting realized access for those living further from senior centers. Instead, the location and service quality of senior centers play a more prominent role. These findings enrich our understanding of older adults’ access to community-based care, informing planning and policy interventions for the development of age-friendly communities.

1. Introduction

Offering accessible services for older populations is a key dimension in developing age-friendly cities and communities [1]. Compared to the younger generations, older adults have increased demand for supportive services but decreased levels of mobility [2,3]. Designed to offer a spectrum of easily accessible services to older residents, community-based services have become prevalent in the world. As a representative form of community-based facilities, senior centers have proliferated in many developed countries, such as the US, Canada, Australia, and Singapore, since the 1970s, forming a vital part of the infrastructure of age-friendly cities and communities [4]. A substantial body of research has demonstrated that the instrumental and emotional support provided by senior centers is invaluable for the independent living of older adults, and that participation in these centers significantly enhances their mental and physical well-being [5,6].
In China, the escalating aging population has prompted policymakers to embrace community-based services in recent years. This shift has resulted in a notable increase in the establishment of senior centers across the country [7]. For instance, in Nanjing, the city on which this study was conducted, over 700 senior centers were constructed between 2014 and 2020 [8], with the goal of ensuring that every elderly resident has access to at least one senior center within 500 m (about 10 minutes’ walk) of their residence [9]. Major Chinese cities, including Beijing, Shanghai, Wuhan, Hangzhou, and Nanjing, have recently revised their policies and planning regulations to encourage the development of senior centers in both existing and newly developed residential areas [10].
Given that the majority of senior center users reside in their own homes, they must rely on walking, cycling, or public transportation to reach these facilities. Therefore, accessibility is a pivotal factor in the success of senior centers and the effectiveness of community-based services. Whether and to what extent senior centers or other elderly care facilities are accessible for older people have attracted increasing attention from planning and geographical scholars in recent years, revealing their uneven distribution in various urban contexts [11,12,13,14,15]. However, most existing studies focus on measuring ‘potential access’ [16,17,18], i.e., the spatial proximity or availability of services; the knowledge on ‘realized access’, i.e., older people’s actual usage or travel behaviors to senior centers, remains scattered. Specifically, we know little about how exactly senior centers are spatially accessed by older adults, whether realized access deviates from potential access, and what factors influence older adults’ realized access.
In recent years, emerging ICT technologies have enabled the collection of fine-grained geo-behavioral data in various scenarios, which can be used to explore realized access and usage behaviors, as well as to make comparisons between potential and realized access. Recently, we have seen researchers using cellphone data to investigate older people’s access to parks [19], revealing that realized traveling distance is longer than expected.
This paper aims to address the research gap regarding older adults’ access to community-based services by investigating both potential and realized access, using the geo-referenced check-in data of 2382 older adults from 44 senior centers in Nanjing, China. Specifically, this study is structured to address three key research questions: (1) To what extent does older adults’ realized access deviate from potential access? (2) Will the disparities between potential and realized access exhibit certain spatial patterns and how? (3) What spatial and non-spatial factors may influence the disparities between older adults’ potential and realized access to senior centers?
To answer these questions, this study will employ a multilevel analytic framework to analyze the disparities between potential and realized access at both user and facility levels. The paper will commence with an overview of the research context, data sources, the analytical framework, and the spatial and statistical methodologies employed. Subsequently, Section 3 will detail the findings from the spatial and statistical analyses conducted at the user and facility levels, which directly respond to the research questions. Section 4 will delve into a discussion of these results, highlighting their implications for accessibility research, urban planning, and policy formulation. Finally, Section 5 will summarize this study’s conclusions and contributions to the field.

2. Literature Review

Building on existing research on health service accessibility [20,21], older adults’ access to senior centers can be delineated into two critical dimensions: potential access and realized (or ‘revealed’) access. Potential access refers to the spatial proximity or availability of services, whereas realized access encompasses the actual usage patterns or travel behaviors in accessing services [20,22]. In recent years, a growing body of scholarly work has concentrated on the accessibility of senior centers, particularly within the contexts of China and South Korea [11,12,13,14]. The majority of these studies have centered on evaluating potential access to senior centers, employing methodologies such as cumulative opportunity measures, gravity-based metrics, or two-step floating catchment areas (2SFCA) to identify inequalities in senior center distribution [16,17,18] or detect a mismatch between demand and supply [14,23]. Examining potential access to senior centers is of great value in guiding urban planning and policymaking. However, there is a noticeable dearth of research on the realized access of older adults to senior centers.
It is widely recognized that studies on potential access can yield biased estimations due to factors such as the arbitrary selection of calculation parameters, the neglect of various aspatial factors, or a reliance on geographically aggregated data [20]. The discrepancies between potential and realized access have been well documented across a spectrum of studies examining access to healthcare facilities [16,24,25], pharmacies [26], parks [19], and food providers [14,24,27]. Researchers have consistently found that individuals travel longer distances in reality to access services than what is estimated by potential access models [26,28,29]. Without accurate and sufficient knowledge of realized access, the estimations of potential access could be misleading for planners and policymakers.
While studies on potential access often emphasize the significance of spatial proximity, realized access is considerably more complex. Over time, a variety of theories, models, and analytic frameworks have been proposed to understand people’s realized access to services. For instance, Rosenstock emphasized individual’s psychological motivations [30]; Suchman addressed the importance of referral systems [31]; Andersen synthesized three sets of factors, including predisposing (e.g., age, gender, education), enabling (e.g., income and transportation), and need (e.g., the level of problems) factors [32]; Joseph and Poyner addressed the influence of factors at both user (e.g., demographic, social, economic and information factors) and facility (e.g., location and service) levels; and Cheng et al. [33] argued that older adults’ realized access to services is the result of geographic access, information access, economic access, and socio-cultural access. In essence, a comprehensive understanding of realized access necessitates a consideration of multilevel and multidimensional factors beyond mere spatial proximity.
Despite the acknowledged importance and complexity of realized access, comparative studies between potential and realized access remain scarce in the literature. A primary reason is that research on realized access demands granular geo-behavioral data, which are often inaccessible to researchers. We have seen a few empirical studies investigating the disparities between potential and realized access to healthcare facilities [16,24,25], pharmacies [26], parks [19], and food providers [14,24,27]. However, these studies have two major weaknesses. Firstly, most of them focus on describing the magnitude of the disparity, with a dearth of research on the multilevel spatial and aspatial factors that influence it. Robitaille and colleagues [28] explored the influence of users’ socio-demographic attributes but neglected the impacts of facility-level factors. Secondly, many studies continue to use geographically aggregated data, and there is a paucity of research on the detailed spatial patterns of disparity, i.e., whether the gap between potential and realized access is more likely to emerge in certain areas rather than others. In summary, the current research on potential and realized access is not comprehensive, indicating a need for more extensive studies that employ fine-grained geo-behavioral data, particularly focusing on spatial patterns and multilevel socio-spatial determinants.
A thorough analysis of older adults’ realized access to senior centers, and particularly the disparities between potential and realized access, will enrich the existing body of literature. Such analysis will offer a more holistic understanding of the challenges and barriers that older adults may encounter in accessing community-based services. This understanding is instrumental in the development of age-friendly cities and communities. Furthermore, insights into the behavioral characteristics of older adults’ realized access will inform researchers on how to refine existing methods for assessing potential access, thereby enhancing the prediction of service accessibility for older populations.

3. Research Context, Materials and Methods

3.1. Research Context and Data

This study was conducted on the Chinese city of Nanjing. China has the largest and one of the most rapidly growing aging populations in the world. As a mega city in eastern China with a population of 9.3 million (Figure 1), over 19 percent of people in Nanjing were aged 60 and over in 2020 [34]. The city plays a leading role in the country in developing community-based elderly care services. Since the year 2014, over 700 senior centers have been established in the municipal area of Nanjing [8]. In the coming decade, the municipal government aims to build senior centers in all residential communities in the city.
Our research area is one district (Jianye District) in the main city of Nanjing, which has 44 senior centers located in diverse urban settings (see Figure 2a,b), ranging from downtown areas with compact street networks, diverse land uses, and dense older populations to more peripheral areas with larger street blocks, newly developed residential communities, and fewer older residents. The social and spatial diversity of the research area serve the purpose of this study well.
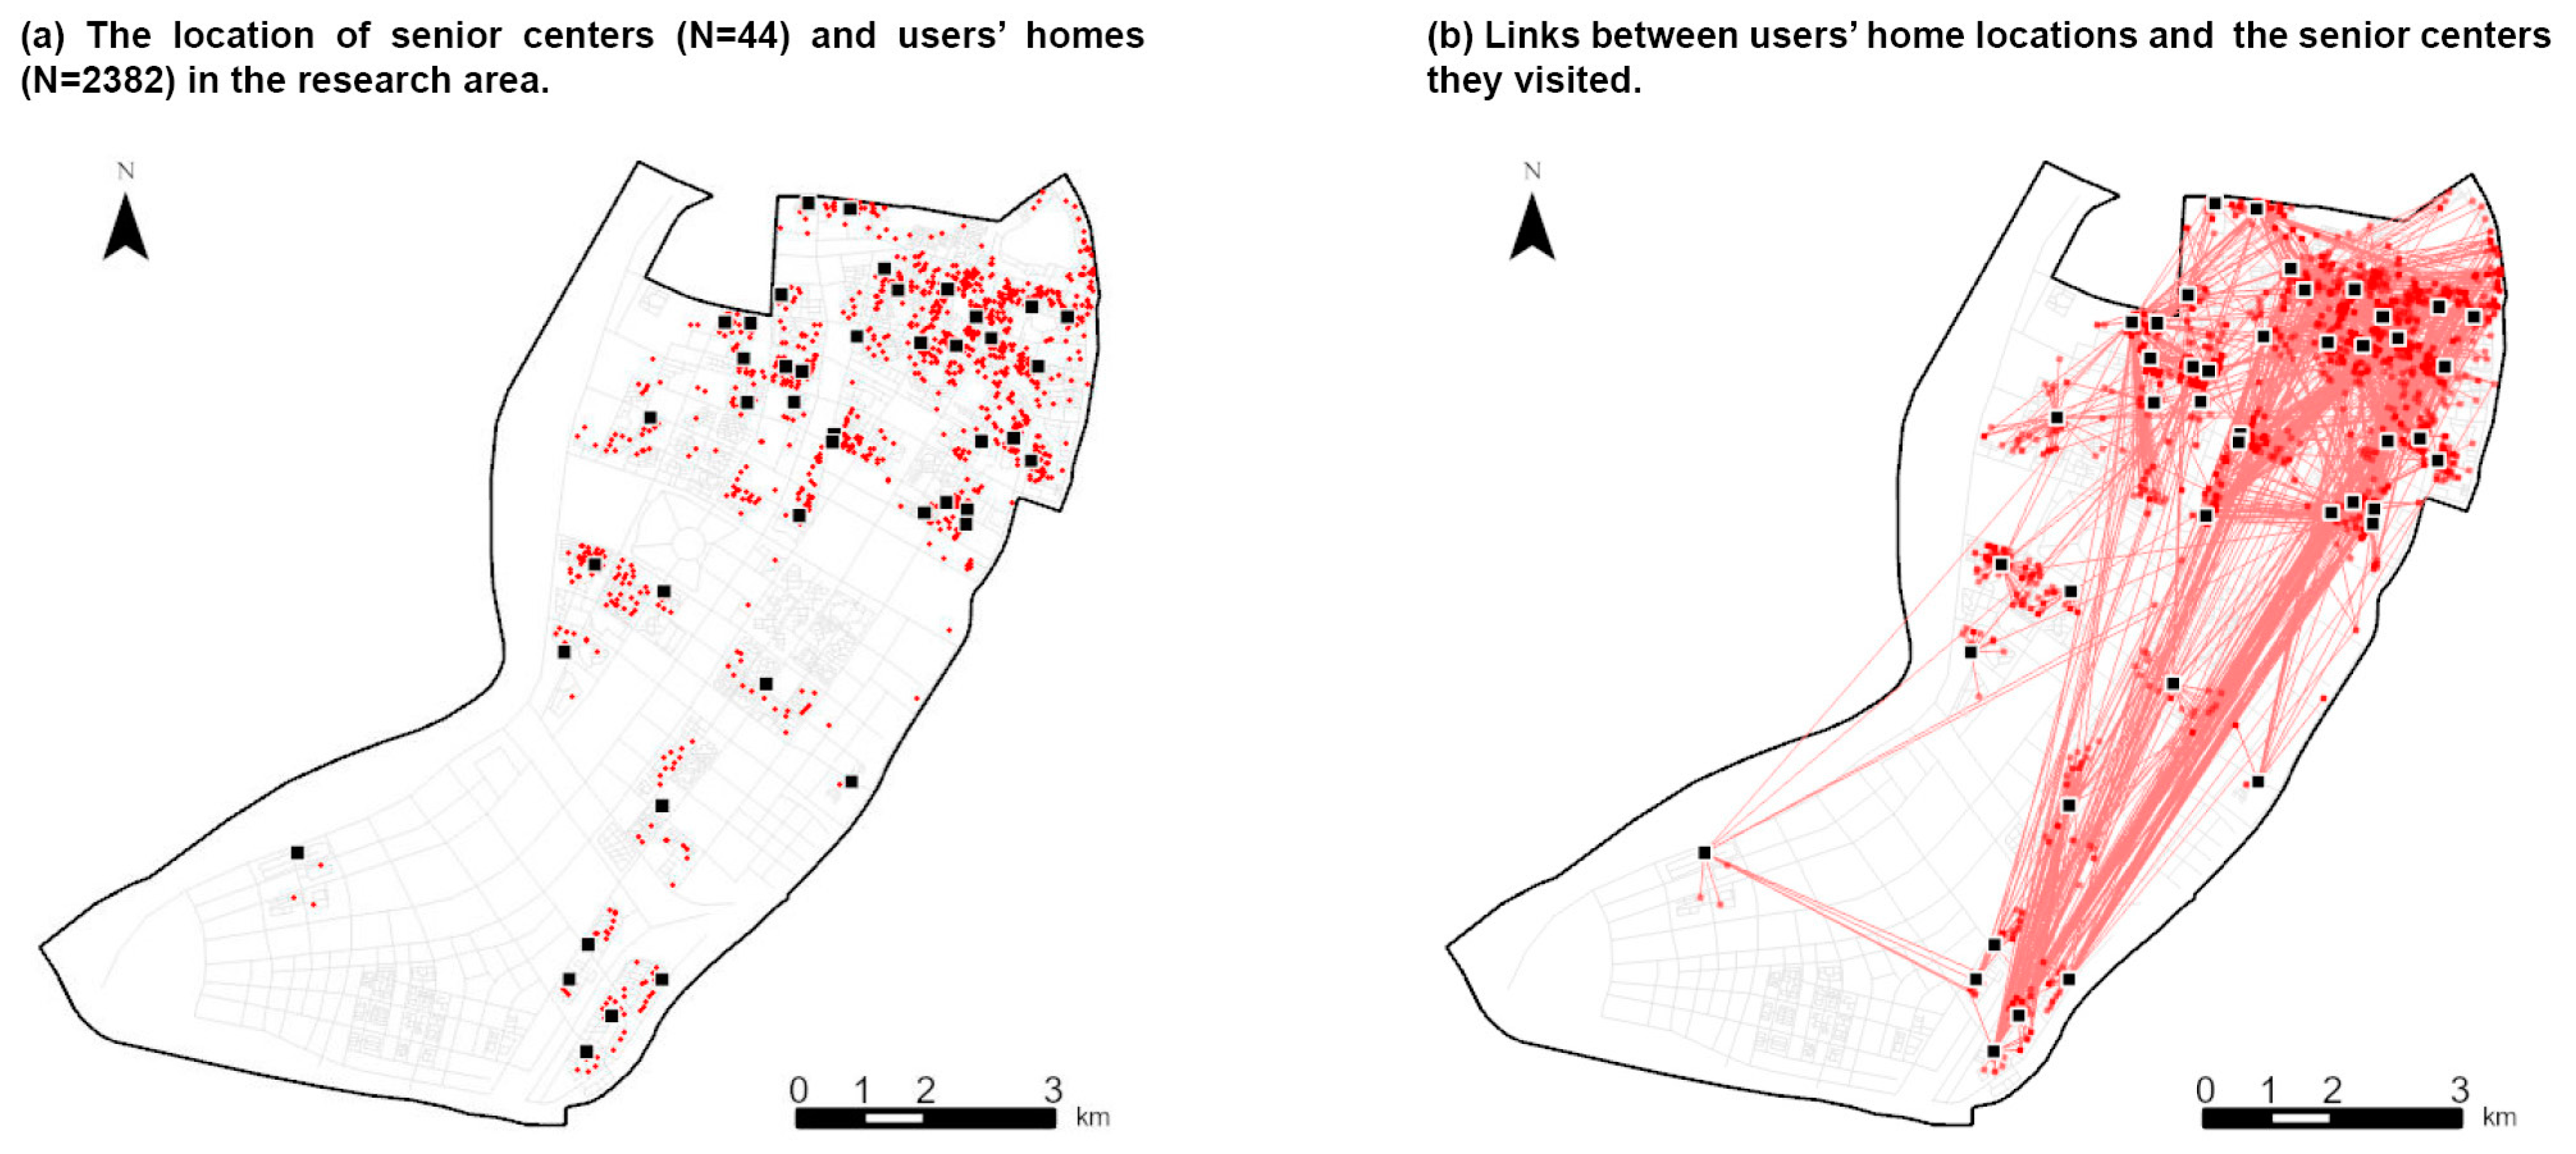
To investigate how senior centers are accessed by older adults, a geo-referenced check-in dataset was employed. The dataset recorded the home addresses and some socio-demographic attributes (age, gender, physical competence, and household composition) of all older adults aged 70 and over ( N = 2382 ) who visited the 44 senior centers in Jianye District from 1 May to 31 December 2020. Figure 3 presents the locations of the senior centers, the home addresses of the users, and the links between users’ home locations and the senior centers they visited. The original data were collected by the Department of Elderly Care Services of Jianye District by recording older adults’ use of service cards in senior centers. The authors were permitted to use the data for research purposes after a formal application process through the ‘Government Open Information’ platform of Nanjing. The research has received ethical approval from the authors’ institution.

3.2. The Multilevel Analytic Framework

Drawing on the conceptual frameworks of realized access to healthcare services established by previous geographers [22,32,35], this study adopts a multilevel analytic framework to delineate and comprehend the disparities between potential and realized access at both the user and facility levels (see Figure 4). This framework advances current empirical research on potential and realized access, which has predominantly concentrated on user-level analysis while neglecting facility-level variations.
We firstly generate models of older adults’ potential and realized access based on the geo-referenced check-in data. Then, the disparities between potential and realized access are characterized by probability and magnitude at both user and facility levels, aiming to answer the question of to what extent older adults’ realized access deviates from potential access. For both levels, the spatial patterns and socio-spatial determinants of the disparities are analyzed, respectively, to examine whether realized access exhibits certain spatial patterns and what factors may influence older adults’ realized access. Based on the framework, we hope to achieve a comprehensive understanding of older adults’ access to community-based services.

3.3. Models, Methods, and Variables

3.3.1. Defining and Characterizing the Disparity Between Potential and Realized Access

In the realm of accessibility studies, potential and realized access have been defined and characterized through diverse methodologies [20]. For example, potential access can be quantified by proximity to facilities, available facilities within a distance, the gravity index, or the 2SFCA method. In contrast, realized access can be assessed by actual travel distances to facilities, frequency, or the probability of service utilization.
Definition of potential and realized access: Given the primary objective of this study is to conduct a direct comparison between potential and realized access, we employ the approach utilized by Gomez et al. [29], Lin et al. [26], and Robitaille et al. [28]. Specifically, our model of potential access is established by linking older adults’ residences to their nearest senior centers, while the model of realized access links older adults’ residences to the senior centers they have actually visited. This approach allows for a more nuanced understanding of the differences between the theoretical potential for access and the actual behaviors exhibited by older adults in their use of senior center services.
Distance of potential and realized access: According to the two definitions, we can measure the distances of potential and realized access at the user and facility levels. For each user, the distance of potential access (PDU) is the metric distance of the shortest route from the user’s home to his/her nearest senior center along street networks, while the distance of realized access (RDU) is the metric distance to the senior center the user actually visits. Accordingly, for each senior center, the distance of potential access (PDC) is the mean value of the PDU of all connected users in the model of potential access, while the distance of realized access (RDC) is the mean value of the RDU of all connected in users in the model of realized access.
Based on these definitions, when an older person visits his/her nearest senior center (the nearest visitor, NV), the distance of potential access equals the distance of realized access; when an older person does not visit his/her nearest senior center (the non-nearest visitor, NNV), the distance of realized access will be longer than that of potential access, and a disparity between potential and realized access occurs. Therefore, we characterize the disparities between potential and realized access from two dimensions: the probability of disparity (PRB) and the magnitude of disparity (MAG).
At the user level, the probability of disparity (PRBU) is a binary variable with the value of 0 or 1, indicating whether an older person visits (0) or does not visit (1) their nearest senior center. For a given user, the magnitude of disparity (MAGU) is the difference between distances of potential access ( P D U ) and realized access ( R D U ), which is expressed as follows:
M A G U = R D U P D U
At the facility level, for a given senior center, the probability of disparity (PRBC) is measured by the proportion of NNV users visiting the center in reality, which is calculated as the total number of NNV users ( N N N V ) divided by the total number of users of the center ( N C ).
P R B C = N N N V / N C
The magnitude of disparity for a given senior center (MAGC) is the difference between the mean values of potential access ( P D C ) and realized access ( R D C ), which is expressed as follows:
M A G C = R D C P D C
The four variables characterize the disparity between potential and realized access at both the user and the facility level, serving as dependent variables in this study. Their descriptive statistics are summarized in Table 1.

3.3.2. Spatial Patterns of the Disparity

The spatial patterns of the disparity between potential and realized access are described by the spatial dependency and spatial heterogeneity of the probability and magnitude at the user and facility levels. For continuous variables of PRBC, MAGU, and MAGC, the spatial dependency is measured by Global Moran’ I [36], which is a commonly used metric in geographic studies, indicating whether a variable exhibits a clustered, dispersed, or random spatial pattern across a geographic area. The value of Global Moran’s I ranges from −1 to 1, where positive values indicate spatial clustering (similar values are located near each other); negative values suggest spatial dispersion (dissimilar values are near each other); and values close to zero imply a random spatial pattern.
The spatial heterogeneity of PRBC, MAGU, and MAGC is described by Local Moran’s I [37], which is a measure of local spatial autocorrelation that identifies clusters or outliers in specific locations within a geographic area. Unlike Global Moran’s I, which assesses spatial patterns across an entire region, Local Moran’s I provides a statistic for each spatial unit, allowing the detection of “hot spots” (clusters of high values) and “cold spots” (clusters of low values). Local Moran’s I is widely used in spatial analysis to identify localized clusters and anomalies, providing a detailed view of spatial patterns that can help in decision-making for regional planning, resource allocation, and other geographically focused initiatives.

3.3.3. Multilevel Social–Spatial Determinants of the Disparity

To explain what factors may influence the disparities between potential and realized access, we examine a series of social and spatial attributes of users and senior centers.
For users, based on previous findings and the availability of data, seven variables are examined. Age, gender, household composition, and physical capacity describe the demographic attributes of older adults. Due to lack of data on older adults’ income and education, we use house price to approximate the social status of older adults, which has been used in previous studies as a substitution for income or social status [19]. We assume that wealthier residents would predominantly live in communities with higher housing prices, and poorer people would likely choose to live in communities with more affordable housing prices [38,39]. Community age indicates how many years ago the house an older adult resides in was built. It is used to differentiate old communities and newly developed communities. Distance to the city center is measured as the distance from an older adult’s home to the city center of Nanjing along street networks. The variables are summarized in Table 2.
For senior centers, eight variables are employed to describe their attributes relating to population, location, and service quality. The density of the older population is the density of people aged 60 and over in the subdistricts in which senior centers are located. The distance to the city center is the distance from the senior center to the city center of Nanjing along street networks. We also characterize the location of senior centers by their closeness to several public amenities that are frequented by older adults, including commercial amenities (retails and restaurants), public transportation (bus and metro stations), local medical centers, and parks. Closeness to these amenities may influence older adults’ use of senior centers. Closeness is calculated as the accumulation of amenities within 500 m of the senior center weighted by the inverse of their distances to the senior center (distances are calculated along street networks). Two variables are used to measure the service of senior centers. Service quality is a score ranging from 1 (the lowest quality) to 5 (the highest quality) given by local authorities based on the overall assessment of the service quality of senior centers. Facility size is the net internal square meters (m2) of a given senior center. The variables are summarized in Table 3.

3.3.4. Statistic Models

Regression models are employed to examine the relationships between characteristics of disparities and various socio-spatial factors. Considering the data form of the four dependent variables (PRBU, PRBC, MAGU, and MAGC) in this study, two types of regression models are used, which are logistic regression and gamma regression.
Logistic regression is a statistical model commonly used to predict a binary outcome variable (0 or 1) or probability outcome variable (bonded between 0 and 1) based on one or more predictor variables [40]. For instance, it was used to investigate whether or not (represented by 0 or 1) older people visiting senior centers are influenced by various socio-demographic factors [41,42]. In this study, logistic regression was chosen to model PRBU and PRBC. Logistic regression predicts the probability P ( Y = 1 ) that an outcome Y occurs, given predictors X 1 , X 2 , , X n . This probability is expressed as follows:
P Y = 1 X = 1 1 + e ( β 0 + β 1 X 1 + β 2 X 2 + β n X n )
where Y is the binary outcome variable; X 1 , X 2 , , X n are the predictor variables; and β 0 , β 1 , , β n are the coefficients estimated from the data. The model can be rewritten as the logit (log-odds) function, which is a linear function of the predictors:
l o g i t P y = 1 = ln P Y = 1 1 P Y = 1 = β 0 + β 1 X 1 + β 2 X 2 + β n X n
In this formulation, the coefficients β represent the change in the log-odds of the outcome for a one-unit change in each predictor, which is also known as the Odds Ratio, and will be reported in the outcome tables in this paper.
To predict MAGU and MAGC, which are positive, continuous data (i.e., metric distances) with right-skewed distribution (see Table 1), gamma regression models are employed. Gamma regression is suitable for modeling continuous outcomes with non-negative values and right-skewed distributions, as it assumes a gamma distribution for the error terms [43]. Gamma regression is widely used in social and economic studies to model outcome variables such as medical cost [44], income [45], or service usage [46], which are positive and usually right-skewed data from the real world. In gamma regression, the mean ( μ ) of the outcome Y is modeled as a function of predictor variables X 1 , X 2 , , X n through a link function, typically the log link, to ensure positive predictions. The model is specified as follows:
g μ = η = β 0 + β 1 X 1 + β 2 X 2 + β n X n
where g ( · ) is the link function (in this study, g μ = ln ( μ ) ); η is the linear predictor; and β 0 , β 1 , , β n are the regression coefficients estimated from the data. This approach allows us to interpret the exponential form of the regression coefficients. The model can also be rewritten as follows:
μ = e β 0 + β 1 X 1 + β 2 X 2 + β n X n
To assess the goodness of fit of the logistic and gamma regression models, log-likelihood and AIC (Akaike Information Criterion) values are used. For the models with the same predictor variables, a higher log-likelihood value or a lower AIC value indicates a better fit. In addition, to calculate the R 2 values of the regression models, Tjur’s R 2 and Nagelkerke’s R 2 are employed. The former serves as the pseudo R 2 for the logistic regression models, while the latter is used for the gamma regression models.

4. Results

4.1. User-Level Analysis

4.1.1. A General Description of Potential and Realized Access

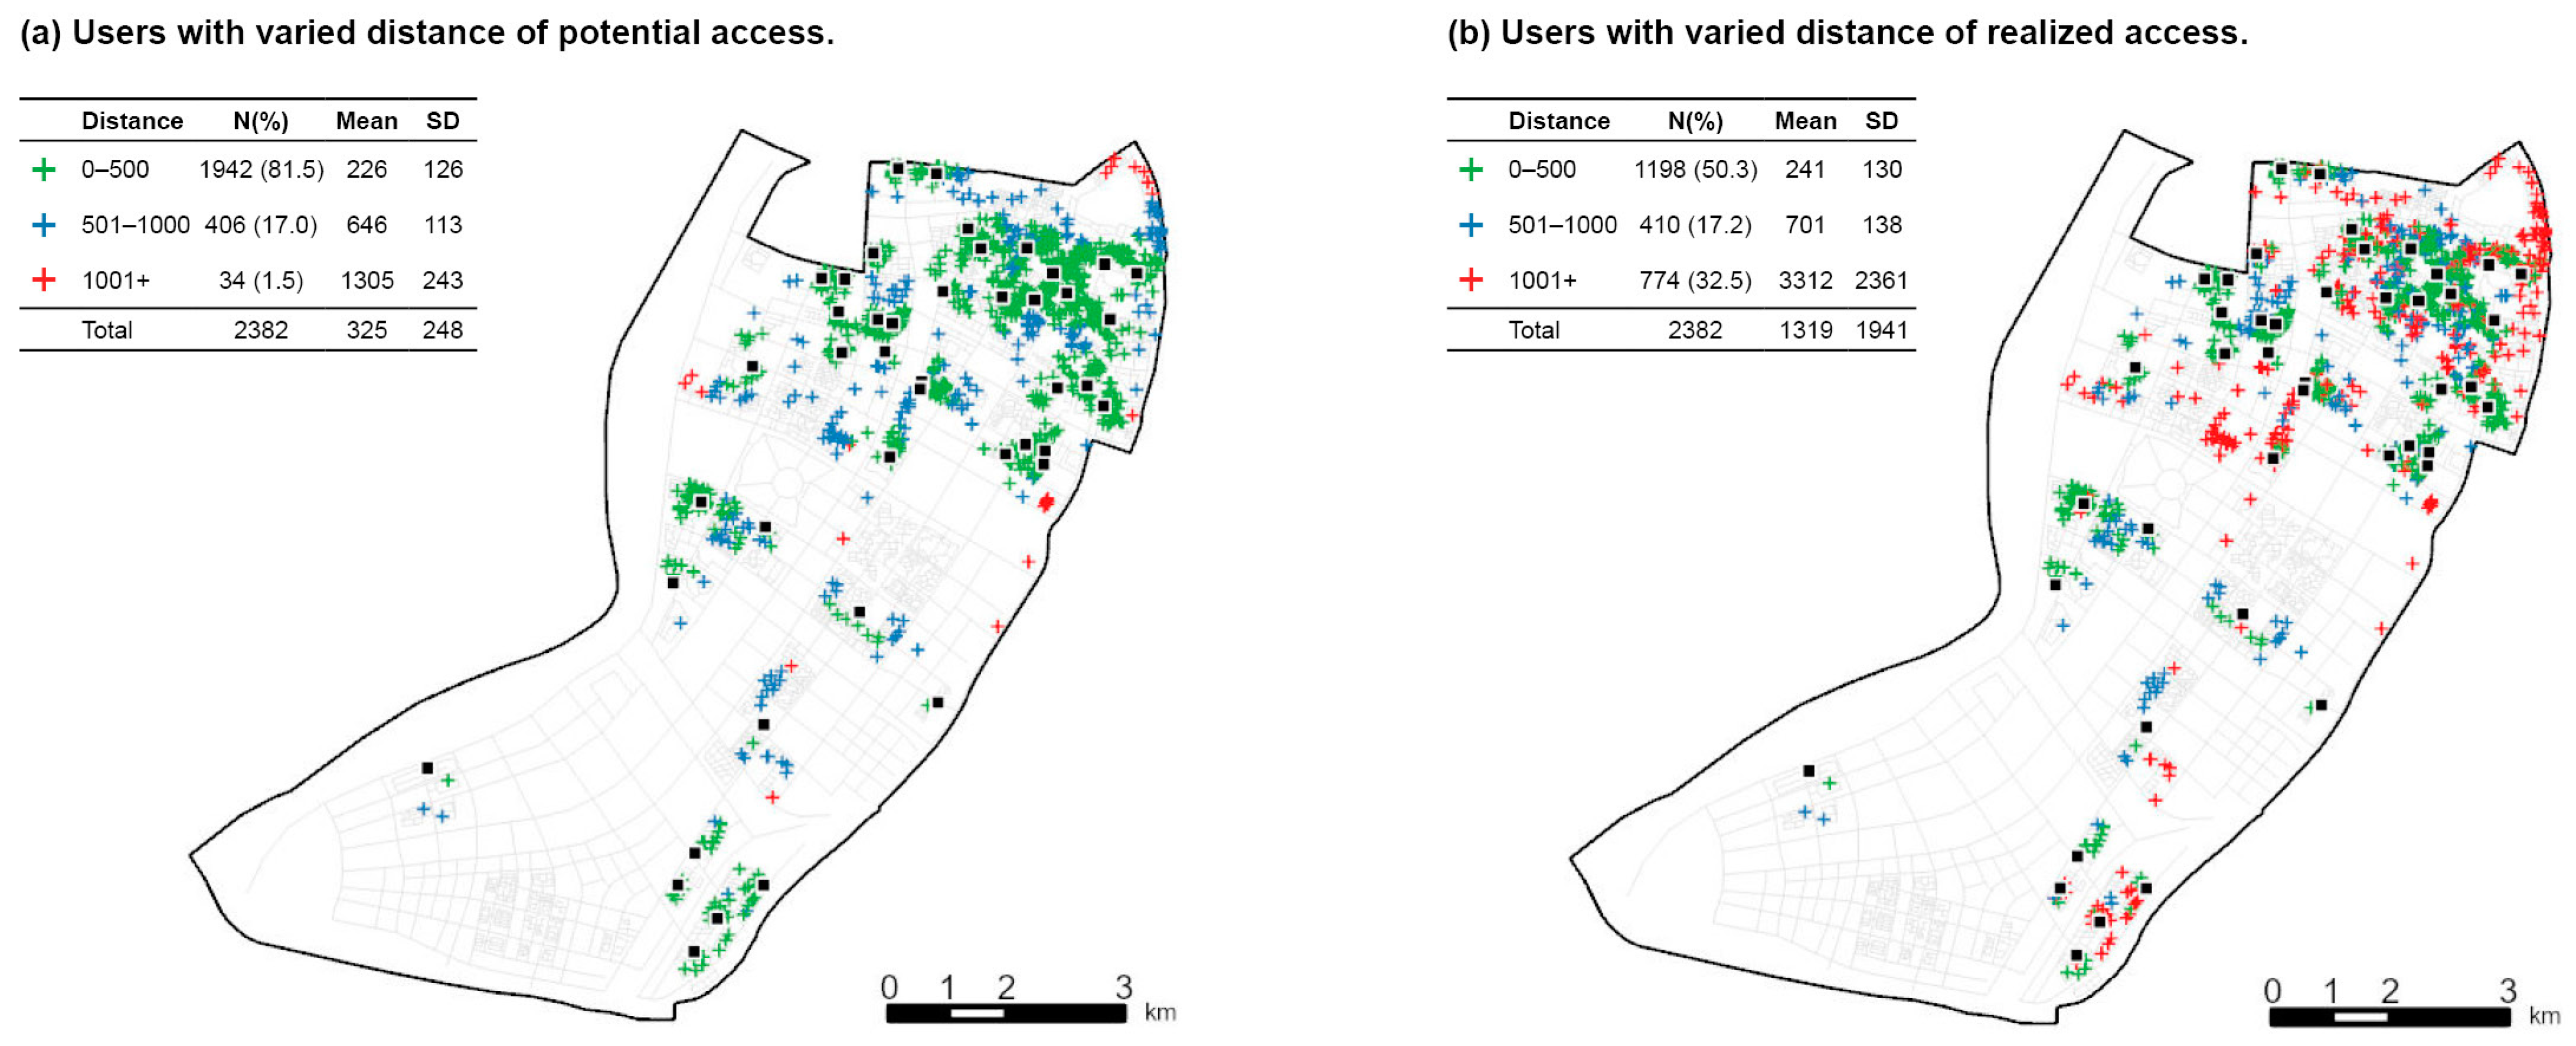
The descriptive statistics and the spatial distribution of the distance of the potential and realized access of users are presented in Figure 5. For potential access, the statistics show that within the research area, the mean distance between older adults’ residences and their nearest senior centers is 325 m, and over 80% ( N = 1942 ) of users live within 500 m of their nearest senior center, with a mean distance of 226 m. Older adults live between 500 and 1000 m from centers, and those beyond 1000 m are relatively few, only accounting for 17% and 1.5%, with average distances of 646 and 1305 m, respectively. The statistic of the distance of potential access largely reflects the achievements of Nanjing in recent years, which has aimed to ensure that all older residents in the city have access to at least one senior center within 500 m of their home.
As for realized access, the mean distance between older adults’ residences and the senior centers they visited is 1319 m, about four times the figure (325 m) of potential access. The mean short and medium distances of realized access are similar to those of potential access, at 241 and 701 m, respectively. However, there is a large portion of long-distance users (32.5%) in reality, with a mean distance of 3312 m, which is about three times the figure (1305 m) proposed by potential access calculations.
As for the spatial distribution of users, it can be seen that compared to the potential access calculations, a large number of users who traveled more than 1000 m emerge in reality. Moreover, long-distance users in reality are clustered in certain areas, such as the red marks in the top-right corner and in the middle of Figure 5b. The clustering of users indicates the spatial heterogeneity of patterns of realized access. Moreover, considering Figure 5a,b, it seems that long-distance users in reality are likely to be those that were designated as medium-distance users in the potential access calculations, i.e., those who live 500 m away from their nearest centers. This spatial pattern seems to suggest that when older adults live far away from senior centers, they are less likely to visit their nearest centers, but rather more distant ones. Nevertheless, this will be further illustrated in the following sections.

4.1.2. The Probability and Magnitude of Disparity

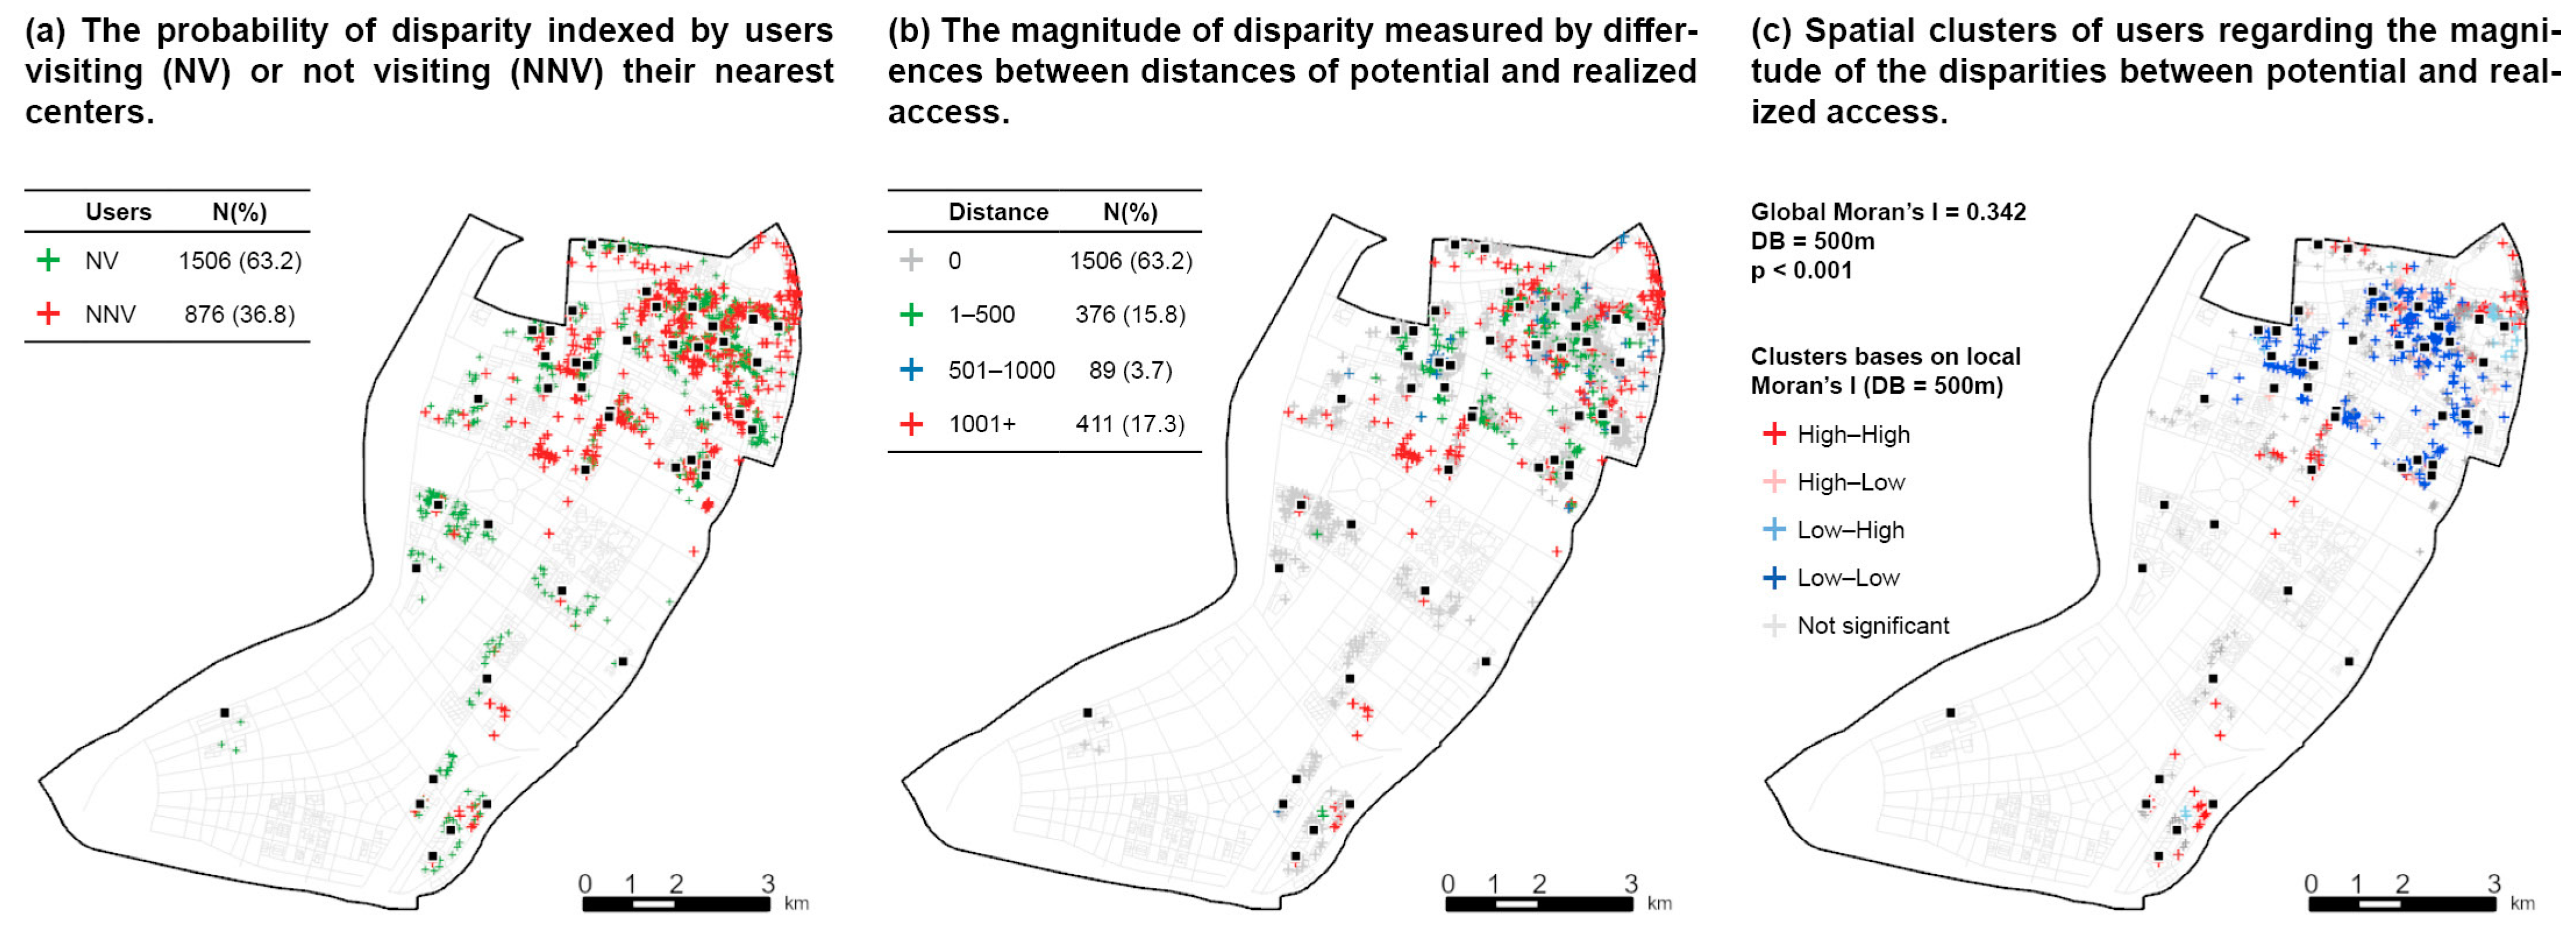
The disparity between potential and realized access at the user level is characterized by probability (PRBU) and magnitude (MAGU). The spatial and statistical distribution of PRBU and MAGU are shown in Figure 6.
As shown in Figure 6a, users not visiting their nearest centers (NNV) comprise about 37% ( N = 876 ), and users visiting their nearest centers (NV) account for 63% ( N = 1506 ). NNV users are more likely to emerge in the inner city (the upper part of the map) compared to the outer city. Moreover, in the middle of the upper part of the map, where senior centers aggregate, there is a mix of NNV and NV users, while in the top-right corner and the middle part of the map, most of the users are NNVs. Compared with Figure 5a, this seems to suggest that when older adults live far from senior centers, they are less likely to visit their nearest centers, although NNVs may also occur in areas where older adults have close access to multiple centers.
The spatial variance of the magnitude of the disparity is presented in Figure 6b,c. Figure 6c presents the result of the tests of global and local spatial autocorrelation with a distance band of 500 m. The statistic of Global Moran’s I ( 0.342 ,   p < 0.001 ) indicates that older adults with a similar degree of magnitude are more likely to be close to each other. The results of Local Moran’s I further reveal the clusters of users. It can be seen that users with low levels of disparity are aggregated in the middle of the upper part of the map. This can be explained as older adults living in these areas have multiple senior centers available within a short distance. Even though they did not visit their nearest ones, the centers they visited are still close to their residence, thus resulting in lower degrees of disparities. In contrast, there are clusters of older adults with high degrees of disparities in the top-right corner and the middle of the map. As presented in Figure 5a, these people need to travel longer distances to their nearest centers.

4.1.3. Spatial and Social Determinants of the Disparity

Regression analysis was performed to examine whether older adults’ socio-spatial attributes significantly influence the probability (PRBU) and magnitude (MAGU) of the disparities between potential and realized access. The results are shown in Table 4. In general, the model on probability performs better than the one on magnitude, with a higher R2 value (0.148 vs. 0.093), higher log-likelihood value (−1383 vs. −3227), and lower AIC value (2788 vs. 6477).
For the probability of the disparity, five factors are significant. Older adults living alone are less likely to visit non-nearest centers ( O d d s   R a t i o = 0.69 ,   p < 0.05 ). Those more likely to visit non-nearest centers are more likely to live in communities which are newly built, with lower house prices, close to the city center and far away from their nearest senior centers. Age and gender are insignificant in affecting whether older people visit their nearest centers. The reason that older residents in communities that are newly built or cheaper are more likely to visit non-nearest centers might be that centers in low-price or newly built communities are not as good as centers in high-price and well-established communities. In comparison, demographic attributes (age and gender) are not that important in determining older people’s choice of senior centers.
As for the magnitude of the disparity, distance of potential access is the only significant factor that is positively associated with magnitude ( O d d s   R a t i o = 1.08 ,   p < 0.001 ), meaning that when older adults live further away from their nearest centers, their actual travel distance to senior centers will deviate greatly from the potential distance. All other factors are insignificant in predicting the magnitude of disparity. Compared to the results on probability, these findings indicate that older people’s actual travel distances to senior centers are less likely to be predicted by individual-level socio-demographic factors. A possible explanation might be that users of senior centers are mostly older people who are healthy and active, whose traveling distances are less likely to be influenced by physical capacity or social status.
It is worth noting that the distance of users’ potential access (PDU) stands out as the only factor that is significant in both of the two models, underscoring its pivotal role in affecting older adults’ patterns of realized access. With the increase in the distance between older people and their nearest centers, older people are less likely to visit their nearest centers, and their actual travel distances deviate greatly from potential distance (see Figure A1 in Appendix A). These findings indicate that the efficacy of spatial proximity as a predictor of realized access diminishes as the distance between older adults and their nearest centers increases. Additionally, the findings also indicate that when calculating older adults’ potential accessibility, utilizing large distance thresholds (or radius) may lead to more significant biases in the results.

4.2. Facility-Level Analysis

4.2.1. A General Description of Potential and Realized Access to Senior Centers

The spatial distribution of senior centers regarding mean distances of potential and realized access is presented in Figure 7. It can be seen that the two figures show distinct spatial patterns. In Figure 7a, centers with higher mean distance of potential access are mainly located in the middle part of the map where senior centers are sparse, while in Figure 7b, centers with higher mean distance of realized access are mainly located in the bottom part of the map, and are newly developed residential areas far away from the inner city. Moreover, most of the centers in the dense residential areas of the inner city (the upper part of the map) have a lower mean distance of realized access. In brief, it seems that senior centers in the outer city are more likely to accept long-distance users.
The heterogeneity among senior centers regarding potential and realized access indicates that senior centers themselves might also play a significant role in affecting older adults’ patterns of realized access. Some centers are significantly more ‘attractive’ for distant users compared to others. Therefore, it is worthwhile to account for facility-level factors when seeking to explain older adults’ realized access.

4.2.2. The Probability and Magnitude of the Disparity Among Senior Centers

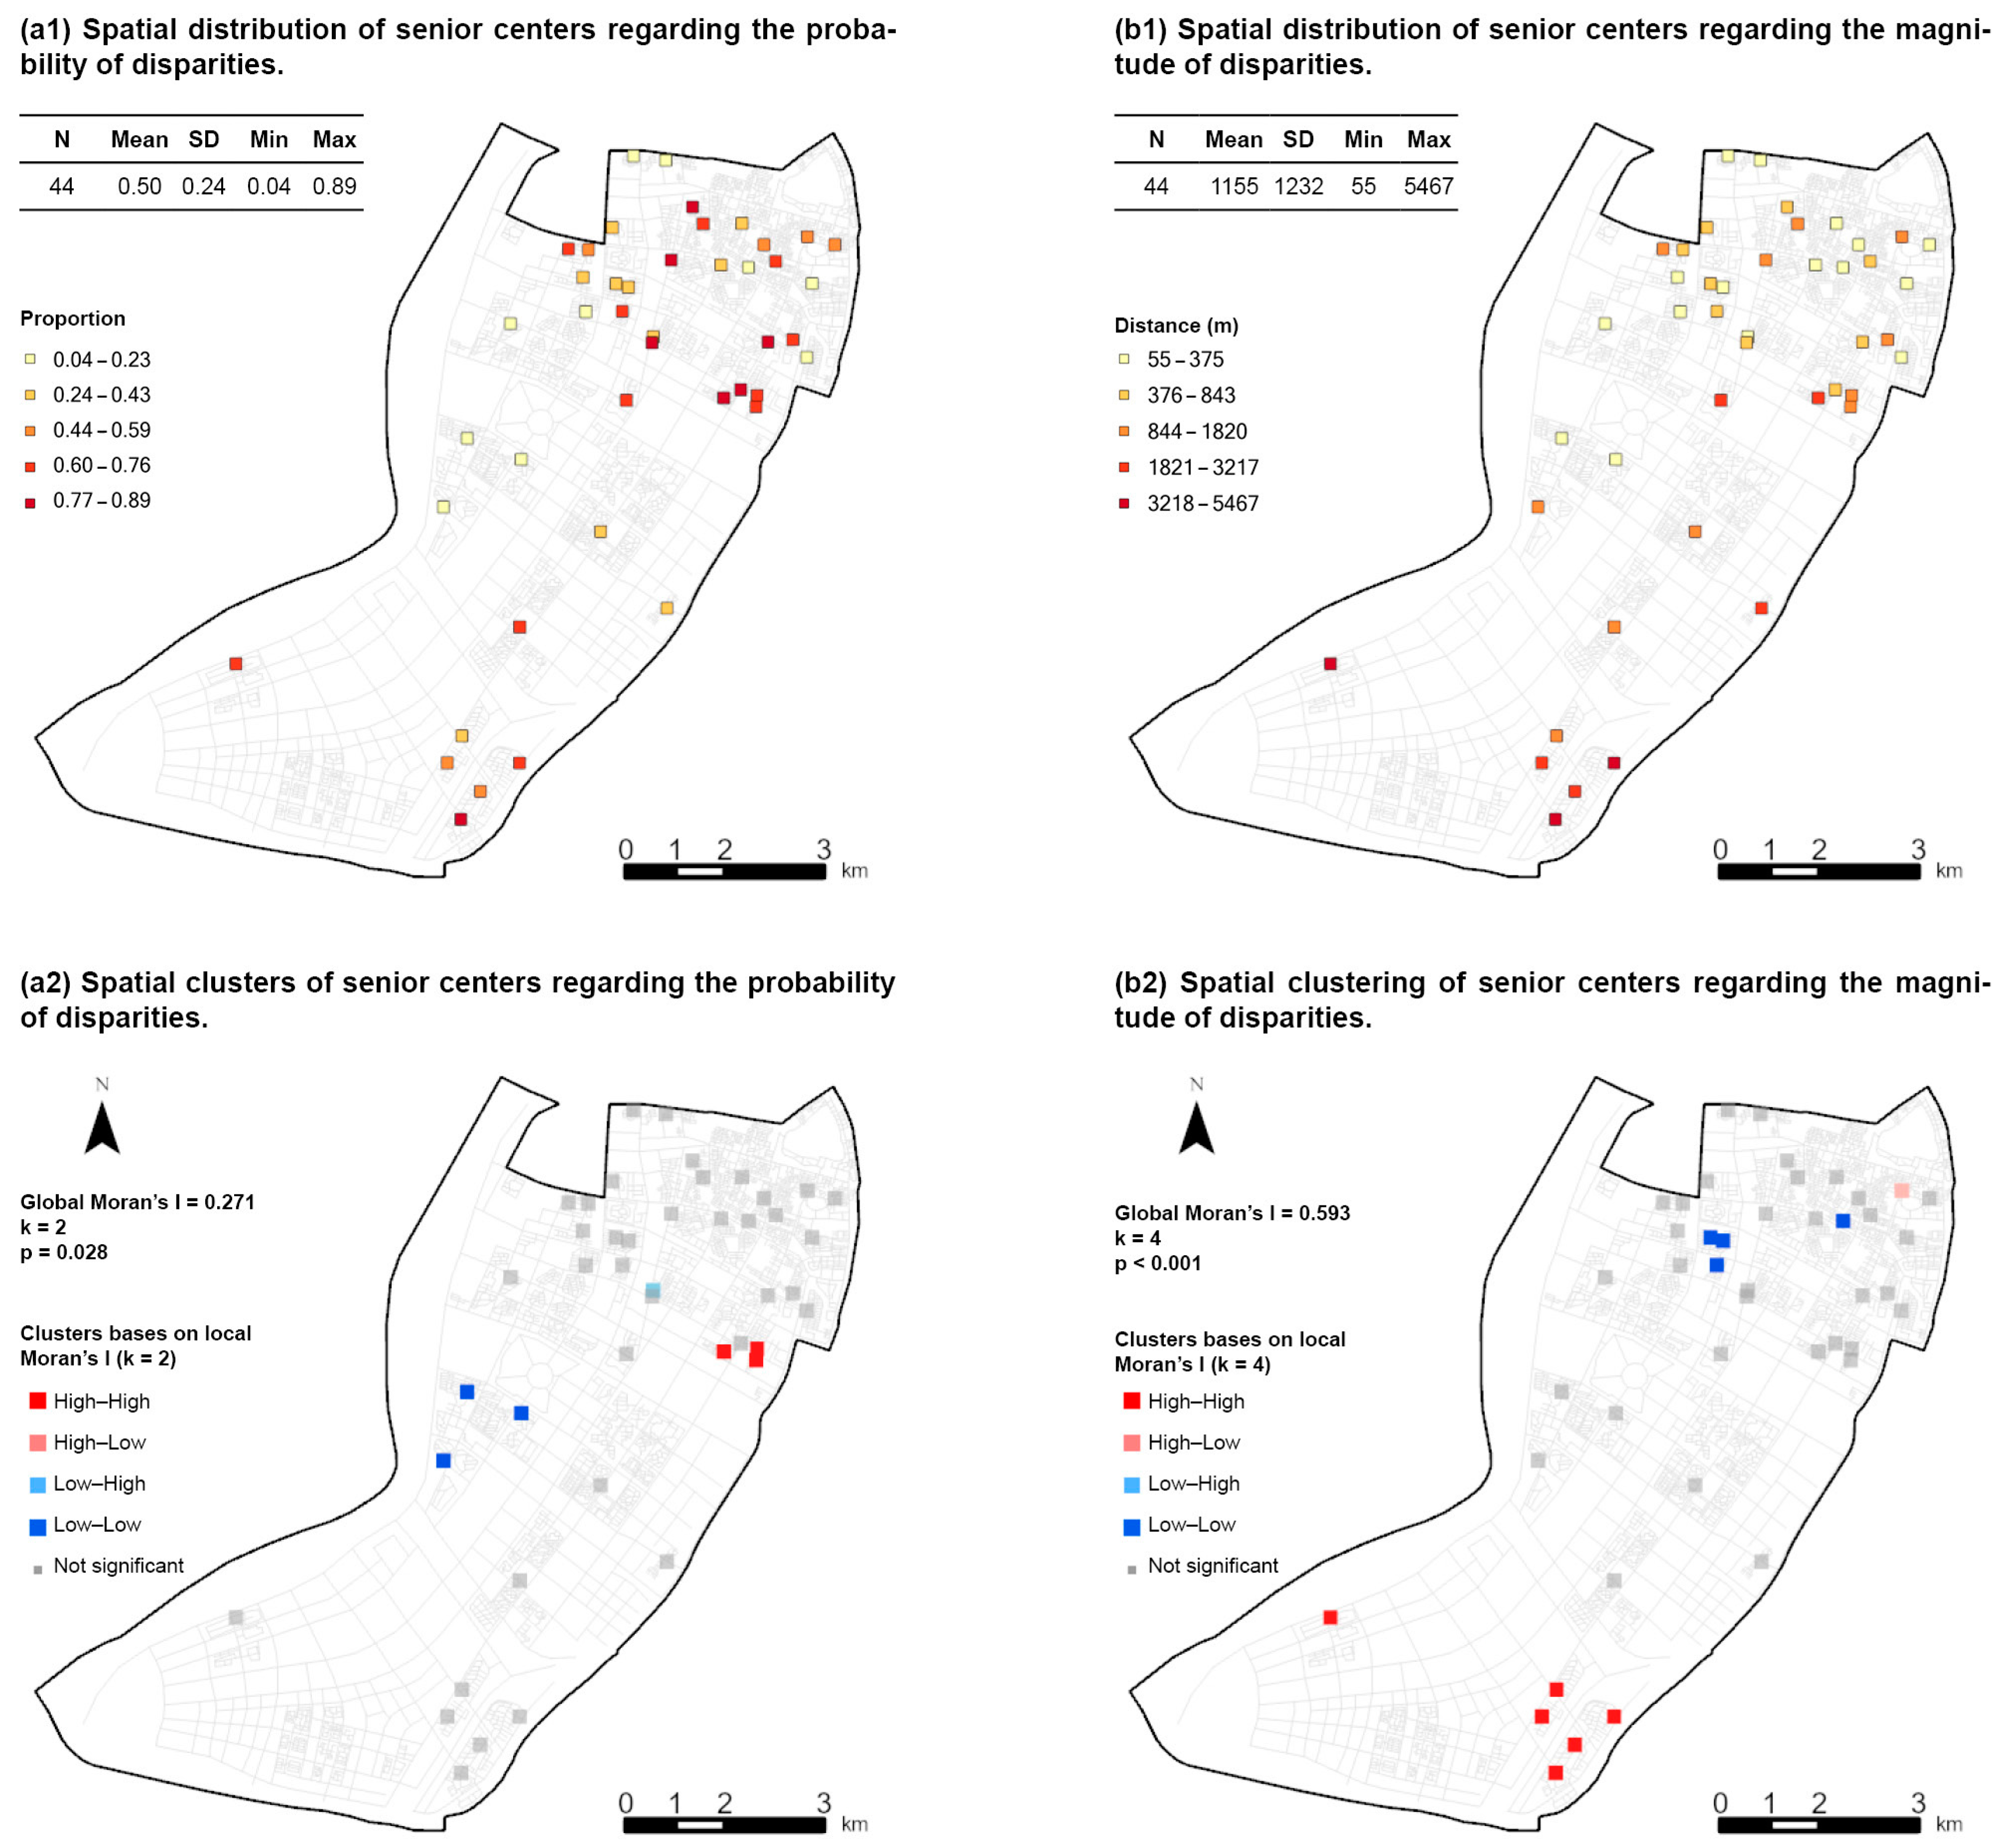
As explained in Section 3.3, we further investigate the disparity between PA and RA among senior centers by measuring their probability (PRBC) and magnitude (MAGC). The descriptive statistics and spatial patterns of the two variables are presented in Figure 8.
For the probability of disparity, the mean value among the 44 senior centers is 0.5 (see Figure 8(a1)), meaning that, on average, half of the users of the senior centers in the research area are non-nearest visitors. For the center with the highest probability, 89% of its users are non-nearest visitors. As for the spatial heterogeneity of the probability among senior centers, Figure 8(a1) show that centers with a high probability of disparity are located in both the inner and the outer city. The statistics of Global Moran’s I show a significant but relatively low level of spatial autocorrelation ( M o r a n s   I = 0.271 ,   p = 0.028 ,   k = 2 ). As for the test of Local Moran’s I (Figure 8(a2)), a low-low cluster is found in the middle of the map where the three senior centers are distant from each other, as well as all the other senior centers. A high-high cluster is detected on the right border of the map where senior centers are very close to each other. The different spatial clusters seem to indicate that when multiple senior centers are closely located, they are more likely to accept non-nearest users, because their local users have multiple choice.
For the magnitude of disparity, the mean value among the 44 senior centers is 1155 m (see Figure 8(b1)), showing a substantial degree of disparity. A clear spatial pattern can be seen, namely, senior centers with high levels of disparity are mainly located in the outer city (the lower part of the map), while most of the centers in the inner city have low levels of disparity. The statistics of Global Moran’s I also show a strong spatial autocorrelation ( M o r a n s   I = 0.593 ,   p < 0.001 ,   k = 4 ), and the test of Local Moran’s I (Figure 8(b2)) identifies a high-high cluster of centers in the bottom of the map, while low-low clusters are located in the inner city in the upper part of the map.
In summary, the spatial analysis reveals spatial heterogeneity among senior centers regarding their characteristics of disparity between potential and realized access. Senior centers in the inner city are more likely to have high probability but a low magnitude of disparity, indicating that they are likely to accept non-nearest users, but those users are mainly from local areas, thus with a low magnitude of disparity. In contrast, centers in the outer city are likely to accept large portions of non-nearest users who are from distant areas.

4.2.3. Spatial and Social Determinants of Disparity

To further examine how various spatial and non-spatial factors influence the characteristics of disparities among senior centers, regression analysis was performed on probability (PRBC) and magnitude (MAGC), respectively. The results are presented in Table 5. In general, the model on magnitude performs better than the model on probability, with a higher R2 value (0.564 vs. 0.140), higher log-likelihood value (−138 vs. −478), and lower AIC value (296 vs. 974).
For the probability of disparity, six factors are significant, and the model explains about 14% of the variance (Tjur’s pseudo R2). According to the results, senior centers with higher proportions of non-nearest visitors are located closer to the city center (closer to commercial amenities, public transportation, and parks) or have a larger size and higher service quality. The positive influence of commercial amenities, public transportation, and parks can be explained as these public amenities are frequently used by older adults, thereby neighboring them helps senior centers attract more users from wider spatial contexts, thus increasing the proportion of non-nearest visitors. Also, senior centers with higher service quality and larger size are expected to have a broader impact and higher level of recognition in the area, which may help attract non-nearest visitors.
For the magnitude of disparity, the density of the older population ( O d d s   R a t i o = 0.82 ,   p < 0.05 ) and the distance to the city center ( O d d s   R a t i o = 1.21 ,   p < 0.001 ) are the two factors with significant impacts. These two factors suggest that senior centers located in the outer city with a lower density of older populations are more likely to have large portions of long-distance users. This finding corresponds with the spatial pattern revealed by Figure 8. Moreover, we find that public amenities, service quality, and facility size do not significantly influence the magnitude of disparity. A possible explanation for this finding is that senior centers in the outer city lack potential users in their vicinity, and thereby ‘recruit’ users from the inner city (see Figure A2 in Appendix A) through certain approaches. This finding indicates the role of organizational factors rather than spatial proximity in affecting older adults’ patterns of realized access.

4.3. Summary of Main Findings

This study indicates that potential access calculations can significantly overestimate the actual accessibility of community-based services for older adults, with distances of realized access (mean = 1319 m) being considerably greater than potential access (mean = 325 m). Spatial analysis reveals notable variations in the disparities between potential and realized access. Regression analysis further confirms that older adults living in newly built, lower-priced houses in the inner city are more likely to travel longer distances to reach senior centers. As the distance from senior centers increases, the predictive power of spatial proximity on realized access diminishes. Instead, the location and service quality of senior centers emerge as the factors influencing older adults’ choices, emphasizing the need to consider a range of factors beyond mere spatial proximity when evaluating the service accessibility of older adults.

5. Discussion

Through spatial and statistical analysis at both user and facility levels, this study reveals the disparities between older adults’ potential and realized access to senior centers, as well as spatial patterns and various determinants. The results will be discussed in the following sections.

5.1. The Biased Estimation of Potential Access

The finding of the disparities between potential and realized access in this study is consistent with the findings of previous studies on realized access to healthcare facilities, pharmacies, food stores, and parks [19,26,28,29,47], namely, the distance of realized access is much longer than that of potential access. Based on the estimation of potential access, over 80% of the older adults in the research area have access to senior centers within 500 m of their residence, which, according to the policy and planning regulation of Nanjing [48], represents an overall high level of accessibility. However, in practice, about 50% of older adults travel more than 500 m to senior centers, and those travelling more than 1000 m take up over 30%. The estimation of potential access is highly biased from reality.
The observed long-distance traveling in reality is against the goal of senior centers in terms of offering accessible services to local elderly people. Considering the decreased mobility of older adults, long-distance travelling is an unsustainable pattern for them to access services, especially instrumental services like meals or health checks. In contrast to the estimation of potential access, the analysis of realized access shows that a considerable portion of older adults are still suffering from low levels of access to community-based services. The biased estimation of potential access can be misleading for planners and policymakers. The ‘high’ level of potential access masks the underlying barriers older adults may face in accessing community-based services. In this situation, research on realized access is a critical component of accessibility studies.

5.2. The Spatial Heterogeneity of the Disparities

Previous studies have shown the spatial heterogeneity of users regarding the disparity between potential and realized access. Users in rural or suburban areas were often found to experience higher levels of disparity compared to those in the inner city [19,26,49] because rural or suburban areas are more likely to be in shortage of services. This study furthers the research field by investigating spatial heterogeneity at both the user and facility levels. At the user level, those experiencing high levels of disparities are mainly located in areas lacking senior centers in the inner city. At the facility level, senior centers exhibiting high levels of disparities are mainly located in the outer city.
At the user level, our findings are in line with previous studies, i.e., that users living in places with low levels of potential access are found to be more likely to experience high levels of disparities between potential and realized access. However, in our research area, low levels of potential access are found in certain areas in the inner city rather than the outer city. The lack of senior centers in the inner city has been observed in existing studies in China [14,27]. This is because residential communities in the inner city in China usually have a high density of populations and buildings, which lack spaces to build senior centers.
Our research extends existing studies by revealing the spatial heterogeneity at the facility level, showing that senior centers in the outer city have large portions of long-distance users compared to those in the inner city. The phenomenon that long-distance users flow from the inner city to senior centers in the outer city can be explained by the imbalance on both the supply and the demand sides. Senior centers in the outer city are located inside newly developed residential communities, with a very low density of older populations (see Figure 2b). These centers may lack potential users in their local areas. Therefore, it is likely that these centers use specific marketing strategies or referral approaches to ‘recruit’ older adults from the inner city. Although these approaches can help senior centers increase their numbers of users, they are not sustainable approaches for older adults because of the long-distance traveling required.
Identifying the spatial heterogeneity of realized access at the user and facility levels can help planners and policymakers to implement more targeted spatial and social interventions, which will be discussed in Section 5.4.

5.3. The Role of Spatial Proximity and Other Underlying Factors

As argued by previous researchers [20,21], the reason that potential access calculations produce biased estimation is that they highlight the importance of spatial proximity while overlooking other factors. This study found that spatial proximity becomes less effective in predicting older adults’ realized access when older adults live further away from their nearest senior centers (see Table 4). As shown in Figure A1, at the distance of 500 m, about 50% of older adults do not visit their nearest centers, and the figure rises to about 80% at the distance of 1000 m. The reason spatial proximity becomes less effective, or older adults become less likely to visit their nearest centers at longer distances, might be a lack of information or knowledge about the centers.
Information is a critical factor enabling people’s realized access to services [33,35]. Due to decreased mobility, older adults are likely to experience a shrinkage of the everyday life space. Therefore, some older residents may have little chance in their everyday movements to pass by and learn about the senior centers located several hundred meters away from their home. In other words, the information brought by spatial proximity diminishes. In this situation, which senior center an older person visits may be determined by whether the person is able to acquire information about the center through certain approaches, such as advertisements, phone calls, or friends’ recommendations. Our findings support this postulation in two ways.
On the one hand, we found that senior centers located close to commercial amenities, parks, and public transportation are more likely to accept non-nearest visitors (see Table 5). The reason is that these locations are frequented by large numbers of older adults in everyday life; thus, senior centers in such locations are more easily seen by older adults, which facilitates older adults’ information access to senior centers. On the other hand, we found that many older adults overlooked more nearby centers and traveled long distances (over 5 km) to visit senior centers located in the very outer area of the city (see Figure A2). This type of realized access is very likely to be motivated by the information offered by senior centers through certain marketing strategies, such as phone calls or advertisements.
In addition, this study also found that senior centers of a larger size and with higher service quality are more likely to attract non-nearest visitors, meaning that service quality may outweigh spatial proximity in determining older adults’ choice of senior centers. In brief, the findings of this study suggest that non-spatial factors such as information or service may play a critical role in determining older adults’ realized access to senior centers, especially when older adults live far away from senior centers.

5.4. Implications for Research and Practice

The findings of this study have implications for research and practice relating to the accessibility of community-based services for the elderly.
In terms of research, when assessing older adults’ potential access to senior centers or other community-based facilities using methods such as 2SFCA or cumulative opportunity approaches, researchers should select smaller distance thresholds (or radii), as our findings show that older adults’ realized access is less likely to be determined by spatial proximity when living a long distance away from facilities. Therefore, using large distance thresholds in assessing potential access may increase the bias of estimation. Based on the findings of this study, a 250 or 300 m radius might be an optimal choice. Moreover, since attributes of senior centers such as service quality or building size are found to influence older adults’ realized access, adding these factors as weighting parameters of facilities will also help increase the accuracy of the estimation of potential access.
In term of practice, local authorities and planners may adopt a smaller service radius when planning senior centers in the inner city. The existing planning regulations in Nanjing and other Chinese cities normally employ a 500 m service radius for distributing community-based service facilities for the elderly. However, our findings suggest that this service radius might be too large, as older adults living 500 m away from a senior center might struggle to obtain enough information about the center. One possible solution is to reduce the service radius to, for example, 250 m, although this means an increased provision of senior centers, increasing the financial burden of local governments. Another solution is to place senior centers in locations close to public amenities such as shops and stores, parks, or public transportation, which will facilitate older adults’ awareness of senior centers. Last but not least, local authorities or facility managers should adopt more active strategies to disseminate or advertise information on senior centers to local older adults, through approaches such as phone calls, text messages, television advertisements, or posters on main streets. These approaches will help overcome the constraints of spatial distances, facilitating older adults’ realized access to services offered by senior centers.

6. Conclusions

Community-based services provided by senior centers are essential in addressing the challenges posed by an aging population. While the potential accessibility of these services has garnered scholarly interest, there is a dearth of research focusing on the realized access of older adults to senior centers, particularly using detailed geo-behavioral data. This study addresses this gap by employing a multilevel analytic framework to assess the divergence between potential and realized access, identify spatial patterns, and investigate the spatial and non-spatial factors influencing realized access.
Utilizing geo-referenced check-in data from 2382 older adults across 44 senior centers in Nanjing, China, this study reveals that potential access calculations significantly overestimate the actual accessibility of community-based services. The mean distance of realized access to senior centers for older adults (1319 m) is considerably greater than the distance suggested by potential access estimations (325 m). Spatial analysis highlights substantial heterogeneity in realized access among users and senior centers, indicating that there are complex factors at play. Regression analysis confirms that older adults residing in newly built low-cost housing in the inner city are more likely to travel longer distances to access senior centers. Furthermore, this study finds that spatial proximity is a less reliable predictor of realized access for those living further from senior centers. Conversely, the locational attributes and service quality of senior centers significantly influence the choices of older adults.
The present study is not without limitations. Firstly, the data were collected from one Chinese city, and the sample includes only older adults aged 70 and over, which may limit the generalizability of our findings. Future studies may employ older adults’ access data from other cultural contexts and compare the findings with this study to see if the results are consistent. Secondly, this study is mainly built upon quantitative analytic methods. Although we identified patterns of older adults’ spatial access, the reason underlying the spatial patterns, such as senior centers’ marketing strategies or older adults’ motivation for visiting senior centers, cannot be fully articulated by quantitative variables. Future studies could mitigate this issue by employing mixed methods, e.g., using qualitative approaches such as organizing interviews or focus group discussions with older adults and senior center managers. Thirdly, this study does not differentiate users by the services they used in the senior centers, which may limit our understanding of the details of realized access, because users of different services may access senior centers in different patterns. Future studies could forward this research field by analyzing and comparing the realized access of users of different services.
By synthesizing potential and realized access, this study not only fills a critical knowledge gap in the existing body of literature, but also deepens our understanding of how older adults access community-based services. The multilevel analytic framework offers methodological insights for researchers seeking to understand the nuances of realized access patterns and determinants. Supported by fine-grained geo-behavioral data, this study provides empirical insights to guide the planning and policy development of community-based services for the elderly.

Author Contributions

Conceptualization, X.L. methodology, X.L.; software, X.L. and Z.X.; validation, X.L., and Z.X.; formal analysis, X.L.; investigation, X.L.; resources, X.L.; data curation, X.L.; writing—original draft preparation, X.L.; writing—review and editing, Z.X.; visualization, X.L.; supervision, X.L.; project administration, X.L.; funding acquisition, X.L. and Z.X. All authors have read and agreed to the published version of the manuscript.

Funding

This research was funded by China Scholarship Council (ID: 201806090302) and the Postgraduate Research & Practice Innovation Program of Jiangsu Province, China (ID: KYCX19_0090).

Data Availability Statement

The datasets presented in this article are not readily available due to ethical restrictions and the requirements of the data provider.

Conflicts of Interest

The authors declare no conflicts of interest.

Appendix A

Based on the regression models in Table 4, Figure A1 plots the predicted values of PRBU and MAGU in relation to PDU. It can be seen that with the increase of PDU (i.e., distance to the nearest center), the probability older adults not visiting the nearest centers increases steadily. At a distance of 500 m, about 50% of the older adults will not visit their nearest centers. This proportion escalates to around 80% when the PDU extends to 1000 m. Furthermore, Figure A1b suggests that when older adults are situated 500 m from their nearest centers, they are inclined to visit centers that are approximately 1.5 km away.
Figure A1. Predicted values of the PRBU (a) and MAGU (b) based on the distance of potential access of users using the models presented in Table 4.
Buildings 14 03900 g0a1
In Figure A2, home addresses of the users in three senior centers (F33, F9 and F27) located in the outer city are plotted. These plots show that these centers accepted a large portion of long-distance users who travelled several kilometers and live in the inner city.
Figure A2. Exemplary cases showing that senior centers in the outer city accept long-distance users from the inner city.
Buildings 14 03900 g0a2

References

  1. World Health Organization. Global Age-Friendly Cities: A Guide; World Health Organization: Geneva, Switzerland, 2007. [Google Scholar]
  2. Tanner, D. Older People and Access to Care. Br. J. Soc. Work 2003, 33, 499–515. [Google Scholar] [CrossRef]
  3. Teo, P. Space to Grow Old In: The Availability of Public Spaces for Elderly Persons in Singapore. Urban Stud. 1997, 34, 419–439. [Google Scholar] [CrossRef]
  4. Weil, J. The New Neighborhood Senior Center: Redefining Social and Service Roles for the Baby Boom Generation; Rutgers University Press: New Brunswick, NJ, USA, 2014. [Google Scholar]
  5. Farone, D.W.; Fitzpatrick, T.R.; Tran, T.V. Use of Senior Centers as a Moderator of Stress-Related Distress Among Latino Elders. J. Gerontol. Soc. Work 2005, 46, 65–83. [Google Scholar] [CrossRef] [PubMed]
  6. Choi, N.G.; McDougall, G.J. Comparison of Depressive Symptoms Between Homebound Older Adults and Ambulatory Older Adults. Aging Ment. Health 2007, 11, 310–322. [Google Scholar] [CrossRef] [PubMed]
  7. Zhang, S.; Zhang, Z. Smart Elderly Care Is an Inevitable Choice for China’s Elderly Care Services. Available online: https://news.sciencenet.cn/sbhtmlnews/2023/10/376759.shtm (accessed on 24 October 2023).
  8. Social Construction Committee of Nanjing. Report on Community-Based Elderly Care Service in Nanjing. Available online: http://rd.nanjing.gov.cn/rmtzx/rddy/202010/t20201020_2453967.html (accessed on 19 May 2020).
  9. Nanjing Municipal Government. Standard of Public Facility Planning and Provision. Available online: https://www.nanjing.gov.cn/zdgk/201502/t20150212_1056577.html (accessed on 26 January 2015).
  10. The State Council. The 14th Five-Year Planning on the Development of Elderly Care System. Available online: http://www.gov.cn/zhengce/content/2022-02/21/content_5674844.htm (accessed on 30 December 2021).
  11. Wang, N.; Ma, W. Evaluation Study on the Layout of Community Senior Living Facilities in the Main Area of Shanghai from the Perspective of Senior Life Circle. Sustainability 2023, 15, 10362. [Google Scholar] [CrossRef]
  12. Zhao, X.; Park, E.-S.; Kim, J.; Lee, S.-Y.; Lee, H. Basic Analysis of Physical Determinants Affecting the Distribution Density of Senior Citizen Centers around Small Apartment Complexes, Focusing on Administrative Districts in Busan. Buildings 2024, 14, 929. [Google Scholar] [CrossRef]
  13. Johnson, M.P.; Gorr, W.L.; Roehrig, S. Location of Service Facilities for the Elderly. Ann. Oper. Res. 2005, 136, 329–349. [Google Scholar] [CrossRef]
  14. Han, F.; Luo, R. A Study on the Matching of Supply and Demand for Community-based Elderly Care Services in Urban Communities Based on Accessibility Measures: A Case Study of Nanjing. Econ. Geogr. 2020, 40, 91–101. [Google Scholar]
  15. Borana, S.L.; Yadav, S.K. Spatial Disparity Analysis of Public Amenities in Jodhpur City. Int. Res. J. Eng. Technol. 2017, 4, 171–173. [Google Scholar]
  16. Ding, Q.; Zhu, L.; Luo, J. Analysing Spatial Accessibility to Residential Care Facilities in Wuhan. Hum. Geogr. 2016, 31, 36–42. [Google Scholar]
  17. Zhao, D.; Han, Z.; Zhao, B. A Study of Urban Pension Service Facilities Distribution Assessment Based on GIS: A Case Study of Jinzhou New District Dalian. Popul. Dev. 2017, 23, 74–81. [Google Scholar]
  18. Zhao, L.; He, D.; Zhao, J. Spatial Distribution and Factors Influencing Elderly Care Service Facilities based on Accessibility Evaluation—Taking Wuxi City as an Example. J. Resour. Ecol. 2024, 15, 130–139. [Google Scholar] [CrossRef]
  19. Guo, S.; Song, C.; Pei, T.; Liu, Y.; Ma, T.; Du, Y.; Chen, J.; Fan, Z.; Tang, X.; Peng, Y.; et al. Accessibility to urban parks for elderly residents: Perspectives from mobile phone data. Landsc. Urban Plan. 2019, 191, 103642. [Google Scholar] [CrossRef]
  20. Joseph, A.E.; Phillips, D.R. Accessibility and Utilization: Geographical Perspectives on Health Care Delivery; Sage: Newcastle upon Tyne, UK, 1984. [Google Scholar]
  21. Andersen, R.; Aday, L.A. Access to Medical Care in the US: Realized and Potential. Med. Care 1978, 16, 533–546. [Google Scholar] [CrossRef]
  22. Aday, L.A.; Andersen, R. A Framework for the Study of Access to Medical Care. Health Serv. Res. 1974, 9, 208. [Google Scholar]
  23. Shao, L.; Zhang, J.; Xu, B.; Tan, S. An Analysis of the Spatial Distribution and Demand-Supply Relation of Care Facilities for the Elderly in the Central Urban Area of Beijing. Archit. J. 2017, 10, 4–8. [Google Scholar]
  24. He, J.; Zhou, D.; Xu, Y.; Dai, J. The Study of Spatial Accessibility Measurement of Pension Facilities in Urban Community. Archit. J. 2018, 18, 18–22. [Google Scholar]
  25. Tao, Z.; Cheng, Y.; Dai, T.; Li, X. Sensitivity Analysis of Parameters in Measuring Spatial Accessibility to Public Service Facilities. Mordern Urban Res. 2017, 3, 30–35. [Google Scholar]
  26. Lin, S.-J.; Crawford, S.Y.; Warren Salmon, J. Potential Access and Revealed Access to Pain Management Medications. Soc. Sci. Med. 2005, 60, 1881–1891. [Google Scholar] [CrossRef]
  27. Luo, X.; Yue, B.; Lin, A. The Research of Accessibility and Fairness of Pension Service Facilities Based on Multiple Modes of Transportation—A Case Study of Wuhan. J. Cent. China Norm. Univ. 2018, 52, 883–893. [Google Scholar]
  28. Robitaille, E.; Durette, G.; Dubé, M.; Arbour, O.; Paquette, M.-C. Measuring the Potential and Realized (or Revealed) Spatial Access from Places of Residence and Work to Food Outlets in Rural Communities of Québec, Canada. ISPRS Int. J. Geo-Inf. 2024, 13, 43. [Google Scholar] [CrossRef]
  29. Gomez, D.; Haas, B.; Doumouras, A.G.; Zagorski, B.; Ray, J.; Rubenfeld, G.; McLellan, B.A.; Boyes, D.M.; Nathens, A.B. A Population-Based Analysis of the Discrepancy Between Potential and Realized Access to Trauma Center Care. Ann. Surg. 2013, 257, 160–165. [Google Scholar] [CrossRef] [PubMed]
  30. Rosenstock, I.M. What research in motivation suggests for public health. Am. J. Public Health Nations Health 1960, 50, 295–302. [Google Scholar] [CrossRef] [PubMed]
  31. Suchman, E.A. Health orientation and medical care. Am. J. Public Health Nations Health 1966, 56, 97–105. [Google Scholar] [CrossRef]
  32. Andersen, R. A Behavioral Model of Families’ Use of Health Services; Center for Health Administration Studies, University of Chicago: Chicago, IL, USA, 1968. [Google Scholar]
  33. Cheng, Y.; Rosenberg, M.W.; Wang, W.Y.; Yang, L.S.; Li, H.R. Access to Residential Care in Beijing, China: Making the Decision to Relocate to a Residential Care Facility. Ageing Soc. 2012, 32, 1277–1299. [Google Scholar] [CrossRef]
  34. Nanjing Municipal Government. The Seventh National Population Census of Nanjing City. Available online: https://www.nanjing.gov.cn/zdgk/202105/t20210524_2946168.html (accessed on 24 May 2021).
  35. Joseph, A.E.; Poyner, A. Interpreting Patterns of Public Service Utilization in Rural Areas. Econ. Geogr. 1982, 58, 262–273. [Google Scholar] [CrossRef]
  36. Anselin, L. Spatial Econometrics: Methods and Models; Springer Science & Business Media: Berlin/Heidelberg, Germany, 2013; Volume 4. [Google Scholar]
  37. Sauer, J.; Oshan, T.; Rey, S.; Wolf, L.J. The importance of null hypotheses: Understanding differences in local Moran’s under heteroskedasticity. Geogr. Anal. 2022, 54, 752–768. [Google Scholar] [CrossRef]
  38. Davidoff, T. Labor Income, Housing Prices, and Homeownership. J. Urban Econ. 2006, 59, 209–235. [Google Scholar] [CrossRef]
  39. Yang, Z.; Shen, Y. The Affordability of Owner Occupied Housing in Beijing. J. Hous. Built Environ. 2008, 23, 317–335. [Google Scholar] [CrossRef]
  40. Peng, C.-Y.J.; Lee, K.L.; Ingersoll, G.M. An Introduction to Logistic Regression Analysis and Reporting. J. Educ. Res. 2002, 96, 3–14. [Google Scholar] [CrossRef]
  41. Krout, J.A.; Cutler, S.J.; Coward, R.T. Correlates of Senior Center Participation: A National Analysis. Gerontol. 1990, 30, 72–79. [Google Scholar] [CrossRef] [PubMed]
  42. Strain, L.A. Senior Centres: Who Participates? Can. J. Aging La Rev. Can. Du Vieil. 2001, 20, 471–492. [Google Scholar] [CrossRef]
  43. Dunn, P.K.; Smyth, G.K. Generalized Linear Models with Examples in R; Springer: Berlin/Heidelberg, Germany, 2018; Volume 53. [Google Scholar]
  44. Moran, J.L.; Solomon, P.J.; Peisach, A.R.; Martin, J. New Models for Old Questions: Generalized Linear Models for Cost Prediction. J. Eval. Clin. Pract. 2007, 13, 381–389. [Google Scholar] [CrossRef] [PubMed]
  45. Salem, A.B.Z.; Mount, T.D. A Convenient Descriptive Model of Income Distribution: The Gamma Density. Econom. J. Econom. Soc. 1974, 42, 1115–1127. [Google Scholar] [CrossRef]
  46. Diehr, P.; Yanez, D.; Ash, A.; Hornbrook, M.; Lin, D.Y. Methods for Analyzing Health Care Utilization and Costs. Annu. Rev. Public Health 1999, 20, 125–144. [Google Scholar] [CrossRef]
  47. Thatcher, E.; Johnson, C.; Zenk, S.N.; Kulbok, P. Retail Food Store Access in Rural Appalachia: A Mixed Methods Study. Public Health Nurs. 2017, 34, 245–255. [Google Scholar] [CrossRef]
  48. Rui, Y.; Yang, Z.; Qian, T.; Khalid, S.; Xia, N.; Wang, J. Network-Constrained and Category-Based Point Pattern Analysis for Suguo Retail Stores in Nanjing, China. Int. J. Geogr. Inf. Sci. 2016, 30, 186–199. [Google Scholar] [CrossRef]
  49. Lin, S.; Deng, H.; Wang, Y.; Chen, S. Potential and Realized Access to Healthcare Services in Wuhan Metropolitan Area, China. Trans. Plan. Urban Res. 2023, 3, 97–120. [Google Scholar] [CrossRef]
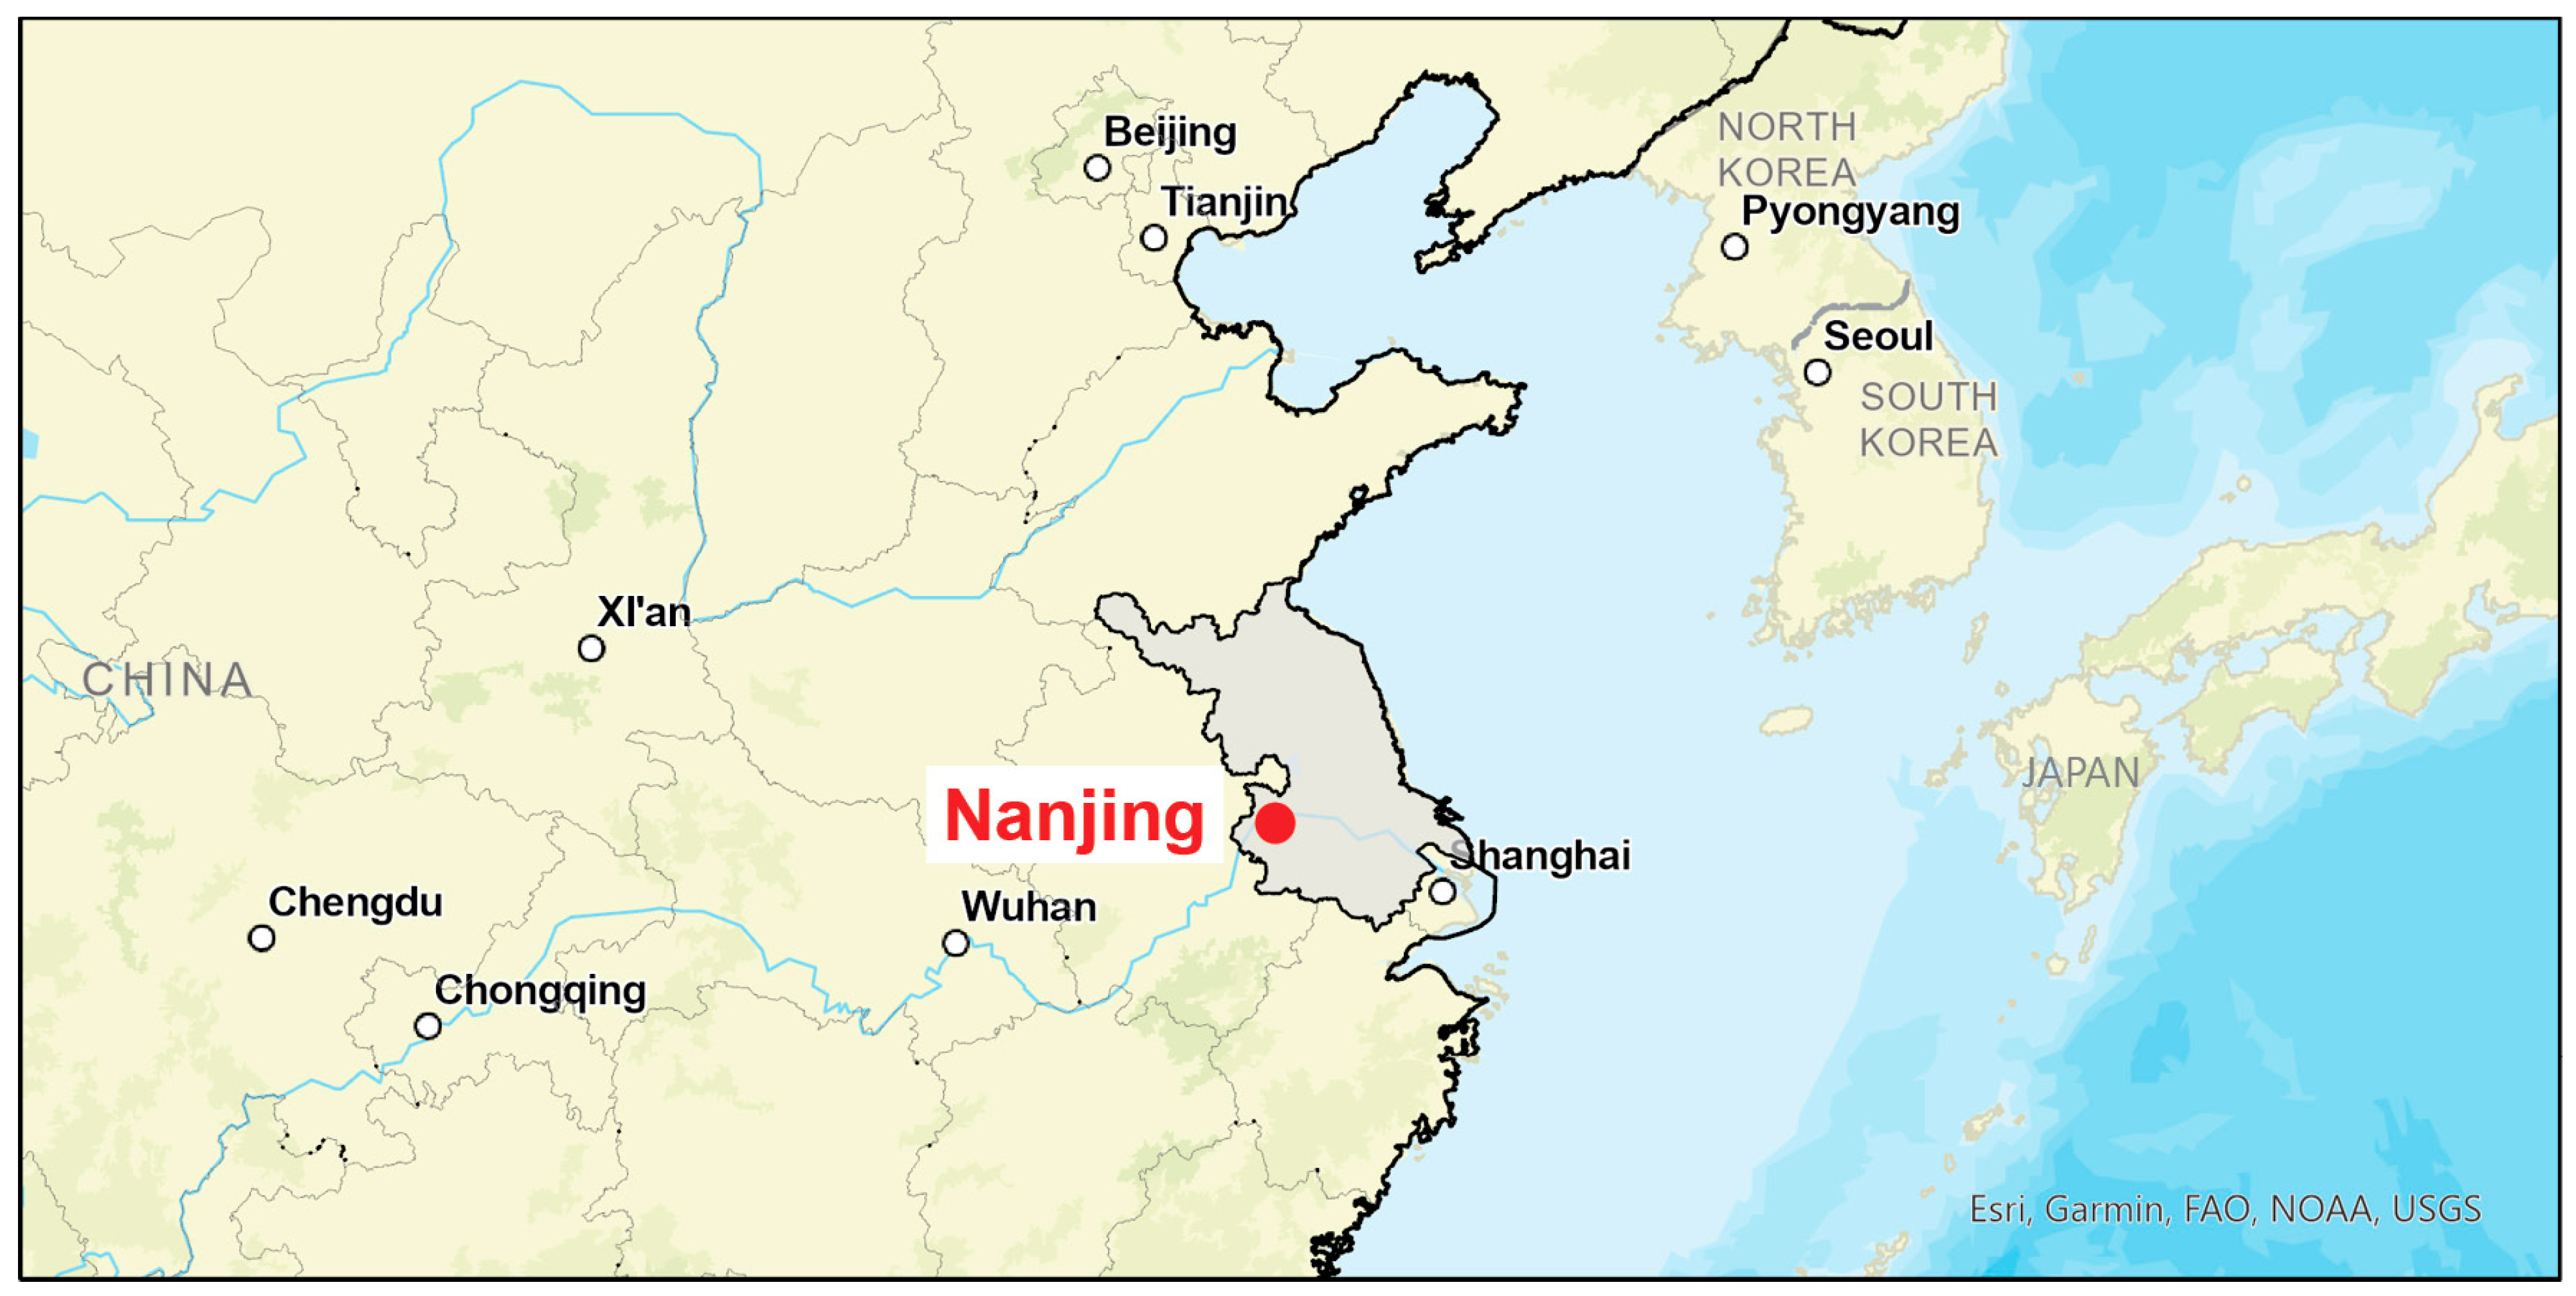
Figure 1. The location of the city of Nanjing in eastern China.
Buildings 14 03900 g001
Figure 2. The research area in the main city of Nanjing (a) and the density of older populations by subdistrict (b).
Buildings 14 03900 g002
Figure 3. The geo-referenced check-in data of senior centers, including locations of senior centers and users’ homes (a) and check-in records (b). Senior centers are marked as black squares, and users are marked as red dots. Red lines indicate which user visited which senior center.
Buildings 14 03900 g003
Figure 4. The multilevel analytic framework.
Buildings 14 03900 g004
Figure 5. Spatial distribution of users with varied distances of potential and realized access. Senior centers are marked as black squares and users are marked as crosses.
Buildings 14 03900 g005
Figure 6. The spatial distribution of users regarding the probability (a) and magnitude (b,c) of the disparities between potential and realized access. Senior centers are marked as black squares.
Buildings 14 03900 g006
Figure 7. Spatial distribution of senior centers with varied mean distances of potential (a) and realized (b) access.
Buildings 14 03900 g007
Figure 8. Spatial distribution and spatial clusters of senior centers regarding the probability and magnitude of disparities between potential and realized access.
Buildings 14 03900 g008
Table 1. A summary of variables characterizing the disparity between potential and realized access at user and facility levels.
VariablesN (%)/Mean (SD)
User’s probability of disparity (PRBU)
   NV (0)1506 (63.2%)
   NNV (1)876 (36.8%)
User’s magnitude of disparity (MAGU)1635 (2165)
Center’s probability of disparity (PRBC)0.50 (0.24)
Center’s magnitude of disparity (MAGC)1155 (1232)
Table 2. A summary of socio-spatial variables describing attributes of older adults ( N = 2382 ).
VariablesN (%)/Mean (SD)
Age
    70–751036 (43.5%)
    76–80506 (21.2%)
    81–85510 (21.4%)
    86+330 (13.9%)
Gender
    Male1066 (44.8%)
    Female1316 (55.2%)
Household composition
    Alone218 (9.2%)
    With only spouse314 (13.2%)
    With others1799 (75.6%)
Physical Capacity
    Independent2323 (97.5%)
    Semi-independent50 (2.1%)
    Dependent9 (0.4%)
House price (RMB/m2)41,471 (8396)
Community age (year)21 (7)
Distance to the city center (meter)5437 (2188)
Table 3. A summary of socio-spatial variables describing attributes of senior centers ( N = 44 ).
VariablesMean (SD)
Density of older population (N/km2)2649 (2485)
Distance to the city center (meter)6629 (2820)
Closeness to commercial amenities0.31 (0.35)
Closeness to public transport0.21 (0.01)
Closeness to medical centers0.02 (0.06)
Closeness to parks0.02 (0.06)
Service rank3.13 (0.67)
Facility size (m2)340 (225)
Table 4. The results of the regression analysis examining the impacts of socio-spatial factors of older adults on the probability (PRBU) and magnitude (MAGU) of disparities.
VariablesProbability (PRBU)Magnitude (MAGU)
Odd RatiosCIZOdds RatiosCIZ
Intercept7.23 ***1.07–1.626.997.37 *1.21–41.692.26
Age
 70–75 (ref)
 76–801.080.85–1.380.640.900.71–1.15−0.85
 81–851.190.93–1.511.401.140.90–1.461.12
 86+1.130.84–1.500.821.280.97–1.711.68
Gender
 Male (ref)
 Female 0.890.74–1.07−1.271.100.91–1.310.99
Household
 Alone0.69 *0.50–0.96−2.210.830.61–1.17−1.11
 With spouse0.810.62–1.06−1.521.280.98–1.701.79
 With others (ref)
House price0.55 ***0.46–0.65−6.780.860.73–1.04−1.42
Community age0.40 ***0.29–0.53−6.191.350.94–1.961.75
Distance to city center0.63 ***0.58–0.69−10.911.060.97–1.151.23
Distance of potential access1.34 ***1.28–1.4012.961.08 ***1.04–1.124.44
Log-likelihood−1383.04 −3226.77
AIC2788.08 6477.55
Pseudo R20.148 0.093
Note: (1) * p < 0.05, ** p < 0.01, *** p < 0.001. (2) Statistically significant variables are bolded. (3) The pseudo R2 for the model on probability (logistic regression) is calculated as Tjur’s R2, and the one for the model on magnitude (gamma regression) is calculated as Nagelkerke’s R2.
Table 5. The results of facility-level regression analysis examining socio-spatial factors affecting the probability (PRBC) and magnitude (MAGC) of disparities between potential and realized access.
VariablesThe Probability (PRBC)The Magnitude (MAGC)
Odd RatiosCIZOdds RatiosCIZ
(Intercept)1.040.60–1.830.154.050.73–22.221.60
Older population density0.960.91–1.00−1.820.82 *0.90–1.00−2.01
Distance to city center0.96 *0.91–1.00−1.991.21 ***1.09–1.353.39
Commercial amenities3.26 ***2.04–5.284.851.920.59–8.061.10
Public transportation1.49 *1.08–2.052.410.690.30–1.66−0.78
Medical centers0.840.39–1.78−0.461.790.46–16.080.74
Parks1.71 **0.55–0.922.640.860.31–2.99−0.26
Service quality1.21 *1.03–1.412.320.950.83–1.10−0.66
Facility size1.90 ***0.86–0.954.160.890.53–1.50−0.45
Log-likelihood−478.11 −137.75
AIC974.22 295.51
Pseudo R20.140 0.564
Note: (1) * p < 0.05, ** p < 0.01, *** p < 0.001. (2) Statistically significant variables are bolded. (3) The pseudo R2 for the model on probability (binary logistic regression) is calculated as Tjur’s R2, and the one for the model on magnitude (gamma regression) is calculated as Nagelkerke’s R2.
Disclaimer/Publisher’s Note: The statements, opinions and data contained in all publications are solely those of the individual author(s) and contributor(s) and not of MDPI and/or the editor(s). MDPI and/or the editor(s) disclaim responsibility for any injury to people or property resulting from any ideas, methods, instructions or products referred to in the content.