
Retrofit Analysis of Exterior Windows for Large Office Buildings in Different Climate Zones of China


Abstract
1. Introduction
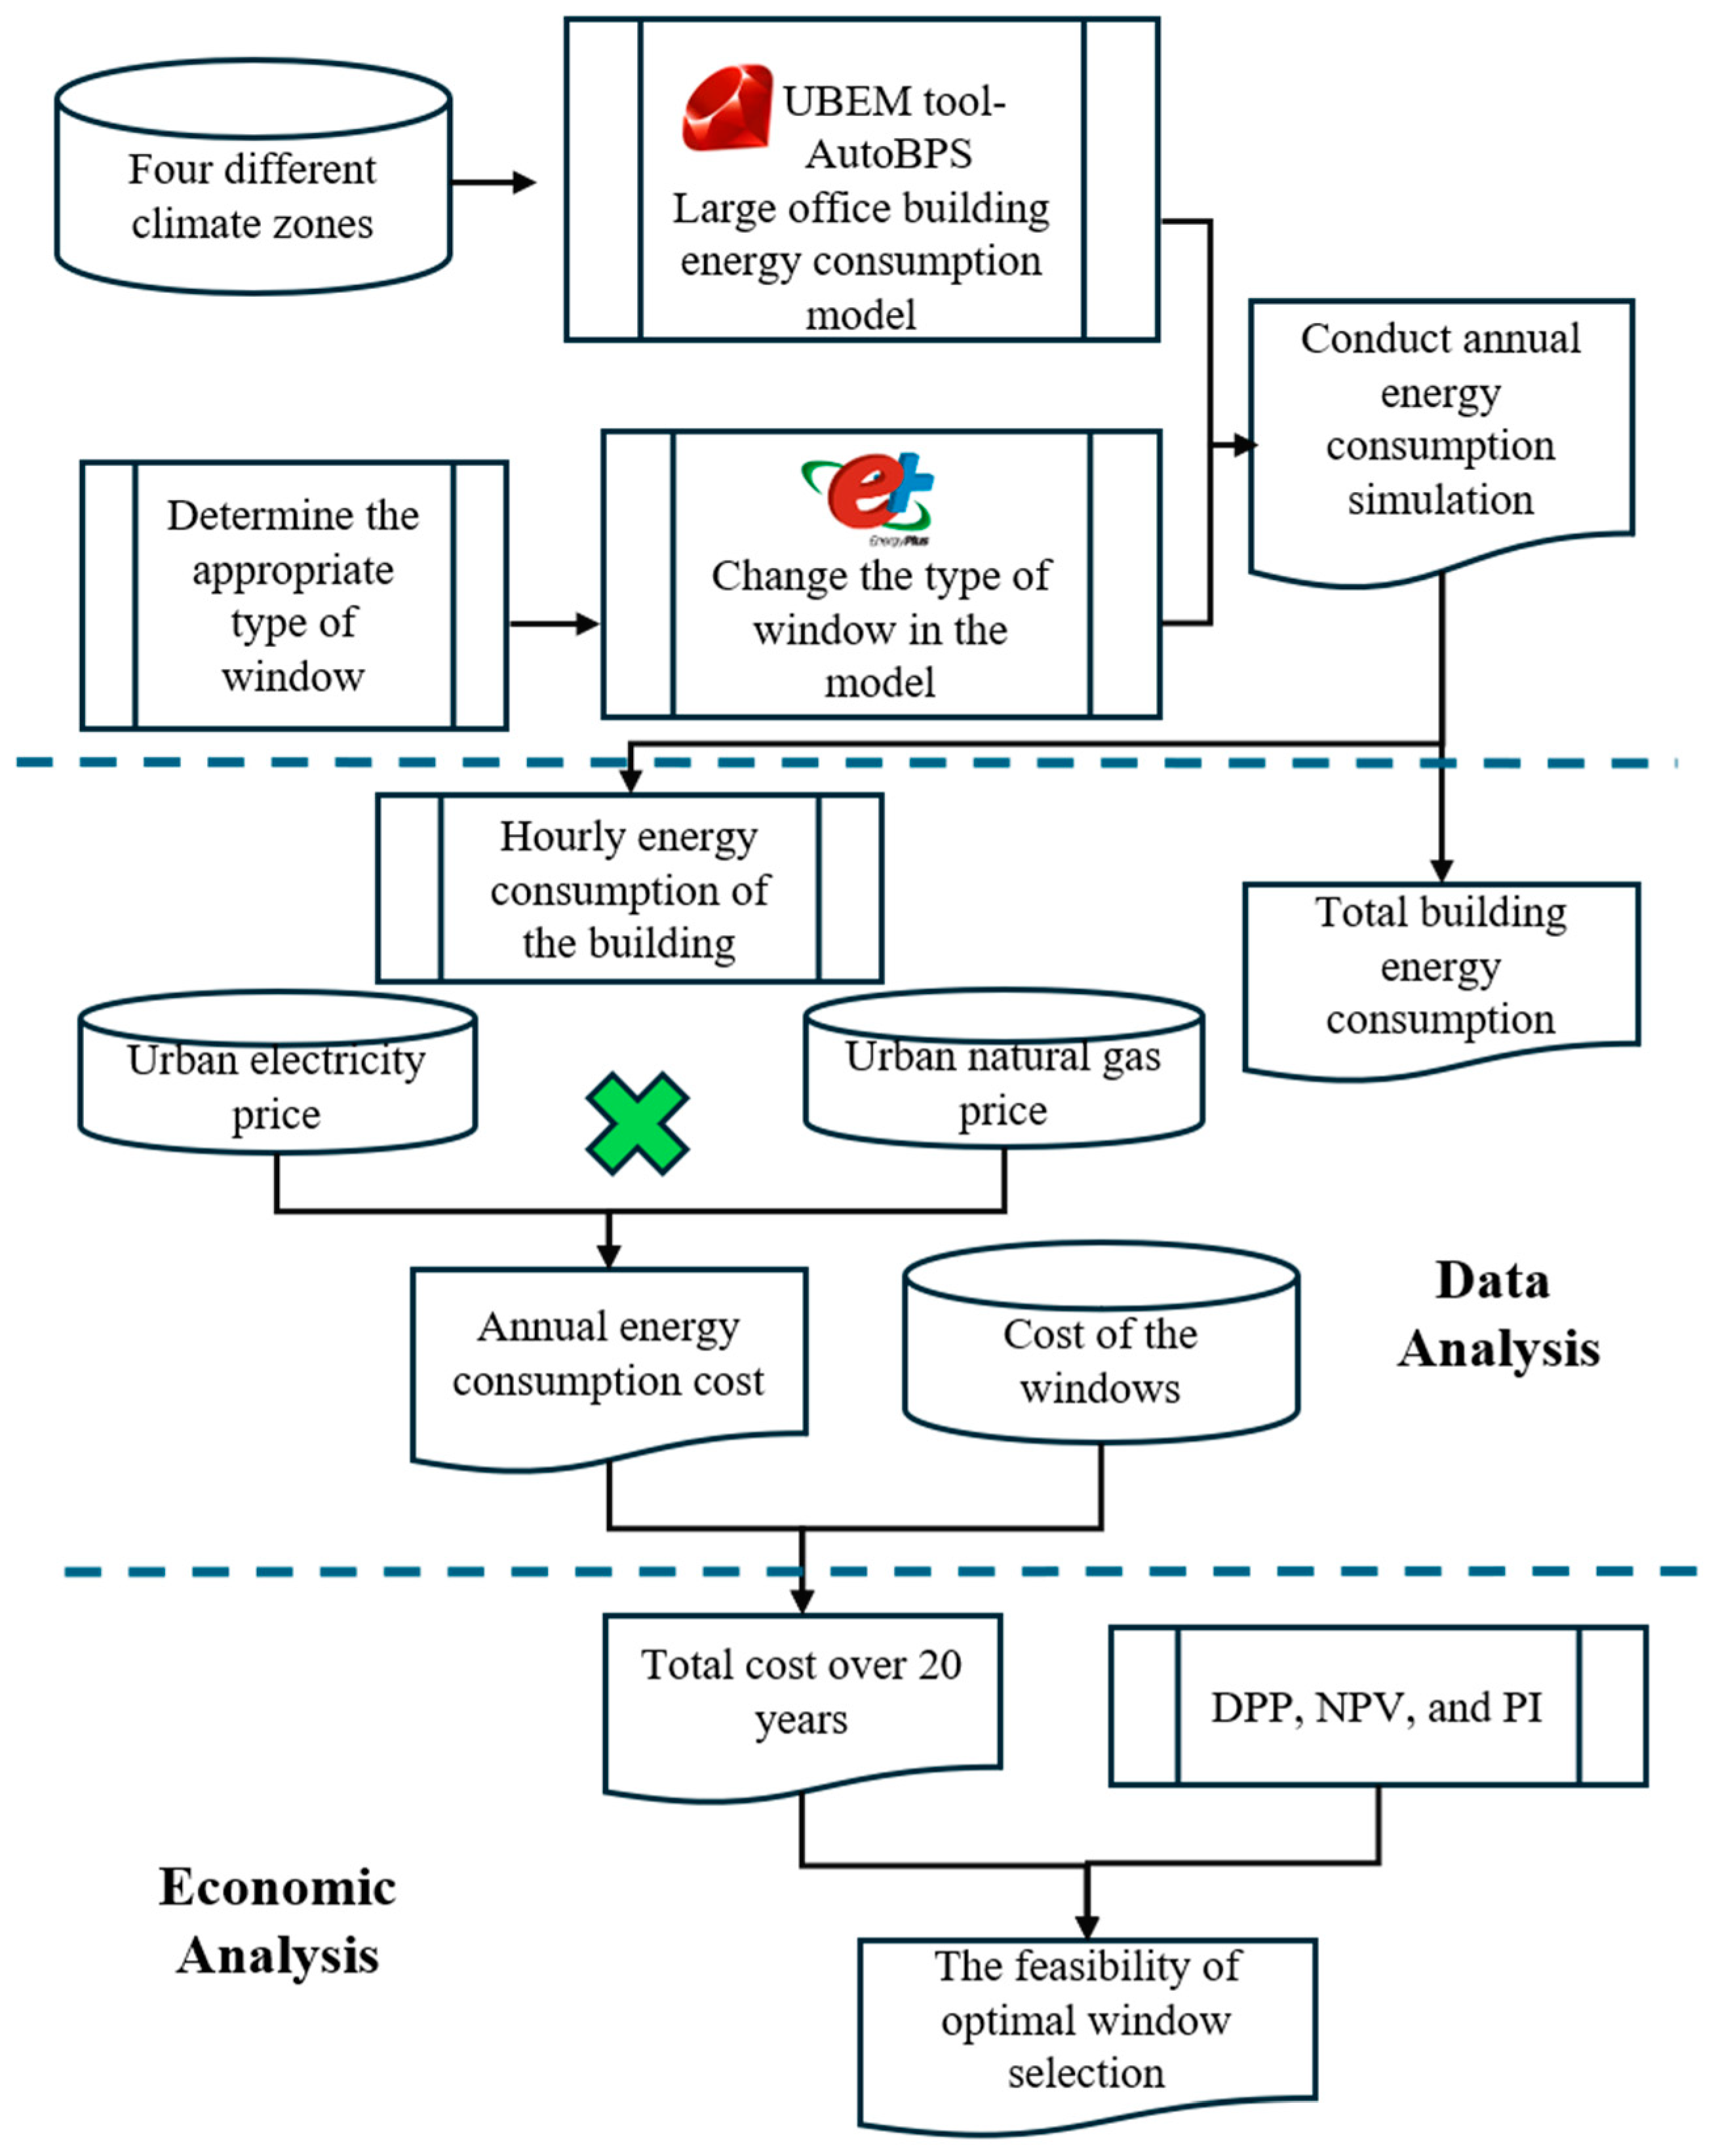
2. Methodology
2.1. Climate Zones and Weather Data
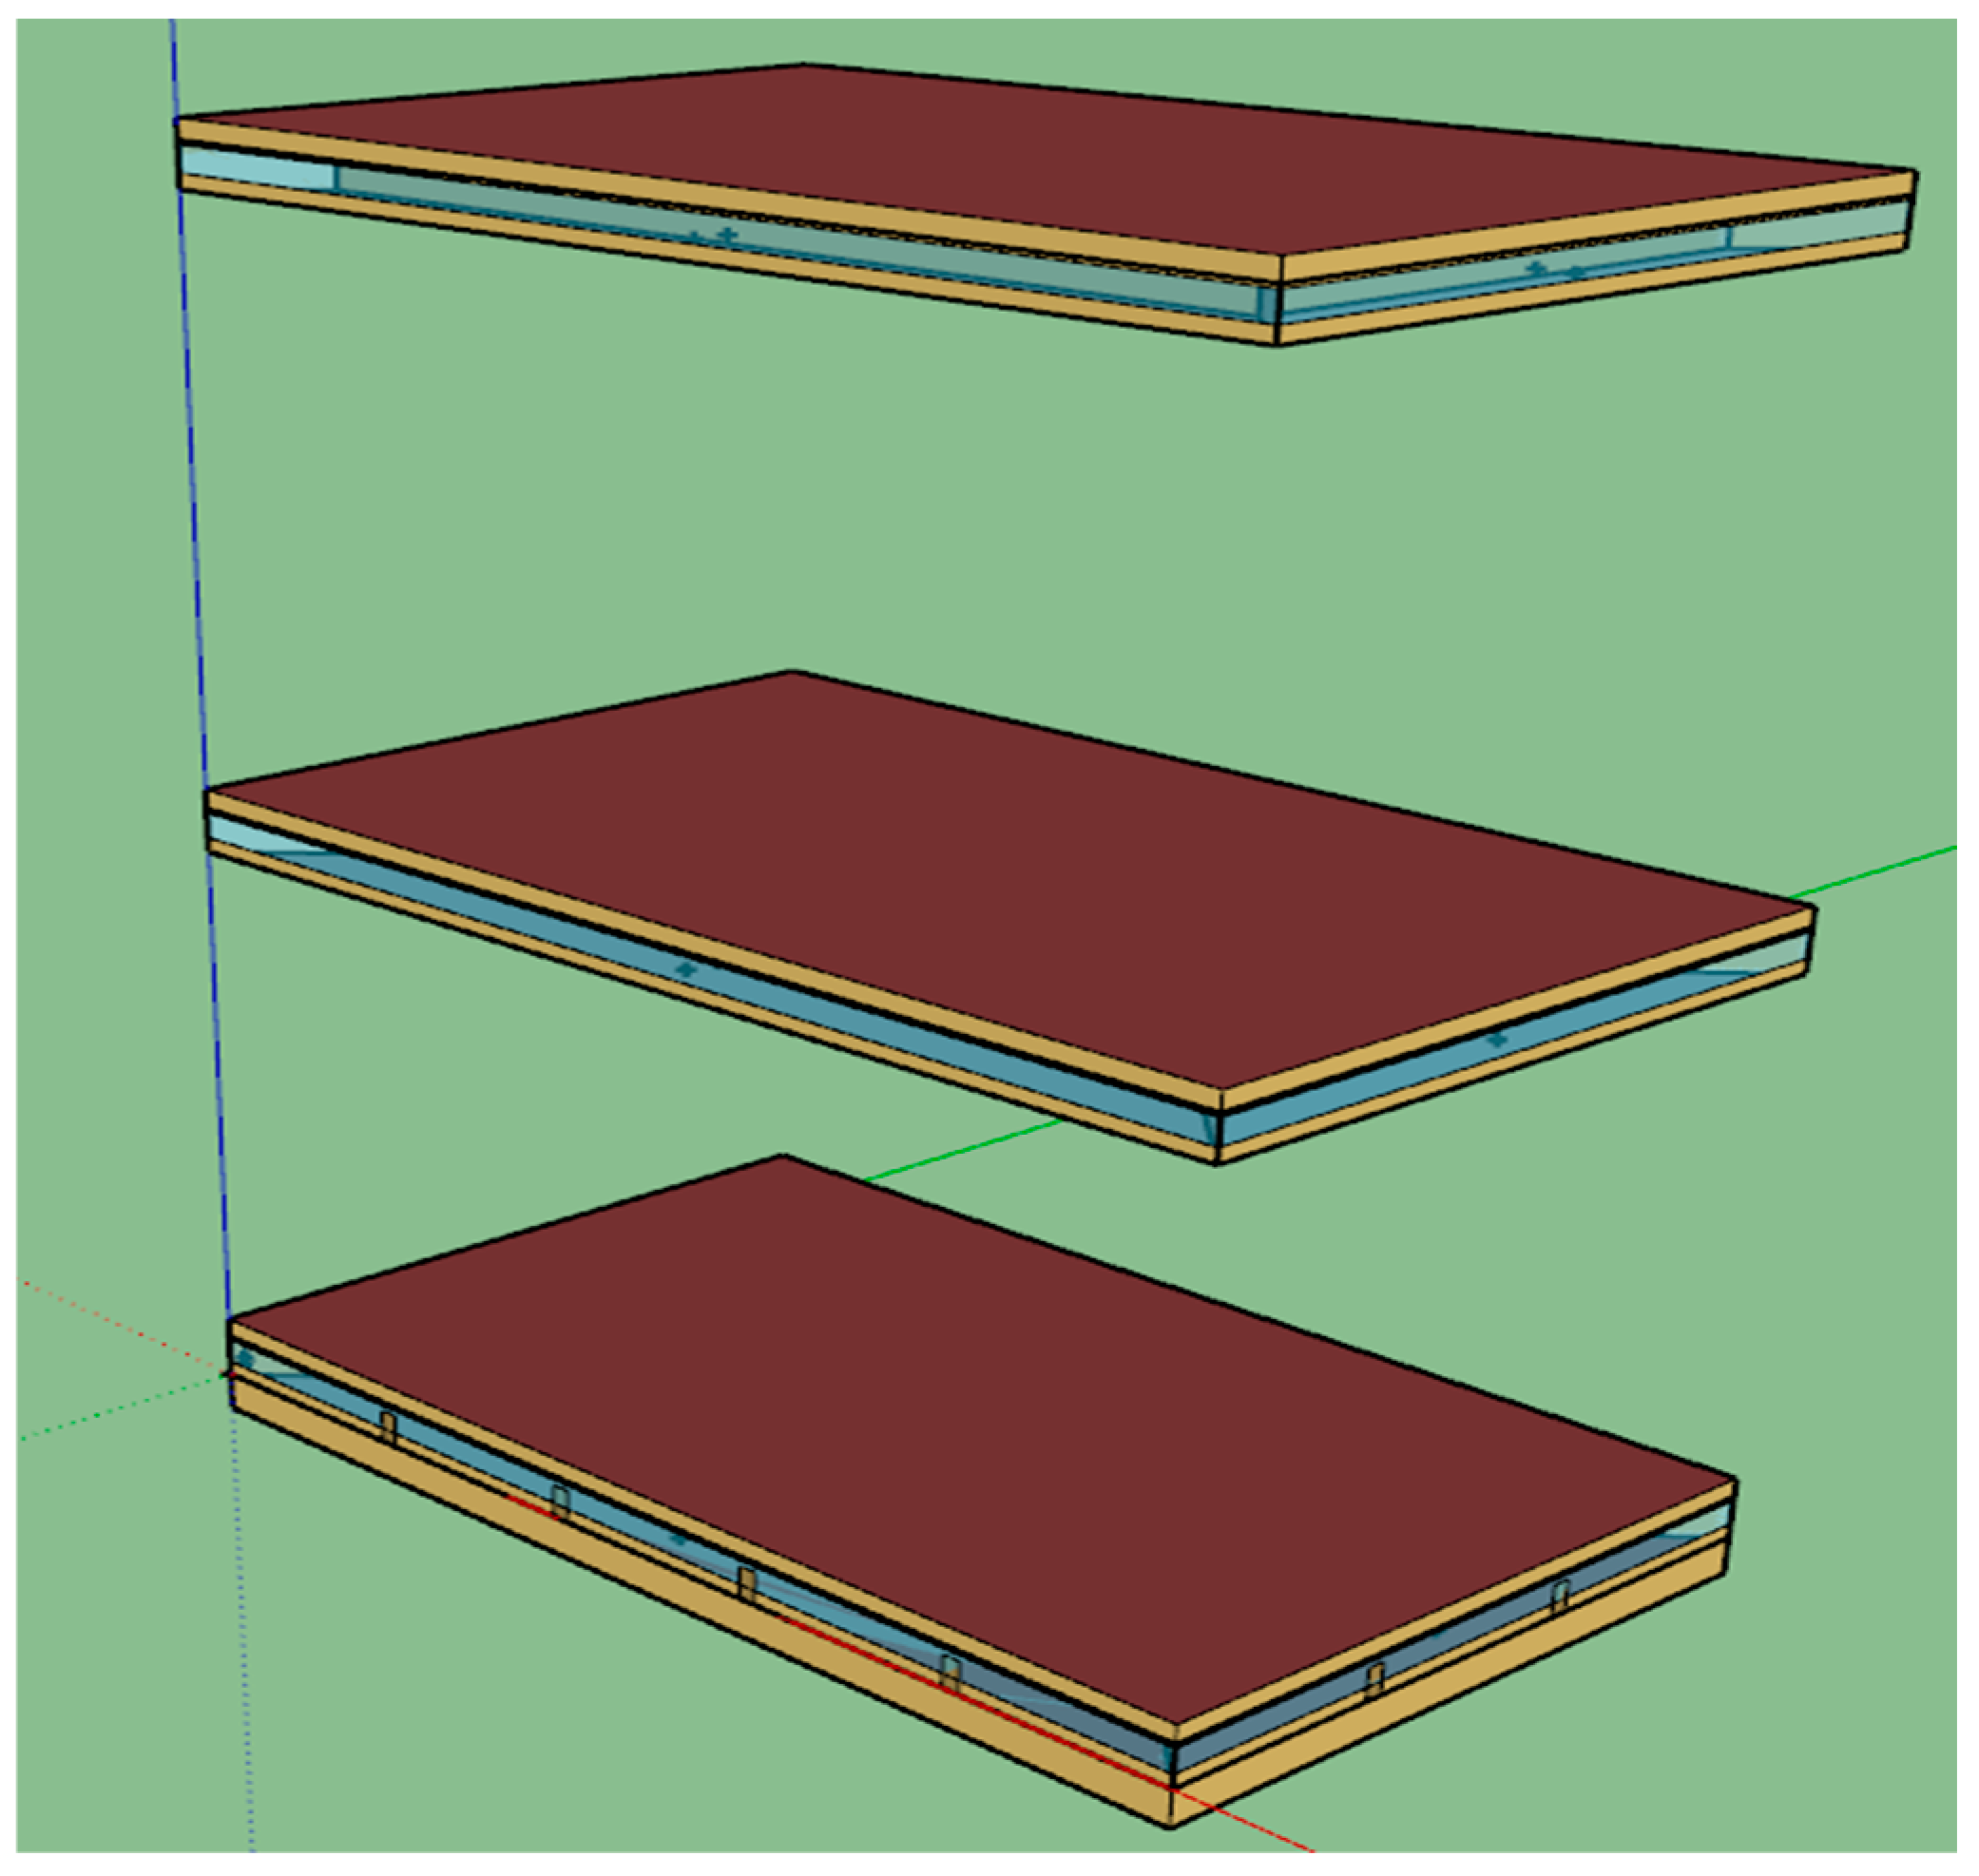
2.2. Generation of Baseline Energy Models for Large Office Buildings
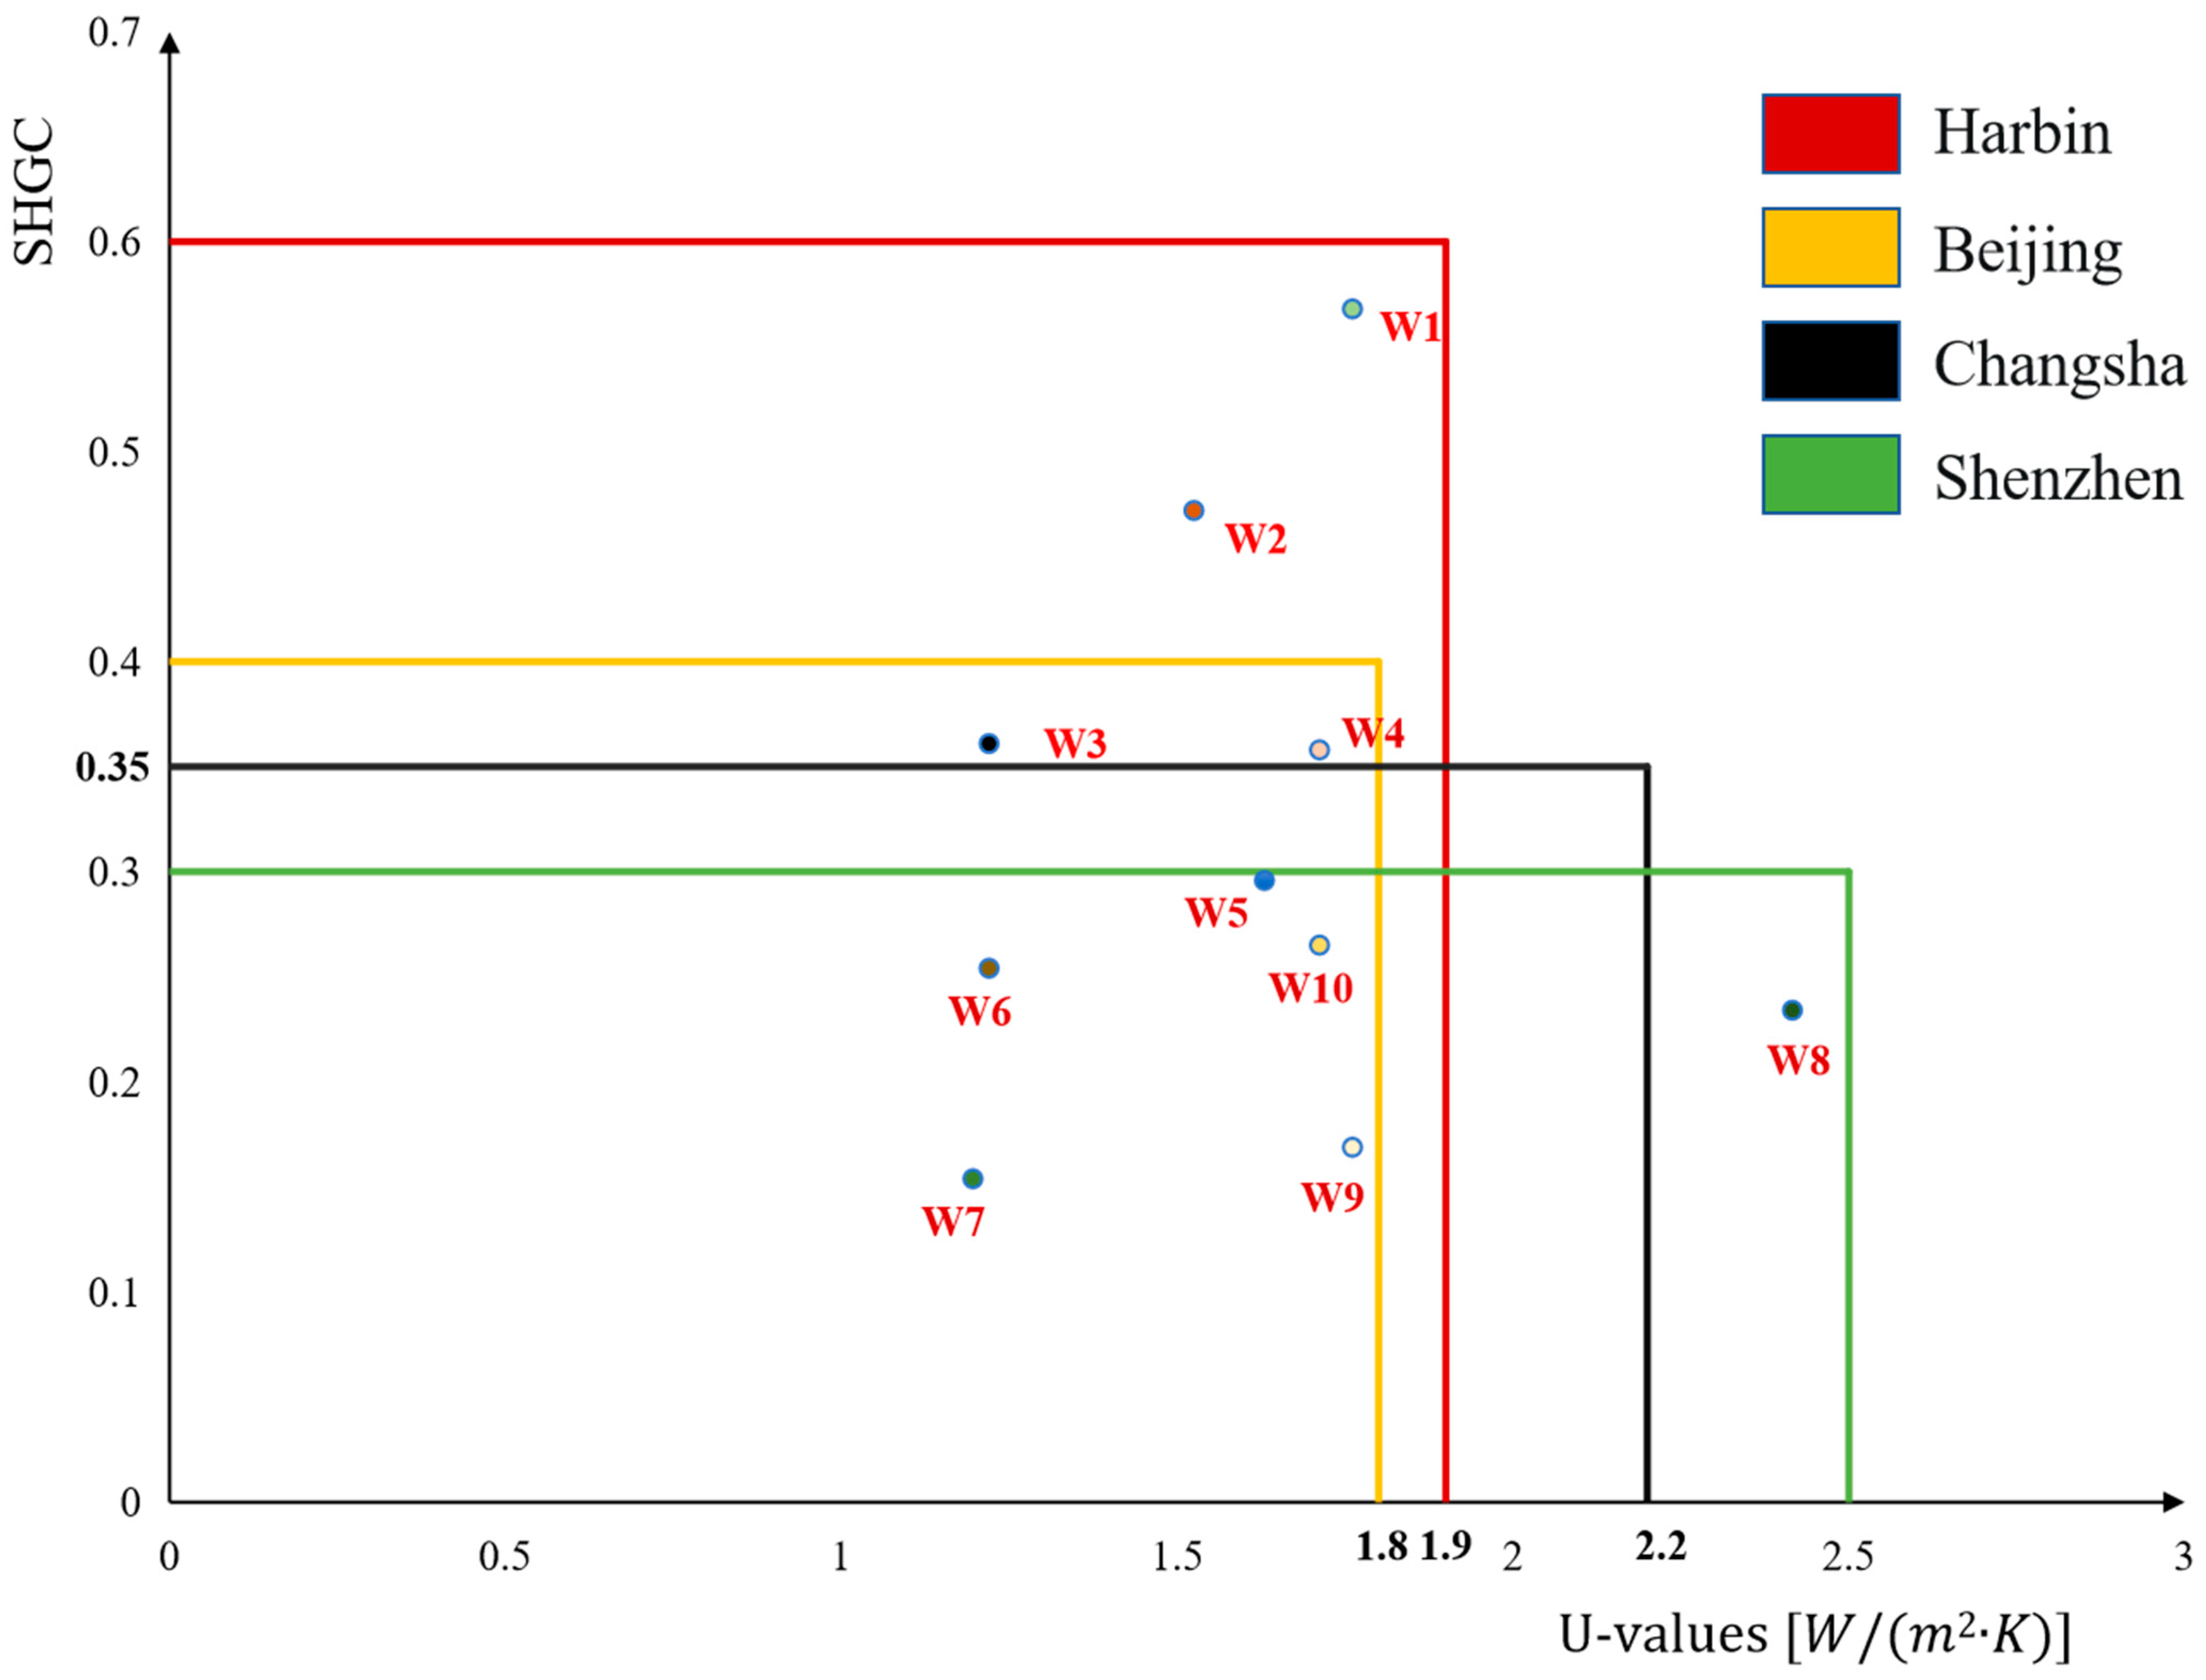
2.3. Window Type Selection
2.4. Cost and Energy Costs
2.4.1. Initial Total Investment of Window
2.4.2. Total Energy Cost
- Ph is the energy price corresponding to moment h;
- Qh is the energy consumption corresponding to the moment h, calculated from the hour-by-hour electric energy consumption and hour-by-hour natural gas energy consumption generated by EnergyPlus.
- ECy is the annual energy consumption cost for the retrofit cases;
- ECy is the annual energy consumption cost for the baseline or collected cases.
2.5. Economic Indicators
2.5.1. Cumulative Discounted Cash Flow Payback Period (DPP)
- Pw = price of ten different glass windows;
- Sw = total window area of the building;
- T = 20 years.
- Vt = unrecovered initial investment;
- Ct = net cash inflow during the period t, That is the energy cost that can be saved by replacing windows in each city;
- i = discounted rate;
- t = period in which cash inflows are related.
2.5.2. Net Present Value (NPV)
- Ct = net cash inflow during the period t; t is the number of time periods;
- i = discounted rate.
2.5.3. Profitability Index (PI)
- Ct = net cash inflow during the period t;
- t = the number of time periods.
3. Simulation Results
3.1. Baseline Simulation Results
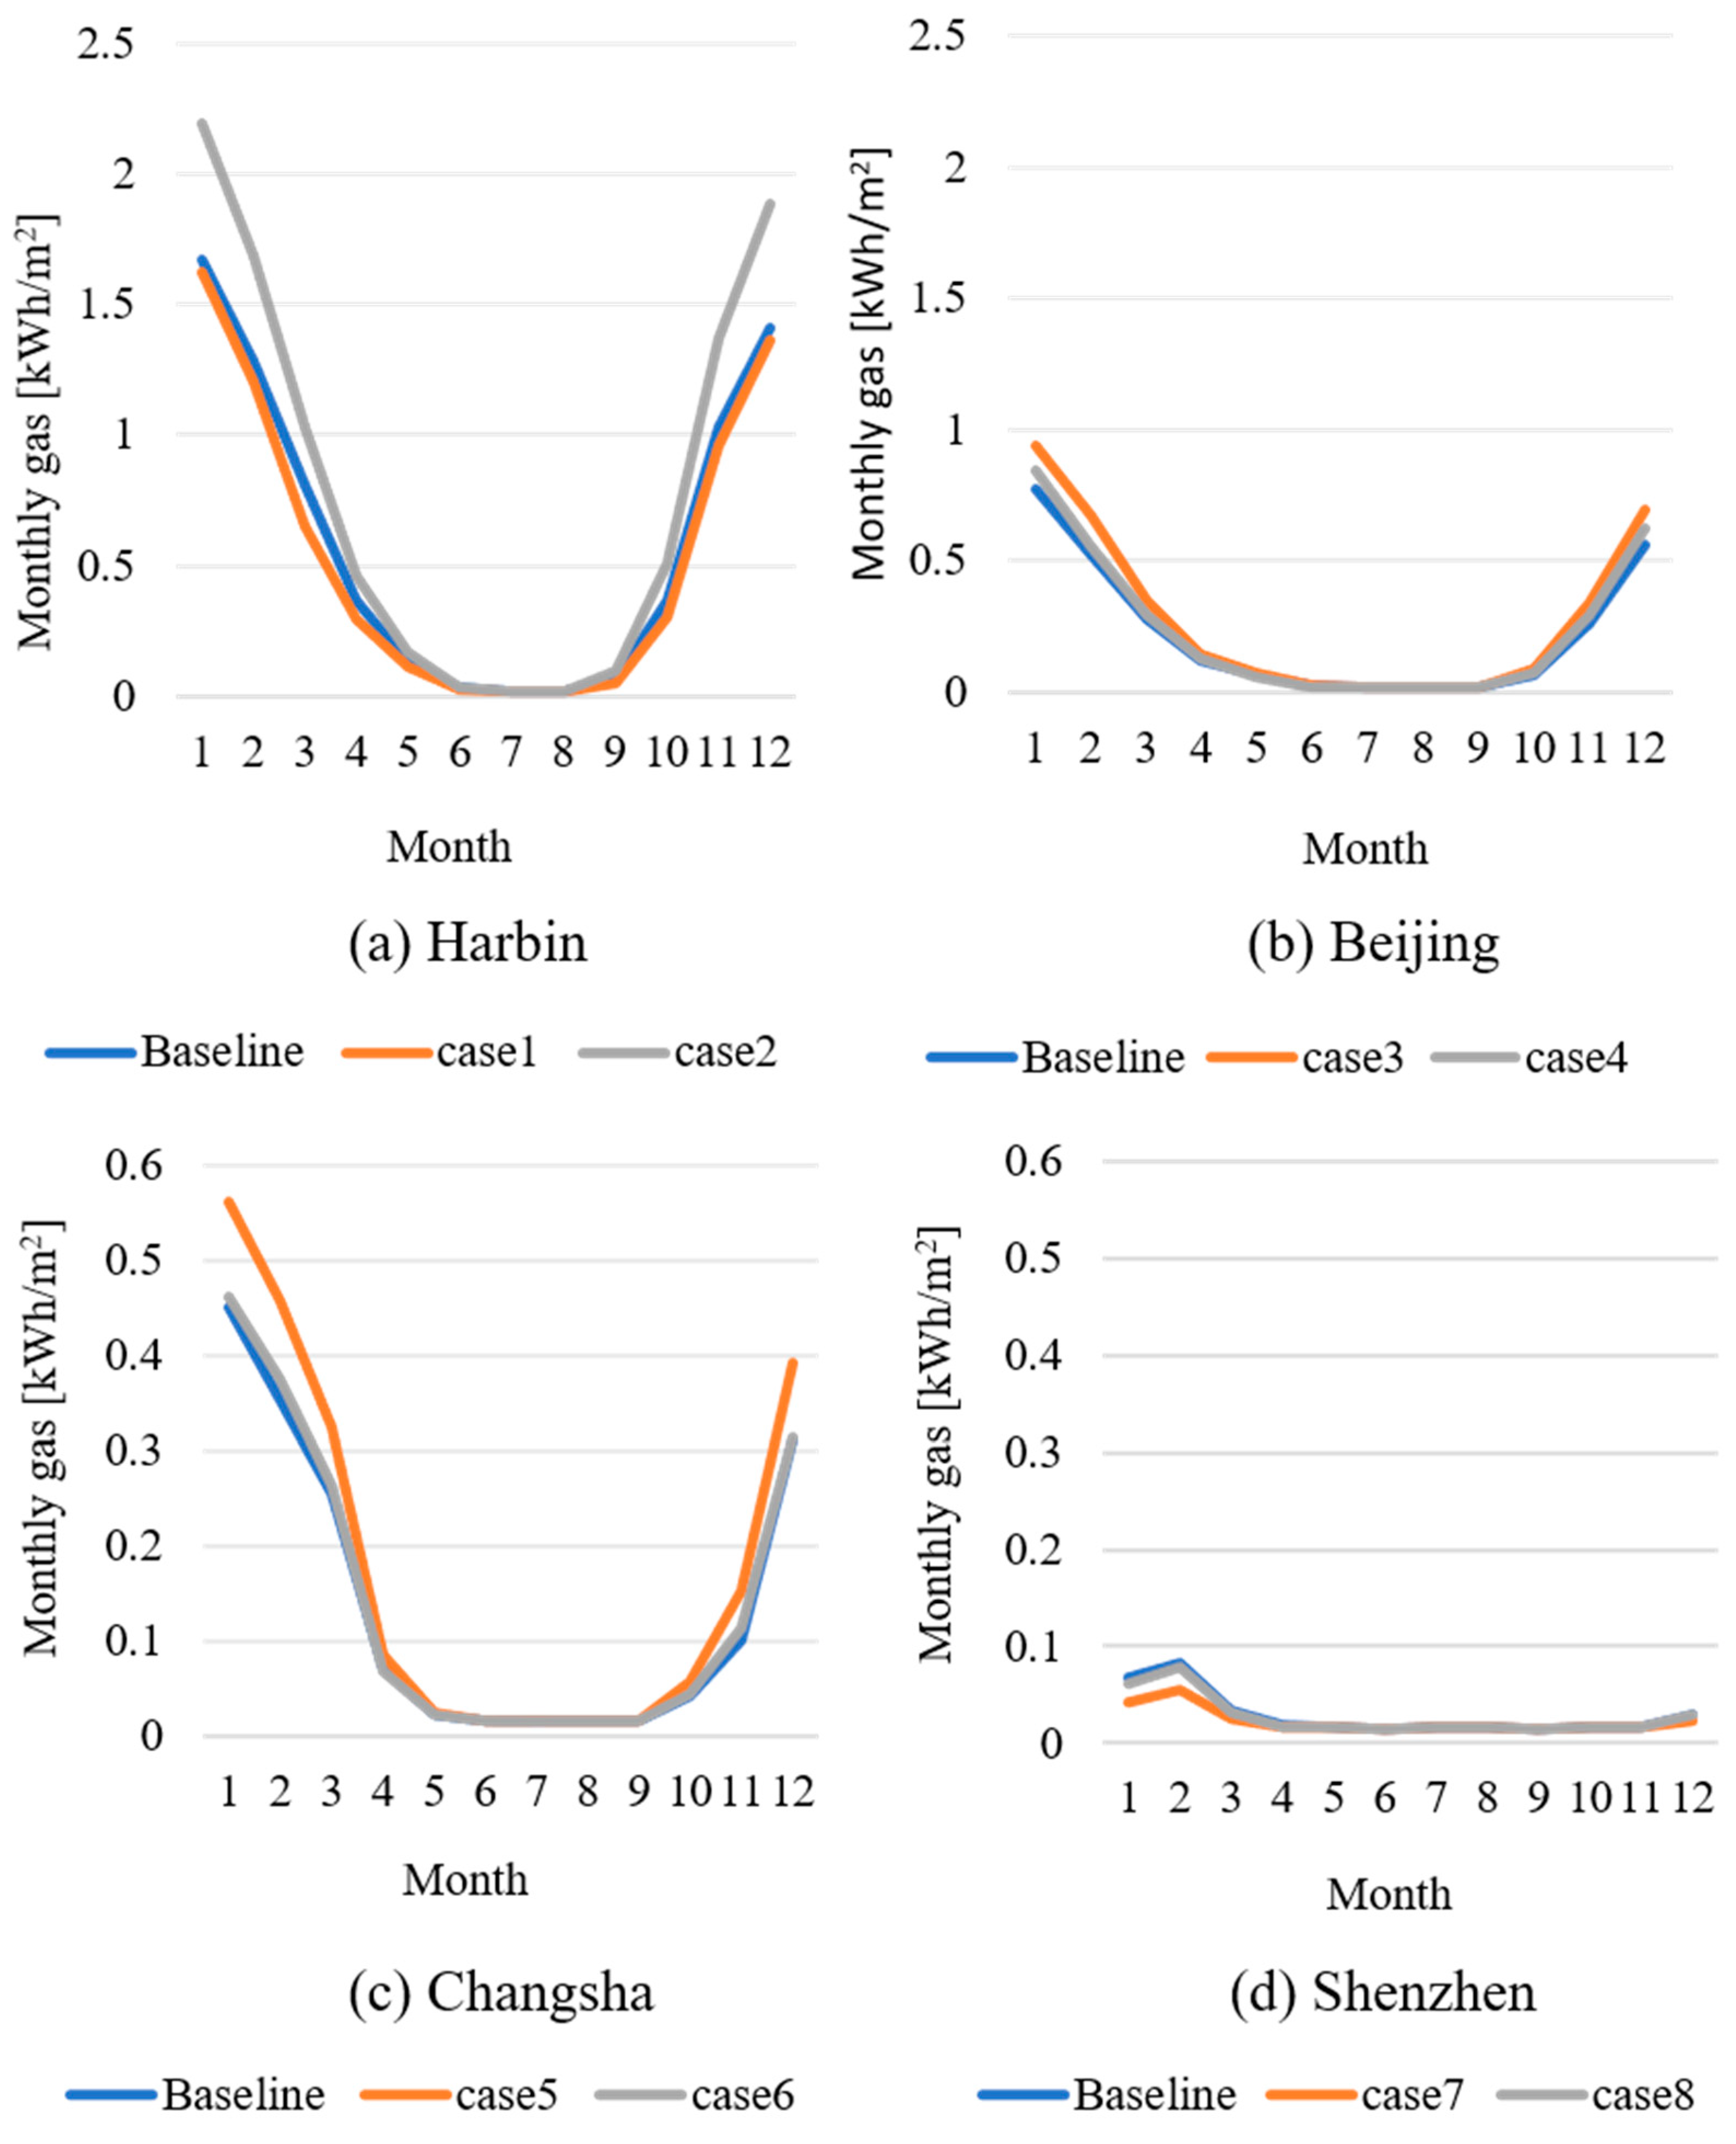
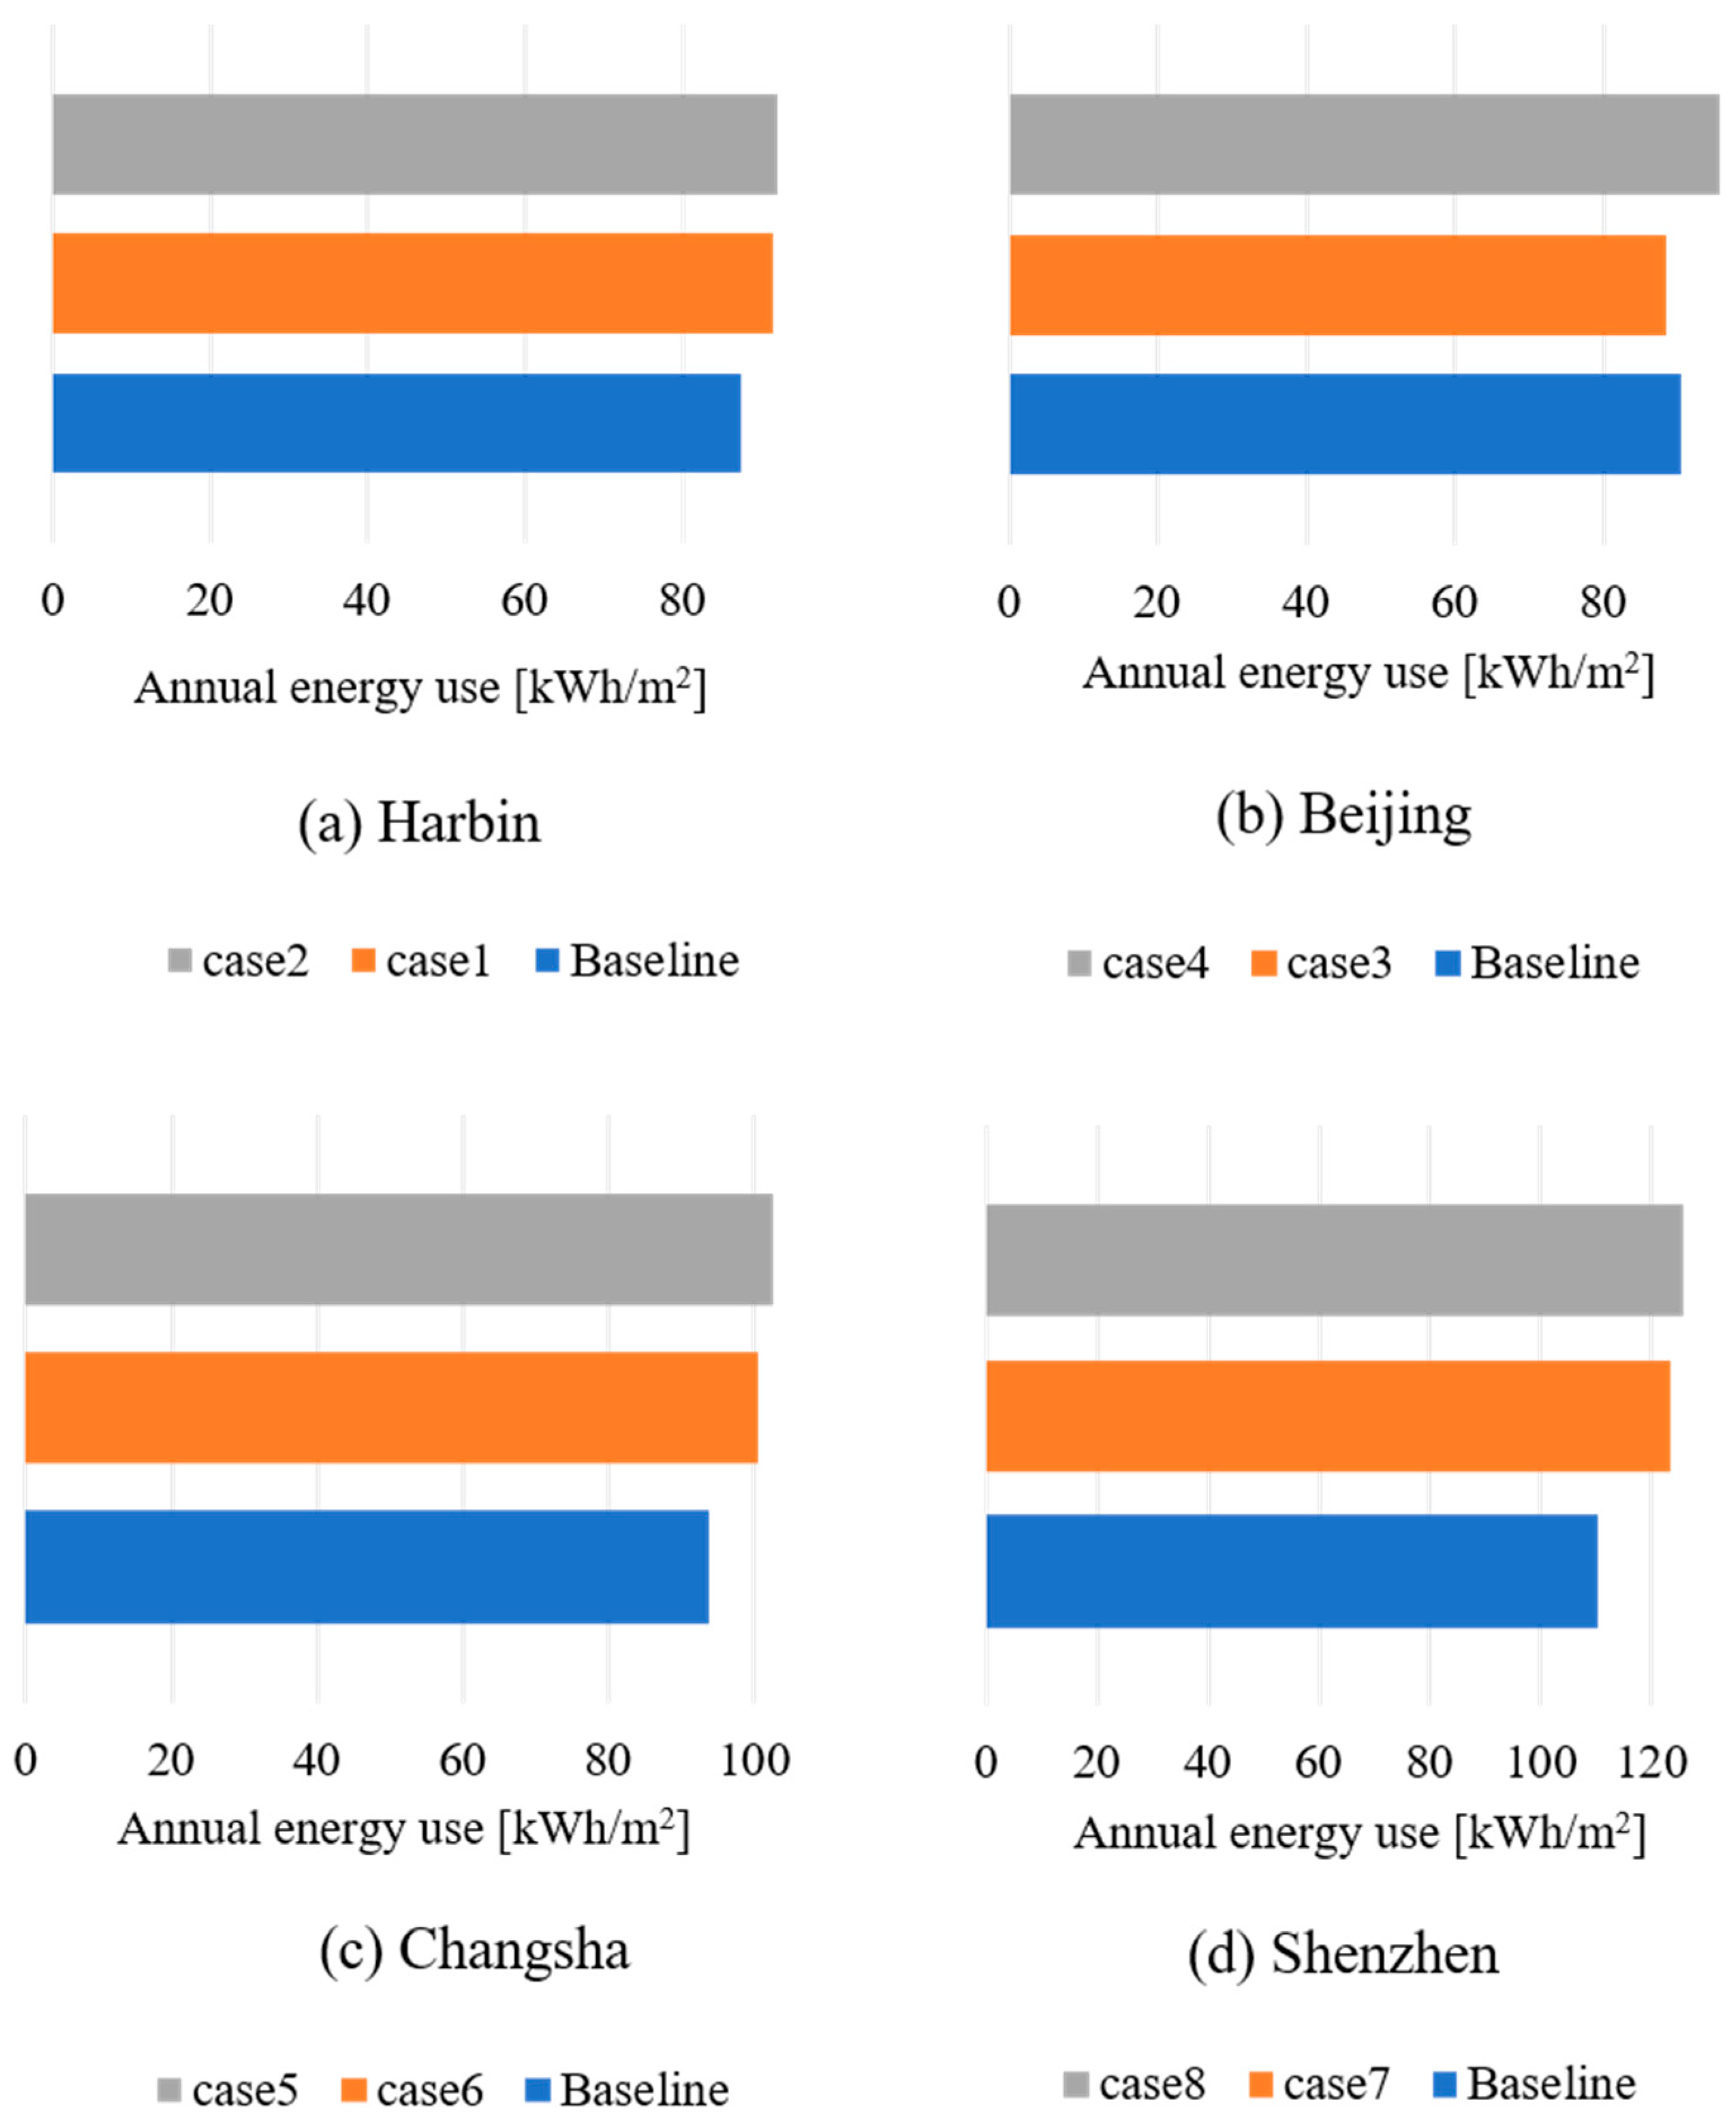
3.2. Retrofit Case Simulation Results
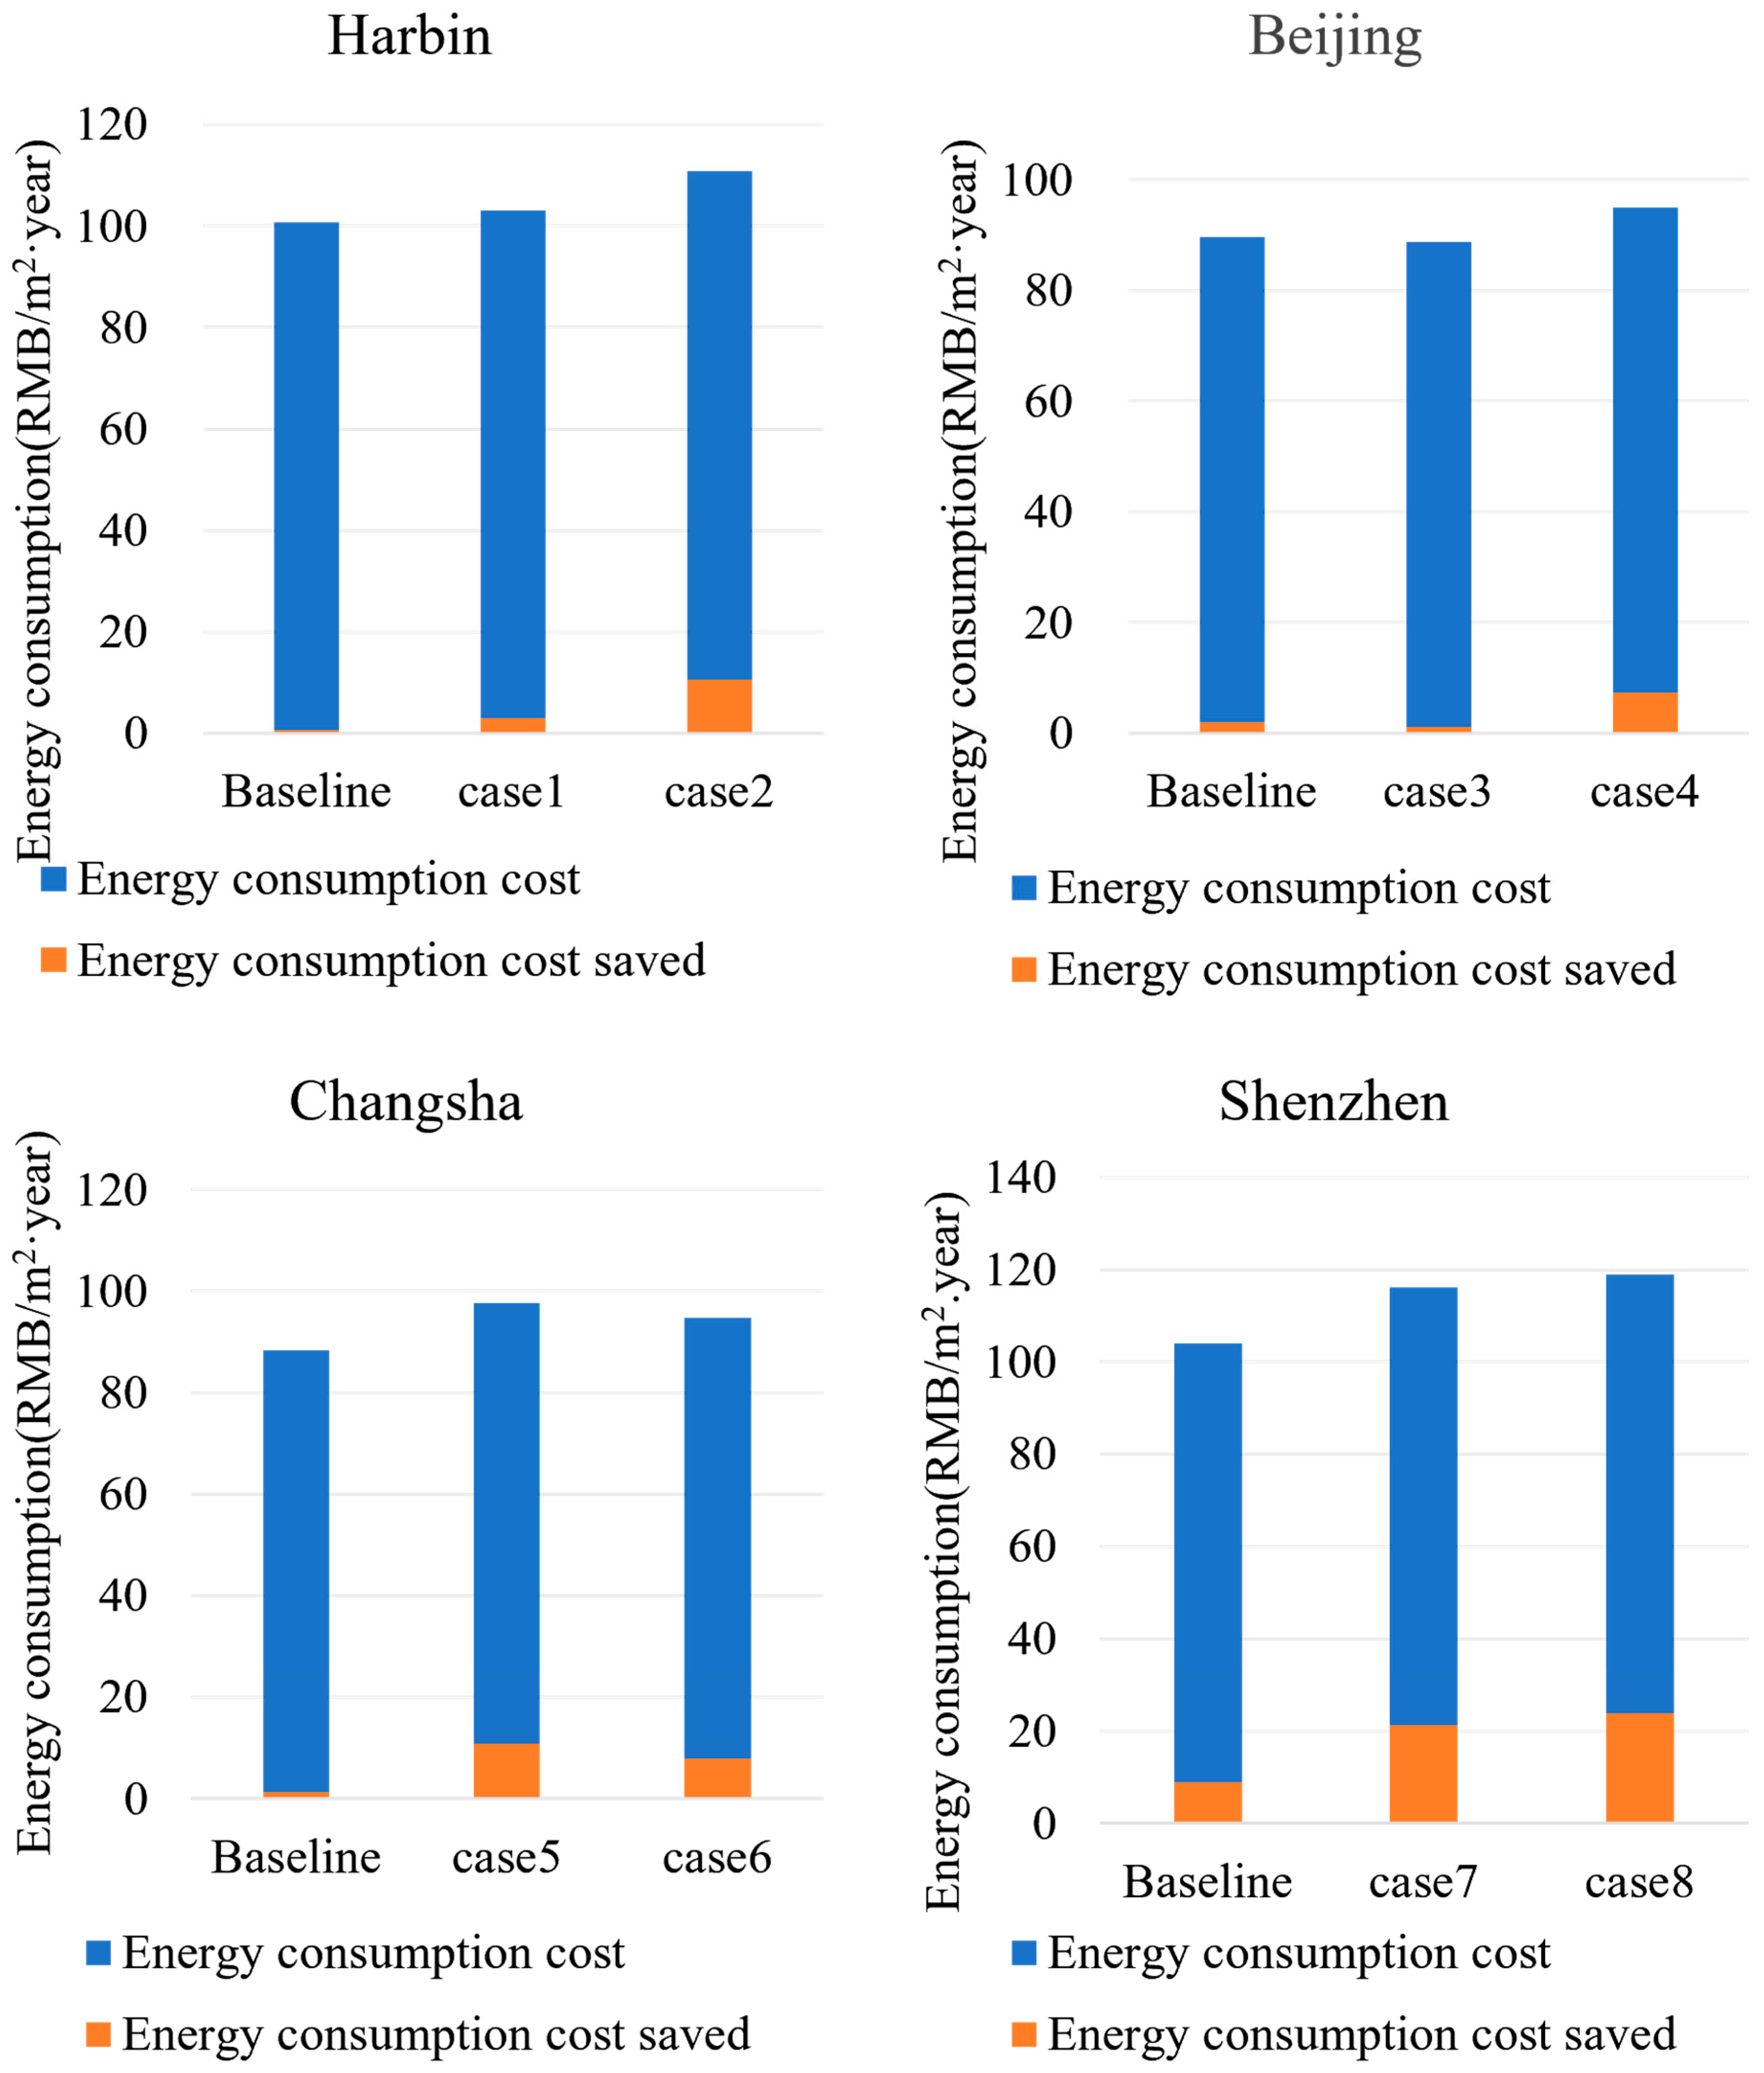
3.3. Economic Feasibility Analysis
4. Discussion
- (1)
- Window characteristics and retrofit effectiveness
- (2)
- Window selection strategies for climate zones
- (3)
- Policy implications
- (4)
- Limitations and future research directions
5. Conclusions
- (1)
- Economic evaluation beyond U-values and SHGC values
- (2)
- Economic feasibility in Changsha and Shenzhen
- (3)
- Policy recommendations for older buildings
Author Contributions
Funding
Data Availability Statement
Acknowledgments
Conflicts of Interest
References
- Tong, D.; Zhang, Q.; Zheng, Y.; Caldeira, K.; Shearer, C.; Hong, C.; Qin, Y.; Davis, S.J. Committed Emissions from Existing Energy Infrastructure Jeopardize 1.5 °C Climate Target. Nature 2019, 572, 373–377. [Google Scholar] [CrossRef]
- Ahmed, A.; Ge, T.; Peng, J.; Yan, W.C.; Tee, B.T.; You, S. Assessment of the Renewable Energy Generation towards Net-Zero Energy Buildings: A Review. Energy Build. 2022, 256, 111755. [Google Scholar] [CrossRef]
- Zhou, Y.; Fan, F.; Liu, Y.; Zhao, S.; Xu, Q.; Wang, S.; Luo, D.; Long, Y. Unconventional Smart Windows: Materials, Structures and Designs. Nano Energy 2021, 90, 106613. [Google Scholar] [CrossRef]
- Gaetani, I.; Hoes, P.J.; Hensen, J.L.M. Occupant Behavior in Building Energy Simulation: Towards a Fit-for-Purpose Modeling Strategy. Energy Build. 2016, 121, 188–204. [Google Scholar] [CrossRef]
- Uddin, M.M.; Ji, J.; Wang, C.; Zhang, C. Building Energy Conservation Potentials of Semi-Transparent CdTe Integrated Photovoltaic Window Systems in Bangladesh Context. Renew. Energy 2023, 207, 512–530. [Google Scholar] [CrossRef]
- Yin, H.; Zhou, X.; Zhou, Z.; Liu, R.; Mo, X.; Chen, Z.; Yang, E.; Huang, Z.; Li, H.; Wu, H.; et al. Switchable Kirigami Structures as Window Envelopes for Energy-Efficient Buildings. Research 2023, 6, 0103. [Google Scholar] [CrossRef]
- Altun, A.F. Determination of Optimum Building Envelope Parameters of a Room Concerning Window-to-Wall Ratio, Orientation, Insulation Thickness and Window Type. Buildings 2022, 12, 383. [Google Scholar] [CrossRef]
- Kirankumar, G.; Saboor, S.; Vali, S.S.; Mahapatra, D.; Talanki Puttaranga Setty, A.B.; Kim, K.H. Thermal and Cost Analysis of Various Air Filled Double Glazed Reflective Windows for Energy Efficient Buildings. J. Build. Eng. 2020, 28, 101055. [Google Scholar] [CrossRef]
- RollCar, M.K.; Anderson, A.M.; Mangu, S.T.; Hajjaj, Z.; Capron, M. Aesthetic Aerogel Window Design for Sustainable Buildings. Sustainability 2022, 14, 2887. [Google Scholar] [CrossRef]
- Nundy, S.; Mesloub, A.; Alsolami, B.M.; Ghosh, A. Electrically Actuated Visible and Near-Infrared Regulating Switchable Smart Window for Energy Positive Building: A Review. J. Clean. Prod. 2021, 301, 126854. [Google Scholar] [CrossRef]
- Zhang, S.; Hu, W.; Li, D.; Zhang, C.; Ar, M. Energy Ef Fi Ciency Optimization of PCM and Aerogel-Fi Lled Multiple Glazing Windows. Energy 2021, 222, 119916. [Google Scholar] [CrossRef]
- Fu, J.; Feng, C.; Liao, Y.; Mao, M.; Liu, H.; Liu, K. Broadband Light Management in Hydrogel Glass for Energy Efficient Windows. Front. Optoelectron. 2022, 15, 33. [Google Scholar] [CrossRef] [PubMed]
- Shi, S.; Zhu, N.; Wu, S.; Song, Y. Evaluation and Analysis of Transmitted Daylight Color Quality for Different Colored Semi-Transparent PV Glazing. Renew. Energy 2024, 222, 119826. [Google Scholar] [CrossRef]
- Abraham, E.; Cherpak, V.; Senyuk, B.; ten Hove, J.B.; Lee, T.; Liu, Q.; Smalyukh, I.I. Highly Transparent Silanized Cellulose Aerogels for Boosting Energy Efficiency of Glazing in Buildings. Nat. Energy 2023, 8, 381–396. [Google Scholar] [CrossRef]
- Mendes, V.F.; Cruz, A.S.; Gomes, A.P.; Mendes, J.C. A Systematic Review of Methods for Evaluating the Thermal Performance of Buildings through Energy Simulations. Renew. Sustain. Energy Rev. 2024, 189, 113875. [Google Scholar] [CrossRef]
- Chen, X.; Qiu, Y.; Wang, X. A Systematic Review of Research Methods and Economic Feasibility of Photovoltaic Integrated Shading Device. Energy Build. 2024, 311, 114172. [Google Scholar] [CrossRef]
- Farzaneh, S.; Motlagh, M.; Sohani, A.; Saghafi, M.D.; Sayyaadi, H.; Nastasi, B. The Road to Developing Economically Feasible Plans for Green, Comfortable and Energy Efficient Buildings. Energies 2021, 14, 636. [Google Scholar] [CrossRef]
- Hussain, S.N.; Ghosh, A. Highly Insulated Hydrogen Powered Vacuum Gasochromic Smart Windows for Energy-Efficient Buildings. J. Build. Eng. 2024, 97, 110855. [Google Scholar] [CrossRef]
- Gao, Y.; Zheng, Q.; Jonsson, J.C.; Lubner, S.; Curcija, C.; Fernandes, L.; Kaur, S.; Kohler, C. Parametric Study of Solid-Solid Translucent Phase Change Materials in Building Windows. Appl. Energy 2021, 301, 117467. [Google Scholar] [CrossRef]
- Zhang, Y.; Tennakoon, T.; Chan, Y.H.; Chan, K.C.; Fu, S.C.; Tso, C.Y.; Yu, K.M.; Huang, B.L.; Yao, S.H.; Qiu, H.H.; et al. Energy Consumption Modelling of a Passive Hybrid System for Office Buildings in Different Climates. Energy 2022, 239, 121914. [Google Scholar] [CrossRef]
- Ma, Y.; Li, D.; Yang, R.; Zhang, S.; Arıcı, M.; Liu, C.; Zhang, C. Energy and Daylighting Performance of a Building Containing an Innovative Glazing Window with Solid-Solid Phase Change Material and Silica Aerogel Integration. Energy Convers. Manag. 2022, 271, 116341. [Google Scholar] [CrossRef]
- Nicoletti, F.; Kaliakatsos, D.; Ferraro, V.; Cucumo, M.A. Analysis of the Energy and Visual Performance of a Building with Photochromic Windows for a Location in Southern Italy. Build. Environ. 2022, 224, 109570. [Google Scholar] [CrossRef]
- Ali, H.; Hashlamun, R. Envelope Retrofitting Strategies for Public School Buildings in Jordan. J. Build. Eng. 2019, 25, 100819. [Google Scholar] [CrossRef]
- Chiradeja, P.; Thongsuk, S.; Ananwattanaporn, S.; Ngaopitakkul, A.; Yoomak, S. A Study on Transparent Type Envelope Material in Terms of Overall Thermal Transfer, Energy, and Economy for an Office Building Based on the Thai Building Energy Code. Sustainability 2023, 15, 10435. [Google Scholar] [CrossRef]
- Liu, J.; Yang, R.; Zhang, J.; Tao, Q.; Li, A.; Liu, Z.; Su, Y.; Liu, Y. Dual-Function Smart Windows with Dynamic and Fast Thermal Response for Building Energy-Saving/Storage. Sol. Energy Mater. Sol. Cells 2023, 249, 112048. [Google Scholar] [CrossRef]
- Heydari, A.; Sadati, S.E.; Gharib, M.R. Effects of Different Window Configurations on Energy Consumption in Building: Optimization and Economic Analysis. J. Build. Eng. 2021, 35, 102099. [Google Scholar] [CrossRef]
- Kowalczyk, Z.; Tomasik, M. Economic and Energy Analysis of the Operation of Windows in Residential Buildings in Poland. Energies 2023, 16, 6810. [Google Scholar] [CrossRef]
- Moghaddam, S.A.; Mattsson, M.; Ameen, A.; Akander, J.; Da Gameiro Silva, M.; Simões, N. Low-Emissivity Window Films as an Energy Retrofit Option for a Historical Stone Building in Cold Climate. Energies 2021, 14, 7584. [Google Scholar] [CrossRef]
- Foroughi, R.; Asadi, S.; Khazaeli, S. On the Optimization of Energy Efficient Fenestration for Small Commercial Buildings in the United States. J. Clean. Prod. 2021, 283, 124604. [Google Scholar] [CrossRef]
- GB 50352-2019; Uniform Standard for Design of Civil Buildings. China Architecture & Building Press: Beijing, China, 2019.
- Deng, Z.; Chen, Y.; Yang, J.; Causone, F. AutoBPS: A Tool for Urban Building Energy Modeling to Support Energy Efficiency Improvement at City-Scale. Energy Build. 2023, 282, 112794. [Google Scholar] [CrossRef]
- Yang, J.; Zhang, Q.; Peng, C.; Chen, Y. AutoBPS-Prototype: A Web-Based Toolkit to Automatically Generate Prototype Building Energy Models with Customizable Efficiency Values in China. Energy Build. 2024, 305, 113880. [Google Scholar] [CrossRef]
- Zhao, W.; Deng, Z.; Ji, Y.; Song, C.; Yuan, Y.; Wang, Z.; Chen, Y. Analysis of Peak Demand Reduction and Energy Saving in a Mixed-Use Community through Urban Building Energy Modeling. Energies 2024, 17, 1214. [Google Scholar] [CrossRef]
- Song, C.; Deng, Z.; Zhao, W.; Yuan, Y.; Liu, M.; Xu, S.; Chen, Y. Developing Urban Building Energy Models for Shanghai City with Multi-Source Open Data. Sustain. Cities Soc. 2024, 106, 105425. [Google Scholar] [CrossRef]
- Ji, Y.; Li, G.; Su, F.; Chen, Y.; Zhang, R. Retrofit Analysis of City-Scale Residential Buildings in the Hot Summer and Cold Winter Climate Zone. Energies 2023, 16, 6152. [Google Scholar] [CrossRef]
- Peng, C.; Chen, Z.; Yang, J.; Liu, Z.; Yan, D.; Chen, Y. Assessment of Electricity Consumption Reduction Potential for City-Scale Buildings under Different Demand Response Strategies. Energy Build. 2023, 297, 113473. [Google Scholar] [CrossRef]
- Ren, Z.; Chen, Y.; Song, C.; Liu, M.; Xu, A.; Zhang, Q. Economic Analysis of Rooftop Photovoltaics System under Different Shadowing Conditions for 20 Cities in China. In Building Simulation; Tsinghua University Press: Beijing, China, 2023. [Google Scholar] [CrossRef]
- Su, F.; Wang, Z.; Yuan, Y.; Song, C.; Zeng, K.; Chen, Y.; Zhang, R. Enhanced Operation of Ice Storage System for Peak Load Management in Shopping Malls across Diverse Climate Zones. Sustainability 2023, 15, 14759. [Google Scholar] [CrossRef]
- Yang, L.; Lam, J.C.; Tsang, C.L. Energy Performance of Building Envelopes in Different Climate Zones in China. Appl. Energy 2008, 85, 800–817. [Google Scholar] [CrossRef]
- GB50176-2016; Code for Thermal Design of Civil Building. China Architecture & Building Press: Beijing, China, 2016.
- ANSI/ASHRAE 169-2021; Climatic Data for Building Design Standards. American Society of Heating, Refrigerating and Air-Conditioning Engineers, Inc.: Washington, DC, USA, 2021.
- GB 50189–2015; Ministry of Housing and Urban-Rural Development, Design Standard for Energy Efficiency of Public Buildings. China Architecture & Building Press: Beijing, China, 2015.
- Huang, J.; Lv, H.; Gao, T.; Feng, W.; Chen, Y.; Zhou, T. Thermal Properties Optimization of Envelope in Energy-Saving Renovation of Existing Public Buildings. Energy Build. 2014, 75, 504–510. [Google Scholar] [CrossRef]
- Hee Chung, M.; Eun Kim, S.; Woo Song, Y.; Chul Park, J. Strategies for Improving Impact of Energy Renovation: A Case Study on Korean Daycare Centers. Energy Build. 2023, 284, 112844. [Google Scholar] [CrossRef]
- Wang, P.; Gong, G.; Wang, Y.; Li, L. Thermodynamic Investigation of Building Integrated Energy Efficiency for Building Retrofit. Energy Build. 2014, 77, 139–148. [Google Scholar] [CrossRef]
- Xiang, Q.C.; Feng, X.P.; Jia, X.Y.; Cai, L.; Chen, R. Reducing Carbon Dioxide Emissions through Energy-Saving Renovation of Existing Buildings. Aerosol Air Qual. Res. 2019, 19, 2732–2745. [Google Scholar] [CrossRef]
- Aksamija, A. Impact of Retrofitting Energy-Efficient Design Strategies on Energy Use of Existing Commercial Buildings: Comparative Study of Low-Impact and Deep Retrofit Strategies. J. Green Build. 2017, 12, 70–88. [Google Scholar] [CrossRef]
- GB55015-2021; General Code for Energy Efficiency and Renewable Energy Application in Buildings. China Architecture & Building Press: Beijing, China, 2021.
- Knoke, T.; Gosling, E.; Paul, C. Use and Misuse of the Net Present Value in Environmental Studies. Ecol. Econ. 2020, 174, 106664. [Google Scholar] [CrossRef]
- Chiradeja, P.; Ngaopitakkul, A. Energy and Economic Analysis of Tropical Building Envelope Material in Compliance with Thailand’s Building Energy Code. Sustainability 2019, 11, 6872. [Google Scholar] [CrossRef]
- Ahsan Kabir, M.; Hasan, M.M.; Hossain, T.; Ahnaf, A.; Monir, H. Sustainable Energy Transition in Bangladeshi Academic Buildings: A Techno-Economic Analysis of Photovoltaic-Based Net Zero Energy Systems. Energy Build. 2024, 312, 114205. [Google Scholar] [CrossRef]
- Deng, Z.; Chen, Y.; Yang, J.; Chen, Z. Archetype Identification and Urban Building Energy Modeling for City-Scale Buildings Based on GIS Datasets. Build. Simul. 2022, 15, 1547–1559. [Google Scholar] [CrossRef]
- Chen, D.; He, Z.; Liu, Y.; Tao, C.; Wang, H.; Lu, B.; Li, J.; Lu, Y. Influence of Transparent Envelope Parameters on Office Building Energy Use Intensity in the Different Thermal Climate Regions of China. Processes 2023, 11, 2908. [Google Scholar] [CrossRef]
- Chen, S.; Guan, J.; Levine, M.D.; Xie, L.; Yowargana, P. Elaboration of Energy Saving Renovation Measures for Urban Existing Residential Buildings in North China Based on Simulation and Site Investigations. Build. Simul. 2013, 6, 113–125. [Google Scholar] [CrossRef]
- Raimundo, A.M.; Saraiva, N.B.; Dias Pereira, L.; Rebelo, A.C. Market-Oriented Cost-Effectiveness and Energy Analysis of Windows in Portugal. Energies 2021, 14, 3720. [Google Scholar] [CrossRef]
- Englund, J.S.; Cehlin, M.; Akander, J.; Moshfegh, B. Measured and Simulated Energy Use in a Secondary School Building in Sweden-a Case Study of Validation, Airing, and Occupancy Behaviour. Energies 2020, 13, 2325. [Google Scholar] [CrossRef]


| City | Thermal Climate Zone | Longitude | Latitude | HDD18 | CDD26 | Solar Energy Resource Area | Climatic Regions | |
|---|---|---|---|---|---|---|---|---|
| GB50176-2016 [40] | ASHRAE Standard 169-2021 [41] | |||||||
| Harbin | 1C | 7 | 126.53 | 45.8 | 5032 | 14 | II | Severe cold (SC) |
| Beijing | 2A | 4 | 116.4 | 39.9 | 2699 | 94 | II | Cold (C) |
| Changsha | 3B | 3 | 112.93 | 28.23 | 1466 | 230 | III | Hot summer and cold winter (HC) |
| Shenzhen | 4A | 2 | 114 | 22.53 | 223 | 374 | III | Hot summer and warm winter (HW) |
| Parameters | Harbin | Beijing | Changsha | Shenzhen |
|---|---|---|---|---|
| Exterior wall heat transfer coefficient (W/m2·K) | 0.35 (≤0.43) | 0.45 (≤0.50) | 0.60 (≤0.60) | 0.80 (≤0.80) |
| Roof heat transfer coefficient (W/m2·K) | 0.25 (≤0.35) | 0.40 (≤0.45) | 0.40 (≤0.40) | 0.50 (≤0.50) |
| Window U-value/SHGC | 2.208/0.217 (≤2.3/-) | 2.262/0.422 (≤2.4/≤0.48) | 2.493/0.356 (≤2.6/≤0.40) | 2.888/0.316 (≤3.0/≤0.35) |
| People density (person/m2) | 0.05 (0.1) | 0.05 (0.1) | 0.05 (0.1) | 0.05 (0.1) |
| Equipment power density (W/m2) | 15 (15) | 15 (15) | 15 (15) | 15 (15) |
| Lighting power density (W/m2) | 8.93 (0.90) | 8.93 (0.90) | 8.93 (0.90) | 8.93 (0.90) |
| Cooling/heating temperature setpoint (°C) | 26/20 (26/20) | 26/20 (26/20) | 26/20 (26/20) | 26/20 (26/20) |
| Chiller COP | 5.40 (5.40) | 5.50 (5.50) | 5.60 (5.60) | 5.70 (5.70) |
| Boiler heating efficiency | 0.9 (0.9) | 0.9 (0.9) | 0.9 (0.9) | 0.9 (0.9) |
| City | Glass Type |
|---|---|
| Harbin | REF C TINT HI 6 mm glass + 13 mm air + 6 mm clear glass |
| Beijing | ECREF-2 COLORED 6 mm glass + 13 mm argon gas + 6 mm clear glass |
| Changsha | REF D TINT 6 mm glass + 13 mm air + 6 mm clear glass |
| Shenzhen | REF B CLEAR LO 6 mm glass + 13 mm argon gas + 6 mm clear glass |
| Code | City | Building Types | U-Value (W/(m2·K)) | SHGC (-) | Solar Energy Resource Area | Climatic Regions |
|---|---|---|---|---|---|---|
| Case1 [39] | Harbin | office | 2.556 | 0.609 | II | (SC) |
| Case2 [43] | Shenyang | office | 5.067 | 0.4 | II | (SC) |
| Case3 [39] | Beijing | office | 2.888 | 0.316 | II | (C) |
| Case4 [44] | Seoul | daycare centers | 3.835 | 0.768 | II | (C) |
| Case5 [45] | Changsha | office | 5.894 | 0.861 | III | (HC) |
| Case6 [46] | Wuxi | four-star resort hotel | 3.835 | 0.768 | III | (HC) |
| Case7 [47] | Phoenix | office | 2.511 | 0.704 | III | (HW) |
| Case8 [39] | Hongkong | office | 4.513 | 0.781 | III | (HW) |
| Parameters | Harbin | Beijing | Changsha | Shenzhen |
|---|---|---|---|---|
| U-value (W/(m2·K)) | ≤2.1 | ≤2.0 | ≤2.2 | ≤2.5 |
| SHGC (-) | - | ≤0.40 | ≤0.35 | ≤0.30 |
| Name | Glass Type | U-Value ((W/(m2·K)) | SHGC | Harbin | Beijing | Changsha | Shenzhen |
|---|---|---|---|---|---|---|---|
| W1 | 6 low-transmittance Low-E + 13 air + 6 transparent | 1.761 | 0.568 | X | |||
| W2 | 3 low-transmittance Low-E + 6 air + 3 clear + 6 air + 3 clear | 1.525 | 0.472 | X | |||
| W3 | 6 low-transmittance low-film66 + 13 air + 6 transparent + 13 air + 6 transparent | 1.22 | 0.363 | X | X | ||
| W4 | 6 low-transmittance low-film66 + 6 air + 6 transparent + 6 air + 6 transparent | 1.712 | 0.358 | X | |||
| W5 | 6 tri-silver Low-E + 12 air + 6 transparent | 1.63 | 0.296 | X | X | ||
| W6 | 6 tri-silver low-film66 + 13 air + 6 transparent + 13 air + 6 transparent | 1.22 | 0.254 | X | X | ||
| W7 | 6 tri-silver low-film33 + 13 air + 6 clear + 13 air + 6 clear | 1.196 | 0.154 | X | X | X | |
| W8 | 6 highly transparent heat reflective + 13 air + 6 transparent | 2.416 | 0.234 | X | |||
| W9 | 6 colored heat absorption + 13 air + 6 transparent | 1.761 | 0.169 | X | X | ||
| W10 | 6 tri-silver low-film66 + 6 air + 6 clear + 6 air + 6 clear | 1.712 | 0.265 | X |
| Name | Harbin (CNY/m2) | Beijing (CNY/m2) | Changsha (CNY/m2) | Shenzhen (CNY/m2) |
|---|---|---|---|---|
| W1 | 412 | - | - | - |
| W2 | 455 | - | - | - |
| W3 | 479 | 527 | - | - |
| W4 | - | 540 | - | - |
| W5 | - | 544 | 522 | - |
| W6 | 590 | - | 603 | 847 |
| W7 | - | 680 | - | 1103 |
| W8 | - | - | - | 906 |
| W9 | - | - | 624 | 1059 |
| W10 | - | - | 550 | - |
| City | Critical Peak Period (CNY/kWh) | On Peak Period (CNY/kWh) | Mid-Peak Period (CNY/kWh) | Off-Peak Period (CNY/kWh) |
|---|---|---|---|---|
| Harbin | 1.3294 | 1.1181 | 0.7660 | 0.4139 |
| Beijing | 1.3029 | 1.1572 | 0.8333 | 0.5499 |
| Changsha | 1.4576 | 1.2223 | 0.7813 | 0.3403 |
| Shenzhen | 1.4259 | 1.1462 | 0.7615 | 0.2770 |
| City | Prices (CNY/m3) |
|---|---|
| Harbin | 3.48 |
| Beijing | 2.45 |
| Changsha | 3.853 |
| Shenzhen | 4.3 |
| Name | Harbin (RMB/m2) | Beijing (RMB/m2) | Changsha (RMB/m2) | Shenzhen (RMB/m2) |
|---|---|---|---|---|
| W1 | 100.14 | - | - | - |
| W2 | 98.70 | - | - | - |
| W3 | 97.38 | 87.80 | - | - |
| W4 | - | 88.06 | - | - |
| W5 | - | 88.42 | 87.57 | - |
| W6 | 99.89 | - | 87.25 | 103.81 |
| W7 | - | 87.55 | - | 95.07 |
| W8 | - | - | - | 102.80 |
| W9 | - | - | 87.02 | 101.36 |
| W10 | - | - | 89.99 | - |
| Harbin | Total Cost (CNY/m2) | Beijing | Total Cost (CNY/m2) | Changsha | Total Cost (CNY/m2) | Shenzhen | Total Cost (CNY/m2) |
|---|---|---|---|---|---|---|---|
| W1 | 2414.73 | W3 | 2283.02 | W5 | 2273.47 | W6 | 2923.1 |
| W2 | 2429.09 | W4 | 2301.12 | W6 | 2348.08 | W7 | 3004.37 |
| W3 | 2426.69 | W5 | 2312.35 | W9 | 2364.31 | W8 | 2961.97 |
| W6 | 2587.9 | W7 | 2430.94 | W10 | 2349.74 | W9 | 3086.23 |
| City | Selected Window | Retrofitting Buildings | DPP (Year) |
|---|---|---|---|
| Harbin | W1 | Baseline | >20 |
| Case1 | >20 | ||
| Case2 | 6.60 | ||
| Beijing | W3 | Baseline | >20 |
| Case3 | >20 | ||
| Case4 | 15.66 | ||
| Changsha | W5 | Baseline | >20 |
| Case5 | 10.16 | ||
| Case6 | 15.66 | ||
| Shenzhen | W6 | Baseline | >20 |
| Case7 | 14.14 | ||
| Case8 | 11.42 |
| City | Selected Window | Retrofitting Buildings | Returns Within the Service Life (RMB) | Initial Investment (RMB) | NPV (RMB) |
|---|---|---|---|---|---|
| Harbin | W1 | Baseline | 38.60 × 10⁴ | 244.30 × 10⁴ | −205.70 × 10⁴ |
| Case1 | 182.10 × 10⁴ | −62.20 × 10⁴ | |||
| Case2 | 64.97 × 10⁴ | 405.34 × 10⁴ | |||
| Beijing | W3 | Baseline | 114.50 × 10⁴ | 312.49 × 10⁴ | −197.98 × 10⁴ |
| Case3 | 58.30 × 10⁴ | −254.19 × 10⁴ | |||
| Case4 | 439.85 × 10⁴ | 127.36 × 10⁴ | |||
| Changsha | W5 | Baseline | 44.11 × 10⁴ | 309.52 × 10⁴ | −265.41 × 10⁴ |
| Case5 | 620.91 × 10⁴ | 311.38 × 10⁴ | |||
| Case6 | 443.41 × 10⁴ | 133.89 × 10⁴ | |||
| Shenzhen | W6 | Baseline | 72.07 × 10³ | 502.23 × 10⁴ | −495.03 × 10⁴ |
| Case7 | 762.71 × 10⁴ | 260.48 × 10⁴ | |||
| Case8 | 921.16 × 10⁴ | 418.93 × 10⁴ |
| City | Window | Retrofitting Buildings | PI |
|---|---|---|---|
| Harbin | W1 | Case2 | 2.66 |
| Beijing | W3 | Case4 | 1.41 |
| Changsha | W5 | Case5 | 2.01 |
| Case6 | 1.43 | ||
| Shenzhen | W6 | Case7 | 1.52 |
| Case8 | 1.83 |
Disclaimer/Publisher’s Note: The statements, opinions and data contained in all publications are solely those of the individual author(s) and contributor(s) and not of MDPI and/or the editor(s). MDPI and/or the editor(s) disclaim responsibility for any injury to people or property resulting from any ideas, methods, instructions or products referred to in the content. |
© 2024 by the authors. Licensee MDPI, Basel, Switzerland. This article is an open access article distributed under the terms and conditions of the Creative Commons Attribution (CC BY) license (https://creativecommons.org/licenses/by/4.0/).
Share and Cite
Liu, S.; Ghazali, F.E.M.; Yang, J.; Guo, Z.; Zeng, K.; Chen, Y. Retrofit Analysis of Exterior Windows for Large Office Buildings in Different Climate Zones of China. Buildings 2024, 14, 3904. https://doi.org/10.3390/buildings14123904
Liu S, Ghazali FEM, Yang J, Guo Z, Zeng K, Chen Y. Retrofit Analysis of Exterior Windows for Large Office Buildings in Different Climate Zones of China. Buildings. 2024; 14(12):3904. https://doi.org/10.3390/buildings14123904
Chicago/Turabian StyleLiu, Sai, Farid E. Mohamed Ghazali, Jingjing Yang, Zongkang Guo, Kejun Zeng, and Yixing Chen. 2024. "Retrofit Analysis of Exterior Windows for Large Office Buildings in Different Climate Zones of China" Buildings 14, no. 12: 3904. https://doi.org/10.3390/buildings14123904
APA StyleLiu, S., Ghazali, F. E. M., Yang, J., Guo, Z., Zeng, K., & Chen, Y. (2024). Retrofit Analysis of Exterior Windows for Large Office Buildings in Different Climate Zones of China. Buildings, 14(12), 3904. https://doi.org/10.3390/buildings14123904