
Investigating the Structural Health of High-Rise Buildings and Its Influencing Factors Using Sentinel-1 Synthetic Aperture Radar Imagery: A Case Study of the Guangzhou–Foshan Metropolitan Area


Abstract
:1. Introduction
2. Study Area and Datasets
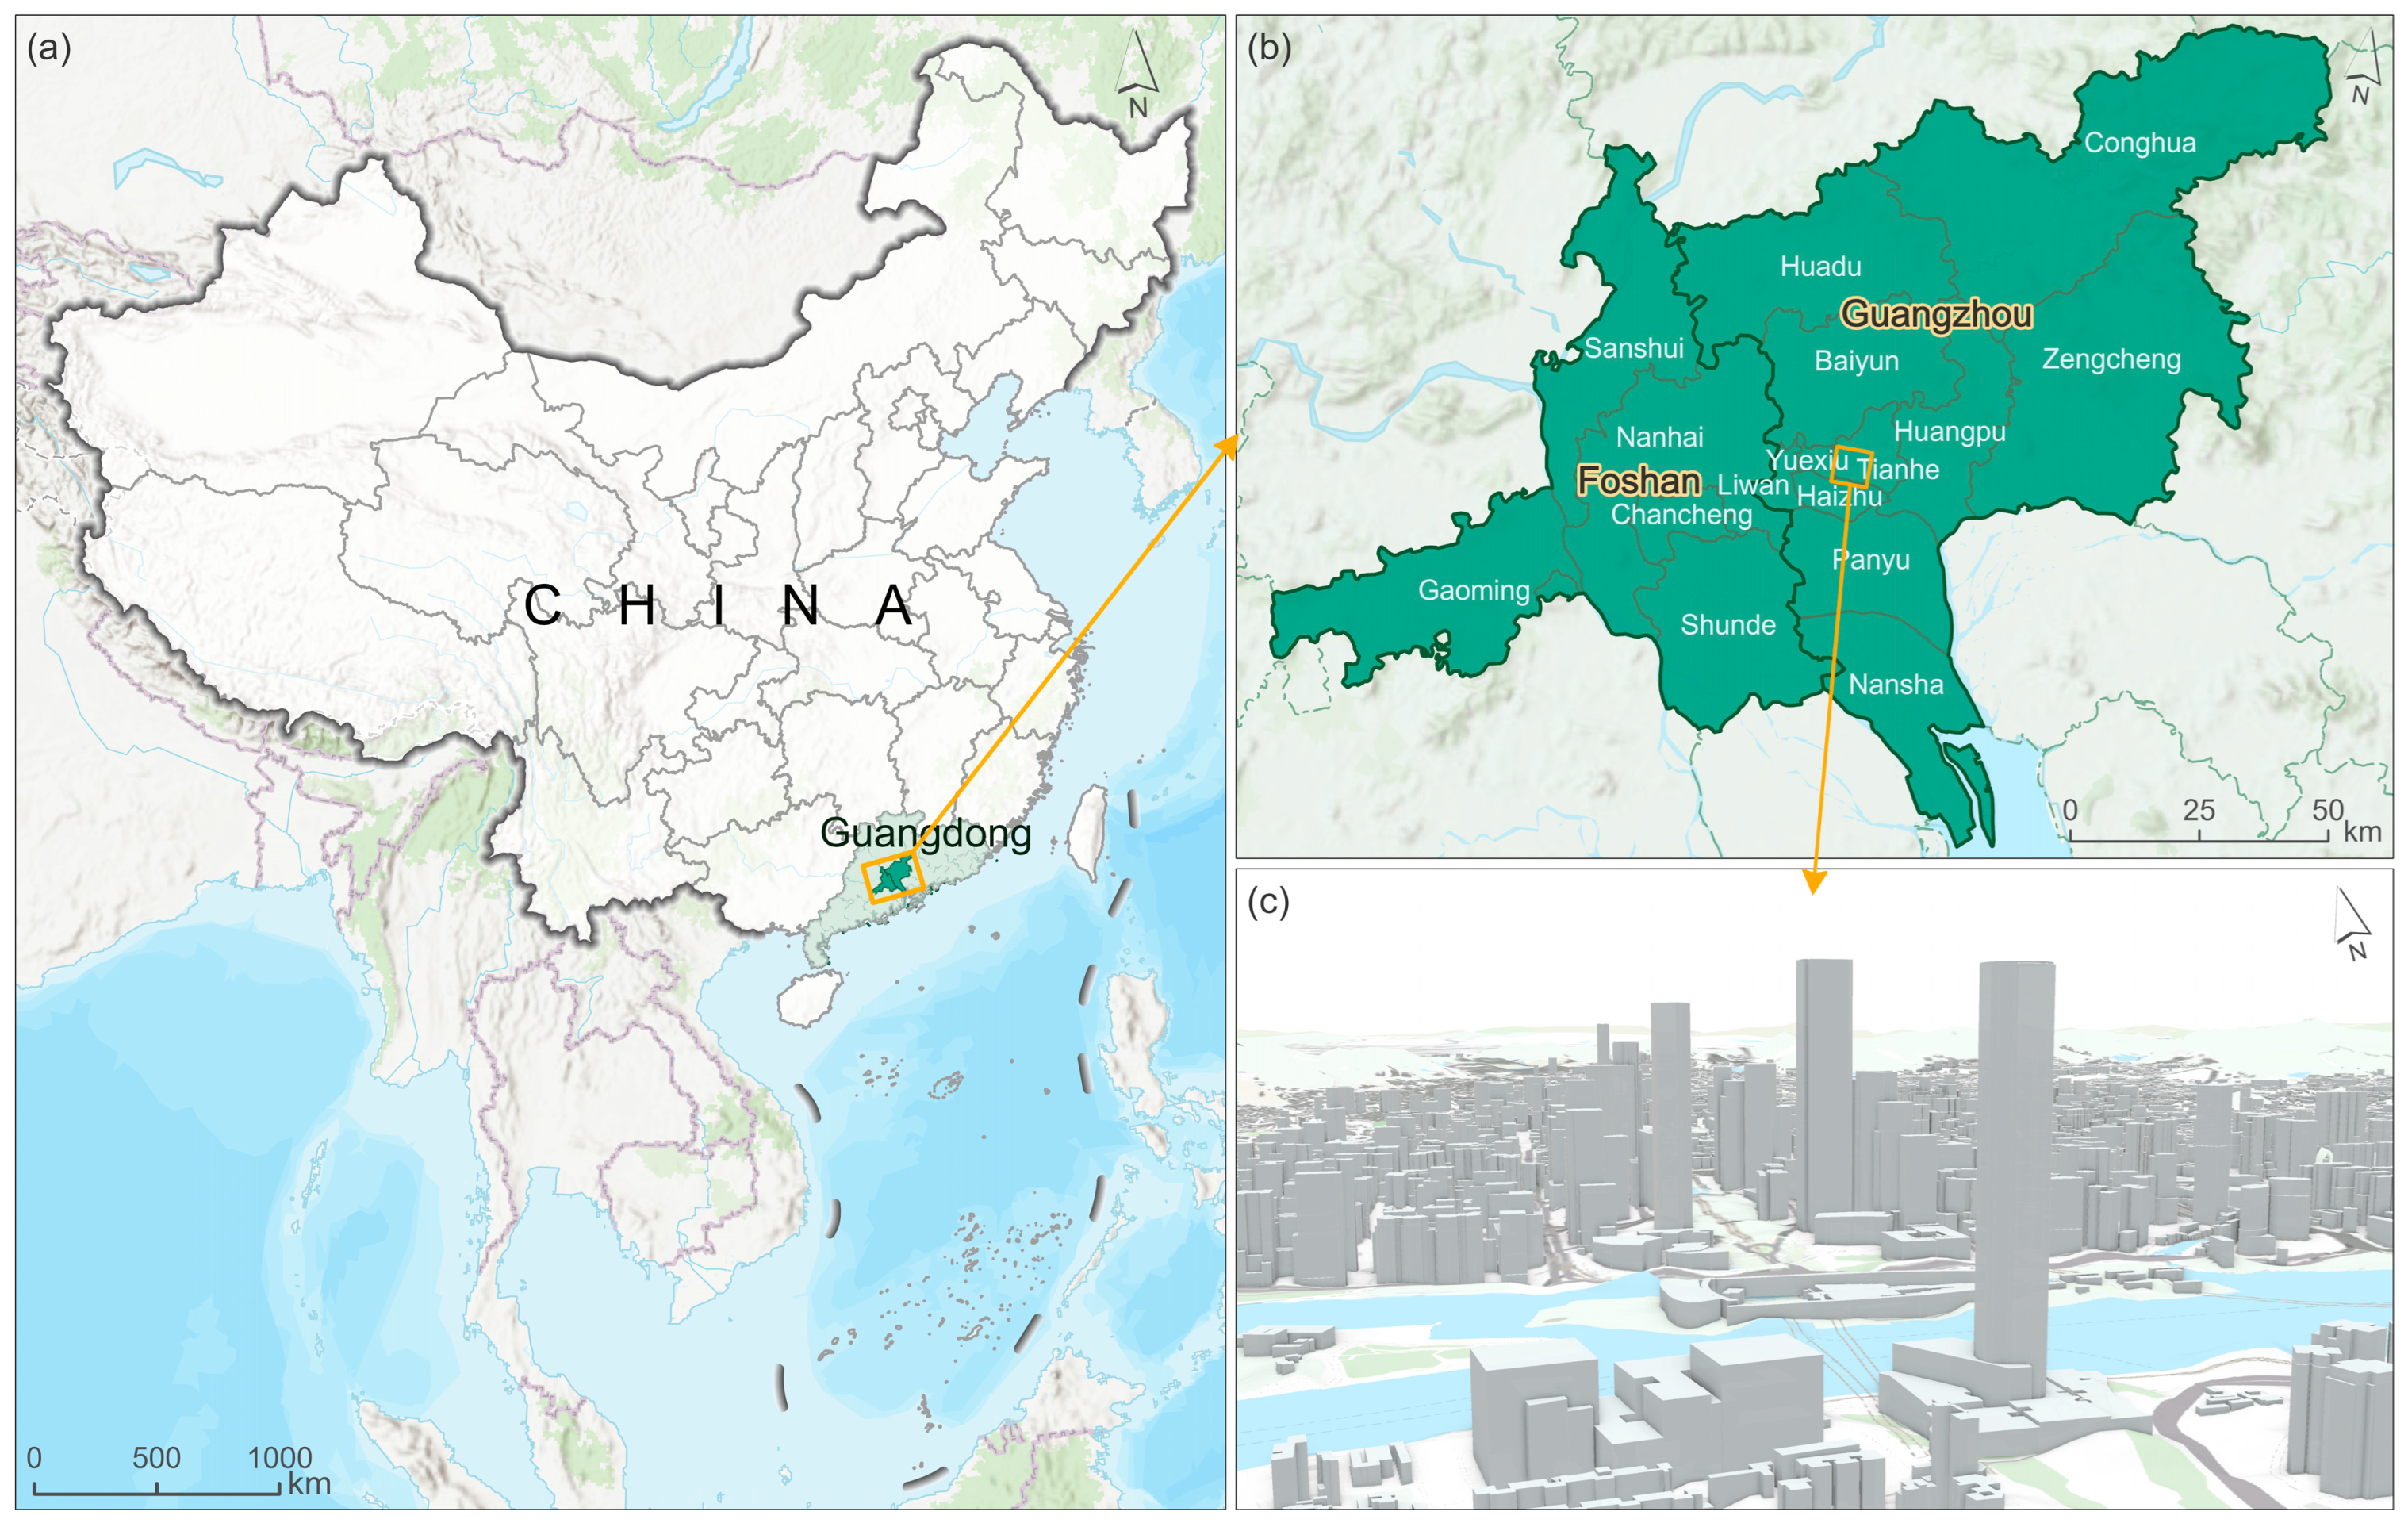
2.1. Study Area
2.2. Study Datasets
2.2.1. SAR Data
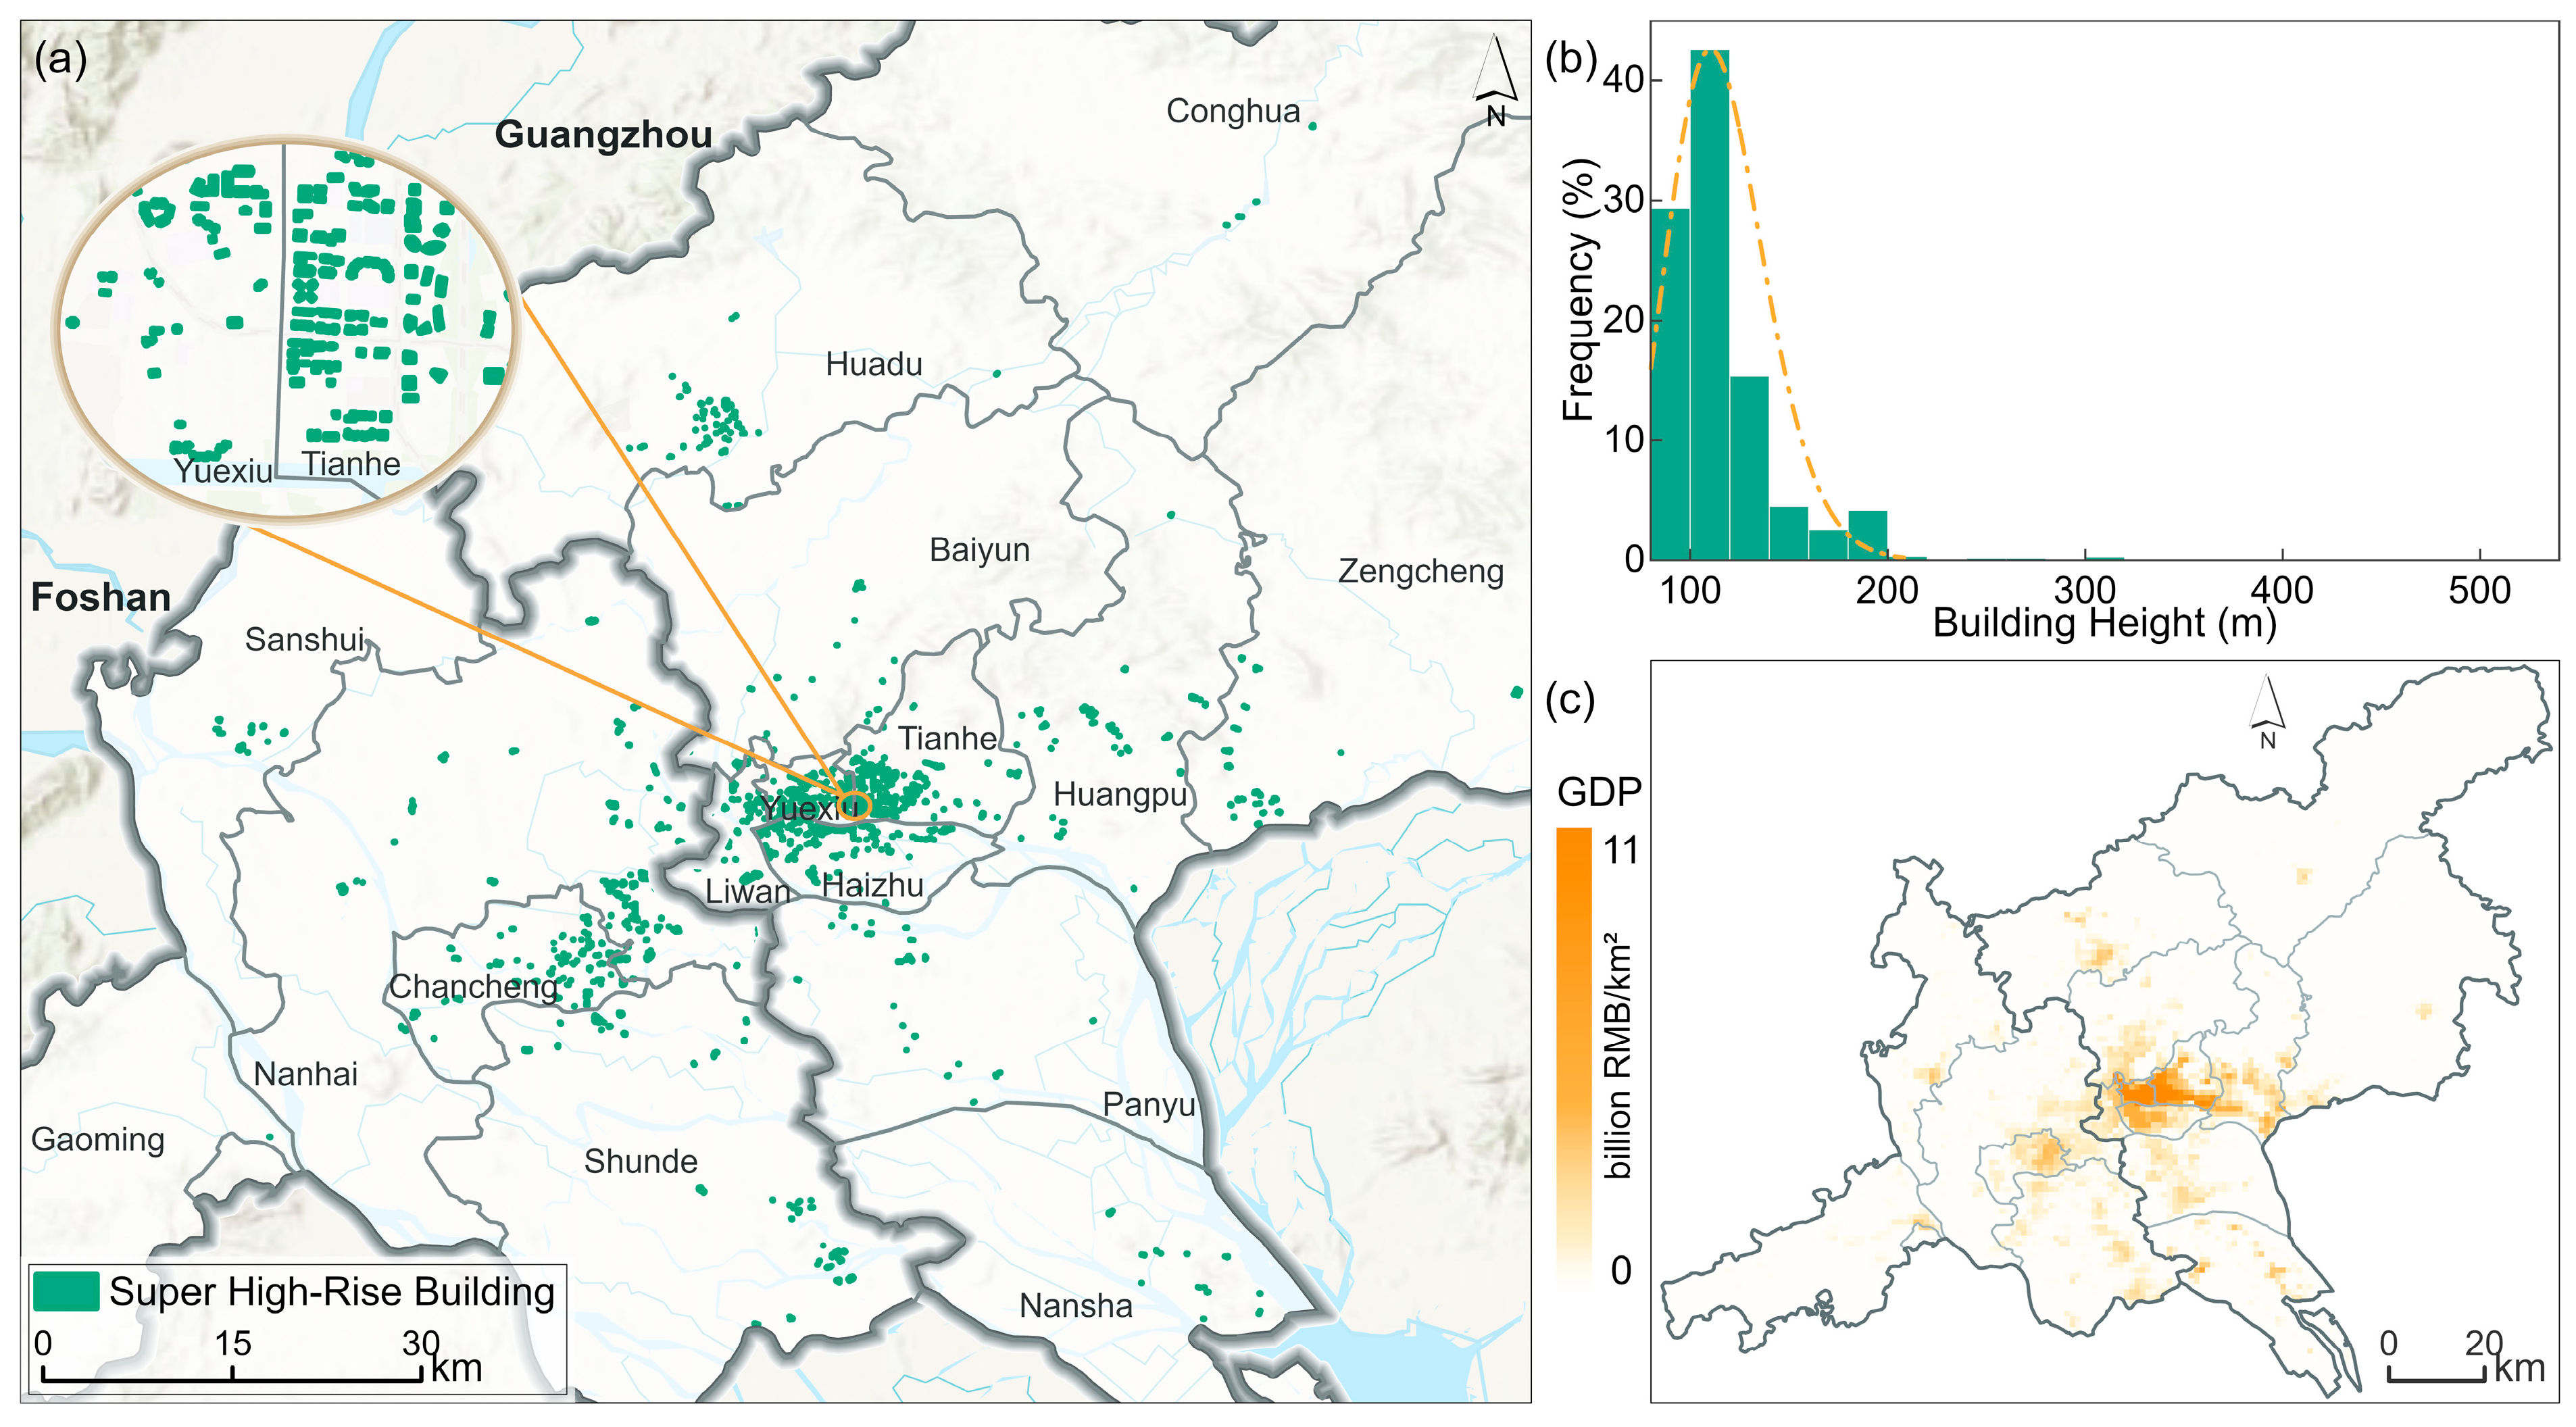
2.2.2. Building Data
3. Method
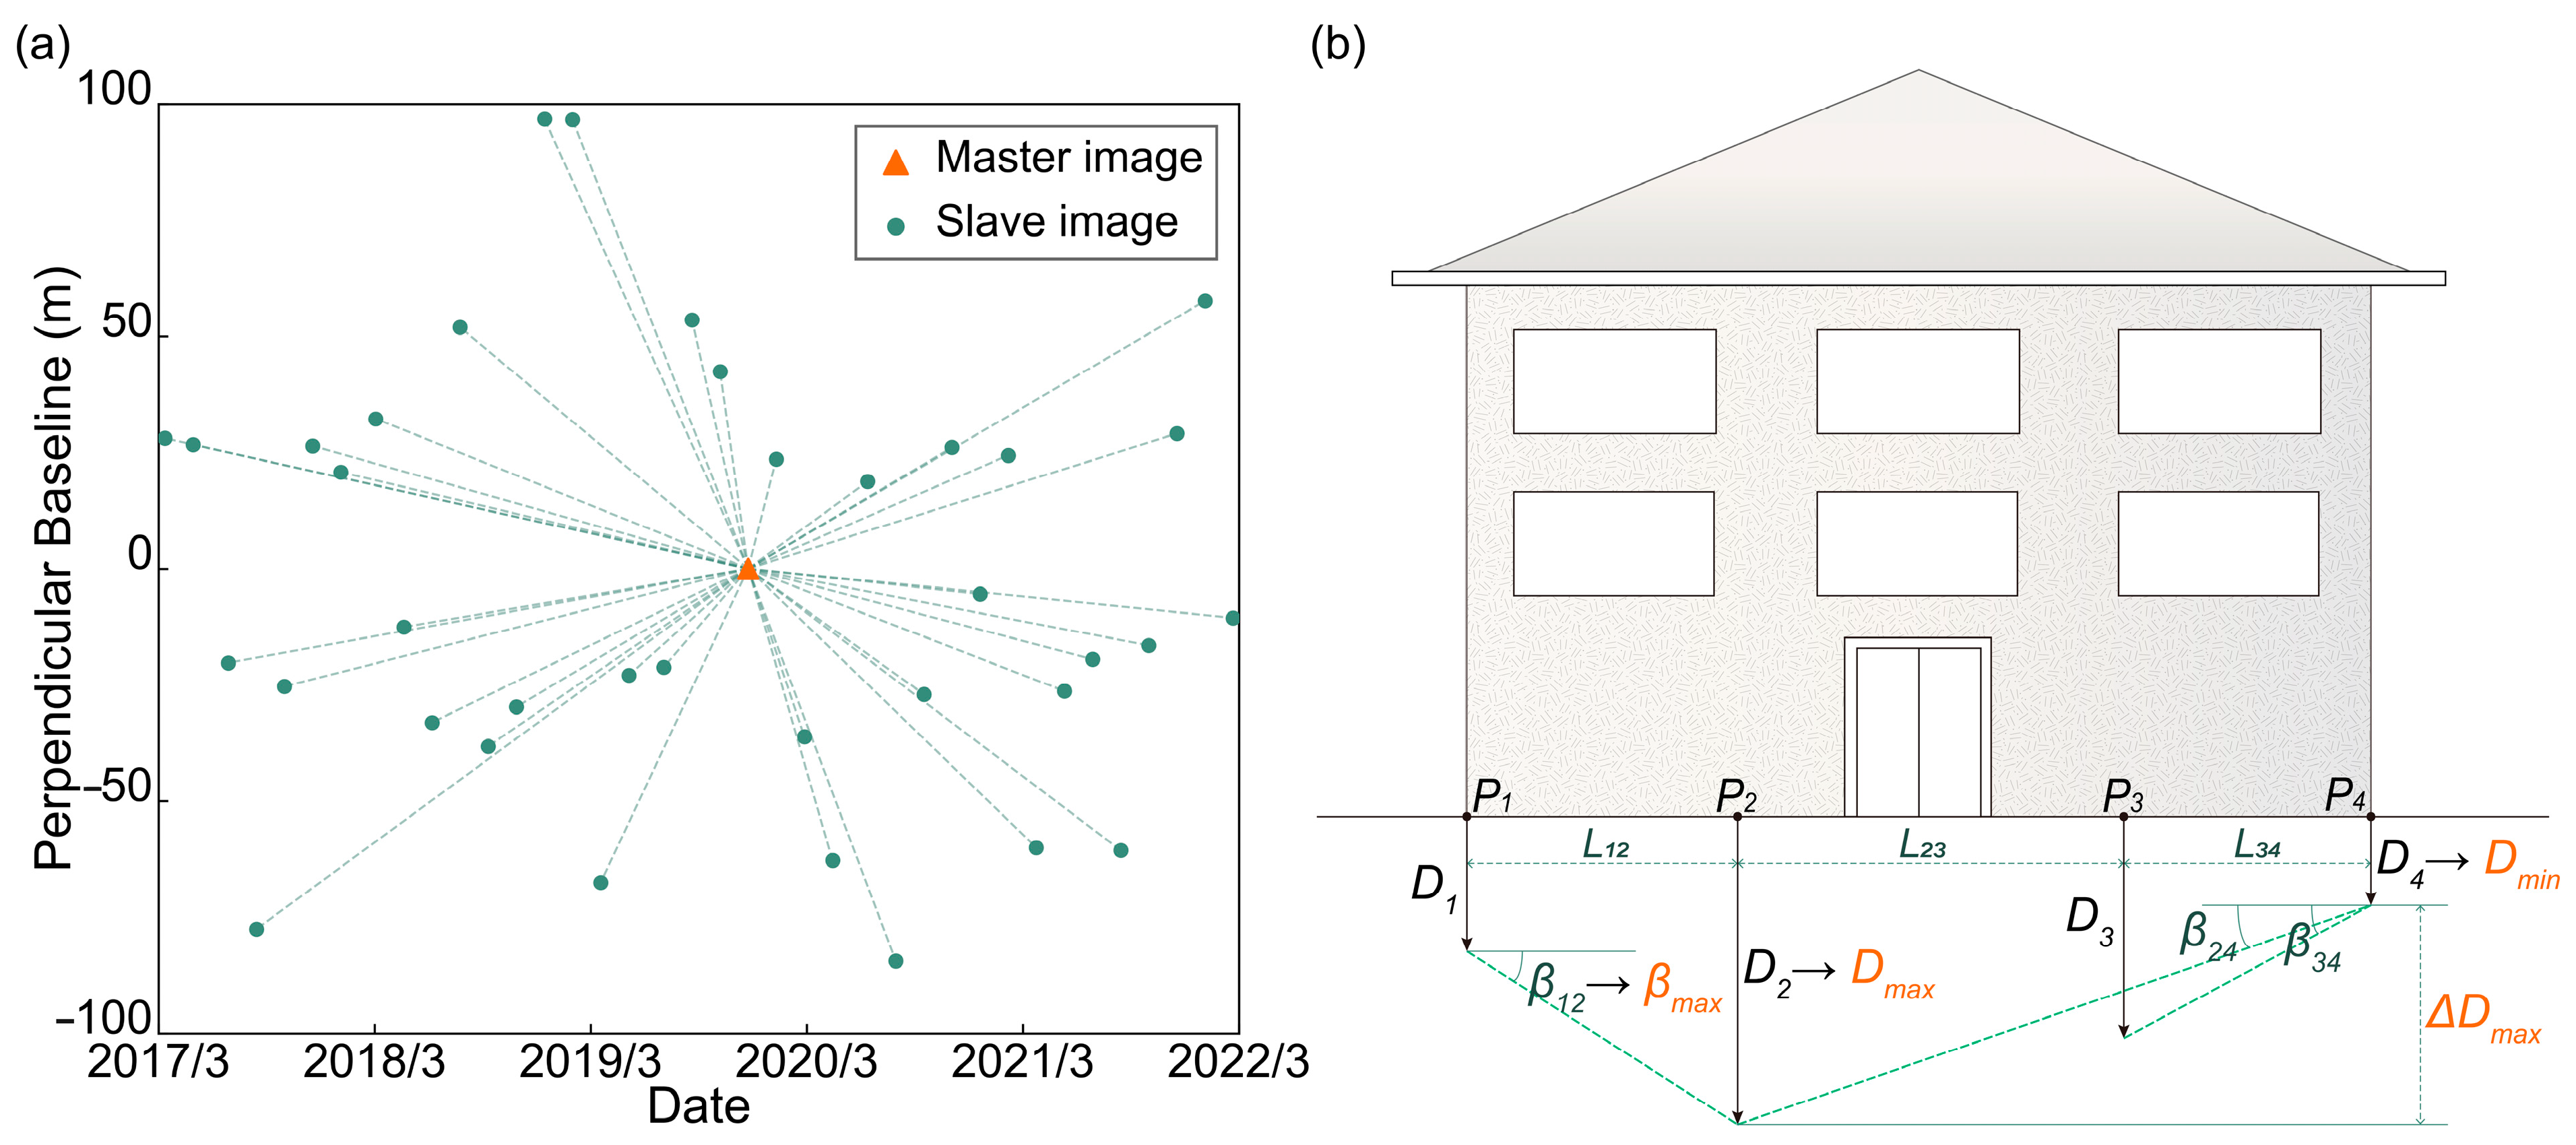
3.1. PS-InSAR
3.2. Structural Health Monitoring
4. Results and Discussion
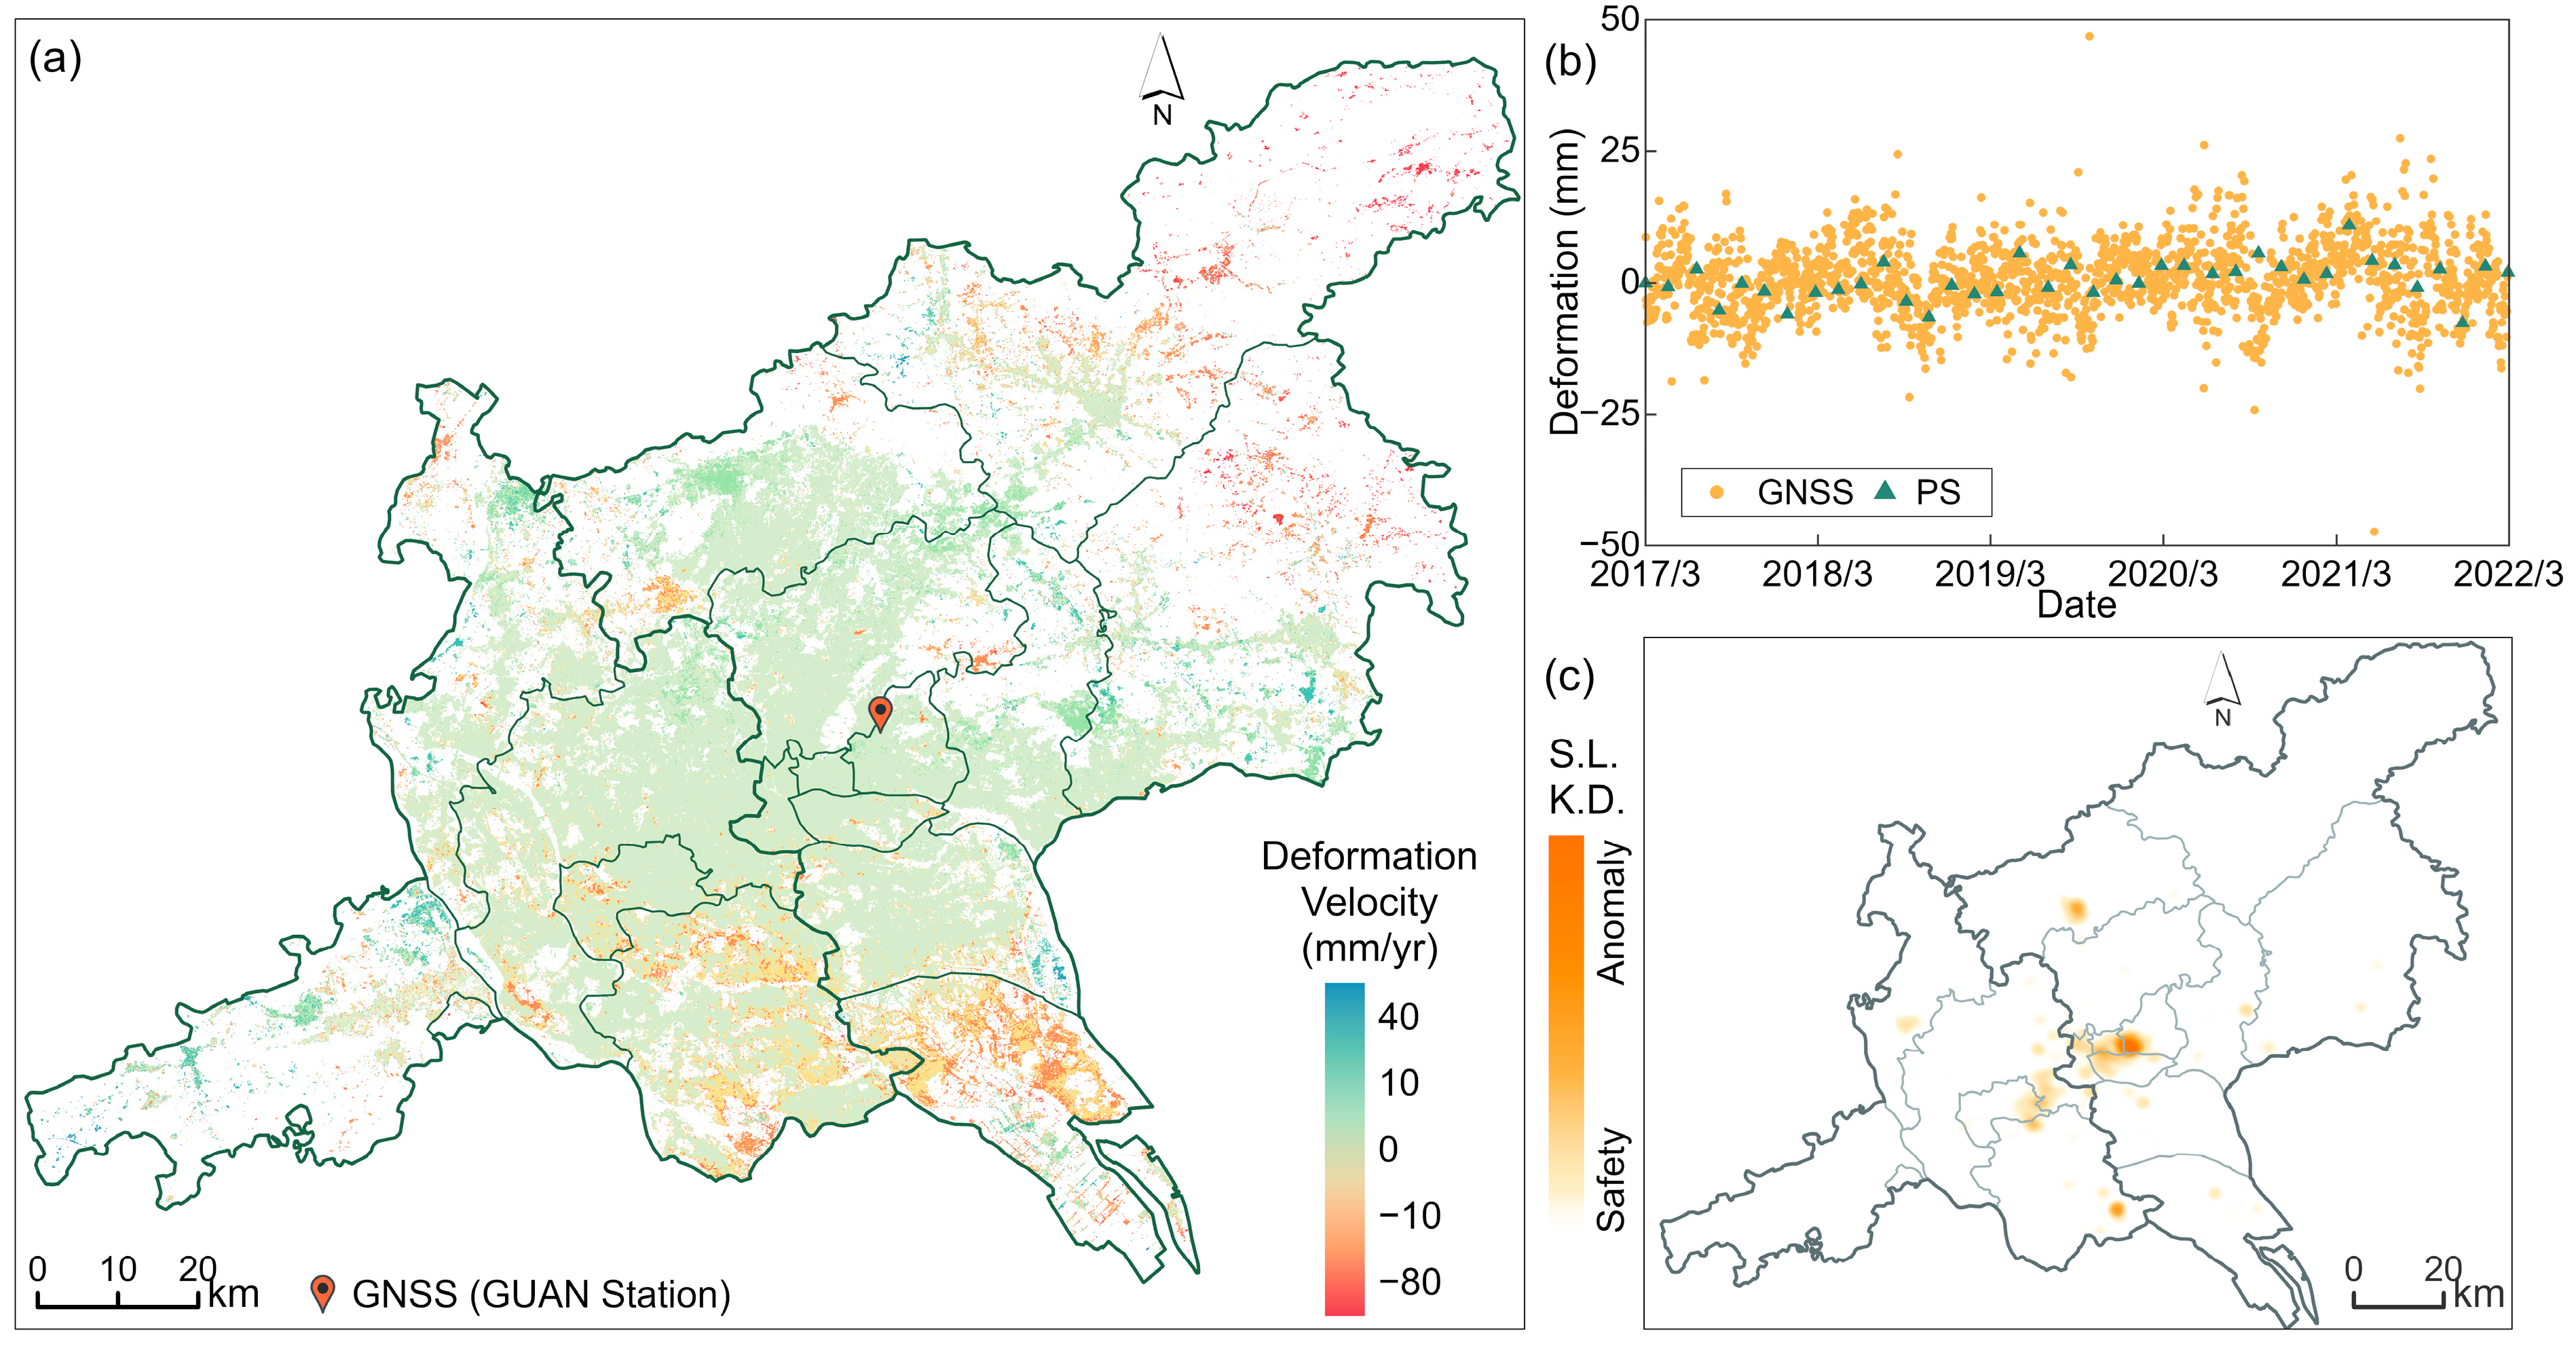
4.1. Safety Status of Super High-Rise Buildings
4.2. Cause Analysis for Anomaly Buildings
4.2.1. Regional Settlement in Soft Soil Areas
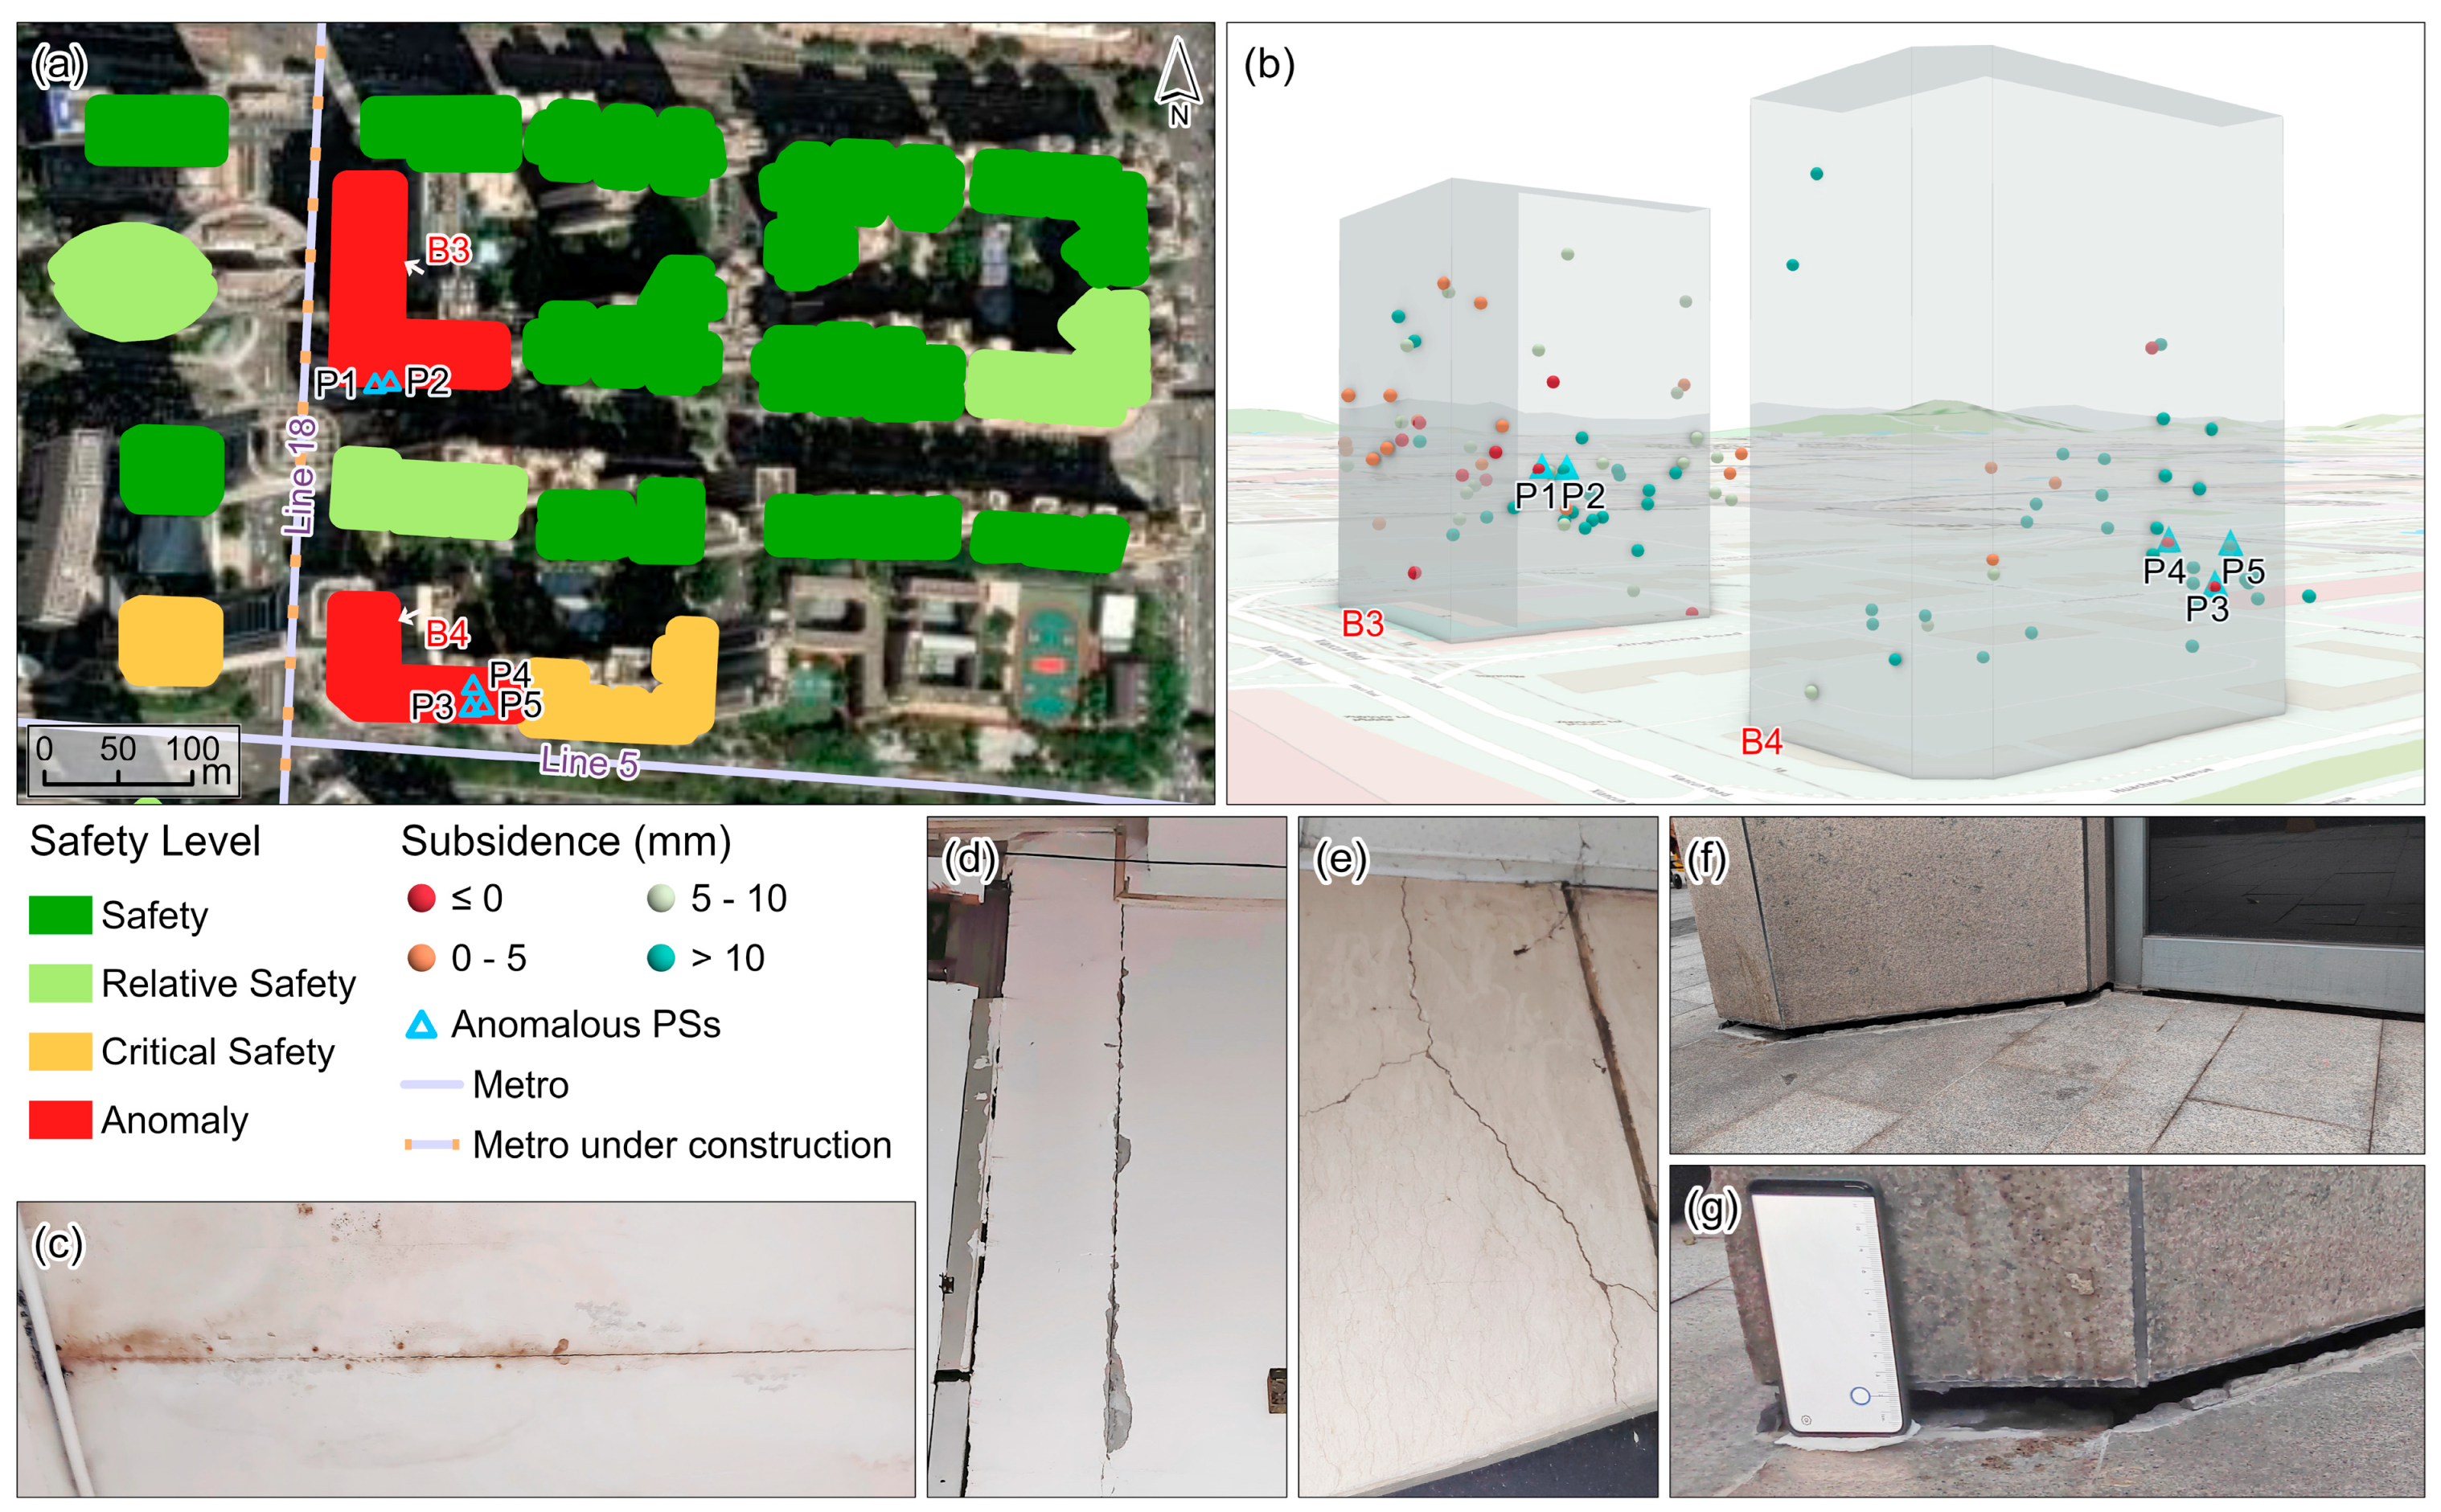
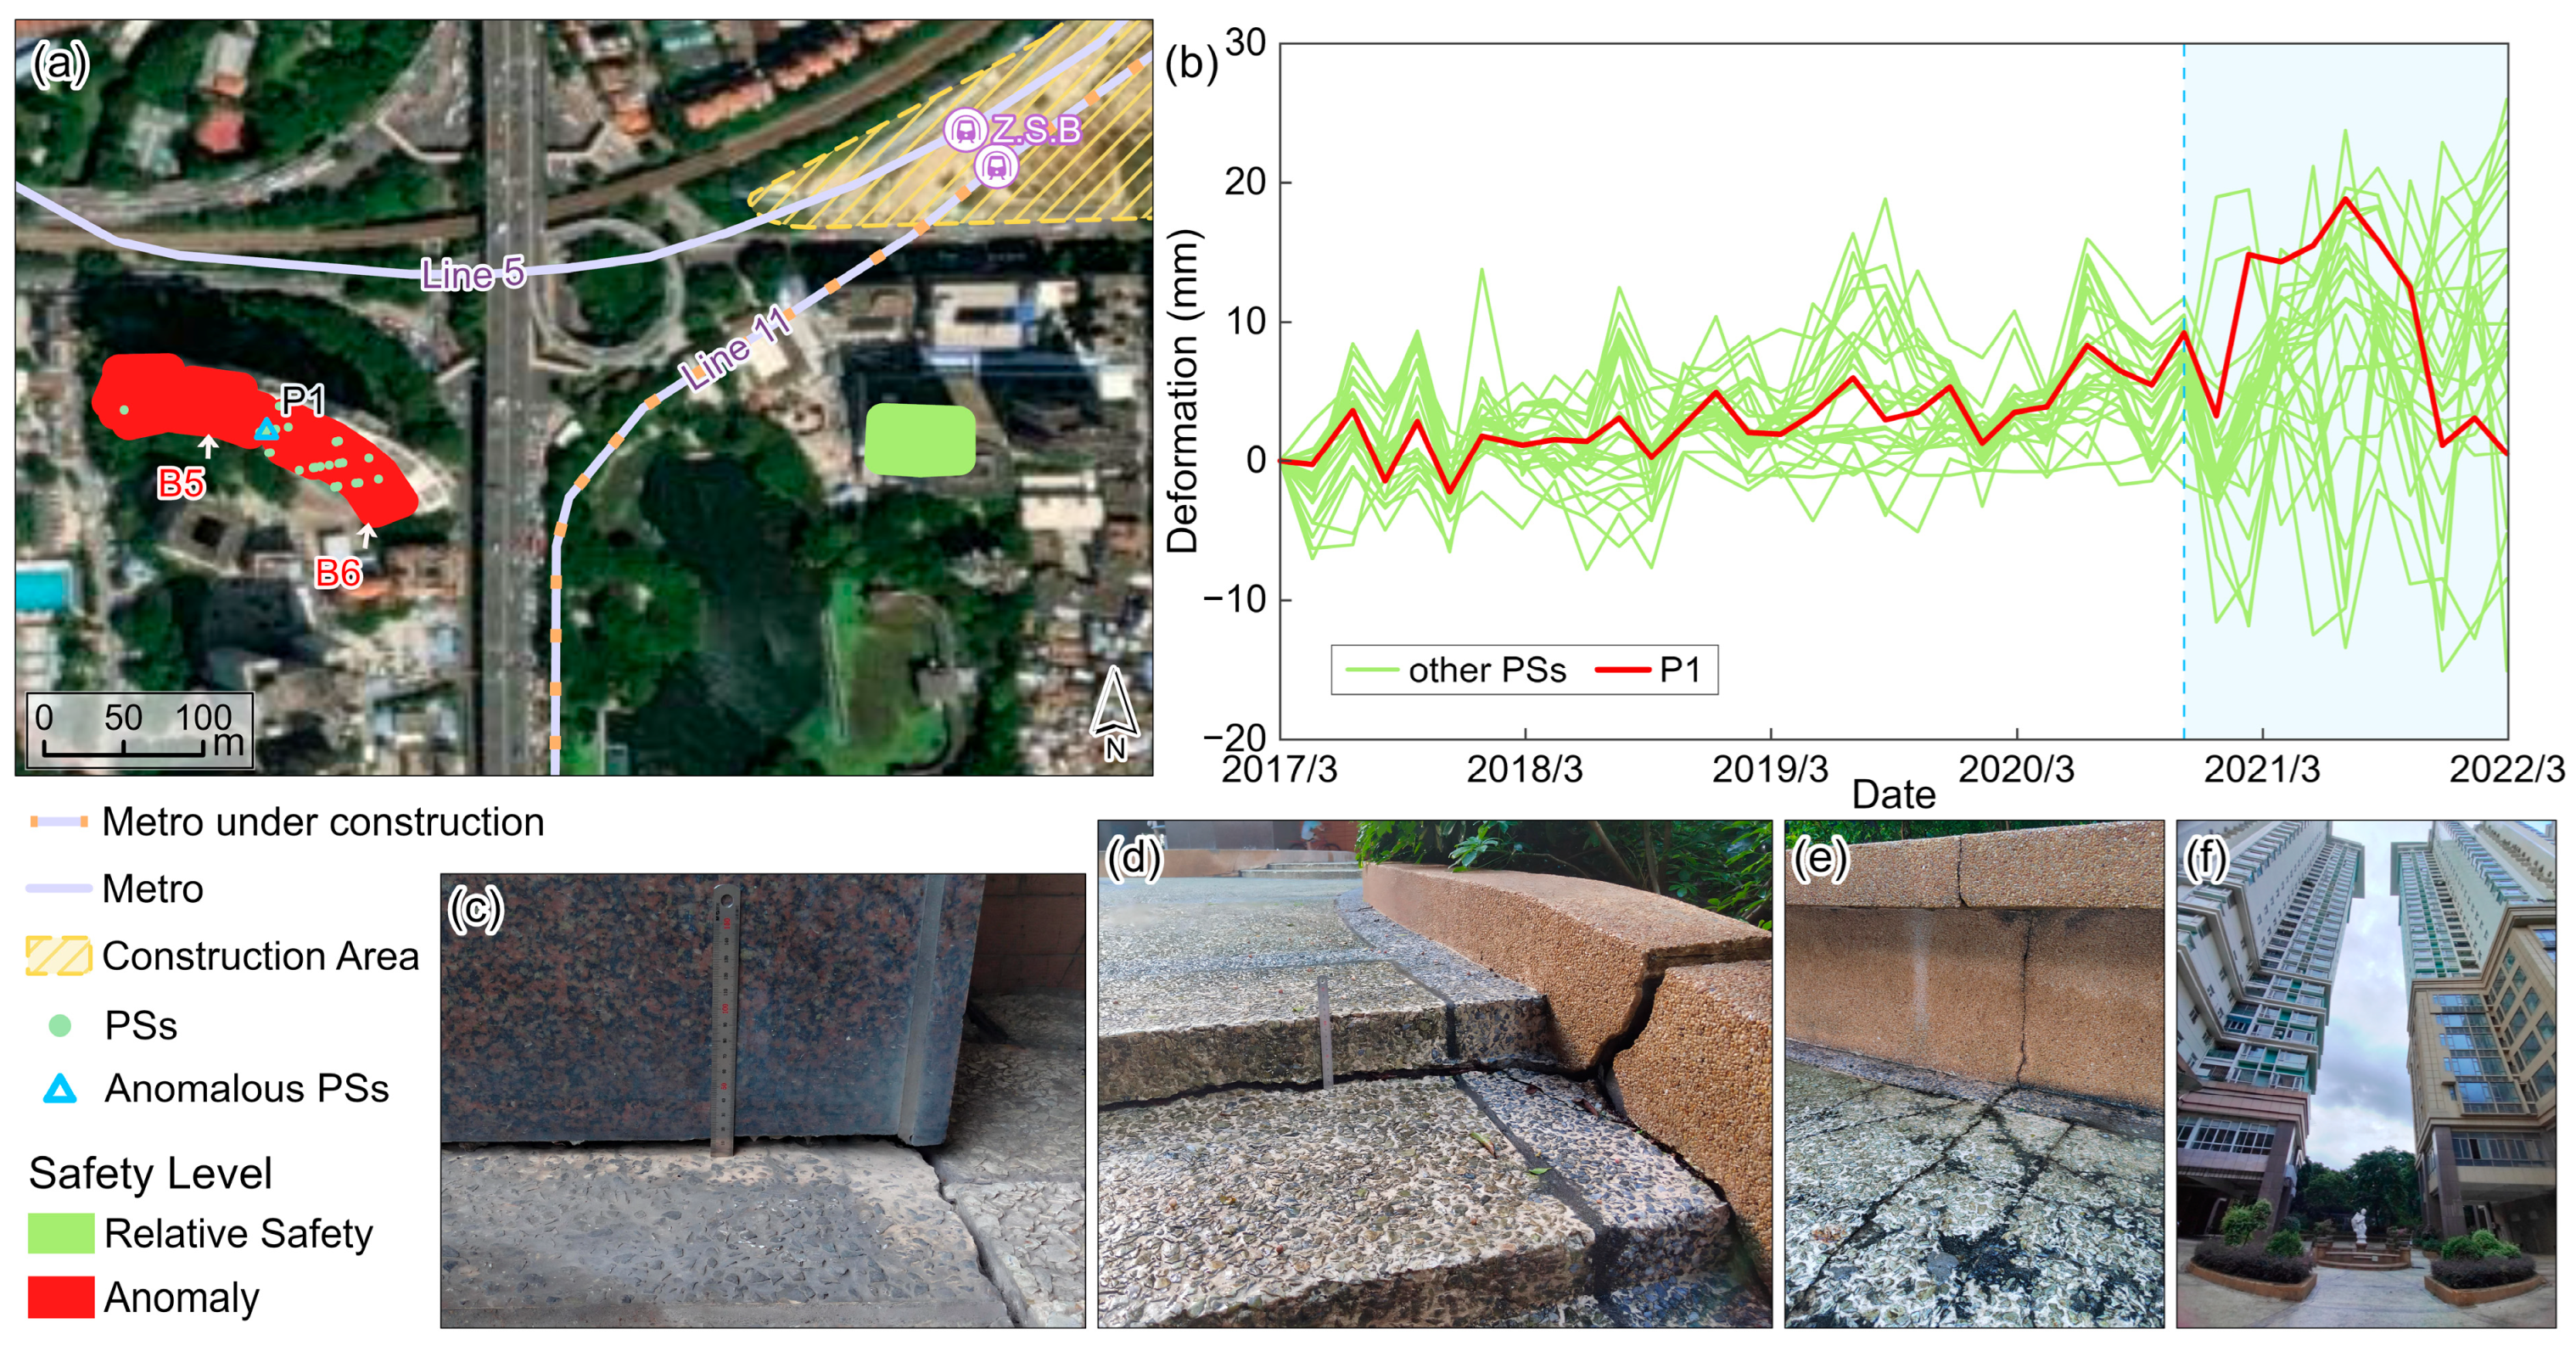
4.2.2. Construction of Surrounding (Underground) Infrastructure
4.2.3. Aging Buildings
5. Conclusions
Author Contributions
Funding
Data Availability Statement
Acknowledgments
Conflicts of Interest
References
- JGJ 8-2016; Code for Deformation Measurement of Building and Structure. China Architecture Publishing: Beijing, China, 2016.
- Talledo, D.; Stella, A.; Bonano, M.; Di Carlo, F.; Lanari, R.; Manunta, M.; Meda, A.; Mele, A.; Miano, A.; Prota, A.; et al. Techniques for Structural Assessment Based on MT-DInSAR Data, Applied to the San Michele Complex in Rome. In Proceedings of the European Workshop on Structural Health Monitoring—EWSHM 2022, Palermo, Italy, 4–7 July 2022; Volume 270, pp. 593–603. [Google Scholar] [CrossRef]
- Kumavat, H.R.; Chandak, N.R.; Patil, I.T. Factors Influencing the Performance of Rebound Hammer Used for Non-Destructive Testing of Concrete Members: A Review. Case Stud. Constr. Mater. 2021, 14, e00491. [Google Scholar] [CrossRef]
- Katam, R.; Pasupuleti, V.D.K.; Kalapatapu, P. A Review on Structural Health Monitoring: Past to Present. Innov. Infrastruct. Solut. 2023, 8, 248. [Google Scholar] [CrossRef]
- Wardhana, K.; Hadipriono, F.C. Analysis of Recent Bridge Failures in the United States. J. Perform. Constr. Facil. 2003, 17, 144–150. [Google Scholar] [CrossRef]
- Solari, L.; Del Soldato, M.; Bianchini, S.; Ciampalini, A.; Ezquerro, P.; Montalti, R.; Raspini, F.; Moretti, S. From ERS 1/2 to Sentinel-1: Subsidence Monitoring in Italy in the Last Two Decades. Front. Earth Sci. 2018, 6, 149. [Google Scholar] [CrossRef]
- Abdulkarem, M.; Samsudin, K.; Rokhani, F.Z.; A Rasid, M.F. Wireless Sensor Network for Structural Health Monitoring: A Contemporary Review of Technologies, Challenges, and Future Direction. Struct. Health Monit. 2019, 19, 693–735. [Google Scholar] [CrossRef]
- Shan, J.; Huang, P.; Loong, C.N.; Liu, M. Rapid Full-Field Deformation Measurements of Tall Buildings Using UAV Videos and Deep Learning. Eng. Struct. 2024, 305, 117741. [Google Scholar] [CrossRef]
- Calò, M.; Ruggieri, S.; Doglioni, A.; Morga, M.; Nettis, A.; Simeone, V.; Uva, G. Probabilistic-Based Assessment of Subsidence Phenomena on the Existing Built Heritage by Combining MTInSAR Data and UAV Photogrammetry. Struct. Infrastruct. Eng. 2024, 1–16. [Google Scholar] [CrossRef]
- Ribeiro, D.; Santos, R.; Cabral, R.; Saramago, G.; Montenegro, P.; Carvalho, H.; Correia, J.; Calçada, R. Non-Contact Structural Displacement Measurement Using Unmanned Aerial Vehicles and Video-Based Systems. Mech. Syst. Signal Process 2021, 160, 107869. [Google Scholar] [CrossRef]
- Fornaro, G.; Reale, D.; Verde, S. Bridge Thermal Dilation Monitoring with Millimeter Sensitivity via Multidimensional SAR Imaging. IEEE Geosci. Remote Sens. Lett. 2013, 10, 677–681. [Google Scholar] [CrossRef]
- Hakim, W.L.; Fadhillah, M.F.; Park, S.; Pradhan, B.; Won, J.S.; Lee, C.W. InSAR Time-Series Analysis and Susceptibility Mapping for Land Subsidence in Semarang, Indonesia Using Convolutional Neural Network and Support Vector Regression. Remote Sens. Environ. 2023, 287, 113453. [Google Scholar] [CrossRef]
- Kellndorfer, J.; Cartus, O.; Lavalle, M.; Magnard, C.; Milillo, P.; Oveisgharan, S.; Osmanoglu, B.; Rosen, P.A.; Wegmüller, U. Global Seasonal Sentinel-1 Interferometric Coherence and Backscatter Data Set. Sci. 2022, 9, 73. [Google Scholar] [CrossRef] [PubMed]
- Ferretti, A.; Savio, G.; Barzaghi, R.; Borghi, A.; Musazzi, S.; Novali, F.; Prati, C.; Rocca, F. Submillimeter Accuracy of InSAR Time Series: Experimental Validation. IEEE Trans. Geosci. Remote Sens. 2007, 45, 1142–1153. [Google Scholar] [CrossRef]
- Gabriel, A.K.; Goldstein, R.M.; Zebker, H.A. Mapping Small Elevation Changes over Large Areas: Differential Radar Interferometry. J. Geophys. Res. Solid. Earth 1989, 94, 9183–9191. [Google Scholar] [CrossRef]
- Nettis, A.; Massimi, V.; Nutricato, R.; Nitti, D.O.; Samarelli, S.; Uva, G. Satellite-Based Interferometry for Monitoring Structural Deformations of Bridge Portfolios. Autom. Constr. 2023, 147, 104707. [Google Scholar] [CrossRef]
- Chen, Y.; Wu, G.; Ge, Y.; Xu, Z. Mapping Gridded Gross Domestic Product Distribution of China Using Deep Learning With Multiple Geospatial Big Data. IEEE J. Sel. Top. Appl. Earth Obs. Remote Sens. 2022, 15, 1791–1802. [Google Scholar] [CrossRef]
- Zhao, Y.; Qian, L.; Yang, K. The Discussion of InSAR Accuracy in the Urban Building Subsidence Monitoring. Urban. Geotech. Investig. Surv. 2015, 3, 115–119. [Google Scholar]
- Peduto, D.; Nicodemo, G.; Maccabiani, J.; Ferlisi, S. Multi-Scale Analysis of Settlement-Induced Building Damage Using Damage Surveys and DInSAR Data: A Case Study in The Netherlands. Eng. Geol. 2017, 218, 117–133. [Google Scholar] [CrossRef]
- Talledo, D.A.; Miano, A.; Bonano, M.; Di Carlo, F.; Lanari, R.; Manunta, M.; Meda, A.; Mele, A.; Prota, A.; Saetta, A.; et al. Satellite Radar Interferometry: Potential and Limitations for Structural Assessment and Monitoring. J. Build. Eng. 2022, 46, 103756. [Google Scholar] [CrossRef]
- Kuzu, R.S.; Bagaglini, L.; Wang, Y.; Dumitru, C.O.; Braham, N.A.A.; Pasquali, G.; Santarelli, F.; Trillo, F.; Saha, S.; Zhu, X.X. Automatic Detection of Building Displacements Through Unsupervised Learning From InSAR Data. IEEE J. Sel. Top. Appl. Earth Obs. Remote Sens. 2023, 16, 6931–6947. [Google Scholar] [CrossRef]
- Mo, L.; Wang, X. Monitoring and Analysis of Ground and Building Settlement of Deep Trough in Houhai Based on PS-InSAR Technology. Chin. J. Geol. Hazard. Control. 2023, 34, 68–74. [Google Scholar]
- Li, R.; Chang, L.; Qin, H. Application of InSAR Technology in Deformation Monitoring of Super High Rise Buildings. Constr. Qual. 2021, 39, 70–73. [Google Scholar]
- Zhu, M.; Wan, X.; Fei, B.; Qiao, Z.; Ge, C.; Minati, F.; Vecchioli, F.; Li, J.; Costantini, M. Detection of Building and Infrastructure Instabilities by Automatic Spatiotemporal Analysis of Satellite SAR Interferometry Measurements. Remote Sens. 2018, 10, 1816. [Google Scholar] [CrossRef]
- Chen, F.; Guo, H.; Ma, P.; Lin, H.; Wang, C.; Ishwaran, N.; Hang, P. Radar Interferometry Offers New Insights into Threats to the Angkor Site. Sci. Adv. 2017, 3, e1601284. [Google Scholar] [CrossRef] [PubMed]
- Ma, P.; Zheng, Y.; Zhang, Z.; Wu, Z.; Yu, C. Building Risk Monitoring and Prediction Using Integrated Multi-Temporal InSAR and Numerical Modeling Techniques. Int. J. Appl. Earth Obs. Geoinf. 2022, 114, 103076. [Google Scholar] [CrossRef]
- Zhou, Y.; Hao, G.; Chen, J.; Wei, J.; Zheng, J. Long-Term Deformation Monitoring of a Steel-Truss Arch Bridge Using PSI Technique Refined by Temperature Field Analysis. Eng. Struct. 2024, 311, 118164. [Google Scholar] [CrossRef]
- Dai, K.; Chen, C.; Shi, X.; Wu, M.; Feng, W.; Xu, Q.; Liang, R.; Zhuo, G.; Li, Z. Dynamic Landslides Susceptibility Evaluation in Baihetan Dam Area during Extensive Impoundment by Integrating Geological Model and InSAR Observations. Int. J. Appl. Earth Obs. Geoinf. 2023, 116, 103157. [Google Scholar] [CrossRef]
- Council on Tall Buildings and Urban Habitat—CTBUH. Available online: https://www.ctbuh.org/ (accessed on 24 October 2024).
- Ng, A.H.M.; Wang, H.; Dai, Y.; Pagli, C.; Chen, W.; Ge, L.; Du, Z.; Zhang, K. InSAR Reveals Land Deformation at Guangzhou and Foshan, China between 2011 and 2017 with COSMO-SkyMed Data. Remote Sens. 2018, 10, 813. [Google Scholar] [CrossRef]
- De Zan, F.; Guarnieri, A.M. TOPSAR: Terrain Observation by Progressive Scans. IEEE Trans. Geosci. Remote Sens. 2006, 44, 2352–2360. [Google Scholar] [CrossRef]
- Hu, J.; Motagh, M.; Guo, J.; Haghighi, M.H.; Li, T.; Qin, F.; Wu, W. Inferring Subsidence Characteristics in Wuhan (China) through Multitemporal InSAR and Hydrogeological Analysis. Eng. Geol. 2022, 297, 106530. [Google Scholar] [CrossRef]
- Che, Y.; Li, X.; Liu, X.; Wang, Y.; Liao, W.; Zheng, X.; Zhang, X.; Xu, X.; Shi, Q.; Zhu, J.; et al. 3D-GloBFP: The First Global Three-Dimensional Building Footprint Dataset. Earth Syst. Sci. Data 2024, 16, 5357–5374. [Google Scholar] [CrossRef]
- Liu, Z.; Tang, H.; Feng, L.; Lyu, S. China Building Rooftop Area: The First Multi-Annual (2016–2021) and High-Resolution (2.5 m) Building Rooftop Area Dataset in China Derived with Super-Resolution Segmentation from Sentinel-2 Imagery. Earth Syst. Sci. Data 2023, 15, 3547–3572. [Google Scholar] [CrossRef]
- GB 50352-2019; Uniform Standard for Design of Civil Buildings. China Architecture Publishing: Beijing, China, 2019.
- Ferretti, A.; Prati, C.; Rocca, F. Permanent Scatterers in SAR Interferometry. IEEE Trans. Geosci. Remote Sens. 2001, 39, 8–20. [Google Scholar] [CrossRef]
- Ferretti, A.; Prati, C.; Rocca, F. Nonlinear Subsidence Rate Estimation Using Permanent Scatterers in Differential SAR Interferometry. IEEE Trans. Geosci. Remote Sens. 2000, 38, 2202–2212. [Google Scholar] [CrossRef]
- Touzi, R.; Lopes, A.; Bruniquel, J.; Vachon, P.W. Coherence Estimation for SAR Imagery. IEEE Trans. Geosci. Remote Sens. 1999, 37, 135–149. [Google Scholar] [CrossRef]
- Crosetto, M.; Monserrat, O.; Cuevas-González, M.; Devanthéry, N.; Crippa, B. Persistent Scatterer Interferometry: A Review. ISPRS J. Photogramm. Remote Sens. 2016, 115, 78–89. [Google Scholar] [CrossRef]
- Rabus, B.; Eineder, M.; Roth, A.; Bamler, R. The Shuttle Radar Topography Mission—A New Class of Digital Elevation Models Acquired by Spaceborne Radar. ISPRS J. Photogramm. Remote Sens. 2003, 57, 241–262. [Google Scholar] [CrossRef]
- Hooper, A.; Segall, P.; Zebker, H. Persistent Scatterer Interferometric Synthetic Aperture Radar for Crustal Deformation Analysis, with Application to Volcán Alcedo, Galápagos. J. Geophys. Res. Solid. Earth 2007, 112, 7407. [Google Scholar] [CrossRef]
- Zhuang, D.; Zhang, L.; Zou, B. Interferometry Modeling and Height Reconstruction for High-Rise Buildings in Complex Scenes Based on One Single Interferogram. IEEE Trans. Geosci. Remote Sens. 2024, 62, 5206916. [Google Scholar] [CrossRef]
- Qin, X.; Liao, M.; Yang, M.; Wang, H.; Yang, T. Monitoring Shanghai Relocation Housing Skew Deformation Using High Resolution PS-InSAR Technology. Bull. Surv. Mapp. 2016, 6, 18–21. [Google Scholar]
- Drougkas, A.; Verstrynge, E.; Van Balen, K.; Shimoni, M.; Croonenborghs, T.; Hayen, R.; Declercq, P.Y. Country-Scale InSAR Monitoring for Settlement and Uplift Damage Calculation in Architectural Heritage Structures. Struct. Health Monit. 2021, 20, 2317–2336. [Google Scholar] [CrossRef]
- Rosen, P.A.; Hensley, S.; Joughin, I.R.; Li, F.K.; Madsen, S.N.; Rodriguez, E.; Goldstein, R.M. Synthetic Aperture Radar Interferometry. Proc. IEEE 2000, 88, 333–382. [Google Scholar] [CrossRef]
- Mario Costantini, T. A Novel Phase Unwrapping Method Based on Network Programming. IEEE Trans. Geosci. Remote Sens. 1998, 36, 813–821. [Google Scholar] [CrossRef]
- Yu, C.; Li, Z.; Penna, N.T. Interferometric Synthetic Aperture Radar Atmospheric Correction Using a GPS-Based Iterative Tropospheric Decomposition Model. Remote Sens. Environ. 2018, 204, 109–121. [Google Scholar] [CrossRef]
- Liu, J.; Li, T.; Ma, S.; Shan, Q.; Jiang, W. Study on LOS to Vertical Deformation Conversion Model on Embankment Slopes Using Multi-Satellite SAR Interferometry. ISPRS Int. J. Geoinf. 2024, 13, 58. [Google Scholar] [CrossRef]
- Calò, M.; Ruggieri, S.; Nettis, A.; Uva, G. A MTInSAR-Based Early Warning System to Appraise Deformations in Simply Supported Concrete Girder Bridges. Struct. Control Health Monit. 2024, 2024, 8978782. [Google Scholar] [CrossRef]
- Liu, Z.; Ng, A.H.M.; Wang, H.; Chen, J.; Du, Z.; Ge, L. Land Subsidence Modeling and Assessment in the West Pearl River Delta from Combined InSAR Time Series, Land Use and Geological Data. Int. J. Appl. Earth Obs. Geoinf. 2023, 118, 103228. [Google Scholar] [CrossRef]
- Niocodemo, G.; Peduto, D.; Ferlisi, S.; Maccabiani, J. Investigating Building Settlements via Very High Resolution SAR Sensors. In Life-Cycle of Engineering Systems: Emphasis on Sustainable Civil Infrastructure; CRC Press: Boca Raton, FL, USA, 2016; pp. 2256–2263. [Google Scholar]
- GB 50497-2019; Technical Standard for Monitoring of Building Excavation Engineering. Beijing China Planning Publishing House: Beijing, China, 2020.
- Bianchini, S.; Pratesi, F.; Nolesini, T.; Casagli, N. Building Deformation Assessment by Means of Persistent Scatterer Interferometry Analysis on a Landslide-Affected Area: The Volterra (Italy) Case Study. Remote Sens. 2015, 7, 4678–4701. [Google Scholar] [CrossRef]
- GB 50007-2011; Code for Design of Building Foundation. China Architecture Publishing: Beijing, China, 2011.
- LI, M.; Huang, L.; Anrong, D. Building Comprehensive Risk Assessment and Optimization Strategy Based on Multi-Source Data: A Case Study of Cangshan District, Fuzhou. Shanghai Urban. Plan. Rev. 2022, 3, 38–45. [Google Scholar]
- Fei, B.; Han, P.; Zhu, M.; Wan, X.; Wang, C.; Sun, Z. Risk Identification of Urban House Safety Based on Spaceborne InSAR Technology. Urban. Geotech. Investig. Surv. 2021, 6, 71–76. [Google Scholar]
- Zhang, L.; Ng, A.M.Y. Limiting Tolerable Settlement and Angular Distortion for Building Foundations. In Probabilistic Applications in Geotechnical Engineering, Proceedings of the Geo-Denver 2007, New Peaks in Geotechnics, Denver, CO, USA, 18–21 February 2007; American Society of Civil Engineers: Reston, VA, USA, 2007; pp. 1–11. [Google Scholar]
- Cooper, A.H. The Classification, Recording, Databasing and Use of Information about Building Damage Caused by Subsidence and Landslides. Q. J. Eng. Geol. Hydrogeol. 2008, 41, 409–424. [Google Scholar] [CrossRef]
- The Second Monitoring and Application Center (The Western Data Branch of National Earthquake Data Center) Continuous GNSS Observation Data. Available online: http://data.smac.ac.cn (accessed on 24 October 2024).
- Dheenathayalan, P.; Small, D.; Schubert, A.; Hanssen, R.F. High-Precision Positioning of Radar Scatterers. J. Geod. 2016, 90, 403–422. [Google Scholar] [CrossRef]
- Schubert, A.; Small, D.; Miranda, N.; Geudtner, D.; Meier, E. Sentinel-1A Product Geolocation Accuracy: Commissioning Phase Results. Remote Sens. 2015, 7, 9431–9449. [Google Scholar] [CrossRef]
- Foroughnia, F.; Nemati, S.; Maghsoudi, Y.; Perissin, D. An Iterative PS-InSAR Method for the Analysis of Large Spatio-Temporal Baseline Data Stacks for Land Subsidence Estimation. Int. J. Appl. Earth Obs. Geoinf. 2019, 74, 248–258. [Google Scholar] [CrossRef]
- Ao, Z.; Hu, X.; Tao, S.; Hu, X.; Wang, G.; Li, M.; Wang, F.; Hu, L.; Liang, X.; Xiao, J.; et al. A National-Scale Assessment of Land Subsidence in China’s Major Cities. Science 2024, 384, 301–306. [Google Scholar] [CrossRef]
- Wang, F.; Mao, X.; Wang, A. Prediction of Land Subsidence of Soft Soil in Foshan City with GMS. Saf. Environ. Eng. 2009, 16, 26–29. [Google Scholar]
- Kruse, G.; den Haan, E. Characterisation and Engineering Properties of Dutch Peats. In Proceedings of the Second International Workshop on Characterisation and Engineering Properties of Natural Soils, Singapore, 29 November—2 December 2006; Volume 3, pp. 2101–2133. [Google Scholar] [CrossRef]
- Ma, P.; Wang, W.; Zhang, B.; Wang, J.; Shi, G.; Huang, G.; Chen, F.; Jiang, L.; Lin, H. Remotely Sensing Large- and Small-Scale Ground Subsidence: A Case Study of the Guangdong–Hong Kong–Macao Greater Bay Area of China. Remote Sens. Environ. 2019, 232, 111282. [Google Scholar] [CrossRef]


| Satellite | Band | Mode | Polarization | Resolution | Cycle | Swath Width | Pay |
|---|---|---|---|---|---|---|---|
| CSK | X | SM | HH | 3 × 3 m | 16 days | 40 km | yes |
| TSX | X | SM | HH or VV | 1.2 × 3.3 m | 11 days | 30 × 50 km | yes |
| Sentinel-1 | C | IW | VV | 5 × 20 m | 6 or 12 days | 250 km | free |
| SHM Parameter | Safety Level | |||
|---|---|---|---|---|
| Safety | Relative Safety | Critical Safety | Anomaly | |
| Settlement value, (mm) | <20 | ≥20 | ≥40 | ≥60 |
| Differential settlement value, (mm) | <20 | ≥20 | ≥30 | ≥45 |
| Recent settlement velocity, (mm/mon) | <1.0 | ≥1.0 | ≥1.8 | ≥2.4 |
| Angular distortion, (‰) | <1.0 | ≥1.0 | ≥1.5 | ≥2.0 |
| Building Height (m) | Safety Level | Total | ||||
|---|---|---|---|---|---|---|
| Not Measured | Safety | Relative Safety | Critical Safety | Anomaly | ||
| ≤100 | 160 | 368 | 212 | 37 | 4 | 781 |
| 100–150 | 402 | 770 | 296 | 55 | 13 | 1536 |
| 150–200 | 73 | 86 | 31 | 8 | 0 | 198 |
| >200 | 6 | 9 | 12 | 5 | 0 | 36 |
| Total | 641 | 1234 | 554 | 105 | 17 | 2551 |
Disclaimer/Publisher’s Note: The statements, opinions and data contained in all publications are solely those of the individual author(s) and contributor(s) and not of MDPI and/or the editor(s). MDPI and/or the editor(s) disclaim responsibility for any injury to people or property resulting from any ideas, methods, instructions or products referred to in the content. |
© 2024 by the authors. Licensee MDPI, Basel, Switzerland. This article is an open access article distributed under the terms and conditions of the Creative Commons Attribution (CC BY) license (https://creativecommons.org/licenses/by/4.0/).
Share and Cite
Huang, D.; Qi, Z.; Lin, S.; Gu, Y.; Song, W.; Lv, Q. Investigating the Structural Health of High-Rise Buildings and Its Influencing Factors Using Sentinel-1 Synthetic Aperture Radar Imagery: A Case Study of the Guangzhou–Foshan Metropolitan Area. Buildings 2024, 14, 4074. https://doi.org/10.3390/buildings14124074
Huang D, Qi Z, Lin S, Gu Y, Song W, Lv Q. Investigating the Structural Health of High-Rise Buildings and Its Influencing Factors Using Sentinel-1 Synthetic Aperture Radar Imagery: A Case Study of the Guangzhou–Foshan Metropolitan Area. Buildings. 2024; 14(12):4074. https://doi.org/10.3390/buildings14124074
Chicago/Turabian StyleHuang, Di, Zhixin Qi, Suya Lin, Yuze Gu, Wenxuan Song, and Qianwen Lv. 2024. "Investigating the Structural Health of High-Rise Buildings and Its Influencing Factors Using Sentinel-1 Synthetic Aperture Radar Imagery: A Case Study of the Guangzhou–Foshan Metropolitan Area" Buildings 14, no. 12: 4074. https://doi.org/10.3390/buildings14124074
APA StyleHuang, D., Qi, Z., Lin, S., Gu, Y., Song, W., & Lv, Q. (2024). Investigating the Structural Health of High-Rise Buildings and Its Influencing Factors Using Sentinel-1 Synthetic Aperture Radar Imagery: A Case Study of the Guangzhou–Foshan Metropolitan Area. Buildings, 14(12), 4074. https://doi.org/10.3390/buildings14124074