Abstract
For a large number of monolithic buildings in the Wenzhou area, serious cold air infiltration occurs at night due to the poor insulation performance of the enclosure structure. This results in the indoor temperature often falling below the thermal comfort zone, which is compounded by high relative humidity. Various types of energy-efficient buildings, considering different envelope structures (exterior walls, roofs, exterior windows, and shading designs), were constructed, taking into account both structural characteristics and residents’ energy consumption habits. The building environment and energy consumption during the transition period (i.e., summer and winter) were analyzed using the ideal solution similarity ranking preference method (TOPSIS) and the building energy simulation software, EnergyPlus 9.5. This analysis aimed to identify four energy-efficient building models closest to the ideal solution. Comparing the indoor environment parameters and load values of the energy-saving buildings with those of the basic building yielded the following results: the average building load of the energy-saving buildings was 79.48 to 122.00 W lower than that of the basic building. The average temperature difference between the exterior walls of the energy-saving buildings and the interior temperature was 0.6 to 1.45 °C lower than that of the basic building. Similarly, the average temperature difference between the exterior windows and the interior temperature of the energy-saving buildings was 0.56 to 0.98 °C lower than that of the basic building. Additionally, the average temperature difference between the roof and room temperature of the energy-saving buildings was 0.54 to 0.39 °C lower than that of the basic building. Furthermore, the average indoor temperature of the energy-saving buildings was 1.50 to 2.11 °C higher than that of the basic building. In addition, when compared with the basic building, the energy-saving buildings could save 5.66 to 16.39 kg of standard coal and reduce CO2 emissions by 1.60 to 4.47 kg during the transition period. The study of the energy-saving envelope structure combination form in Wenzhou provides a reasonable basis for building an energy-saving envelope structure combination form in the tropical monsoon climate area, which is of great significance for reducing building energy consumption.
1. Introduction
Buildings are the basic living areas of human beings and tend to consume a large amount of energy. In fact, in both developed and developing countries, building energy consumption accounts for a large proportion of the total energy consumption. At present, the building industry in China is shifting from the extensive development of expanding space to intensive developments that are focused on the quality of the residential space and living comfort [1]. Here, both the energy-saving aspect and the indoor environment must be considered when selecting the specific building envelope system. In terms of the single buildings in Wenzhou area, a number of crucial issues require urgent attention. Specifically, during the transition between seasons, serious cold air penetration occurs in the residential buildings at night, while the envelope systems tend to exhibit poor insulation performance with little difference between the indoor and outdoor temperature, and the indoor temperature at night is often lower than that of the thermal comfort zone. Meanwhile, the high relative humidity generally results in poor thermal comfort. The conflict between the energy-saving aspect of building envelopes and the comfort of the living environment is thus becoming increasingly prominent with the improvement in the envelope’s performance the common requirement of most residential buildings and a major issue that must be resolved by the construction industry [2,3].
The energy-saving design of the envelope is largely aimed at improving the thermal insulation performance, reducing the influence of external adverse conditions on the indoor environment, and reducing the energy consumption while ensuring a comfortable indoor environment is maintained. A large number of countries have attached great importance to the research on the energy-saving aspects of the envelope with a series of studies carried out. For example, Diao et al. [4], Stazi et al. [5], Cabeza et al. [6], Pan et al. [7], and Fang et al. [8] have conducted comparative analyses of the external insulation effects of different types of wall, identifying the types with good thermal insulation performance that meet the requirements of the attendant standards in terms of energy-saving efficiency and comparing the building energy-saving rates in different seasons. Meanwhile, Daouas et al. [9] analyzed and verified the envelope-related heat transfer theory, determining the limit of the envelope heat transfer coefficient in both winter and summer. Elsewhere, Guo et al. [10] simulated and analyzed a residential building in Shanghai and found that the energy-saving effect of the external wall insulation tended to be considerable with a continuous heating pattern but extremely small with an intermittent energy consumption pattern. Jian et al. [11,12] calculated the thermal load value of external walls with insulation materials of different thicknesses and determined the law that describes how the thickness of the insulation layer changes with the energy-saving effect. Meanwhile, Tu et al. [13,14,15,16] proposed evaluating the overall thermal performance of residential building envelopes in areas characterized by hot summers and cold winters by using the system evaluation index of the thermal performance of building envelopes, including in terms of the heat transfer and solar radiation coefficients, while Tummu et al. [17,18] conducted experiments related to the cooling load of air conditioners under different window/wall ratios and different building envelopes. Here, the results indicated that when there are no windows, both the internal and the external insulation can reduce the building’s energy consumption, while with an increase in window area, the internal insulation can still reduce the energy consumption but the external insulation exhibits an “anti-energy-saving” characteristic. Elsewhere, Udaykumar et al. [19] analyzed the comfort performance of an Ahmedabad unit building and devised a prediction formula for evaluating the comfort of unit buildings according to the existing comfort evaluation method that is in line with international standards. Crawley et al. [20,21] investigated a new generation of building energy simulation software. The results revealed that the EnergyPlus 9.5 software incorporates numerous innovative simulation features, such as variable time steps, a user-configurable modular system, integrated zone simulation based on heat and mass balances, and customized input and output data structures. It can facilitate the development of third-party modules and interfaces to estimate building energy consumption. Garcia et al. [22] proposed a new MATLAB ultrasound simulator (SIMUS) belonging to the MATLAB (R2017b) Ultrasound Toolbox (MUST). The SIMUS ultrasound simulates the acoustic pressure field and RF radiofrequency signals of a homogeneous linear or convex probe. Results indicate that SIMUS can be used for a realistic simulation of medical ultrasound imaging. Kizielewicz et al. [23] utilized multi-criteria decision analysis (MCDA) methods, COMET and SPOTIS, respectively, to examine how obtained rankings vary. It was found that the SPOTIS methodology determines the ideal ISP solution requires specific boundaries, including a maximum boundary value for the profit criterion and a minimum boundary value for the cost criterion. While the COMET method exhibits good real-time performance, it occupies the connection for an extended period, losing stateless high concurrency and is often applied to stock systems as well as real-time communication. Więckowski et al. [24] proposed the RANkingl CoMparison (RANCOM) method, which can be used to determine criteria weights based on expert knowledge. Its performance relies on obtaining weight vectors based on the sorting order of the defined criteria. Arithmetic examples and a comparative analysis of the chosen subjective weighting methods demonstrate that the proposed method yields reliable results and exhibits a high correlation with existing methods. When comparing the RANCOM method with the AHPl method, it becomes evident that the RANCOM method achieves higher reproducibility, particularly when dealing with a high number of criteria. Maniya et al. [25,26,27] successfully addressed the problem of selecting houses using the ideal solution similarity ranking preference method (TOPSIS) in comparison with other methods. The results show that TOPSIS is suitable for accurate performance rating and can reflect the preferences well.
Comparing the mentioned methods, TOPSIS stands out due to several characteristics when contrasted with other computational methods. It employs logical thinking that articulates sound logic fundamental to human choice. Additionally, it provides a scalar value applicable to both the best and worst choices. The calculation process is straightforward and easily programmable into a spreadsheet. Given its ease of understanding and suitability for the specific topic, the TOPSIS method is chosen as the research method for this study.
All the above studies were focused on different types of building envelope and involved various theoretical calculation methods and evaluations of the energy-saving effects. Based on these studies, it can be stated that the energy-saving form of the building envelope will affect the heat transfer, the building load, and the indoor environment of the building. However, most of these studies were focused on the impact of one type of envelope system in relation to energy consumption or building environment without considering the overall impact of the envelope system as a whole, while the optimization of an energy-saving envelope system for a certain regional environment has not yet been addressed.
Considering these factors, the project “Tropical Monsoon Climate—Existing Single Residential Buildings in Wenzhou Region”, for instance, is a study that integrates the regional environment, resource conditions, energy consumption habits, and individual perceptual capabilities. With some consideration of the indoor thermal and humidity environment of the building, the envelope energy-saving system that is the most suitable for the single residential buildings in the region in question is selected with the aim of enhancing the energy-saving effect and meeting the indoor thermal and humidity environment needs of the residents, which will be of great significance to promoting the application and development of energy-saving technologies in tropical monsoon climate area, protecting the ecological environment, and driving regional economic development [28,29].
2. The Current Status of the Building Envelopes Typical of the Regional Climate
The global climate, classified by the Köppen climate system into A (tropical), B (dry), C (subtropical), D (temperate and subfreezing), and E (polar), places Wenzhou in category C. Additionally, the Schaller Climate Classification includes various climates like tropical rainforest, savannah, tropical desert, tropical monsoon, subtropical monsoon, Mediterranean, temperate oceanic, temperate monsoon, temperate continental, subarctic coniferous, polar, and highland mountain climates. Wenzhou falls under the tropical monsoon climate, which is characterized by high temperatures, rainy summers, and mild winters with little rain—similar to regions south of the Qinling Mountains in China, the North American and South American continents, and the southeastern part of the Australian continent. Hence, studying energy-saving envelope structures in Wenzhou is highly significant, providing insights for energy-efficient combinations in tropical monsoon climate areas and contributing to reducing the energy consumption of individual buildings.
Compared with typical urban residential buildings, the existing single residential buildings in Wenzhou area have their own distinct characteristics. In terms of design, the residential buildings in this area are mostly low-rise buildings, with a small size and a large shape coefficient, which is largely unconducive to energy saving [30,31,32,33]. The indoor thermal and wind environment of the residential buildings in this area tends to be poor in winter, and improving the thermal comfort and reducing the indoor wind speed in the winter months is thus a crucial task. Furthermore, various other issues are proving to be problematic, including serious cold air penetration into the residential buildings at night, the poor insulation performance of the envelope, the small difference between the indoor and outdoor temperatures, a lower indoor temperature at night than that of the thermal comfort zone, and poor thermal comfort caused by high relative humidity. In short, in terms of thermal environment evaluation, the environment is at its poorest during the winter, which is largely due to the inadequate building envelope design or the penetration of cold wind. Hence, the thermal insulation performance of the building envelope in the winter must be improved. In terms of indoor humidity evaluation, many residents in the area have reported that while indoor damping can occur, there are no corresponding moisture-proof methods in place to address the issue and improve the humidity adjustment performance of the building envelope of traditional dwellings [34,35].
This paper focuses on the different types of buildings existing in Wenzhou from 2012 to 2022. According to the statistics, the building types include office, education, commerce, sports, dormitory, medical care, and residency buildings. Meanwhile, the main building structures are based on a frame structure with shear walls. Here, the exterior wall materials include sintered porous bricks, non-clay sintered porous bricks, concrete porous bricks, coal gangue sintered porous bricks, cement porous bricks, waste soil sintered porous bricks, shale sintered porous bricks, cement standard bricks, cement hollow bricks, autoclaved lime–sand bricks, shale sintered hollow bricks, sintered shale bricks, shale modulus sintered bricks, composite ceramsite blocks, composite concrete blocks and small concrete blocks, double-row concrete hollow blocks, autoclaved aerated concrete blocks, composite ceramsite concrete blocks, concrete hollow blocks, light sand aerated concrete blocks, and ceramsite concrete hollow block, with the external wall thickness varying from between 180 and 360 mm. Meanwhile, the exterior wall’s thermal insulation materials mainly include rubber powder polystyrene particle thermal insulation slurry, polystyrene particle thermal insulation slurry, polymer thermal insulation mortar, sepiolite thermal insulation mortar, inorganic polymer thermal insulation mortar, inorganic lightweight aggregate polymer thermal insulation mortar, extruded polystyrene board, expanded polystyrene board, rigid foam polyurethane board, extruded polystyrene thermal insulation board, polystyrene particles, rubber powder polystyrene particles, rubber powder polystyrene particles, fiber glass wool, semi-hard glass wool board, semi-hard mineral (rock) cotton board, thermal insulation glass wool board (or rock wool and mineral wool board), thermal insulation rock wool felt, and mineral (rock) cotton or glass wool board, with the thickness of the insulation materials ranging from 12 to 55 mm. The main types of external window include PVC common hollow glass windows, PVC low-radiation hollow glass windows, insulated aluminum alloy low-radiation hollow glass windows, insulated aluminum alloy common hollow glass windows, insulated aluminum alloy low-radiation glass windows, ordinary aluminum alloy low-radiation hollow glass windows, multi-cavity insulated metal Low-e hollow glass windows, insulated metal low-radiation hollow glass windows, and plastic–steel common hollow glass windows. Meanwhile, the roof insulation materials can be categorized into extruded polystyrene foam plastic board, polystyrene particle insulation mortar, hard foam polyurethane board, foam concrete, STP insulation board, polystyrene color steel sandwich board, mineral (rock) cotton, glass wool board, foam glass insulation board, microporous calcium silicate board, hard rock cotton board, semi-hard glass wool board, and semi-hard mineral (rock) cotton board with the thickness of the materials ranging from 20 to 125 mm.
3. Initial Combination Forms of Energy-Saving Envelope
Based on the pattern of compartment and intermittent energy consumption in Wenzhou area, the main focus of the energy-saving design of the building envelope in this area is improving the overall performance of the envelope (roof, external walls, external doors, external windows, etc.) with the aim of maintaining a stable and comfortable indoor environment and reducing the cold and heat load of the air-conditioning equipment [36]. The energy-saving building envelope largely involves the external walls, the roof, the external windows, and the specific shading design, as shown in Table 1, Table 2, Table 3 and Table 4.

Table 1.
Initial combination forms of building envelope (variable is wall material).
Table 2.
Initial combination forms of building envelope (variable is roof material).
Table 3.
Initial combination forms of building envelope (variable is window material).
Table 4.
Initial combination forms of building envelope (variable is shading methods).
Here, the different wall materials can be divided into 12 types: ceramsite concrete composite block, sintered porous brick, sintered hollow brick, autoclaved sand aerated concrete block, autoclaved fly ash aerated concrete block, foam concrete block, non-clay sintered insulation brick, lightweight aggregate concrete hollow block, ordinary concrete porous brick, ordinary concrete porous block, sintered ordinary brick masonry, and non-clay sintered insulation block. Meanwhile, there are 48 roof variables, including plant height, leaf area index, leaf reflectivity, roughness, and thickness, as well as soil conductivity and soil-specific heat. In terms of the external windows, these can be divided into 21 types, which includes different frames (e.g., plastic–steel windows, heat-insulating aluminum alloy) and different glasses (e.g., blue heat-absorbing single glass, high-transmittance heat-reflecting glass, Low-e medium transmission and Low-e high transmission glass). Finally, the shading designs include horizontal shading, vertical shading, comprehensive shading, and louver-based shading, with the attendant variables divided into 79 types, including transmittance, the extension length of the sun visor, and the louver angle.
4. Regional Environment Characteristics
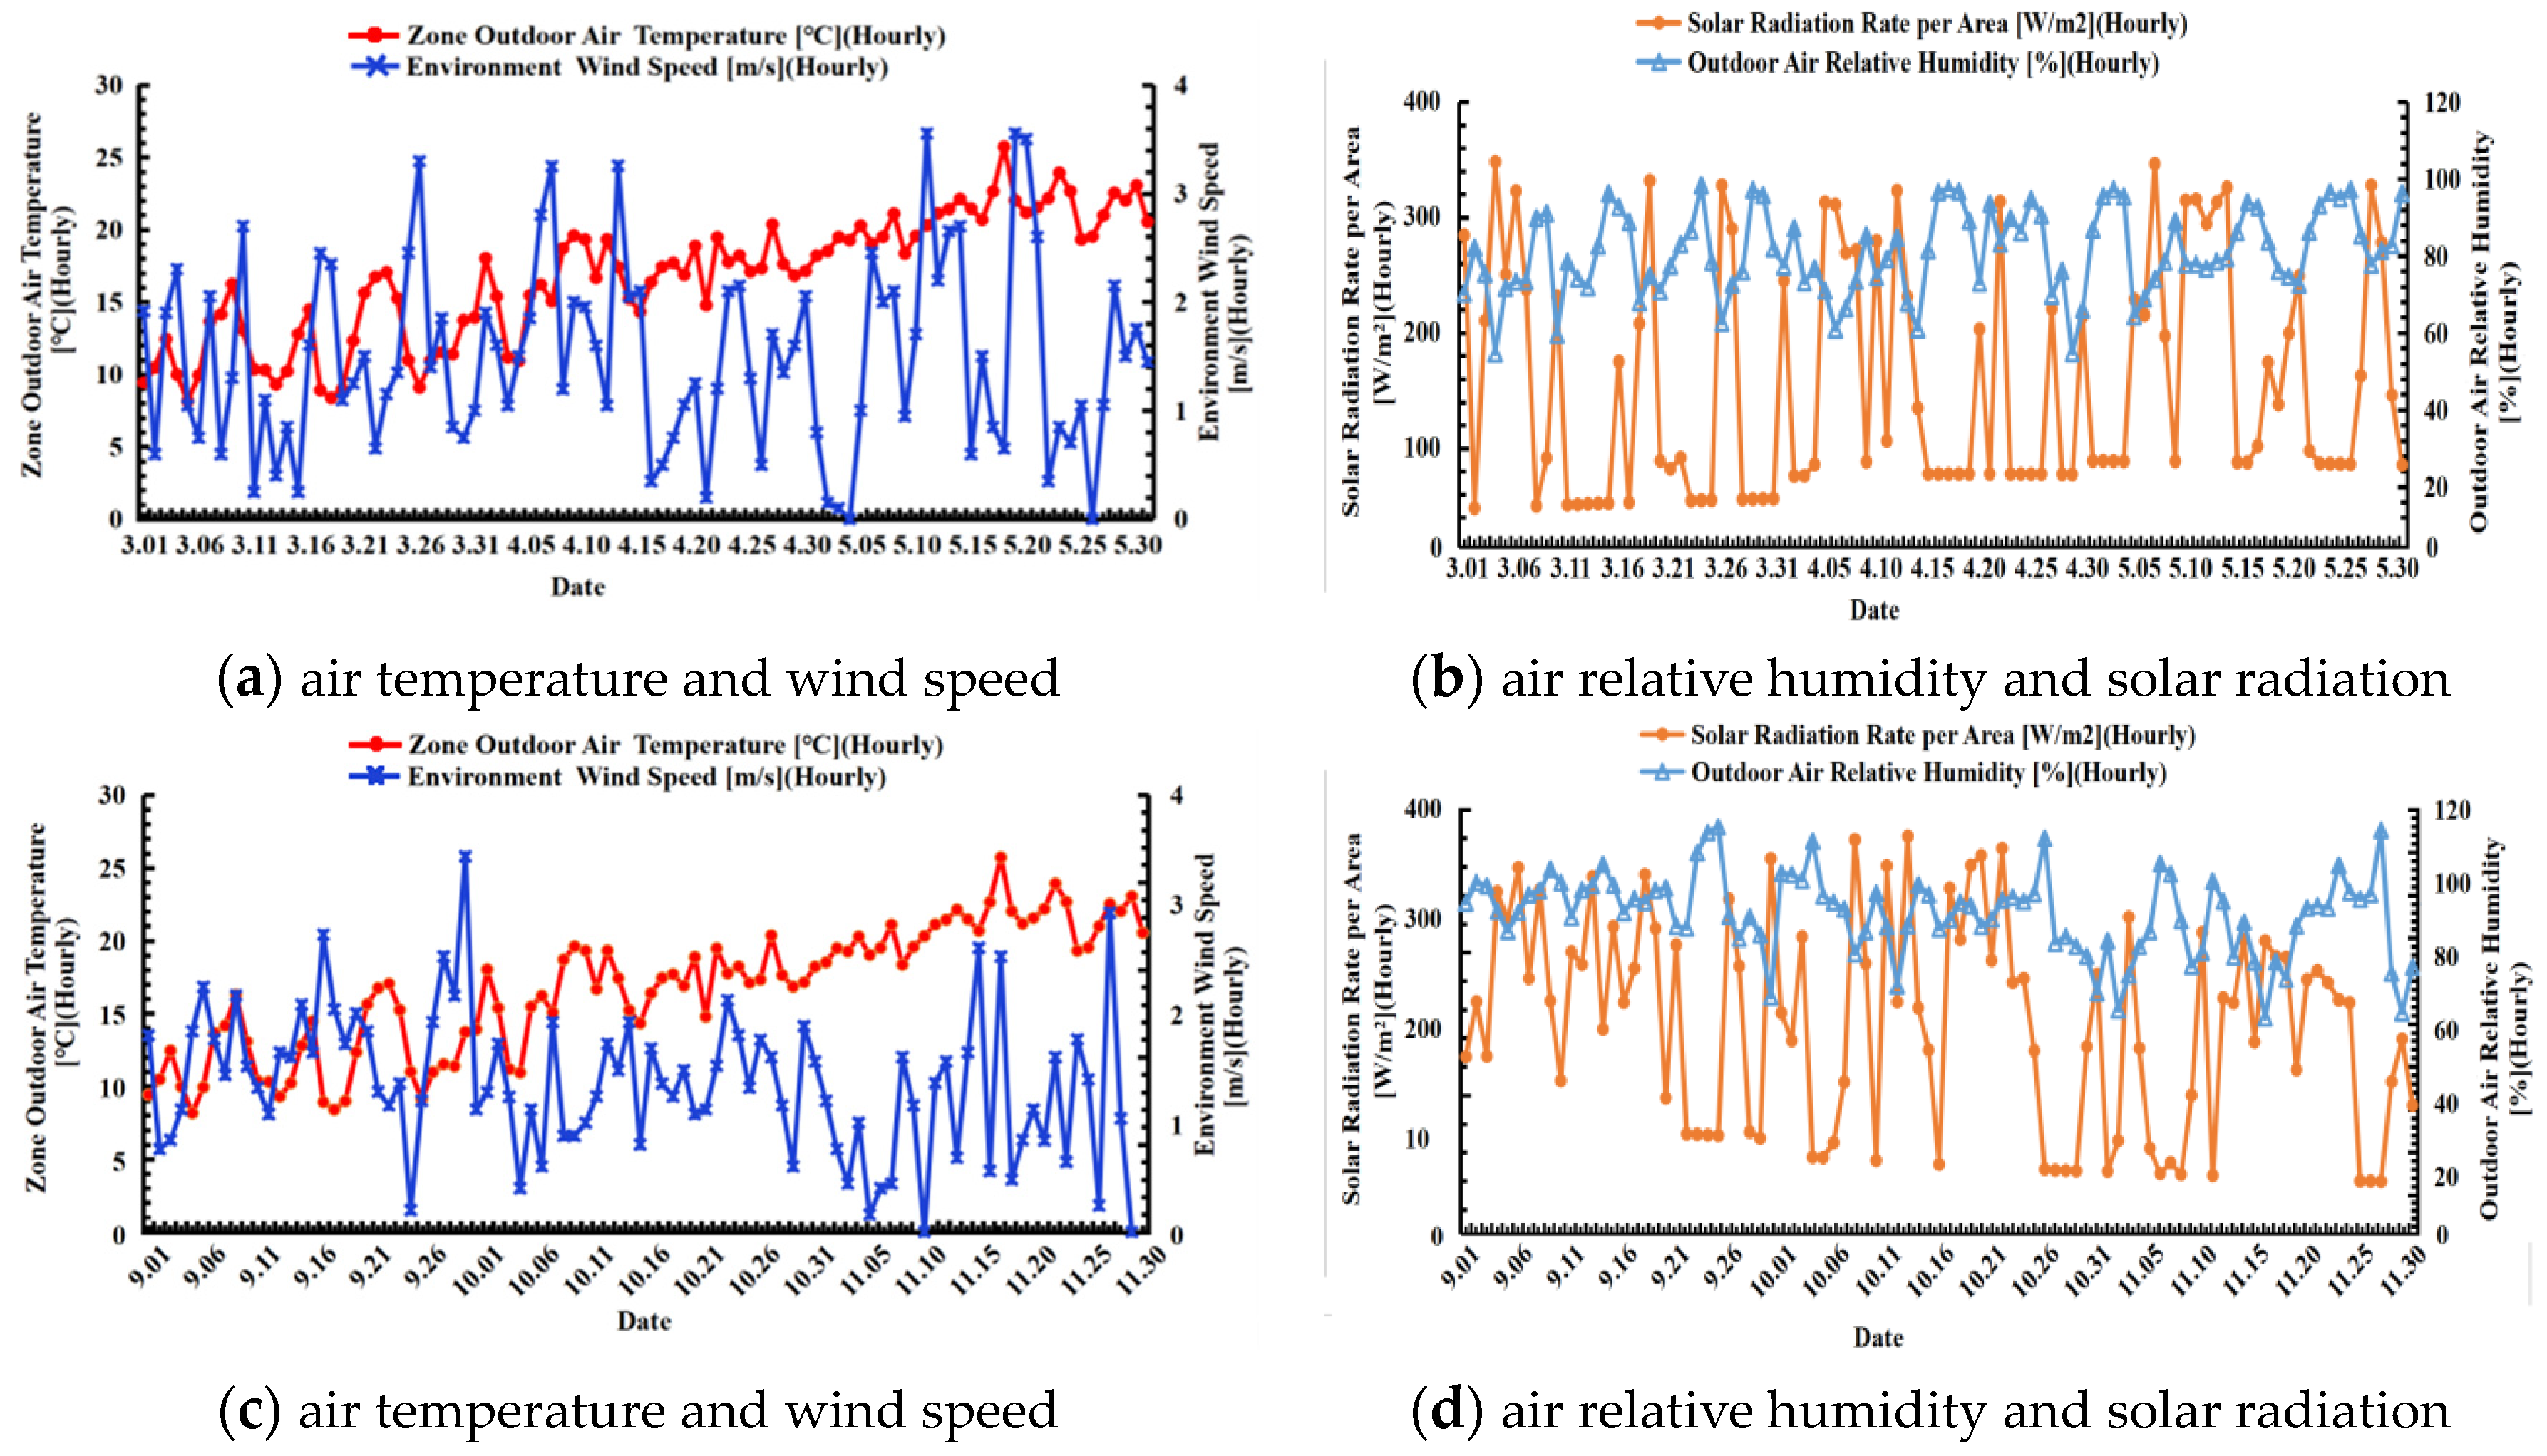
As the research target is the buildings in the south of Zhejiang Province, Wenzhou City, a typical representative city in this region, was chosen as the research object. Wenzhou City lies within a subtropical monsoon climate zone with significant alternating winter and summer monsoons, moderate temperatures, four distinct seasons, and abundant rainfall. Here, the winters are not particularly severe, while the summers are not blisteringly hot. Due to the usage of air conditioners, fans, or other thermal resources for indoor environment adjustment, the transitional periods, i.e., March, April, May, September, October, and November, were selected for the test cycle. Since the residents rarely require any intervention in terms of the indoor environment in the transitional periods, the influence of the energy-saving building envelope on the indoor environment and the energy consumption could be accurately analyzed. The environmental data were collected in real time during the research period with the collection results shown in Figure 1 and the outdoor environmental data summarized in Table 5.
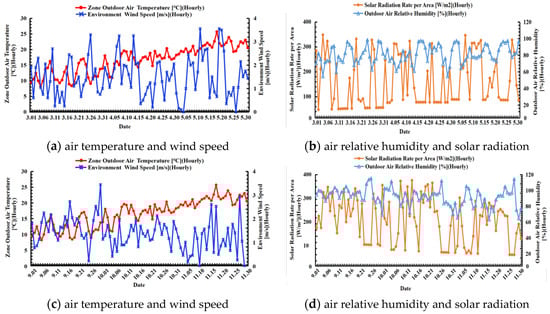
Figure 1.
Outdoor environment data.
Table 5.
Average outdoor environmental data during the test period.
As Table 5 shows, during the target period, the average value of the outdoor air relative humidity in March is 79.00%, the average value of the outdoor ambient wind speed is 1.39 m/s, the average value of the total solar radiation is 140.98 W/m2, and the average value of the outdoor air temperature is 11.93 °C. In April, the average relative humidity of the outdoor air is 79.48%, the average wind speed of the outdoor environment is 1.55 m/s, the average total solar radiation is 154.38 W/m2, and the average outdoor air temperature is 16.93 °C. In May, the average relative humidity of the outdoor air is 84.23%, the average wind speed of the outdoor environment is 1.50 m/s, the average total solar radiation is 176.77 W/m2, and the average outdoor air temperature is 120.97 °C. In September, the average relative humidity of the outdoor air is 79.13%, the average wind speed of outdoor environment is 2.10 m/s, the average total solar radiation is 170.31 W/m2, and the average outdoor air temperature is 25.51 °C. In October, the average relative humidity of the outdoor air is 76.01%, the average wind speed of the outdoor environment is 1.65 m/s, the average total solar radiation is 155.59 W/m2, and the average outdoor air temperature is 20.86 °C. In November, the average relative humidity of the outdoor air is 71.06%, the average wind speed of the outdoor environment is 1.39 m/s, the average total solar radiation is 127.68 W/m2, and the average outdoor air temperature is 5.90 °C.
5. Single Residential Buildings and Energy Consumption Pattern of the Indoor Personnel
5.1. Single Residential Buildings
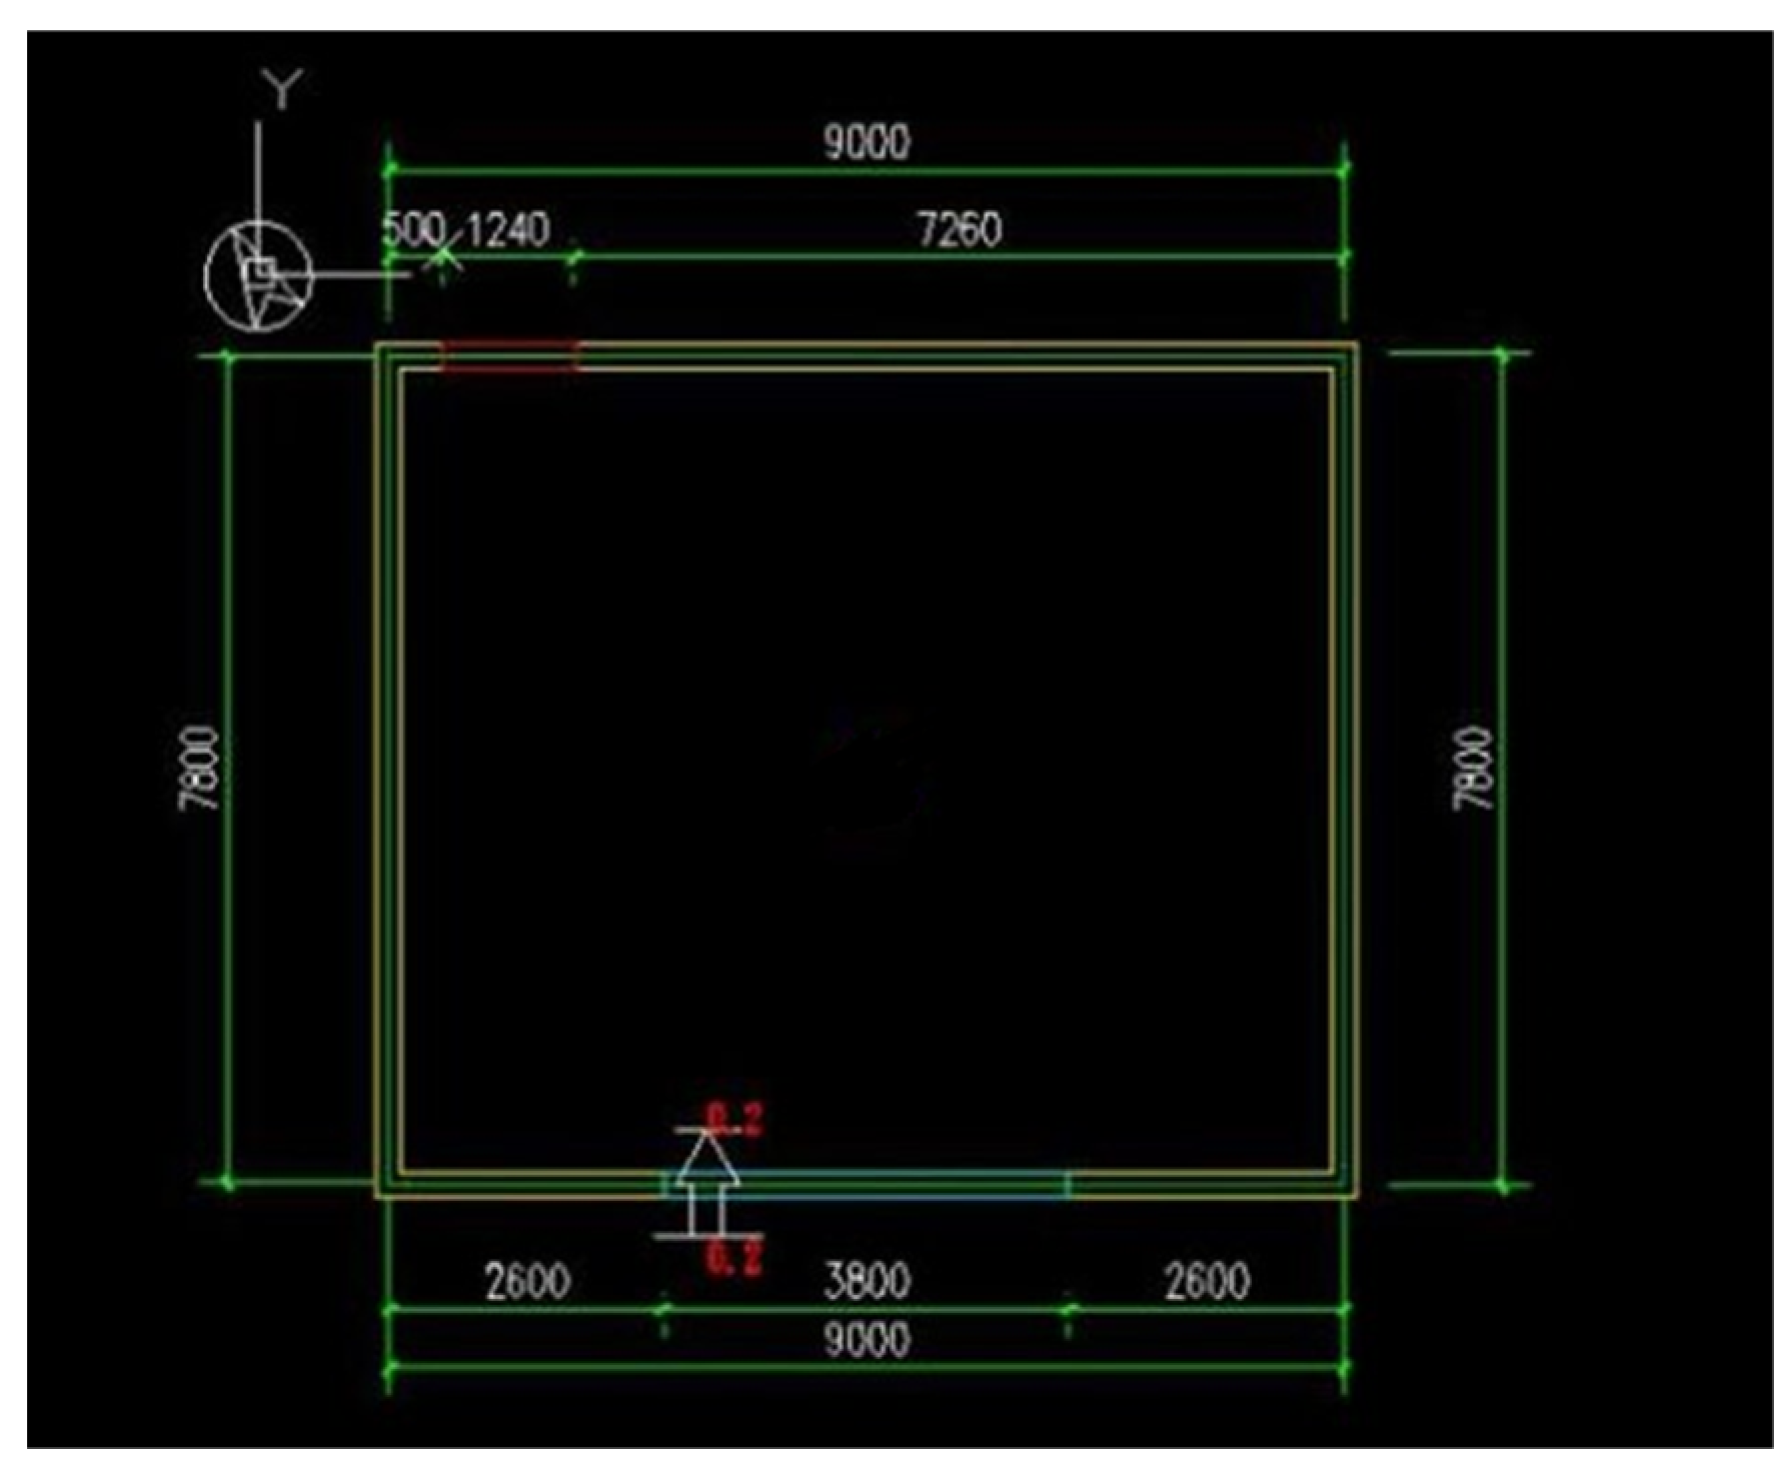
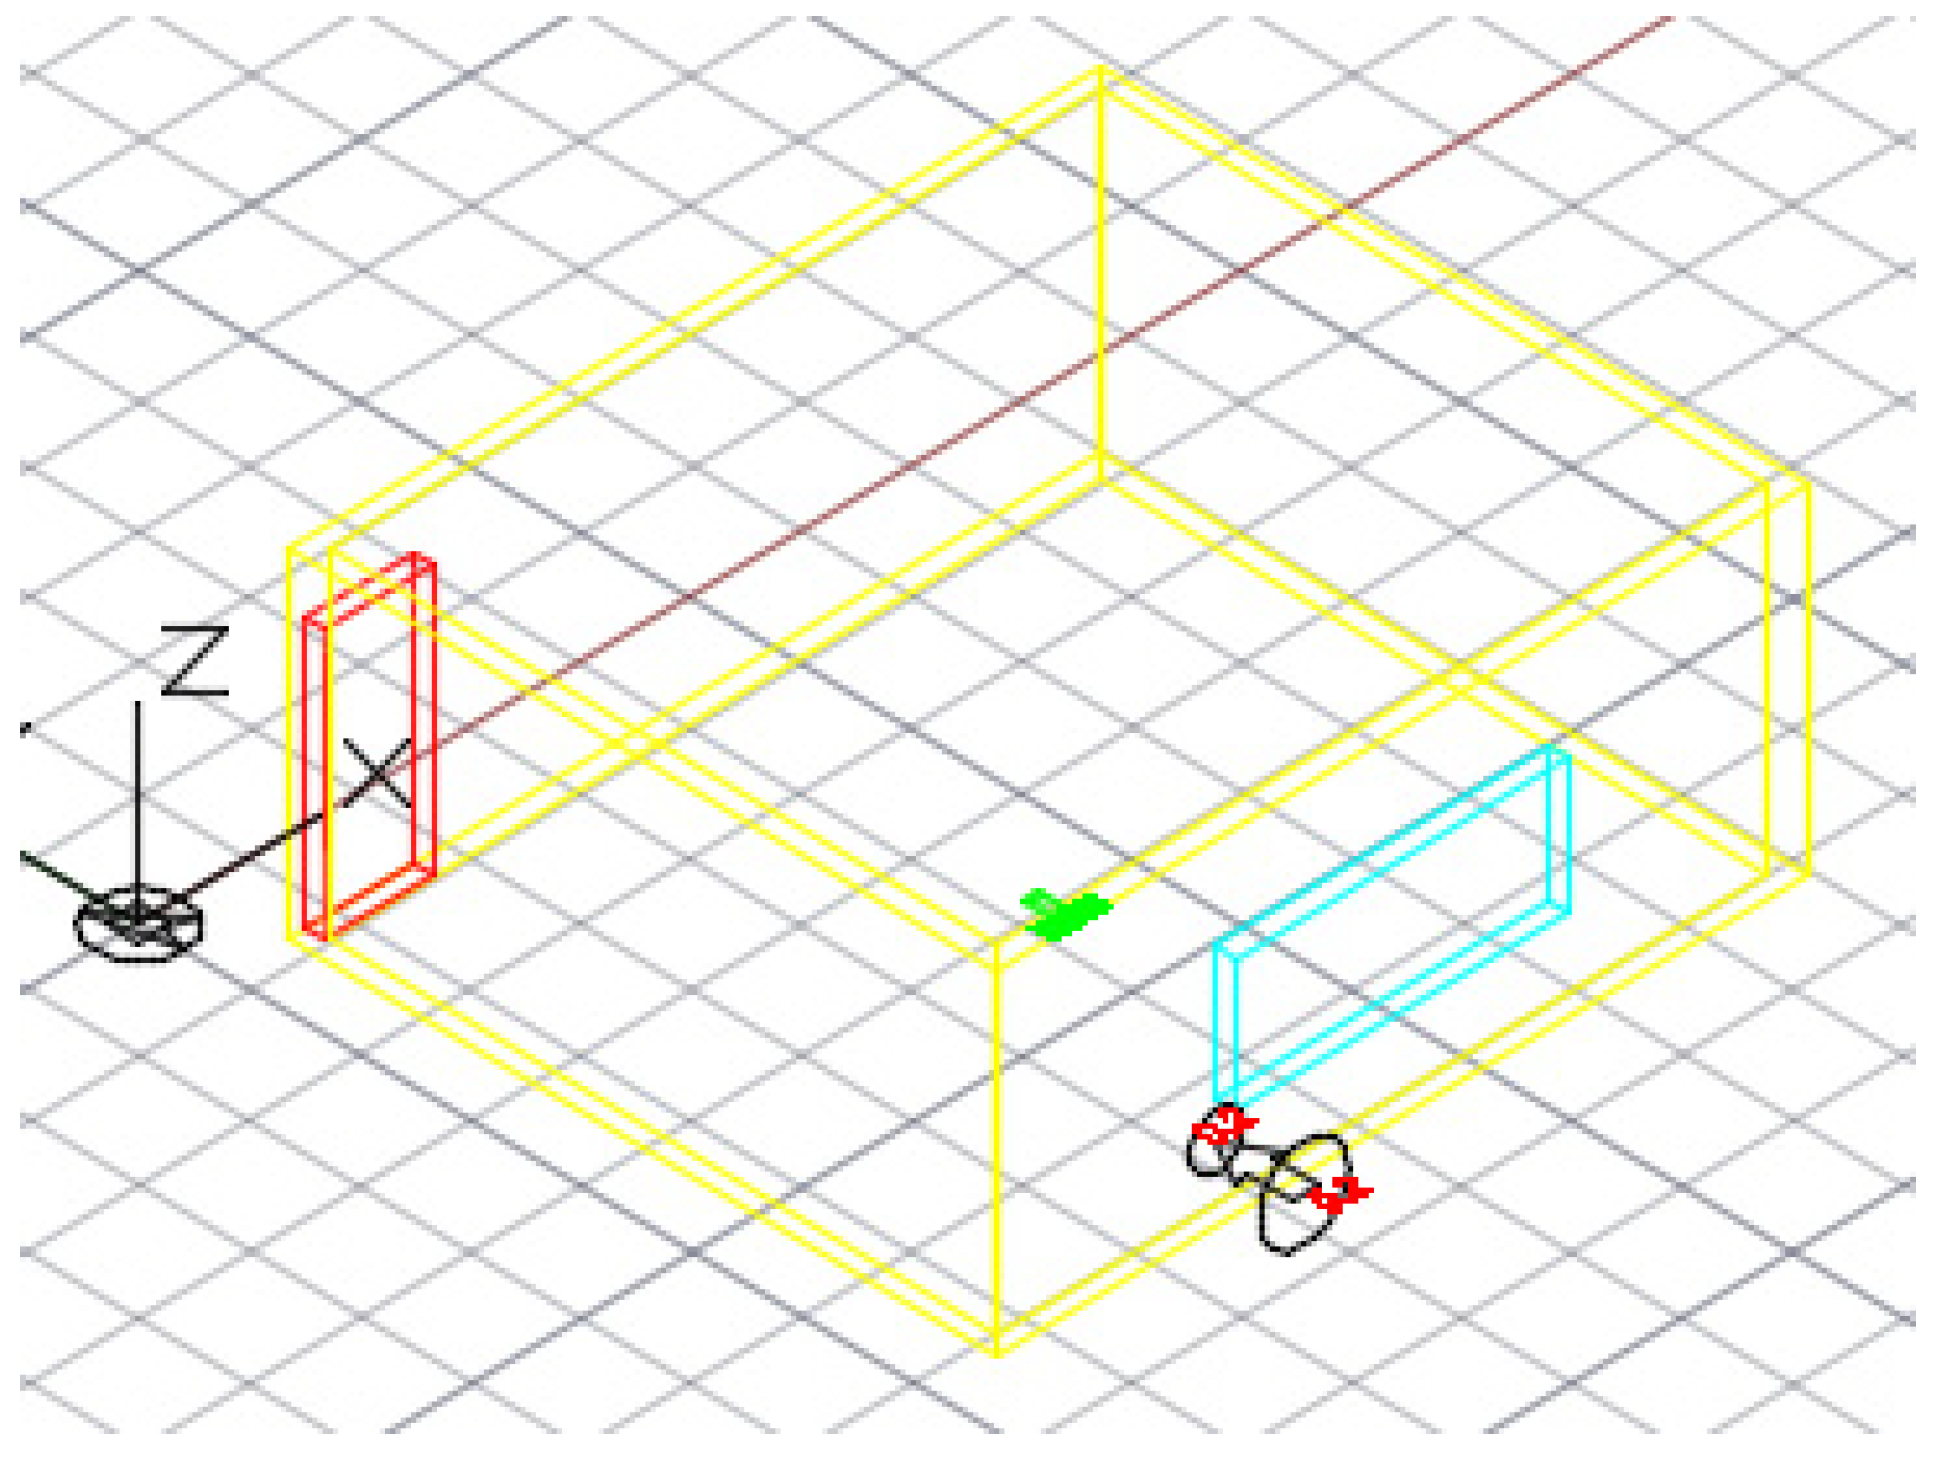
A typical single residential building in Wenzhou City was selected as the research object. The building orientation is 398° (−62°), the building size is 9000 mm × 7800 mm × 3700 mm, the window size is 3800 mm × 1460 mm, the window height is 1000 mm, the door size is 1240 mm × 2960 mm, the distance from the western wall is 500 mm, and the indoor area measures 70.20 m2. Figure 2 and Figure 3 show the plan view and the isometric view of the single residential building, respectively.
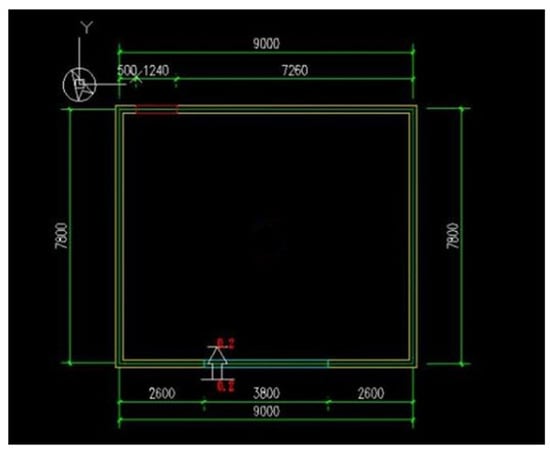
Figure 2.
Plan view.
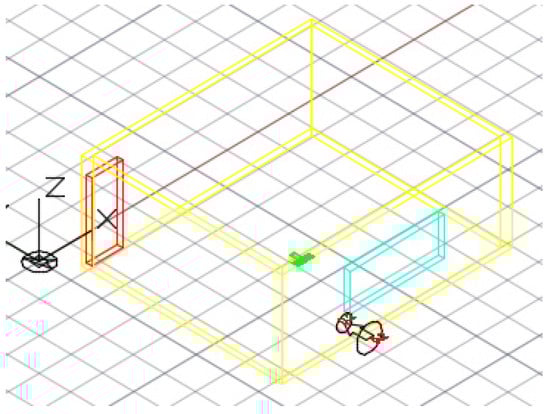
Figure 3.
Isometric view. Note: The yellow line indicates the outline of the room, the blue line indicates the window, and the red line indicates the door.
The foundation building envelope of the building is composed of an inverted roof, reinforced concrete walls, marble floors, standard single-layer glass windows, and all-wood doors. The details of the structure are listed in Table 6, while the thermal parameters of the structure are shown in Table 7.
Table 6.
Details of building envelope structure.
Table 7.
Detail of the building envelope.
5.2. Energy Consumption Pattern of the Indoor Personnel
To compare the energy-saving effects of different building envelopes, the behavioral habits of the indoor personnel were set as identical according to the energy use habits of residents in Wenzhou [38]. The lighting equipment in the room is an incandescent lamp with the minimum illumination set at 300 lx. Here, the convection part accounts for 20% of the heat disturbance distribution of the incandescent lamp, including 40% of the surrounding wall surface, 50% of the floor, and 10% of the ceiling. Table 8 shows the specific behavioral habits of the indoor personnel.
Table 8.
Behavior of the people in the room.
As the table shows, during the transitional periods, the indoor personnel were set to leave at 8:00 a.m. and to arrive home at 17:00 on weekdays and to stay at home all day on their days off. Based on the typical energy consumption behavior of Wenzhou residents, the energy consumption patterns of the experimental buildings were divided into two patterns: working days and rest days. In terms of working days, the time periods for opening the doors and windows for ventilation in May and September were set at 06:00 to 08:00 and 17:00 to 19:00, while the time period for opening the windows for ventilation in March, April, October, and November was set at 06:00 to 08:00. According to the relevant historical meteorological data, the sunrise time during the transitional periods ranges from 5:16 to 6:30, while the sunset time ranges from 17:12 to 18:48. Therefore, the indoor lighting time was set at 06:00 to 08:00 and 17:00 to 24:00 to ensure sufficient brightness in the rooms.
6. Calculation Method
6.1. TOPSIS Basic Principles
The Technique for Order Preference by Similarity to an Ideal Solution algorithm (TOPSIS) is a technology employed for determining the ideal solution through a multi-objective decision-making method. This methodology assists decision-makers in analyzing, comparing, and ranking available options when multiple criteria are considered. The fundamental concept of TOPSIS is straightforward, originating from the idea of a displaced ideal point where the solution with the shortest distance is identified [39]. Hwang et al. [40] extended this concept, suggesting that the ranking of alternatives is based on the shortest distance from the ideal solution or positive ideal solution (PIS) and the farthest distance from the negative-ideal solution (NIS), anti-ideal solution, or nadir in an n-dimensional Euclidean space. TOPSIS takes into account both distances to PIS and NIS simultaneously, establishing a preference order based on their relative closeness, which is a combination of these two distance measures.
In this paper, the envelope is segmented into four components: walls, roof, external windows, and shading aspects. Each component is then sub-divided into various types, which are characterized by low-quality indexes and high-quality indexes. The low-quality indexes encompass parameters like indoor and outdoor temperature differences, roof-surface thermal conductivity, and heat loss. These low-quality indexes need to be converted before comprehensive evaluation alongside the high-quality indexes. Thus, the TOPSIS method is deemed suitable in this context for selecting an optimal combination form for each part of the envelope.
6.2. TOPSIS Calculation Steps
- 1.
- Create a decision or evaluation matrix D
The matrix consists of m alternatives (A1, …, Am) and n criteria (X1, …, Xn) with its element Xij, where i = 1, …, m and j = 1, …, n.
- 2.
- Construct the normalized decision matrix R
Matrix D is normalized to matrix R with m alternatives and n criteria, and its element rij, where i = 1, …, m and j = 1, …, n.
- 3.
- Construct the weighted normalized decision matrix V
A set of weights w = (w1, …, wn), and , where wj > 0, j = 1, …, n is given to the corresponding criterion Xj, where j = 1, …, n. The matrix V = [wjrij] is calculated by multiplying the elements at each column of the matrix R by their associated weights wj, j = 1, …, n.
- 4.
- Determine the positive ideal and negative-ideal solutions Z+ (PIS) and Z− (NIS)
- 5.
- Distance measurement
Assuming that the decision problem involves m objectives fj (j = 1, 2, …, m) and n feasible solutions Zi = (Zi1, Zi2 …, Zim) (i = 1, 2, … n), and that the ideal solution of the normalized weighted objective of this problem is Z+, where , the distance from any feasible solution Zi to Z+ when using the Euclidean norm as the measure of distance can be described as follows:
where Zij is the normalized weighted value of the jth target to the ith scheme (solution).
In the same way, if this is set as the negative ideal solution of the normalized weighted objective of the problem, any feasible solution can be obtained.
Assuming that the distance between Zi and the negative ideal solution Z− is as follows:
the relative proximity of a feasible solution to an ideal solution can be defined as follows:
Therefore, if Zi is an ideal solution, the corresponding Ci = 1, while if Zi is a negative ideal solution, the corresponding Ci = 0. The closer Zi is to the ideal solution, the closer Ci is to 1, while the closer Ci is to the negative ideal solution, the closer it is to 0. Then, Ci can then be sorted to determine a satisfactory solution.
6.3. RANCOM Basic Principles
The RANCOM method introduces a novel approach to determining criterion relevance through subjective evaluations, allowing for the handling of inaccuracies in expert judgment. This methodology employs an intuitive approach to assess standard relationships and establish rankings, catering to both less and more experienced users, thereby solving complex problems efficiently. Key features include providing significant weight diversity in problems with multiple criteria, ensuring results closely align with existing methods, addressing inaccuracies in expert judgment, and displaying high reproducibility. Additionally, the method addresses shortcomings in currently used methods, streamlining the subjective identification process of criteria importance by experts.
In alignment with the TOPSIS findings mentioned earlier, Series 1~Series 12 variables represent different exterior wall materials, Series 13~Series 60 variables denote various planted roofs, Series 61~Series 81 correspond to different window materials, and Series 82~Series 160 encompass distinct shading materials. The decision matrix for the selected criteria is formed by choosing the first four optimal solutions from each of the four material categories. Subsequently, the RANCOM method is employed for importance analysis of the parameters.
6.4. RANCOM Calculation Steps
- 1.
- Define the criteria ranking
The expert determines the position of the criteria regarding other factors. The designated ranking should be defined as lower values assigned to more significant criteria. Additionally, the criteria may have equal positions in the ranking, which means that ties are allowed during the expert judgment. The criteria ranking could be defined with subsequent values (i.e., 1–5 for five criteria) or could consist of more diverse values (i.e., 1, 5, 9, 12, and 18 for five criteria). However, the differences that occurred in the ranking vector would not affect the calculated weights unless they include different criteria hierarchy.
- 2.
- Establish the Matrix of Ranking Comparison
The MAtrix of ranking Comparison (MAC) is determined by using a pairwise comparison of the positions from the ranking made by the expert. The comparison result is determined as αij. Based on that, the MAC matrix can be represented as (9):
where n is the number of criteria taken into account in the problem, and αij is determined from (10):
where ƒ(C) is a significance function of criterion C.
- 3.
- Calculate the Summed Criteria Weights
Based on the obtained MAC, the horizontal vector of the Summed Criteria Weights (SCWs) is obtained as follows (11).
- 4.
- Calculate the final criteria weights
Finally, values of preference are approximated for each criterion. As a result, the horizontal vector W is obtained, where the ith row contains the approximate preference value for Ci. The weights for the set of criteria are obtained as (12):
7. Results and Analysis
7.1. TOPSIS Results
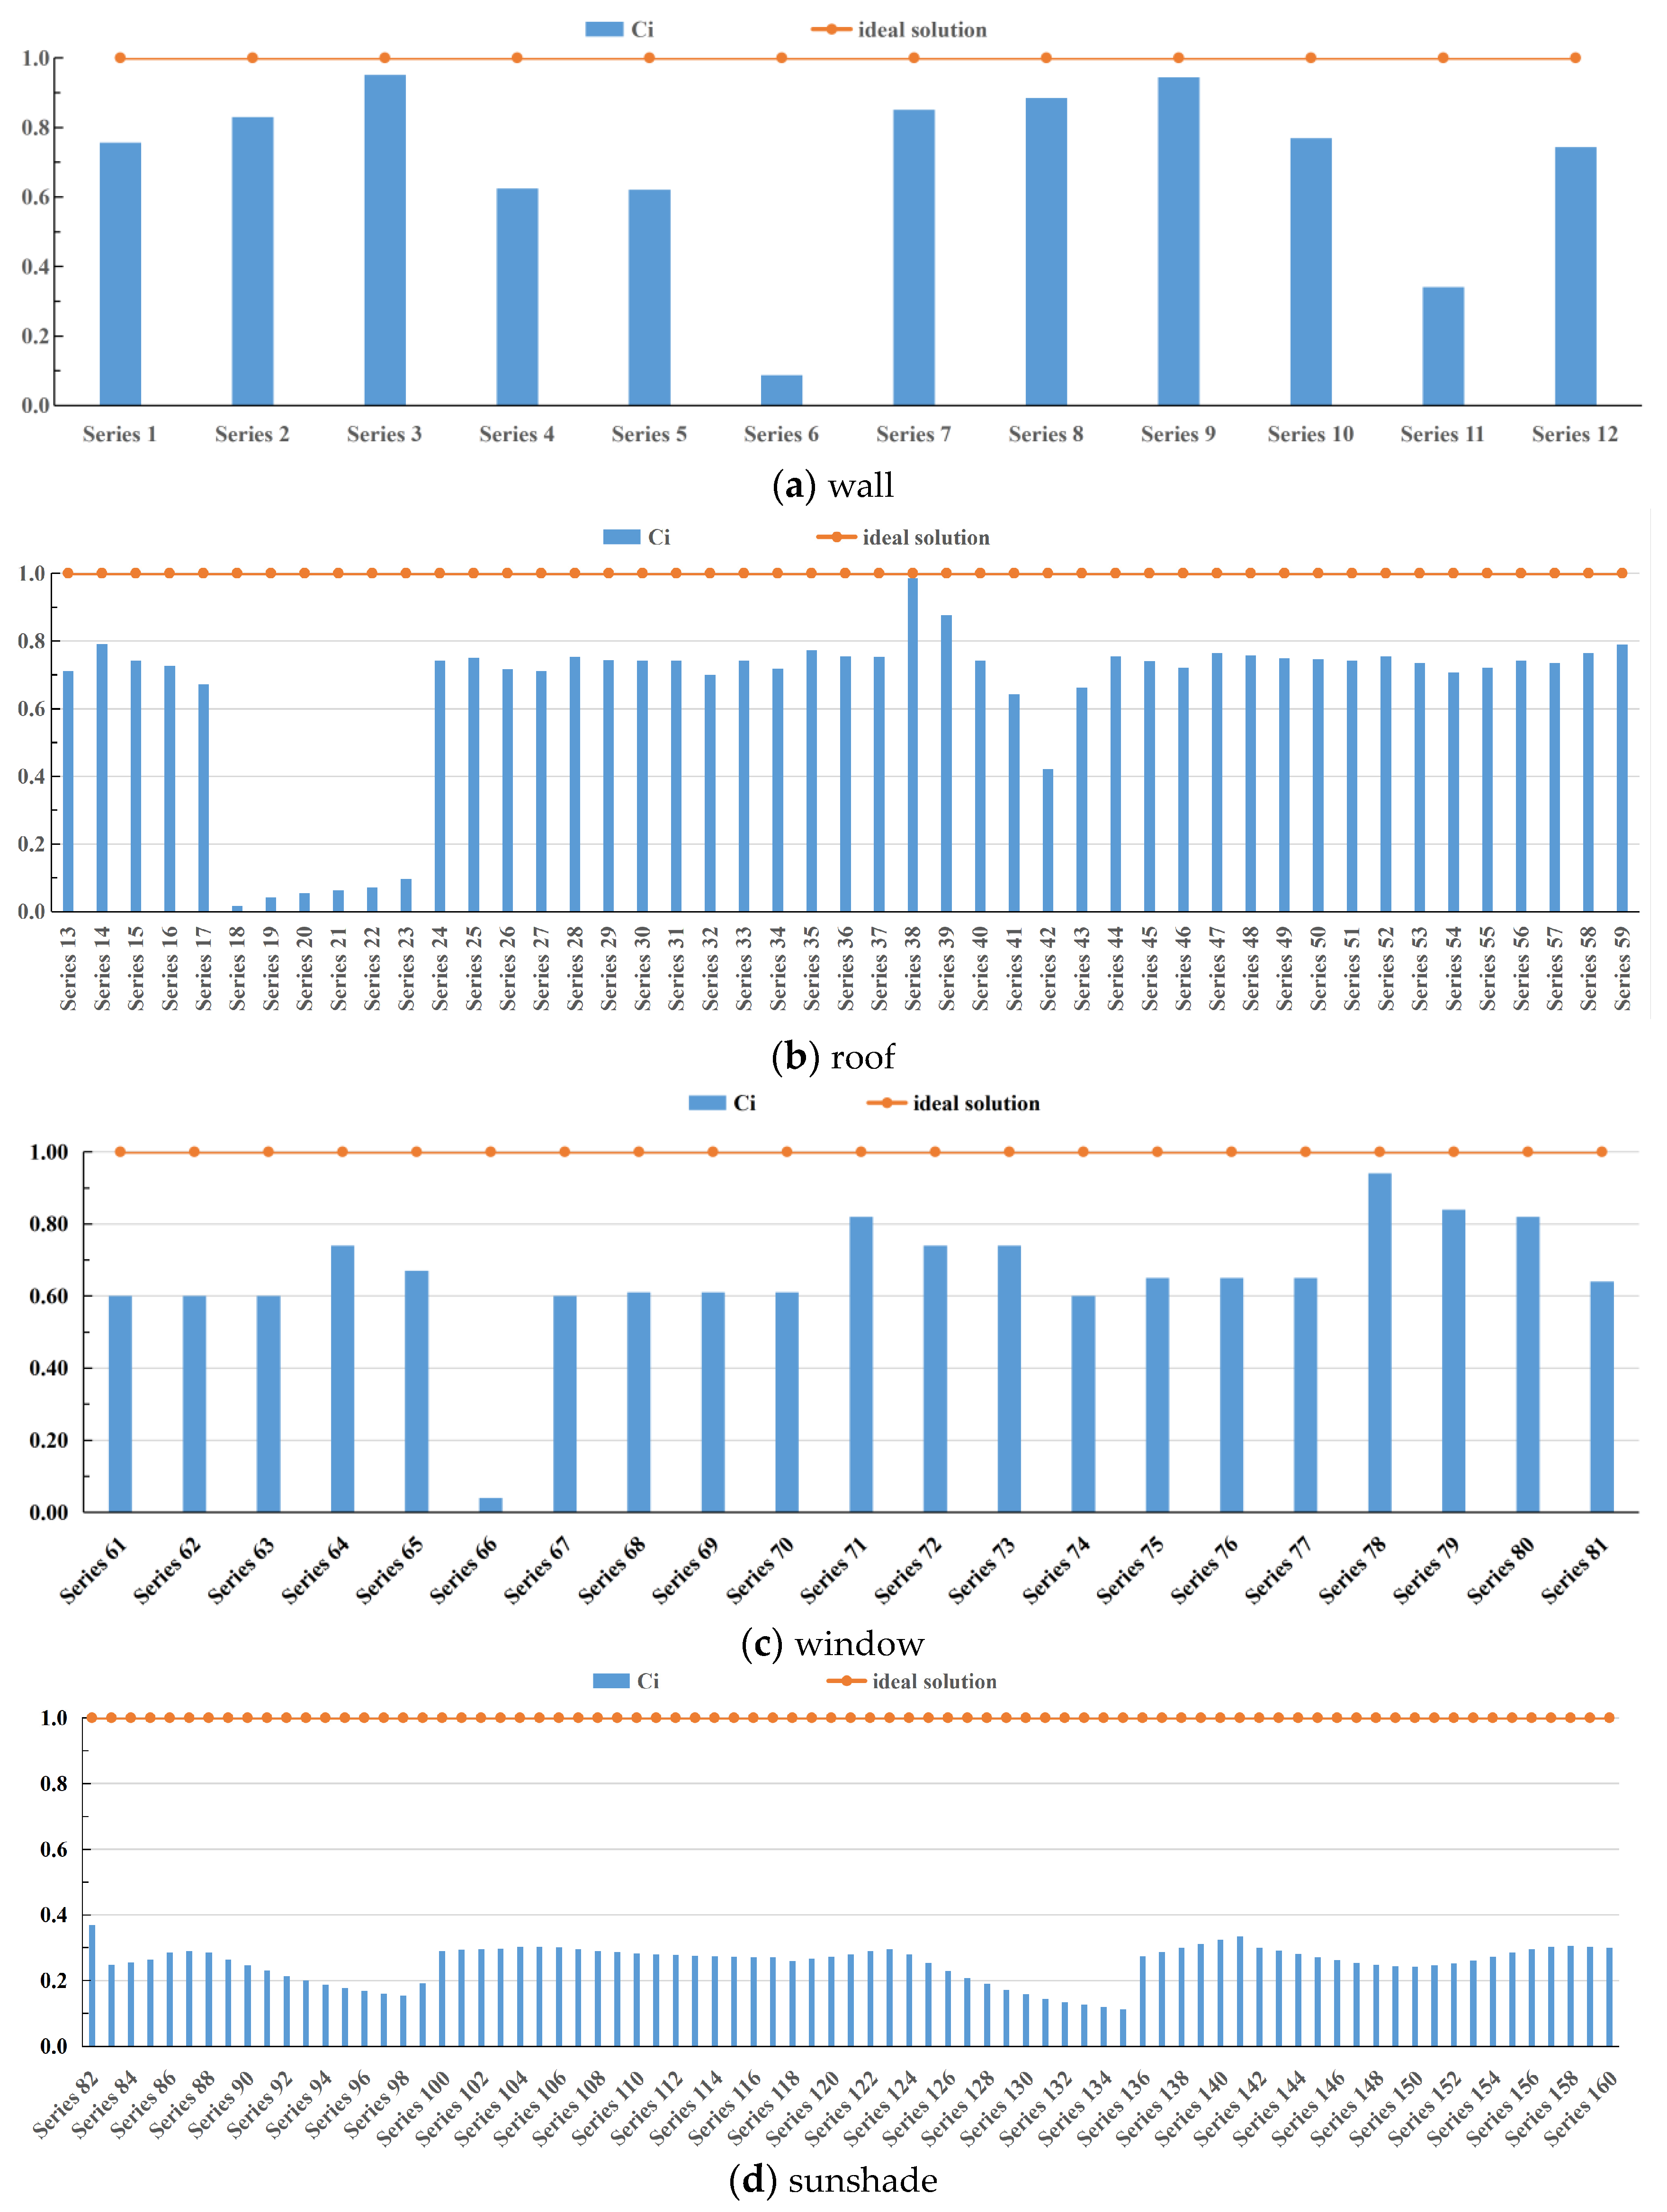
The building environment under different envelope combinations was simulated using ENERGYPLUS 9.5 software to assess the following: the wall-surface temperature, the indoor temperature and the indoor and outdoor temperature difference under wall series 1 to series 12, the roof-surface temperature and thermal conductivity under different plant heights, the leaf area index, the leaf reflectivity, the soil roughness, the soil thickness, the soil conductivity, the soil-specific heat, and the soil density in series 13 to series 60 of the planting roofs, the window heat increase rate, the window heat loss rate, the regional air temperature and the outer window inner-surface temperature under window series 61 to series 81, the incident solar emissivity, the window heat growth rate, the window heat loss rate and inner-surface temperature under different transmittance and shade heights when the shading methods are horizontal shading, vertical shading, and comprehensive shading in the sunshade series 82 to series 160, and the incident solar emissivity, window heat growth rate, window heat loss rate and inner-surface temperature under different louver angles when the shading method is louver shading. The above were assessed using the TOPSIS algorithm with the calculated results compared and sorted. The results are shown in Figure 4.
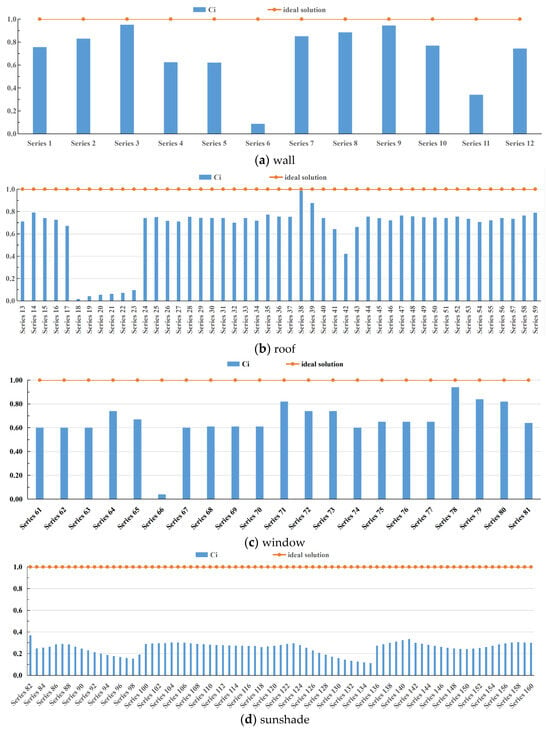
Figure 4.
TOPSIS calculation results of energy saving envelope.
The results, which are shown in Figure 4, were as follows:
- 1.
- Walls
The Ci values were arranged in the order from large to small as C3 > C9 > C8 > C7 > C2 > C10 > C1 > C12 > C4 > C5 > C11 > C6. In other words, we identified the following descending order in terms of approaching the ideal solution: sintered hollow brick > common concrete porous brick > lightweight aggregate concrete hollow block > non-clay sintered insulation brick > sintered porous brick > common concrete porous block > ceramsite concrete composite block > non-clay sintered insulation block > autoclaved sand aerated concrete block > autoclaved fly ash aerated concrete block > sintered common brick masonry > foam concrete block.
- 2.
- Roof
Here, there were numerous influencing factors, which could be divided into eight main categories: plant height, leaf area index, leaf reflectivity, soil roughness, soil thickness, soil conductivity, soil-specific heat, and soil density. These eight factors were calculated together but will be discussed separately. Here, the following was concluded: (i) when the plant height was the variable, the order of the Ci value from large to small was C14 > C15 > C16 > C13, that is, the descending order in terms of approaching the ideal solution was 0.2 > 0.3 > 0.4 > 0.1 > 0.5 m; (ii) when the leaf area index was the variable, the order of the Ci values from large to small was C23 > C22 > C21 > C20 > C19 > C18, that is, the descending order in terms of approaching the ideal solution was 1 > 0.5 > 0.4 > 0.3 > 0.2 > 0.1; (iii) when the leaf reflectivity was the variable, the order of the Ci values from large to small was C28 > C25 > C29 > C24 = C31 > C30 > C26 > C27, that is, the descending order in terms of approaching the ideal solution was 0.8 > 0.2 > 0.85 > 0.1 > 0.95 > 0.9 > 0.3 > 0.4; (iv) when the soil roughness was the variable, the order of the Ci values from large to small was C35 > C36 > C37 > C33 > C34 > C32, that is, the descending order in terms of approaching the ideal solution was smooth > medium smooth > very smooth > medium rough > rough > very rough; (v) when the soil thickness was the variable, the order of the Ci values from large to small was C38 > C39 > C40 > C43 > C41 > C42, that is, the descending order in terms of approaching the ideal solution was 0.05 > 0.1 > 0.2 > 0.5 > 0.3 > 0.4 m; (vi) when soil conductivity was the variable, the order of the Ci values from large to small was C47 > C48 > C44 > C50 > C49 > C45 > C46, that is, the descending order in terms of approaching the ideal solution was 0.7 > 0.8 > 0.4 > 1.0 > 0.9 > 0.5 > 0.6; (vii) when soil-specific heat was the variable, the order of the Ci values from large to small was C53 > C51 > C52 > C54, that is, the descending order in terms of approaching the ideal solution was 1500 > 500 > 1000 > 2000 j/(kg·k); and (viii) when soil density was the variable, the order of the Ci values from large to small was C60 > C59 > C57 > C58 > C56 > C55, that is, the descending order in terms of approaching the ideal solution was 2000 > 1500 > 500 > 1000 > 400 > 300 kg/m3.
- 3.
- Windows
The order of the Ci values from large to small was C78 > C79 > C80 > C71 > C72 = C73 > C64 > C65 > C75 = C76 = C77 > C81 > C68 = C69 = C70 > C74 > C61 = C62 = C63 > C67 > C66. In other words, the descending order in terms of approaching the ideal solution was u = 2.8 PVC plastic–steel type + ordinary hollow, u = 3.3 PVC plastic–steel type + Low-e medium permeability, u = 3.4 PVC plastic–steel type + Low-e high permeability, u = 3.4 insulated aluminum alloy + ordinary hollow, u = 4 insulated aluminum alloy + Low-e medium permeability, u = 4 insulated aluminum alloy + Low-e high permeability, u = 4 plastic–steel window + ordinary hollow, u = 4.6 plastic–steel window + Low-e medium transmittance, u = 4.9 PVC plastic–steel type + standard external window, u = 4.9 PVC plastic–steel type + blue heat-absorbing glass single glass, u = 4.9 PVC plastic–steel type + high-transmittance heat-reflecting glass, u = 5 PVC plastic–steel type + ordinary 3 mm single glass, u = 5.7 insulated heat aluminum alloy + standard external window, u = 5.7 insulated aluminum alloy + blue heat-absorbing glass single glass, u = 5.7 insulated aluminum alloy + high-transmittance heat-reflecting glass, u = 5.8 insulated aluminum alloy + ordinary 3 mm single glass, u = 6.5 plastic–steel window + standard external window, u = 6.5 plastic–steel window + blue heat-absorbing single glass, u = 6.5 plastic–steel window + high-transmittance heat-reflecting glass, u = 6.6 model steel window + ordinary 3 mm single glass, u = 4.7 paternal steel window + Low-e high transmittance.
- 4.
- Shading
As noted, the shading was divided into four categories: horizontal shading, vertical shading, comprehensive shading, and louver shading. The results were as follows. In terms of horizontal shading, when the transmittance was the variable, the order of the Ci values from large to small was C82 > C87 > C86 > C85 > C84 > C83; that is, the descending order in terms of approaching the ideal solution was 0.15 > 0.8 > 0.7 > 0.5 > 0.4 > 0.3. When the extension length of the sun visor was selected as the variable, the order of the Ci values from large to small was C88 > C89 > C90 > C91 > C92 > C93 > C99 > C94 > C95 > C96 > C97 > C98 > C99; that is, the descending order in terms of approaching the ideal solution was 1000 > 200 > 300 > 400 > 500 mm. In terms of vertical shading, when the transmittance was the variable, the order of the Ci values from large to small was C105 > C104 > C103 > C102 > C101 > C100; that is, the descending order in terms of approaching the ideal solution was 0.8 > 0.7 > 0.5 > 0.4 > 0.3 > 0.15. When the length of the sun visor was selected as the variable, the order of the Ci values from large to small was C106 > C107 > C108 > C109 > C110 > C111 > C112 > C113 > C114 > C115 > C116 > C117 with the corresponding values in terms of approaching the ideal solution 100, 200, 300, 400, 500, 600, 700, 800, 900, 1000, 1100, and 1200 mm. In terms of comprehensive shading, when the transmittance was the variable, the order of the Ci values from large to small was C123 > C122 > C121 > C120 > C119 > C118; that is, the descending order in terms of approaching the ideal solution was 0.8 > 0.7 > 0.5 > 0.4 > 0.3 > 0.15. When the length of the sun visor was selected as the variable, the order of the Ci values from large to small was C124 > C125 > C126 > C127 > C128 > C129 > C130 > C131 > C132 > C133 > C134 > C135; that is, the descending order in terms of approaching the ideal solution was 100 > 200 > 300 > 400 mm. In terms of louver shading, when the transmittance was the variable, the order of the Ci values from large to small was C141 > C140 > C139 > C138 > C137 > C136; that is, the descending order in terms of approaching the ideal solution was 0.8 > 0.7 > 0.5 > 0.4 > 0.3 > 0.15. When the louver angle was the variable, the order of the Ci values from large to small was C158 > C157 > C159 > C142 > C160 > C156 > C143 > C155 > C144 > C154 > C145 > C146 > C153 > C147 > C152 > C148 > C151 > C149 > C150 with the corresponding values in terms of approaching the ideal solution 160°, 150°, 170°, 0°, 40°, 180°, 140°, 10°, 130°, 20°, 120°, 30°, 110°, 50°, 100°, 60°, 90°, 70°, and 80°.
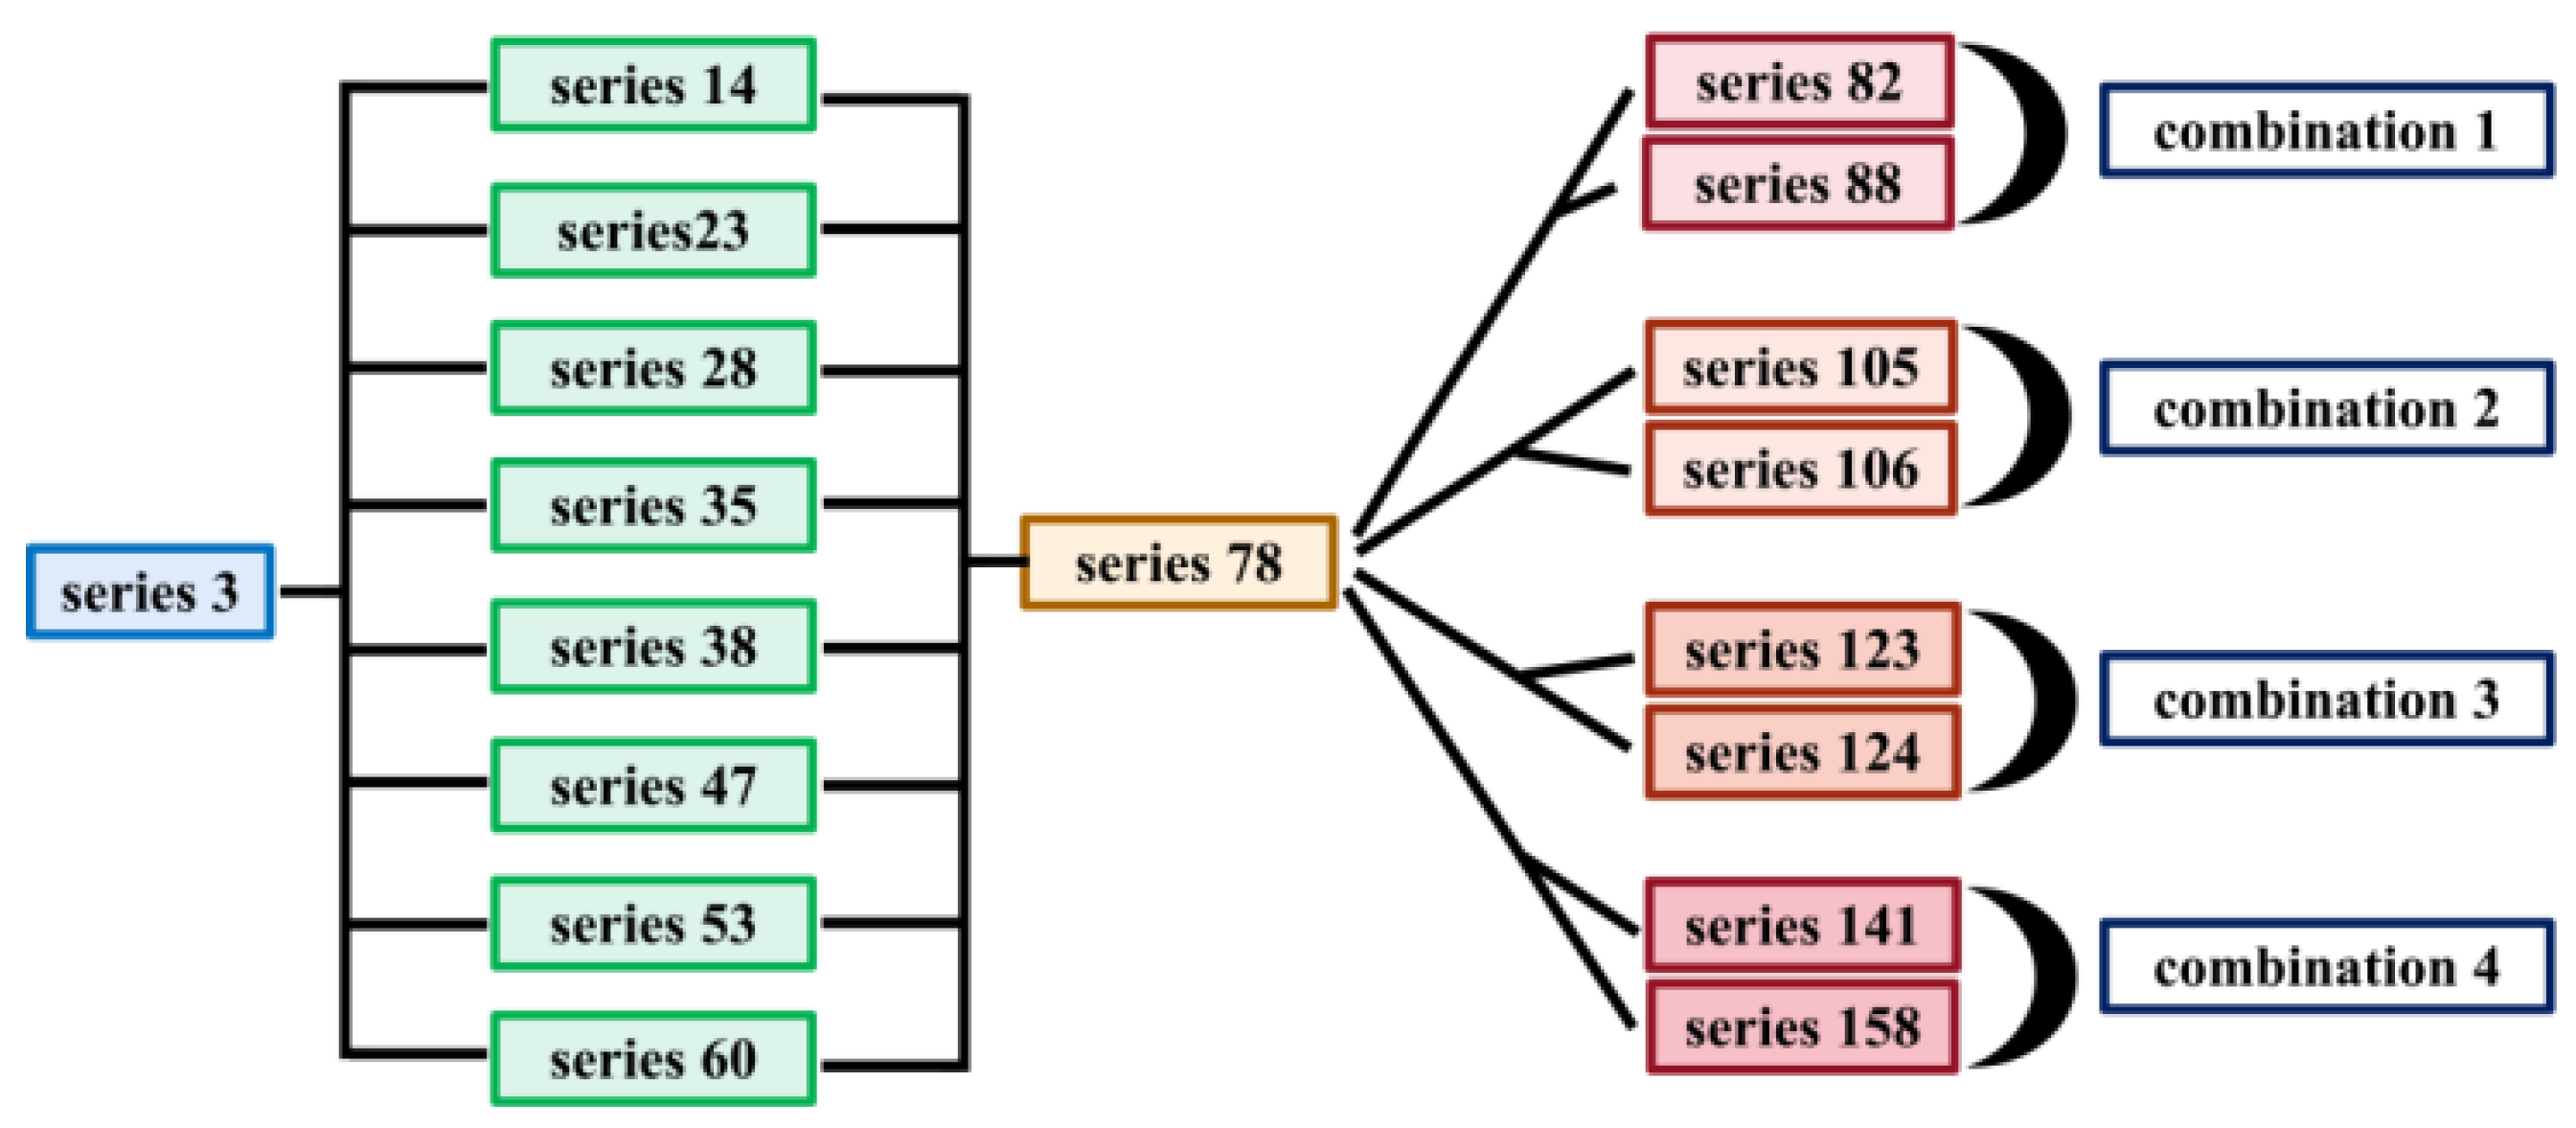
According to the above calculation results, among the different forms of the building envelope, the one that is closest to the ideal solution can be achieved when the wall material is sintered hollow brick, and when the height of the plants on the planting roof is 0.2 m, the leaf area index is 1, the leaf reflectivity is 0.8, the roughness is smooth, the thickness is 0.05 m, the soil conductivity is 0.7, the soil-specific heat is 1500 J/kg °C, and the soil density is 2000 kg/m3. When the window type is u = 2.8 PVC plastic–steel type + ordinary hollow, this is the closest to the ideal solution. Meanwhile, in terms of horizontal shading design, this is the closest to the ideal solution when the transmittance is 0.15 and the extension length of the sun visor is 100 mm, while in terms of the vertical shading design, the transmittance should be 0.8 and the extension length should be 100 mm, and in terms of louver shading, the transmittance should be 0.8 and the louver angle should be 160°. In sum, the energy-saving building envelopes are defined in terms of four categories, as shown in Figure 5.
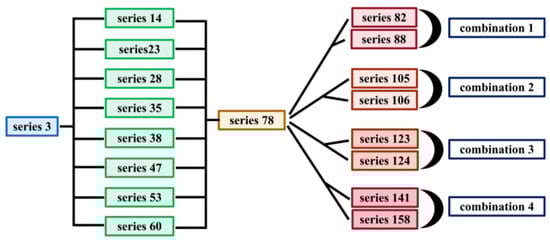
Figure 5.
Energy-saving combination mode.
7.2. RANCOM Results
The first four optimal solutions were selected among different exterior wall materials, various planted roofs, distinct window materials, and diverse shading methods to form the decision matrix of the selected criteria. The importance analysis was then conducted using the RANCOM method with the parameters shown in Table 9.
Table 9.
Decision matrix for the selected criteria.
The RANCOM algorithm was employed for evaluation, and the results of parameter importance weight calculations were compared and ranked. The results are as follows:
Ultimately, among the four variables—exterior wall materials, planted roofs, window materials, and shading forms—the weights, in descending order, are window materials, exterior wall materials, planted roofs, and shading forms in the process of influencing building energy consumption. These results align with those obtained using the TOPSIS method.
7.3. Optimal Energy Saving Form Energy Consumption for Single Building
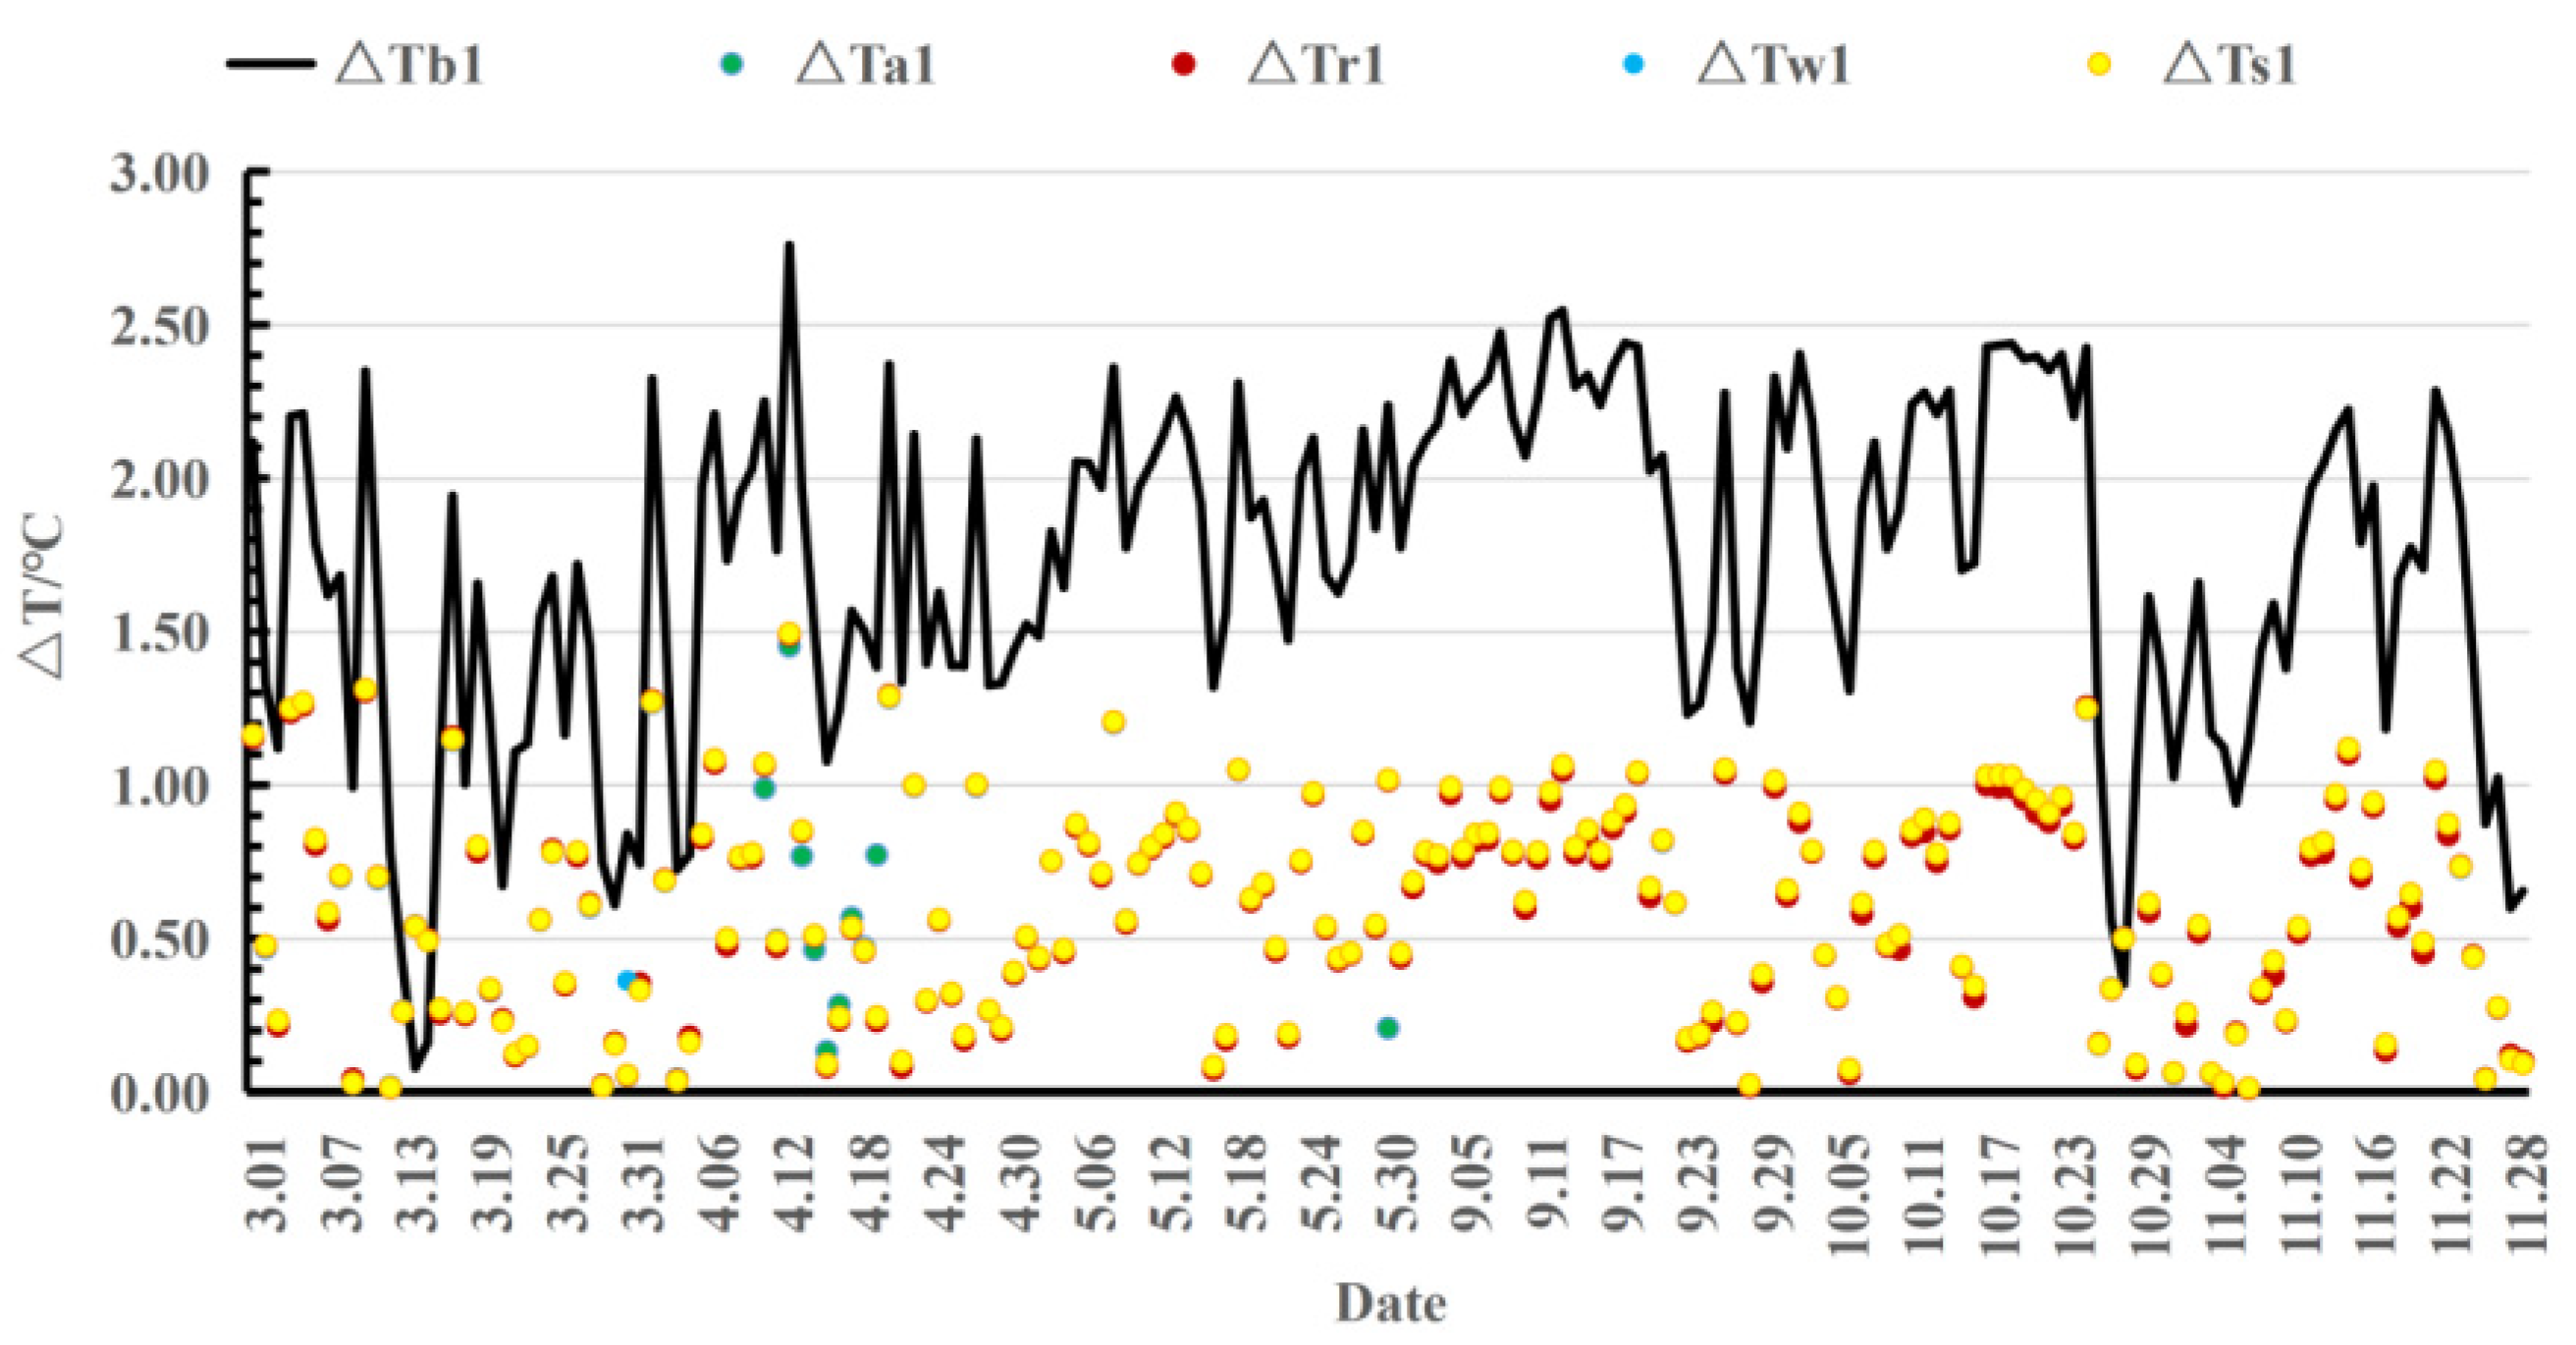
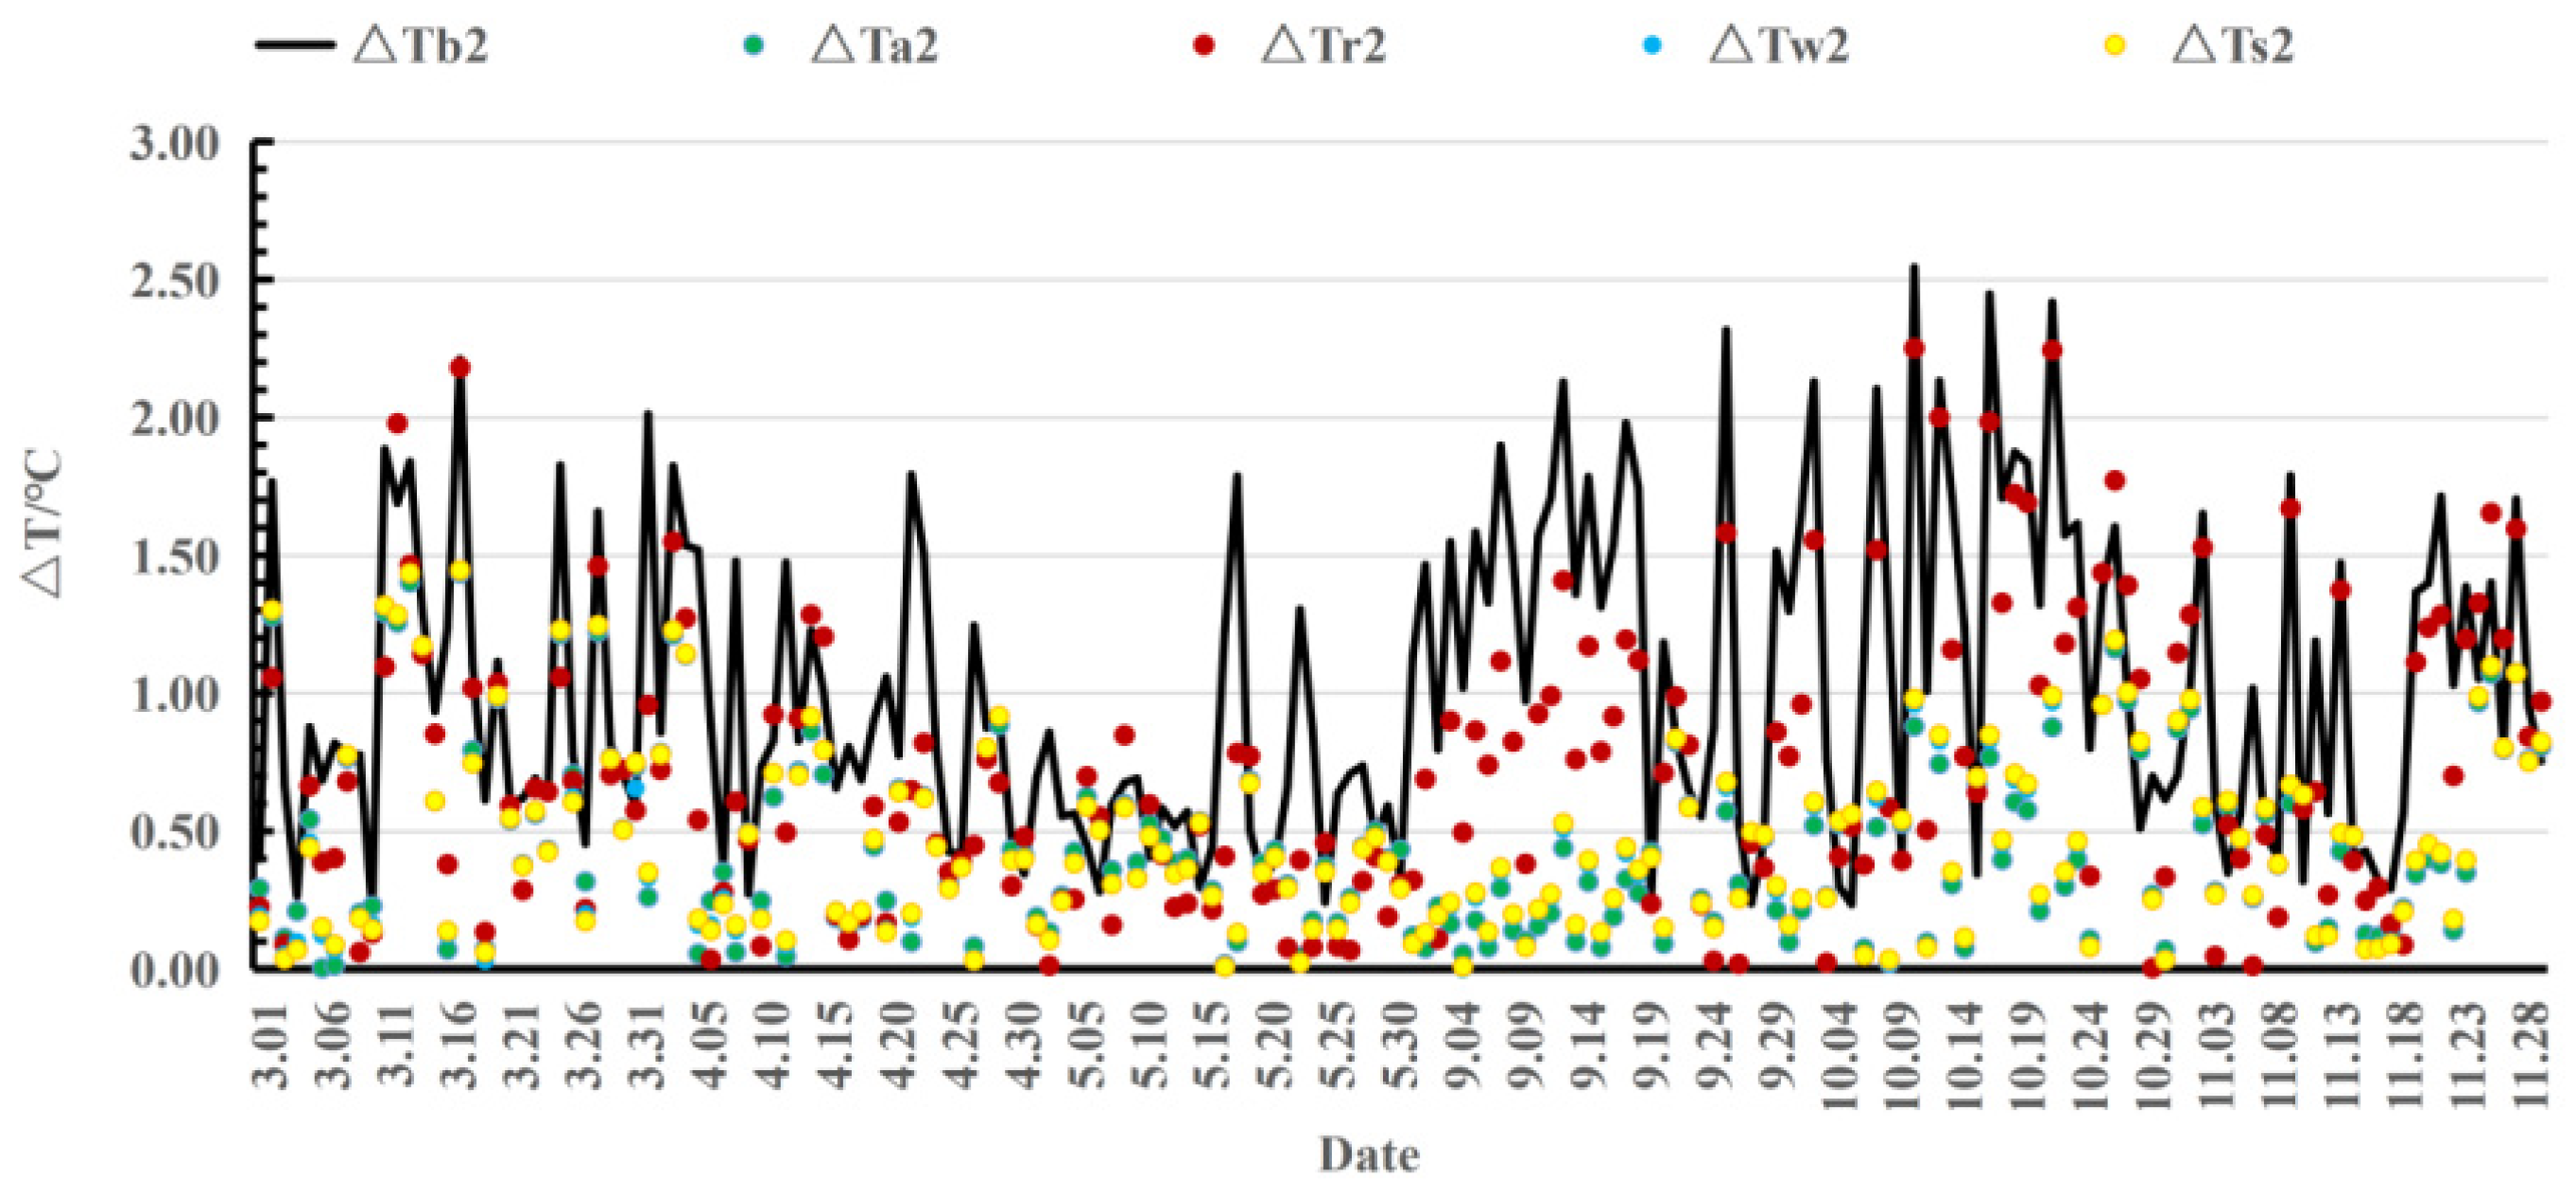
The energy consumption of the four energy-saving buildings shown in Figure 5 was simulated according to the energy consumption pattern presented in Table 5, with the building loads of the energy-saving buildings compared with those of the basic building. The results are shown in Figure 6. After comparing the exterior wall temperature and the indoor temperature, the exterior window temperature and the indoor temperature, the roof temperature and the indoor temperature of the energy-saving buildings and the basic building, the indoor environment distribution uniformity of both building types was obtained, and the results are shown in Figure 7, Figure 8 and Figure 9.
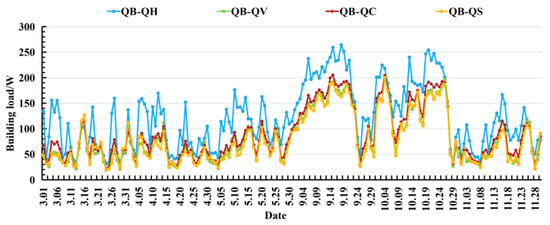
Figure 6.
Differences between different building loads.

Figure 7.
Differences between exterior wall temperature and indoor temperature of different buildings.

Figure 8.
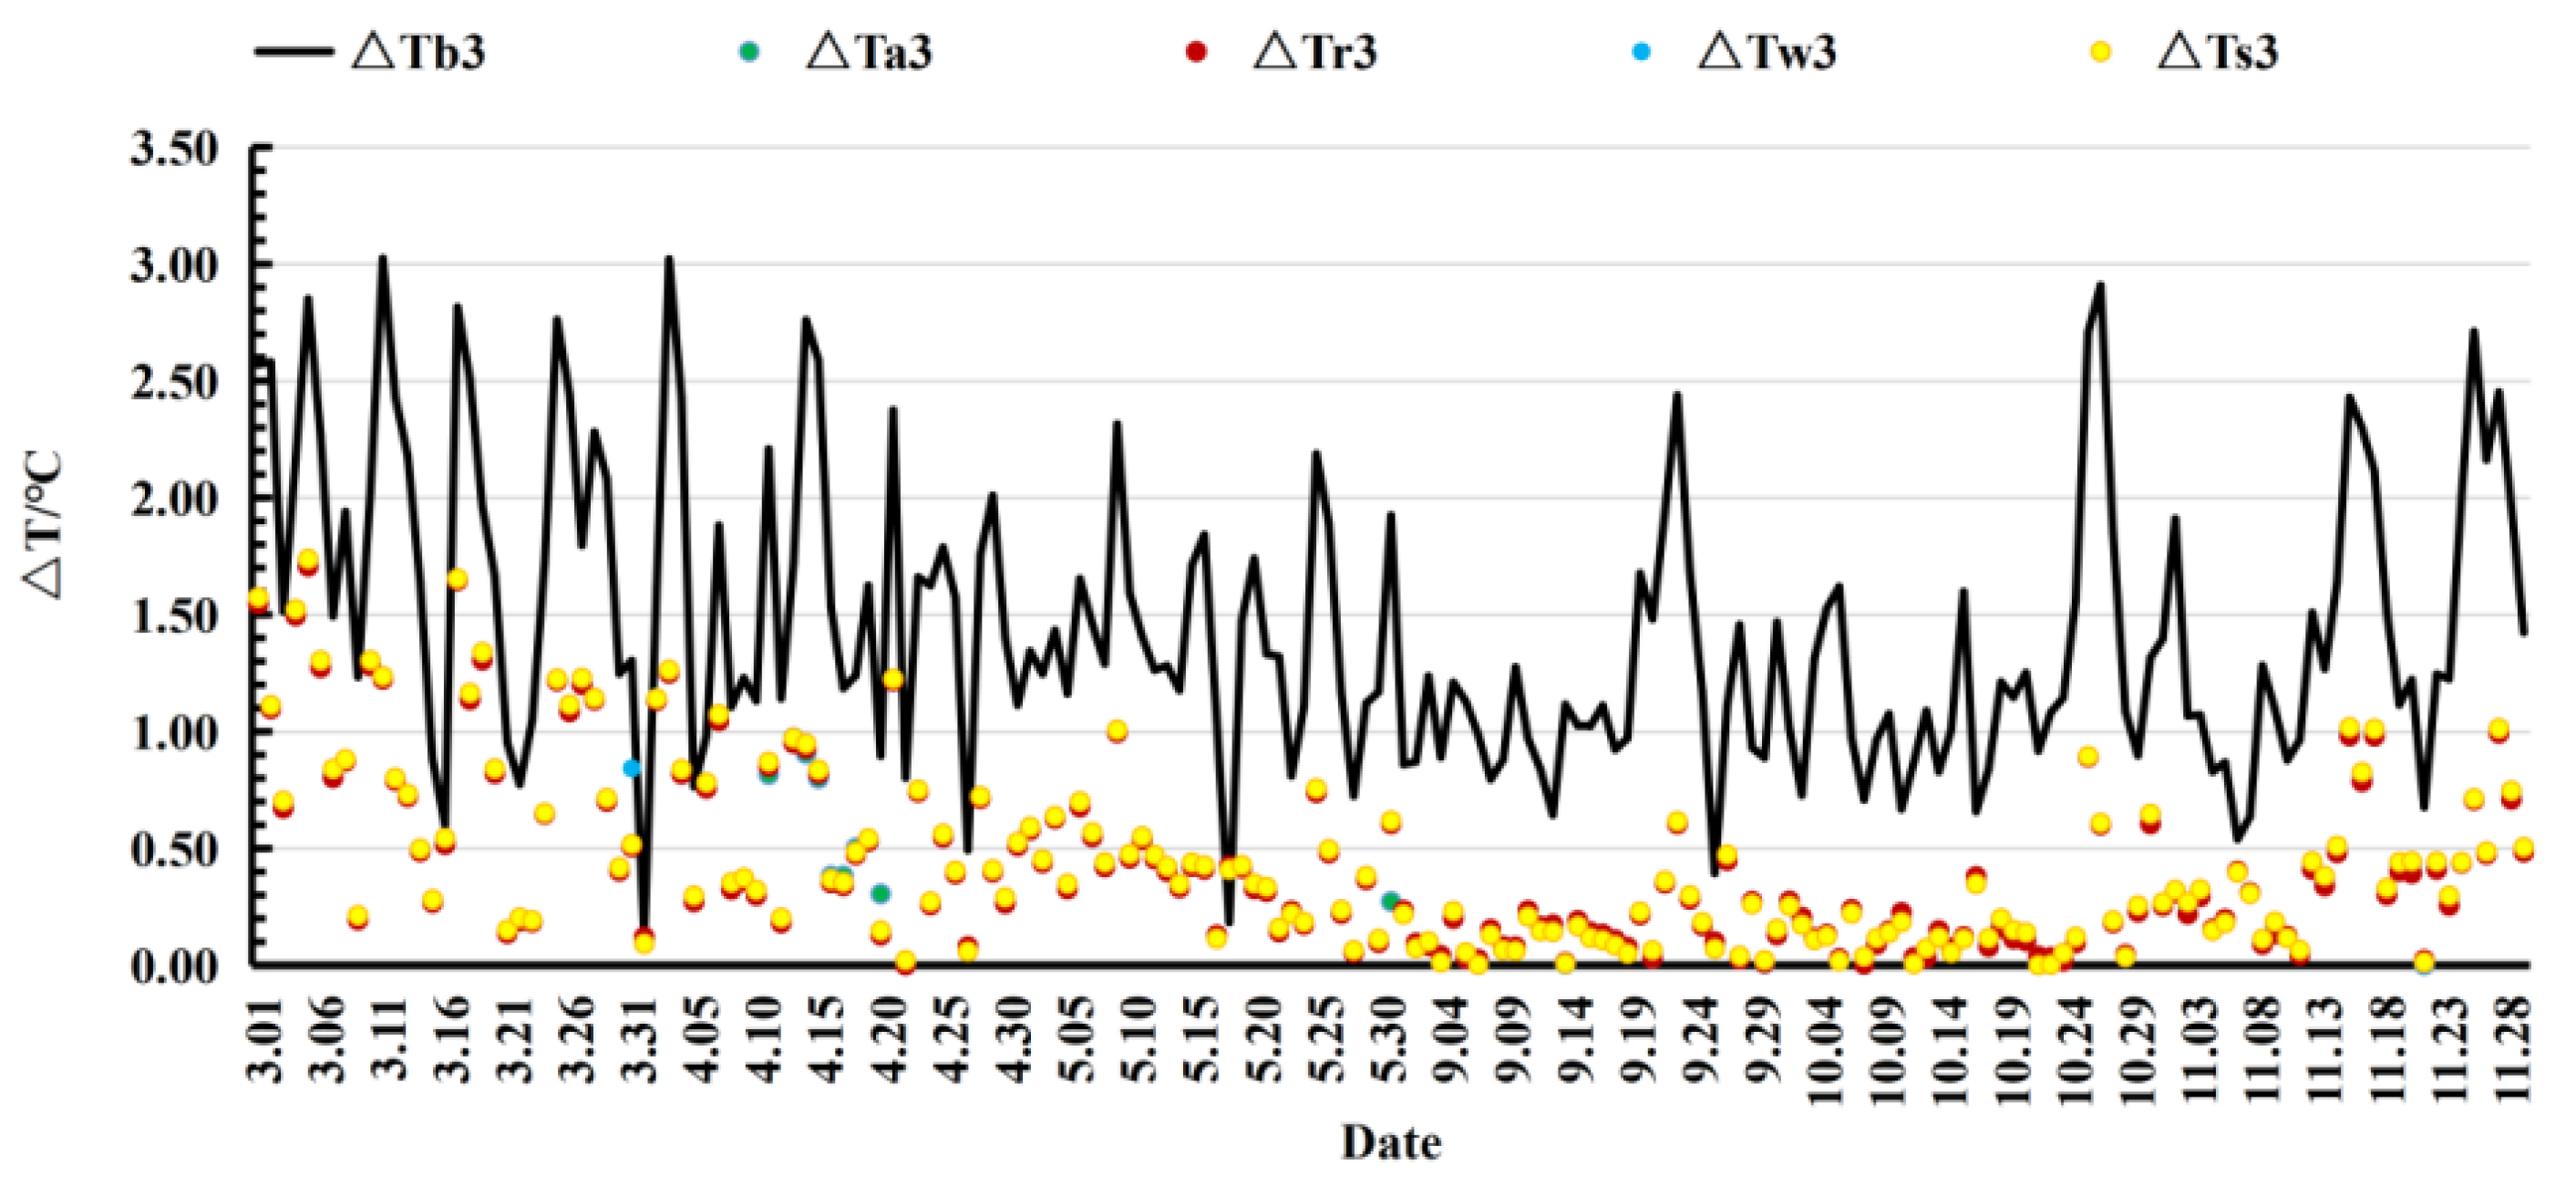
Differences between exterior window temperature and indoor temperature in different buildings.
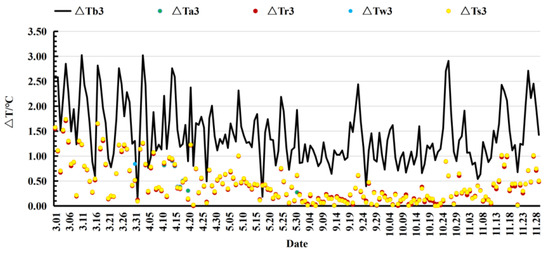
Figure 9.
Differences between roof temperature and indoor temperature in different buildings.
As Figure 6 shows, the load of the energy-saving buildings adopting horizontal shading, vertical shading, comprehensive shading, and louver shading was lower than that of the basic building with the specific results shown in Table 10.
Table 10.
Average value of the differences between different building loads.
In fact, Table 10 shows the average difference in building load among the different buildings. Here, the load of the basic building was 122.00 W higher than that of the horizontal-shading-based energy-saving buildings, 82.31 W higher than that of the vertical-shading-based energy-saving buildings, 88.91 W higher than that of the comprehensive-shading-based energy-saving buildings, and 79.48 W higher than that of the louver-shading-based energy-saving buildings.
As shown in Figure 7, the difference between the exterior wall temperature and the indoor temperature of the basic building was larger than that of the energy-saving buildings regardless of whether they featured horizontal shading, vertical shading, comprehensive shading, or louver-based shading. The specific comparison results are shown in Table 11.
Table 11.
Range of differences between exterior wall temperature and indoor temperature of different buildings.
As the table shows, during the transition periods, the external wall temperature was, on average, 0.64 °C higher than the indoor temperature with horizontal shading, 0.65 °C higher with vertical shading, 0.64 °C higher with comprehensive shading, and 0.65 °C higher with louver-based shading. Meanwhile, the external wall temperature was 1.45 °C higher than the average indoor temperature in the basic building.
As Figure 8 shows, on comparing the external window temperature with the indoor temperature of the buildings incorporating the same shading design, the difference was found to be larger in the basic building than in the energy-saving buildings across all shading designs. The specific comparison results are shown in Table 12.
Table 12.
Range of differences between exterior window temperature and indoor temperature of different buildings.
As the table shows, during the transition periods, the external window temperature was, on average, 0.56 °C higher than the indoor temperature with horizontal shading, 0.91 °C higher with vertical shading, 0.56 °C higher with comprehensive shading, and 0.60 °C with louver-based shading, while it was 0.99 °C higher in the basic building.
As Figure 9 shows, on comparing the roof temperature and the indoor temperature of the buildings incorporating the same shading design, the difference was found to be larger in the basic building than in the energy-saving buildings across all types of shading design. The specific comparison results are shown in Table 13.
Table 13.
Range of differences between roof temperature and indoor temperature of different buildings.
As the table shows, during the transition periods, the roof temperature was, on average, 0.56 °C higher than the indoor temperature with horizontal shading, 0.54 °C higher with vertical shading, 0.56 °C higher with comprehensive shading, and 0.56 °C higher with louver-based shading, while it was, on average, 1.39 °C higher in the basic building.
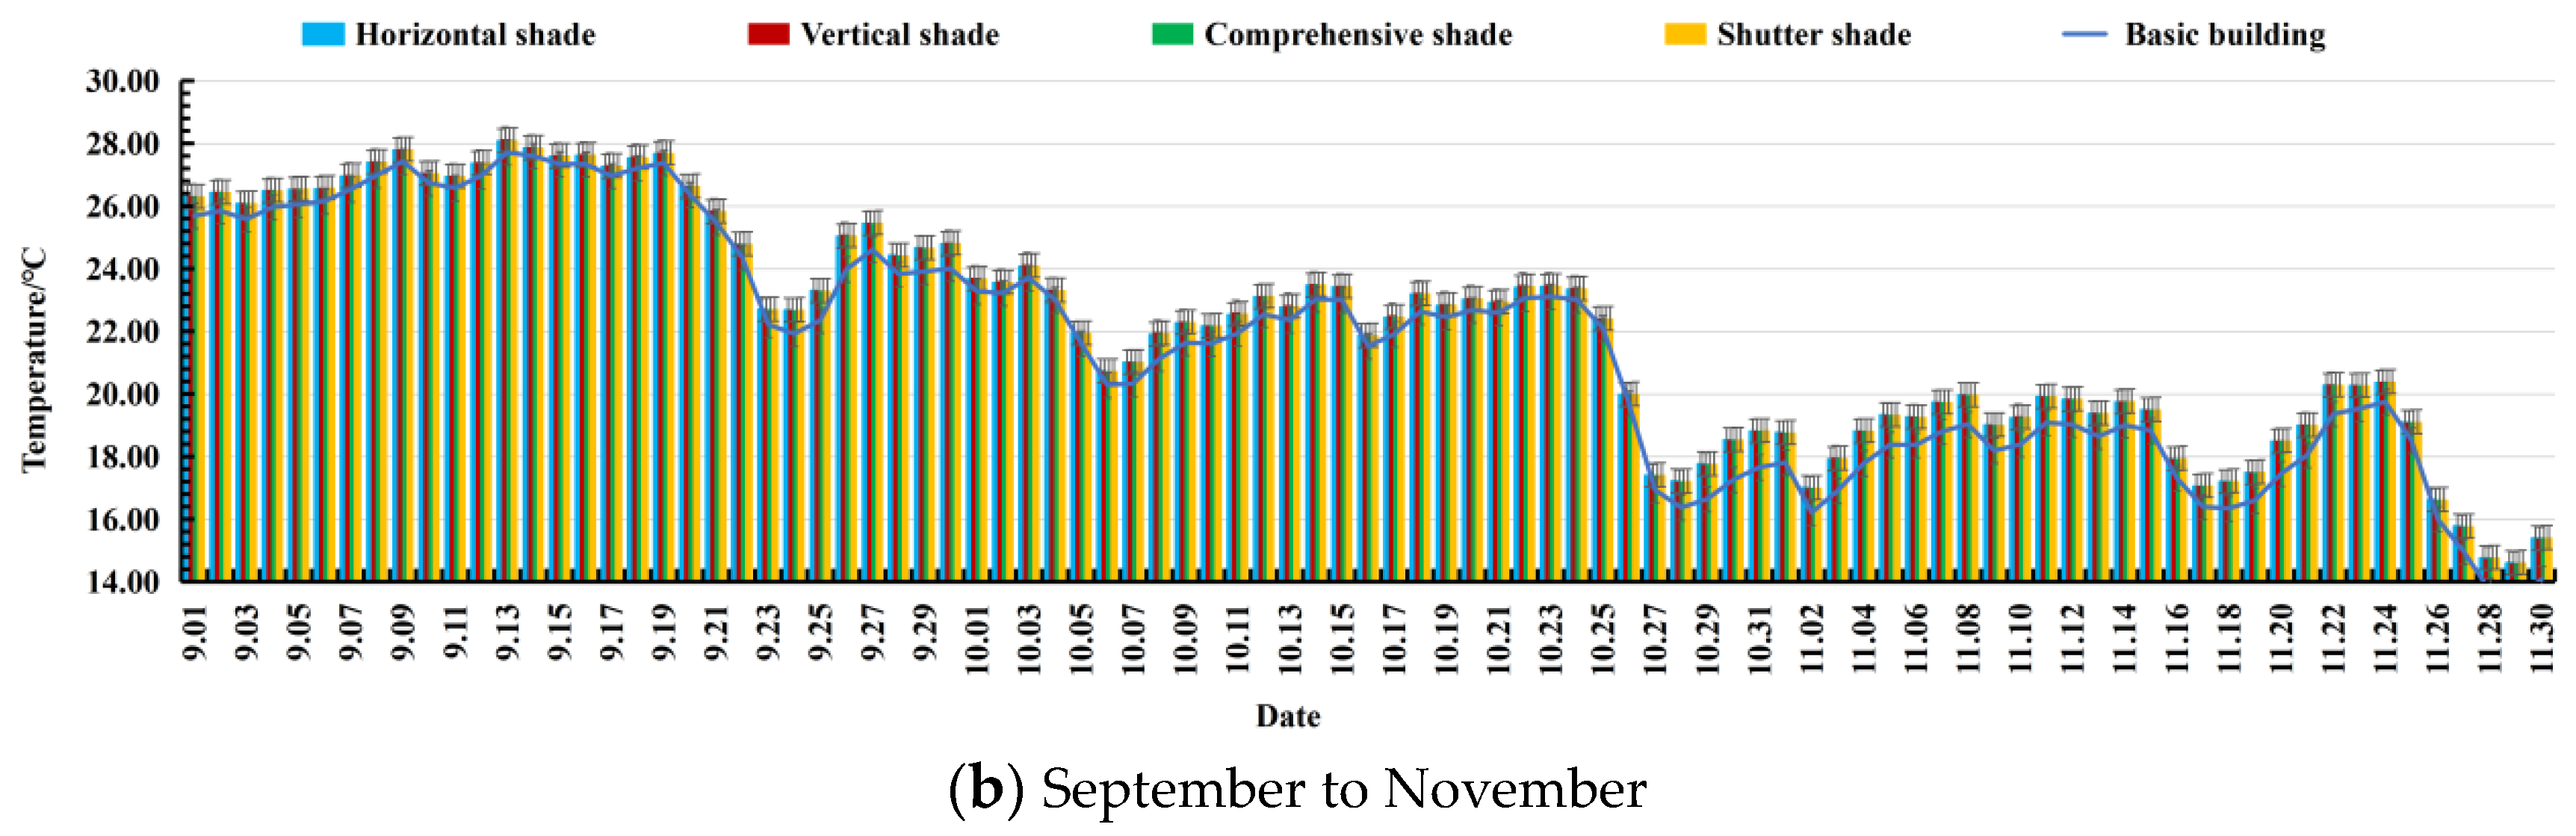
As shown in Figure 10, on comparing the indoor temperature of the four types of shaded energy-saving buildings with that of the basic building, it was found that it was higher in the former than in the latter. The specific results are shown in Table 14.
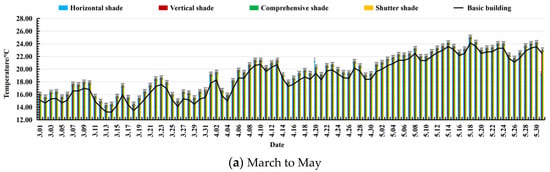
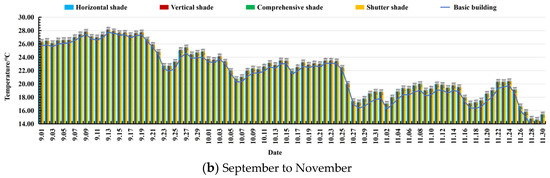
Figure 10.
Indoor temperature of different buildings.
Table 14.
Distribution range of indoor temperature in different buildings.
As the table shows, the indoor temperature in the energy-saving buildings with horizontal shading was, on average, 2.11 °C higher than in the basic building, while in the energy-saving buildings with vertical shading, comprehensive shading, and louver-based shading, it was, on average, 1.5 °C higher.
8. Conclusions
A large number of single buildings in Wenzhou area were investigated and analyzed in terms of the energy consumption habits of their residents from 2010 to 2020, the current situation and the shortcomings of the building structures, and the building envelopes and the indoor environment. Based on the findings, various energy-saving buildings with different building envelopes (external walls, roofs, external windows, and shading designs) were constructed. Here, there were 12 types of wall material and 50 types of roof-related variables, including plant height, leaf area index, leaf reflectivity, soil roughness, thickness, conductivity, and soil-specific heat. Meanwhile, the external windows were divided into 21 types with different window frames and different glass types, while the shading designs were divided into horizontal shading, vertical shading, comprehensive shading, and louver-based shading. Here, there were 79 specific variables, including transmittance, the extension length of the sun visor, and louver angle.
ENERGYPLUS 9.5 software and the TOPSIS calculation method were used to calculate the respective Ci values of the wall series 1 to series 12, the roof series 13 to series 60, the window series 61 to series 81, and the sunshade series 82 to series 160. The results indicated that the solution that is closest to the ideal could be achieved when the wall material is sintered hollow brick, when the height of the plants on the planting roof is 0.2 m, when the leaf area index is 1, the leaf reflectivity is 0.8, and when the soil has the following parameters: the soil roughness is smooth with a thickness of 0.05 m, a soil conductivity of 0.7, a soil-specific heat of 1500 J/kg·°C, and a soil density of 2000 kg/m3. Meanwhile, the ideal solution could be achieved when the window type is the u = 2.8 PVC plastic–steel type + ordinary hollow type. In terms of the horizontal shading design, the closest to the ideal solution could be achieved when the transmittance is 0.15 and the extension length of the sun visor is 100 mm, while with the vertical shading design, the transmittance should be 0.8 and the extension length of the sun visor 100 mm, and with the louver-based design, the transmittance should be 0.8 and the louver angle 160°.
A comparative analysis was conducted using the RANCOM method, wherein the four variables—façade materials, planted roofs, window materials, and shading forms—were weighted in descending order regarding their influence on building energy consumption, specifically: window materials, façade materials, planted roofs, and shading forms. These results align with those obtained through the TOPSIS method.
The indoor environmental parameters and load values of the four energy-saving buildings were compared with those of the basic building. Here, it was found that the average load of the energy-saving buildings was 79.48 to 122.00 W lower than that of the basic building, the average difference between the exterior wall temperature and the interior temperature of the energy-saving buildings was 0.64 to 1.45 °C lower than that of the basic building, the average difference between the exterior window temperature and the interior temperature of the energy-saving buildings was 0.56 to 0.98 °C lower than that of the basic building, the average difference between the roof temperature and the room temperature of the energy-saving buildings was 0.54 to 0.39 °C lower than that of the basic building, and the average indoor temperature of the energy-saving buildings was 1.50 to 2.11 °C higher than that of the basic building.
The economic efficiency of the energy-saving buildings incorporating different shading designs was also calculated with the four energy-saving buildings and the basic building compared based on the heat calculation formula [41]. During the 183 days of the transitional periods, the total heat reduction was 165.75 to 479.84 kg, 171.9 to 444.80 kg, 181.0 to 446.50 kg, and 182.00 to 447.90 kg, respectively. On comparing the above reduced heat values with those related to standard coal, given that the calorific value per kilogram of standard coal is 29.27 MJ, the four energy-saving buildings could save up to 5.66 to 16.39 kg, 5.87 to 15.20 kg, 6.18 to 15.25 kg, and 6.22 to 15.30 kg, respectively [42]. Meanwhile, based on the estimation that 3.67 kg of CO2 is emitted per kilogram of standard coal, the CO2 reduction with the four buildings was 3.16 to 4.47 kg, 1.60 to 4.14 kg, 1.69 to 4.16 kg, and 1.69 to 4.17 kg, respectively [43].
The investigation of energy-saving envelope structure combinations in the Wenzhou area offers insights into energy-saving combinations for envelope structure materials in tropical monsoon climate zones. It lays the groundwork for reducing building energy consumption. However, current discussions, both domestically and internationally, predominantly focus on the energy-saving technology of envelope structures with limited attention paid to the energy-saving impact of other equipment and measures for individual buildings. To enhance the energy-saving efficiency of single buildings in tropical monsoon climate areas, there is a need for further exploration into the energy-saving effects of additional equipment and measures.
Author Contributions
Conceptualization, R.D., F.Y. and C.X.; Methodology, R.D., C.X. and F.Y.; Investigation, R.D. and Y.C.; Validation, R.D.; Funding acquisition, R.D. and L.S.; Writing—review and editing, R.D. and L.S.; Data curation, Y.C.; Writing—Original draft preparation, Y.C.; Resources, L.S.; Supervision, L.S., F.Y. and C.X. All authors have read and agreed to the published version of the manuscript.
Funding
Financial supports from the National Natural Science Foundation of China NSFC under Grant NO. 51878511, Major Science and Technology Projects in Zhejiang Province under Grant NO. 2011C13013, Natural Science Foundation Youth Fund Project of Zhejiang under Grant No. LQ19E080019 and Project of Wenzhou Science and Technology Bureau under Grant NO. G20190025. The authors would like to thank the personnel who participated in this study.
Data Availability Statement
The data presented in this study are available in article.
Conflicts of Interest
The authors declare no conflicts of interest.
References
- Ye, M. Problems and countermeasures of rural housing industry development in China. Inf. China Constr. 2003, 3, 31–33. [Google Scholar]
- Liu, X. Discussion on Energy Conservation of Building Envelope. Available online: https://www.doc88.com/p-907857128506.html (accessed on 16 August 2023).
- Xiao, J.; Zhou, J.; Xu, F. Thermal environment evaluation index of residential buildings in hot summer and cold winter areas based on thermal environment. J. Cent. South Univ. (Sci. Technol.) 2012, 43, 36–39. [Google Scholar]
- Diao, R.; Sun, L.; Yang, F. Thermal performance of building wall materials in villages and towns in hot summer and cold winter zone in China. Appl. Therm. Eng. 2018, 128, 517–530. [Google Scholar] [CrossRef]
- Stazi, F.; Vegliò, A.; Di, P. Experimental comparison between 3 different traditional wall constructions and dynamic simulations to identify optimal thermal insulation strategies. Energy Build. 2013, 60, 429–441. [Google Scholar] [CrossRef]
- Cabeza, L.; Castell, A.; Medrano, M. Experimental study on the performance of insulation materials in Mediterranean construction. Energy Build. 2010, 42, 630–636. [Google Scholar] [CrossRef]
- Pan, D.; Chan, M.; Deng, S. The effects of external wall insulation thickness on annual cooling and heating energy uses under different climates. Appl. Energy 2012, 97, 313–318. [Google Scholar] [CrossRef]
- Fang, Z.; Li, N.; Li, B. The effect of building envelope insulation on cooling energy consumption in summer. Energy Build. 2014, 77, 197–205. [Google Scholar] [CrossRef]
- Daouas, N.; Hassen, Z.; Aissia, H. Analytical periodic solution for the study of thermal performance and optimum insulation thickness of building walls in Tunisia. Appl. Therm. Eng. 2010, 30, 319–326. [Google Scholar] [CrossRef]
- Guo, S.; Yan, D.; Cui, Y. Analysis on the influence of occupant behavior pattems to building envelope’s performance space heating in residential buildings in Shanghai. In Proceedings of the 2nd Asia Conference of International Building Performance Simulation Association, Nagoya, Japan, 28–29 November 2014; pp. 610–616. [Google Scholar]
- Jian, L.; Wen, Z.; Zhi, L. Analysis of air-conditioning cooling and heating source scheme for a commercial complex in hot summer and cold winter area. Build. Energy Effic. 2018, 46, 124–127. [Google Scholar]
- Kaynakli, O. A review of the economical and optimum thermal insulation thickness for building applications. Renew. Sustain. Energy Rev. 2012, 16, 415–426. [Google Scholar] [CrossRef]
- Tu, J.; Li, R.; Qin, F. Study on Residential Building Energy-Saving Comprehensive Evaluation System in Hot Summer and Cold Winter Zone Based on AHP. Applied Mechanics and Materials. Trans. Tech. Publ. 2012, 178, 102–108. [Google Scholar]
- Guo, W.; Qiao, X.; Huang, Y. Study on energy saving effect of heat-reflective insulation coating on envelopes in the hot summer and cold winter zone. Energy Build. 2012, 50, 196–203. [Google Scholar] [CrossRef]
- Xu, L.; Liu, J.; Pei, J. Building energy saving potential in Hot Summer and Cold Winter (HSCW) Zone, China-Influence of building energy efficiency standards and implications. Energy Policy 2013, 57, 253–262. [Google Scholar] [CrossRef]
- Yu, J.; Tian, L.; Yang, C. Sensitivity analysis of energy performance for high-rise residential envelope in hot summer and cold winter zone of China. Energy Build. 2013, 64, 264–274. [Google Scholar] [CrossRef]
- Tummu, P.; Chirarattananon, S.; Hien, V. Thermal performance of insulated walls enclosing residential spaces in Thailand. Energy Build. 2013, 61, 323–332. [Google Scholar] [CrossRef]
- Chirarattananon, S.; Hien, V.; Tummu, P. Thermal performance and cost effectiveness of wall insulation under Thai climate. Energy Build. 2012, 45, 82–90. [Google Scholar] [CrossRef]
- Udaykumar, A.; Rajasekar, E.; Venkateswaran, R. Thermal comfort characteristics in naturally ventilated, residential apartments in a hot-dry climate of India. Indoor Built Environ. 2015, 24, 101–115. [Google Scholar] [CrossRef]
- Crawley, D.B.; Lawrie, L.K.; Winkelmann, F.C.; Buhl, W.F.; Huang, Y.J.; Pedersen, C.O.; Strand, R.K.; Liesen, R.J.; Fisher, D.E.; Witte, M.J.; et al. EnergyPlus: Creating a new-generation building energy simulation program. Energy Build. 2001, 33, 319–331. [Google Scholar] [CrossRef]
- Fumo, N.; Mago, P.; Luck, R. Methodology to estimate building energy consumption using EnergyPlus Benchmark Models. Energy Build. 2010, 42, 2331–2337. [Google Scholar] [CrossRef]
- Garcia, D. SIMUS: An open-source simulator for medical ultrasound imaging. Part I: Theory & examples. Comput. Methods Programs Biomed. 2022, 218, 106726. [Google Scholar]
- Kizielewicz, B.; Więckowski, J.; Shekhovtsov, A.; Wątróbski, J.; Depczyński, R.; Sałabun, W. Study towards the time-based mcda ranking analysis—A supplier selection case study. Facta Univ. Ser. Mech. Eng. 2021, 19, 381–399. [Google Scholar] [CrossRef]
- Więckowski, J.; Kizielewicz, B.; Shekhovtsov, A.; Sałabun, W. RANCOM: A novel approach to identifying criteria relevance based on inaccuracy expert judgments. Eng. Appl. Artif. Intell. 2023, 122, 106114. [Google Scholar] [CrossRef]
- Maniya, K.; Bhatt, M. A selection of material using a novel type decision-making method: Preference selection index method. Mater. Des. 2010, 31, 1785–1789. [Google Scholar] [CrossRef]
- Rathod, M.; Kanzaria, H. A methodological concept for phase change material selection based on multiple criteria decision analysis with and without fuzzy environment. Mater. Des. 2011, 32, 3578–3585. [Google Scholar] [CrossRef]
- Kizielewicz, B.; Bączkiewicz, A. Comparison of Fuzzy TOPSIS, Fuzzy VIKOR, Fuzzy WASPAS and Fuzzy MMOORA methods in the housing selection problem. Procedia Comput. Sci. 2021, 192, 4578–4591. [Google Scholar] [CrossRef]
- Jin, L. Design Research on Improving Indoor Thermal Environment of Rural Residential Buildings in Chongqing. Master’s Thesis, Chongqing University, Chongqing, China, 2015. [Google Scholar]
- Cao, B.; Zhu, Y. Comparison of indoor thermal environment and human thermal adaptability of residential buildings in different climate zones in winter. J. Tsinghua Univ. (Sci. Technol.) 2012, 52, 499–503. [Google Scholar]
- Li, L. The energy-saving design of building is analyzed from the perspective of building. Build. Mater. Decor. 2008, 4, 274–275. [Google Scholar]
- Zhou, Y. Study on the Morphological Characteristics of Traditional Dwellings in Southeast Zhejiang; Tongji University Press: Shanghai, China, 2012; pp. 243–251. [Google Scholar]
- Zhou, Y. Existing problems and countermeasures of newly-built residential buildings in rural areas of Wenzhou. Resid. Sci. Technol. 2012, 32, 2–36. [Google Scholar]
- Ying, D. Extraction and Optimization of Energy Saving Technology for Traditional Residential Houses in Mountainous Areas of Southern Zhejiang Province. Master’s Thesis, Zhejiang University, Hangzhou, China, 2013. [Google Scholar]
- Wang, Y. Study on Energy Saving and Heat Preservation of Building Exterior Wall in Hot Summer and Cold Winter Area. Master’s Thesis, Nanchang University, Nanchang, China, 2014. [Google Scholar]
- Wnag, Q. Energy saving measures of building envelope. Energy Environ. 2014, 30, 30–31. [Google Scholar]
- Fang, R. Theoretical Study on Thermal Insulation and Energy Saving of Residential Building Envelope under the Mode of Sub-chamber Intermittent Energy Use. Ph.D. Thesis, Zhejiang University, Hangzhou, China, 2017. [Google Scholar]
- JGJ 134–2010; Design Standard for Energy Efficiency of Residential Buildings in Hot Summer and Cold Winter Zone. Ministry of Housing and Urban-Rural Development: Beijing, China, 2010.
- Xiufang, J.; Rongdan, D.; Li, Z.; Ying, Z.; Xinrong, L. Comparative Study on Performance of Renewable Energy Building Energy Supply System. E3S Web Conf. EDP Sci. 2021, 233, 01077. [Google Scholar] [CrossRef]
- Belenson, S.; Kapur, K. An algorithm for solving multicriterion linear programming problems with examples. J. Oper. Res. Soc. 1973, 24, 65–77. [Google Scholar] [CrossRef]
- Hwang, C.; Yoon, K. Multiple Attribute Decision Making: A State of the Art Survey. Lecture Notes in Economics and Mathematical Systems; Springer: Berlin, Germany, 1981; Volume 186. [Google Scholar]
- Liu, Y. Heat Transfer Theory; China Electric Power Press: Beijing, China, 2020. [Google Scholar]
- Zhang, J. Manual of Thermophysical Properties of Common Engineering Materials; New Times Press: Beijing, China, 1987. [Google Scholar]
- Jianhua, B. Experimental Study on Gas Production Performance of Constant Temperature Biogas Digester Heated by Solar Energy. Master’s Thesis, Lanzhou University of Technology, Lanzhou, China, 2011. [Google Scholar]


Disclaimer/Publisher’s Note: The statements, opinions and data contained in all publications are solely those of the individual author(s) and contributor(s) and not of MDPI and/or the editor(s). MDPI and/or the editor(s) disclaim responsibility for any injury to people or property resulting from any ideas, methods, instructions or products referred to in the content. |
© 2024 by the authors. Licensee MDPI, Basel, Switzerland. This article is an open access article distributed under the terms and conditions of the Creative Commons Attribution (CC BY) license (https://creativecommons.org/licenses/by/4.0/).