Review

Acoustics Perception in Special-Shaped Spaces: A Systematic Review

by
Xuejiao Kong
1,2,
Hui Ma
1,
Jian Kang
1,3 and
Chao Wang
1,*
1
School of Architecture, Tianjin University, Tianjin 300072, China
2
Tianjin Electronic Information College, Tianjin University, Tianjin 300350, China
3
The Bartlett, University College London (UCL), London WC1E 6BT, UK
*
Author to whom correspondence should be addressed.
Buildings 2024, 14(2), 337; https://doi.org/10.3390/buildings14020337
Submission received: 17 December 2023 / Revised: 21 January 2024 / Accepted: 23 January 2024 / Published: 25 January 2024
(This article belongs to the Section Building Energy, Physics, Environment, and Systems)

Abstract

:
The purpose of this paper is to review the acoustic perception of special-shaped spaces. Peer-reviewed English-language journal articles published between 2003 and 2023 were searched in the Web of Science and Scopus databases by using the keywords “perception”, “acoustics”, “flat space”, “extra-large space”, “coupled space”, “long space”, and spatial function and their synonyms. The inclusion criteria were as follows: (1) Included articles should focus on the field of psychoacoustics. (2) Spaces should be clearly identified as one or more of the four special spaces described above. (3) Subjective evaluation methods for spatial acoustic perception should be used. Finally, a total of 31 studies were included. A standardised data extraction form was used to collect spatial information, subject information, sound environment information, and other information. The results show that comfort expresses positive perception results in all four different spaces, whereas annoyance is negative in both flat and extra-large spaces, and satisfaction shows the opposite results in flat and coupled spaces, whereas perceived reverberation is the specific dimension for coupled space. In addition, unique conclusions were obtained for each type of space and special cases in the spaces were individually characterised.

1. Introduction

Individuals are perpetually immersed in sound within a space. Sound perception is one of the most vital dimensions of our diverse sensory experiences. When the shape of a space is particularly distinctive, the propagation of sound within it differs markedly from that in ordinary spaces, thereby influencing human perceptual experiences. Therefore, the purpose of this paper is to conduct a review of “Acoustics Perception in Special Shape Spaces”, aiming to enhance the understanding of the relationship between the environment and sound perception.

1.1. Special-Shaped Spaces

The special spaces described in this paper include flat spaces, extra-large spaces, coupled spaces, and long spaces. A flat space is characterised by its length and width being much greater than its height [1], which influences the spatial characteristics of the sound field defects due to the lack of the lateral reflection of sound. Sound field characteristics show that the flatter the space, the greater the divergence of its reverberation time from classical diffuse sound field theory [2,3] and that the sound energy attenuation law changes when adding sound absorption to the top and bottom surfaces [4]. A space with a very large volume is called an extra-large space to differentiate it from the acoustically large space, which is regarded as a diffuse sound field. Inhomogeneity of the sound field leads to high reverberation, high noise levels, susceptibility to echoes and acoustic focusing, and other acoustic problems in extra-large spaces [5,6,7]. A coupled space features two spaces connected through smaller coupling holes to form a whole space [8,9]. The sound energies in the two coupled spaces interact with each other to form a more complex sound field with hyperbolic attenuation, which has an important effect on acoustic perception [10,11]. Long spaces are defined by having lengths six times greater than their widths and heights, resulting in a unique acoustic theory in long spaces [12,13].

1.2. The Perception of Spatial Acoustic Environment

The perception of the spatial acoustic environment is the perceptual feedback produced by individuals to a series of sound sources in different functional spaces [14]. Sound sources can be divided into informative sound sources and uninformative noise according to whether they contain information that affects behaviour [15,16]. Sound perception is the process by which people give psychological feedback to sounds in the environment, characterising the results of perception through dimensions such as preference, comfort, satisfaction, annoyance, and loudness [17]. Studies show that the choice of dimensions has little correlation with spatial function [18]. Perceptions are categorised into positive, negative, and neutral perceptions based on their capacity to facilitate human activities in space. One of the significant reasons for studying the acoustic perception of special-shaped spaces, from which positive perception is retained, is so that the beneficial part of the neutral perception is amplified and negative perception is weakened to form a healthy acoustic environment [19].
Sound perception in space is the result of a series of processes. The ear first receives the sound, then the brain makes the initial cognition, defines the sound source and space, and makes spontaneous psychological responses, such as preference, worry, satisfaction, comfort, fatigue, etc., and the body makes adaptive or changeable behaviours that are the result of the perception [20,21]. It is necessary to conduct a systematic review to summarise the latest research results of acoustic environment perception in special-shaped spaces. After the systematic review, this paper will analyse the acoustic perception in special-shaped spaces from the following three aspects: (1) the perception results in several special-shaped spaces, (2) which acoustic factors are related to subjective dimensions, and (3)which non-acoustic factors are related to subjective dimensions?

2. Method

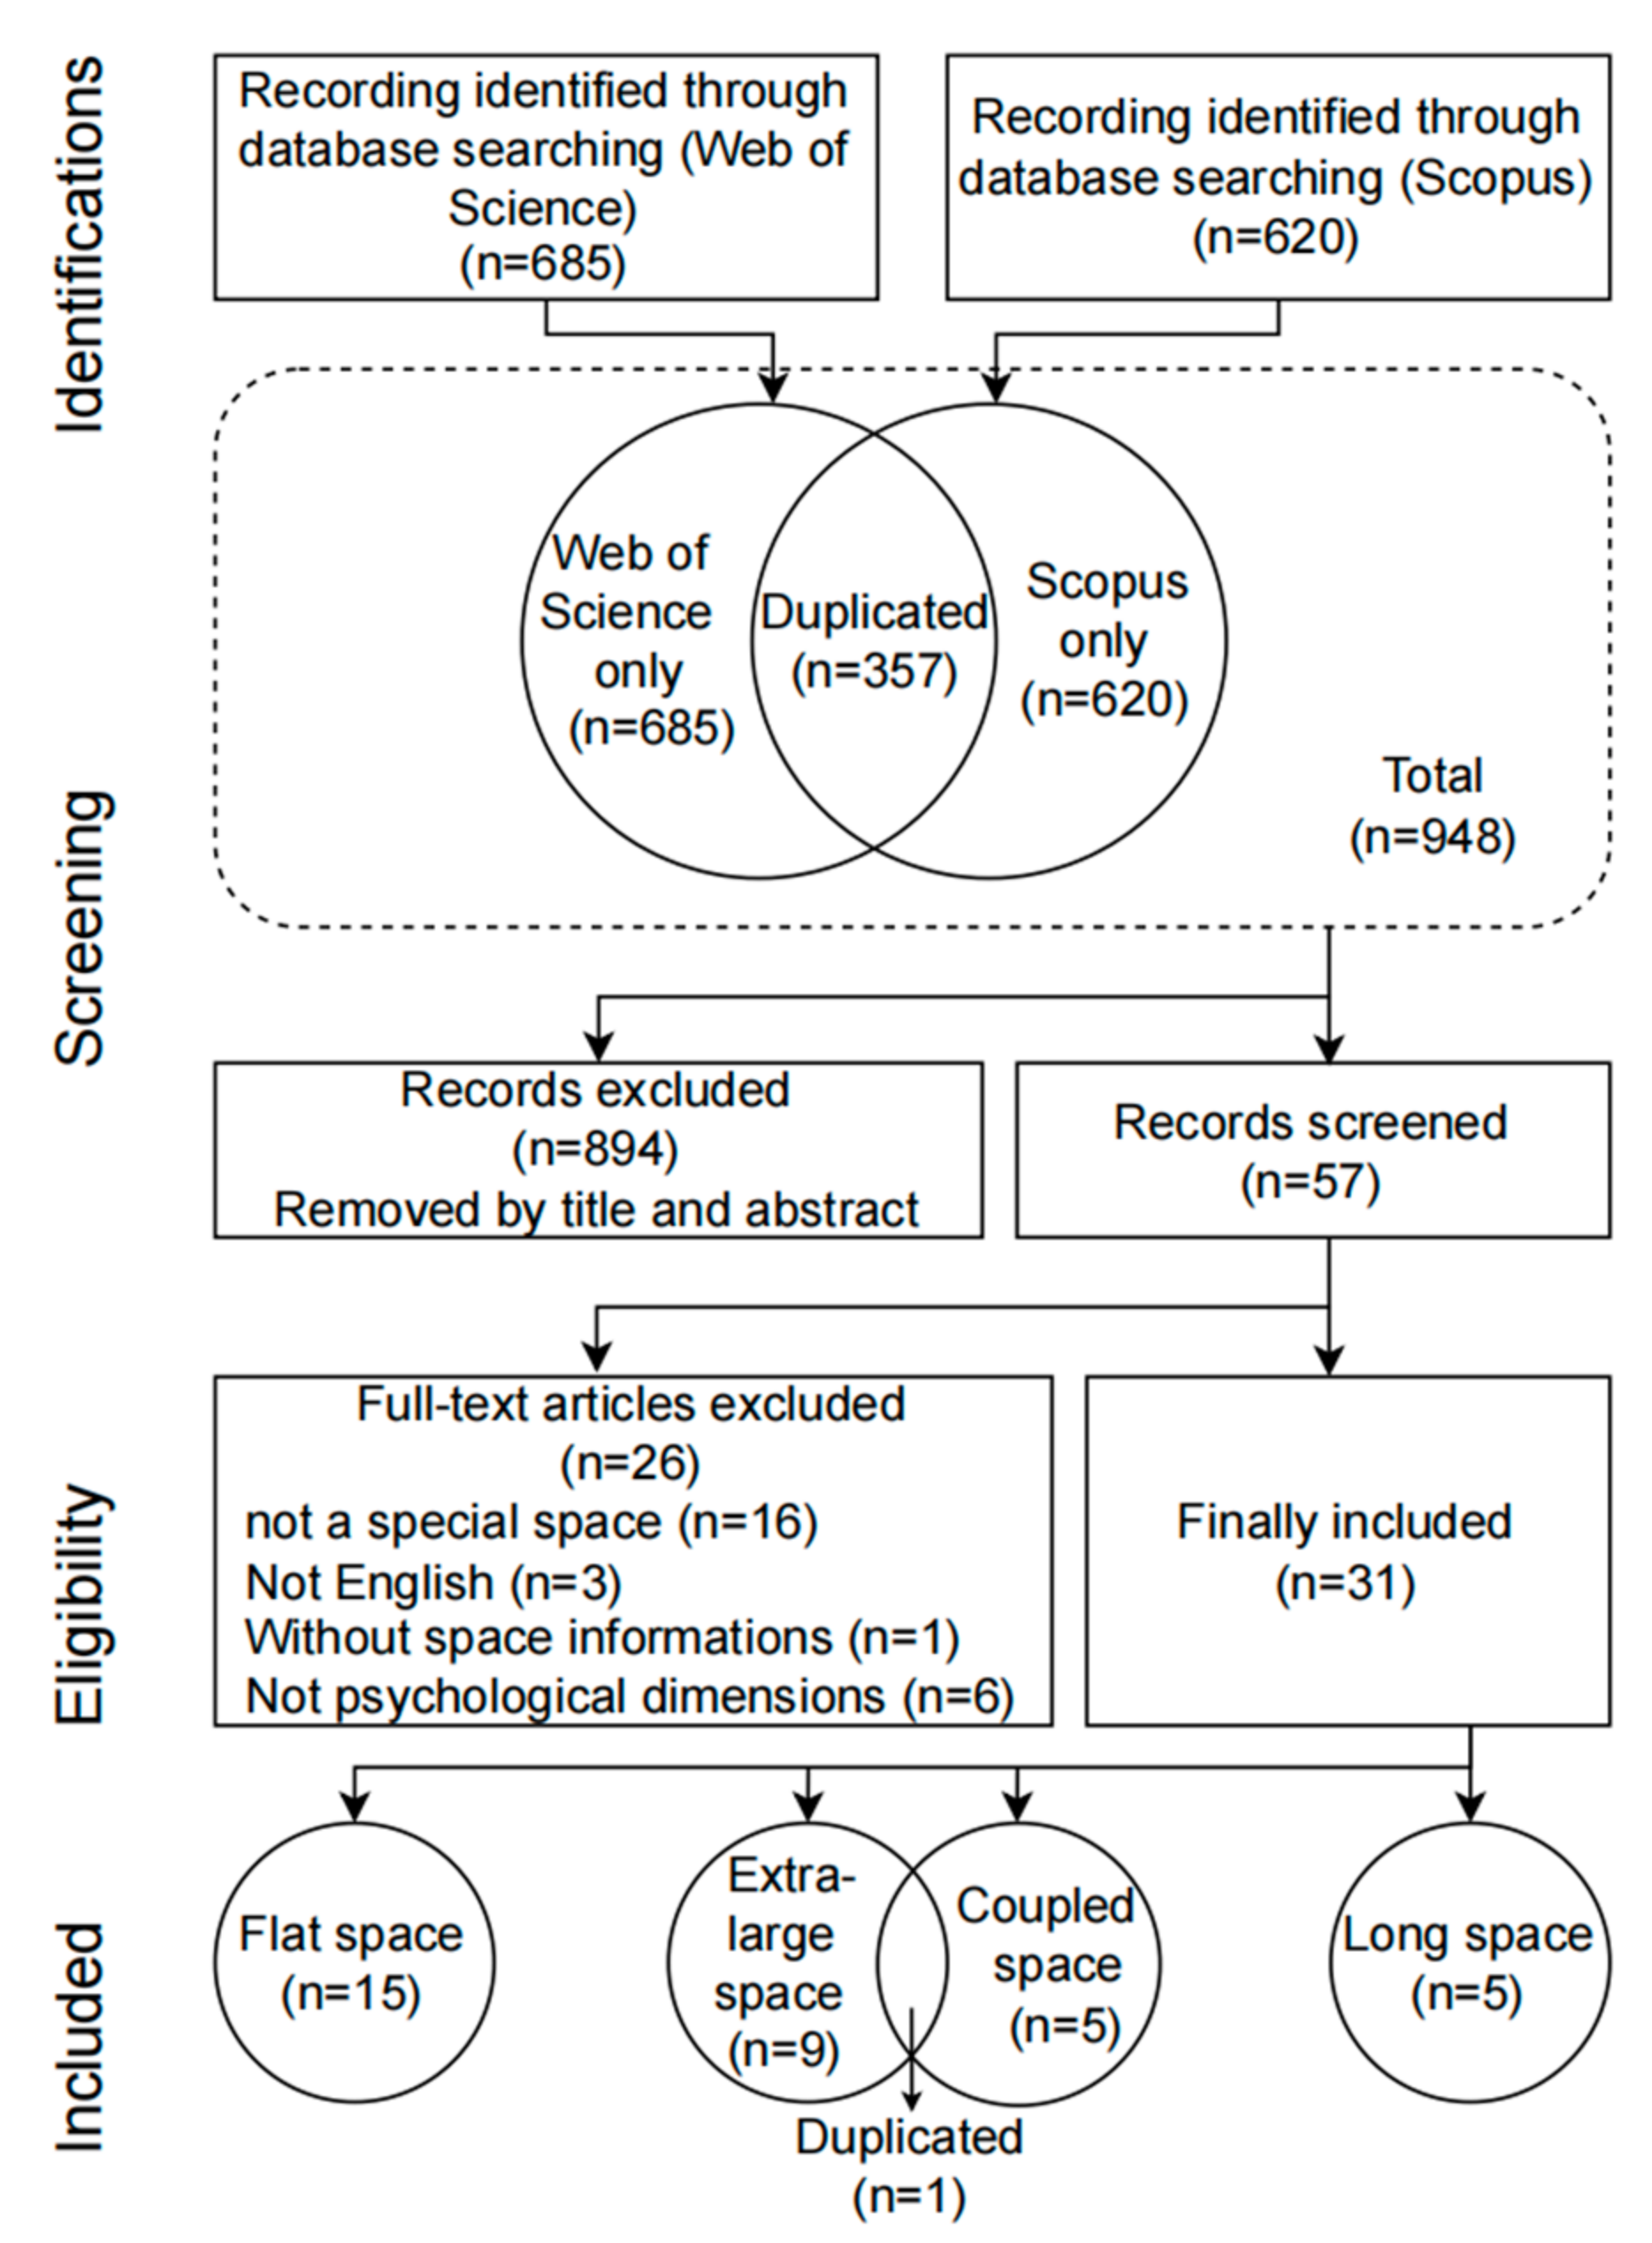
2.1. Search Strategy and Eligibility Criteria

The review methodology used in this paper is based on the PRISMA statement for systematic reviews published by the PRISMA Priority Reporting Entries Group in 2009 in several medical journals, which specifies 27 entries and processes for systematic reviews [22].
The field of research in this paper is the acoustic perception in special-shaped spaces; unlike research in the medical field, there are currently no registration standards in this area. The research object is the subjective perception of an individual in special-shape space [17]. The types of space include flat spaces, extra-large spaces, long spaces, and coupled spaces. Subjective perception is only concerned with psychoacoustics research, not with physical traits such as hearing impairment or memory effects.
The screening process based on PRISMA is shown in Figure 1. The two databases of WOS and Scopus were selected for the search database, and after the screening of identification, screening, eligibility, and included, a total of 31 articles were obtained in this paper. The search criteria were: (1) Special-shaped spaces include the following four types: spaces whose lengths and widths are much greater than their heights but the variability between the length and width is small are known as flat spaces; spaces where the spatial acoustic field is a non-scattered acoustic field and the type of spaces with inhomogeneity of the acoustic field due to nonlinear energy attenuation are called extra-large spaces; spaces whose lengths are greater than six times their widths and heights are referred to as long spaces; and combinations of two or more spaces that are connected by coupling apertures are known as coupled spaces. (2) Functions were determined by spatial definitions such as office, transport, commercial, sports, exhibition, religion, etc., as shown in Table 1. (3) Subjective experiments were performed on the acoustic perception of the indoor spaces. (4) The evaluation dimensions, evaluation process, and evaluation results are included in the study. (5) Acoustic perception of performing arts functions was not considered. The eligibility for this study was reviewed by two reviewers in a non-blind review.

2.2. Data Extraction

In this paper, a standardised data extraction approach was adopted for categorical extraction, and the main categories included spatial information (type, function, volume/area, quantity, subjects’ familiarity with the space, etc.), hearing assessment, noise sensitivity, masking effects, and interactivity. The details are shown in Table 2.

2.3. Quality Assessment

Research on spatial acoustic perception is different from meta-analyses in the medical field, where differences in the type of space have a greater impact on the results and the same type of space is evaluated through different dimensions to obtain different results. The extraction process of perceptual data is a summary of the results of spatial acoustic perception, from which patterns are obtained.

3. Results

3.1. Research Design of the Articles

Perception is the individual psychological feeling in a space that is caused by the sound field, and different shapes of space form different physical sound fields that affect subjective perception [1]. Therefore, we categorise special spaces according to their shape into flat, extra-large, coupled, and long spaces, as shown in Table 1.

3.1.1. Research Types

This study ultimately obtained 31 articles after performing the screening shown in Figure 1. These articles included 15 flat spaces, 9 extra-large spaces, 5 coupled spaces, and 5 long spaces, as shown in Table 1. Different types of space may appear in the same article, for example, studies on transportation spaces include extra-large spaces (waiting hall in large railway stations) and coupled spaces (ticket lobbies and connecting corridors) [26]. Some of the studies are based on space types, so spaces with different functions may appear in the same article, e.g., studies on extra-large spaces include railway stations, conventions, and stadiums [28]. The primary functions of flat-spaces include open-plan offices, as well as large supermarkets, sports halls, and library reading areas. The functionalities of extra-large spaces encompass high-speed train stations, exhibition centres, sports stadiums, canteens, shopping malls, auditoriums, and religious buildings, including cathedrals, temples, and mosques. The functions of coupled spaces include shopping malls, hospital waiting areas, and concert halls. Long spaces have fewer functions and are mainly used for corridors and underground shopping streets.
The results of participants’ sound perception in a space can be influenced by their identity or occupation. Therefore, this article has compiled statistics on participants’ familiarity with the space. The relationship between participants and space includes the following categories: participants who are long-term users of the space, such as shopping mall employees and office workers; another category is temporary users with low familiarity with the space, such as shoppers in malls, travellers in transport spaces, etc.; the third category comprises temporary users who are completely unfamiliar with the space, such as university students temporarily participating in experiments in an office. Based on these classifications, the three types of relationships are respectively marked as + +, +, and 0, as detailed in Table 2.

3.1.2. Research Process

This article compiles the objective indicators associated with subjective perception. As demonstrated in Table 3, only indicators that have a strong correlation with subjective perception are included. These indicators are categorised into sound pressure levels, reverberation time, loudness, unique indicators for coupled spaces, parameters related to the spectrum, and other categories. Under each category, there are various objective indicators. For instance, those related to sound pressure levels can be subdivided into background noise level, LA5 equivalent sound pressure level peak, masking sound pressure level, sound pressure level at 4 m from the sound source, and 8 h noise sound pressure level. The corresponding subjective indicators include annoyance, subjective loudness, satisfaction, perceived sound intensity, comfort, a sense of tranquillity (in religious places), preference, etc., with the frequency of each correlation being recorded.
The sound sources in this study are divided into four major categories: human voices, musical instruments, technical noise sources, and outdoor sources [1]. However, since the studies also mention various outdoor sources, such as animals, wind, and water, the category of outdoor sources has been additionally included [23]. Table 4 lists the sound sources in each category, the subjective attitudes of people towards these sources, and the frequency of occurrence of these sources. The subjective attitudes include positive, negative, both, and unclear.
From Table 4, it is evident that musical instruments, including background music, musical passages, and live performances, are types of sound sources that receive positive evaluations in various environments. In contrast, human voices, including phone conversations, rattling noise, children crying, loud shouting, and footsteps, as well as technical noise sources like luggage noise, elevator noise, and gurgling sounds in public toilets and outdoor sources such as traffic, are consistently evaluated negatively in different spaces. Additionally, some sound sources exhibit varied evaluations depending on the space or context. These include speech, group conversation, and broadcast from human voices; keyboard and mouse, printer/plotter, computer fan, telephone ring, and ventilation/air conditioning noise from technical noise sources; and water from outdoor sources. There are also sound sources whose evaluations are unclear, which could be the subject of further research.
The method of characterising the subjects’ perception results is the perceptual dimensions. Figure 2 counts the frequencies of the 16 perceptual dimensions that appeared in the studies. The three dimensions with the highest frequency of occurrence were annoyance, satisfaction, and comfort, with frequencies of 9, 7, and 8 occurrences, respectively.

3.2. Results of Studies on the Various Types of Space

Through review, it was found that people’s perceptual attitudes towards space manifest in three aspects: positive, negative, and neutral. A positive perceptual attitude refers to subjects showing a tendency towards favourable perception results in some evaluative dimensions, such as comfort and preference. In contrast, negative perceptions, such as annoyance, indicate perception results that are the opposite in these evaluative dimensions.

3.2.1. Flat Spaces

Flat spaces are covered in 15 articles in this paper. The main functions of flat spaces are as open-plan offices, but they also include library reading areas, hypermarkets, and gymnasiums. The statistics on the number and area of all flat spaces revealed that there were a total of 58 spaces, which had areas of between 54 and 2500 m2, of which nearly 90% of the spaces had areas of more than 100 m2.
Satisfaction, the most commonly evaluated dimension in flat spaces, was strongly influenced by the type of sound source and audio–visual interaction [30] and correlated strongly with the background noise and noise spectral balance [24], perceived sound intensity [25], speech sound privacy, and perceived distance [29]. In large flat spaces, quieter areas usually had higher satisfaction, but in noisy areas the correlation between satisfaction and noise was not significant, possibly because subjects in such spaces were themselves part of the noise source, thus attenuating their sensitivity to noise. Water sounds can positively affect spatial sound perception; however, it has also been shown that water-masked sound is less satisfying than artificially masked sound due to its greater intrusiveness [41]. Based on these studies, improving the quality of the visual environment [52] and providing both hydroacoustic and visual stimuli can improve satisfaction. A greater distance from the talker helped to improve satisfaction in offices with poor acoustic quality, but the improvement was not significant in offices with good acoustic quality [42].
Comfort was strongly influenced by the reverberation time of the flat space and the activity noise level in the space [27] and was negatively correlated with work efficiency in open office spaces [36], which was weighted higher than the sense of environmental control and privacy satisfaction. Comfort was also related to the subjects’ occupation or status. For example, in the same noise environment, teachers’ comfort scores were significantly lower than those of students, which was mainly due to the fact that teachers were exposed to noise for a long period of time and had a higher level of adaptability to the environment. According to the above study, comfort can be significantly improved when the reverberation time is reduced by increasing the use of acoustic materials.
In studies of flat spaces, the factors influencing liking are emotion, task, and personal preference [23]. In experiments in open-plan offices, acoustic preferences were commonly evaluated together with visual preferences [30], giving results for audio–visual preferences that showed that acoustic factors did not have a significant effect on overall preferences but had a very significant effect on visual [52].
Annoyance is the most common dimension used for evaluating negative attitudes in flat spaces. There is a strong correlation between the background noise level and annoyance, as well as the perceived loudness [24,39], with perceived loudness also being a significant indicator of annoyance. There is a significant positive correlation between annoyance and noise sensitivity. Studies show that with every 4 dB increase in noise level, the proportion of the population experiencing high annoyance levels increases by 10% [40]. However, other studies indicate that the impact of background noise levels only accounts for 25% of the variance in the annoyance level [18], possibly due to the subjects’ adaptation to such working environments over time. In such cases, newly introduced sound sources typically cause greater annoyance [27]. In open-plan offices, the most annoying noise source is intelligible speech, which is the most common noise source in these spaces (107, 109). Introducing masking sounds can effectively reduce speech intelligibility but has a lower impact on reducing annoyance levels [38].
Neutral perceptual results indicate that sound sources, background noise, behavioural tendencies, and work tasks are the main factors influencing spatial sound perception [23]. The main sound sources in space are speech, music, technical noise sources, and natural sounds. Background noise was significantly and positively correlated with the privacy of conversation and perceivable distance [32].
Since open-plan offices accounted for 80% of the flat spaces studied in this paper, it is necessary to discuss the perceived results of the job attribute dimensions, mainly job satisfaction, attention, and privacy, all three of which were negatively correlated with background noise levels [29]. Reducing the acoustic reverberation of the space or lowering the background noise increased job satisfaction [52], and increasing the diversity of the acoustic environment decreased job satisfaction [36].
In comparison with spaces with similar functionality, flat spaces do not show significant differences in evaluation dimensions or outcomes. In studies comparing living spaces with office functions with standard office spaces, more than half of the participants reported that the environment altered their noise sensitivity [53]. In commercial spaces located in the basements of high-rise office buildings, the noise sensitivity and annoyance levels of the office workers were higher than those of the non-office workers [54]. Studies on the masking effect have shown that introducing masking sounds in standard office spaces can reduce speech intelligibility, thereby increasing satisfaction. Among them, spring water and pink noise were more satisfying than singing [55]. However, all masked sounds were less satisfying than unmasked sounds [56] and indoor water sounds were also able to significantly improve perceptions of intrusive noise [57], both of which are consistent with the findings of the flat space study [41].

3.2.2. Extra-Large Spaces

The extra-large spaces in this paper were defined according to the degree of non-diffusion of acoustic energy attenuation. But some studies did not specify the sound field conditions or physical indicators such as space volume. After consultation between the authors of this paper, it was decided to classify such spaces as extra-large or not based on their function and capacity [35]. This paper includes nine articles on sound perception in extra-large spaces that encompassed functions such as railway stations, sports stadiums, exhibition centres, shopping malls, canteens, auditoriums, cathedrals, temples, and mosques. Among these, three articles related to religious buildings are discussed separately due to the significant differences in the research methods and results from the other spaces.
In the positive outcomes of sound perception in extra-large spaces, comfort is significantly correlated with both the reverberation time and the sound pressure level, and it also has a strong correlation with the type of sound source, as well as the social characteristics and behaviours of the subjects. Social characteristics include the levels of education and income, whereas behaviours cover the frequency of visits and the durations of stay [28]. In railway stations, where there is a high background noise level, the duration of stay is significantly negatively correlated with comfort [26]. However, in large shopping malls, there is a positive correlation between the duration of stay and comfort [49]. Sound source correlations were prominent in the traffic space, with the highest comfort levels for broadcast sound [43] and the lowest for technical noise sources, whereas speech was more comfortable than broadcast sound in small spaces within the traffic space, such as shops or restaurants [26].
The negative results of sound perception in extra-large spaces showed a strong correlation between annoyance and background noise level and sound source, as well as the subjects’ occupation, gender, and behaviour. In the study of campus buildings, the canteen was the area with higher annoyance levels due to the gathering of crowds. In gymnasiums, teachers experienced greater annoyance levels than students [35]. Within the same space, the reports of annoyance are higher among female students compared with male students [47]. When students are engaged in activities such as reading or taking exams, the annoyance level is higher than during other activities. This indicates that the assessment of annoyance level is highly correlated with both objective parameters and social characteristics.
The dimensions of the acoustic perception of religious buildings in extra-large spaces are significantly different from other spaces, emphasising sensory experiences [34], tranquillity, pleasantness, and closure [33]; the research methodologies used were mostly soundwalks and interviews. Echoes in cathedrals can give positive restorative perceptions and enhance the sense of mystery and tranquillity of the environment. The sense of enclosure contributes to tranquillity in religious buildings located in urban areas [33]. The objective parameters of the space show a longer reverberation time and an inverse linear relationship with frequency. In non-religious extra-large spaces, the subjective perception of the acoustic environment is poorer due to the uneven spatial sound field and lower speech intelligibility [45].

3.2.3. Coupled Spaces

There were five articles on coupled spaces selected for this study. A coupled space is a combination of two or more spaces that are connected through coupling holes. The most common coupled spaces are the combination of a concert hall and the surrounding spaces [44,48], the combination of ticket halls and corridors in large railway stations [26], large shopping malls where multiple spaces are connected [49], and the combination of hospital waiting areas and corridors [45]. It should be noted that the research on sound perception in this paper does not include music perception; however, two of the articles in this study represent research on sound perception in concert halls, which requires subjective evaluation with music as the experimental material. The authors have excluded the dimension of music perception in the analysis and only addressed the dimension of spatial perception.
Most of the positive perception results appear in the evaluation of comfort. In coupled spaces, comfort levels show a significant positive correlation with the sound pressure level and reverberation time [26]. These factors are also strongly associated with the social characteristics and behaviour of the subjects [49]. In large railway stations, where the range of sound pressure levels is large, the results indicate that comfort levels increase with higher education and income when the sound pressure level is below 70 dB but that the correlation reverses above 70 dB. In studies conducted in large shopping malls, there is a significant difference in comfort scores between subjects with “below average” and “above average” income. The level of education of the subjects also correlates significantly with comfort, but this correlation is lower than that with income. Comfort increases with the frequency of visits or the duration of stay, suggesting that familiarity with the space can enhance comfort.
However, in another category of extra-large space, a clear negative evaluation appears and the evaluation dimension used is satisfaction. In the study of hospital waiting areas, satisfaction was correlated with background noise levels and patient satisfaction was significantly correlated with length of stay; however, for staff, the perceived echo was a stronger determination [45]. The background noise levels throughout the day ranged between 64 and 73 dBA and the main source was speech; spectral analysis found that speech had more high frequencies than normal speech, with the likely cause being the effect of electronic number calling system sounds and mobile phone ringing. The most acceptable source for both patients and staff was the electronic number calling system sound, which was the only one that patients showed a slight preference for, whereas mobile phone ringing and noise were the least preferred. By analysing the relationship between environment and satisfaction, there was a significant correlation between sound, light, temperature, humidity, scent, and the overall environment, with sound correlating most closely with light.
Perceived reverberation [44] is mainly used in concert with the evaluation of sound perception and has a strong correlation with the sound pressure level. Increases in the sound pressure level and coupled aperture enhance the perceived reverberation, with steeper early-decay slopes yielding higher perceived clarity and slower late-decay slopes yielding longer-lasting perceived reverberation [44] and different positions in the space leading to different preferences, with higher preferences tending to be found near the centre and with position having a greater effect than the aperture in the same space [48].

3.2.4. Long Spaces

This article contains five articles about long spaces that function mainly as underground shopping streets [37,50,51] and school corridors [31,35].
The positive perception results in long spaces were also focused on comfort. Comfort was strongly correlated with the sound pressure level, sound source, and subjective loudness. In general agreement with the results for the other spaces, high sound pressure levels in campus corridors resulted in lower comfort levels. However, in the underground shopping streets, there was an inverted U-shaped trend for comfort level with increasing sound pressure levels, with a peak point of 65 dB [50]. Sound sources in commercial spaces include background music, broadcasting systems, mechanical equipment sounds, and crowd noise, of which, background noise and broadcasting systems can increase comfort, whereas mechanical sound and crowd noise, especially vendors’ shouts, can significantly reduce comfort [51]. The variability in comfort levels caused by the function of the space is more prominent when subjective loudness is constant, with higher comfort levels in restaurants than in the shopping spaces in underground shopping streets. Street-type underground shopping streets showed higher subjective loudness and poorer comfort levels compared with square-type underground shopping streets [37]. From the behaviour analysis of the subjects, those who were taking a break had higher subjective acoustic comfort scores than those who were not [50].
In long spaces, neutral evaluation results appear in the perception results of subjective loudness. Subjective loudness has a strong correlation with the sound pressure level and with environmental factors such as the perceived humidity, the interaction of temperature and relative humidity, luminance, and visual appraisal [37], as well as with sound sources. The correlation between subjective loudness and the sound pressure level was found to be non-linear in the study of commercial spaces, where the change in subjective loudness was not significant when the sound pressure level increased from 55 dBA to 65 dBA but increased significantly when the sound pressure level increased from 65 dBA to 75 dBA. A comparative study of square-type commercial streets and street-type commercial streets revealed that subjective loudness was higher in square-type commercial streets than in street-type commercial streets when the sound pressure level was lower, whereas the results were reversed when the sound pressure level was higher. The subjective loudness decreases with the increase in perceived humidity, brightness, and visual evaluation. The main sound sources in commercial spaces are background music, shop music, broadcasting systems, and vendors’ shouts, and the subjective loudness was rated higher for all of the above sources than for no sources, with the same results as for the comfort level [51].
Most of the negative perception results in long spaces were associated with noise, especially in campus corridors. Comparing the environments of university campuses and primary school campuses, the results showed that on university campuses the sound of music caused a significant enhancement of pleasure and arousal in student communication, and this effect had little relation with spatial variability [31]. In contrast, on primary school campuses, the study of noise interference in the space showed that corridors were one of the worst spaces on campus for listening conditions due to more outdoor noise [35].

4. Discussion

4.1. Results of the Same Dimension in Different Spaces

Positive results in sound perception for comfort appeared in all four types of spaces, and comfort was strongly correlated with the sound pressure level in all spaces. In three of the space types (except long spaces), there was a strong correlation between the reverberation time and the subject’s familiarity with the space. Comfort was also related to the sound source in both the extra-large spaces and the long spaces; the broadcasting system was able to enhance the comfort level in all of them [43], whereas speech reduced it [51]. A different result was that in flat spaces, teachers who were more familiar with the space showed lower comfort levels than their students due to long-term exposure to high-noise environments [27], whereas in the extra-large and coupled spaces, subjects showed higher comfort levels due to their familiarity with the mall space. The study of both extra-large and long spaces showed higher comfort levels in restaurants [49].
Satisfaction was mainly used for sound perception evaluation in flat and coupled spaces, and the results showed that satisfaction was mainly correlated with the sound pressure level. The noise spectrum, sound source, and audio–visual interactions showed positive perception results in flat spaces and the opposite results in coupled spaces. Satisfaction was higher in areas with low sound pressure levels; however, the results were reversed for noise spectral imbalance [24,45]. Satisfaction was also related to the sound source. Water-related sources can enhance satisfaction in flat spaces, whereas noisy speech reduces it in coupled spaces. The audio–visual interaction was significant, improving the visual quality in flat spaces.
Annoyance was the most commonly evaluated dimension for expressing negative perceptions in both flat and extra-large spaces. It was significantly correlated with the sound pressure level and a subject’s familiarity with the space. The results for flat spaces showed that subjects who had been in an open office for a long duration showed lower annoyance levels due to adaptation to the environment [18]; however, in extra-large spaces, teachers who had been in a gymnasium for a long duration showed higher annoyance levels than students [35].

4.2. Masking Effect

The masked sound sources in the included papers are natural sound and pseudo-random noise (PRMS), with the natural sounds mainly being water-related sounds (e.g., fountains, waterfalls, rivers, and gurgling water), birdsong, and so on [30,41]. The studies show that both pseudo-random noise and natural sound have a masking effect. Masking sound sources are effective in reducing the distraction distance and privacy distance in open-plan offices. However, pseudo-random noise has a more pronounced effect, possibly due to the fact that natural sound has a greater distracting effect on speech and is therefore less satisfying. The optimal sound pressure level for masking noise is 45 dBA, and a range of 42–48 dBA (also 43–45 dBA in some studies) can be used, depending on the space and the distance from the source. Most of the studies on masking effects are based on open-plan offices, probably because of the high demands on the acoustic environment in terms of comfort and work efficiency.
The inclusion of a masking system results in some loss of speech intelligibility but usually does not result in an increase in annoyance. However, in the experiments using pseudo-random noise as a masking sound, the annoyance levels related to equipment noise affecting speech was increased by a masking system using a source similar to ventilation noise [38].

4.3. Interaction

The perceptual interaction in this paper focuses on adding visual perception elements to spatial acoustic conditions, as judged by the dimensions of audio–visual preference, satisfaction, pleasure, and annoyance. The results show that there are relatively consistent findings across different types and functions for the space and that the addition of visual elements significantly enhances acoustic satisfaction and pleasantness [33,52]. Studies that superimposed audio–visual interactions on the masking effect showed that the addition of visual stimuli to water sound was able to significantly enhance the masking effect by a multiple of 1.1–2.5 [30]. Audio–visual preferences did not correlate well with the background noise and scene, so audio–visual interactions can also be applied to road traffic noise [30].
The complexity of the visual environment may lead to a downward trend in satisfaction and job performance, which is consistent with the effect of diversity in the acoustic environment [52]; the same pattern applies to learning spaces [31], where simple interior furnishings can enhance pleasantness.

4.4. Demographic Characteristics

The influence on the acoustic perception of gender, age, and occupation showed some similarity among the four types of spaces. In terms of age, the difference correlated with the level of noise annoyance and was more pronounced in open-plan offices [18,39], whereas it was not significant in mall spaces [49].
The perceived variability by gender, in addition to noise annoyance, was also related to background music and was more prominent in the school environments. The main result was that female students were more likely to perceive noise as being at annoying levels than males, with greater effects on attention and fatigue [35]. The effect on control was higher for single-sex groups than for mixed-sex groups in the musical context [31]. There was no significant difference between the genders in malls [49].
There were relatively consistent results on the relationship between occupation and sound perception, with occupational characteristics mainly related to the subjects’ duration of stay and frequency of visit. Occupations including workers in hypermarkets, coaches in stadiums and gyms, staff at railway stations, salespersons in shopping malls, and staff in waiting areas of hospitals, had lower correlations between satisfaction and background noise [25], as well as lower noise sensitivity and annoyance [27] and comfort levels than those who stayed for shorter periods of time in the same spaces [26,49]. Persons in such occupations rate sound perception lower when the overall noise level in the space is higher [45,47].

4.5. Limitations

Unlike for medical research, the spatial sample sizes of the studies in the articles selected for this paper were small and there was no evidence of a randomisation of sample selection in any of the studies, so selection bias is inevitable. In addition, only those spaces that consented to the questionnaire being conducted were included in the studies, so there is a risk of volunteer bias.
The selected articles in this paper use different experimental methods, mostly field tests and on-site questionnaires but also a small number of laboratory evaluations, so the risk of research bias caused by the experimental methods is also one of the limitations of this paper.

5. Conclusions

In this study, the results were analysed in terms of positive, neutral, and negative ratings by providing a systematic review of the subjective evaluations of acoustic perception in flat, extra-large, coupled, and long spaces. The comfort level exhibited positive perceptual outcomes across all four types of space. In terms of annoyance, negative perceptions were particularly notable in the flat and extra-large spaces. Conversely, the facet of satisfaction revealed contrasting outcomes in the flat and coupled spaces. The additional insights pertaining to each space category are detailed as follows:
(1)
Flat spaces obtain positive sound perception results via satisfaction, comfort, and preference evaluation, whereas negative perception results were evaluated via annoyance. Sound perception in open office spaces is an important part of flat-space research. In terms of enhancing the spatial acoustic environment, the inclusion of masking sounds and visual–auditory interaction can play a positive role.
(2)
In extra-large spaces, the results of spatial sound perception were evaluated in terms of comfort and annoyance levels and the evaluation dimensions were significantly correlated with the sound source and the social characteristics and behaviour of the subjects. Extra-large spaces were less comfortable overall and prolonged exposure to the environment resulted in higher noise sensitivity. Different genders led to different perceptual outcomes in extra-large spaces with different functions.
(3)
In the coupled space, the unique evaluation dimension, besides comfort and satisfaction, is perceived reverberation. An increase in the sound pressure level and coupling hole diameter can significantly enhance the perceived reverberation.
(4)
In the long spaces, positive and neutral perceptual results were evaluated via comfort and subjective loudness levels, respectively. The evaluation dimensions were significantly correlated with the sound pressure level, sound source, and environment. The specific result was an inverted U-shaped trend for comfort level with increasing sound pressure levels in commercial street spaces, with 65 dB leading to the optimal comfort level.
In addition, this paper provides separate results for the evaluation of special cases in several spaces, including the dimensions of work characteristics in open offices in flat spaces, the acoustic perception of religious buildings in extra-large spaces, and the acoustic perception in concert halls of coupled spaces.

Author Contributions

Conceptualization, H.M. and C.W.; methodology, X.K.; formal analysis, data curation and writing, C.W. and X.K.; supervision, J.K.; funding acquisition, H.M. All authors have read and agreed to the published version of the manuscript.

Funding

This research was funded by National Natural Science Foundation of China, grant number 51978454.

Conflicts of Interest

The authors declare no conflict of interest.

References

  1. Heinrich, K. Room Acoustics; CRC Press: Boca Raton, FL, USA, 2016. [Google Scholar]
  2. Galaitsis, A.G.; Patterson, W.N. Prediction of noise distribution in various enclosures from free-field measurements. J. Acoust. Soc. Am. 1976, 60, 848–856. [Google Scholar] [CrossRef]
  3. Hodgson, M. On the prediction of sound fields in large empty rooms. J. Acoust. Soc. Am. 1988, 84, 253–261. [Google Scholar] [CrossRef]
  4. Schroeder, M.R. The “Schroeder frequency” revisited. J. Acoust. Soc. Am. 1996, 99, 3240–3241. [Google Scholar] [CrossRef]
  5. Wang, C.; Ma, H.; Wu, Y.; Kang, J. Characteristics and prediction of sound level in extra-large spaces. Appl. Acoust. 2018, 134, 1–7. [Google Scholar] [CrossRef]
  6. Anderson, J.; Bratos-Anderson, M.; Doany, P. The acoustics of a large space with a repetitive pattern of coupled rooms. J. Sound Vib. 1997, 208, 313–329. [Google Scholar] [CrossRef]
  7. Li, X.; Zhao, Y. Evaluation of sound environment in departure lounges of a large hub airport. J. Affect. Disord. 2023, 232, 110046. [Google Scholar] [CrossRef]
  8. Eyring, C.F. Reverberation time measurements in coupled rooms. J. Acoust. Soc. Am. 1931, 3, 181–206. [Google Scholar] [CrossRef]
  9. Harris, C.M.; Feshbach, H. On the acoustics of coupled rooms. J. Acoust. Soc. Am. 1950, 22, 572–578. [Google Scholar] [CrossRef]
  10. Ermann, M.; Johnson, M. Exposure and materiality of the secondary room and its impact on the impulse response of coupled-volume concert halls. J. Sound Vib. 2005, 284, 915–931. [Google Scholar] [CrossRef]
  11. Thompson, C. On the acoustics of a coupled space. J. Acoust. Soc. Am. 1984, 75, 707–714. [Google Scholar] [CrossRef]
  12. Kang, J. Acoustics of Long Spaces: Theory and Design Guidance; Thomas Telford Publishing: London, UK, 2002. [Google Scholar]
  13. Kang, J. Acoustics in long enclosures with multiple sources. J. Acoust. Soc. Am. 1996, 99, 985–989. [Google Scholar] [CrossRef]
  14. Yang, W.; Jeon, J.Y. Design strategies and elements of building envelope for urban acoustic environment. Build. Environ. 2020, 182, 107121. [Google Scholar] [CrossRef]
  15. MacKenzie, D.; Galbrun, L. Noise levels and noise sources in acute care hospital wards. Build. Serv. Eng. Res. Technol. 2007, 28, 117–131. [Google Scholar] [CrossRef]
  16. Cai, Y.; Chen, W.; Wu, Z.; Wang, M.; Zhao, Y. Research on the Relationship between Sound Insulation Frequency Characteristics and Subjective Perception of Building Components. Noise Vib. Control 2023, 43, 237. (In Chinese) [Google Scholar]
  17. Fiebig, A. The perception of acoustic environments and how humans form overall noise assessments. In IN-TER-NOISE and NOISE-CON Congress and Conference Proceedings, Madrid, Spain, 16–19 June 2019; Institute of Noise Control Engineering: Reston, VA, USA, 2019; pp. 8229–8244. [Google Scholar]
  18. Oseland, N.; Hodsman, P. A psychoacoustical approach to resolving office noise distraction. J. Corp. Real Estate 2018, 20, 260–280. [Google Scholar] [CrossRef]
  19. Gaver, W.W. What in the World Do We Hear?: An Ecological Approach to Auditory Event Perception. Ecol. Psychol. 1993, 5, 1–29. [Google Scholar] [CrossRef]
  20. Haapakangas, A.; Helenius, R.; Keskinen, E.; Hongisto, V. Perceived acoustic environment, work performance and well-being–survey results from Finnish offices. In Proceedings of the 9th International Congress on Noise as a Public Health Problem (ICBEN), Foxwoods, CT, USA, 21–25 July 2008. [Google Scholar]
  21. Dockrell, J.E.; Shield, B. Children’s perceptions of their acoustic environment at school and at home. J. Acoust. Soc. Am. 2004, 115, 2964–2973. [Google Scholar] [CrossRef]
  22. Moher, D.; Liberati, A.; Tetzlaff, J.; Altman, D.G.; PRISMA Group*. Preferred reporting items for systematic reviews and meta-analyses: The PRISMA statement. Ann. Intern. Med. 2009, 151, 264–269. [Google Scholar] [CrossRef]
  23. Acun, V.; Yilmazer, S. A grounded theory approach to investigate the perceived soundscape of open-plan offices. Appl. Acoust. 2018, 131, 28–37. [Google Scholar] [CrossRef]
  24. Ayr, U.; Cirillo, E.; Fato, I.; Martellotta, F. A new approach to assessing the performance of noise indices in buildings. Appl. Acoust. 2003, 64, 129–145. [Google Scholar] [CrossRef]
  25. Della Crociata, S.; Simone, A.; Martellotta, F. Acoustic comfort evaluation for hypermarket workers. J. Affect. Disord. 2013, 59, 369–378. [Google Scholar] [CrossRef]
  26. Wu, Y.; Kang, J.; Zheng, W.Z.; Wu, Y.X. Acoustic comfort in large railway stations. Appl. Acoust. 2020, 160, 107137. [Google Scholar] [CrossRef]
  27. Al-Arja, O.A. Acoustic Environment and Noise Exposure in Fitness Halls. Appl. Sci. 2020, 10, 6349. [Google Scholar] [CrossRef]
  28. Chen, J.; Ma, H. An impact study of acoustic environment on users in large interior spaces. Build. Acoust. 2019, 26, 139–153. [Google Scholar] [CrossRef]
  29. Park, S.H.; Lee, P.J.; Lee, B.K.; Roskams, M.; Haynes, B.P. Associations between job satisfaction, job characteristics, and acoustic environment in open-plan offices. Appl. Acoust. 2020, 168, 107425. [Google Scholar] [CrossRef]
  30. Abdalrahman, Z.; Galbrun, L. Audio-visual preferences, perception, and use of water features in open-plan offices. J. Acoust. Soc. Am. 2020, 147, 1661–1672. [Google Scholar] [CrossRef]
  31. Jiang, J.; Meng, Q.; Ji, J. Combining Music and Indoor Spatial Factors Helps to Improve College Students’ Emotion During Communication. Front. Psychol. 2021, 12, 703908. [Google Scholar] [CrossRef] [PubMed]
  32. Kim, A.; Wang, S.; McCunn, L.; Prozuments, A.; Swanson, T.; Lokan, K. Commissioning the Acoustical Performance of an Open Office Space Following the Latest Healthy Building Standard: A Case Study. Acoustics 2019, 1, 473–492. [Google Scholar] [CrossRef]
  33. Jeon, J.Y.; Hwang, I.H.; Hong, J.Y. Soundscape evaluation in a Catholic cathedral and Buddhist temple precincts through social surveys and soundwalks. J. Acoust. Soc. Am. 2014, 135, 1863–1874. [Google Scholar] [CrossRef] [PubMed]
  34. Laplace, J.; Guastavino, C. Exploring sonic experiences in church spaces: A psycholinguistic analysis. Senses Soc. 2022, 17, 343–358. [Google Scholar] [CrossRef]
  35. Brännström, K.J.; Johansson, E.; Vigertsson, D.; Morris, D.J.; Sahlén, B.; Lyberg-Åhlander, V. How Children Perceive the Acoustic Environment of Their School. Noise Health 2017, 19, 84–94. [Google Scholar]
  36. Jo, H.I.; Jeon, J.Y. Influence of indoor soundscape perception based on audiovisual contents on work-related quality with preference and perceived productivity in open-plan offices. J. Affect. Disord. 2022, 208, 108598. [Google Scholar] [CrossRef]
  37. Meng, Q.; Kang, J.; Jin, H. Field study on the influence of spatial and environmental characteristics on the evaluation of subjective loudness and acoustic comfort in underground shopping streets. Appl. Acoust. 2013, 74, 1001–1009. [Google Scholar] [CrossRef]
  38. Lenne, L.; Chevret, P.; Marchand, J. Long-term effects of the use of a sound masking system in open-plan offices: A field study. Appl. Acoust. 2020, 158, 107049. [Google Scholar] [CrossRef]
  39. Pierrette, M.; Parizet, E.; Chevret, P.; Chatillon, J. Noise effect on comfort in open-space offices: Development of an assessment questionnaire. Ergonomics 2015, 58, 96–106. [Google Scholar] [CrossRef] [PubMed]
  40. Ali, S.A. Open-plan office noise levels, annoyance and countermeasures in Egypt. Noise Control Eng. J. 2011, 59, 186–193. [Google Scholar] [CrossRef]
  41. Hongisto, V.; Varjo, J.; Oliva, D.; Haapakangas, A.; Benway, E. Perception of Water-Based Masking Sounds—Long-Term Experiment in an Open-Plan Office. Front. Psychol. 2017, 8, 1177. [Google Scholar] [CrossRef] [PubMed]
  42. Kang, S.; Mak, C.M.; Ou, D.; Zhang, Y. The effect of room acoustic quality levels on work performance and perceptions in open-plan offices: A laboratory study. Appl. Acoust. 2022, 201, 109096. [Google Scholar] [CrossRef]
  43. Wu, Y.; Kang, J.; Zheng, W.Z. Acoustic environment research of railway station in China. In Proceedings of the 5th International Conference on Energy and Environment Research (ICEER), Prague, Czech Republic, 23–27 July 2018; Elsevier Science Bv.: Amsterdam, The Netherlands, 2018; pp. 353–358. [Google Scholar]
  44. Bradley, D.T.; Wang, L.M. The effects of simple coupled volume geometry on the objective and subjective results from nonexponential decay. J. Acoust. Soc. Am. 2005, 118, 1480–1490. [Google Scholar] [CrossRef]
  45. Qin, X.; Kang, J.; Jin, H. Sound Environment of Waiting Areas in Large General Hospitals in China. Acta Acust. United Acust. 2012, 98, 760–767. [Google Scholar] [CrossRef]
  46. Aleshkin, V.M.; Bouttout, A.; Subbotkin, A.O.; Benferhat, M.L.; Amara, M. Acoustics of the Ketchaoua Mosque in Algeria. Acoust. Phys. 2021, 67, 302–311. [Google Scholar] [CrossRef]
  47. Portela, B.S.; Constantini, A.; Tartaruga, M.P.; Zannin, P.H.T. Sound pressure level in the workplace: The case of physical education teachers. J. Phys. Educ. Sport 2019, 19, 1153–1157. [Google Scholar]
  48. Ermann, M. Double Sloped Decay: Subjective Listening Test to Determine Perceptibility and Preference. Build. Acoust. 2007, 14, 91–107. [Google Scholar] [CrossRef]
  49. Meng, Q.; Kang, J. Influence of Social and Behavioural Characteristics of Users on Their Evaluation of Subjective Loudness and Acoustic Comfort in Shopping Malls. PLoS ONE 2013, 8, e54497. [Google Scholar] [CrossRef] [PubMed]
  50. Wang, S.; He, H.; Li, F.; Xiao, Q. A Study on the Soundscape of Underground Commercial Space in Lu’an City and Hefei City, China. Int. J. Environ. Res. Public Health 2023, 20, 1971. [Google Scholar] [CrossRef] [PubMed]
  51. Kang, J.; Meng, Q.; Jin, H. Effects of individual sound sources on the subjective loudness and acoustic comfort in underground shopping streets. Sci. Total. Environ. 2012, 435–436, 80–89. [Google Scholar] [CrossRef]
  52. Jeon, J.Y.; Jo, H.I.; Santika, B.B.; Lee, H. Crossed effects of audio-visual environment on indoor soundscape perception for pleasant open-plan office environments. Build. Environ. 2022, 207, 14. [Google Scholar] [CrossRef]
  53. Puglisi, G.E.; Di Blasio, S.; Shtrepi, L.; Astolfi, A. Remote Working in the COVID-19 Pandemic: Results from a Questionnaire on the Perceived Noise Annoyance. Front. Built Environ. 2021, 7, 688484. [Google Scholar] [CrossRef]
  54. Wang, Q.; Hongwei, W.; Cai, J.; Zhang, L. The multi-dimensional perceptions of office staff and non-office staff about metro noise in commercial spaces. Acta Acust. 2022, 6, 15. [Google Scholar] [CrossRef]
  55. Haapakangas, A.; Kankkunen, E.; Hongisto, V.; Virjonen, P.; Oliva, D.; Keskinen, E. Effects of five speech masking sounds on performance and acoustic satisfaction. Implications for open-plan offices. Acta Acust. United Acust. 2011, 97, 641–655. [Google Scholar] [CrossRef]
  56. Jahncke, H.; Björkeholm, P.; Marsh, J.E.; Odelius, J.; Sörqvist, P. Office noise: Can headphones and masking sound attenuate distraction by background speech? Work 2016, 55, 505–513. [Google Scholar] [CrossRef] [PubMed]
  57. Yang, W.; Moon, H.J. Effects of indoor water sounds on intrusive noise perception and speech recognition in rooms. Build. Serv. Eng. Res. Technol. 2018, 39, 637–651. [Google Scholar] [CrossRef]
Figure 1. A flow chart showing article selection, screening, and exclusion in this systematic review.
Buildings 14 00337 g001
Figure 2. Frequency of occurrence of each dimension in the articles covered in this paper.
Buildings 14 00337 g002
Table 1. The space types, functions, and number of articles.
Space TypeSpace FunctionNumber of Articles
Flat spaceOpen-plan office12
Library reading room1
Hypermarket1
Indoor sports and gymnasium1
Large spaceLarge railway station3
Convention and exhibition building1
Gymnasium2
Canteen1
Shopping mall1
Auditorium1
Religious building (cathedral, mosque, temple)3
Coupled spaceTicket lobby and hallway1
Shopping mall1
Concert hall2
Hospital waiting area1
Long spaceCorridor2
Underground shopping street3
Table 2. Characteristics of the included studies.
No.Space TypeAuthor, Year, and ReferenceSpace FunctionNo. of SpacesVolume/AreaFamiliarity with SpaceHearing
Assessment
Sound SourcesMasking
Effect
Noise
Sensitivity
Interaction
1FlatAcun, Volkan; Yilmazer, Semiha (2018) [23]Open-plan office21245 m3/215 m2
297 m3/135 m2
+ +NoHV/MI/
TNS/OS a
NoNoNo
2FlatAyr, U; Cirillo, E; Fato, I; Martellotta, F (2003) [24]Library1-+YesHV/TNSNoYesNo
3FlatOseland, Nigel; Hodsman, Paige (2018) [18]Open-plan office--+ +NoHV/TNS/OSNoNoNo
4FlatDella Crociata, Sabrina; Simone, Antonio; Martellotta, Francesco (2013) [25]Hypermarket117,400 m2+ +YesHV/MI/TNSNoNoNo
5Large/
Coupled
Wu, Yue; Kang, Jian; Zheng, Wenzhong; Wu, Yongxiang (2020) [26]Large railway station/Ticket lobby and hallway2/1Large 180 m2,
11,100 m2
Coupled 864 m2
+NoHV/TNSNoNoNo
6FlatAl-Arja, Omaimah Ali (2020) [27]Indoor sports and gymnasium20Range from 180 to 15,792 m3Instructors + +
/Participants+
YesHV/MINoNoNo
7LargeChen, Jing; Ma, Hui (2019) [28]Large railway station/Convention and exhibition building/Gymnasium9Range from about 17,200 to 1,785,000 m3+NoHV/TNSNoNoNo
8FlatPark, Sang Hee; Lee, Pyoung Jik; Lee, Byung Kwon; Roskams, Michael; Haynes, Barry P. (2020) [29]Open-plan office12Range from 450 to 1836 m3+ +YesHV/TNSNoYesNo
9FlatAbdalrahman, Zanyar; Galbrun, Laurent (2020) [30]Open-plan office3960.5 m3/343.04 m2
112.42 m2
196.1 m2
+ +YesHV/OSYesNoYes
10LongJiang, Jiani; Meng, Qi; Ji, Jingtao (2021) [31]Corridor1-+ +NoHV/MINoNoYes
11FlatKim, Amy; Wang, Shuoqi; McCunn, Lindsay; Prozuments, Aleksejs; Swanson, Troy; Lokan, Kim (2019) [32]Open-plan office1140 m2+ +NoHV/TNSNoNoNo
12FlatJeon, Jin Yong; Jo, Hyun In; Santika, Beta Bayu; Lee, Haram (2022) [33]Open-plan office1767.6 m3/307.04 m2+ +NoHVNoNoYes
13LargeLaplace, Josee; Guastavino, Catherine (2022) [34]Cathedral1-+ +NoHV/MINoNoNo
14Large/
Long
Brannstrom, Karl Jonas; Johansson, Erika; Vigertsson, Daniel; Morris, David J.; Sahlen, Birgitta; Lyberg-Ahlander, Viveka (2017) [35]Canteen, auditorium, and gymnasium/Corridor3/1-+ +YesHV/OSNoYesNo
15FlatJo, Hyun In; Jeon, Jin Yong (2022) [36]Open-plan office5Range from
57 to 550 m2
+ +YesHVNoNoYes
16Large/
Coupled
Meng, Qi; Kang, Jian (2013) [37]Shopping mall3/3Large 31,000 m2,
28,700 m2,
30,000 m2
Coupled 10,000 m2,
32,000 m2,
45,000 m2
+NoHV/MI/
TNS/OS
NoNoNo
17FlatLenne, Lucas; Chevret, Patrick; Marchand, Julien (2020) [38]Open-plan office1500 m2+ +NoHV/TNSYesNoNo
18FlatPierrette, M.; Parizet, E.; Chevret, P.; Chatillon, J. (2015) [39]Open-plan office10-+ +NoHV/TNSNoYesNo
19FlatAli, Sayed Abas (2011) [40]Open-plan office10Range from 375 to 800 m2+ +NoHV/TNSNoNoNo
20FlatHongisto, Valtteri; Varjo, Johanna; Oliva, David; Haapakangas, Annu; Benway, Evan (2017) [41]Open-plan office1930 m2+ +YesTNS/OSYesNoNo
21LargeJeon, Jin Yong; Hwang, In Hwan; Hong, Joo Young (2014) [33]Cathedral/Temple2-0NoHV/MI/OSNoNoYes
22FlatKang, Shengxian; Mak, Cheuk Ming; Ou, Dayi; Zhang, Yuanyuan (2022) [42]Open-plan office11459.7 m30YesHVNoNoNo
23LargeWu, Yue; Kang, Jian; Zheng, Wenzhong (2018) [43]Large railway station1117,000 m3UnclearNoHV/MI/TNSNoNoNo
24CoupledBradley, DT; Wang, LM (2005) [44]Concert hall137,232 m30YesMINoYesNo
25CoupledQin, Xin; Kang, Jian; Jin, Hong (2012) [45]Hospital waiting area--Staff + +
/Patients +
NoHV/TNS/OSNoNoNo
26LargeAleshkin, V. M.; Bouttout, A.; Subbotkin, A. O.; Benferhat, M. L.; Amara, M. (2021) [46]Mosque111,000 m3+ +NoHVNoNoNo
27LargePortela B.S.; Constantini A.; Tartaruga M.P.; Zannin P.H.T. (2019) [47]Gymnasium10-+ +YesHV/MINoNoNo
28CoupledErmann M. (2007) [48]Concert hall2-0NoMINoNoNo
29LongQi Meng, Jian Kang, Hong Jin (2013) [49]Underground shopping street3Range from 14,000 to 17,000 m2+No-NoNoNo
30LongSu Wang, Huaidong He, Fulong Li and Qingqing Xiao (2023) [50]Underground shopping street217,535 m2,
120,000 m2
+YesHV/MI/TNSNoNoNo
31LongJian Kang, Qi Meng, Hong Jin (2012) [51]Underground shopping street5-+NoHV/MINoNoNo
a In the sound source column, HV refers to the human voice, MI refers to musical instruments, TNS refers to technical noise sources, and OS refers to outdoor sources.
Table 3. Statistics on the correspondence between objective and subjective indicators for the conclusion of strong correlation.
Subjective IndicatorsObjective Indicators bRelationships (Positive/
Negative/Unclear)
Frequency
Satisfaction aLAeq/LA90N3
RT1
QAI [25]1
LA5U1
rD1
LP,A,S,4mP2
AnnoyanceLAeqU1
LA51
LLZ1
LMSN1
Subjective loudnessLAeqP3
LA5U1
ComfortLAeqP3
The proportion of people with high levels of annoyanceLAeqP1
PreferenceLMSU1
DSE1
Acoustic perceived intensityLAeq/LA90P1
TranquillityLAeqN1
Work satisfactionLAeq, 8-hN1
Perceived reverberationT30/T15U1
Subjective perception of speechCILRN1
a Satisfaction refers to acoustic satisfaction and is distinguished from job satisfaction. b LAeq—A-weighted equivalent sound pressure level; LA90—The SPL of background noise; LA5—The peak of background noise; LP, A, S, 4m—The A-weighted sound pressure level of speech at 4 m from the sound source; LAeq, 8-h—Active noise level; rD—The distraction distance; RT—Reverberation time; CILR—Characterisation of the inverse linear relationship between reverberation time and frequency; LLZ—Zwicker’s loudness level; T30/T15—Coupling coefficient ratio; DSE—Double slope decay; QAI—Quality assessment index; LMS—Masking sound level.
Table 4. Classification of sound sources and subjective attitudes.
ClassificationSound SourcesAttitude
(Positive/Negative/Both/Unclear)
Frequency
Indoor sourcesHuman VoicesSpeechB15
Group Conversation2
Broadcast4
Phone ConversationN2
Rattling Noise1
Children Crying2
Loud Shouting2
Footsteps2
Hawking of the StoresU3
Musical InstrumentsBackground MusicP7
Musical Passages1
Live Performances1
Technical Noise SourcesKeyboard and MouseB3
Printer/Plotter3
Computer Fan1
Telephone Ring5
Ventilation/Air Conditioning Noise5
Luggage NoiseN1
Elevator Noise1
Gurgling Sounds in Public Toilets1
Outdoor SourcesAnimalU1
Wind1
Twitter1
WaterB3
TrafficN4
Disclaimer/Publisher’s Note: The statements, opinions and data contained in all publications are solely those of the individual author(s) and contributor(s) and not of MDPI and/or the editor(s). MDPI and/or the editor(s) disclaim responsibility for any injury to people or property resulting from any ideas, methods, instructions or products referred to in the content.

