Article

Research on the Impact of Air Temperature and Wind Speed on Ventilation in University Dormitories under Different Wind Directions (Northeast China)

1
School of Chemical Engineering, Northeast Electric Power University, 169 Changchun Road, Jilin City 132012, China
2
Jilin Provincial Science and Technology Innovation Center of Clean Conversion and High-Valued Utilization of Biomass, Northeast Electric Power University, Jilin City 132012, China
*
Author to whom correspondence should be addressed.
Buildings 2024, 14(2), 361; https://doi.org/10.3390/buildings14020361
Submission received: 1 January 2024 / Revised: 22 January 2024 / Accepted: 26 January 2024 / Published: 29 January 2024
(This article belongs to the Section Building Energy, Physics, Environment, and Systems)

Abstract

:
This study employs computational fluid dynamics to analyze the natural ventilation conditions of university student dormitories in the northeastern region of China under various outdoor wind directions, wind speeds, and temperature conditions. By separately simulating room natural ventilation efficiency under four different outdoor wind speeds (1.5 m/s, 3.3 m/s, 5.4 m/s and 7.9 m/s) at different outdoor temperatures (−10 °C, 0 °C, 10 °C and 20 ℃), curves of indoor pollutant removal rates (VOA-Time) are established for different wind directions. The study also determines the minimum ventilation time required for rooms under different environmental conditions (TVOA=70%). The data indicate that, despite the promotion of ventilation efficiency with increasing wind speed or indoor-outdoor temperature difference, the wind direction determines the extent to which these factors enhance room ventilation efficiency. Furthermore, there are corresponding mathematical relationships between TVOA=70%, outdoor temperature, wind speed, and different wind directions, allowing for predictions related to the rate of indoor carbon dioxide change. The research findings will assist students in formulating more effective ventilation strategies under complex outdoor environmental conditions.

1. Introduction

With the continuous popularization of higher education, the number of college students in Northeast China has been increasing. Following the coronavirus pandemic, people have realized that sufficient attention must be paid to the health issues of university students [1]. Since the dormitory is the place where the students spend most of their time while attending school, how to build a safer and healthy place for students is a meaningful topic. The research [2,3,4] reveals that the air quality within dormitories has a direct impact on the physical health of students. A poorly ventilated living space [5,6,7,8,9] can result in compromised sleep quality among students and even heighten the risk of infection.
In Northeast China, natural ventilation is the predominant method of ventilation employed in university dormitories. Natural ventilation is an energy-saving and environmentally friendly way, while its ventilation efficiency is closely related to the outdoor environment. However, this may not be the most effective ventilation strategy because outdoor environmental conditions will largely affect ventilation efficiency, and it is difficult to maintain pollutant concentrations below specified standards by relying solely on students’ subjective judgment [10,11,12,13].
In order to assess the relationship between indoor air quality and outdoor environment, scholars have proposed various research methods. Lei et al. [14] explored the relationship by monitoring indoor carbon dioxide levels and analyzing the ventilation area’s correlation with indoor pollutant concentrations based on the winter outdoor environment in Beijing. Li et al. [15] established an empirical equation for the ventilation status and indoor air quality in university dormitories by monitoring the carbon dioxide concentration. Sun et al. [16] conducted a series of measurements in the academic buildings of Tianjin, China, revealing that changes in the outdoor environment significantly impact the health of students on campus. Although these studies utilized experiments to demonstrate the relationship between natural ventilation and air quality, the inability to precisely control various environmental variables often affecting experimental factors necessitates extended experimental periods, and the conclusions drawn may be subject to noticeable regional limitations.
With the continuous development of computational fluid dynamics (CFD), CFD technology has gradually found applications in this field, becoming a crucial method for analyzing the relationship between indoor air quality and the outdoor environment [17,18,19]. In this context, Dai et al. [20] simulated different wind directions to identify critical pollution areas within university dormitory buildings. Meanwhile, Kai et al. [21] conducted a simulation analysis of the dispersion of droplet pollutants inside dormitories and discovered a significant correlation between wind direction and the distribution of indoor pollutants. Additionally, Wang et al. [22], based on the thermal environment in Chongqing, China, analyzed the impact of thermal effects on dormitory ventilation efficiency and established the relationship between thermal effects and natural ventilation efficiency. Overall, in relevant simulation studies, the variations in airflow environments caused by outdoor wind conditions and temperature have been the focal points of such research. It is widely known that in real-world scenarios, the natural ventilation efficiency of a room is typically determined by multiple factors. These primarily include outdoor wind direction [23,24,25], wind speed [26,27,28], air temperature [29,30,31], and so on. However, current research on indoor natural ventilation tends to analyze the impact of specific single variables on indoor ventilation efficiency. Neglecting the influence of changes in multiple factors on indoor natural ventilation efficiency may lead to significant limitations in research conclusions. Therefore, quantitatively calculating the mathematical relationship between outdoor wind speed and temperature and indoor natural ventilation, as well as analyzing the degree of influence of various environmental factors on indoor ventilation efficiency, contributes to the construction of a room’s natural ventilation model under complex environmental conditions. Furthermore, influenced by the climate, student dormitories in the northeastern region of China utilize smaller casement windows. Although this design enhances the insulation of the dormitories, it restricts the ventilation area. Currently, there is no research on room natural ventilation based on models of university dormitories in this region.
According to the above perspectives, this paper utilizes CFD to analyze the ventilation efficiency of rooms within a linear-shaped dormitory building under different outdoor wind directions, wind speeds, and air temperatures. The paper establishes functional relationships among multiple variables. Additionally, the study combines on-site experiments to further validate the universality and reliability of the obtained conclusions. The research aims to quantitatively analyze the impact of the outdoor environment around the dormitory building on indoor natural ventilation through theoretical calculations and practical measurements. The results of this study will assist students in formulating reasonable and effective ventilation strategies under different outdoor environmental conditions. It can also serve as a reference for the relationship between room ventilation efficiency and prevalent winds in the region, providing guidance for architectural design.

2. Model and Methods

The Ansys-Fluent 2020R2 CFD software was utilized in this study, with a server core count of 64 and the CPU was AMD-EPYC-7061.
The nomenclature can be found in the Nomenclature section.

2.1. Theoretical Equations
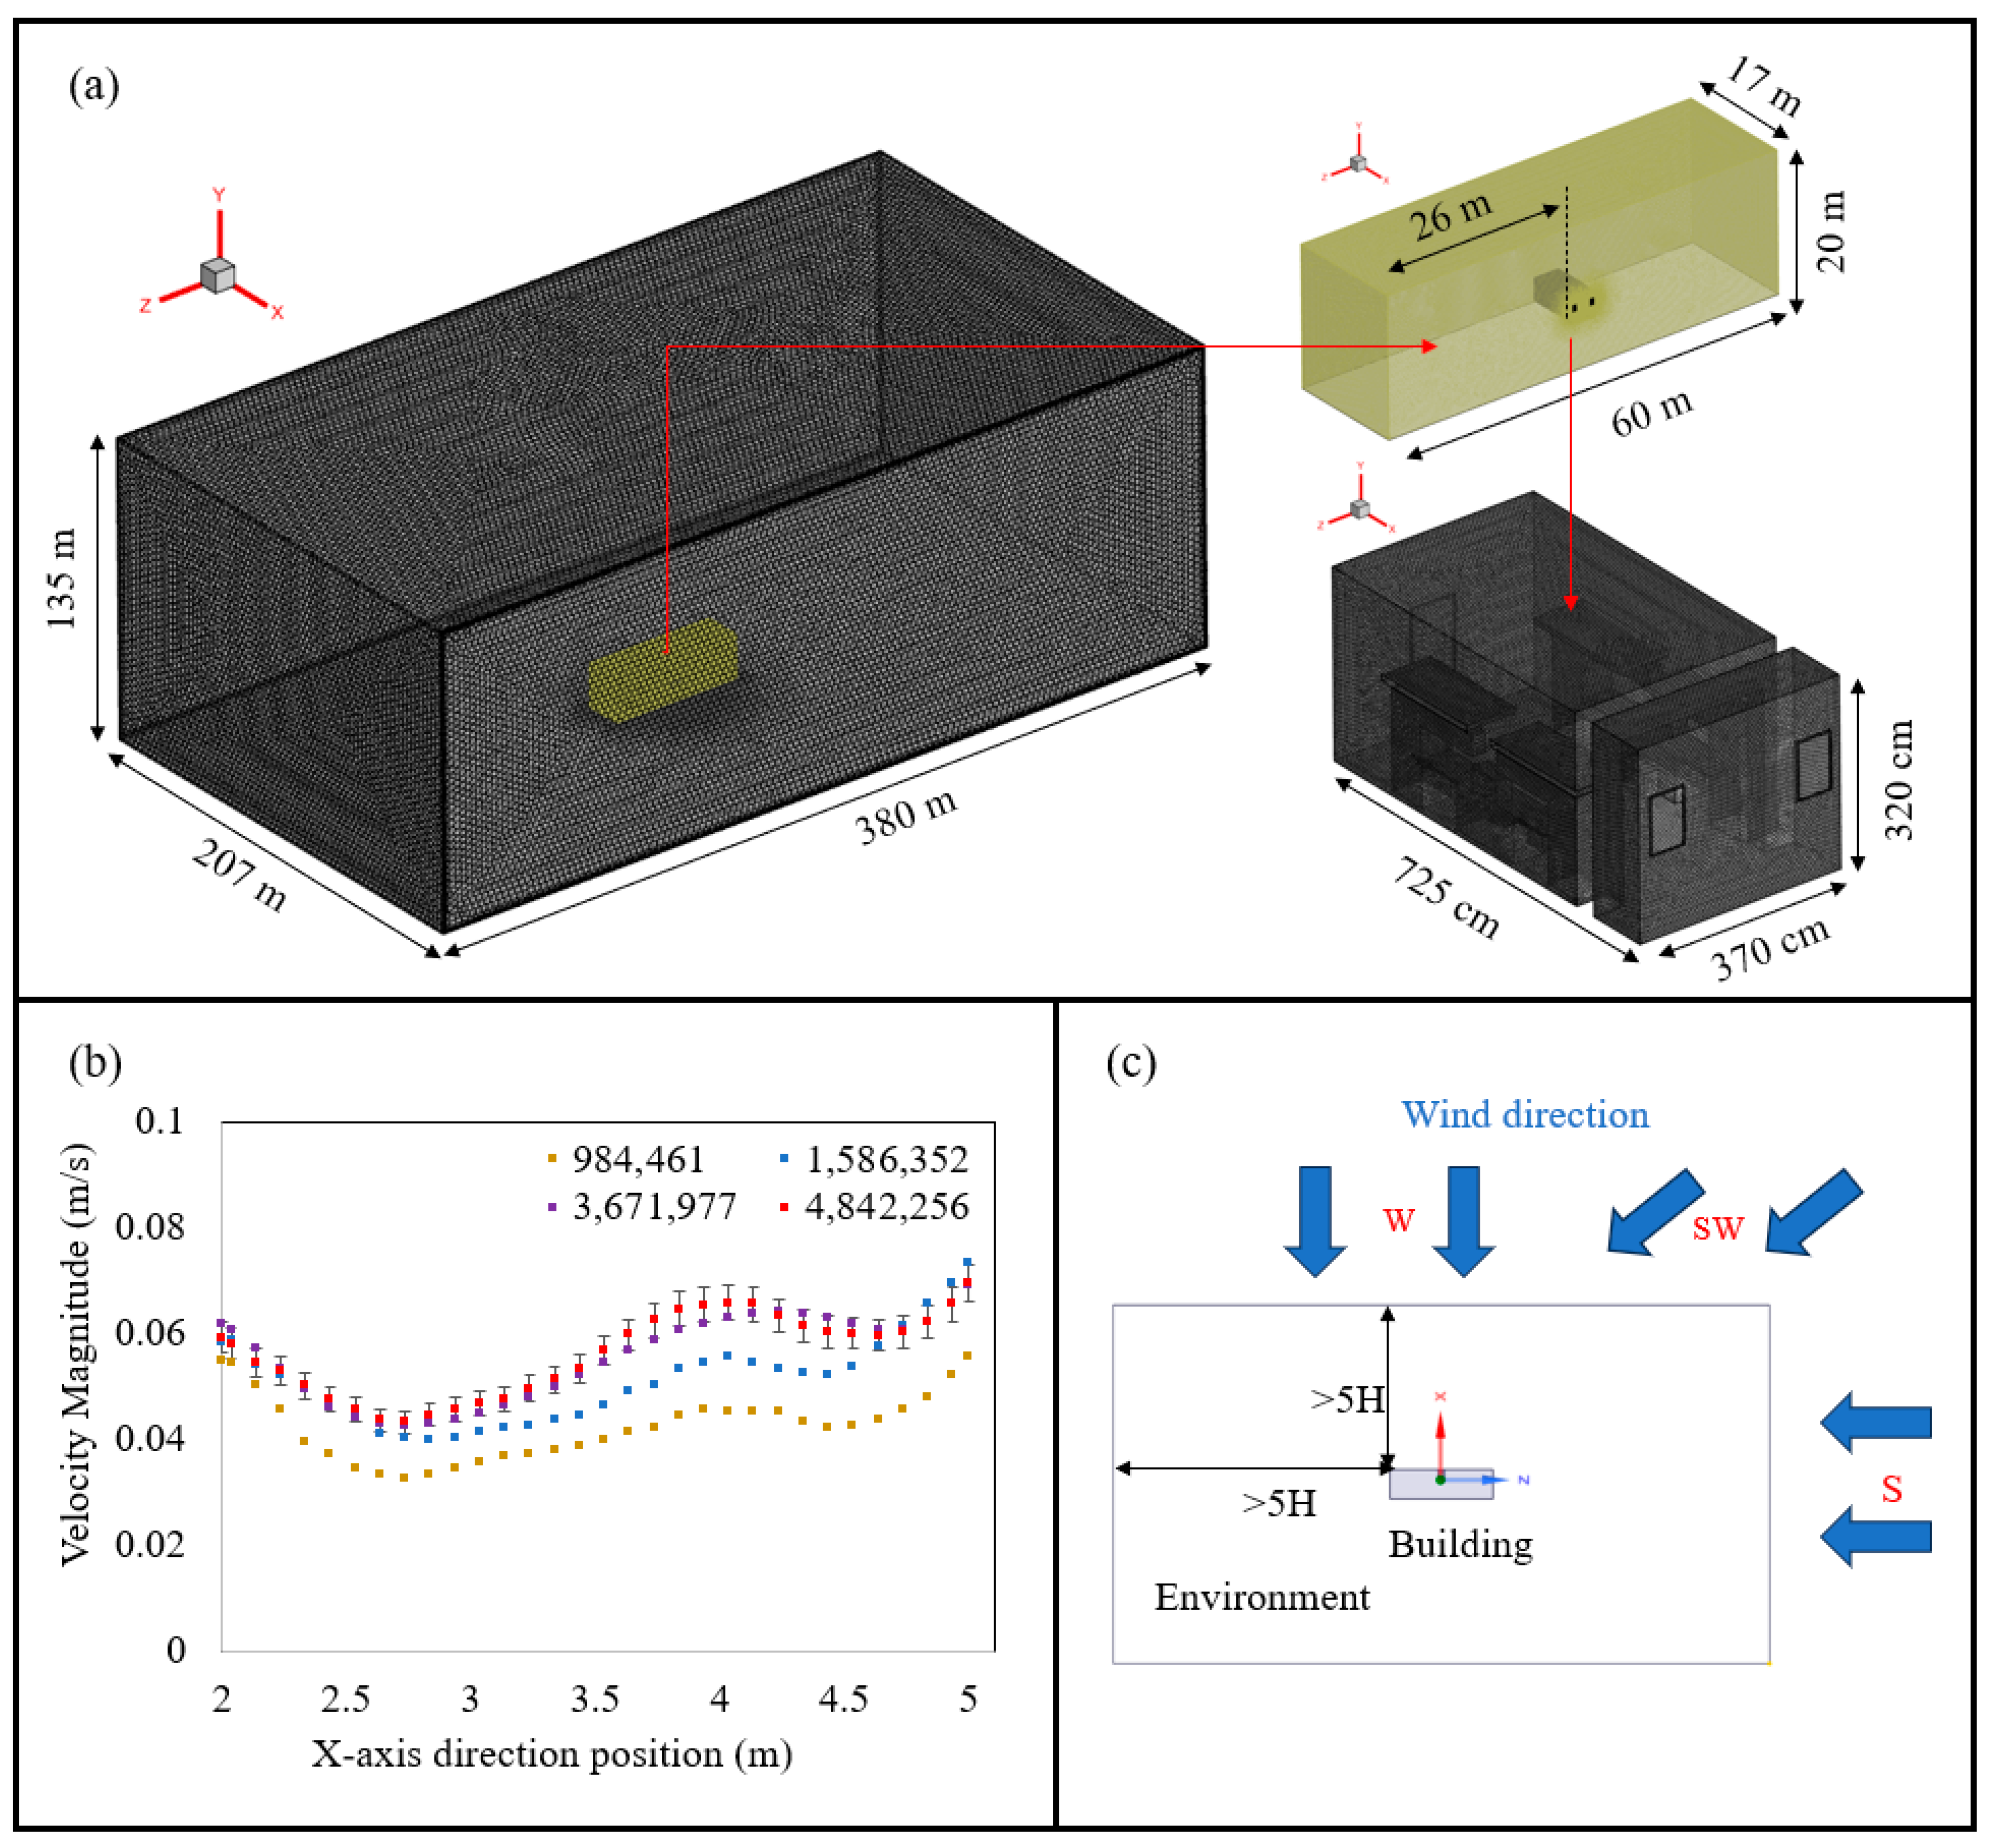
The simulation calculation method employed in this study is RNG-k-ε, with the standard wall equation utilized for the wall boundary condition. This approach has sufficient accuracy when applied to simulate indoor ventilation [32,33]. The k and ε equations are as follows:
t ρ k + x i ρ k u i = x j a k u e f f k x j + G k + G b ρ ε Y M + S k
t ρ ε + x i ρ ε u i = x j a ε u e f f ε x j + C 1 ε ε k G k + C 3 ε G b C 2 ε ρ ε 2 k R ε + S ε
where
R ε = C μ ρ η 3 1 η η 0 ε 2 k 1 + β η 3
η = S k ε
The equation below is utilized for the computation of viscosity:
d ρ 2 k ε μ = 1.72 v ~ v ~ 3 1 C v d v ~
v ~ = u e f f u
In the regime of high Reynolds numbers, the viscosity coefficient governing air turbulence is formulated as follows:
μ t = ρ C μ k 2 ε
C μ = 0.0845
The logarithmic distribution of the dimensionless velocity predicted by the standard wall function is as follows:
u + = y + ,     y + < 11.25     1 k ln E y + , y + > 11.25    
Additionally, the tensor expression utilized to solve the governing equation of air age definition is as follows:
x i A ρ u i = x i Γ A x i + ρ
Γ A = μ S c + μ t S c t

2.2. Physical Model

The design specifications for university dormitories can be found in “Several Opinions on the Construction Standards of College Students’ Apartments [2001]” [34] and “GB 55025-2022” [35]. Northeast Electric Power University is situated on the outskirts of Jilin City, and there are no high-rise buildings around the corresponding dormitory building in the experiment. The physical model employed in this study is based on a four-student room at Northeast Electric Power University. In this model, the window is the only ventilation opening for the room. The selected room for the study is situated in the middle of the third floor of the dormitory building. Ventilation issues in the other rooms within the dormitory building are not considered in this study; therefore, all sides of the dormitory building are defined as Wall in the model. Furthermore, relevant experimental work was also conducted within the dormitory rooms of the same university.
The construction of the outdoor fluid domain is crucial. Inadequate space within the fluid domain can lead to deviations in calculations, as air pressure rises due to wind influence, while an excessively large outdoor fluid domain can reduce calculation efficiency. Assuming the height of the corresponding building in the experiment as H (H = 20 m), a minimum distance of 5H is necessitated between the building and the boundary of the fluid domain, according to the construction recommendations for outdoor fluid domains provided by relevant research [36,37]. The model utilized in this study is illustrated in Figure 1a, and the length of each boundary of the fluid domain (length × width × height = 380 m × 207 m × 135 m) is ensured to be five times the corresponding building height, and the outlet blockage rate is guaranteed to remain below 3%.
The Polyhedral mesh generation method is employed for mesh generation. In order to balance the accuracy and efficiency of the simulation, the turbulent kinetic energy of the connection between points A (2, 1.8, 1.6) and B (5, 1.8, 1.6) in the dormitory is utilized as an evaluation metric to verify grid independence. The assumed wind speed is 1 m/s with a westerly direction. Figure 1b displays the grid independence verification, where the range of the error bar is 5%. Four sets of grid models were compared through calculations, and it has been observed that the difference in turbulent kinetic energy calculated is less than 5% when the number of grids reaches 3,671,977. The model with a grid size of 3,671,977 will be selected for subsequent calculations.
The flow field in the room is the focus of this study, so the number of grids is 1,095,331, and the grid size is 5 cm. In addition, the growth rate of grid size is set to 1.03, and the upper limit of the mesh size in the fluid domain is 3.5 m. The minimum orthogonal quality is 0.51.

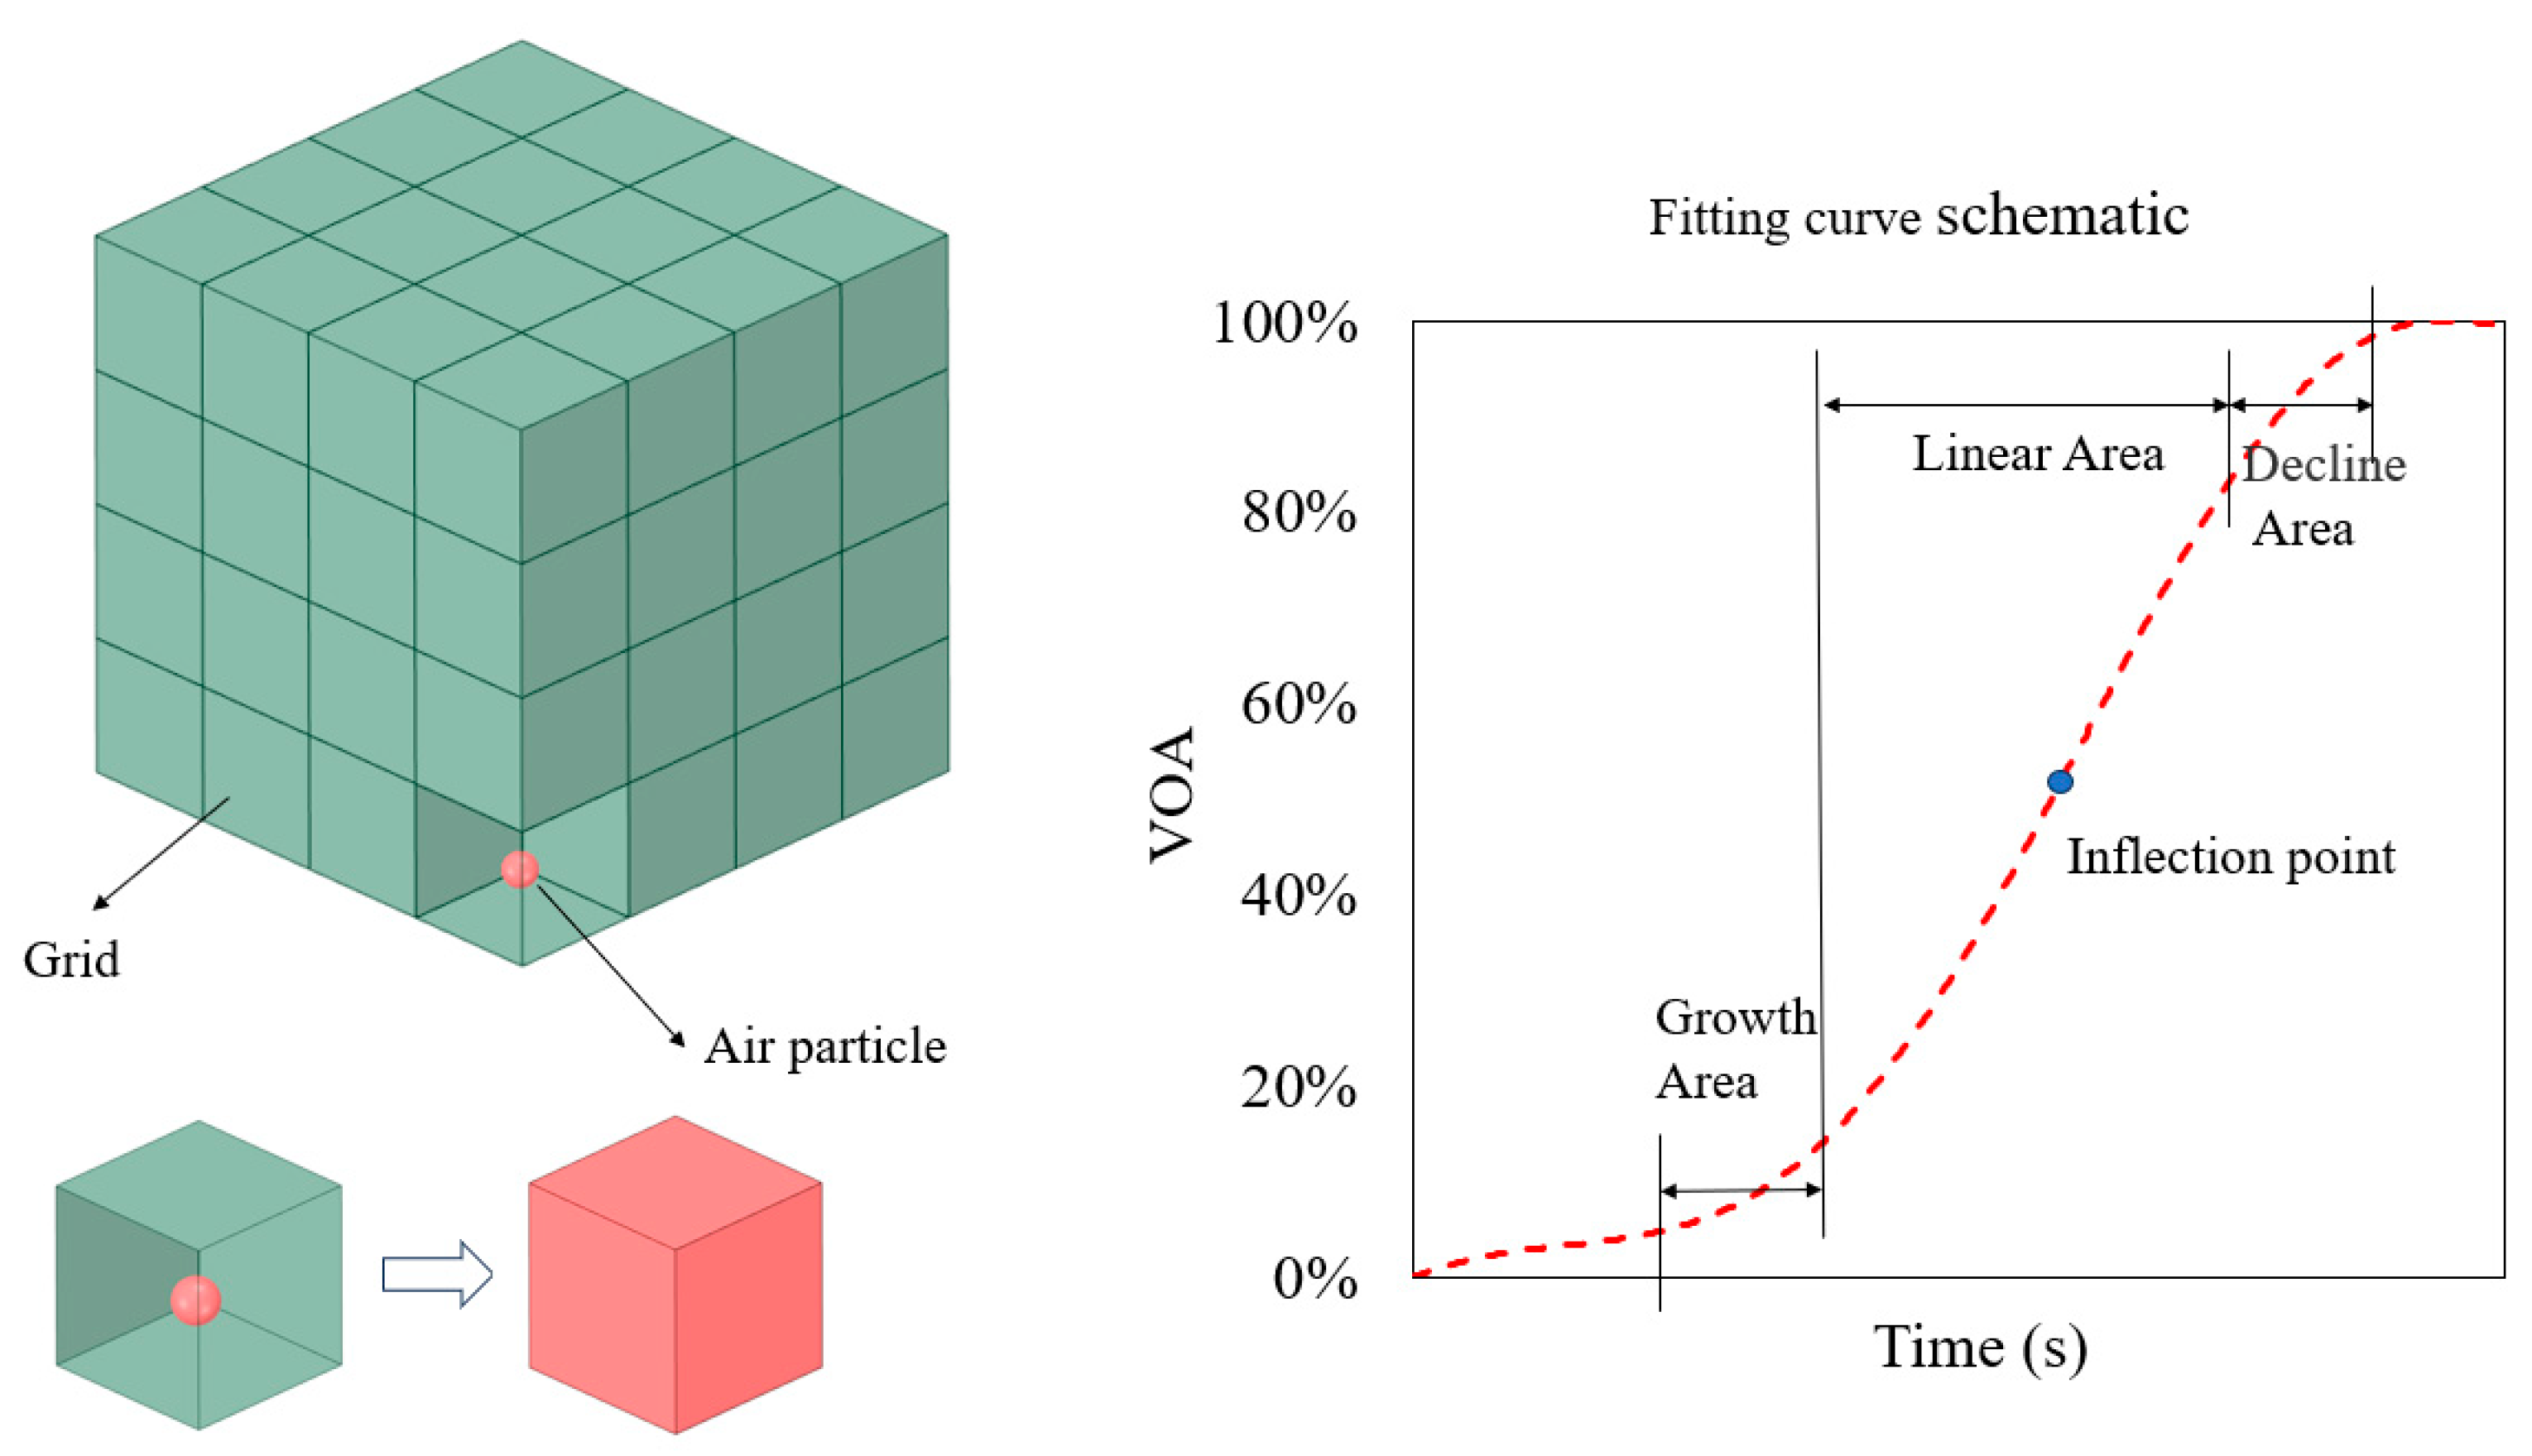
2.3. Evaluation Method

The “air age” is defined as the time duration required for air particles to enter a room and reach a specific location [38]. Although the “air age” can accurately reflect the freshness of air at a specific location in a room, it is challenging to comprehensively evaluate the overall air quality of the entire space. Liu [39] and Yang [40] have proposed a novel concept, namely area ratio of age of air (AOA), for assessing overall air quality in a classroom. The calculation formula is as follows:
AOA % = X the   area   of   age   of   air   in   a   time Y the   area   of   age   of   air   in   a   whole   time
The calculation of AOA is based on the air age values’ area coverage in each part of the contour map. However, it should be noted that the flow field studied in this work is three-dimensional, and using the air age above the cross-section to reflect the overall indoor air quality may reduce the accuracy of the conclusion. Therefore, this study has extended the AOA indicator to three dimensions and proposed a novel concept of the volume ratio of air age (VOA). This study was inspired by the Rosin-Rammler distribution (Equation (13)), which characterizes particle size in materials [41,42] as below.
Y d = e d / d ¯ n
n = l n ( l n Y d ) ln d / d ¯
The following introduces the numerical sampling method for VOA. Given that each air particle corresponds to a unique air age value, and the air age values of adjacent air particles are nearly identical. Since the grid cells constituting the dormitory room are sufficiently small, it can be assumed that the air age values of all air particles within the grid cell are exactly the same (as shown in Figure 2). In addition, to ensure the accuracy of the fitted curve, it is recommended to average at least 15 values within the overall calculated range of environmental air age and calculate the corresponding grid volumes for each of these values. The volume size corresponding to different values can indicate the number of air particles associated with those values. Equation (15) shows the fitting approach for the VOA curve.
V O A % = V i V m
V i = z = 1 i v z z < m ; Accuracy   requirement : i 15
where V i is the total volume of the grids of which the air age is less than a certain value, V m is the total volume of the grid contained in the selected value.
The numerical value of VOA represents the exchange ratio between the original air inside the room and the outdoor air, indicating the freshness or air quality inside the room. When the VOA value is 0, it means that the air inside the room has not exchanged with the outdoor air, indicating no ventilation. When the VOA value is 100%, it indicates a complete exchange between the original air inside the room and the outdoor air, resulting in excellent indoor air quality. The relationship between VOA value and time is illustrated in Figure 2, showing the correlation between the duration of ventilation and indoor air quality. Due to the noticeable slow-growth region (decline area) in the curve, prolonged ventilation may not necessarily lead to higher ventilation efficiency and may even fail to meet residents’ comfort [43,44]. Therefore, according to “GB/T 50378-2019” [45] and the study by Liu [39], it is known that when the continuous ventilation time of the room ensures that the value of VOA exceeds 70% (i.e., VOA > 70%), the indoor air quality reaches an acceptable level. The time corresponding to the VOA value of 70%, i.e., TVOA=70%, is the minimum ventilation time that the room should maintain under such conditions.

2.4. Settings

The essential data for computation and the solution settings are presented in Table 1. Convergence of the computational results should be determined by user-defined scale (UDS) iteration <0.0001 and a fluctuation rate of calculation results <5%.
The relationship between wind speed and height above ground is shown by Equation (17), where h represents the height position at the velocity-inlet surface and V 0 is the velocity at this height. The dormitory building is situated in a suburban area, with a roughness index of approximately 0.2. This equation is incorporated into the model through a user-defined function (UDF).
V h = V 0 h h 0 a

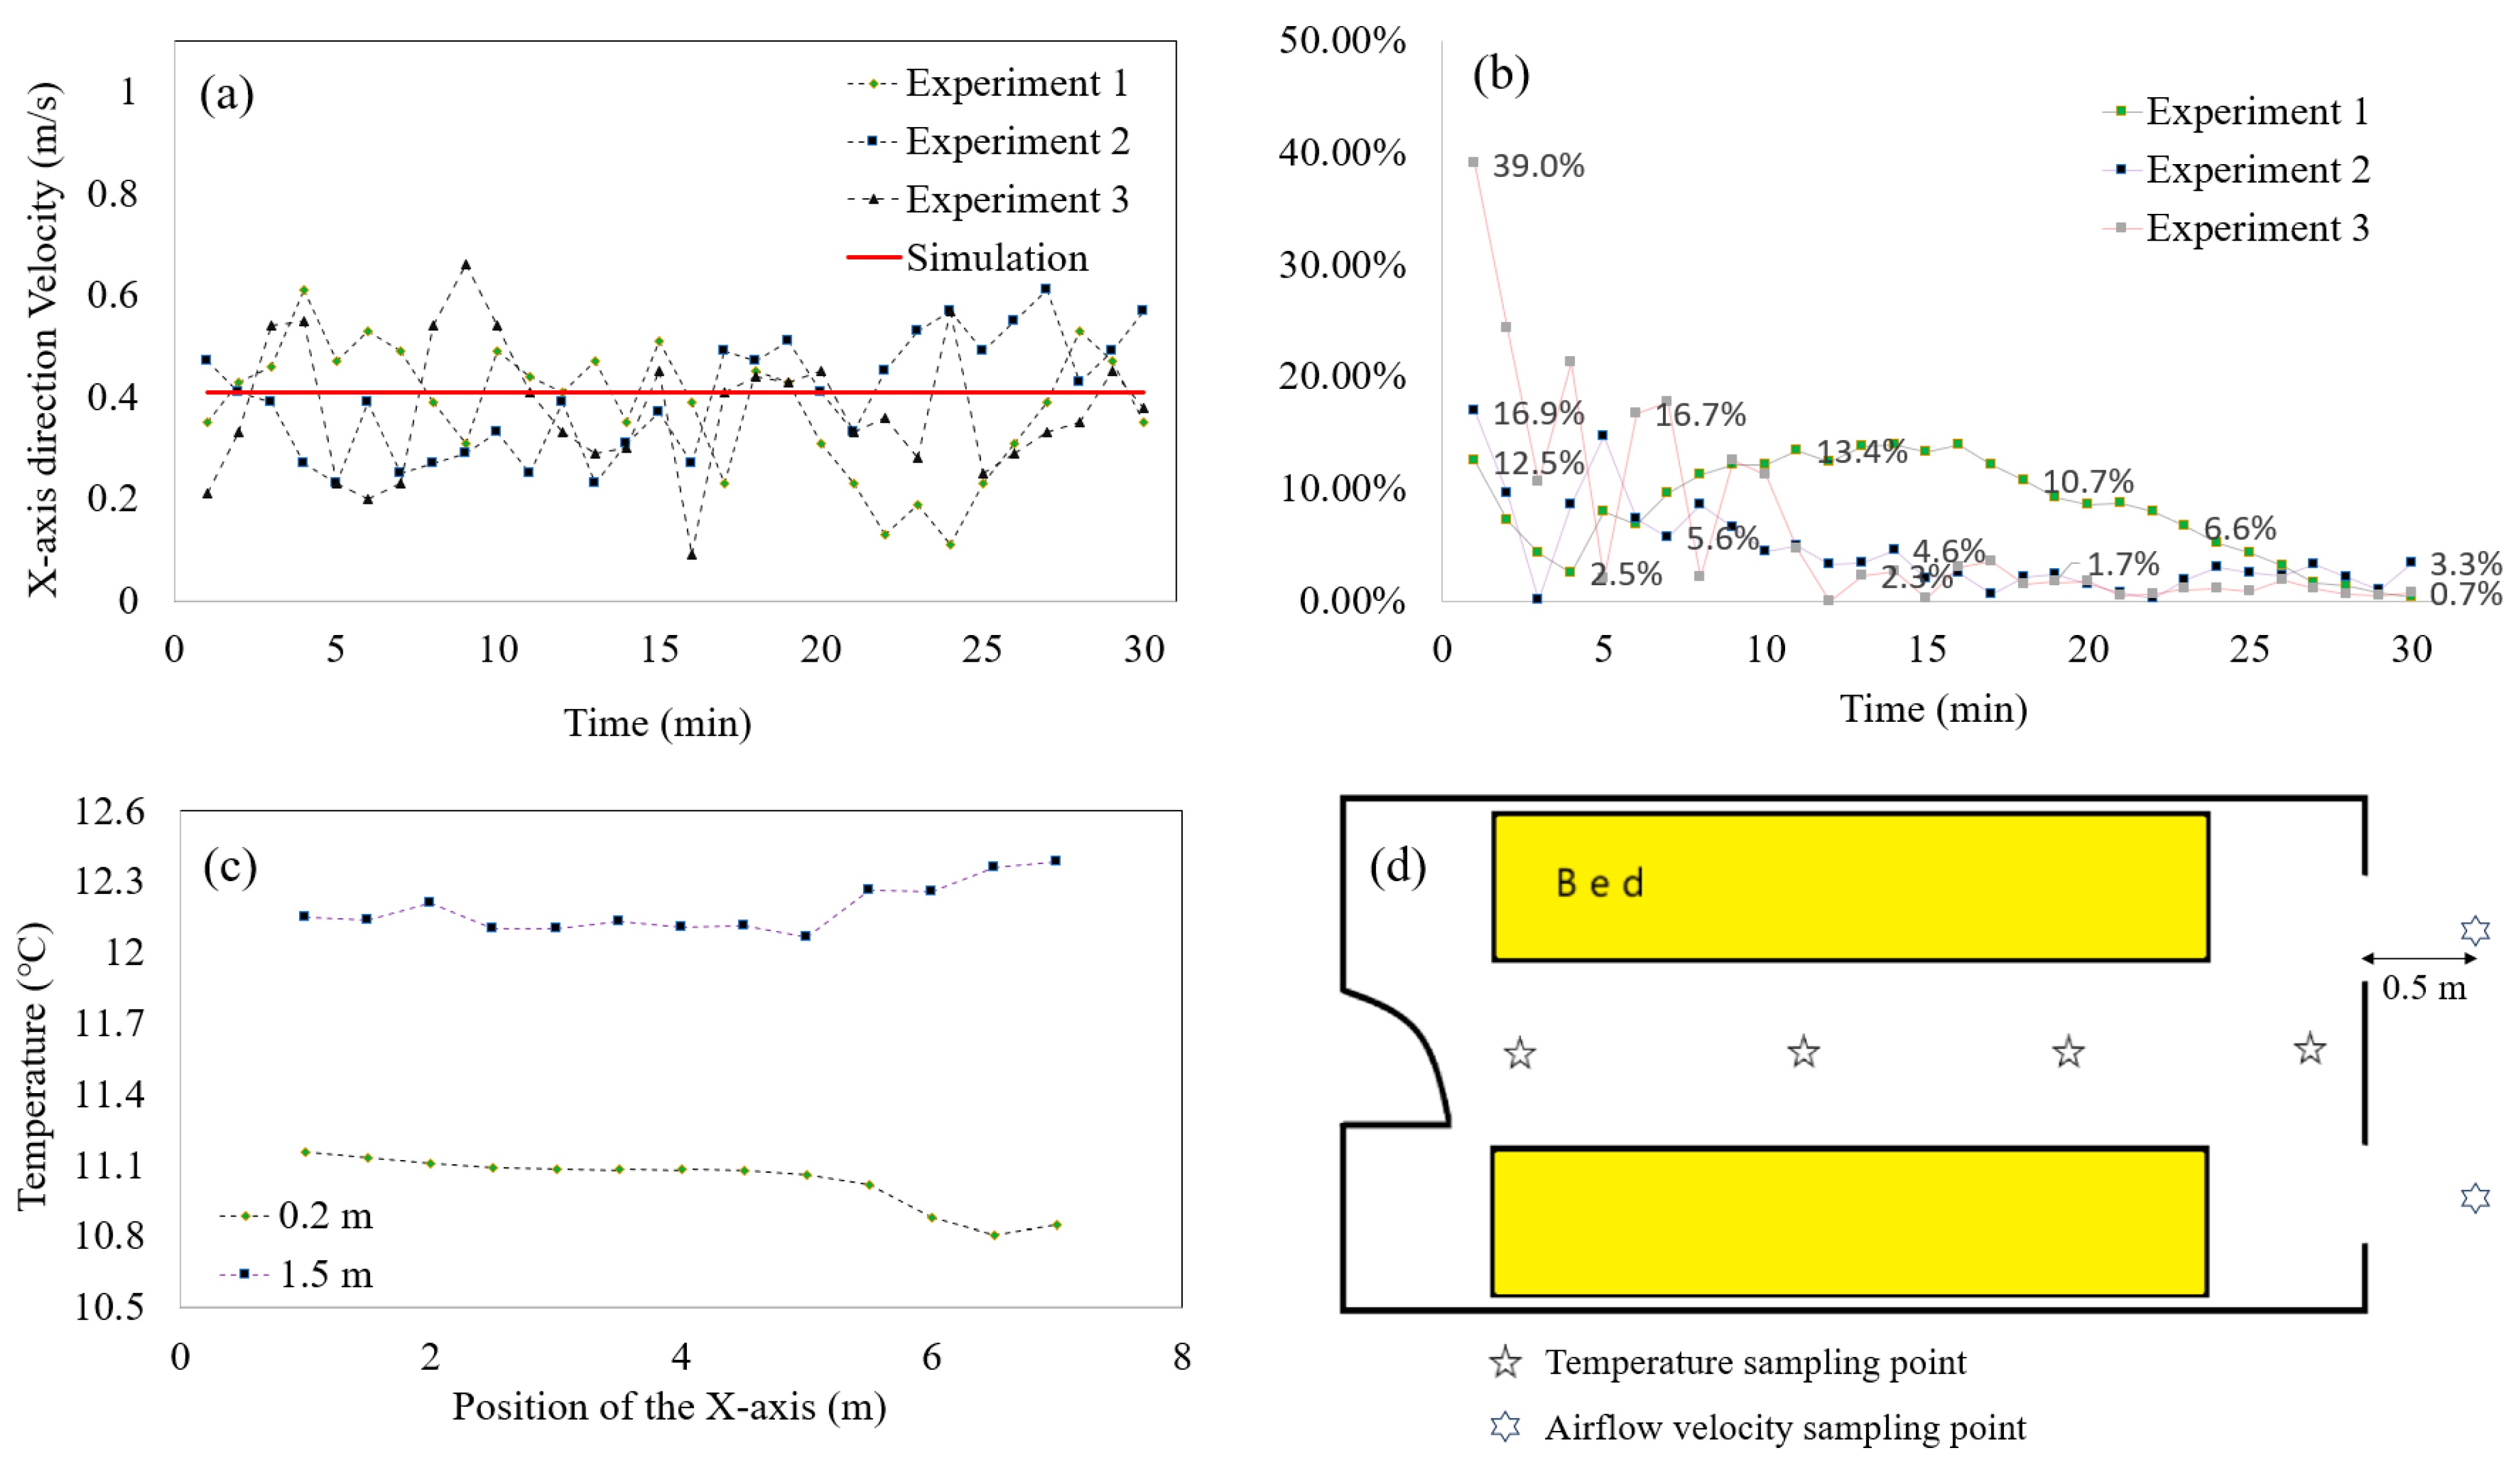
2.5. CFD Verification

The value of the air age is dependent on the velocity of airflow, and validation of the model can be achieved by comparing the velocity of airflow at sampling points [46,47]. The sampling point is set outdoors at 0.5 m from the window. In addition, the indoor temperature is subject to external environmental factors and human body heat, leading to the formation of temperature gradients. We conducted air temperature monitoring at sampling points located at heights of 0.2 m and 1.5 m within the indoor space, from which we obtained the average air temperature for each height. Three sets of validation experiments were conducted on the model, with each set lasting approximately 30 min. Validate the precision of the simulation model through a comparison between the initial simulation data and experimental findings.
The experimental instruments include an anemometer (Brand: Aicevoos; Accuracy ±0.1 m/s) (Brand: Smart-Sensor; Accuracy ±0.02 m/s) and a hygrometer (Brand: Sensirion-sensor; Temperature accuracy: ±0.2 °C). The experiment was conducted starting from 10 May 2023. During the experiment, the air temperature in the outdoor environment was 9 °C, and the average wind speed was 1.8 m/s. The wind direction is perpendicular to the window surface.
The variation of airflow velocity is shown in Figure 3a. To streamline data analysis, we normalized both the collected and simulated data (Equation (18)). The Y value serves as an indicator of the discrepancy between theoretical calculations and actual results across different time periods. As shown in Figure 3b, with an increase in monitoring time, the Y value gradually converges toward zero and exhibits slight fluctuations near the X-axis. In these three experiments, the Y value remained below 5% after a sampling time of 25 min, and the highest Y value was 3.3% at 30 min. Therefore, the discrepancy between experimental and simulated results is acceptable.
Y = i = 1 t i m e = 30 ( V i V ¯ r e l ¯ ) i V ¯
It was recommended that dormitory students remain in bed during the experiments to evaluate the potential impact of student activities on experimental accuracy. Thermometers were positioned at the sampling points depicted in Figure 3d for air temperature measurements. Upon opening the window, the air temperature at a height of 0.2 m in the room rapidly decreased and stabilized after 5 min, with an average temperature of 11.9 °C. Meanwhile, at a height of 1.5 m, the air temperature stabilized after approximately 10 min, maintaining an average temperature of 13.2 °C. The results obtained after the convergence of simulation computations are illustrated in Figure 3c, indicating an average air temperature of 11.0 °C at a height of 0.2 m and 12.3 °C at a height of 1.5 m. Upon comparing experimental and simulated results, it is evident that at 0.2 m from the floor inside the room, there is an absolute error of 0.9 °C between experimental and simulated outcomes. Similarly, at a height of 1.5 m, the absolute error in the obtained results is also 0.9 °C. There are two possible reasons for the error. On the one hand, it is because of unstable outdoor wind force, which leads to differences in air flow inside the dormitory compared to simulation results. On the other hand, students act as heat sources, and their body heat output is also influenced by objective factors such as clothing.
Although variations exist between simulated outcomes and actual measurements, these differences are considered acceptable. Therefore, these simulation settings will be applied in future research endeavors.

2.6. Applicability

The main objective of this article is to establish the correlation between ventilation efficiency in line-type dormitory buildings and outdoor environmental factors (wind direction, wind speed, and air temperature difference). Therefore, the conclusion will be further substantiated by real-time monitoring of indoor pollutant concentrations in this type of dormitory building.
The instruments utilized in these experiments included an air quality monitor (Brand AirNow; Carbon dioxide concentration accurate ±40 ppm; PM2.5 accurate ±10 μg/m3) Thermometer (Brand: Sensirion-sensor; Temperature accuracy: ±0.2 °C) and Anemometer (Brand: Aicevoos; Accuracy ±0.1 m/s). The instrument is positioned at the center of the room [2,15], and its results will be presented in the Section 4.

3. Results and Discussion
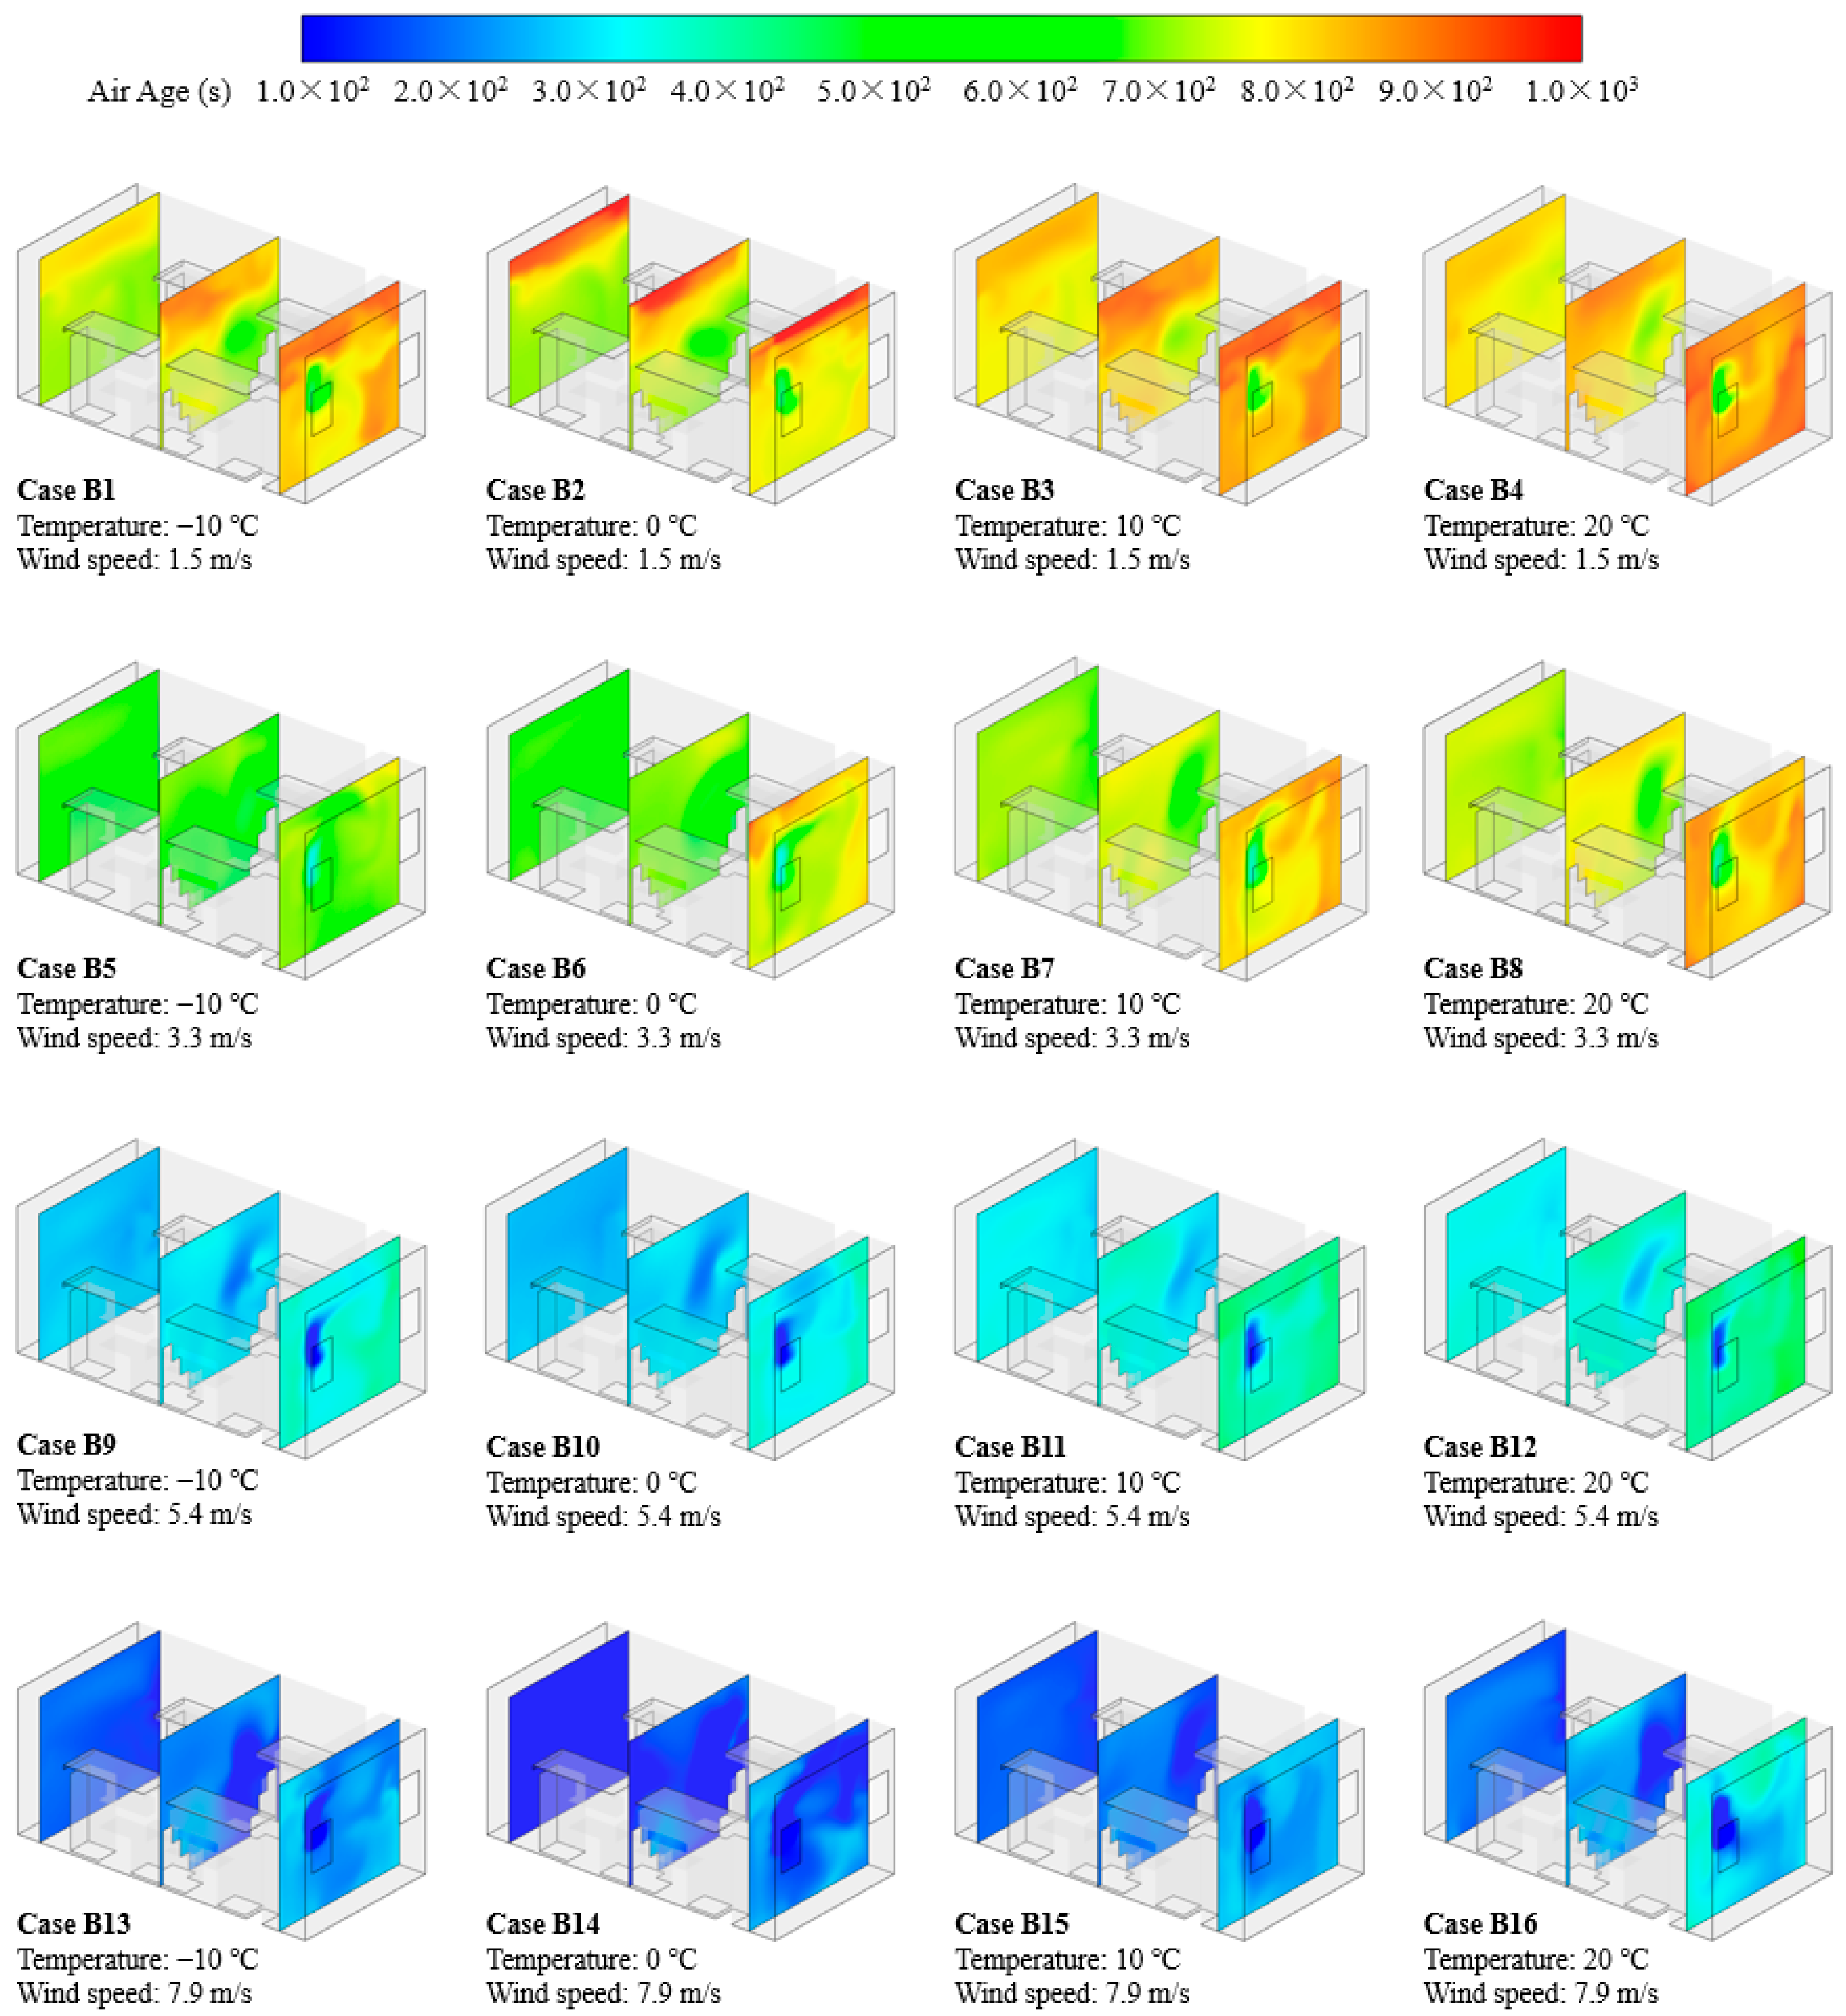
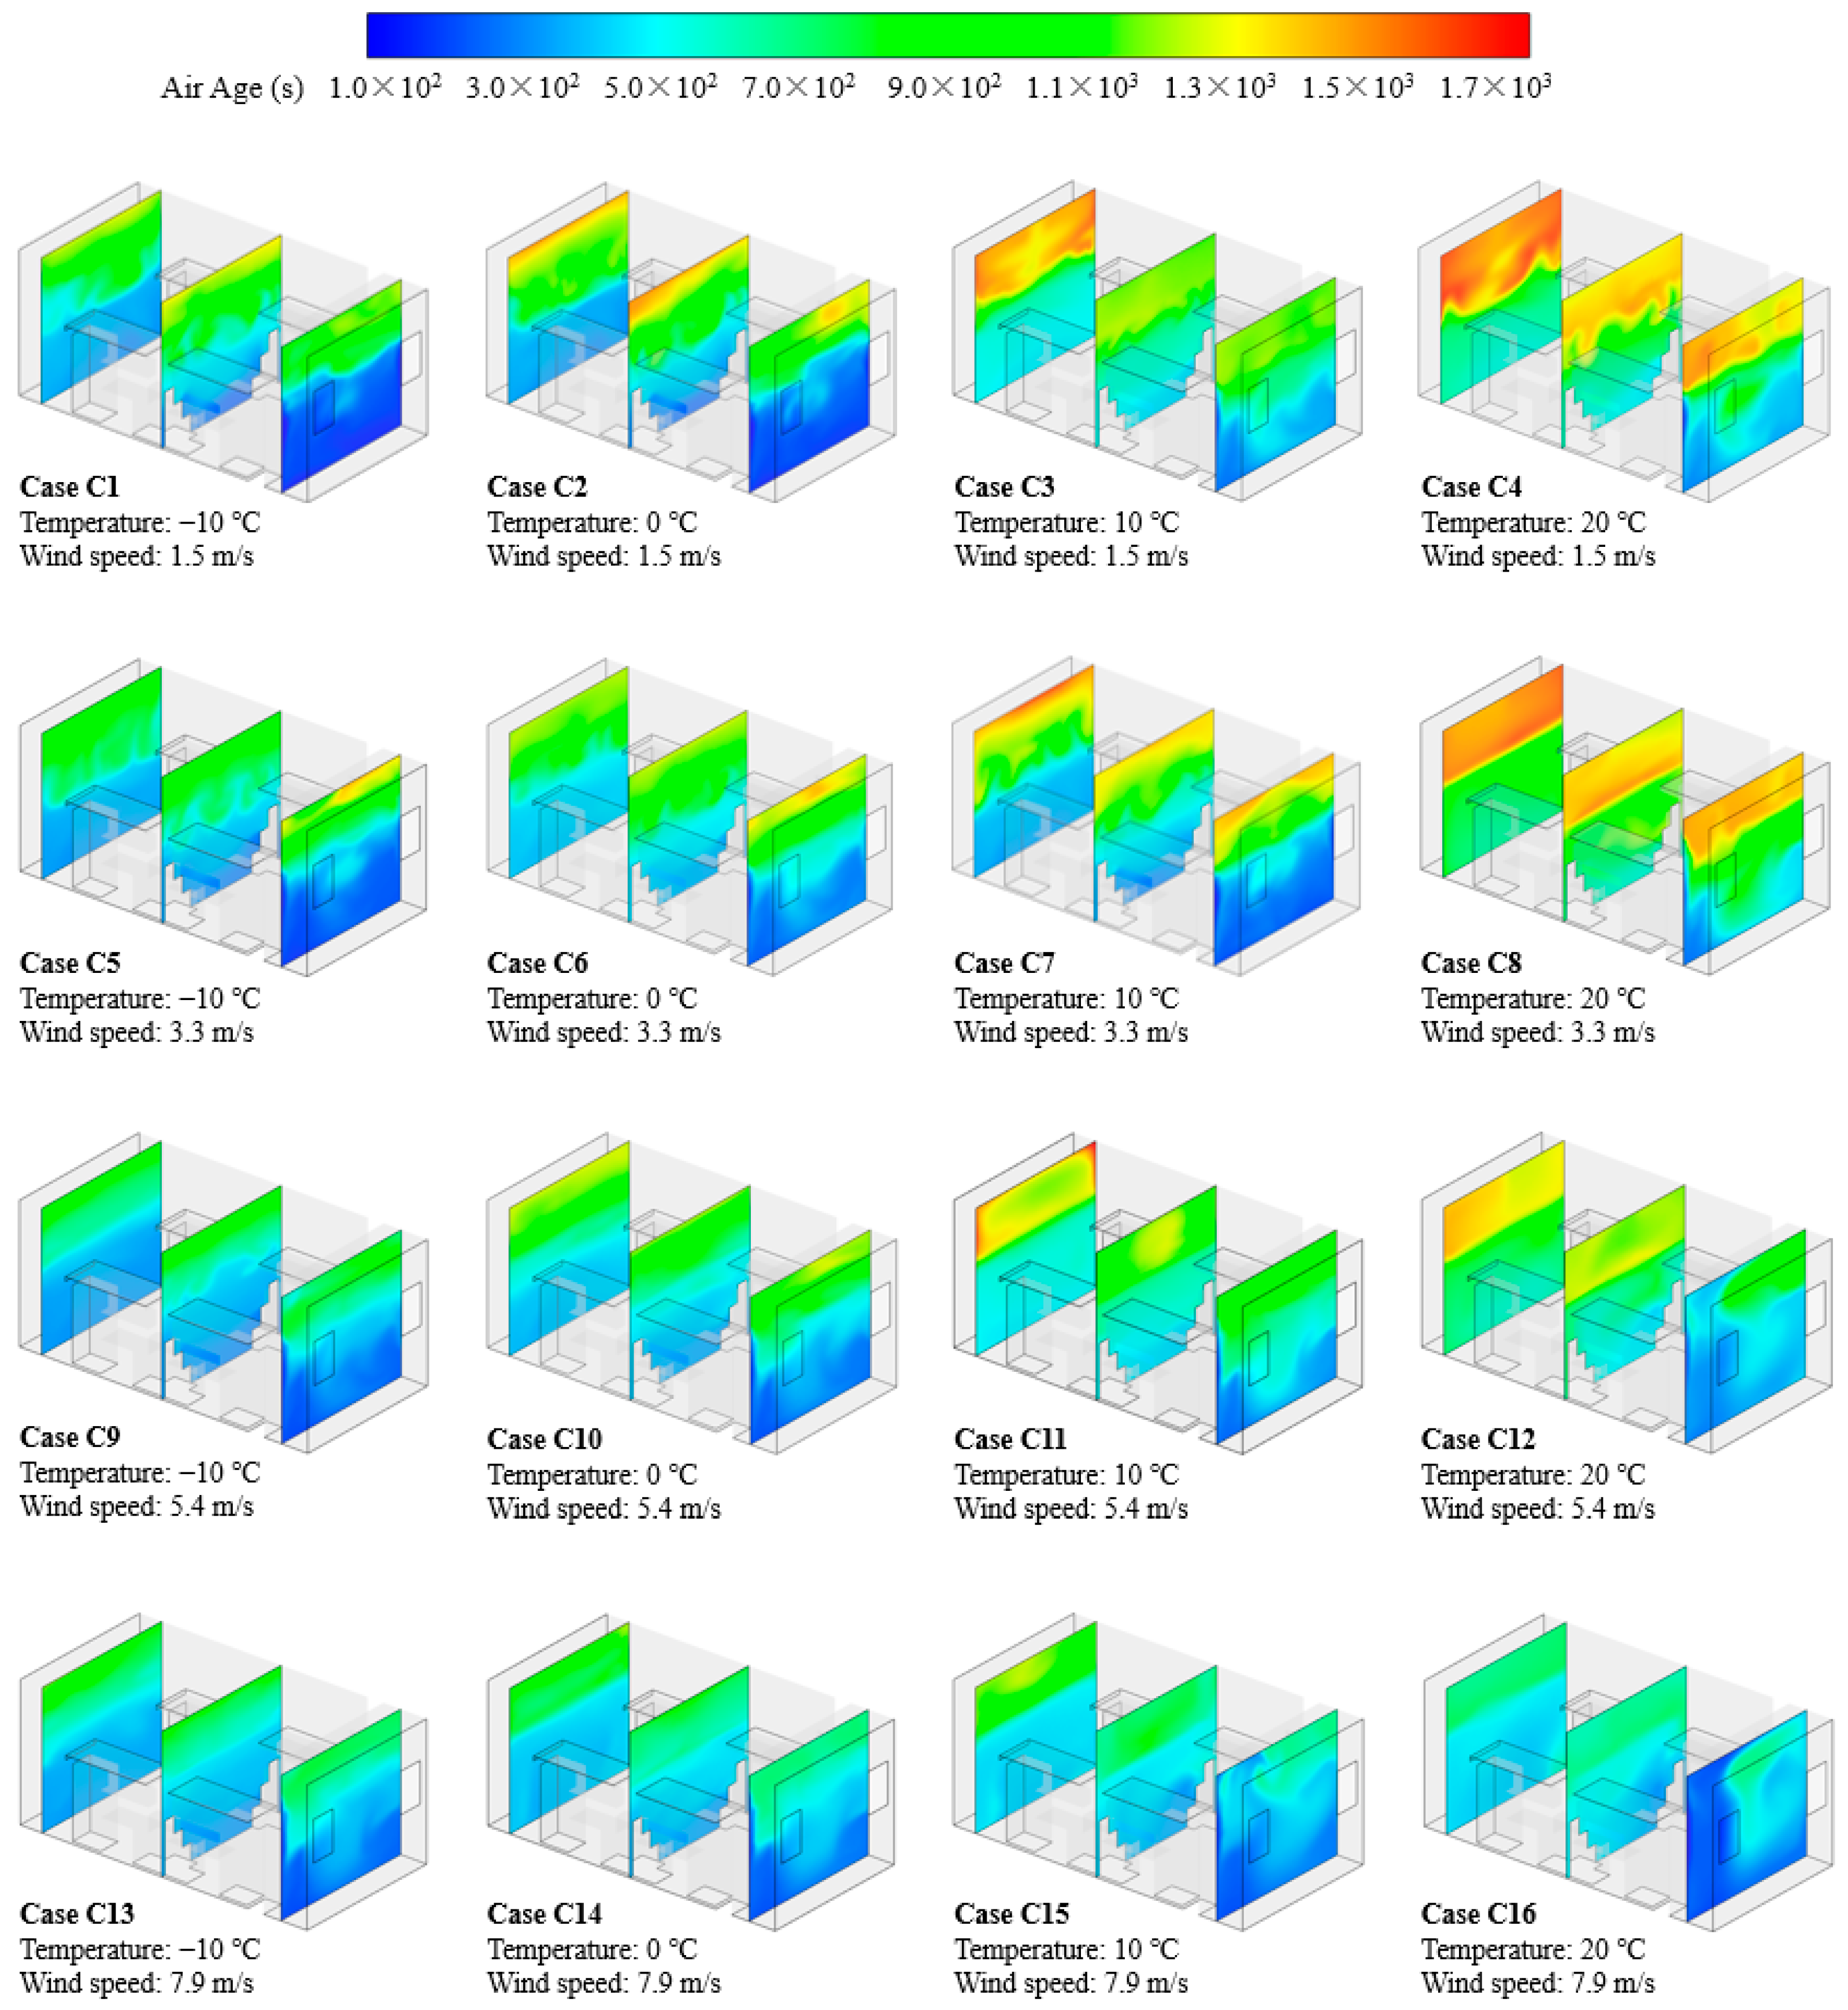
Under varying wind directions, the primary factors that facilitate the movement of indoor air particles will also change. The simulated cloud maps and the numerical values were combined to summarize and analyze all cases.

3.1. Phenomena

The cloud maps were created to show air age distribution based on different wind directions to help readers visually understand the air age distribution in the room. The selected section is the Z-Y plane, with positions at X = 0.5 m, 3.5 m, and 6.5 m. The impact of buildings on environmental airflow is not the focus of this study; therefore, the flow field cloud map of the entire environment will not be displayed. This part of the work calculated a total of 48 cases and fitted the VOA change curve of each case using the polynomial fitting method.
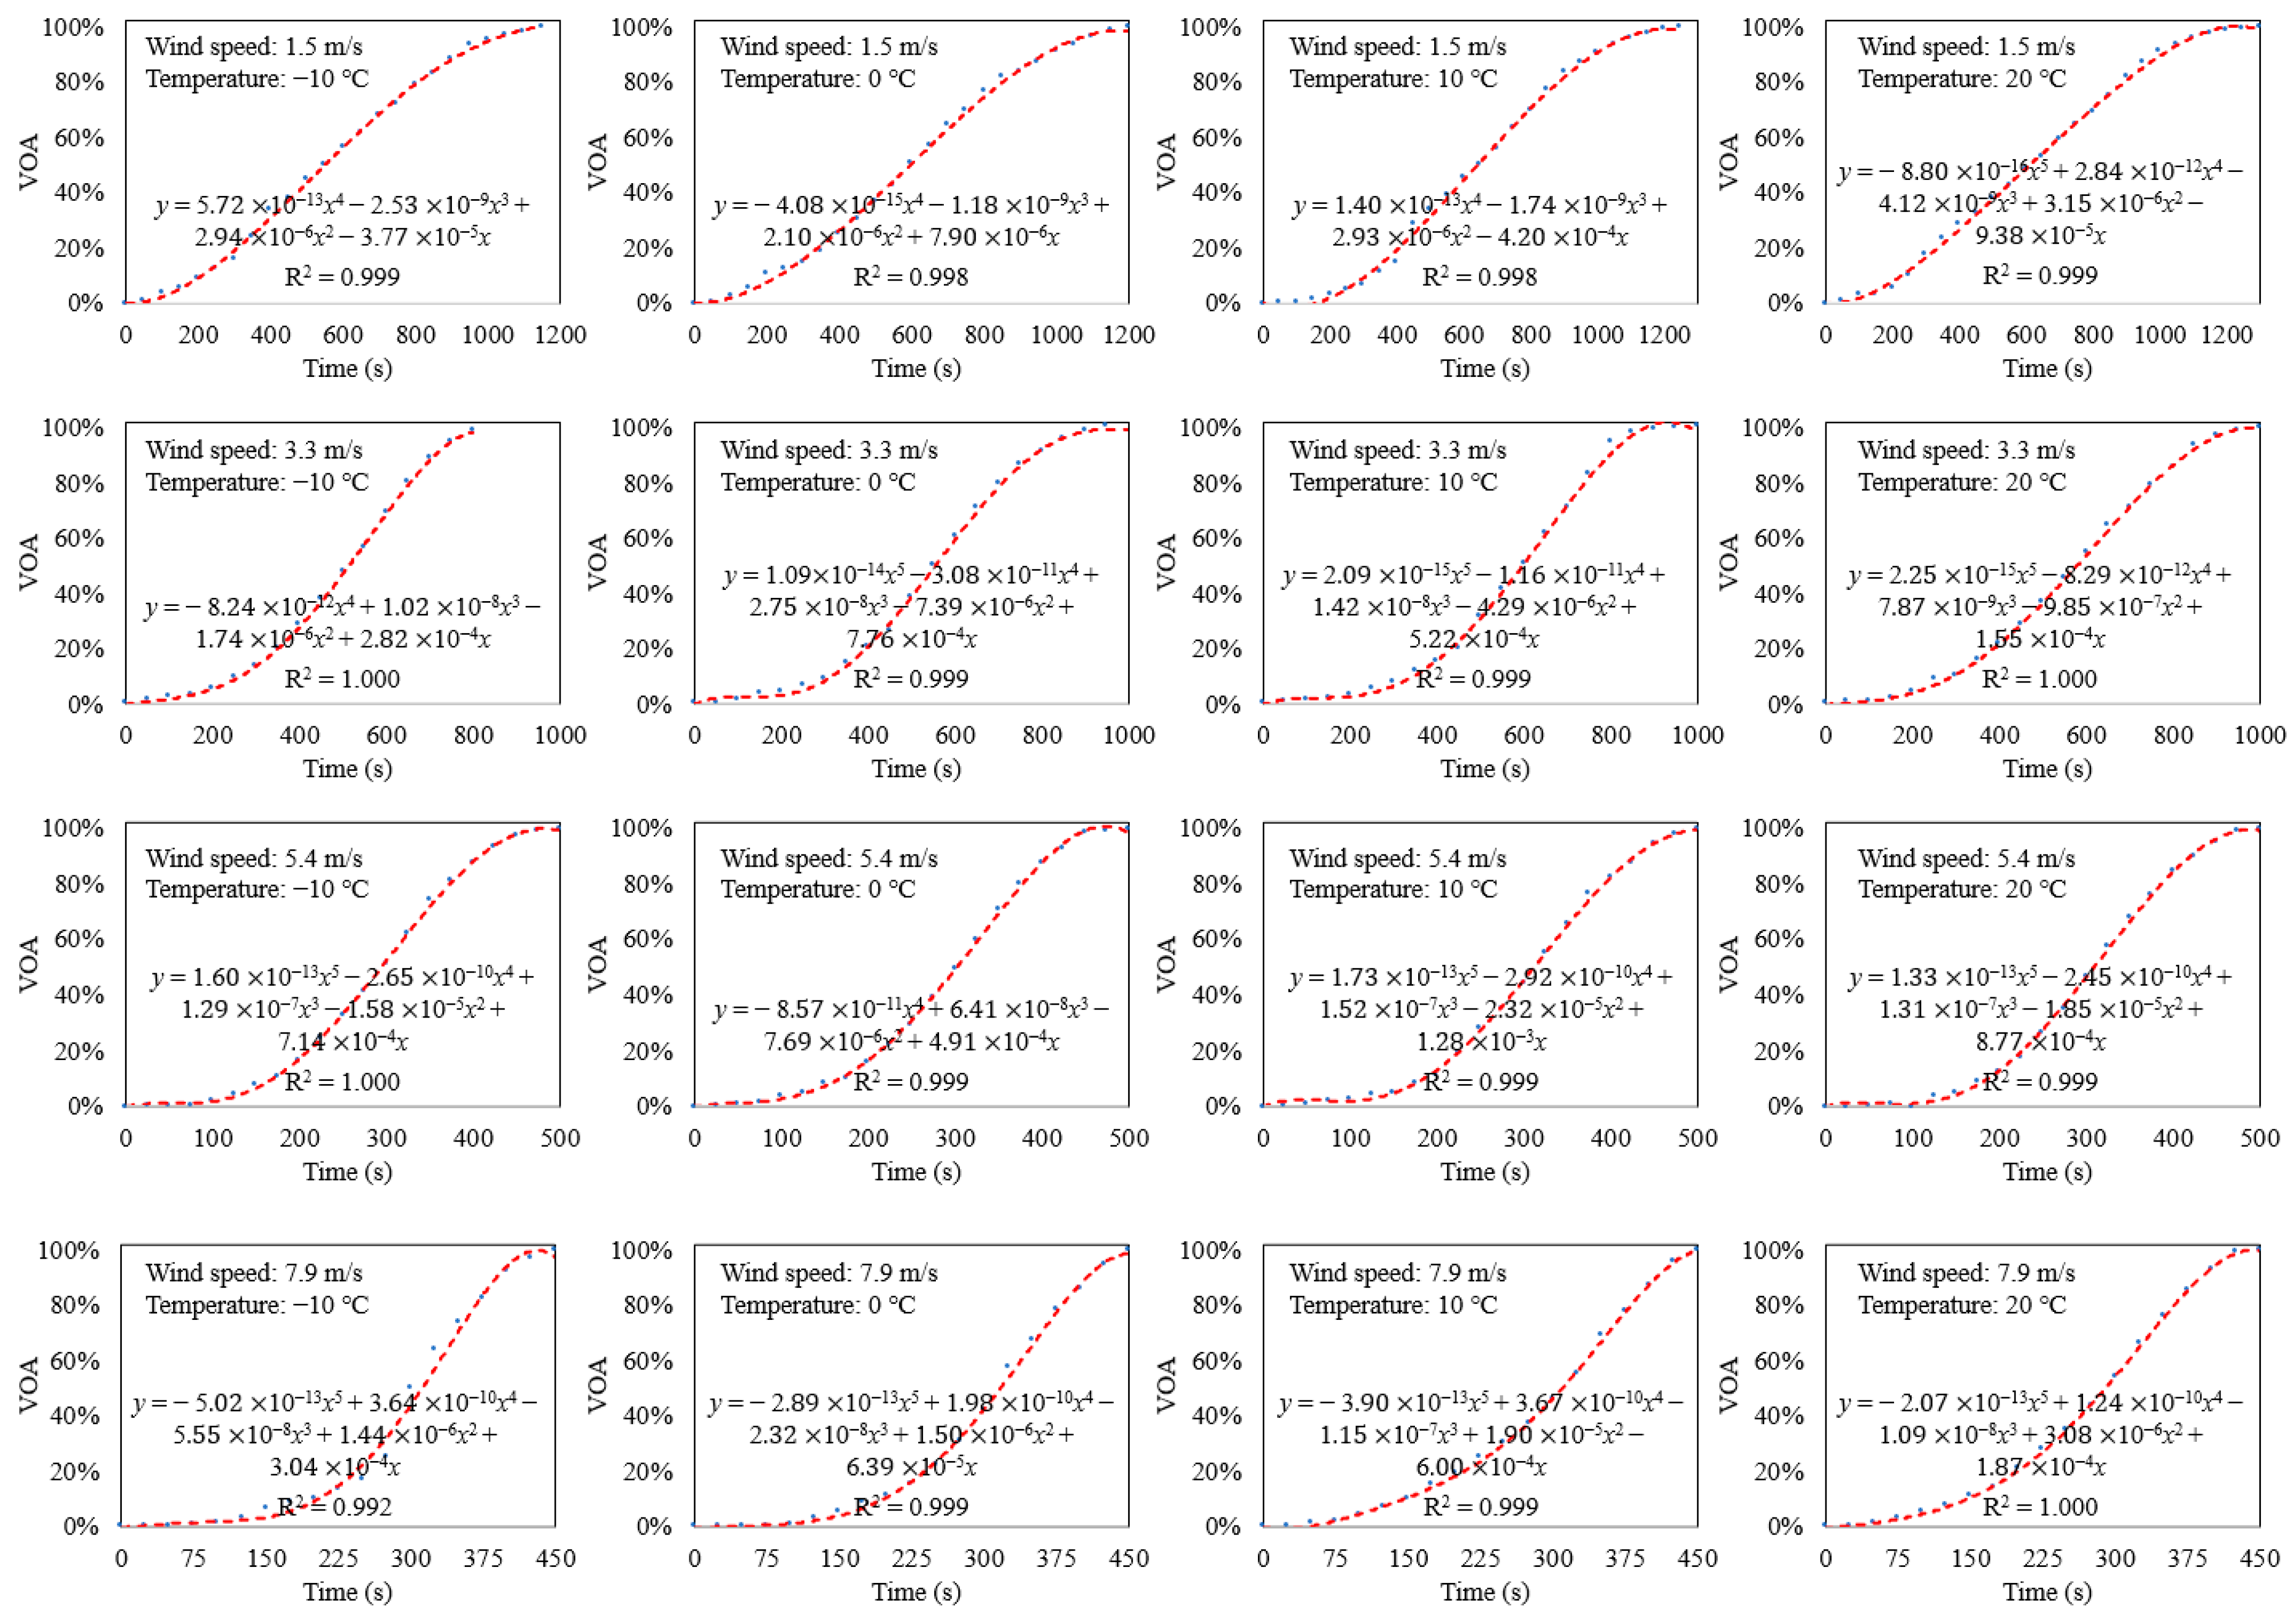
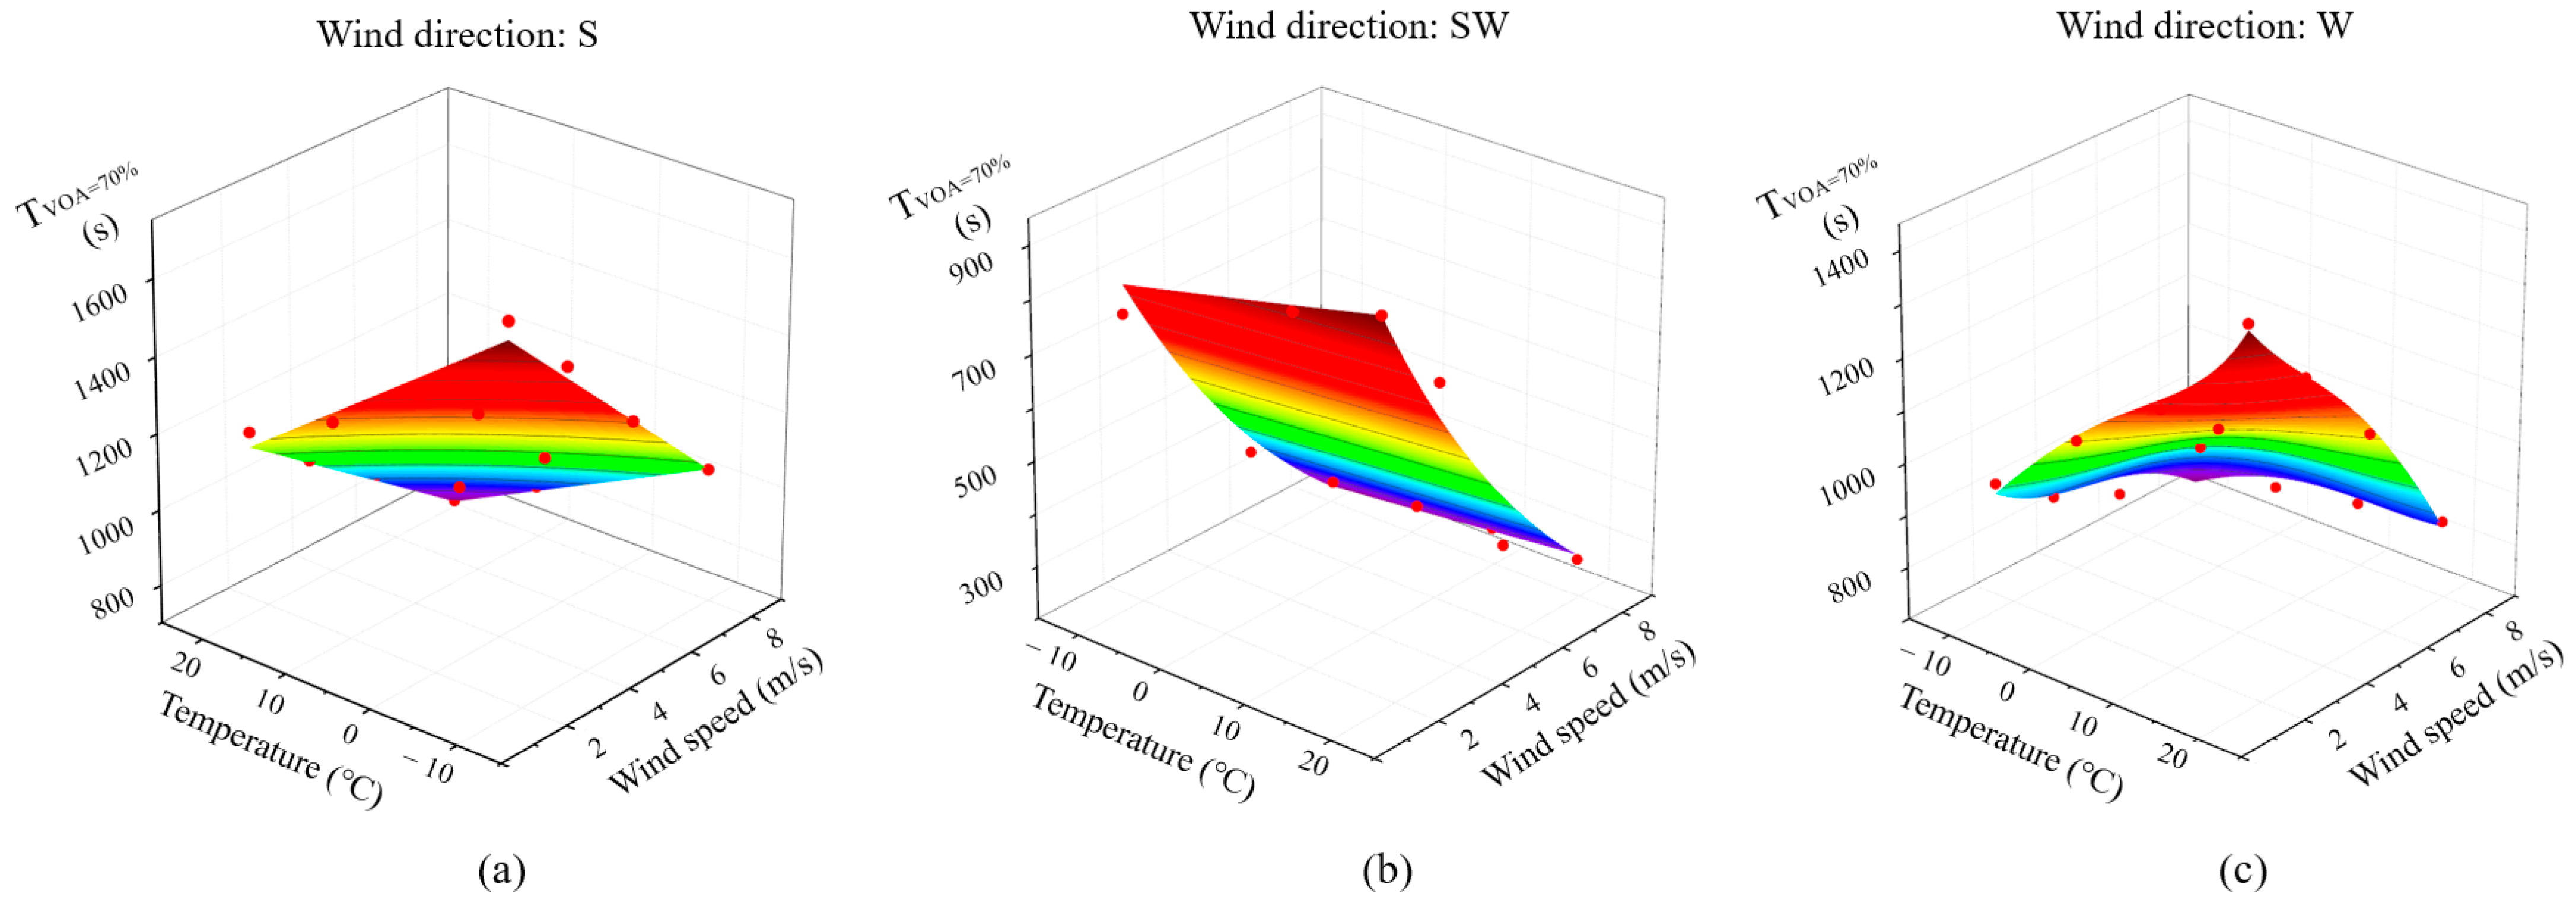
  • Case 1 S Wind Direction
The impact of wind force on the indoor airflow field involves two primary aspects. Firstly, as the ambient wind speed increases, a pressure gradient is created, leading to a decrease in air pressure outside the window, resulting in an outward flow of indoor air. Secondly, although the environmental wind direction is parallel to the window surface, the outdoor airflow is influenced by the dormitory building, generating a component of airflow that tends toward the X-axis direction. The airflow entering the room can promote the movement of indoor air particles, thereby enhancing turbulence intensity inside the room. As shown in Figure 4, when the temperature difference between indoor and outdoor air is constant, the increase in wind speed leads to a gradual increase in the gradient difference in indoor air age on the horizontal plane. The air age value shows a positive correlation with the vertical distance between the air particle and the window surface. Additionally, from Figure 4, it is evident that when wind speeds reach 5.4 m/s and 7.9 m/s, the longitudinal gradient difference of air age gradually decreases. This phenomenon indicates that the indoor flow field’s enhanced intensity under the influence of wind and the airflow toward the X-axis direction plays a significantly dominant role in the indoor flow field.
In this wind direction, the air temperature difference between indoors and outdoors is another crucial factor influencing dormitory ventilation. Firstly, due to the influence of temperature, the indoor air pressure exceeds the outdoor air pressure, causing indoor air to gradually flow toward the outside under the effect of pressure. Secondly, there are temperature differences at different heights within the room. As cold air with higher density enters the dormitory from outside, it flows toward the positions closer to the floor upon entering the room. Additionally, with the influx of cold air, the indoor hot air gradually rises due to density effects. Therefore, the indoor temperature is positively correlated with the height above the room floor. Additionally, under the influence of the temperature field, the pressure increases at higher positions within the room. The airflow inside is hindered by the pressure gradient, resulting in a positive correlation between air age and the height above the room floor.
From the three surfaces depicted in Figure 4, it is evident that at wind speeds of 1.5 m/s and 3.3 m/s, there is a significant increase in air age at an indoor height of approximately 2 m or above. The reason is that, due to the longitudinal air pressure gradient indoors, the air at the height above the window stays indoors for a long time. The distribution of outdoor air age under the same air temperature in Figure 4 suggests that when the wind speed reaches 5.4 m/s or above, the longitudinal pressure gradient inside the room gradually weakens due to wind speed influence. In addition, air age is higher in locations further away from the window when the outdoor temperature is 20 °C. This phenomenon can be attributed to a smaller temperature difference between indoor and outdoor air, resulting in a less pronounced settling of airflow and a decrease in the temperature gradient difference of indoor air. Under the influence of wind, it is beneficial for indoor air particles to leave the indoor flow field.
Table 2 shows the time required for indoor natural ventilation with VOA = 70% under different wind speeds and outdoor temperature when the wind direction is S. Through a comprehensive analysis of the impact of wind speed and air temperature difference on natural ventilation in the room; it can be found that an increase in wind speed and air temperature difference has different promotion effects on indoor ventilation efficiency. Based on the calculation results, when the wind speed is 1.5 m/s or 3.3 m/s, the relationship between outdoor temperature and TVOA=70% can be described as a concave function. While the outdoor wind speed is equal to or greater than 5.4 m/s, The relationship between outdoor temperature and TVOA=70% is a convex function. Therefore, it can be inferred that under this wind direction, when the wind speed is below 3.3 m/s, the influence of air pressure gradient due to indoor-outdoor temperature difference on indoor ventilation is more significant. While the wind speed increases, the enhancing effect of air temperature difference on indoor ventilation will diminish. Under the same outdoor temperature, an increase in wind speed results in a gradual decrease in TVOA=70%; however, the rate of TVOA=70% decrease gradually slows down.
Figure 5 depicts the VOA curve and its fitting equation. In order to facilitate the description of the variation pattern of the VOA curve, the rapidly growing part of the curve is defined as the growth area, the steadily rising part of the curve is approximated as a linear area, and the slowing-down part of the curve is defined as the decline area (as shown in Figure 2). By comparing the variation patterns of VOA curves at identical outdoor temperatures, it can be observed that as the wind speed increases, the slope of the linear area of the curve also increases. This suggests that with an increase in wind speed, there is a corresponding improvement in indoor ventilation efficiency. Additionally, when comparing VOA curves at the same wind speed, it is evident that the growth rate of the linear area of the curve remains almost consistent. An increase in outdoor temperature leads to a delayed onset of the growth area within the curve. This phenomenon suggests that the greater the temperature differential between indoor and outdoor air, the more rapid the increase in indoor ventilation efficiency following ventilation initiation. The timing of the growth area occurrence is solely related to the air temperature difference between indoors and outdoors. When the wind speed reaches 7.9 m/s, the growth area of the curve remains close to time = 600 s. Furthermore, the decreasing area of the curve indicates a decrease in indoor ventilation efficiency, and the proportion of this area to the overall curve can reflect the volume ratio of the room with low removal efficiency of indoor air pollutants. In this wind direction, the proportion of the decline area of the curve in all cases is almost consistent.
  • Case 2 SW Wind Direction
Figure 6 illustrates the distribution of air age for three indoor cross-sections under a wind direction at a 45° angle to the window surface. From this figure, it can be observed that the indoor air age distribution is relatively uniform in all cases. The impact of wind force on indoor airflow is highly significant in this wind direction. Upon comparing the effects of changes in wind speed on ventilation efficiency under the same air temperature, it becomes evident that an increase in wind speed significantly reduces the value of indoor air age. The airflow enters the room through windows near the Y-axis and is influenced by the room walls, resulting in counterclockwise circulation within the room and being discharged through another window. The reason for the indoor circulation is that the airflow entering the room from the window near the Y-axis changes direction under the influence of the wall, resulting in the flow velocity of the airflow not decreasing rapidly. Therefore, the air pressure gradually increases in the positive direction of the Z-axis, resulting in a flow of indoor air out of the window near the X-axis. As a result, a significant gradient in air age near the X-axis window is evident, with higher air ages observed in most areas of the section close to the window.
Table 3 presents the time required for indoor natural ventilation to achieve a VOA value of 70% under different wind speeds and outdoor temperatures, with a wind direction of SW. It is observed that when the ambient wind speed reaches 5.4 m/s, the TVOA=70% values for different temperatures are nearly identical under the same wind speed. The impact of indoor and outdoor temperature differences on ventilation efficiency is noticeable only when the wind speed is below 3.3 m/s. Thus, under this wind direction, as outdoor wind speeds increase, the influence of indoor and outdoor temperature differences on room ventilation efficiency diminishes. Furthermore, at a wind speed of 1.5 m/s, elevated areas in rooms of Case B1 and Case B2 exhibit higher air ages. This is attributed to the influence of air temperature, causing increased air pressure at higher positions, hindering longitudinal airflow movement. As the wind speed increases to 3.3 m/s or above, indoor air circulation accelerates, and the vertical distribution of indoor air age gradually becomes more uniform.
The VOA curves are depicted in Figure 7. Analyzing the trend of changes in the linear area of the curve reveals that as wind speed increases, the growth amplitude of the linear area gradually intensifies. This suggests a positive correlation between indoor ventilation efficiency and wind speed. In this wind direction, the proportion of the decline area of the curve is higher than that observed in the other two investigated wind directions. It can be inferred that an increase in indoor airflow velocity can generate vortices near certain corners, potentially leading to the entrapment of air particles within this area for an extended period.
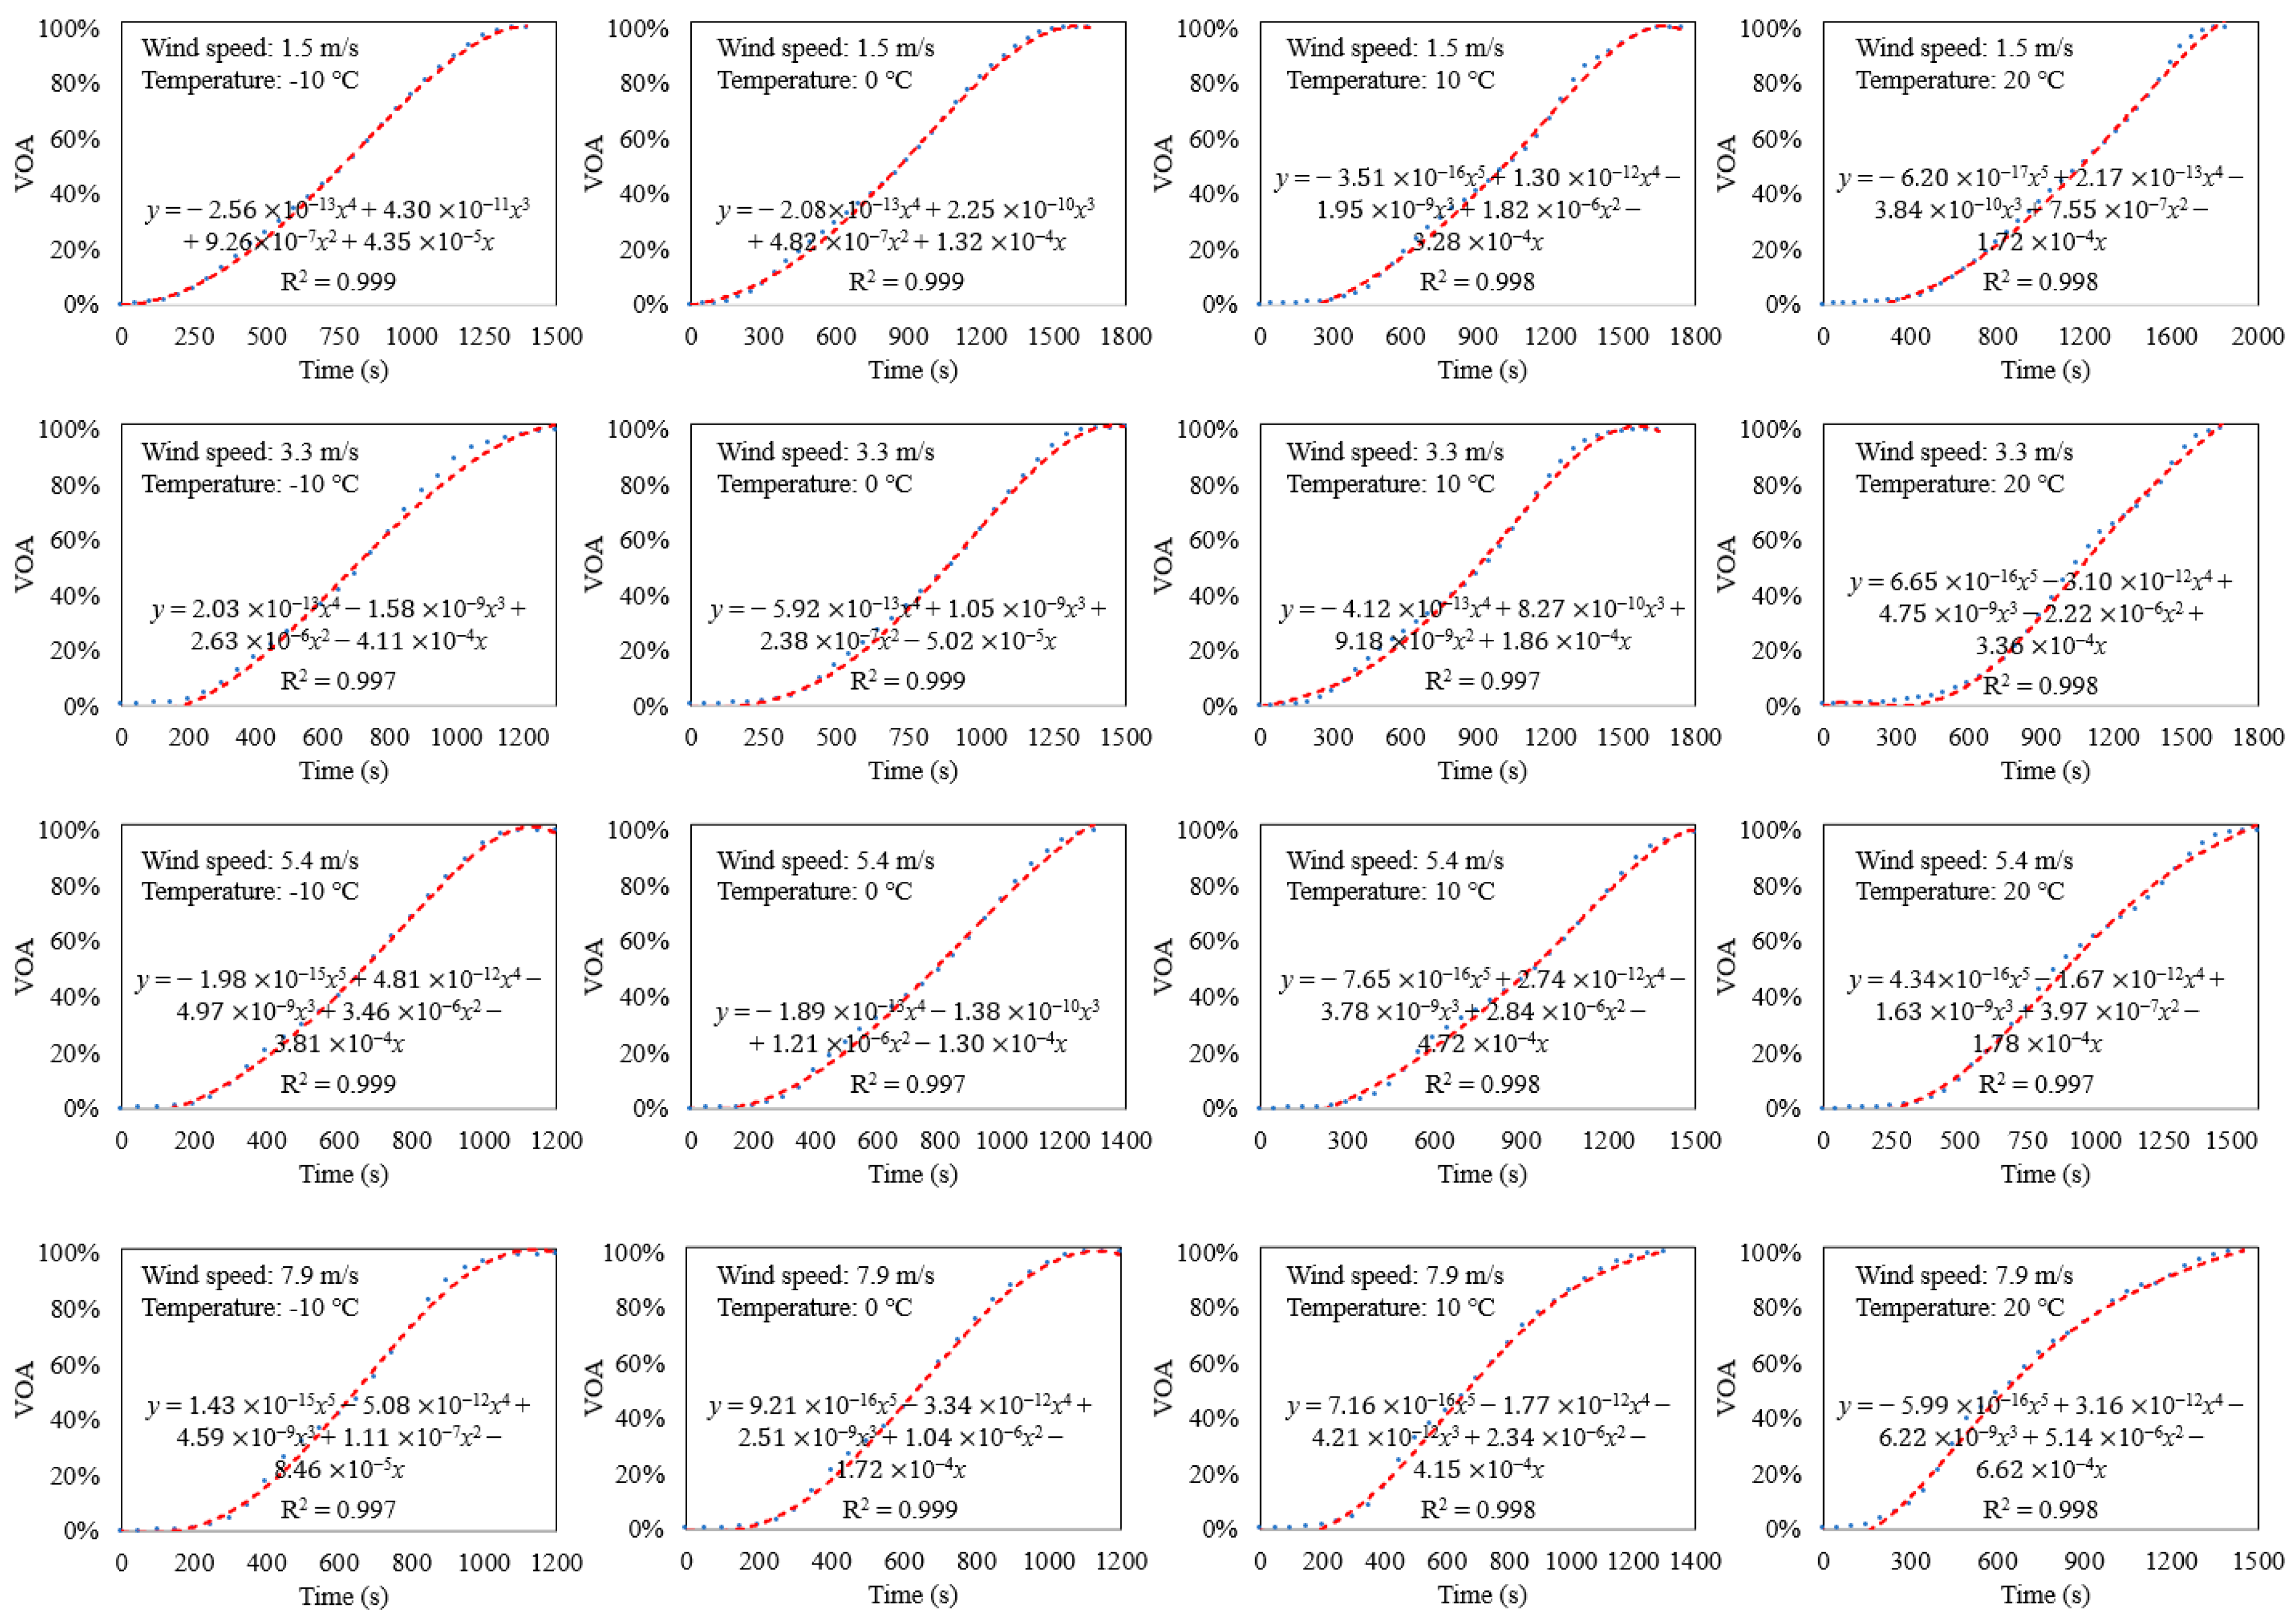
  • Case 3 W Wind Direction
Figure 8 illustrates the distribution of air age across three sections within a room under a perpendicular wind direction relative to the window surface. The influence of temperature on indoor air age is analogous to that of the south (S) wind direction. Outdoor cold air, with higher density than indoor air, flows toward lower positions inside the room upon entering. Consequently, air particles near the ground in the room move faster and exhibit a shorter air age. The air pressure generated by the temperature field increases with height, while the intensity of the flow field gradually decreases under the influence of the longitudinal pressure gradient. Therefore, it can be observed from Figure 8 that there is a positive correlation between air age and indoor height.
The impact of wind on the indoor flow field is manifested in several aspects. Firstly, when students open the windows, outdoor air enters the dormitory under the force of the wind. Due to the symmetrical structure of the XY plane of the dormitory, even in strong outdoor wind conditions, the indoor airflow field can remain relatively stable. Secondly, the dormitory building influences the direction and velocity of outdoor airflow, resulting in an increase in air pressure around its windward side. This air pressure impedes the airflow to the room.
The time values corresponding to VOA = 70% are presented in Table 4. There is a significant positive correlation between indoor ventilation efficiency and both wind speed and temperature difference. The analysis of wind force indicates that the increase in air pressure inside the dormitory will hinder the movement of indoor air particles toward the outside. However, under the influence of the temperature field, the interaction between cold and hot air in the room during natural ventilation will promote the air particles to be driven by thermal pressure. Therefore, even though indoor air is obstructed by outdoor high-pressure zones during flow, it can still effectively interact with outdoor air. While ensuring indoor air quality, the rate of change in the time required for achieving optimal ventilation at different temperatures gradually decreases with the increase in wind speed. This suggests that the impact of thermal pressure on air inflow is gradually diminishing, while the driving effect of wind force on airflow will gradually play a dominant role in indoor air exchange.
The VOA curves for all cases in this wind direction are illustrated in Figure 9. When the outdoor wind speed remains constant, an increase in the air temperature difference between the indoor and outdoor environments leads to a positive shift of the growth area of the curve along the X-axis. However, when the outdoor wind speed exceeds 5.4 m/s, the influence of the temperature difference on the growth area curve becomes negligible. This indicates that wind speed plays a primary role in determining indoor ventilation efficiency when it reaches or surpasses 5.4 m/s. Additionally, with a constant temperature differential between indoor and outdoor environments, an increase in outdoor wind speed results in a higher slope of the linear segment of the curve. This suggests that indoor ventilation efficiency improves with higher wind speeds. Furthermore, as the wind speed reaches 7.9 m/s, there is a greater proportion of decline area in the curves. This indicates that while an increase in wind speed can decrease the time required for indoor pollutant removal, it can also have adverse impacts on overall decontamination due to the influence of indoor airflow.

3.2. Equations

This study on natural ventilation in dormitories incorporates wind speed and temperature as independent variables in the outdoor environment, with the TVOA=70% as the dependent variable. The obtained conclusion of ventilation time under three different wind directions can be utilized to construct a respective three-dimensional surface equation. The X-axis represents the temperature value, the Y-axis represents the wind speed value, and the Z-axis represents the minimum time that ventilation should be maintained.
When the wind direction is S, the fitting plane formed by the data is similar to a Gaussian surface. Equation (19) can be derived by simplifying the surface equation. The final fitted surface obtained is shown in Figure 10a.
Z = a + e b × x × y + c × x + d × y + f × x × y
The value of ‘a’ is 1428.88 ± 23.20, ‘b’ is 1476.82 ± 1.49, ‘c’ is 18.62 ± 1.89, ‘d’ is −76.11 ± 4.54 and ‘f’ is −0.91 ± 0.37. The R2 of the fitted surface is 0.98.
When the wind direction is SW, there is a small difference in the temperature axis, while the difference in the wind speed axis follows an exponential relationship. Therefore, sampling using the fitting surface method should follow the exponential distribution. The corresponding fitting surface can be seen in Figure 10b.
Z = a + b × e x / c × e y / d
The value of ‘a’ is −211.59 ± 357.93, ‘b’ is 1289.77 ± 306.62, ‘c’ is −291.11 ± 182.41, and ‘d’ is 7.71 ± 3.77. The R2 of the fitted surface is 0.95.
When the wind direction is W, the data distribution method is more appropriate for fitting the rational 2D equation. The surface of data fitting can be observed in Figure 10c.
Z = a + a 1 × x + b 1 × y + b 2 × y 2 + b 3 × y 3 1 + a 2 × x + a 3 × x 2 + + a 4 × y 3 + b 4 × y + b 5 × y 2
The fitting results indicate that ‘a’ is 1221.966 ± 79.48, ‘a1’ is −16.21 ± 8.85, ‘b1’ is −223.50 ± 215.03, ‘b2’ is 43.95 ± 46.88, and ‘b3’ is −2.30 ± 2.14; the value of ‘a2’ and ‘a3’ less than 1 × 10⁻⁴ can be omitted; ‘b4’ is −0.10 ± 0.14 and ‘b5’ is 0.02 ± 0.02. The R2 of the fitted surface is 0.97.
By employing 3D surface equations, the assessment of indoor ventilation efficiency can be conducted across diverse ambient conditions, enabling accurate prediction of the minimum duration necessary for achieving optimal indoor air exchange.
The VOA curve represents the process of reducing the volume of areas with indoor air pollution, while indoor carbon dioxide concentration, serving as an indicator of air quality, often reflects the overall level of indoor air pollution. Although these two methods of evaluating indoor air quality have different emphases, based on the definition of air age, it can be inferred that the removal rate of indoor carbon dioxide should be approximately equal to the numerical values of VOA. According to the actual situation, the growth rate of indoor pollutants is related to the number of students in the dormitory and the movement behavior of students in the dormitory. Therefore, it is imperative to adjust the function in the conclusion when utilizing carbon dioxide concentration as a metric for assessing indoor air pollution.
f t = Z × ( C i n i t i a l + n × 0 t 0.02 × 1.964 × 10 6 V d o r m × 3600 d t × η ) C i n i t i a l
Among them, ‘ C i n i t i a l ’ represents the initial indoor carbon dioxide concentration. ‘ n ’ represents the number of personnel in the dormitory. ‘ η ’ denotes the correction coefficient for the respiratory intensity of personnel (generally assumed to be η = 1); 0.02 refers to the average hourly exhalation rate of carbon dioxide per individual during steady breathing (m³); 1.964 is the mass of one cubic meter of carbon dioxide (kg). ‘ t ’ represents the duration of time for indoor carbon dioxide concentration to reach stability. The calculated result ‘ f t ’ of the equation indicates the minimum duration required for ensuring adequate indoor ventilation. This equation takes into account the real-time generation of carbon dioxide and ensures that the conclusion is more applicable to real-life scenarios.

4. Tests and Discussion

Based on the formula obtained from the conclusion, we conducted an applicability experiment to validate our research findings. The experimental scenario is shown in Figure 11.
During the experiment, the outdoor carbon dioxide concentration in the area was approximately 370 ppm and particle pollutant concentration was <3 μg/m3. The indoor space has a volume of approximately 85 m3. Table 5 shows the prerequisite conditions for the outdoor environment and the experimental results.
In theory, the average indoor carbon dioxide concentration should reach the value ( C p p m × 70 % ). Where C i n i t i a l represents the concentration of carbon dioxide in the room before ventilation. C s t e a d y represents the value at which the carbon dioxide concentration stabilizes after indoor ventilation.
C p p m = C i n i t i a l C s t e a d y
However, discrepancies exist between experimental results and theoretical predictions. The underlying causes of these differences are as follows. Firstly, the intermittency of the wind may lead to variations in the indoor and outdoor airflow fields. While in this study, simulated wind speeds are considered constant, in reality, wind speeds often fluctuate. Combining with the findings of Mott et al. [48] on the impact of intermittent winds on natural ventilation in rooms, we identify wind speed fluctuations as a major factor causing differences between calculations and actual observations. Secondly, the amount of carbon dioxide exhaled by the human body depends on metabolism, and individual differences may result in variations in carbon dioxide emission rates [49]. Since the carbon dioxide generation rate used in the study is an average value, it may contribute to differences between calculated and measured results.
We monitored the concentration of inhalable particulate matter indoors and observed a fluctuating downward trend in the concentration of indoor particulate pollutants in groups (a), (b), (d), and (f), while the concentration of particulate pollutants in the other three groups remained relatively constant. The concentration of indoor particulate matter is influenced by the deposition of indoor dust and the level of students’ indoor activities. The reduction in inhalable particulate matter concentration can serve as evidence for the efficacy of natural ventilation in enhancing indoor air quality. The variables involved in this experiment are relatively complex, resulting in significant errors in some of the data obtained from the experimental conclusions. Although there were discrepancies between the experimental and simulation results, it is noteworthy that group (d) exhibited the highest deviation of 11.1%, while the absolute error between the conclusions of other experimental groups and theoretical calculations was less than 10%. The overall trend of the experimental results is consistent with relevant conclusions drawn in our current work. Therefore, the conclusions drawn from this study can be considered reliable.
This study presents a systematic analysis of indoor natural ventilation of the room in “line” type dormitory buildings under varying environmental conditions, utilizing the CFD method. This work improves the way Liu [39] and Yang [40] use air age as an indicator to analyze indoor environmental quality and utilizes the widely adopted Rosin-Rammler distribution method in data statistics to fit the proportion curve of indoor air age more conveniently. Moreover, this study facilitates a comparative analysis of indoor air quality under diverse environmental conditions by utilizing the VOA curve proposed in this article.
Currently, airborne diseases continue to pose a significant threat to public health safety [50]. In densely populated areas such as university dormitories, proper ventilation is crucial for maintaining safe indoor pollutant levels. Therefore, this study formulated pollutant removal rate equations for three wind directions, which were subsequently adjusted based on real-world conditions. Consequently, these equations are beneficial for providing recommendations to students when formulating ventilation strategies.
Despite this study combining the analysis of wind environment and building shape to assess the ventilation of dormitories in Northeastern universities and proposing a corresponding relationship equation for “TVOA=70%—outdoor temperature—wind speed”, the research only used four-student rooms as models, excluding the more common six-student rooms in the region. Therefore, whether the conclusions of this study can be applied to the ventilation of six-student dormitories awaits further experimental investigation. Additionally, both the experimental and simulated aspects of this work assumed that windows in nearby rooms of the studied room were closed. The impact of nearby rooms opening windows on the generated airflow field is not clearly defined. Furthermore, as mentioned earlier, environmental wind speed conforms to the power-law equation, meaning that wind speed is positively correlated with environmental height. This paper primarily investigates the natural ventilation of rooms located in the middle of dormitory buildings under various environmental conditions. The relationship between the ventilation efficiency of the room and the height of the room is a topic worthy of future research.

5. Conclusions

This study focuses on dormitories in the Northeast region and conducts a multifactor analysis of variables such as air temperature, wind speed, and wind direction to explore the efficiency of natural ventilation in dormitories. Additionally, functions describing the change in indoor air quality over time are established for different ventilation scenarios. Simulation results reveal that, although wind speed and indoor-outdoor temperature difference are crucial factors in improving indoor ventilation efficiency, wind direction significantly influences the degree to which these factors promote indoor ventilation. Specifically, under a wind direction of 45°, the TVOA=70% for dormitories at different outdoor temperatures stabilizes around 380 s at a wind speed of 5.4 m/s. However, at a wind direction of 0°, even with a wind speed of 7.9 m/s, there is still a noticeable difference in TVOA=70% between rooms at −10 °C and 20 °C, with a difference of 339 s. Therefore, there is a substantial difference in the relationship between outdoor wind speed, temperature, and TVOA=70% under different wind directions. When the wind direction is 0°, the relationship exhibits characteristics of a Gaussian function (Equation (19)). In this case, both wind speed and air temperature difference are considered the main factors promoting indoor ventilation when the wind speed is below 7.9 m/s. When the wind direction forms a 45° angle with the windows, the relationship between wind speed and TVOA=70% follows an exponential pattern (Equation (20)), with the impact of indoor-outdoor temperature difference on natural ventilation being relatively small. For a wind direction angle of 90°, wind-induced airflow causes an increase in air pressure on the windward side of the dormitory building, hindering ventilation to some extent. Therefore, the fitting method for the function is the rational 2D (Equation (21)). Moreover, to ensure the practicality of the conclusions, physical quantities were incorporated into the numerical equation, constructing the equation f(t) (Equation (22)), and validation was performed by monitoring the carbon dioxide concentration in dormitories. The research findings assist students in scientifically formulating ventilation plans and provide valuable insights into the relationship between local architectural design and prevailing winds.

Author Contributions

Y.C.: Formal analysis, Validation, Writing—original draft. M.Y.: review & editing. S.X.: Investigation. J.L.: Investigation. S.Z.: Methodology, Writing—review & editing. All authors have read and agreed to the published version of the manuscript.

Funding

This research received no external funding.

Data Availability Statement

The data that support the findings of this study are available upon reasonable request from the corresponding author. The data are not publicly available due to the potential use of the data in the manuscript for ongoing research.

Acknowledgments

This research was supported by Jilin Provincial Science and Technology Innovation Center of Clean Conversion and High-Valued Utilization of Biomass.

Conflicts of Interest

The authors declare that they have no known competing financial interests or personal relationships that could have appeared to influence the work reported in this paper.

Nomenclature

ρ Density
t Time
u e f f the effective turbulent viscosity
a ε The inverse effective Prandtl numbers
S ε User-defined source term
Y M Contribution of fluctuating expansion to the total dissipation rate
C v 100
μ Coefficient of aerodynamic viscosity of air
S c Schmidt number
Y d Mass fraction
μ t Coefficient of viscosity of air turbulence
d Particle size
k Turbulent energy
ε the turbulent dispassion rate
a k the inverse effective Prandtl numbers for k equation
G b The turbulent kinetic energy produced by buoyancy
S k User-defined source term
G k The turbulent kinetic energy produced by the average velocity gradient
η 0 4.38
y The location of the center of the grid from the wall
u Velocity vector
β 0.012

References

  1. Saeedi, R.; Ahmadi, E.; Hassanvand, M.S.; Mohasel, M.A.; Yousefzadeh, S.; Safari, M. Implemented indoor airborne transmission mitigation strategies during COVID-19: A systematic review. J. Environ. Health Sci. Eng. 2023, 21, 11–20. [Google Scholar] [CrossRef]
  2. Xu, L.; Hu, Y.; Liang, W. Subjective and objective sensory assessments of indoor air quality in college dormitories in Nanjing. Build. Environ. 2022, 212, 108802. [Google Scholar] [CrossRef]
  3. Yang, Z.; Shen, J.; Gao, Z. Ventilation and Air Quality in Student Dormitories in China: A Case Study during Summer in Nanjing. Int. J. Environ. Res. Public Health 2018, 15, 1328. [Google Scholar] [CrossRef]
  4. Liu, L.; Wang, L.; Zhang, Y.; Dong, B.; Song, B. Study on Ventilation Rates at University Dormitories in Winter. Procedia Eng. 2015, 121, 743–748. [Google Scholar] [CrossRef]
  5. Fisk, W.J.; Black, D.; Brunner, G. Changing ventilation rates in U.S. offices: Implications for health, work performance, energy, and associated economics. Build. Environ. 2011, 47, 368–372. [Google Scholar] [CrossRef]
  6. Sarkhosh, M.; Najafpoor, A.A.; Alidadi, H.; Shamsara, J.; Amiri, H.; Andrea, T.; Kariminejad, F. Indoor Air Quality associations with sick building syndrome: An application of decision tree technology. Build. Environ. 2020, 188, 107446. [Google Scholar] [CrossRef]
  7. Surawattanasakul, V.; Sirikul, W.; Sapbamrer, R.; Wangsan, K.; Panumasvivat, J.; Assavanopakun, P.; Muangkaew, S. Respiratory Symptoms and Skin Sick Building Syndrome among Office Workers at University Hospital, Chiang Mai, Thailand: Associations with Indoor Air Quality, AIRMED Project. Int. J. Environ. Res. Public Health 2022, 19, 10850. [Google Scholar] [CrossRef]
  8. Hou, J.; Sun, Y.; Dai, X.; Liu, J.; Shen, X.; Tan, H.; Yin, H.; Huang, K.; Gao, Y.; Lai, D.; et al. Associations of indoor carbon dioxide concentrations, air temperature, and humidity with perceived air quality and sick building syndrome symptoms in Chinese homes. Indoor Air 2021, 31, 1018–1028. [Google Scholar] [CrossRef]
  9. Xu, X.; Lian, Z.; Shen, J.; Cao, T.; Zhu, J.; Lin, X.; Qing, K.; Zhang, W.; Zhang, T. Experimental study on sleep quality affected by carbon dioxide concentration. Indoor Air 2020, 31, 440–453. [Google Scholar] [CrossRef]
  10. Sundell, J.; Anderson, B.; Anderson, K.; Lindvall, T. Volatile Organic Compounds in Ventilating Air in Buildings at Different Sampling Points in the Buildings and their Relationship with the Prevalence of Occupant Symptoms. Indoor Air 1993, 3, 82–93. [Google Scholar] [CrossRef]
  11. Subramanian, P.; Reynolds, S.; Breuer, G.; Whitten, P. Analysis of limonene as an indicator for the assessment of environmental air-quality and health symptoms in office buildings. J. Environ. Sci. Health Part A 2000, 35, 999–1019. [Google Scholar] [CrossRef]
  12. Lan, L.; Pan, L.; Lian, Z.; Huang, H.; Lin, Y. Experimental study on thermal comfort of sleeping people at different air temperatures. Build. Environ. 2014, 73, 24–31. [Google Scholar] [CrossRef]
  13. Shaughnessy, R.J.; Levetin, E.; Blocker, J.; Sublette, K.L. Effectiveness of Portable Indoor Air Cleaners: Sensory Testing Results. Indoor Air 1994, 4, 179–188. [Google Scholar] [CrossRef]
  14. Lei, Z.; Liu, C.; Wang, L.; Li, N. Effect of natural ventilation on indoor air quality and thermal comfort in dormitory during winter. Build. Environ. 2017, 125, 240–247. [Google Scholar] [CrossRef]
  15. Li, H.; Li, X.; Qi, M. Field testing of natural ventilation in college student dormitories (Beijing, China). Build. Environ. 2014, 78, 36–43. [Google Scholar] [CrossRef]
  16. Sun, Y.X. On the Association between Dorm Environmental Factors and Allergies among College Students; Tianjin University: Tianjin, China, 2008. [Google Scholar]
  17. Chen, Q. Design of Natural Ventilation with CFD; Springer: Dordrecht, The Netherlands, 2006; Volume 9, pp. 116–123. [Google Scholar] [CrossRef]
  18. Cheung, J.O.P.; Liu, C.H. CFD simulations of natural ventilation behaviour in high-rise buildings in regular and staggered arrangements at various spacings. Energy Build. 2011, 43, 1149–1158. [Google Scholar] [CrossRef]
  19. Hooff, T.V.; Blocken, B.; Aanen, L.; Bronsema, B. A venturi-shaped roof for wind-induced natural ventilation of buildings: Wind tunnel and CFD evaluation of different design configurations. Build. Environ. 2011, 46, 1797–1807. [Google Scholar] [CrossRef]
  20. Dai, Y.; Xu, D.; Wang, H.; Zhang, F. CFD Simulations of Ventilation and Interunit Dispersion in Dormitory Complex: A Case Study of Epidemic Outbreak in Shanghai. Int. J. Environ. Res. Public Health 2023, 20, 4063. [Google Scholar] [CrossRef]
  21. Kai, Z.; Peter, O.; Wen, L.Y.; Jing, Z.T. Ventilation in worker dormitories and its impact on the spread of respiratory droplets. Sustain. Cities Soc. 2021, 75, 103327. [Google Scholar] [CrossRef]
  22. Wang, L. Research on Indoor Thermal Environment of Dormitory in Chongqing; College of Urban Construction & Environmental Engineering of Chongqing University: Chongqing, China, 2009. [Google Scholar]
  23. Sin, C.H.; Jon, K.S.; Un, G.H.; Thae, Y.I.; Kim, H.; Tokgo, J.; Ri, H.M. Evaluation of the ventilation and pollutant exposure risk level inside 3D street canyon with void deck under different wind directions. Environ. Sci. Pollut. Res. Int. 2023, 30, 61808. [Google Scholar] [CrossRef]
  24. Jon, K.S.; Luo, Y.; Sin, C.H.; Cui, P.Y.; Huang, Y.D.; Tokgo, J. Impacts of wind direction on the ventilation and pollutant dispersion of 3D street canyon with balconies. Build. Environ. 2023, 230, 110034. [Google Scholar] [CrossRef]
  25. Lee, K.Y.; Mak, C.M. Effects of different wind directions on ventilation of surrounding areas of two generic building configurations in Hong Kong. Indoor Built Environ. 2022, 31, 414–434. [Google Scholar] [CrossRef]
  26. Ou, J.; Wang, X.; Ming, Y.; Sun, X. Study on the Influence of Ventilation Speed on Smoke and Temperature Characteristics of Complex Underground Spaces. Fire 2023, 6, 11. [Google Scholar] [CrossRef]
  27. Su, L.; Ouyang, J.; Yang, L. Mixed-Mode Ventilation Based on Adjustable Air Velocity for Energy Benefits in Residential Buildings. Energies 2023, 16, 2746. [Google Scholar] [CrossRef]
  28. Ahmad, A.A.; Djimantoro, M.I.; Suryawinata, B.A. The Effect of Local Wind Speed for Opening in Mega Kuningan Highrise Office Tower. IOP Conf. Ser. Earth Environ. Sci. 2021, 794, 012194. [Google Scholar] [CrossRef]
  29. Li, Z.; Li, K.; Chang, J.; Wu, H.; Liu, J. Numerical simulation the effect of natural ventilation on Indoor Environment Quality in the inner-corridor-type student dormitory in winter. IOP Conf. Ser. Mater. Sci. Eng. 2019, 609, 042016. [Google Scholar] [CrossRef]
  30. Wu, Z.; Li, N.; Wargocki, P.; Peng, J.; Li, J.; Cui, H. Adaptive thermal comfort in naturally ventilated dormitory buildings in Changsha, China. Energy Build. 2019, 186, 56–70. [Google Scholar] [CrossRef]
  31. Hu, Y.; Wu, Y.; Wang, Q.; Hang, J.; Li, Q.; Liang, J.; Ling, H.; Zhang, X. Impact of Indoor-Outdoor Temperature Difference on Building Ventilation and Pollutant Dispersion within Urban Communities. Atmosphere 2021, 13, 28. [Google Scholar] [CrossRef]
  32. Wu, J.; Wang, J.; Cheng, Z. Air Distribution Simulation of Natural Ventilation in Dormitory. In Proceedings of the 2016 5th International Conference on Advanced Materials and Computer Science, Qingdao, China, 26–27 March 2016; pp. 543–548. [Google Scholar] [CrossRef]
  33. Ai, Z.T.; Mak, C.M. Determination of single-sided ventilation rates in multistory buildings: Evaluation of methods. Energy Build. 2014, 69, 292–300. [Google Scholar] [CrossRef]
  34. Ministry of Education [2001] No. 12; Several Opinions on the Construction Standards of College Students’ Apartments. Ministry of Education of China: Beijing, China, 2001.
  35. GB 55025-2022; Dormitory and Hotel Building Project Specifications. Ministry of Housing and Urban-Rural Development: Beijing, China, 2022.
  36. Franke, J.; Hellsten, A.; Schlunzen, K.H.; Carissimo, B. The COST 732 Best Practice Guideline for CFD simulation of flows in the urban environment: A summary. Int. J. Environ. Pollut. 2011, 44, 419–427. [Google Scholar] [CrossRef]
  37. Tominaga, Y.; Mochida, A.; Yoshie, R.; Kataoka, H.; Nozu, T.; Yoshikawa, M.; Shirasawa, T. AIJ guidelines for practical applications of CFD to pedestrian wind environment around buildings. J. Wind. Eng. Ind. Aerodyn. 2008, 96, 1749–1761. [Google Scholar] [CrossRef]
  38. Mats, S. What is ventilation efficiency? Build. Environ. 1981, 16, 473–481. [Google Scholar] [CrossRef]
  39. Liu, X.; Yang, L.; Niu, S.; Qin, W.; Qian, F. Research on the effect of different position on classroom ventilation in a L type teaching building. J. Build. Eng. 2020, 33, 101852. [Google Scholar] [CrossRef]
  40. Yang, L.; Liu, X.; Qian, F.; Du, S. Ventilation effect on different position of classrooms in “line” type teaching building. J. Clean. Prod. 2019, 209, 886–902. [Google Scholar] [CrossRef]
  41. Zhang, G.H.; Fan, Y.B.; Yang, R.S.; Li, S.H. Application of the Rosin-Rammler function to describe quartz sandstone particle size distribution produced by high-pressure gas rapid unloading at different infiltration pressure. Powder Technol. 2022, 412, 117982. [Google Scholar] [CrossRef]
  42. Duan, W.; Liu, Z.; Liu, P.; Hui, L. Estimation of Acid-Hydrolyzed Cellulose Fiber Size Distribution with Exponential and Rosin-Rammler (R-R) Laws. BioResources 2018, 13, 7792–7804. [Google Scholar] [CrossRef]
  43. Chen, J.; Augenbroe, G.; Wang, Q.; Song, X. Uncertainty Analysis of Thermal Comfort in a Prototypical Naturally Ventilated Office Building and Its Implications Compared to Deterministic Simulation. Energy Build. 2017, 146, 283–294. [Google Scholar] [CrossRef]
  44. Udrea, I.; Croitoru, C.; Nastase, I.; Dogeanu, A.; Badescu, V. Thermal Comfort Analyses In Naturally Ventilated Buildings. Math. Model. Civ. Eng. 2014, 3, 64–70. [Google Scholar] [CrossRef]
  45. GB/T 50378-2019; Green Building Assessment Standards. Ministry of Housing and Urban-Rural Development: Beijing, China, 2019.
  46. Etheridge, D. A perspective on fifty years of natural ventilation research. Build. Environ. 2015, 91, 51–60. [Google Scholar] [CrossRef]
  47. Weng, J.; Zhang, X. Analysis of Ventilation in the Student Dormitory Based on CFD Methods. Fluid Mach. 2010, 38, 61–65. [Google Scholar] [CrossRef]
  48. Mott, W.; Woods, W. Natural ventilation driven by periodic gusting of wind. J. Fluid Mech. 2011, 679, 58–76. [Google Scholar] [CrossRef]
  49. Persily, A.; Jonge, L. Carbon dioxide generation rates for building occupants. Indoor Air 2017, 27, 868–879. [Google Scholar] [CrossRef] [PubMed]
  50. Shen, J.; Chen, Y.; Rajagopal, K. Enhancing Indoor Environmental Quality and Sustainability in Post-Pandemic Office Settings: A Study on Displacement Ventilation Feasibility. Buildings 2023, 13, 3110. [Google Scholar] [CrossRef]
Figure 1. Physical model; (a) Mesh; (b) Grid independence verification; (c) Wind direction.
Buildings 14 00361 g001
Figure 2. Schematic diagram of VOA numerical sampling method and VOA schematic.
Buildings 14 00361 g002
Figure 3. Sampling points and the data; (a) Wind speed in the X direction; (b) Normalized data; (c) Simulation conclusion of indoor temperature; (d) Sampling points.
Buildings 14 00361 g003
Figure 4. Air age distribution of S (0°) wind direction.
Buildings 14 00361 g004
Figure 5. VOA fitting curve of S (0°) wind direction. The red dashed line represents the fitting curve of the equation; the blue dots represent the sampling values.
Buildings 14 00361 g005
Figure 6. Air age distribution of SW (45°) wind direction.
Buildings 14 00361 g006
Figure 7. VOA fitting curve of SW (45°) wind direction. The red dashed line represents the fitting curve of the equation; the blue dots represent the sampling values.
Buildings 14 00361 g007
Figure 8. Air age distribution of W (90°) wind direction.
Buildings 14 00361 g008
Figure 9. VOA fitting curve of W (90°) wind direction. The red dashed line represents the fitting curve of the equation; the blue dots represent the sampling values.
Buildings 14 00361 g009
Figure 10. The relationship between ventilation periods; (a) Wind direction is S; (b) Wind direction is SW; (c) Wind direction is W.
Buildings 14 00361 g010
Figure 11. Experimental scenario.
Buildings 14 00361 g011
Figure 12. The variation of indoor pollutants over time; (a,b) Wind direction is S; (c,d) Wind direction is SW; (e,f) Wind direction is W.
Buildings 14 00361 g012
Table 1. Values and Model Settings.
FeatureValueNote
Room air temperatureAverage 22 °CMeasurements.
Body temperature36.5 °CReplace the human body with a bed surface and emit heat.
Ambient mean air pressure99,342 Pa
Initial air pressure difference between indoor and outdoor−5 Pa~0 Pa
Ambient wind directionW (0°); SW (45°); S (90°)Due to the geometric symmetry of the building and considering people’s habits of using the basic wind direction, the focus is on these three wind directions.
Ambient wind speed1.5 m/s; 3.3 m/s; 5.4 m/s; 7.9 m/sThe Beaufort Wind Scale ranges from wind force 1 to 4.
Outdoor temperature−10 °C; 0 °C; 10 °C; 20 °CAssume.
Calculation schemeCoupled
Pressure solutionPRESTO!
Momentum and energy
discretization scheme
Second order upwind
Gas definitionIncompressible-ideal-gasIdeal for thermal diffusion.
Table 2. TVOA=70%, S (0°) wind direction.
Wind SpeedOutdoor Temperature
−10 °C0 °C10 °C20 °C
1.5 m/s1181 s1290 s1434 s1706 s
3.3 m/s1028 s1203 s1317 s1519 s
5.4 m/s897 s949 s1111 s1290 s
7.9 m/s716 s839 s977 s1055 s
Table 3. TVOA=70%, SW (45°) wind direction.
Wind SpeedOutdoor Temperature
−10 °C0 °C10 °C20 °C
1.5 m/s759 s821 s876 s925 s
3.3 m/s656 s701 s725 s752 s
5.4 m/s379 s381 s396 s384 s
7.9 m/s280 s272 s273 s275 s
Table 4. TVOA=70%, W (90°) wind direction.
Wind SpeedOutdoor Temperature
−10 °C0 °C10 °C20 °C
1.5 m/s945 s1087 s1205 s1418 s
3.3 m/s862 s1045 s1113 s1267 s
5.4 m/s801 s953 s1074 s1098 s
7.9 m/s768 s796 s825 s851 s
Table 5. Experimental condition.
Wind
Direction
Outside Air TemperatureWind SpeedData GraphThe Value of ‘t’
(Equation (22))
The Ratio of Carbon
Dioxide Concentration Change
S6 °C2.2 m/sFigure 12a30 min72.0%
S10 °C1.7 m/sFigure 12b35 min79.9%
SW14 °C3.8 m/sFigure 12c15 min77.1%
SW8 °C1.7 m/sFigure 12d19 min81.1%
W4 °C1.9 m/sFigure 12e25 min71.1%
W12 °C1.8 m/sFigure 12f31 min74.8%
Disclaimer/Publisher’s Note: The statements, opinions and data contained in all publications are solely those of the individual author(s) and contributor(s) and not of MDPI and/or the editor(s). MDPI and/or the editor(s) disclaim responsibility for any injury to people or property resulting from any ideas, methods, instructions or products referred to in the content.

