Abstract
Moisture ingress is a major cause of damage to masonry cavity walls. Products of various chemical compositions are available for wall surface treatment, aimed at reducing/eliminating water ingress. This study presents the results of full-scale wall tests designed to quantify water absorption into uninsulated and insulated brick masonry cavity walls exposed to wind-driven rain (WDR) with and without surface waterproofing. Two different waterproofing products were used: acrylic and silane–siloxane mixture. Untreated and treated walls were exposed to cycles consisting of 10 min wetting at 2.25 L/m2·min every 60 min. The results show that both treatments lead to a reduction in water ingress ranging from 90% to 97%. However, while a more consistent performance was obtained for the silane/siloxane-treated walls under repeated exposure, the results for the acrylic treatment were dominated by the original wall conditions, improved with a reapplication of the treatment. The testing protocol proposed in this study is effective in determining the performance of waterproofing treatments exposed to different levels of WDR. Both treatments prove to be effective in preventing moisture uptake in walls in moderate WDR exposure conditions, while in extreme WDR exposure conditions, the acrylic treatment is less effective.
1. Introduction
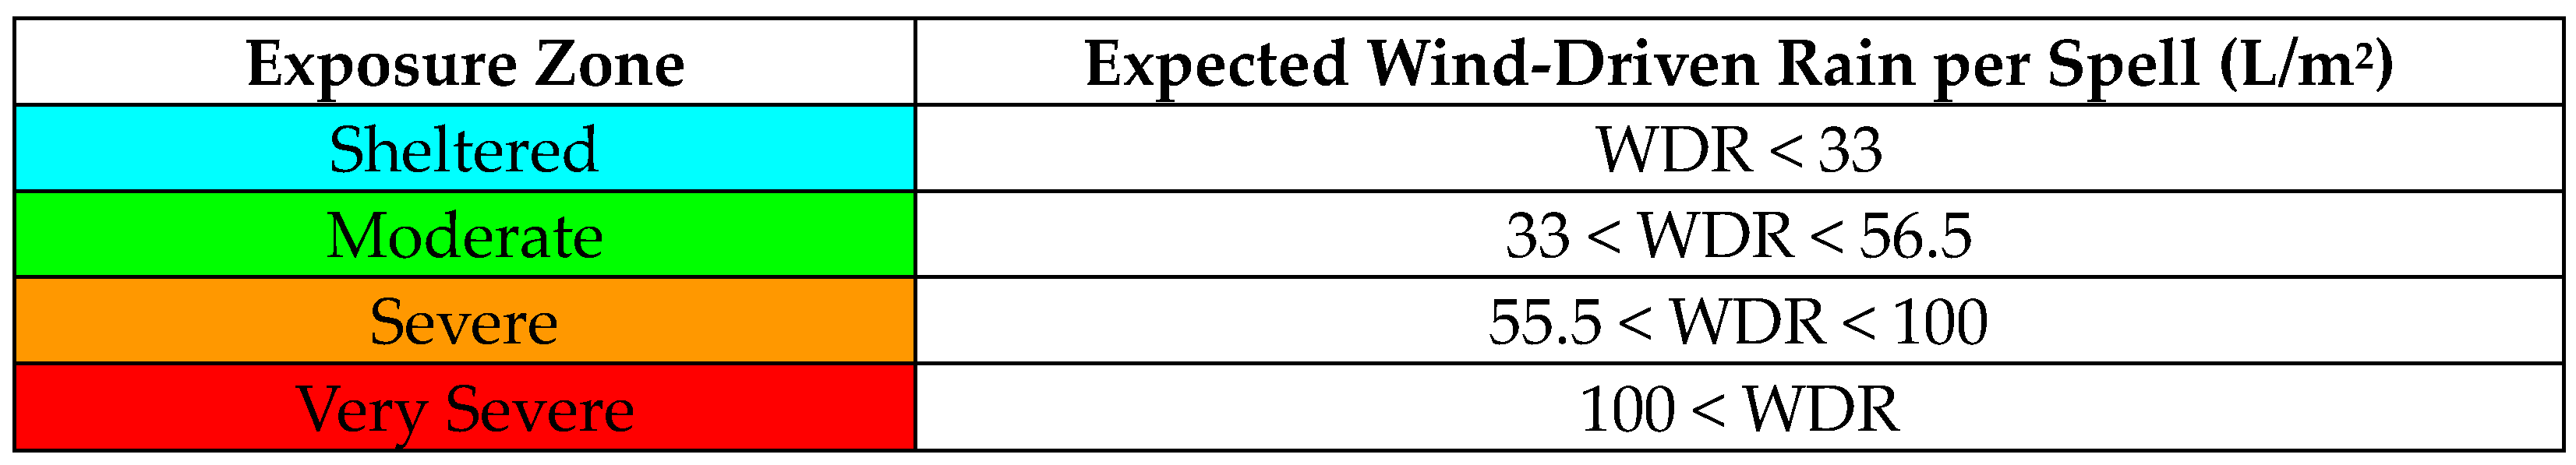
Masonry wall construction is the most popular and traditional construction method in the UK [1,2], representing around 90.4% of all homes in England [3]. Within this building stock, the relatively more recent cavity wall construction technique is found in 64.2% of all dwellings in England [3]. A significant portion of these buildings are located in WDR exposure zones classified as severe or very severe according to criteria given in BS 8104:1992 [4,5], without sufficient construction features to prevent water ingress [6], (see Figure 1).
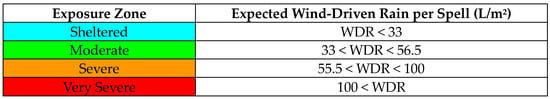
Figure 1.
UK wind-driven rain exposure zones derived from BS 8104 [5]. A spell is defined as a period of driving rain separated by at least 96 h of dry weather.
The Domestic Minimum Energy Efficiency Standard (MEES) Regulations [7] provide guidance for interventions aimed at improving building energy performance. Among the recommended measures, insulating walls is recognised as key in improving the energy efficiency of buildings. Improved energy efficiency will undoubtably help achieve governmental milestones for the decarbonisation of the UK built environment, including fuel-poor homes, estimated to account for more than 10% of the residential building stock in England, 12% in Wales, 18% in Northern Ireland, and 25% in Scotland [8,9].
Wind-driven rain (WDR), one of the key sources of moisture ingress in masonry buildings, can impact on the hygrothermal performance, durability, and indoor environmental quality of buildings [10,11,12]. Water penetrating into building fabrics and moisture trapped inside can lead to damage through freeze–thaw, material decay, and mould growth and may affect structural integrity [13,14]. Further, according to the English Housing Survey [3], the most commonly used insulation materials might not be suitable for exposed conventional masonry fabrics due to their high permeability, which can substantially reduce insulation effectiveness in the presence of water ingress, so that this class of buildings is nicknamed “hard-to-treat cavity walls”.
Methods to manage moisture risk under WDR exposure therefore are critical for a significant number of existing buildings. Water-repellent products that are directly applied onto the exposed faces of walls for surface hydrophilisation have long been advocated and used as a solution to reduce moisture ingress in WDR-exposed masonry walls, while still allowing water vapour permeation to minimise dampness retention risk. Since the 1960s, research on these products has focused on their suitability for historic building fabrics, as they are mostly colourless and therefore do not change the appearance of the substrate [15,16]. Attention has recently shifted to existing buildings more generally, with the aim of reducing risks and damage caused by moisture ingress. Combining water-repellent products and traditional insulation materials may provide a potentially economic and effective solution for retrofitting existing masonry cavity façades in exposed areas for a longer service life and for higher energy efficiency. Research has focused on three major fields: firstly, the effectiveness of these applications, including water absorption reduction rate and uniform performance [17,18]; secondly, product–substrate compatibility, involving limited or no appearance alteration and lower impact on water vapour permeability (i.e., [19,20]); and finally, durability, representing service life of the product on wall surfaces and long-term performance degradation under various deterioration agents, such as solar radiation and cyclic freeze and thaw (i.e., [21,22]). Developments in these fields have spun multiple commercially available surface water-repellent products with different chemical compositions. Researchers characterised the hydrophobicity, water absorption, and vapour transmission of some of these products when applied to masonry substrates [23,24,25,26]. However, controversial findings are reported, even with products based on similar chemical composition [27,28]. Further, the real-life performance of water-repellent-treated elements can be very different to the lab environment due to the complex factors that govern their behaviour [29] and the application technique may influence the penetration depth of the treatment [30]; the workmanship can impact the uniformity of the performance across the façade [27,31]; the effectiveness of the water-repellent material can change depending on the suitability of its physical–chemical properties to the smoothness and unevenness of the substrates [32]. Indeed, the interface between brick and mortar is reported to be a critical location of water ingress [33] as the diverse porous structures of the mortar joints compared to those of bricks makes them more vulnerable to WDR [27]. The role that defects and other surface irregularities play on the surface waterproofing performance are commonly reported in the field [29], as most existing masonry buildings in exposed areas have various levels and types of damage to their façades. A major possible drawback of using water-repellent products is identified by [25], as the reduction in water vapour permeability, which, when compounded with insulation-filled cavities, may further extend the drying time in masonry walls. This aspect has not yet received sufficient attention.
The present study looks into the impact of an acrylic-based liquid product and a silane/siloxane blend cream product on cavity walls’ water uptake under WDR exposure through a series of wall-scale tests and identifies how surface waterproofing affects the walls’ hygrothermal performance in uninsulated and insulated conditions. The overarching aim is to determine whether the coupling of external surface treatment and cavity insulation can be considered a cost-effective retrofitting measure, feasible to benefit a significant number of homes in exposed areas in the UK to improve their moisture and energy performance to extend their life in an age of new climatic conditions and in the face of carbon reduction efforts. The primary objective is to quantify the capacity of surface waterproofing products to prevent or reduce WDR-induced moisture ingress into existing masonry cavity walls by evaluating the water uptake using load cells and temperature (T) and relative humidity (RH) sensors embedded into the wall specimens. Other objectives are to identify the extent to which the treatments hinder or facilitate the drying process and to determine whether the presence of the insulation alters the behaviour of the treated walls. The testing campaign described was achieved by developing a bespoke testing protocol applied to both uninsulated and insulated full-scale masonry cavity wall elements.
The rest of the paper is organised as follows: In Section 2, the details of the methodology developed for the WDR tests, including selection of materials, experimental setup, and testing protocol are presented. In Section 3, the results are given for each treatment for the uninsulated and insulated conditions of the specimens, including variations in RH, T, and weight, to determine the water absorption and loss during the test. A discussion on the comparative performance of the treatments is presented in Section 4, correlating results with previous findings from a bench test study conducted using small-scale specimens [23], followed by conclusions and the need for further research. The study successfully proposes an appropriate testing and sensing protocol, which is effective in demonstrating the performance of waterproofing treatments exposed to WDR.
2. Materials and Methods
2.1. Selection of Materials and Specimen Design
The authors investigated the impact of four surface waterproofing treatments of different chemical compositions on three different types of brick-and-mortar samples and small masonry assemblies [23] (see Figure 2a). This testing programme focussed on hydrophobicity, water absorption, and water vapour permeability representing three major stages of moisture exposure life-cycle: first contact with water, wetting, and drying. The results show that out of four products that were tested, silane/siloxane blend cream is the most effective, with up to 96% reduction in water absorption, but, as a drawback, its hydrophobicity performance was found to be inconsistent and water vapour resistance increased by 18%, impairing vapour transmission for moisture stored within the fabric. On the other hand, specimens treated with the acrylic-based product showed satisfactory performance in hydrophobicity and water vapour transmission tests, showing good beading effect and ease of drying. However, the 40% reduction in water absorption indicated a comparatively poor performance. Given the very different performance and characteristics observed in the small specimens’ tests, these two surface waterproofing products were selected for the wall-scale tests reported here, to further the understanding of their impact on the dynamic process of wetting and drying of real-scale cavity walls exposed to WDR. The information provided by the manufacturer and a summary of bench test outcomes are given in Table 1.
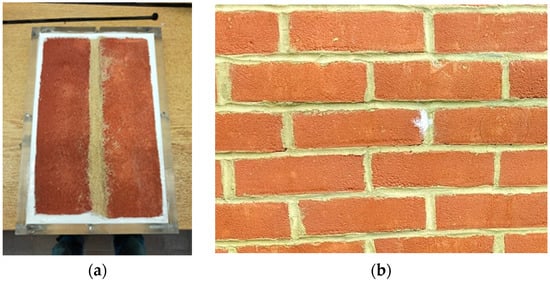
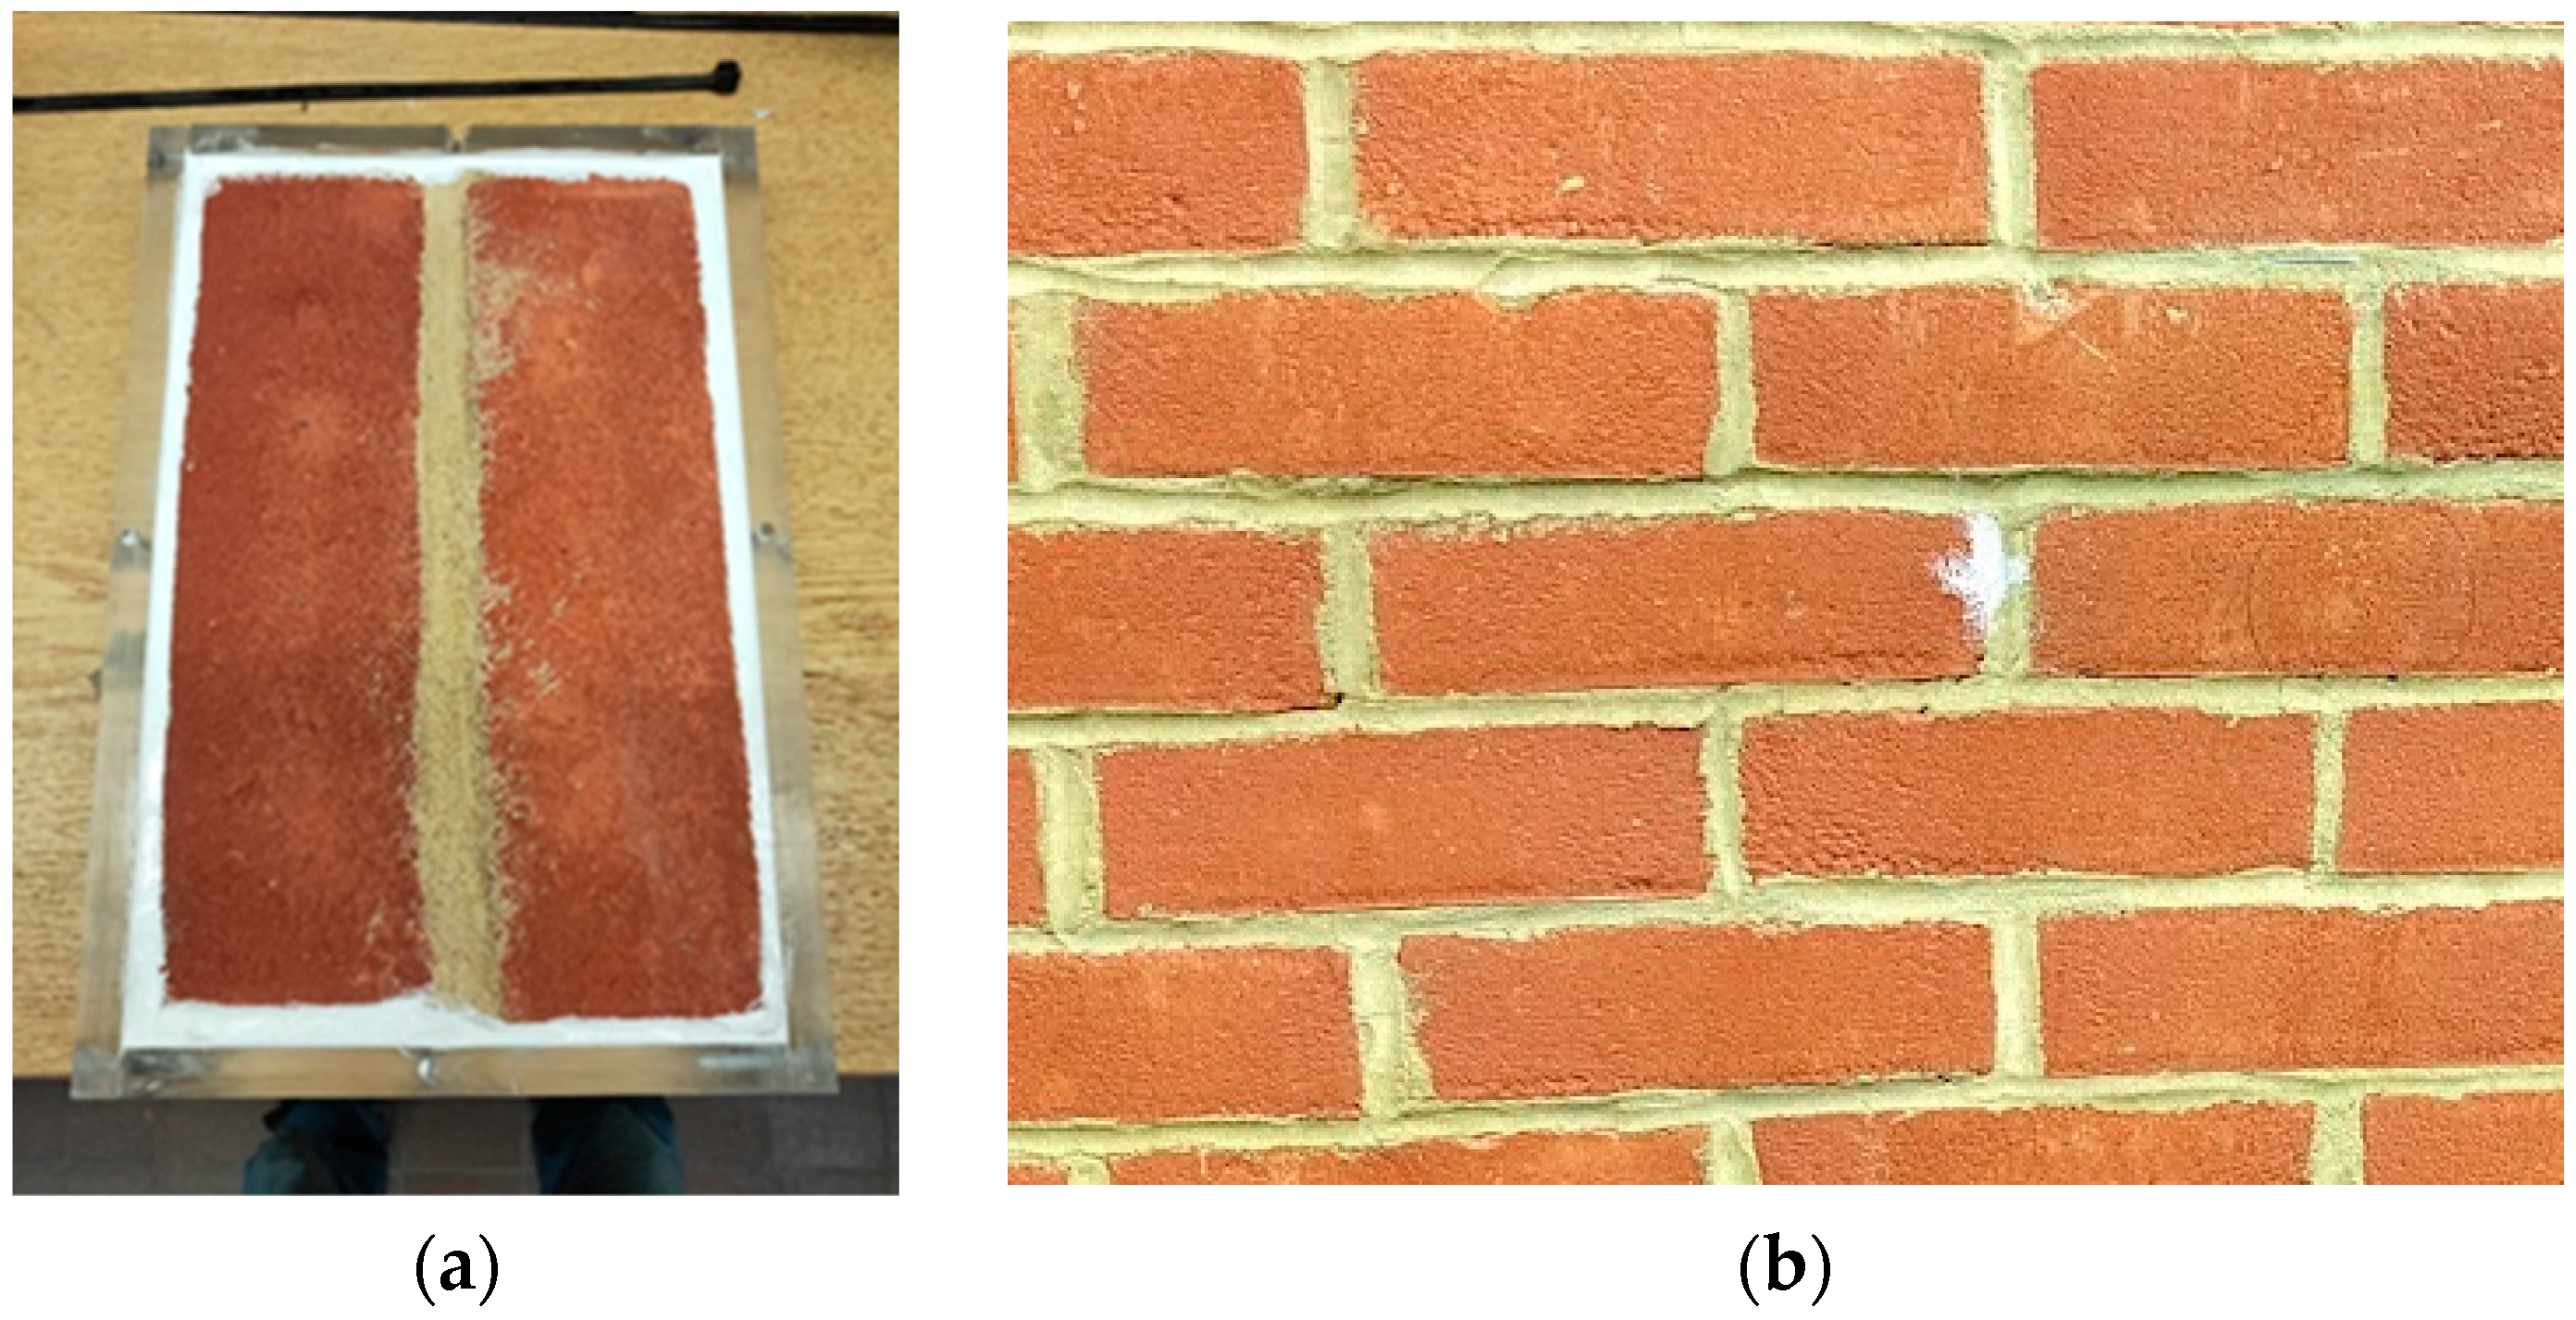
Figure 2.
(a) Two-brick-and-mortar assembly 28 mm thick used for bench tests and (b) Part of wall specimen built with standard size brick and 10 mm concave mortar bed and head joints showing manufacturing irregularities.

Table 1.
Product information and performance summary.
The outcomes of these bench tests were used to select vulnerable brick types, on the basis of comparatively lower water vapour resistance, showing consistency of performance with each applied waterproofing treatment [34]. The Forterra Atherstone Red, is a fired clay brick with a smooth finish, of a standard size of 215 × 102.5 × 65 mm, with the manufacturer’s reported gross density equal to 1900 kg/m3 and 15% frogged volume. Particle composition and manufacturing methods are both representative of bricks kilned in the 1960s to 1980s and are still commonly used in current construction practice in the UK [35,36]. Hydrated lime M4 mortar with a lime, cement, and sand ratio of 1:1:6, was used, representing typical mortars used in the 1960s and 1970s [37].
The masonry cavity wall specimens were built in dimensions of 1.1 m × 1.1 m × 0.28 m, each wall consisting of two 102.5 mm thick leaves of bricks in stretcher bond and with a 75 mm cavity in between. Mortar bed and head joints were bucket-handled and 10 mm thick. The height of the wall specimens differed from the specifications recommended in [38], which suggests a height of 2.4 m. The decision to limit the height of the specimen stems from the fact that taller specimens would result in a higher level of runoff in the lower portions of the walls [39], while the emphasis of the present study is on determining the effect of WDR exposure conditions.
Six wall specimens were built by professional brick layers and cured in a constant environment maintained at 22 °C and 55% relative humidity for 28 days before applying the water-repellent treatments. After applying the treatment, the walls were further conditioned for 14 days. The walls were built at the end of 2018 and exposed to WDR tests during the summer of 2019 as part of a project sponsored by the Department for Business, Energy & Industrial Strategy (BEIS, [36]) (Figure 2b). The specimens were then stored in a curing room under variable environmental conditions until May 2022, before the set of tests reported here were performed. As the wall condition and quality of workmanship have a substantial impact on masonry as rainwater can easily penetrate cracks and reach the interior surface (see [40]), the crack locations on test walls were recorded and mapped in detail.
The insulation material filling the cavity of the walls was closed-cell, expanded polystyrene (EPS) beads with a diameter around 2 mm, manufactured following [41] and meeting the requirements of KIWA BDA Agrément. The installation of beads started with sealing the sides of the specimens with insulation tape from Pavatax, a thermal-resistant tape with high-strength adhesive; then, the insulation beads were poured into the cavity without use of adhesives, compacted until full, for a total of 1.4 kg of beads per cavity, achieving a density of 12 kg/m3 ± 2 per installation recommended by [41,42]. The water vapour transmission factor (µ), measured according to [43], for loose-fill EPS beads is 2, a value notably lower than the average of 18.23 observed in untreated masonry specimens reported by [23]. Additionally, the 24 h water absorption, measured through partial immersion following [44], method A, is found to be lower than 1 kg/m3.
2.2. Test Setup
The progression of moisture from the outer surface of the outdoor leaf to the inner surface of the indoor leaf is affected by outdoor and indoor environmental conditions, including the differential in temperature and relative humidity of the two environments. To reproduce such conditions simultaneously while applying cyclic WDR to the specimens, the coupled environmental chambers of the integrated mechanical–climatic testing facility of the UCL StrEnTHE lab (Figure 3) were used. The two bespoke WEISS chambers were connected by a shared mounting frame of 5 m × 4 m × 0.4 m with structural testing capacity. The outdoor chamber simulated environmental conditions from −30 to 70 °C with RH control from 5 to 98%, while the indoor chamber simulated 5 to 40 °C with RH from 20 to 98%. Each test batch included two specimens for a total of 12 specimens tested in two rounds. The first round included couples of uninsulated untreated reference walls, acrylic-treated walls, and silane/siloxane blend cream-treated walls. The same walls were then insulated and tested again in the second round (Figure 3).
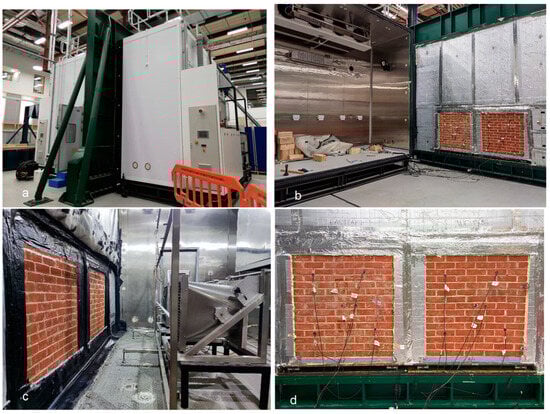
Figure 3.
Outdoor–indoor-coupled environmental chambers at UCL-StrEnTHE laboratory (Strength and Environmental Testing @ Here East) and wall specimens: (a) overview of the environmental chambers and loading rig; (b) open view of the mobile indoor chamber and specimens; (c) WDR equipment in the outdoor chamber; (d) view from indoor chamber of wall specimens mounted on loadcells and equipped with T&RH sensors.
The WDR was dispersed via a three-layer built-in horizontal rain simulation system in the outdoor chamber, each layer equipped with six nozzles (Figure 3c). The nozzles had a 400 mm horizontal interval and sprayed with 60° cone, the vertical height of each layer being adjustable. The bottom layer of 6 nozzles at a height of 600 mm from the chamber floor were used in these tests, aligned with the mid-height of the specimens, to ensure even and full coverage of the specimens’ surface through horizontal spraying. The nozzle spray pressure was enhanced by two fans installed behind the nozzles and set to achieve 6 m/s (22 Pa) wind speed for the rain.
Each wall specimen was built on a steel plate of 17.5 mm thickness, with four load cells installed under each corner of the wall and fixed to a base steel plate. Each load cell had a range up to 200 kg with an accuracy of ±0.04 kg, determining any weight change due to water absorption, redistribution, and evaporation separately for each leaf.
To understand the movement of moisture inside the specimens, each wall was monitored by five in-wall sensors installed in the outer leaf at various depths and heights, and one in the inner leaf at the centre, to record RH and T in both brick and mortar. One of the sensors in the mortar of the outer leaf had higher accuracy. Holes were drilled at sensor sizes at different depths from the inner leaf to the outer leaf and sealed with waterproof silicone putty after the sensors’ installation to prevent moisture leakage.
Load cell and in-wall sensor specifications and locations are given in Table 2 and Figure 4, respectively. All RH and T sensors measured in-wall conditions, providing an accurate representation of the moisture uptake in the outer leaf and hence a direct measure of the effectiveness of the superficial treatments as barriers to water absorption. All in-wall sensors and load cells were connected and logged simultaneously using the National Instrument LabView data acquisition system at a frequency of 30 s. All obtained data were further averaged at one reading per minute on each sensor. T and RH of both indoor and outdoor chambers were controlled and recorded by using the WEISS S!MPATI® 4.80.1 software.
Table 2.
In-wall sensors and load cell specifications.
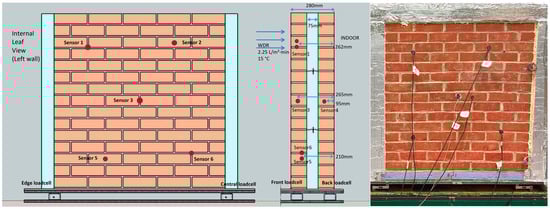
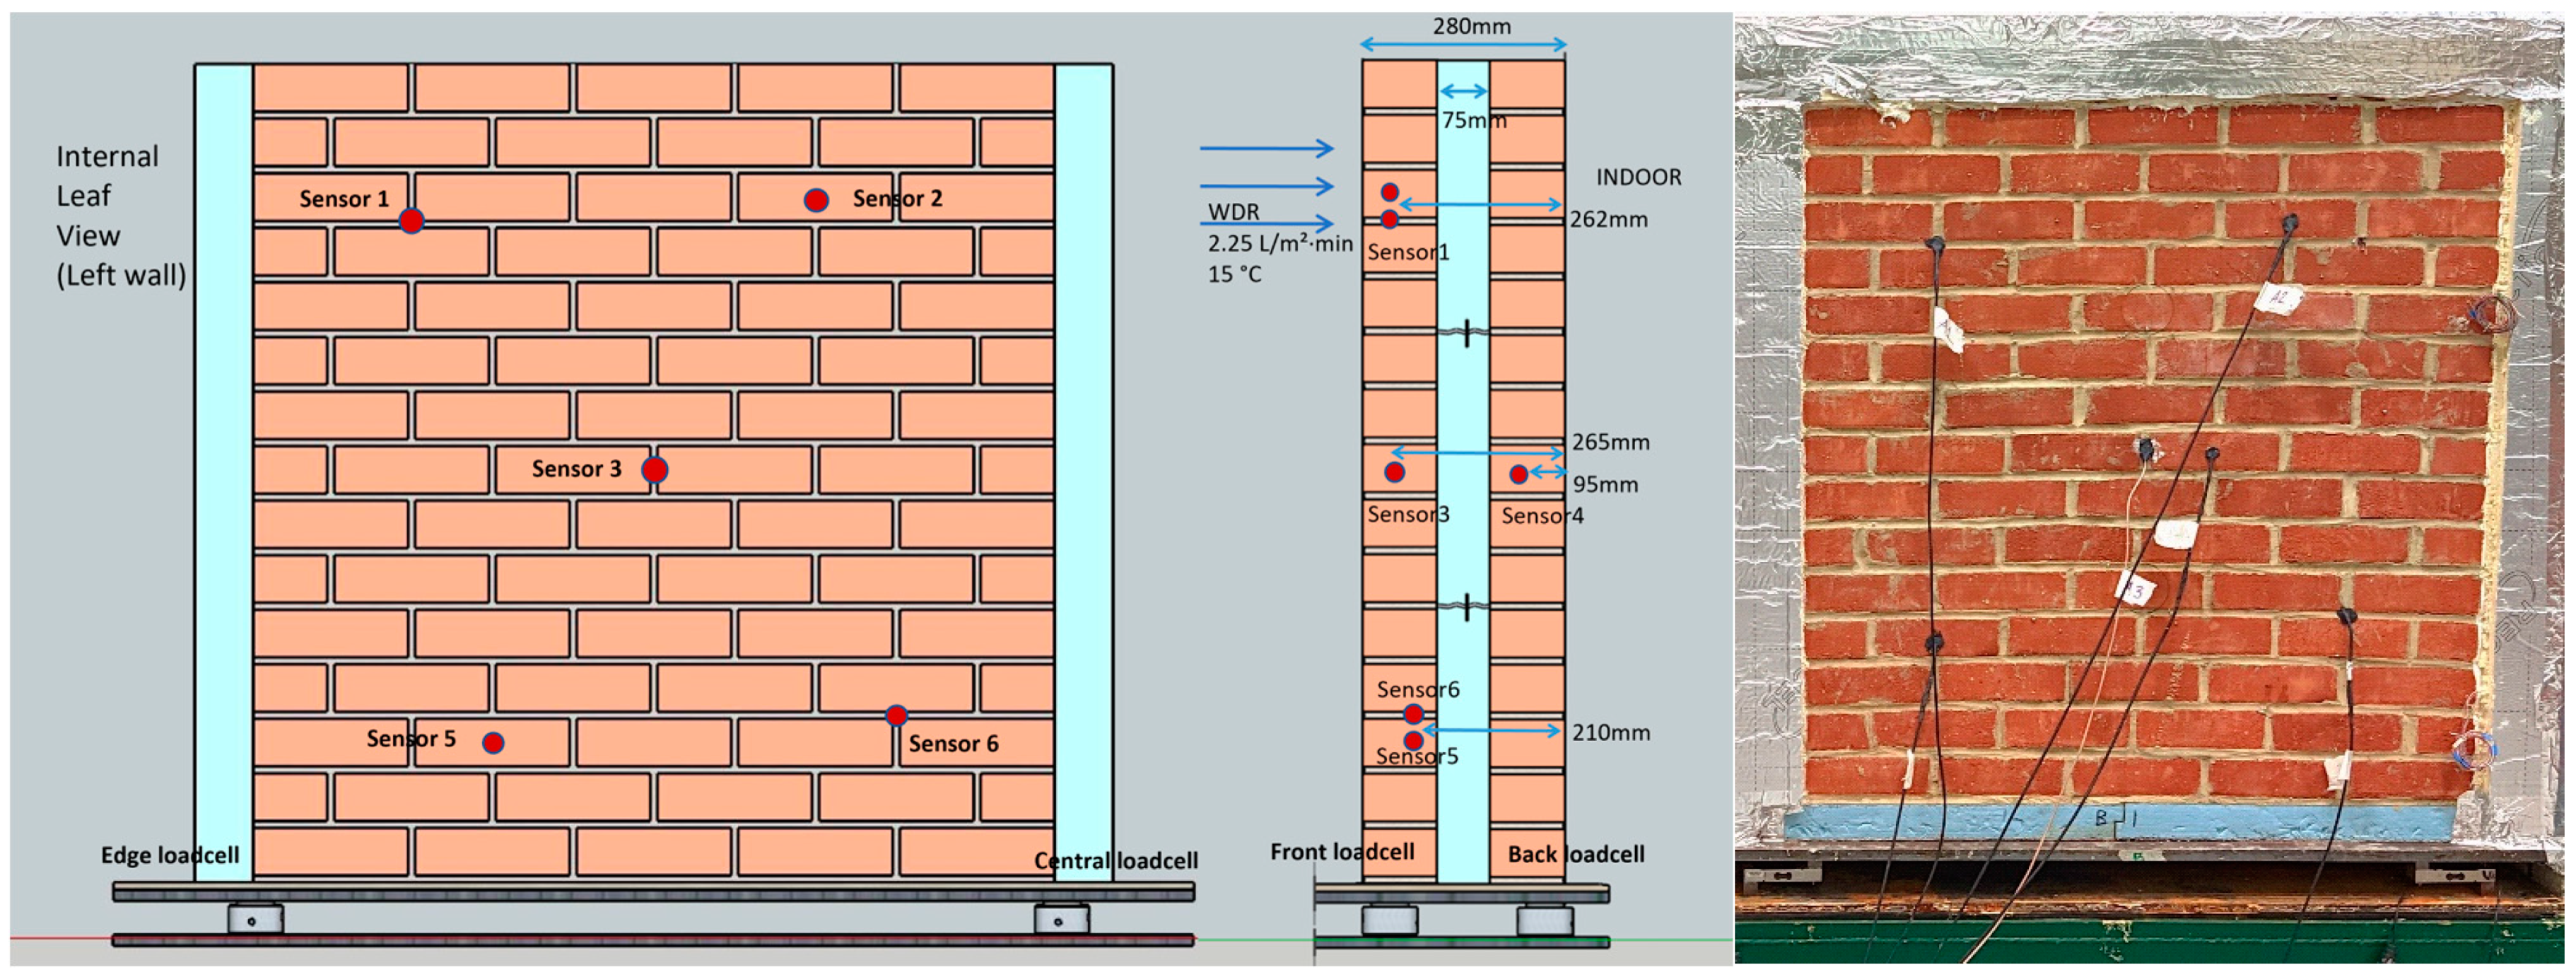
Figure 4.
Layout of the in-wall T and RH sensors and their depth from the inner surface of the internal leaf. Sensor 3 is SC05; other sensors are HTM2500LF.
2.3. Test Protocol
Table 3 summarises the methods and specifications of commonly used WDR test standards on different building elements. The water application rate, wind pressure, and test duration differ with the climate/weather conditions represented, corresponding to three diverse test purposes:
Table 3.
Standards for WDR testing (superscripts “a” and “b” represent two distinct alternative test methods within a specific standard).
- Water tightness with a pass/fail criterion after exposure to given test conditions for a period of time;
- Water tightness failure in static or dynamic conditions with different levels of wind pressure;
- Record of absorption rate within a given test duration.
As the objective of this study is to identify the impact on water uptake in masonry cavity wall specimens of surface waterproofing treatments exposed to WDR, the quantification of absorption rate was deemed of vital importance to establish their performance.
Examples of different testing protocols from previous research were also examined. The work of [52,53] adheres to [38] but uses different spray systems compared to the standard. The authors of [52] deliver a much lower WDR application rate at 0.28 L/m2·min in their test on external wood claddings compared to the 1.5 L/m2·min required by [38]. Ref. [53] uses only driving rain, excluding runoff water while using specimen dimensions differing from the standard requirements. Similarly, Ref. [54] introduces a spray rate of 1.44 L/m2·min in high-velocity rainfall simulation, exceeding the 0.5 L/m2·min required in [51]. The authors of [55] provide an overview of 30 test standards worldwide and note the lack of clarity on which type of test procedure renders the most realistic or severe test conditions. They consider that available standards provide testing procedures for the resistance to water penetration of either window and door elements (e.g., [48]) or for generic façade systems (e.g., [38]). Therefore, adjusting the test conditions based on the materials/elements being tested and the specific weather conditions of interest is deemed necessary and justified.
In the study by [56], the peak WDR intensity, peak WDR wind pressure, and combined average for return periods up to 1 in 50 years for Belgium and the Netherlands were studied. The results indicate that procedures using both high wind pressure, i.e., 600 Pa, and high water dispersion, i.e., 2 L/m2·min, as specified by standards such as [45,48], are extreme test conditions and are unlikely to occur under normal service conditions [57], as high wind speeds and intense rainfall do not usually occur at the same time [10]. Research involving on-site monitoring at different locations in the UK reported similar findings [11,58]. Therefore, it would be beneficial to study the behaviour of specimens exposed to high water applications and low wind pressure or vice versa in order to reduce the discrepancy between laboratory test results and real-world performance. Ref. [59] tested clay brick masonry with reduced water application of 0.03–0.06 L/m2·min with no wind load applied, resulting in no water penetration over six cycles of 210 min of wetting and 20 min of pause. Ref. [60] tested historic masonry-infilled timber frames using low rates of spraying and wind speed, 0.375 L/m2·min and 2 m/s, respectively, to encourage wetting of the walls while matching typical rainfall amounts for given return periods and to study the strength and stiffness deterioration of the load-bearing system, with up to 100 cycles of wetting and drying. Further research is needed to investigate the impact of wind speed and water application rate on water uptake and system performance.
Ref. [61] carried out a comparative study of weather data including average annual rainfall, average annual wind speed, and WDR spell index for locations in very severe exposure areas across the UK. By excluding low-population-density locations, Swansea in South Wales was deemed typical of a mid-size city in a very severe exposure zone and was used to compare test protocols from the standards with historical weather data (see Figure 1). Weather data for Swansea are available for a number of stations from the Met Office [62]. According to the most recent dataset spanning the period 1991 to 2020, the average annual maximum and minimum temperatures are 13.72 °C and 8.81 °C, respectively, with annual mean wind speed of 6.85 m/s. Additionally, through Swansea City Council, data at hourly intervals are available for the period between 2012 and 2017. The highest hourly rainfall rate recorded is 7.8 mm/hour (0.13 L/m2·min), while the highest hourly average wind speed is 17.5 m/s, yielding a pressure exerted of approximately 185 Pa. These measurements yield a water application rate significantly lower than the minimum rate recommended by the test standards shown in Table 3. Considering indications from the literature discussed above, the average monthly wind speed of 6.85 m/s, recorded from 1991 to 2020 in Swansea, was considered the most suitable reference for the WDR test.
Surface waterproofing treatments form a hydrophobic layer on the exterior surface of the masonry to prevent/reduce the ingress of rainwater. Therefore, a test condition at a sustained water application rate was deemed more suitable to monitor the absorption rate, while lower wind speeds reduce the influence of splashing and bouncing of raindrops [63]. From the water application rates shown in Table 3, it can be inferred that in European standards, a spray rate of 2.0 L/m2·min is the most common spray rate used to apply a constant and continuous film to the outside surface of the specimen.
As previously mentioned, the vapour pressure differential between indoors and outdoors, primarily resulting from the temperature differences, can have a significant effect on moisture movement in walls. By examining the data for Swansea, the average monthly temperature during the month with the highest rain and wind occurrence was 7.6 °C [61]. To account for the average conditions as well as the extremes, while ensuring wide applicability of the results and accurate control of the environmental chambers, a consistent outdoor temperature of 15 °C was kept during the wetting period, while the water temperature was maintained at 6–7 °C and the indoor temperature was set at 20 °C.
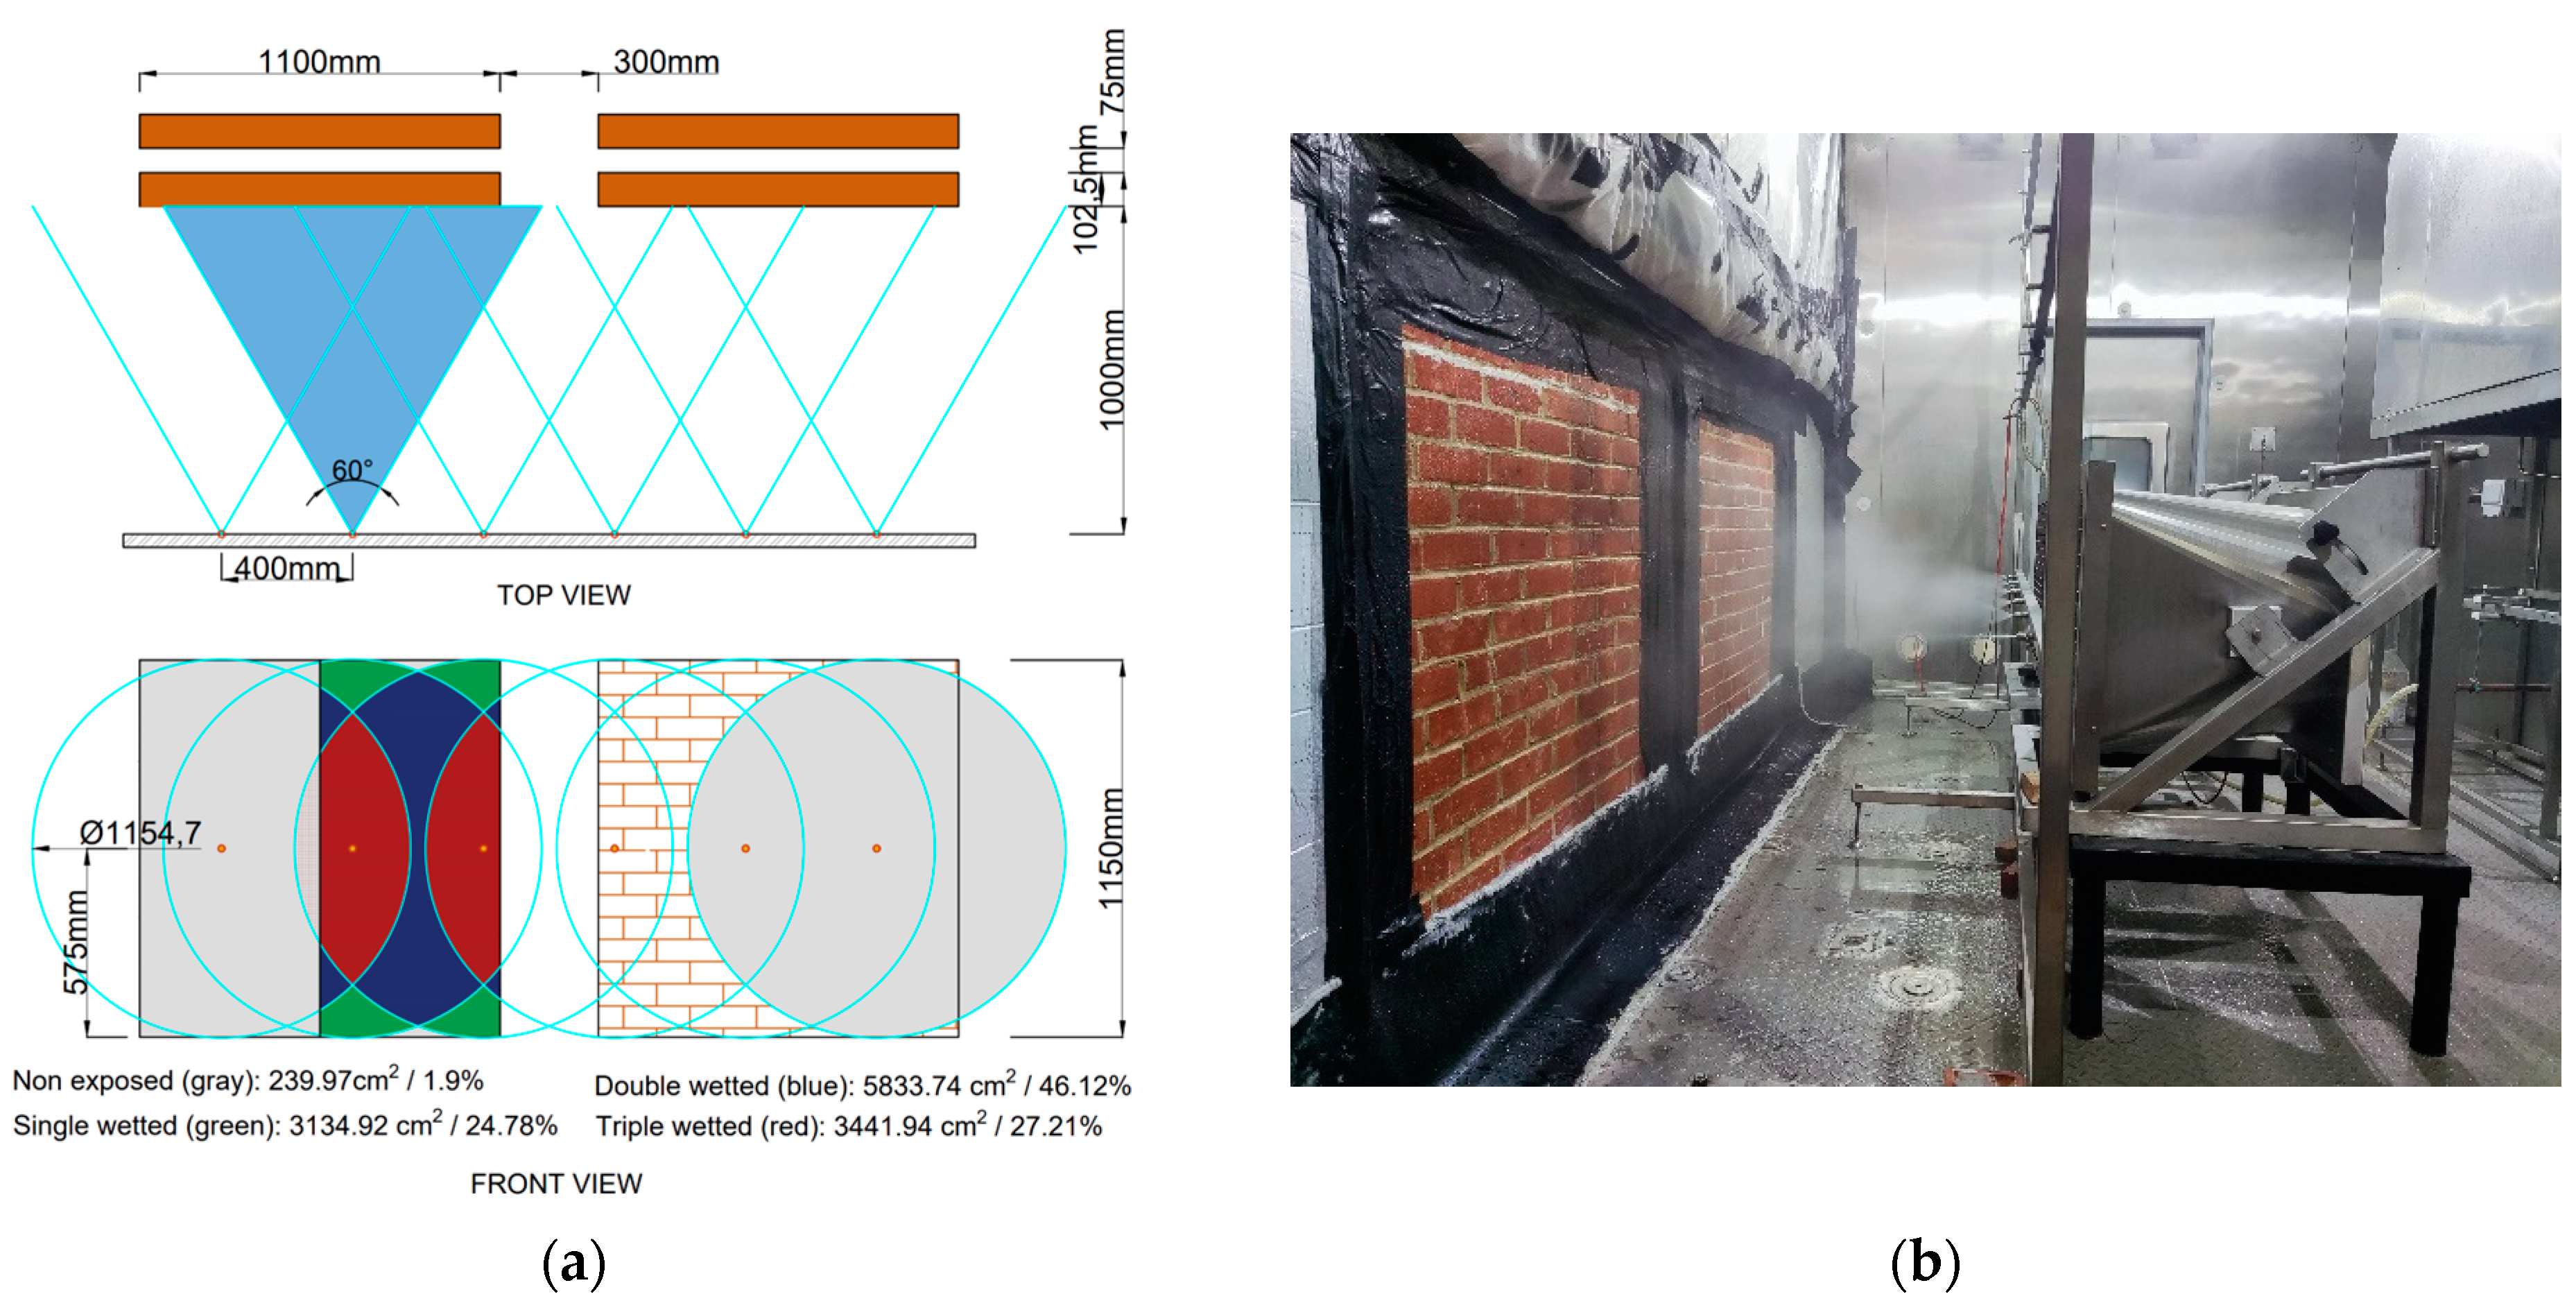
Figure 5 shows the WDR setup of six nozzles and how nozzles spray cones overlap, causing parts of the specimens’ surface to be wetted to different degrees. Each nozzle was set to deliver 1 L/min of water, resulting in an average wetting rate at the walls equal to 1.91 L/m2·min. During the actual testing, with the wind pressure provided by the fans, the water dispersion pattern and intensity can be different from the theoretical case. To confirm this, three WDR gauges were put at the centre and edges of both walls to measure the overall amount of water delivered to the wall surface during a wetting cycle. The average was measured at 2.25 L/m2·min. Ref. [38] prescribes that the deviation of the measured WDR application from the nominal values should not surpass 0.5 L/m2·min, which was adhered to by all measured values as proven by the WDR gauge readings. Furthermore, the flow meter utilised in the setup complied with the standard’s requirement for ±10% accuracy in measuring the amount of supplied water.
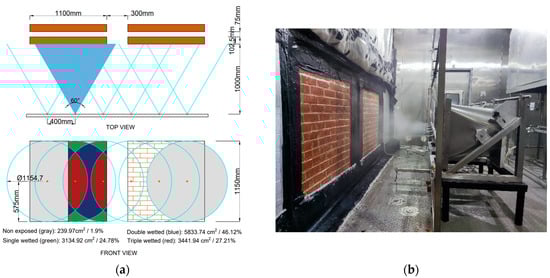
Figure 5.
(a) Theoretical wetting patterns of wall specimens during WDR tests and (b) WDR wetting in action.
In summary, the WDR test protocol in the outdoor chamber consisted of cyclic application of 10 min of wetting at a rate of 2.25 L/m2·min at 15 °C every 60 min between conditioning intervals at a constant 20 °C, with a wind speed of 6 m/s (22 Pa). Indoor conditions were set at a constant of 20 °C and 50% RH. As shown in Table 4, the WDR test was divided into four phases over 52 h: all walls were exposed to 2 WDR cycles in the first phase of the test, then conditioned for 20 h at 20 °C T, 50% RH in Phase 2; in Phase 3, untreated walls were exposed to 6 wetting cycles, while treated ones were exposed to 8 cycles, and again all underwent 22 h of drying with the same conditions in Phase 4. The drying times for Phases 2 and 4 took into account the observation that no significant weight loss could be observed after 20 h of drying.
Table 4.
WDR test program.
Table 4 and Table 5 summarise the rate and amount of water applied to each specimen in each phase. Phase 1 applies a total of 45 L/m2 to the specimen, an amount within the range of 33–56.5 L/m2 per spell, representative of a moderate exposure zone. Phase 3 represents an exposure rate of 135 L/m2 and 180 L/m2 per spell for untreated and treated specimens, respectively, in excess of both the severe exposure range (56.5–100 L/m2) and the very severe exposure range threshold (100+ L/m2), as defined in Figure 1, and therefore representing extreme conditions.
Table 5.
Water application rate per wall specimen.
3. Results
For each of the phases described in Table 4, the results were analysed and compared for each specimen couples considering the in-wall RH and T sensor readings and various combinations of the readings of the load cells to best interpret the weight change in terms of water absorption and release.
Given the substantial difference in performance and responses to WDR, the results of the untreated and treated specimens are presented separately. For the untreated specimens, a more comprehensive discussion is provided, including detailed results and analyses of the RH and T variations, as well as weight changes for the inner/outer leaves and central/edge regions. In contrast, the focus in the presentation of the treated specimens is primarily on highlighting their distinct behaviour compared to the untreated specimens. Although two specimens were tested for each treatment, for the sake of ease of reporting, the results for specimen 1 are directly compared in Section 3.2.
3.1. Untreated Walls
3.1.1. Phase 1: Two Wetting Cycles
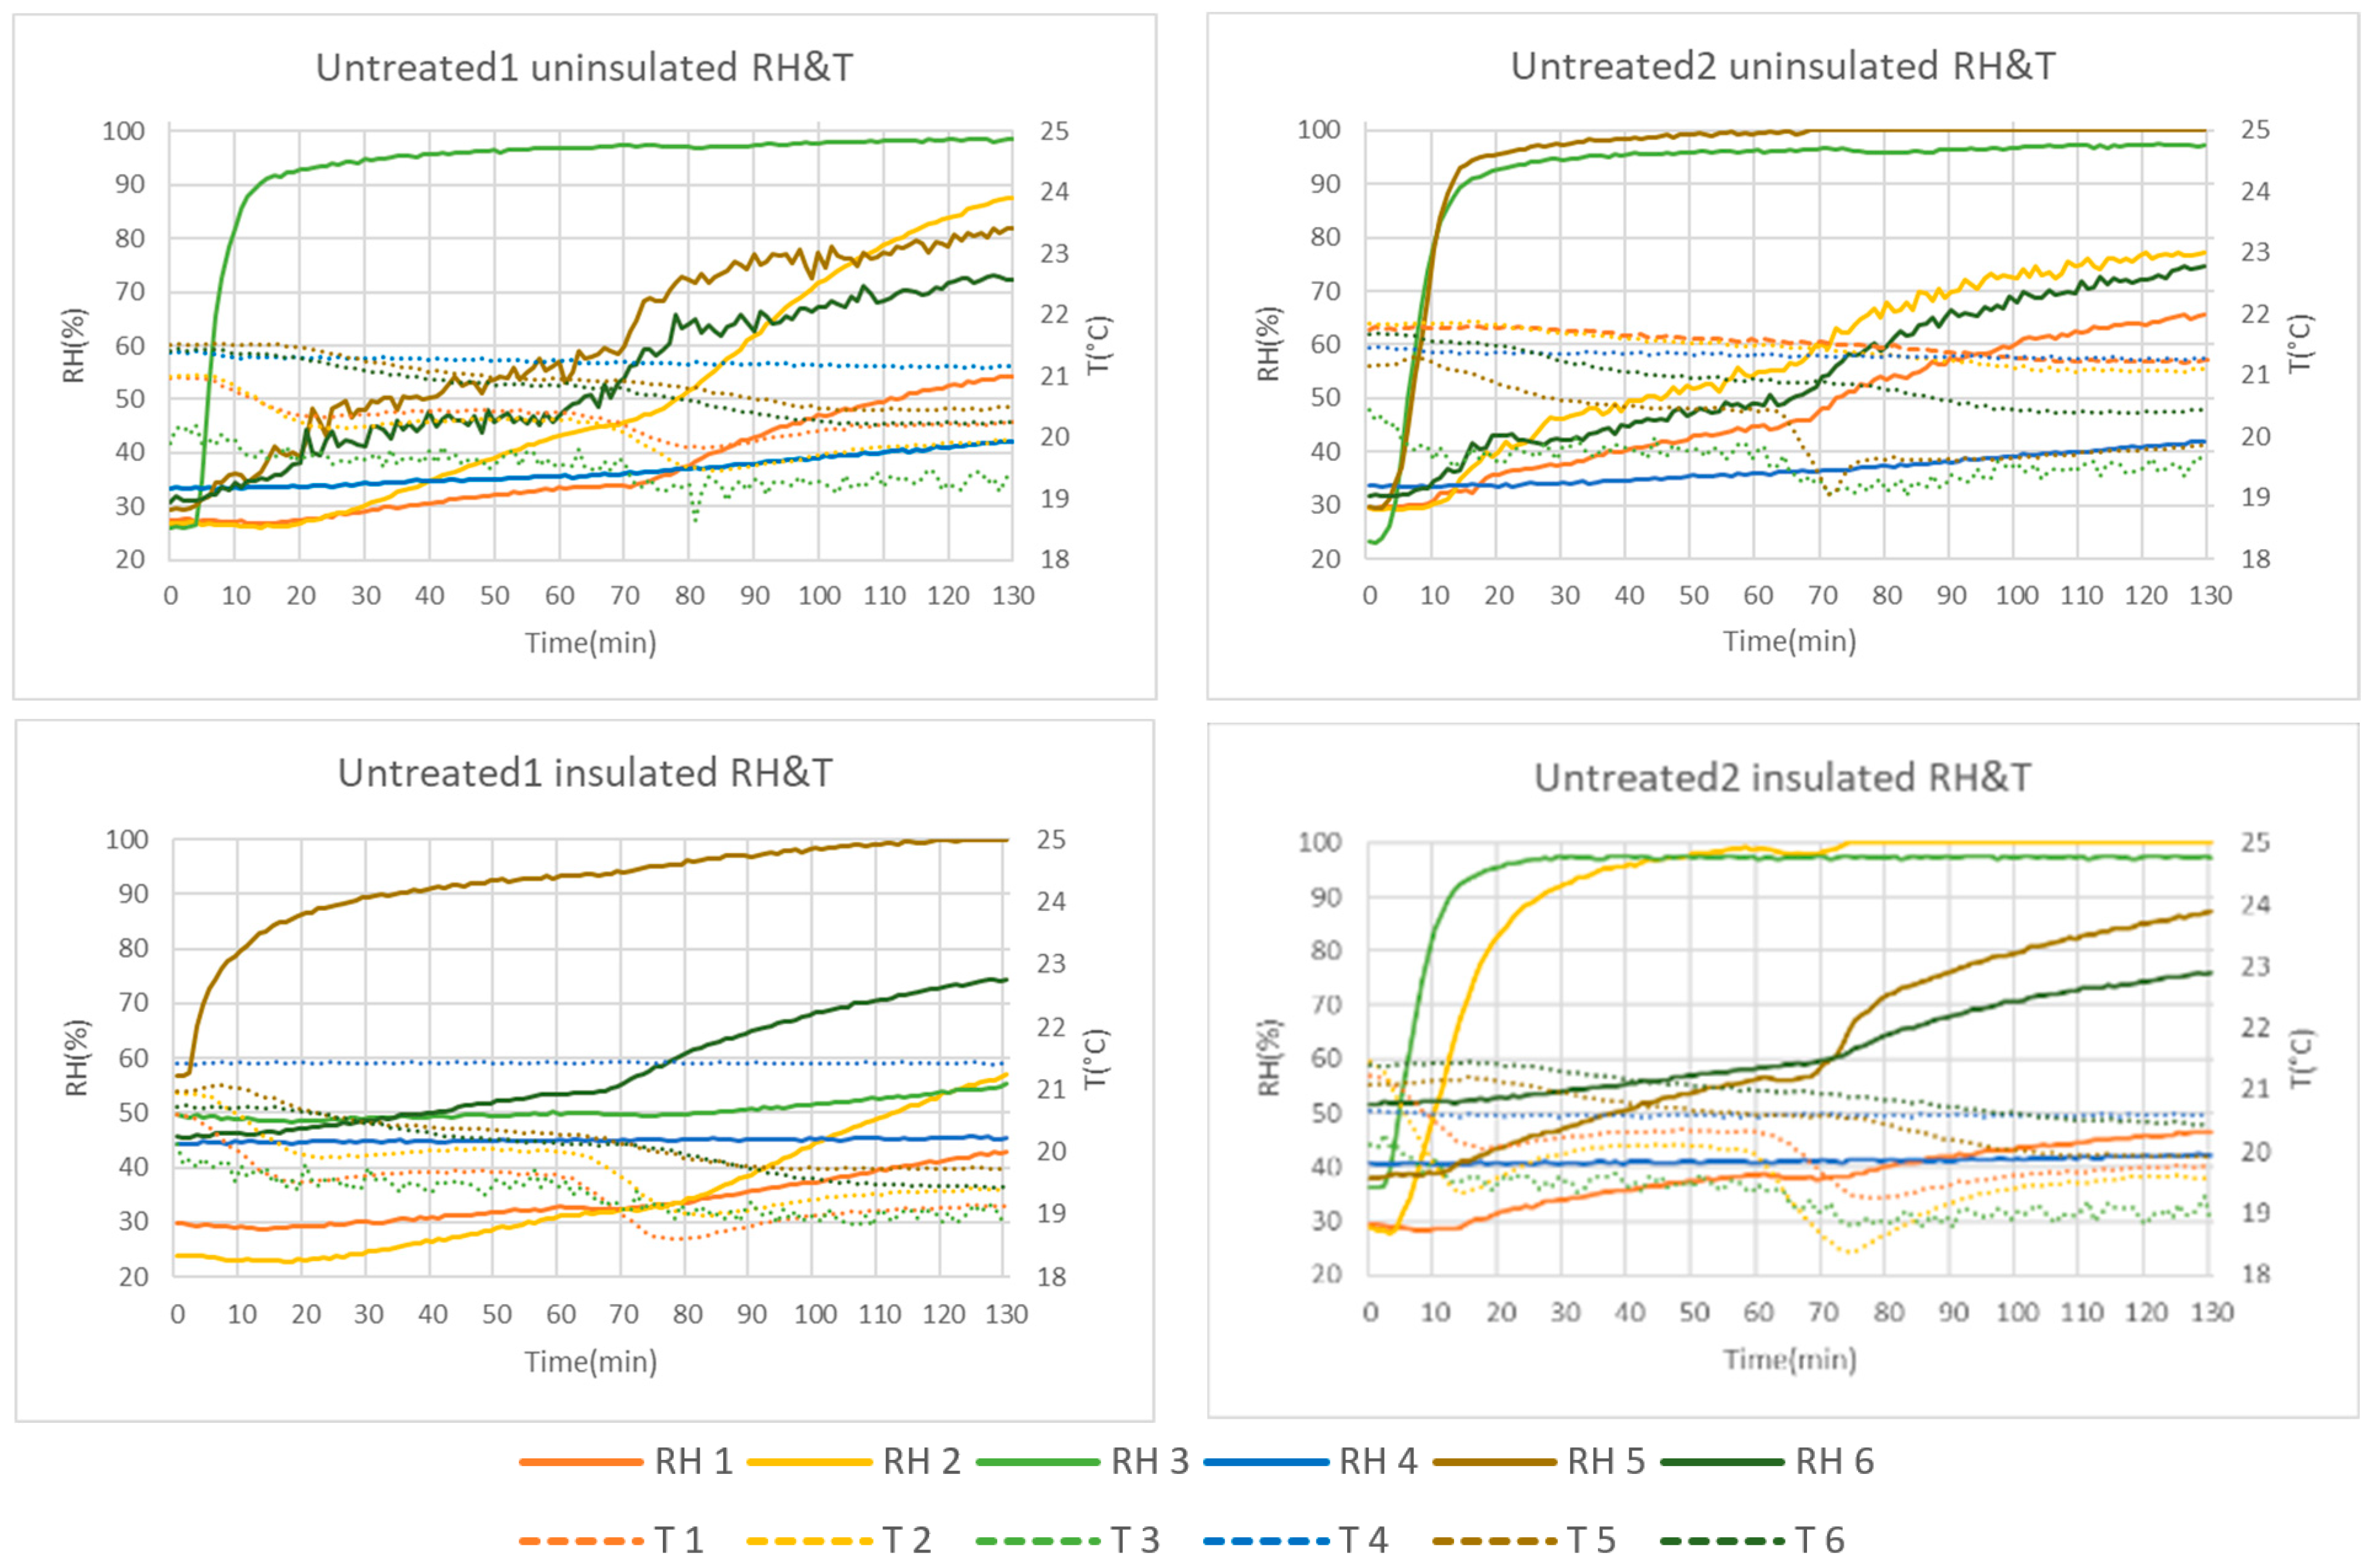
Figure 6 shows the in-wall RH and T sensor readings of the untreated specimens 1 and 2, both uninsulated and insulated conditions, during the two wetting cycles of the first phase. In the uninsulated case, the RH readings of Sensors 3 in both walls and Sensor 5 in wall 2 show a rapid increase after 5 min of contact with water and reach near saturation by the end of the two wetting cycles. A similar trend can also be observed for Sensor 5 in insulated wall 1 and Sensors 2 and 3 in insulated wall 2. It should be noted that apart from Sensor 3, there is no consistency among the sensors’ quick gain in moisture in the uninsulated and insulated states of the same specimen, indicating that this might not be necessarily related to lack of integrity in the wall fabric. The wetting pattern and water runoff may also have an impact on the results. Indeed, Sensors 1 and 2 located near the top of the walls usually gain RH at a lower rate compared to Sensors 5 and 6 located near the bottom of the walls due to the impact of runoff. A faster increase is observed for the unsaturated sensors in the outer leaf at the beginning of the second wetting cycle. On the other hand, a minor RH gain from 33%RH to 42%RH is observed for Sensor 4 in the inner leaf of both uninsulated walls, while in the insulated conditions, it remains constant at 40%, showing the effectiveness of the insulation.
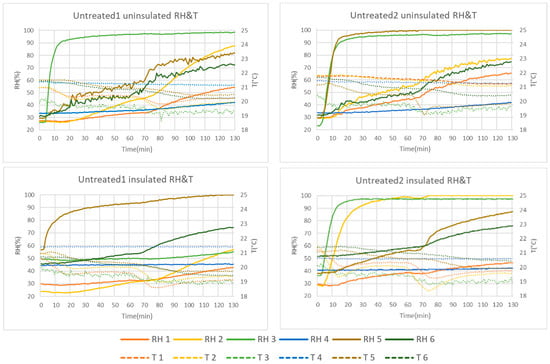
Figure 6.
Untreated Specimens 1 and 2, uninsulated and insulated, RH and T variations during Phase 1.
A temperature reduction up to 1 °C can be observed during the 10 min wetting cycle with a consequent slight increase during the 50 min conditioning period. Sensors with a higher rate of RH gain show a proportionally greater reduction in temperature. This is consistent throughout all tests.
The load cells installed under each specimen record the weight change in the inner and outer leaves during each test period, indicating the amount of water absorbed by the walls. Figure 7 shows the percentage of weight change in the inner and outer leaves of the untreated specimens 1 and 2, uninsulated and insulated conditions. The load cells are very sensitive and responsive to the variation in weight resulting from slight out-of-plane oscillations generated by a variation in the wind pressure produced by the fans and by the vibration caused by the chamber motors. To eliminate these spikes, which do not refer to a gain in weight, a moving average was applied to the reading of the coupled load cells in Figure 7. Spikes appearing during the 10 min wetting were removed by averaging the inner and outer leaf readings using adjacent data points while keeping the sum of the weights measured at the two edges of each wall and the sum of the four load cells constant. In the 50 min conditioning periods, the noise mirrored on the inner and outer leaves is caused by the wind load of the chamber’s circulation and drying fans.
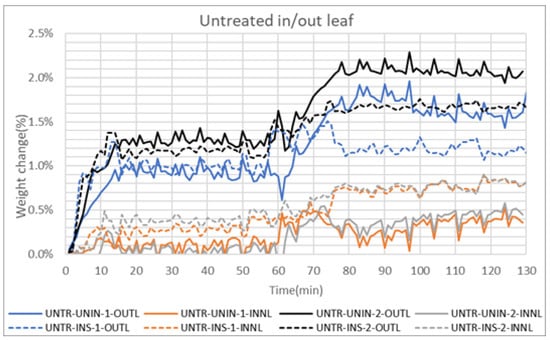
Figure 7.
Untreated Specimens 1 and 2, uninsulated and insulated, inner/outer leaf weight change during Phase 1 (OUTL and INNL stand for outer and inner leaves, respectively).
As a result of the wetting, the outer leaf of the untreated uninsulated specimen 1 gained around 0.95% of its overall weight after the first cycle and 0.9% after the second, while the outer leaf of the untreated uninsulated specimen 2 gained 1.3% after the wetting of the first cycle and 0.8% from the second cycle. The inner leaf of both walls shows a minor gain in the first cycle, 0.1% and 0.08%, respectively, but gradually increased to 0.4% and 0.5% by the end of this phase.
The behaviour observed in terms of the RH gain between the uninsulated and insulated cases is also confirmed by the weight gain. However, for the insulated specimens, the weight gain during the first cycle is substantially greater than in the second, and the apparent reduction in weight in specimen 1 during the second drying cycle is more pronounced. Overall, the untreated insulated specimen 1 gained up to 1.4% on the outer leaf, before losing 0.3% by the end of Phase 1 and gained 0.8% on the inner leaf. The untreated insulated specimen 2 gained 1.65% on the outer leaf and 0.8% on the inner leaf.
The comparison of the graphs in Figure 7 clearly highlights that the presence of the insulating beads increases the water transfer to the inner leaf, although this was not confirmed by an increase in RH by Sensor 4, which leads to the hypothesis that this water transfer occurs in the lower courses of the specimens. This is often a concern in practice.
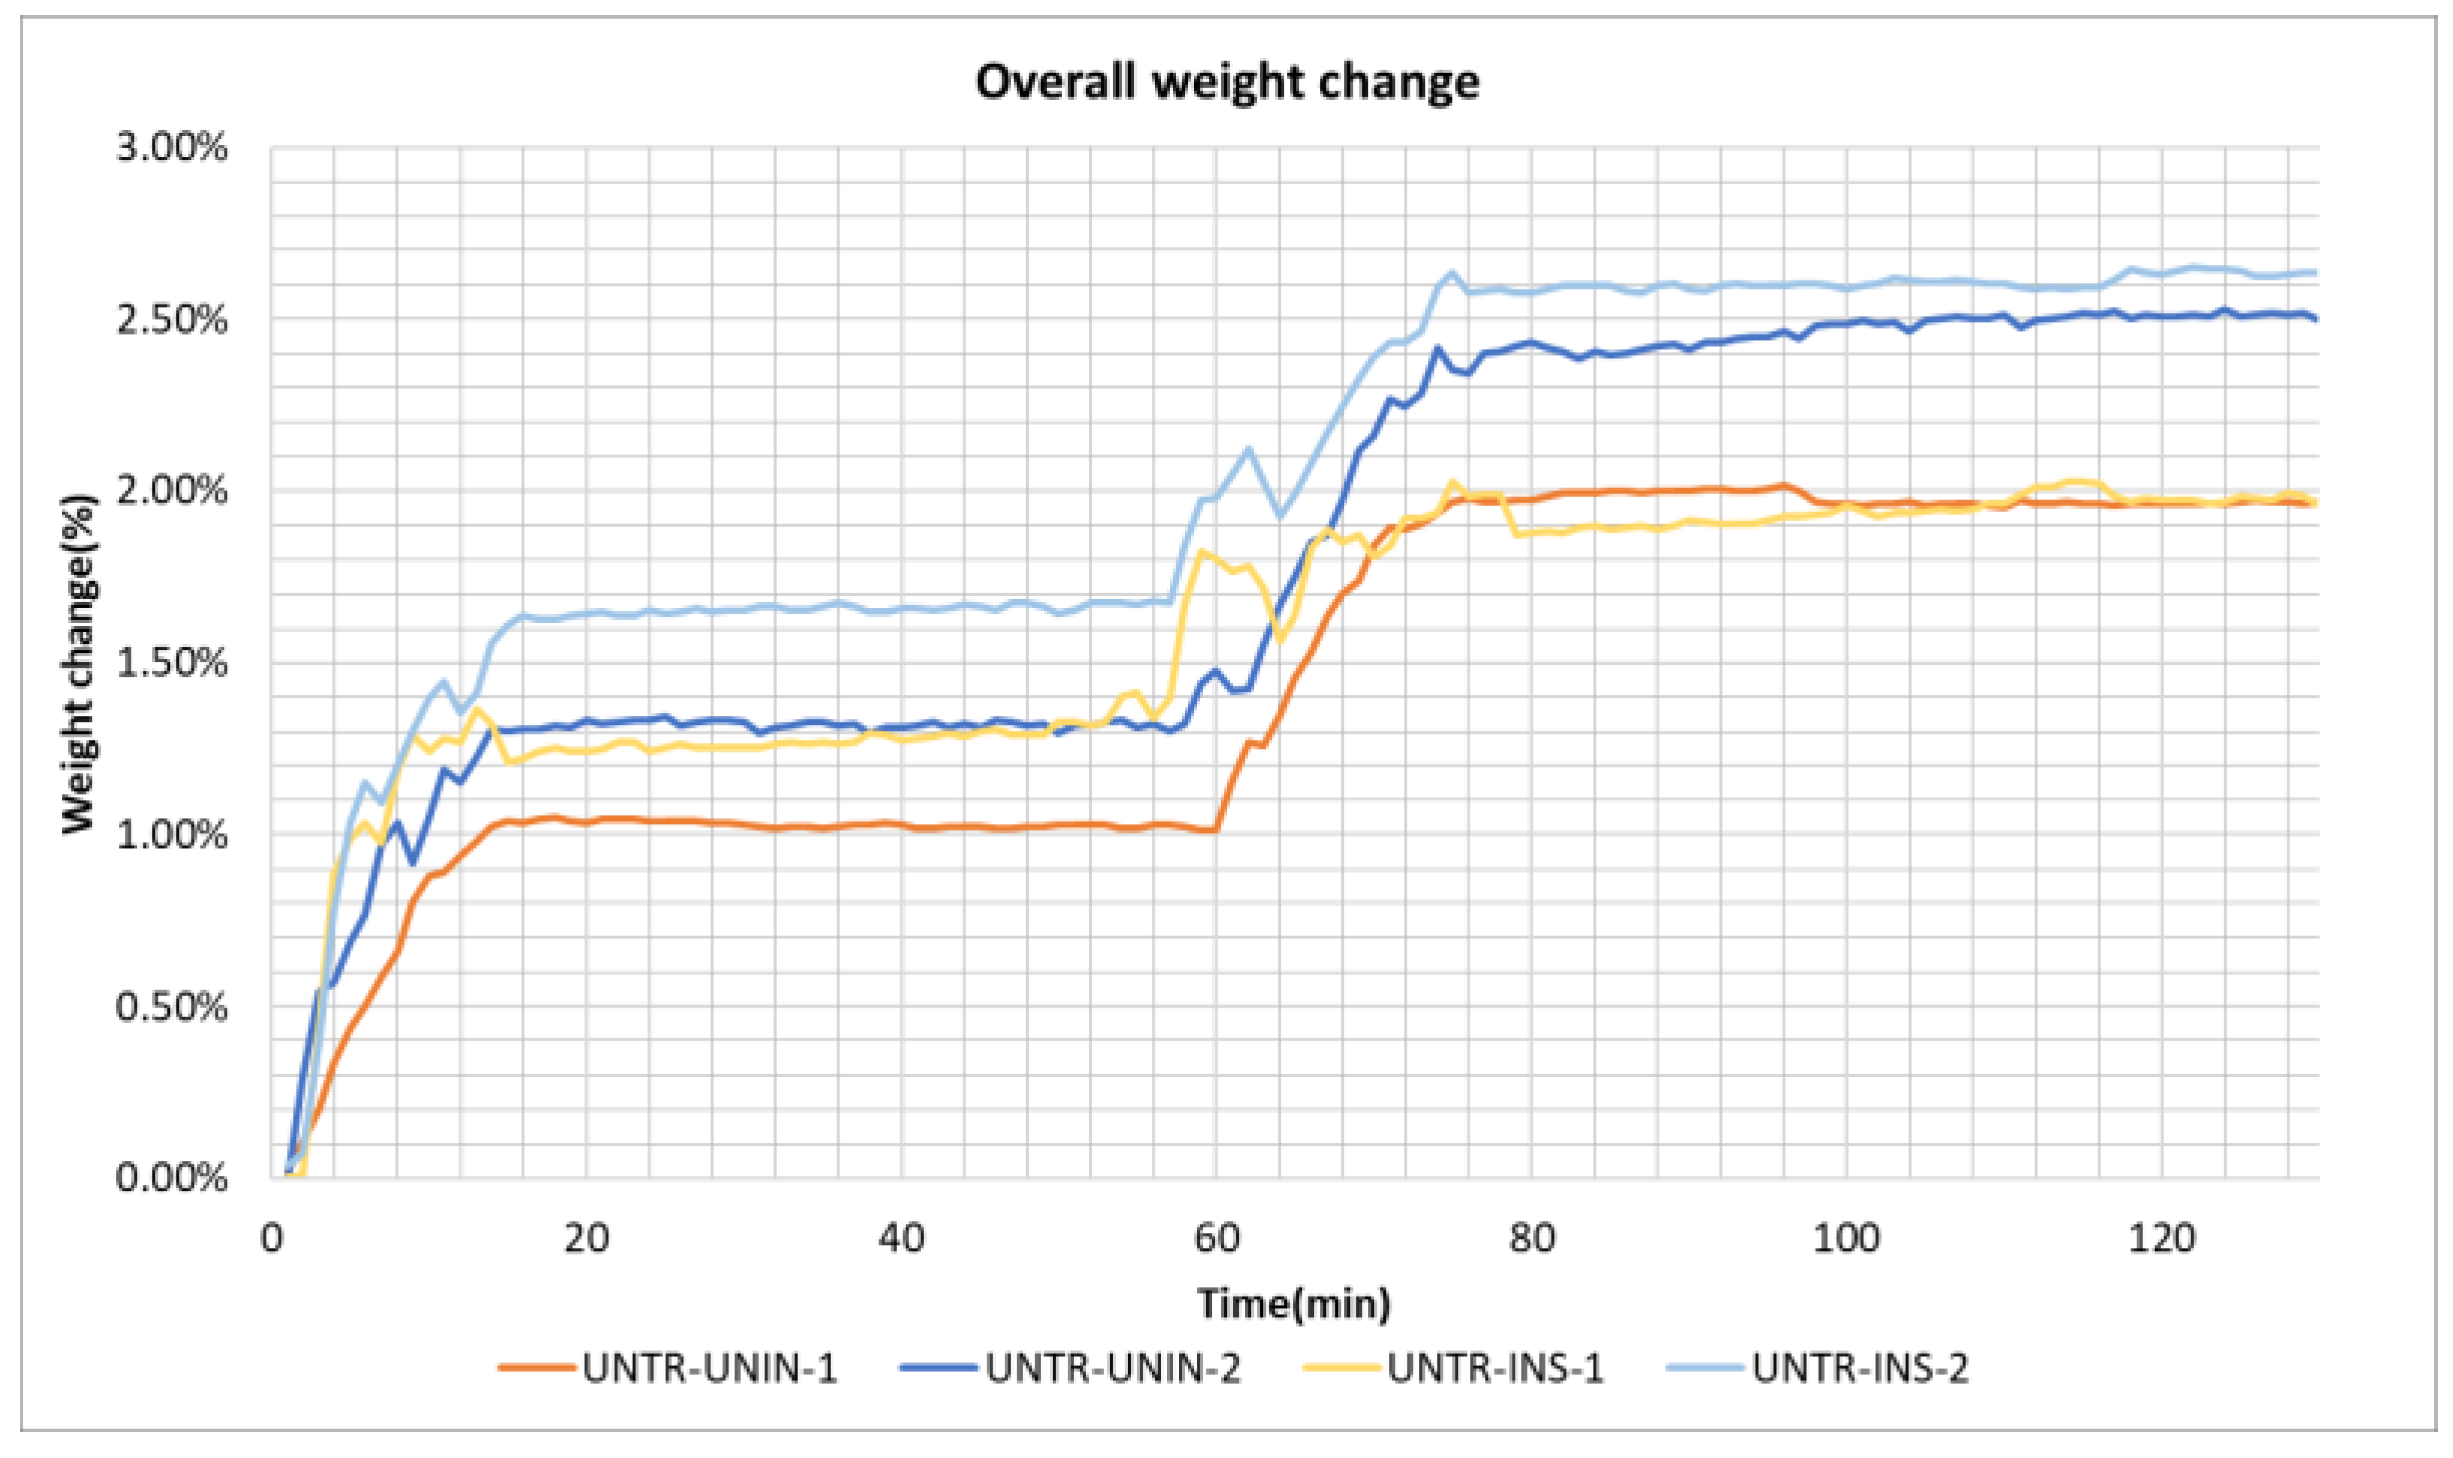
An overview of the water absorption for the four specimens based on the overall weight change is given in Figure 8. It is evident that specimen 2 absorbed more water in both uninsulated and insulated cases (2.5% and 2.64%, respectively) with respect to specimen 1 (1.98% in both cases). It should also be noted that the difference in the overall relative weight gain is substantially the same for the uninsulated and insulated cases, outlining the importance of analysing the inner and outer leaf gains separately, see Figure 7.
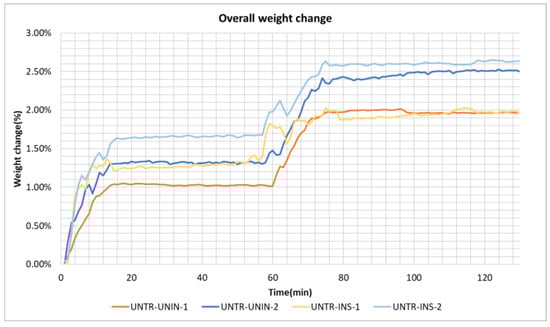
Figure 8.
Phase 1 total weight change in Untreated specimens 1 and 2, uninsulated and insulated.
3.1.2. Phase 2: Overnight Drying
Following the two wetting cycles, specimens were conditioned at constant 20 °C T and 50% RH for 20 h, for both indoor and outdoor chambers, with the wind speed maintained at 6 m/s on the exposed face of the walls. For all specimens, the unsaturated sensors on the outer leaf show a further gain in RH of about 15%. A similar gain of about 20% RH is observed for Sensor 4 on the inner leaf. The drying conditions, while reducing the surface moisture, aid the process of moisture migration. This confirms the results of previous tests conducted by [6,60]. Moisture readings are in broad agreement with the weight change observed at the inner and outer leaves of both walls. Uninsulated specimen 1 undergoes a weight reduction of about 0.34% on the outer leaf and of 0.13% on the inner leaf, while for the uninsulated specimen 2, the measurements are 0.11% and 0.36%, respectively. For the insulated specimens though, a weight loss of about 0.2% at the outer leaf is accompanied by a weight gain at the inner leaf of 0.4% on average, indicating the migration of moisture through the insulation beads and absorption on the inner leaf. This is a common phenomenon in masonry walls be they single- or double-leaf. However, this migration of moisture continues during the conditioning phase when insulation is present, so that the loss of weight of the internal leaf is not apparent. This is why it is important to treat the external surface of the external leaf to prevent moisture ingress in the first place.
3.1.3. Phase 3: Six Wetting Cycles
For the third phase, the specimens were exposed to six cycles of wetting and drying, following the same protocol as Phase 1. For all four specimens, all the sensors on the outer leaf become saturated in the earlier part of this phase. During the test, the increase in RH at the inner leaf ranges between 2.4% and 3.1% across all specimens. The reduction in temperature at the end of the phase is about 2 °C.
The change in weight for the outer and inner leaves is presented in Figure 9a for the uninsulated and insulated specimens. For the uninsulated pair, the weight gains on the outer leaf reach a maximum of 2.6% for specimen 1 and 1.9% for specimen 2, while the inner leaf gains are 0.2% and 0.7%, respectively. Gains for the insulated cases are more modest for the outer leaves, with specimen 1 absorbing less than specimen 2. The weight increase in the inner leaves is greater for the insulated cases reaching a peak of 0.9%. For all walls, the amount of weight gain on the outer leaf gradually reduces over the wetting cycles, but for specimen 1 in both the uninsulated and insulated cases, an upward trend is maintained. Figure 9b presents the total weight gain of the four specimens. For the uninsulated walls, the gain is 2.85% for specimen 1 and 2.62% for specimen 2, while for the insulated cases, the weight gains are 2.29% and 2.6%, respectively. In the case of wall 2, the total weight gains in the uninsulated and insulated cases are virtually equal, and of the same order of magnitude as in Phase 1, notwithstanding the three-fold increase in the number of wetting cycles.
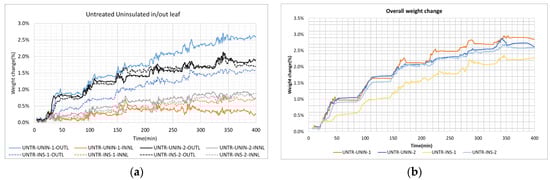
Figure 9.
(a) Untreated specimens 1 and 2, uninsulated and insulated, inner/outer leaf weight change in Phase 3; (b) Total weight change in Untreated specimens 1 and 2, uninsulated and insulated in Phase 3.
3.1.4. Phase 4: Post-Test Conditioning
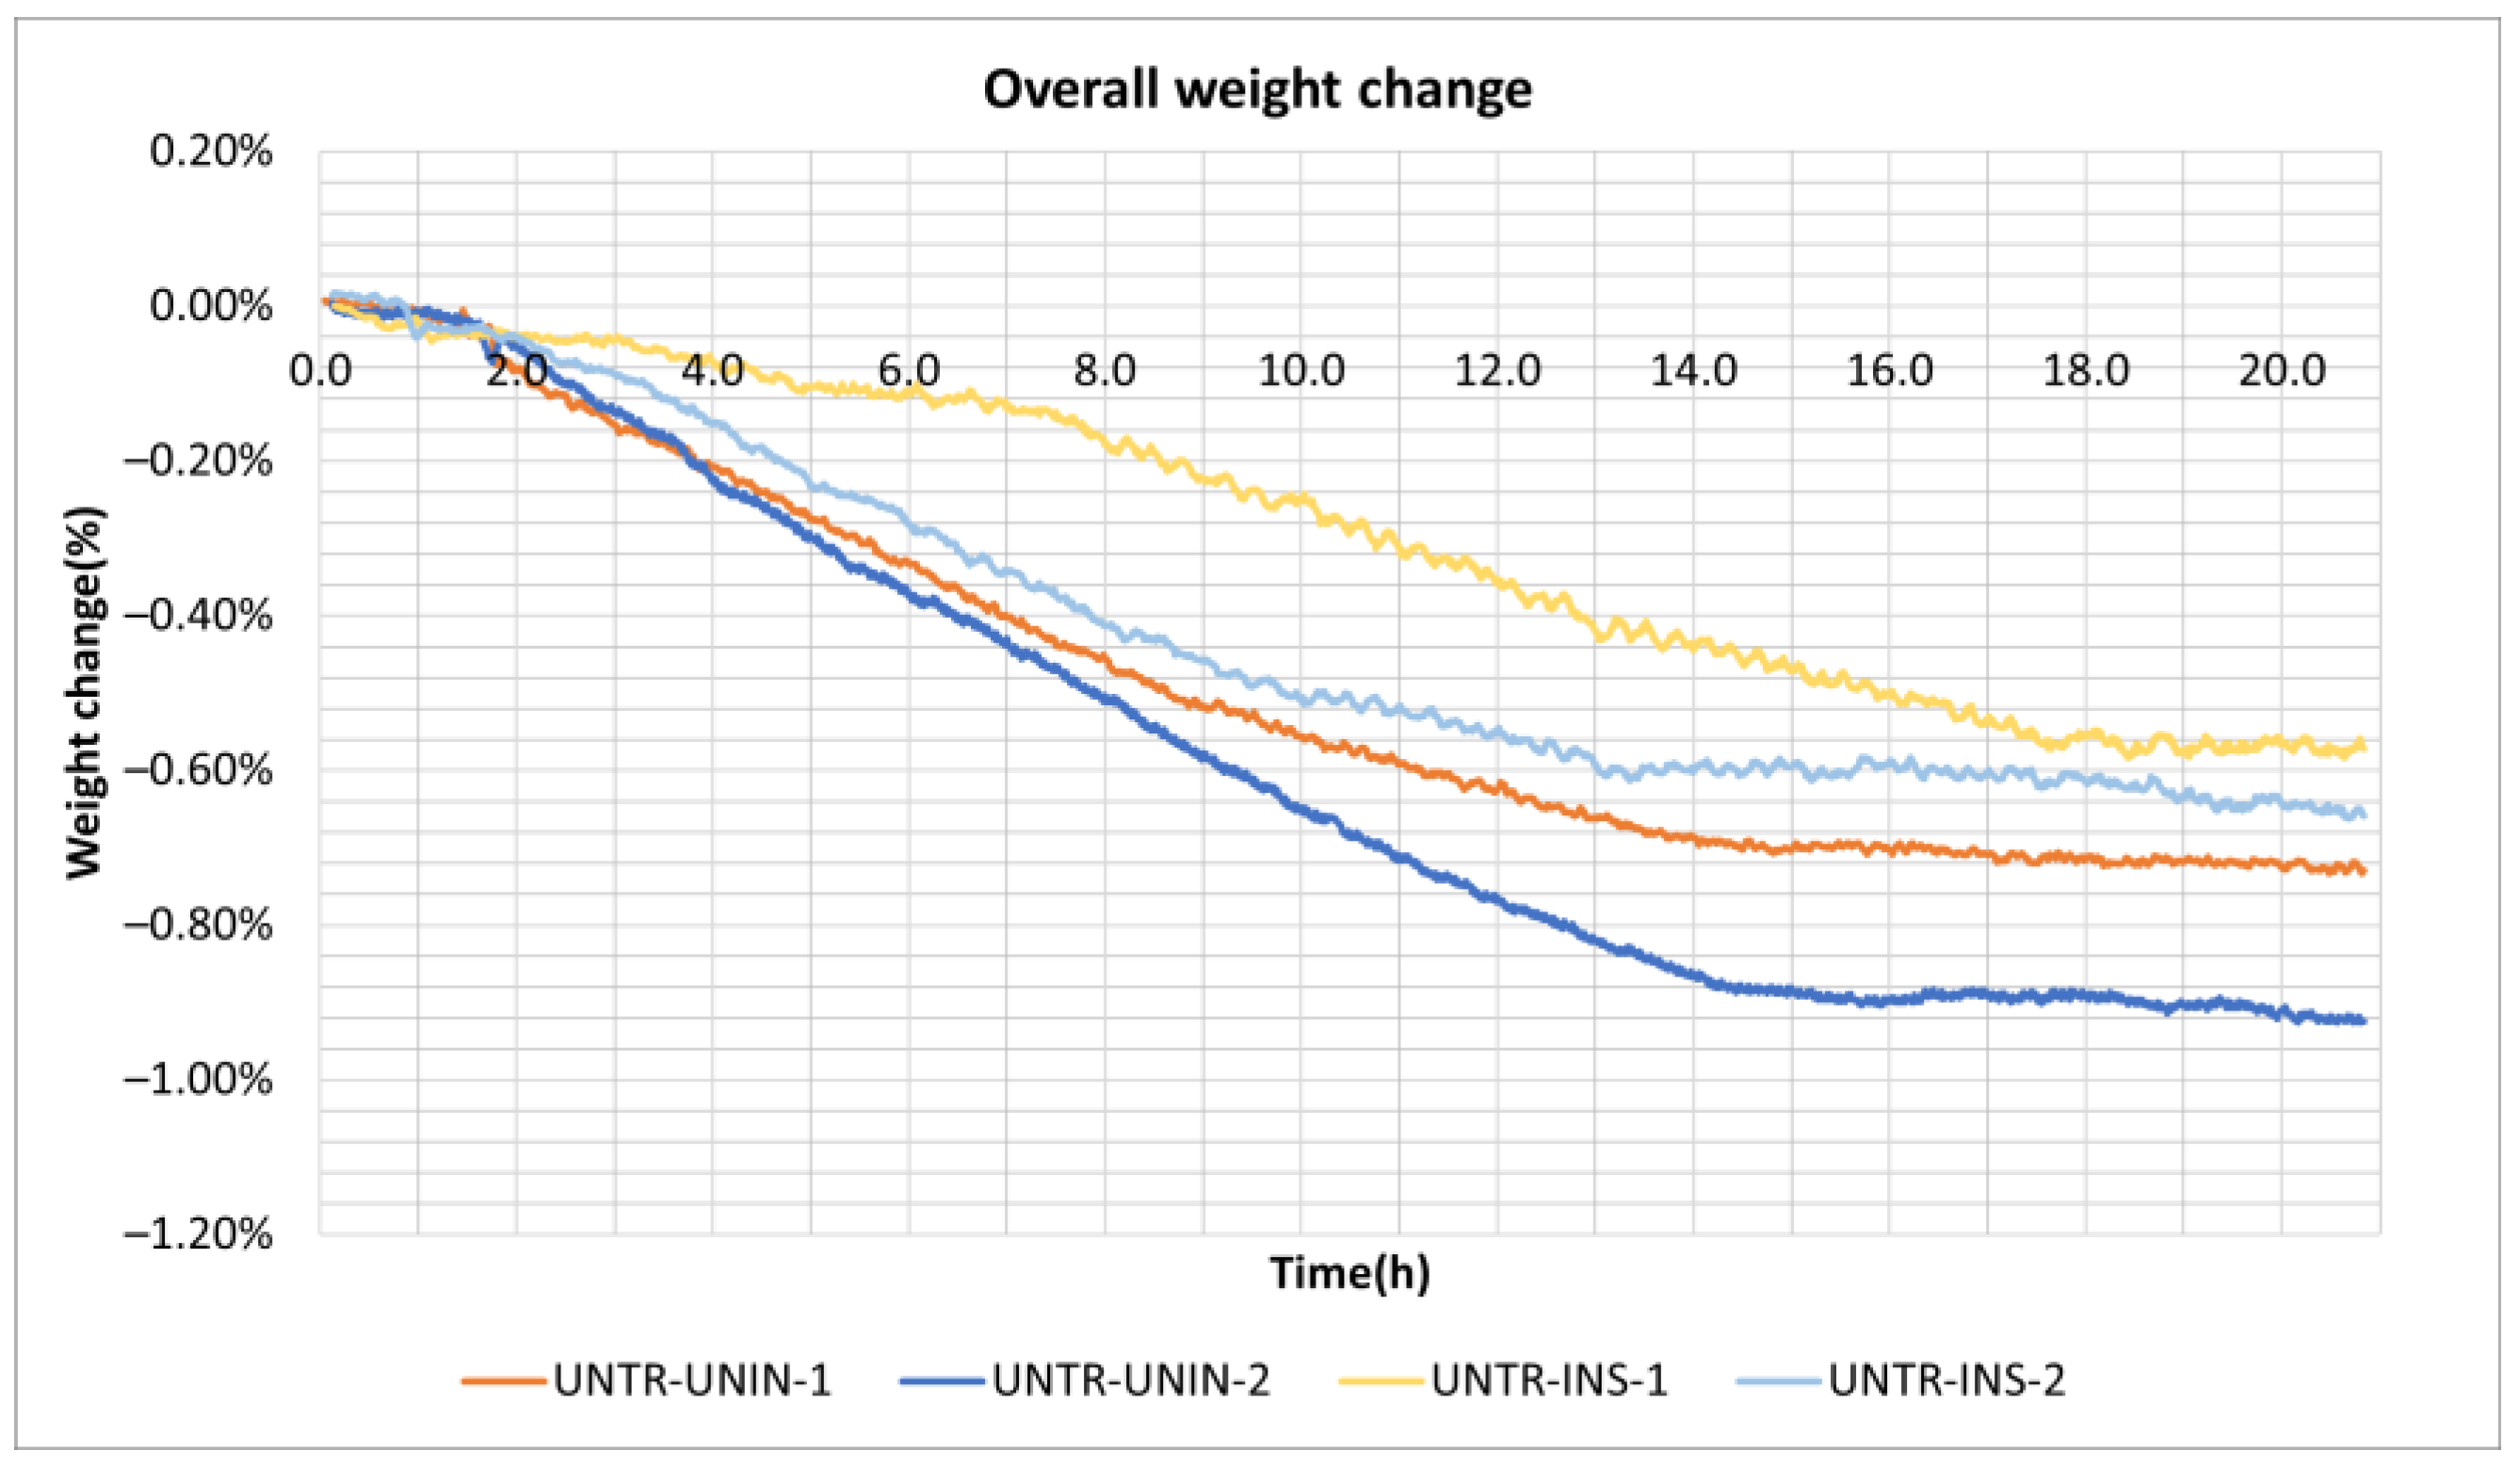
The post-wetting conditioning lasts 22 h at 20 °C and 50% RH for both the outdoor and indoor chambers. No major recovery of the RH sensors of the outer leaves was noted for any specimen. However, the RH readings of the inner leaf sensor increase from 66% to 71% for the uninsulated walls, while for the insulated cases, the increase is from 61% to 64% on wall 1 and 63% to 65.5% on wall 2. On the other hand, all specimens show a substantial weight loss at the outer leaf of all walls (see Figure 10). Overall, there were much smaller gains on the inner leaf compared with Phase 2. Figure 10 shows that the majority of weight loss occurs between 100 and 800 min from the start of the conditioning period. By the end of this phase, specimen 1 loses 0.73% weight, while specimen 2 loses 0.94% in the uninsulated case. For the insulated specimens, losses are 0.58% and 0.68%, respectively, showing greater moisture retention compared to the uninsulated conditions.
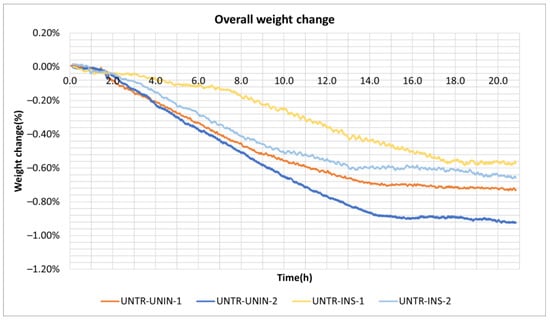
Figure 10.
Untreated specimens 1 and 2, uninsulated and insulated, overall weight change during Phase 4.
3.2. Surface Waterproofing-Treated Walls
Four specimens were treated with two different waterproofing products, one with an acrylic base and one with a silane–siloxane base. In what follows, the results are presented for one specimen only for each treatment directly comparing their performance. As a substantially different behaviour was observed between specimens Acrylic 1 and Acrylic 2 in the uninsulated condition, with a substantial intake of water by Acrylic 2, it was decided to reapply this surface treatment before testing the insulated specimens. The tests took place one month apart, during which time the two specimens were conditioned under 22 °C and 50% RH.
3.2.1. Phase 1: Two Wetting Cycles
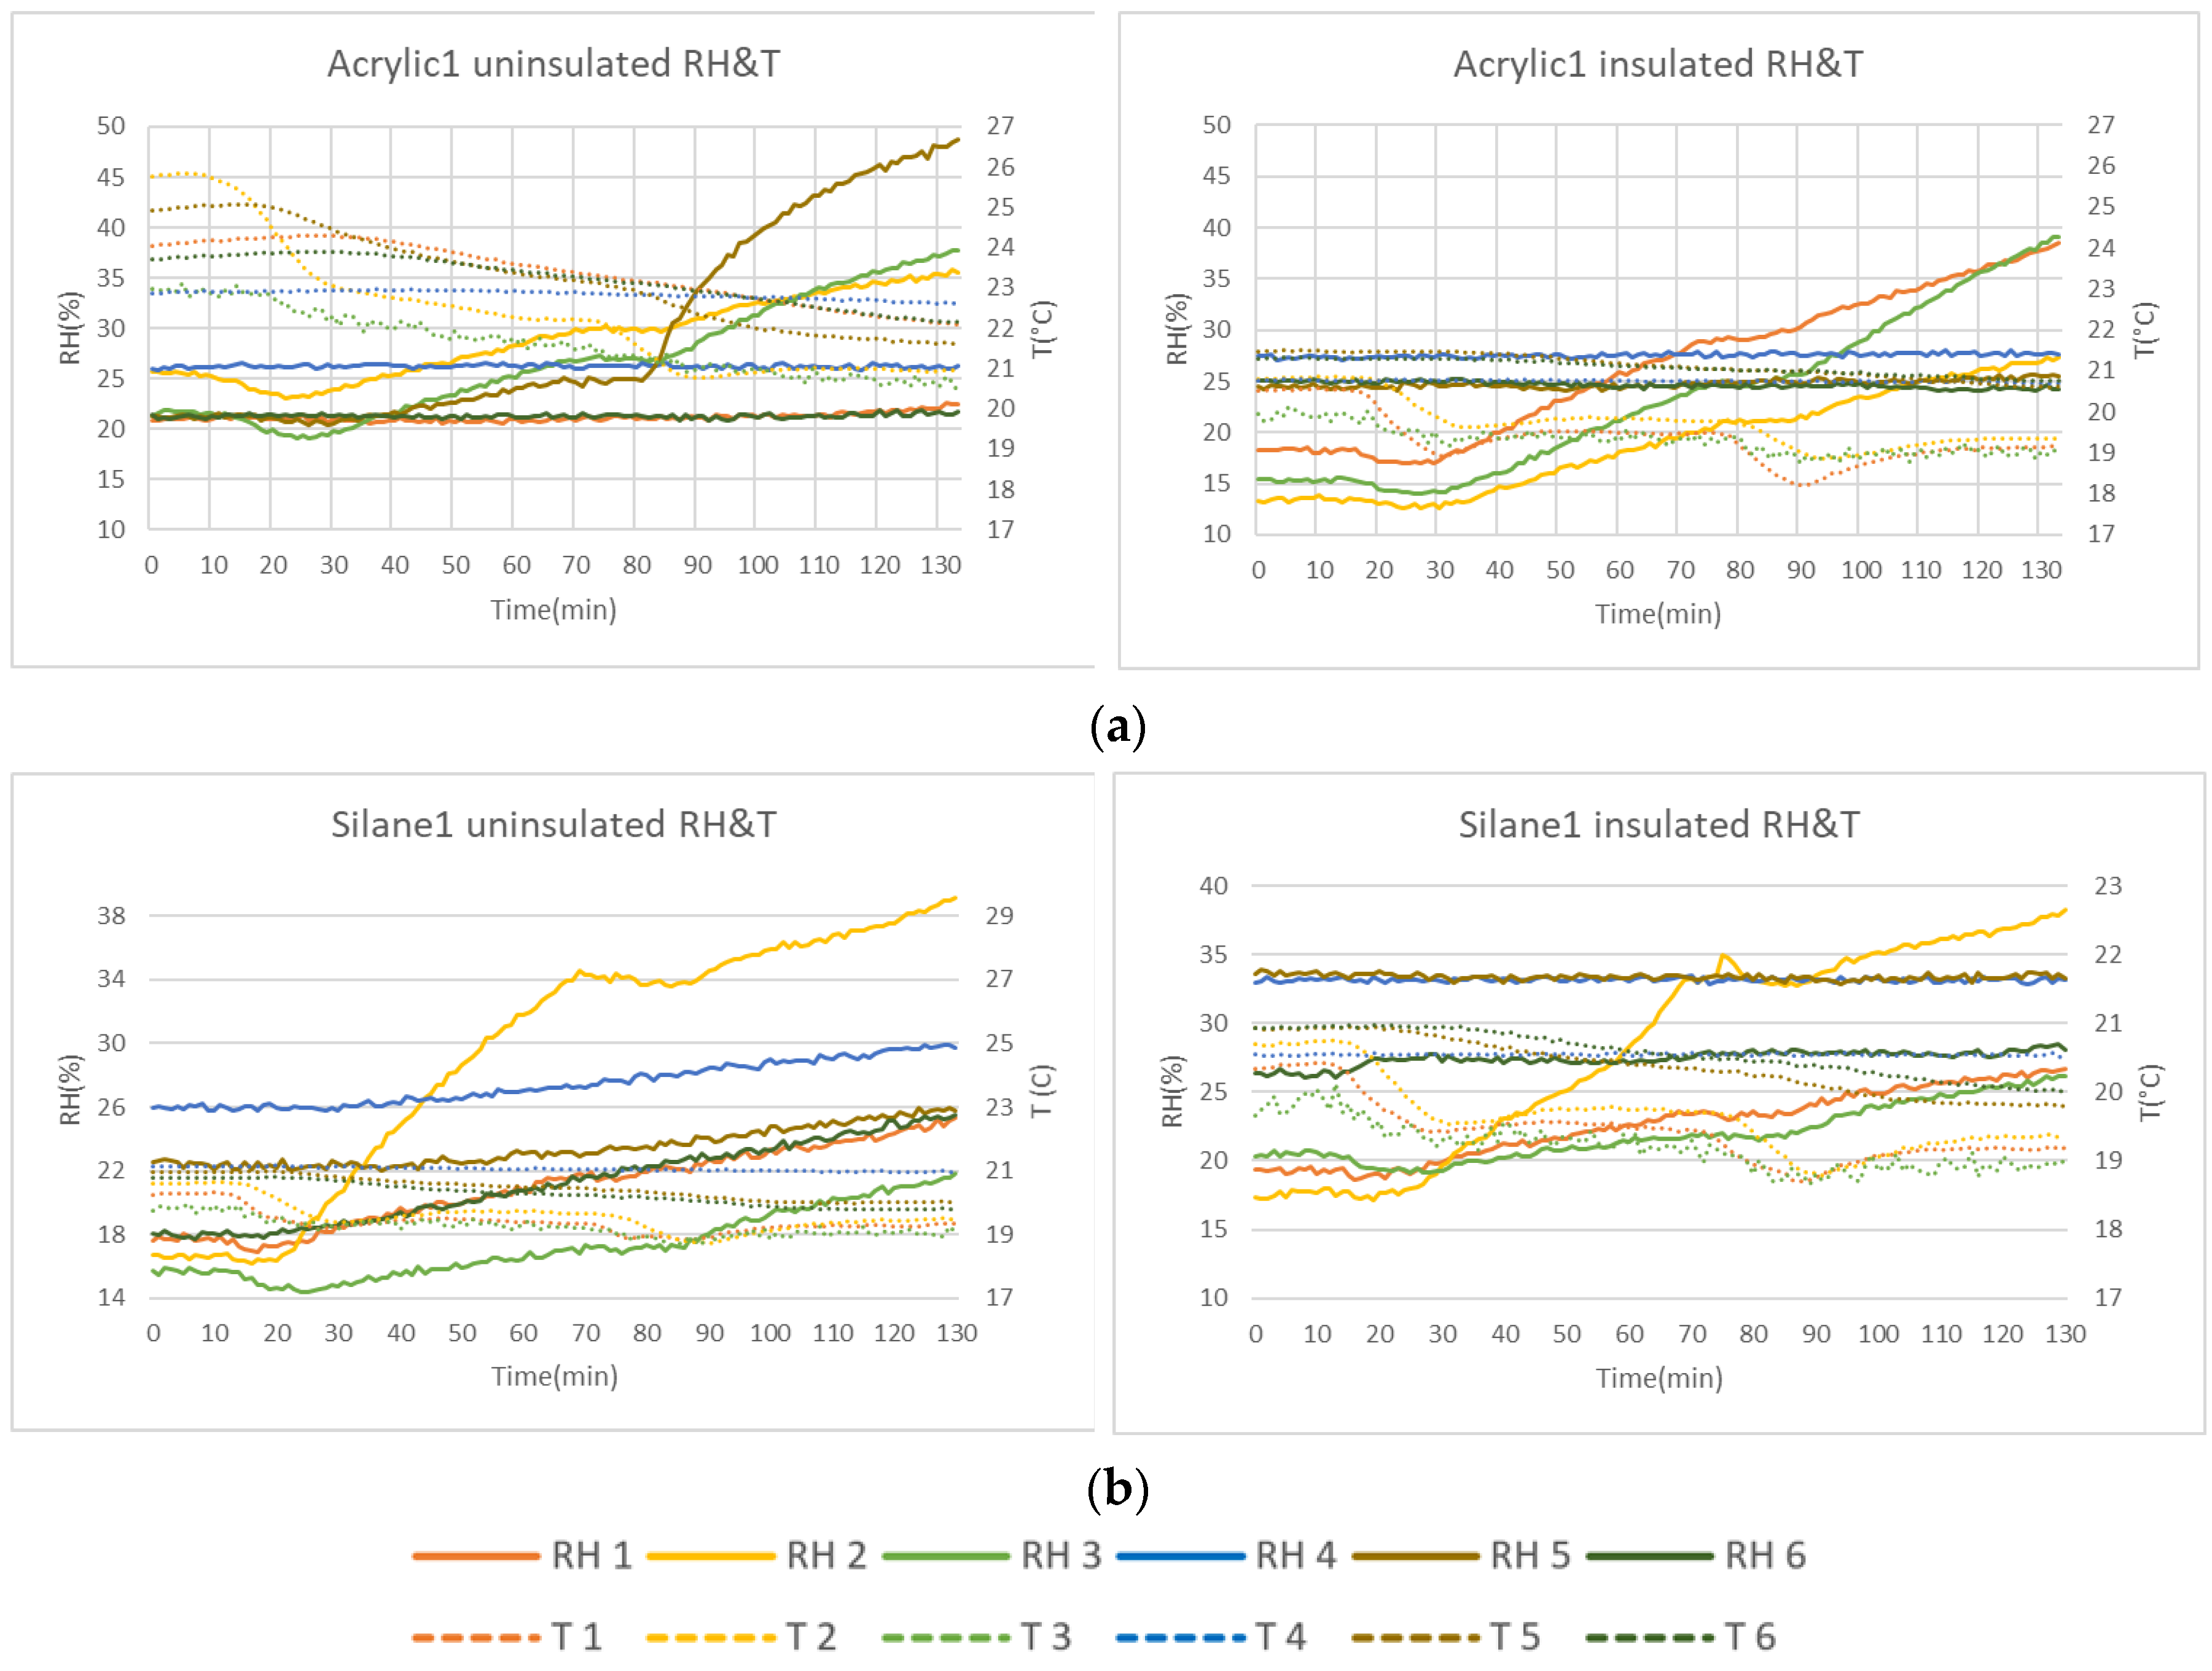
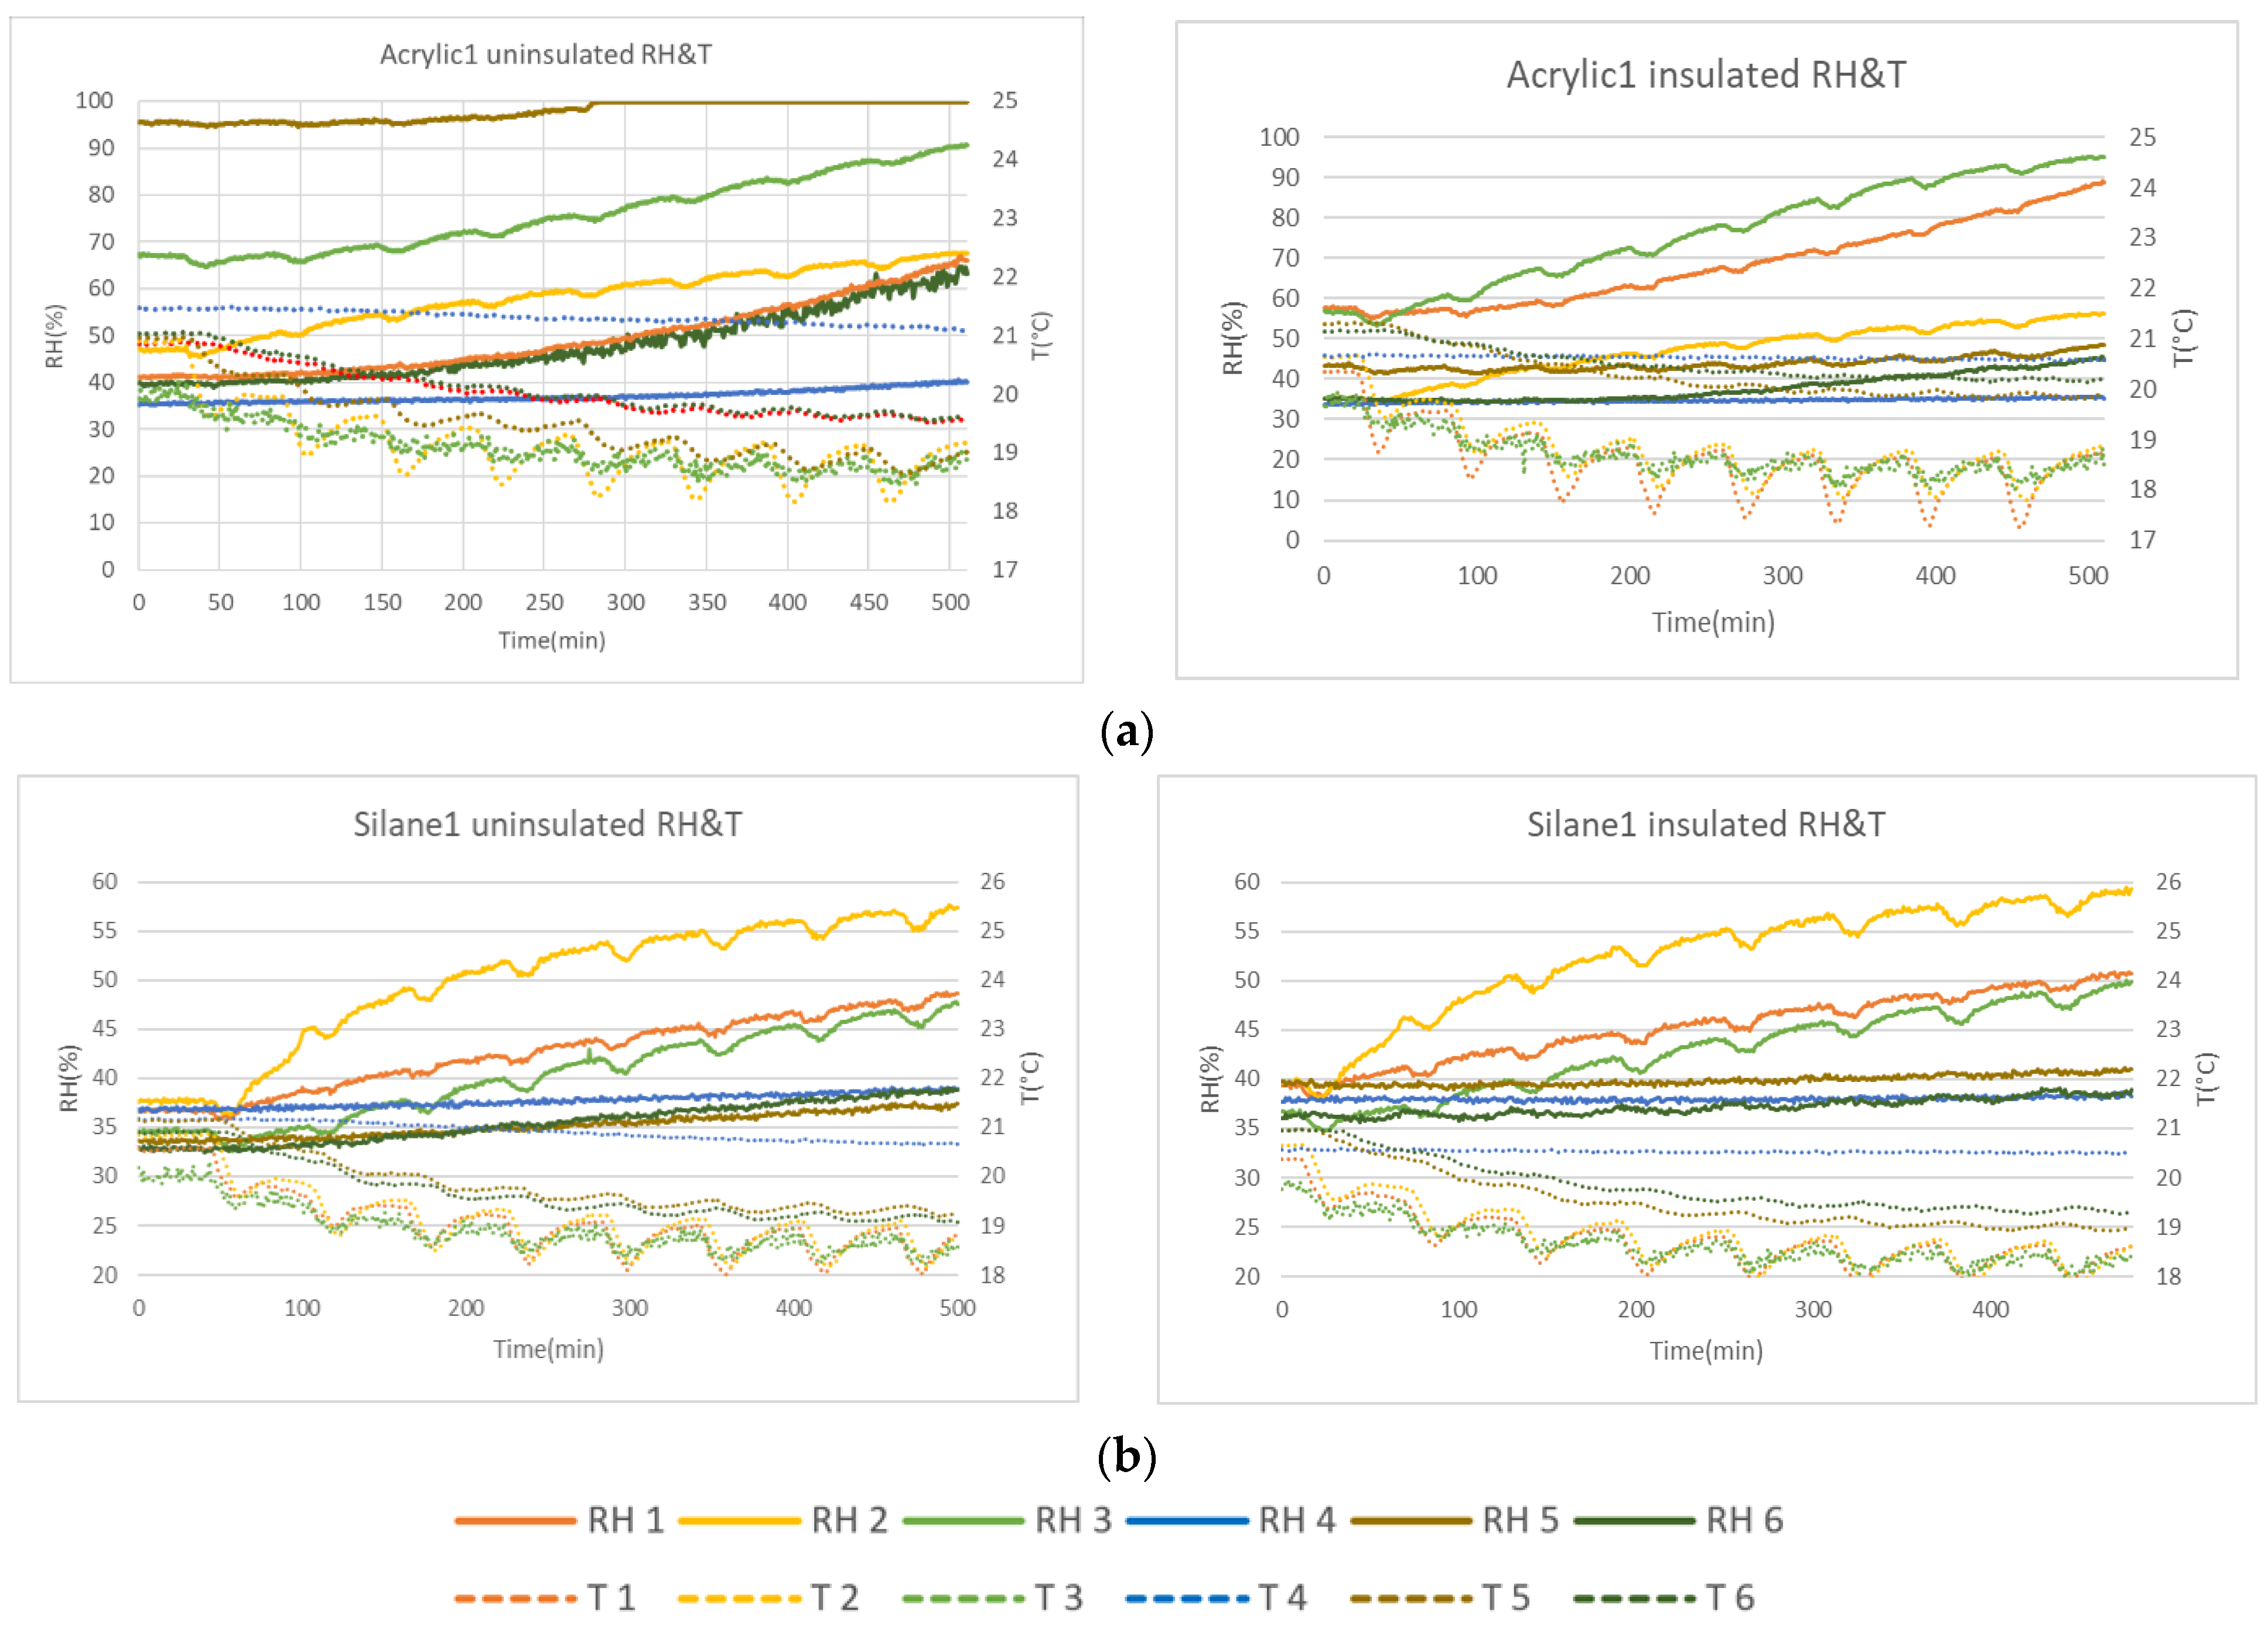
Figure 11a shows the RH and T changes in the uninsulated and insulated acrylic-treated specimen 1 during the two WDR cycles of Phase 1. For the Acrylic 1 uninsulated specimen, the first wetting cycle produces a modest increase in moisture in all sensors during the drying interval, while sensors 2, 3, and 5, show a sharper uptake of moisture during the second cycle, although the maximum RH does not exceed 50%. The reapplication of the treatment before testing the insulated specimens did not substantially change the behaviour of specimen 1, as can be seen from Figure 11a. Figure 11b shows the RH and T changes in the silane/siloxane cream-treated specimen 1, both uninsulated and insulated, during Phase 1. The RH readings of Sensor 2 set in the external leaf in bricks, reached the highest RH reading of about 40% RH. This is in agreement with the finding that the stronger waterproofing performance was seen on mortar rather than brick specimens during the water absorption test for this product. Overall, all RH readings of these specimens did not exceed 40% by the end of Phase 1, showing a consistent performance compared to the acrylic-treated specimens and a substantial reduction in RH gain compared with the untreated specimens.
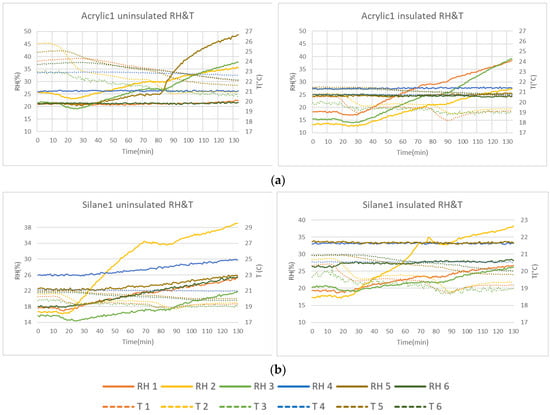
Figure 11.
(a) Acrylic-treated 1, uninsulated and insulated, RH and T readings during Phase 1; (b) Silane/siloxane cream-treated 1, uninsulated and insulated, RH and T readings during Phase 1.
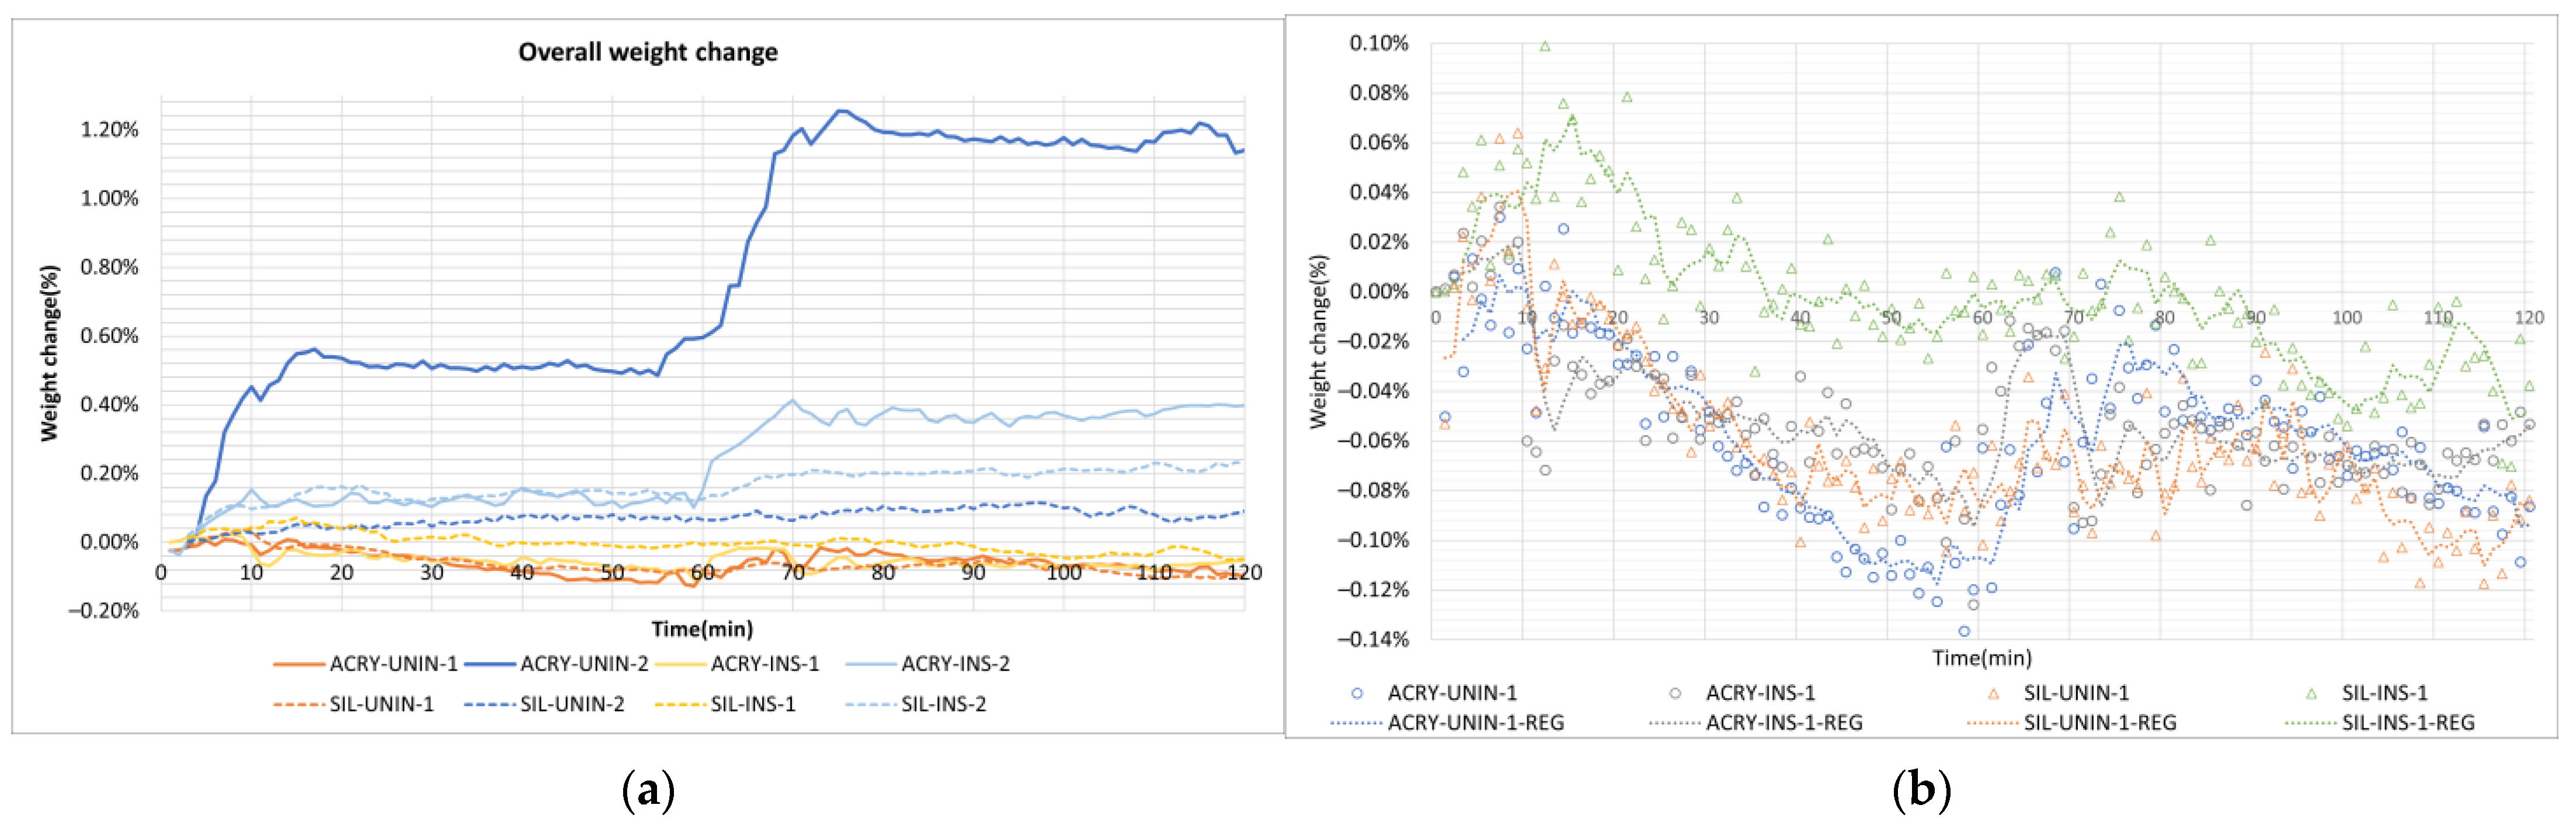
The percentage weight gain of the acrylic-treated and silane/siloxane cream-treated specimens, shown in Figure 12a for all four specimens, both uninsulated and insulated cases, confirms the observations on the basis of the RH sensors. It is evident that the second application of the treatment was indeed effective in substantially reducing the water uptake by about 55% for the Acrylic 2 insulated case with respect to the uninsulated case.
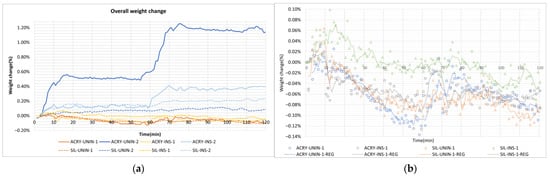
Figure 12.
Weight change for acrylic- and silane-treated specimens 1 and 2, uninsulated and insulated, in Phase 1. (a) comparison of the four tests; (b) detailed behaviour of Acrylic 1 and Silane 1, uninsulated and insulated.
From Figure 12b, showing an enlarged view of weight change in the specimens Acrylic 1 and Silane 1, uninsulated and insulated cases, it can be noted that, for both treatments, the minor weight gain during the 10 min wetting cycle is off-set by a non-negligible weight reduction during the 50 min conditioning period. The uptake is greater in the second cycle, while the drying is also less effective. The acrylic and silane treatments were both effective in preventing water ingress, and the drying regime is sufficient to reduce the modest weight increase in the wall system in both the uninsulated and insulated conditions. The RH sensors show a delayed increase in RH during the drying period as the surface wetting slowly diffuses to the inner pores.
3.2.2. Phase 2: Overnight Drying
The overnight drying led to, in all specimens, an initial increase in RH for the sensors that were not saturated. However, for the insulated Acrylic 1, this was followed by a reduction in RH. This is in agreement with the good water vapour transmission this acrylic-based treatment has shown in the bench test [23]. Such behaviour is confirmed by the rate of weight loss of both Acrylic 1, uninsulated and insulated cases. Overall, no additional weight loss was observed in the acrylic-treated specimens after 12 h. In the case of the silane specimens, a gain in RH was observed on some of the sensors during the first couple of hours, while the weight change during Phase 2 was minimal.
3.2.3. Phase 3: Eight Wetting Cycles
The acrylic- and silane-treated specimens were subjected in Phases 3 to 8 cycles of wetting and drying in both the uninsulated and insulated conditions. Figure 13a shows a comparison of the RH and T changes for specimen Acrylic 1 in both conditions: the behaviour is qualitatively very similar, with an RH gain and T oscillations during each wetting cycle for all sensors in the outer leaf, particularly evident for Sensors 1, 2, and 3, while Sensor 5 in the uninsulated condition became saturated after the sixth cycle. The highest gain appeared in both cases on Sensor 3, which is located at the centre of the specimen, therefore affected by the highest WDR rate of wetting, and set in a mortar joint, which is more absorbent than the brick and more prone to microcracks, which might have occurred during the curing period [33].
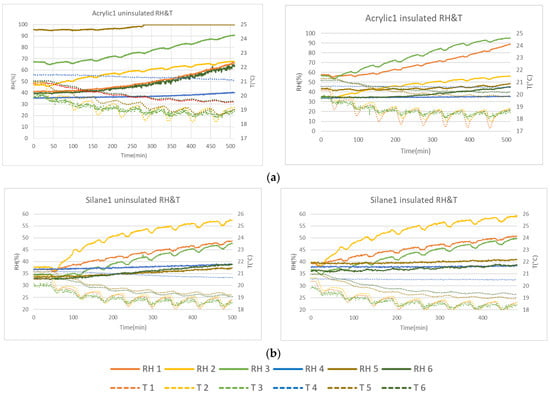
Figure 13.
(a) Acrylic 1 uninsulated and insulated specimens RH and T changes during Phase 3; (b) Silane 1 uninsulated and insulated RH and T readings during Phase 3.
Figure 13b shows the RH and T changes in Silane 1, uninsulated and insulated cases, during eight wetting cycles. An RH increase and a T reduction are observed for each wetting cycle in Sensors 1, 2, and 3 consistently in both conditions. The pattern of increase is very similar to the one observed for the Acrylic 1 specimen and substantially constant from cycle to cycle. By the end of eight wetting cycles, the RH readings did not exceed 60% and were significantly lower than both the untreated and the acrylic-treated specimens. In addition, the temperature reduction is more focused on the outer leaf, while the inner leaf dropped 0.5 °C in the uninsulated case and 0.1 °C in the insulated case, showing that the insulation remains effective in maintaining indoor comfort. This is also the case for the Acrylic 1-treated specimen.
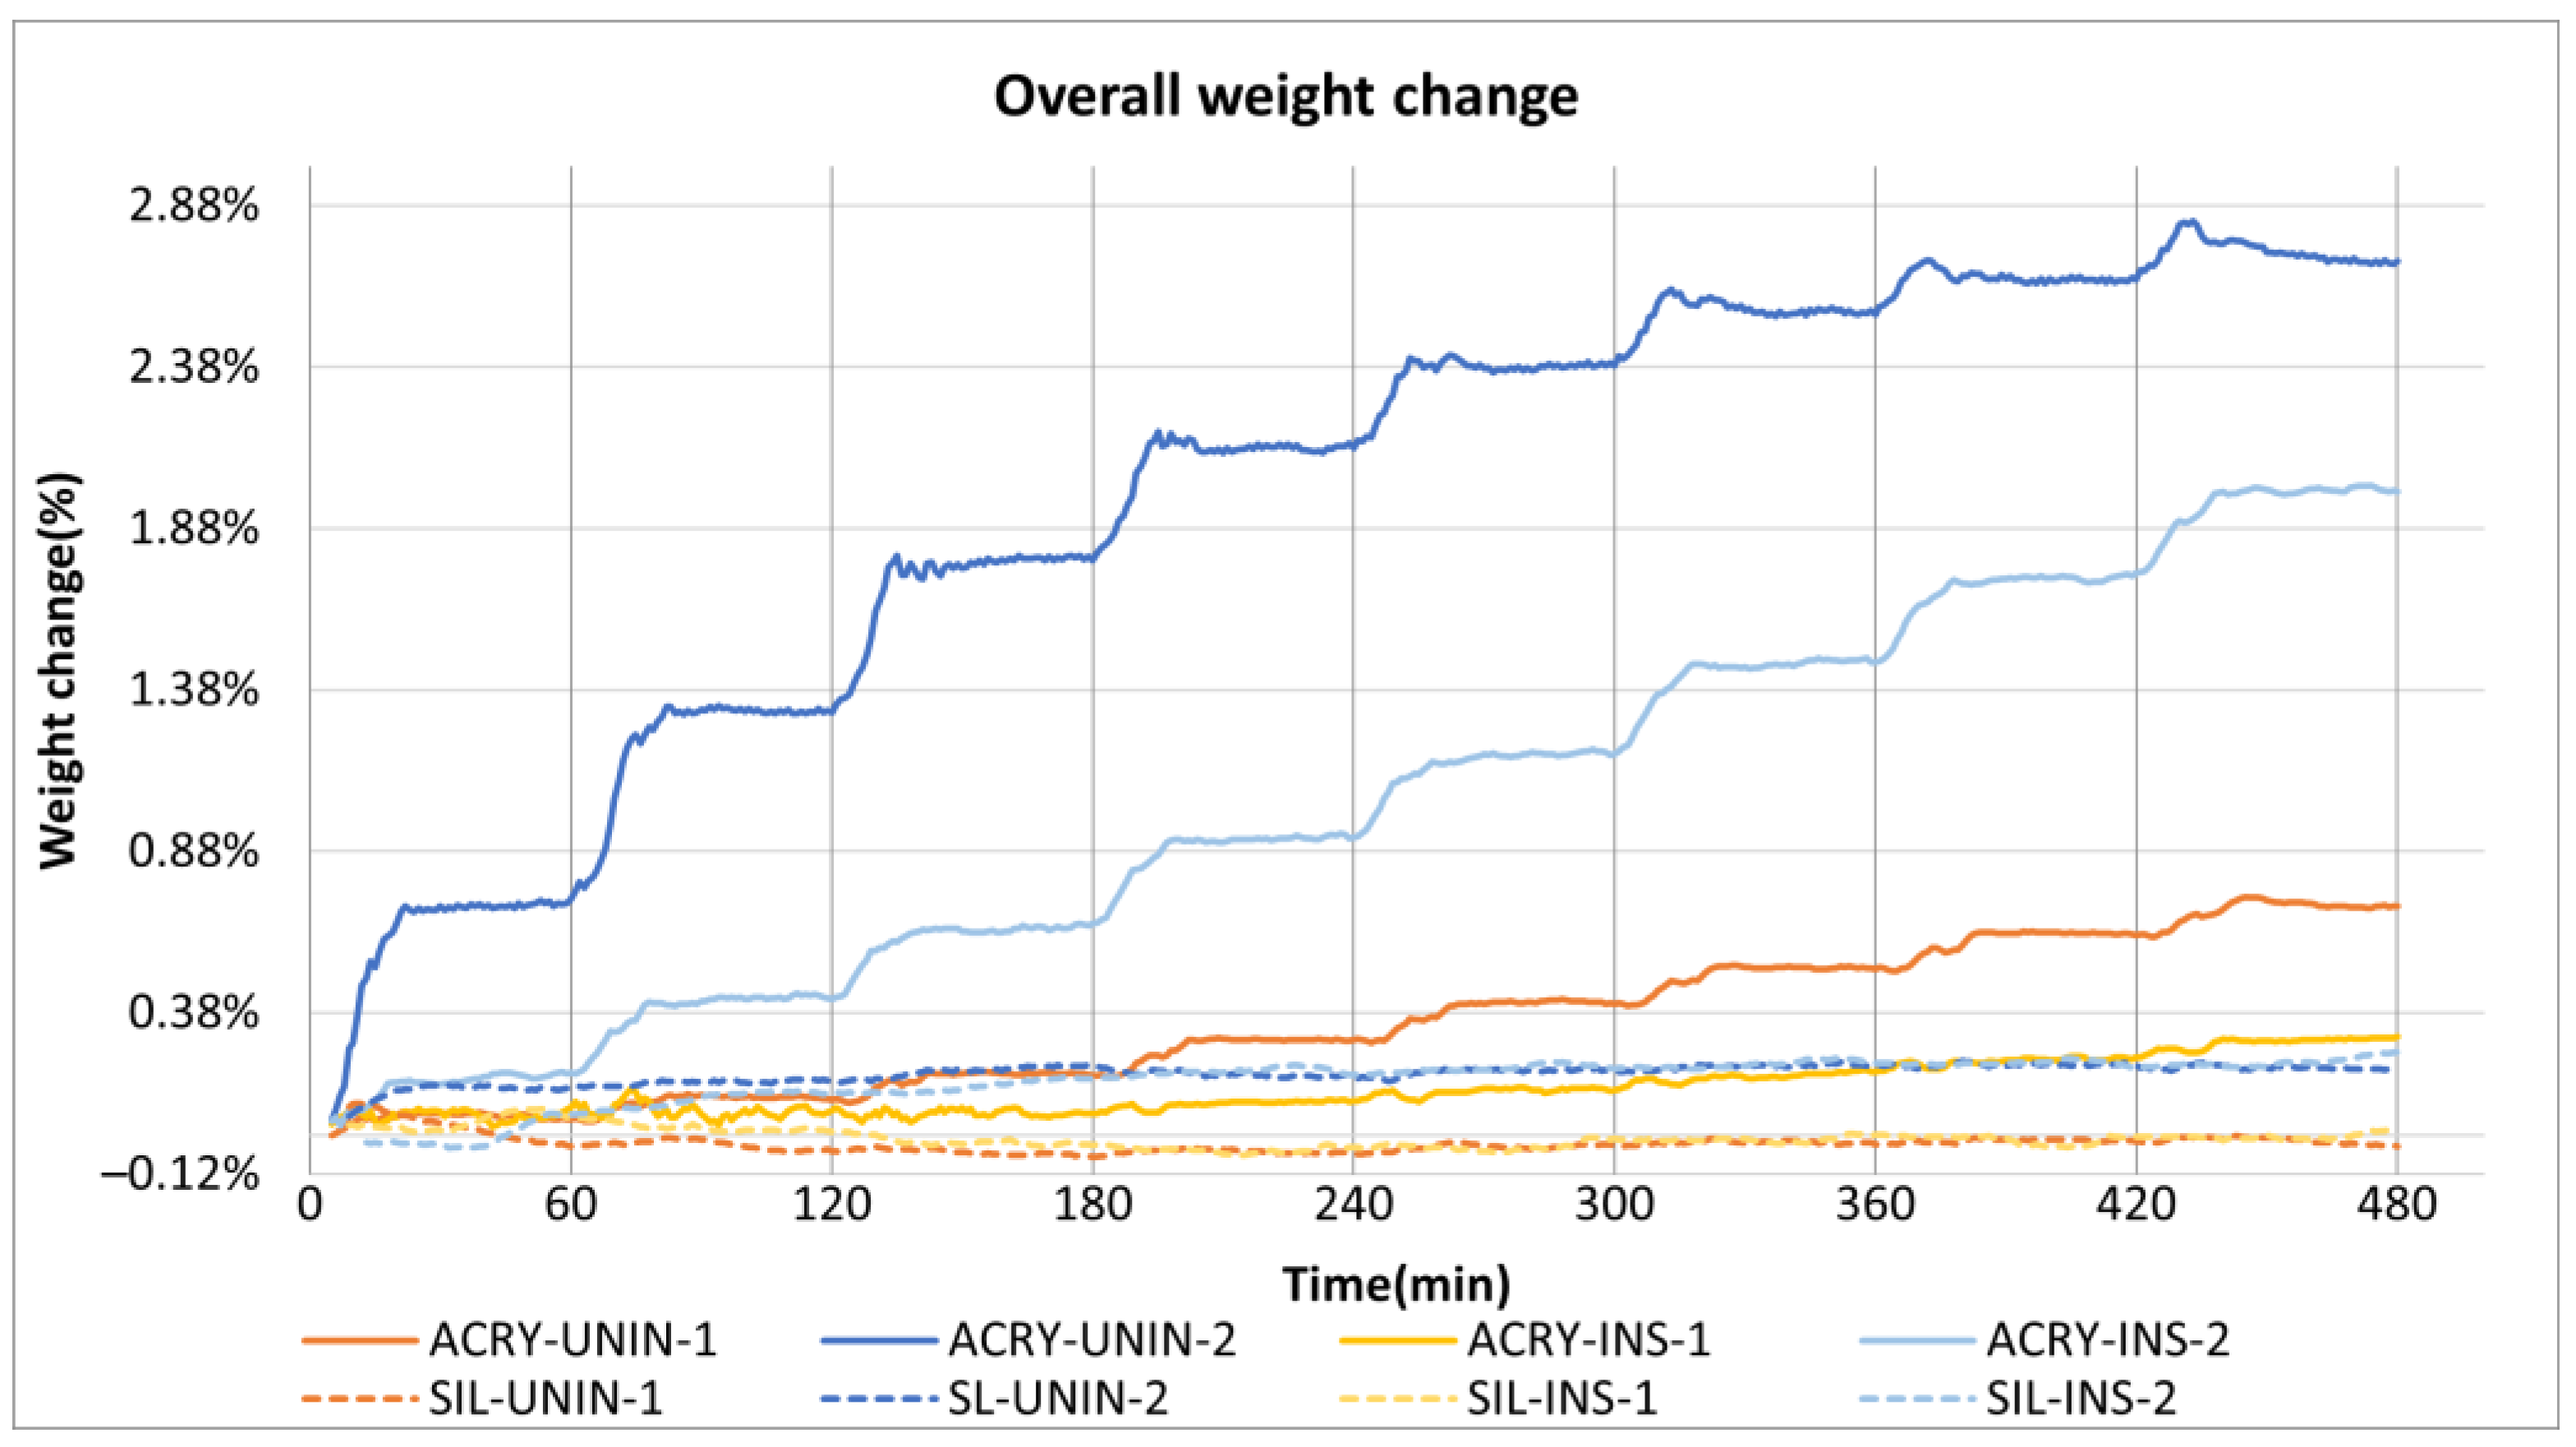
For the acrylic-treated specimens, the trend observed for the increase in RH is replicated by the weight gain exhibited by both specimens in both conditions, to different degrees of magnitudes as already observed for the two wetting cycles (Figure 14). Acrylic 1 and Acrylic 2 gained 0.70% and 2.7% in the uninsulated condition and 0.30% and 1.98% in the insulated condition, respectively. It is noticeable in the readings for Acrylic 2 how the latter wetting cycles contribute less to the total weight gain for the uninsulated case. This is not replicated in the insulated case, with a smaller overall weight gain thanks to the second treatment application but a constant uptake at each cycle. It is also noticeable that in this third phase, the drying period does not have the same marked effect in weight reduction, even for specimen 1 with low rates of absorption.
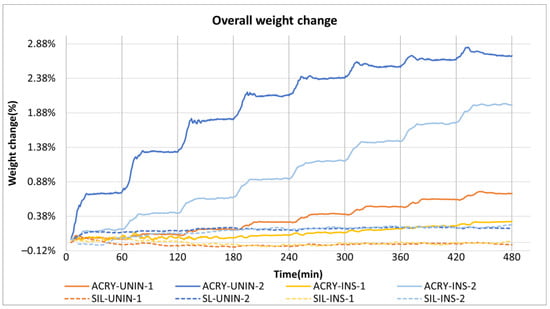
Figure 14.
Total weight change in acrylic- and silane/siloxane cream-treated specimens 1 and 2, uninsulated and insulated in Phase 3.
Figure 14 also shows the weight change in the uninsulated and insulated silane-treated walls during Phase 3. Two observations are noteworthy: a sensible reduction in weight during the first drying cycle for specimen 1, similar to the phenomenon observed in Phase 1, sustained for the first three cycles for both the uninsulated and insulated cases; and an increase in water uptake for both conditions of specimen 2, especially in the first cycle and greater for the insulated case. Hence, overall, for the uninsulated cases, Silane 1 loses 0.04%, while Silane 2 gains 0.15% in weight, while for the insulated cases, Silane 1 loses 0.018% and Silane 2 gains 0.28% in weight.
3.2.4. Phase 4: Post-Test Conditioning
During Phase 4, no significant variation was observed in the RH and T readings except for a slight reduction in Sensor 2 of Acrylic 1, in both conditions of the acrylic-treated specimens. The changes in weight are very minor over a period of 20 h and show a significantly lower drying rate than in the overnight drying of Phase 2. This might confirm the increased difficulty in drying acrylic-treated walls with a high moisture content observed in the bench test [23].
Similar to the behaviour observed during Phase 2, a gain in RH was observed in some of the sensors during the first couple of hours, and then this gradually reduced to a stable state and was maintained to the end of the testing phase. By the end of Phase 4, there was no notable weight change for both the uninsulated and insulated specimens, showing a good performance in reducing water ingress but impacting on the drying, which is in line with the findings in the bench test [23].
3.3. Treatment Comparison
A summary of the weight change from each testing phase is provided in Table 6. The results for the untreated walls are rather consistent, both across specimens and when comparing the uninsulated and insulated cases. The greater difference between the uninsulated and insulated cases comes from the drying phase, which is less effective in the presence of insulation. Therefore, by the end of the experiment, the untreated insulated specimens show the greatest weight gain. Both treatments are effective in substantially reducing water ingress with respect to the untreated case, albeit the acrylic with a lesser level of consistency. Due to this issue, the acrylic tests were performed a second time in insulated conditions. While the disparity between the two specimens was somewhat reduced, the difference was still substantial, confirming the inconsistency. The silane/siloxane treatment performed better in terms of preventing water ingress; however, a gain across both specimens and for all phases of the tests can be identified when the insulation is present. Such gains, however, are only about 5% of the weight gain for the corresponding untreated case. In terms of drying efficiency, it should be noted that in all cases, to a greater or lesser extent, the insulation has an adverse effect. Nonetheless, the acrylic treatment shows a better performance than the silane/siloxane treatment in the drying phases, in agreement with the higher breathability observed in the bench test [23].
Table 6.
Percentage weight change in wall specimens by the end of each testing phase.
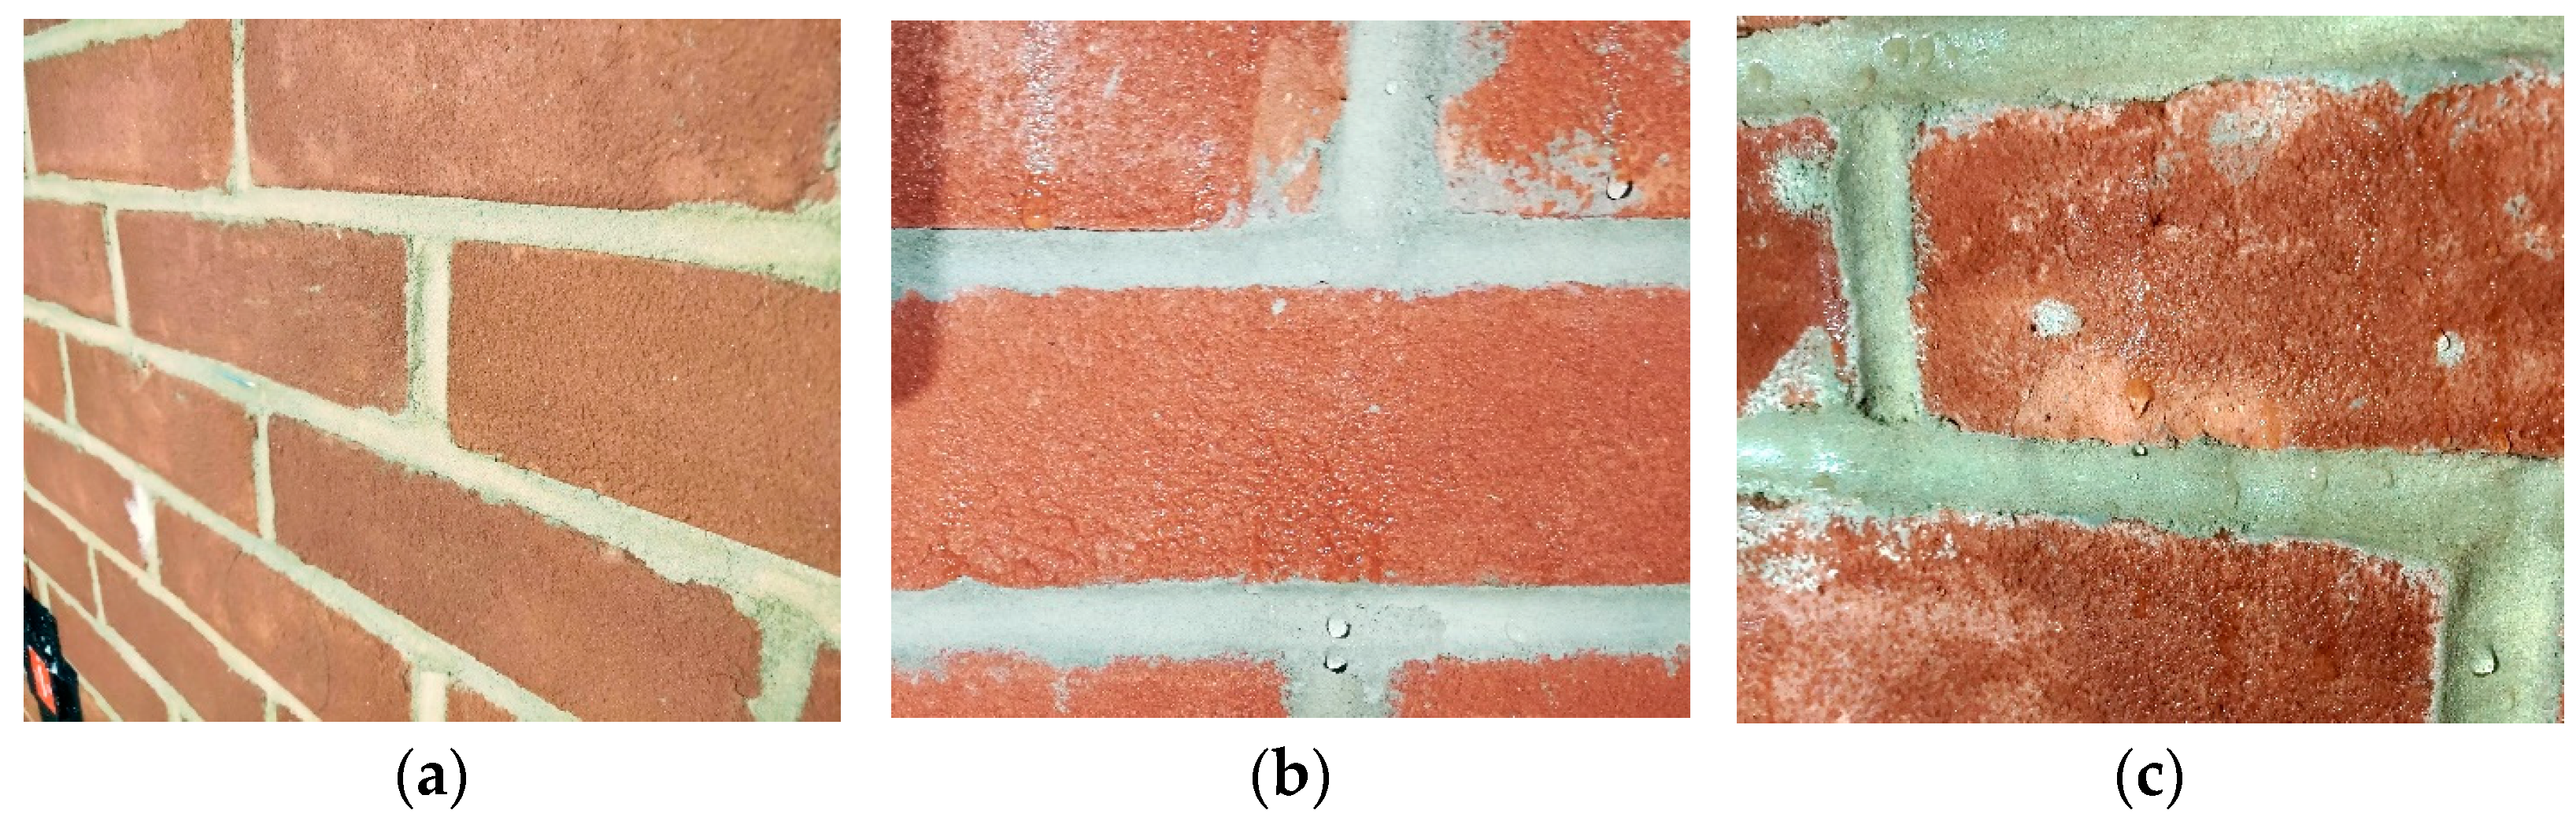
The water-repellent performance of the surface treatments can also be reflected in the colour change in the wall surfaces. Figure 15 shows the surface colour change and the beading effect observed from the wall surfaces after two wetting cycles. In Figure 15a, representing the untreated specimen, a local colour difference can be observed after the first wetting cycle; this can be related to the variation in absorption on the specimen surface due to the nature of the brick manufacturing process. This colour difference disappeared after the second wetting cycle with increased water ingress and internal moisture redistribution. A similar colour difference can also be observed on both the acrylic- and silane-treated wall specimens after two cycles as shown in Figure 15b,c. The fact that all the wall surfaces reverted to their original colour after they were fully dried suggests that the observed changes were likely linked to water ingress during the testing process. Thus, this phenomenon can be considered as an indication of water ingress at the surface of the wall specimens. However, being a local phenomenon, not only is not representative of the water ingress condition of the entire specimen, but also the penetration depth and the level f saturation cannot be assessed accurately. Equipment such as microwave moisture sensors can be used in further tests to support the research on the relevance of colour difference on water ingress.

Figure 15.
Surface colour change and beading effect of (a) untreated after 1 wetting cycle, (b) acrylic-treated specimen after 2 wetting cycles and (c) silane-treated specimen after 2 wetting cycles.
4. Discussion and Conclusions
The purpose of the study is to determine the impact of two surface waterproofing treatments of different chemical compositions on the performance of masonry cavity walls under cyclic WDR loading when uninsulated and insulated, in order to comment on the feasibility of pairing surface waterproofing with conventional insulation materials for better hygric and hence energy performance of this construction form in the UK.
The four distinct test phases were designed to simulate various WDR exposure levels from moderate exposure to very severe exposure (Table 4). The cyclic wetting approach used has the benefit of reproducing the alternance of WDR spells to periods of dryness, while achieving a more precise control of the amount of water applied to the specimens and allowing for the observation of the complex movement of the water through the section of the composite masonry wall characterised by diverse porous structures of brick and mortar and other heterogeneities. The two drying phases within the test protocol highlighted the further moisture movement within the two leaves of the cavity walls in drying conditions and the role played by the insulation.
The following sections discuss the correlation between the weight gain measured by the load cells and absolute humidity as measured by the RH sensors, the correlation between the weight gain of the large-scale tests and the weight gain measured by the standard absorption test on small masonry units, and, finally, the correlation between the water application and the masonry absorption rate.
4.1. Correlation of Weight Gain and Absolute Humidity
The correlation between sensed humidity and weight gain has been studied recently by [64,65,66] in reference to experimental work, with the purpose of transferring such correlations from the laboratory to the real world of buildings, where weight measurements cannot be used to determine the level of moisture presence in walls.
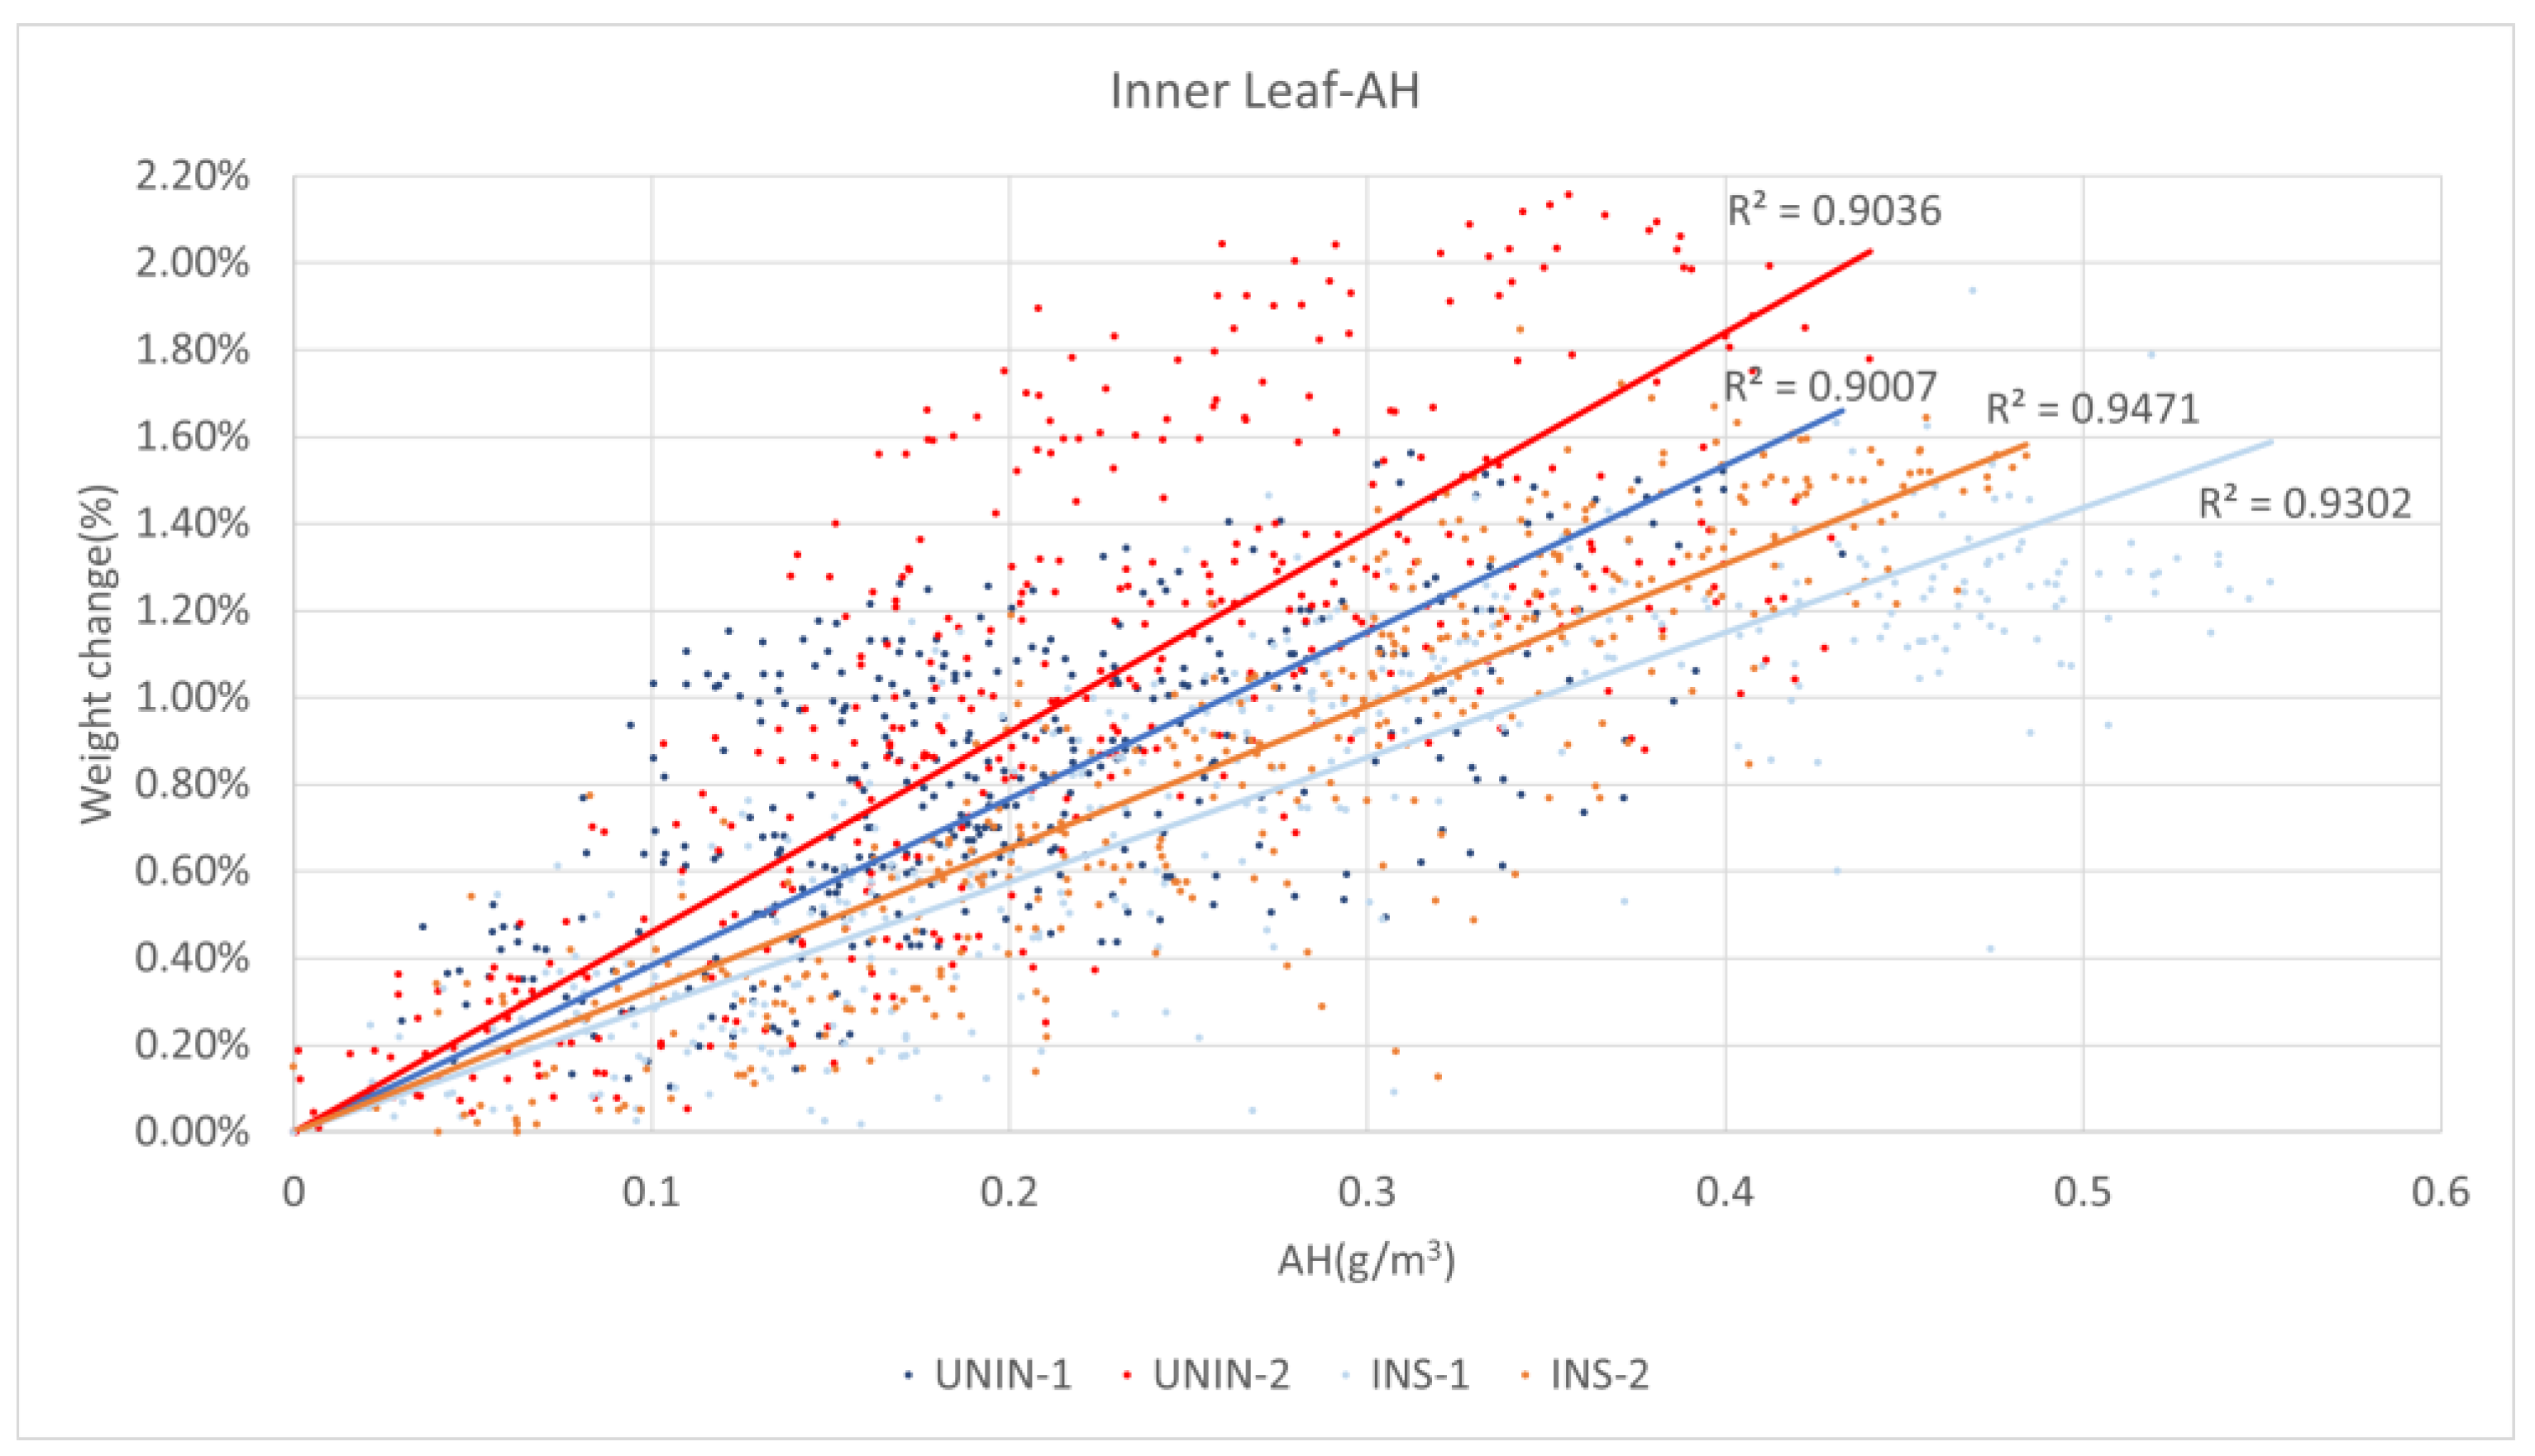
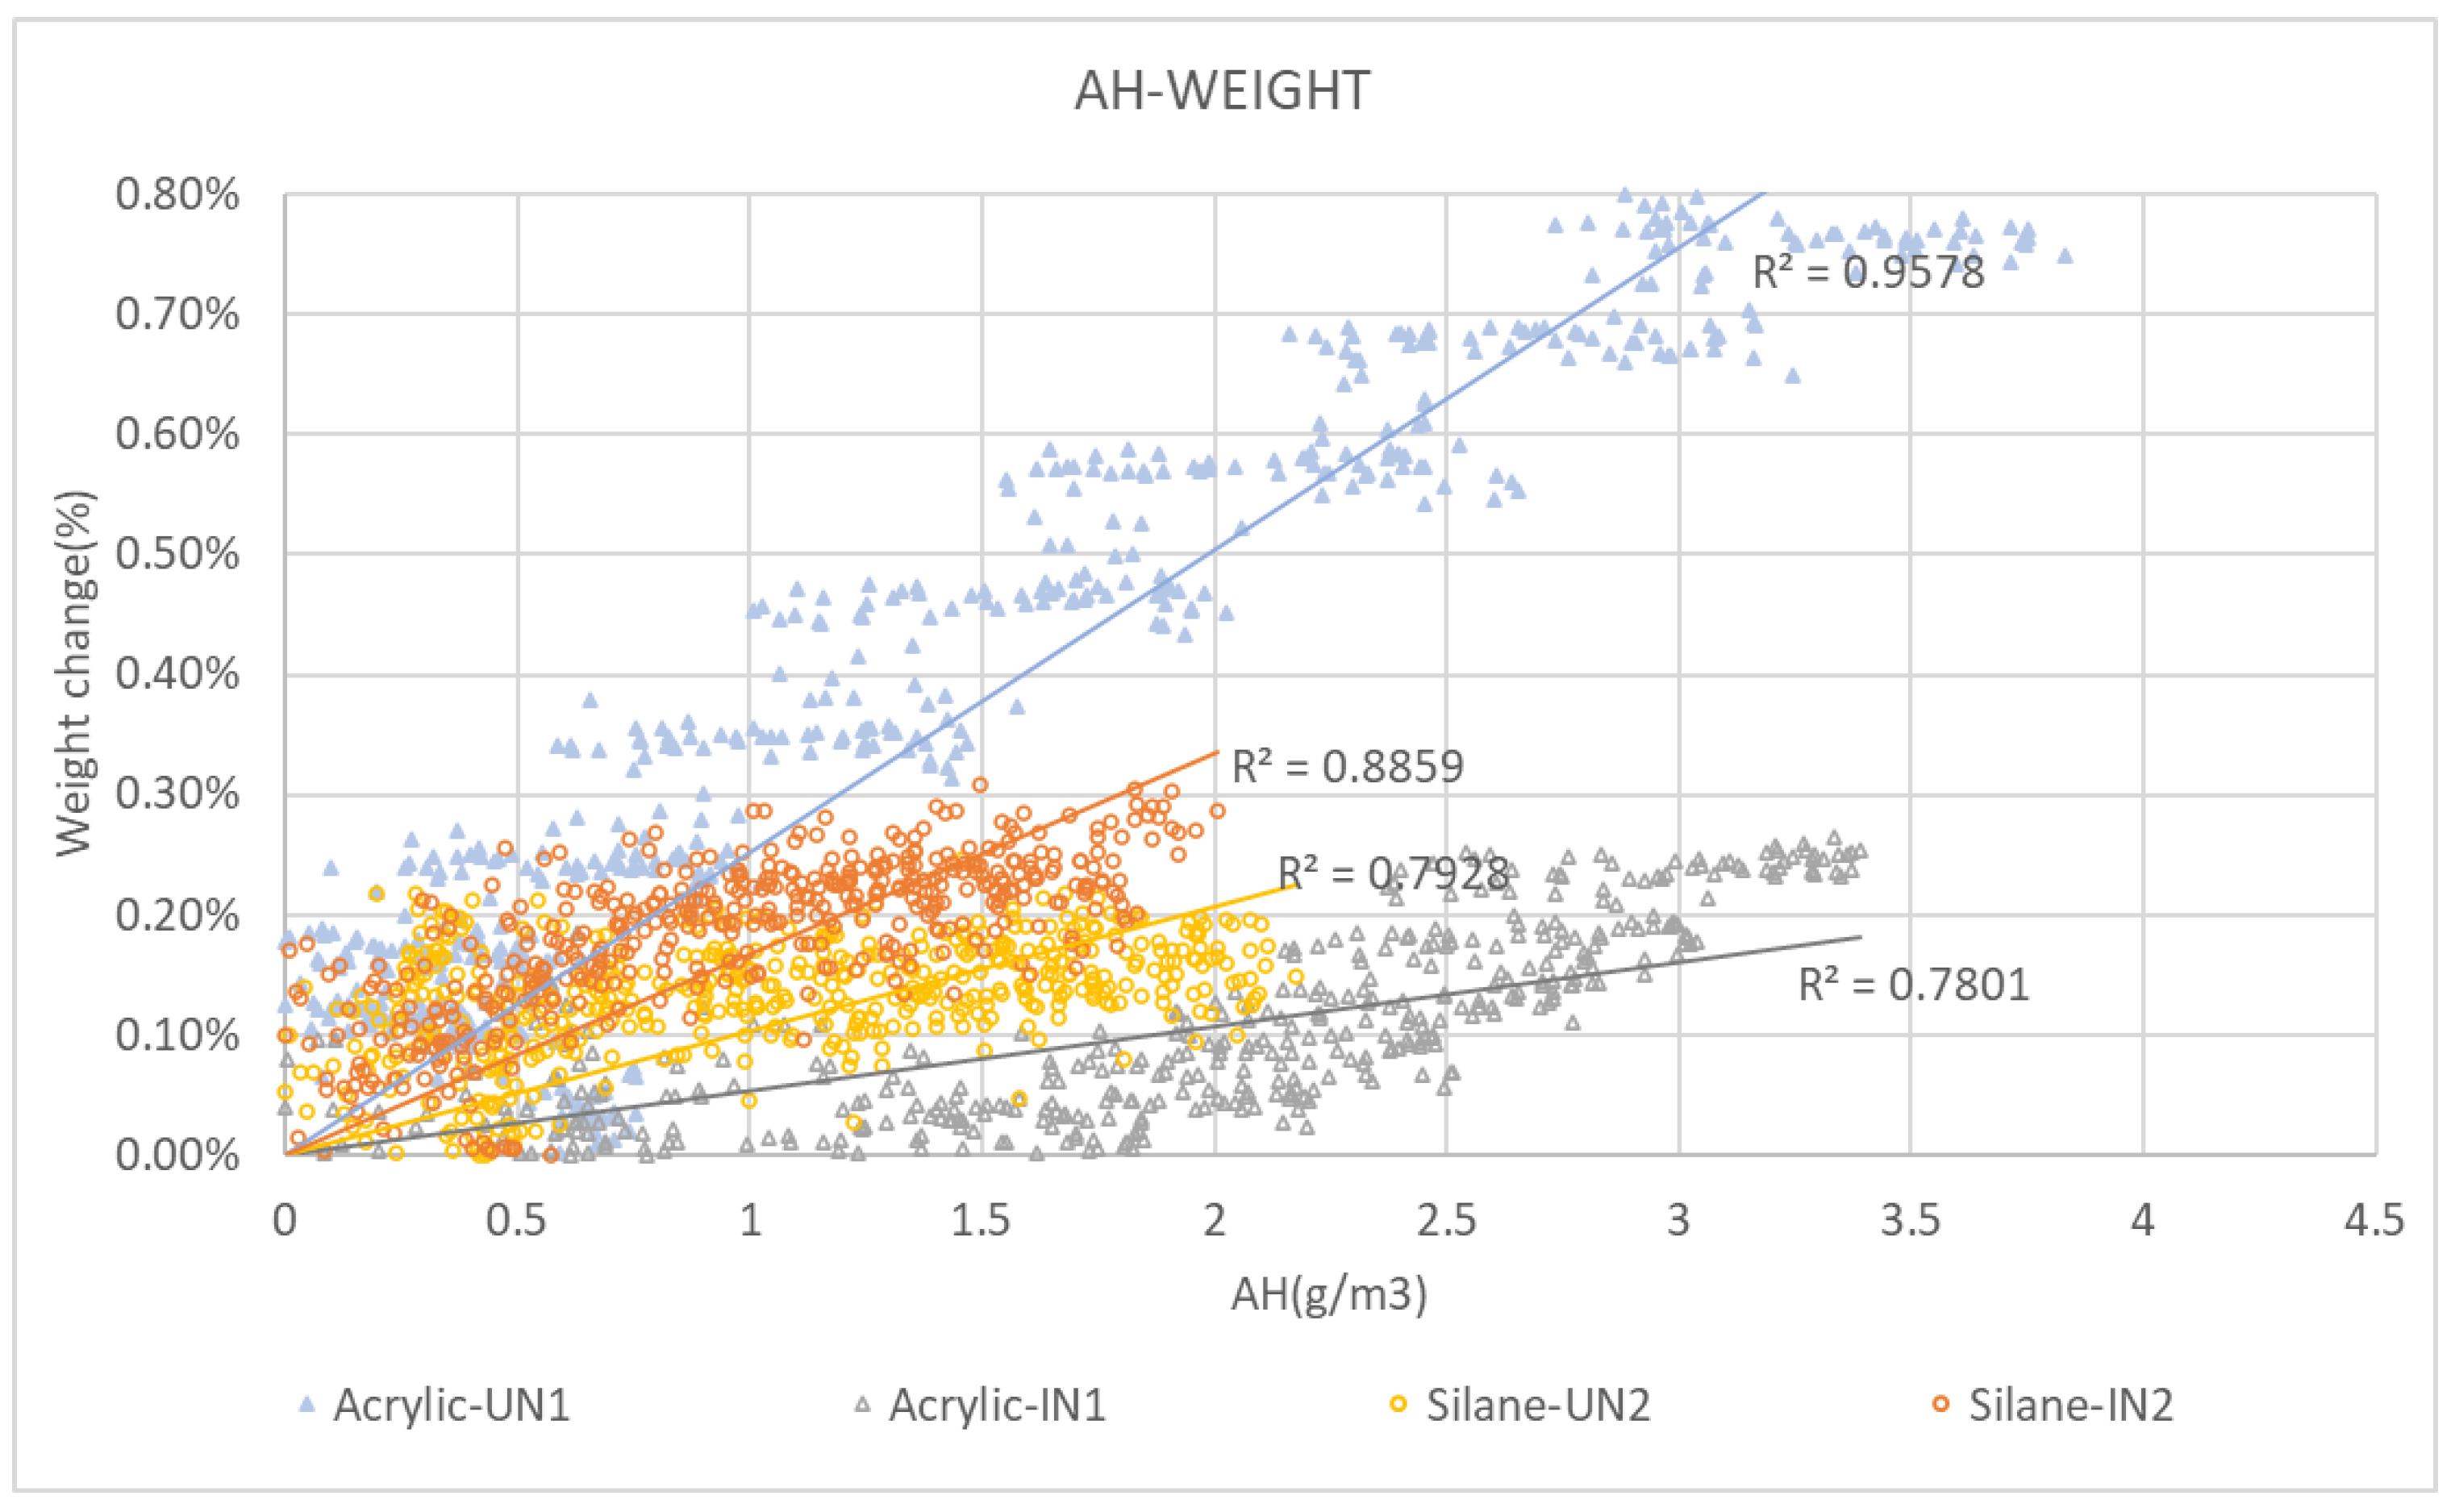
As the purpose of the study is to determine the efficiency of surface treatments and their coupling with cavity wall insulation, the weight gain of the inner leaf is compared with the increase in absolute humidity measured by the sensor positioned in the centre of the surface area of the inner leaf as shown in Figure 4, first for the untreated cases during the third phase. Figure 16 shows the results for the four untreated specimens. A linear regression fits well with the correlation between the two parameters with an R2 value of 0.9 or greater for all cases. The different slopes of the regression lines indicate that specimen 1 has a smaller weight gain than specimen 2 for the same value of sensed absolute humidity in both conditions. Moreover, the insulated untreated walls gain less weight compared to the uninsulated cases, while they show an increased absolute humidity at the point of measurement in the inner leaf.
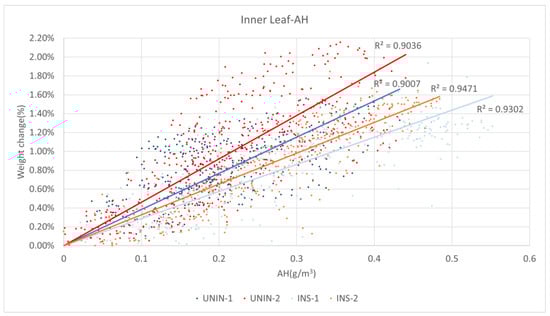
Figure 16.
Correlation between weight change and absolute humidity (AH) of Sensor 4 in inner leaf of untreated walls during 6 wetting cycles.
For the treated specimens, given the very modest increases in weight and RH at the inner leaf, the correlation was studied between the overall weight gain and the higher resolution sensors RH3 at the centre of the outer leaf (see Figure 4), in a position close to the inner sensor, but set in mortar, which recorded a considerable increase in RH, without reaching saturation, in all specimens in both conditions during the Phase 3 tests. Figure 17 compares the behaviour of specimen Acrylic 1 and specimen Silane 2, in other words, the best of the acrylic with the worst of the silane/siloxane performances. Linear regressions show good agreement with the data: the acrylic-treated specimens were retreated before the test with the insulation, which explains the significant difference in total weight gain, while the absolute humidity remains comparable. For the silane/siloxane case, the uninsulated specimen shows a smaller weight gain than the insulated one for a very similar level of overall increase in absolute humidity. Therefore, it can be concluded that while the correlation between weight gain and absolute humidity can be consistently represented with a linear model, further tests are needed to associate a specific analytical model to each type of treatment and insulation.
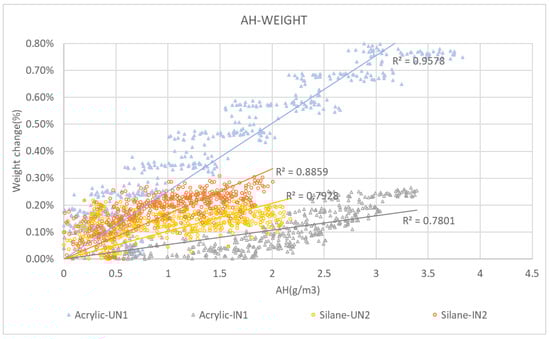
Figure 17.
Correlation between weight change and absolute humidity (AH) of acrylic- and silane-treated walls during 8 wetting cycles.
4.2. Comparison between WDR Weight Gain and Absorption Tests
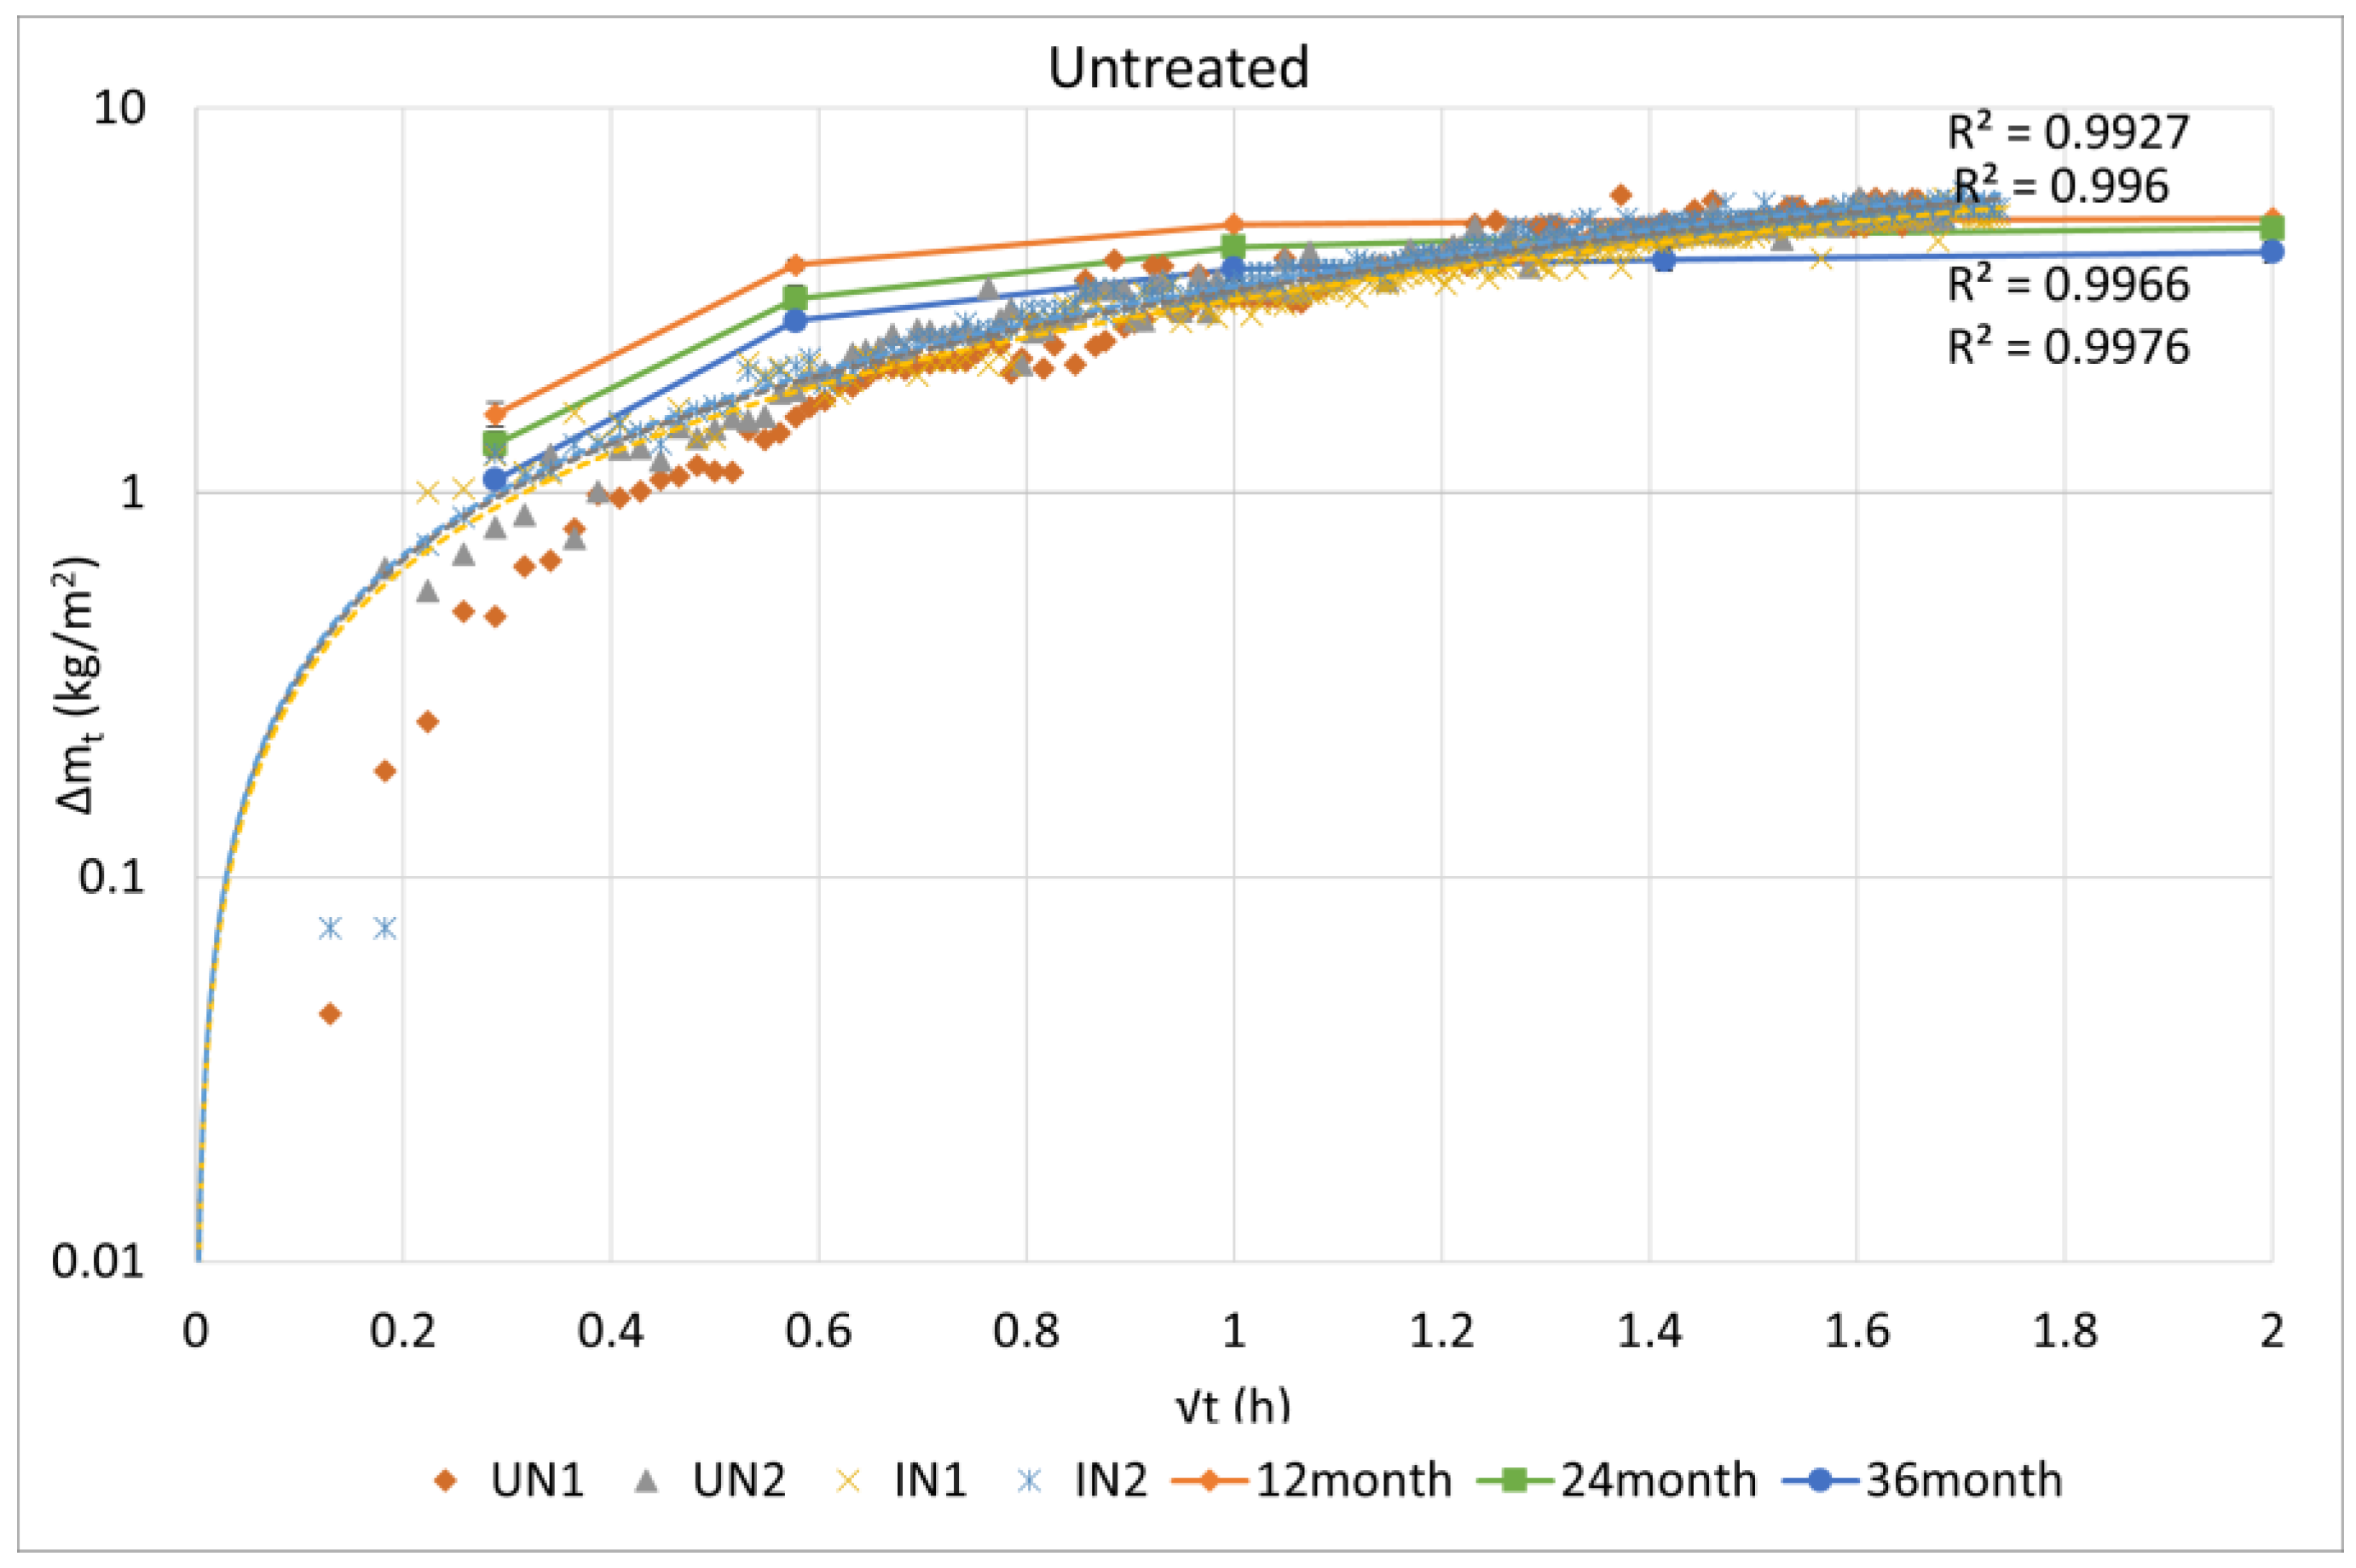
The water absorption of the thin masonry samples determined according to [67] was compared to the weight gain by the wind-driven rain simulation observed in this study. Several conditions differ in the two cases: (i) the thickness of the samples is a first important parameter as the specimens exposed to the absorption tests are 28 mm thick in contrast with the 102 mm thickness of the external leaf wall; (ii) the sequence of wetting differs, as during the absorption test, one surface of the specimen is in continuous contact with a still water surface and measurements of its weight increase are taken at regular intervals, while in the WDR test, one surface of the wall panel is exposed to cycles of intense spray and drying over a period of several hours; (iii) the pressure conditions at which the water comes into contact with the specimen surfaces. In the case of the absorption test, it is ambient pressure, while in the case of the walls, there is an additional pressure of 22 Pa. Finally, after the application of the treatment, the absorption tests were repeated yearly, to monitor the change in waterproofing product performance over time. Figure 18, Figure 19 and Figure 20 show the uptake of water with time for the three conditions of treatment, with and without insulation and for the absorption tests at 12, 24 and 36 months. There is very good agreement between the curves for the untreated case.

Figure 18.
Comparison of weight gain from WDR and absorption test for untreated specimens.
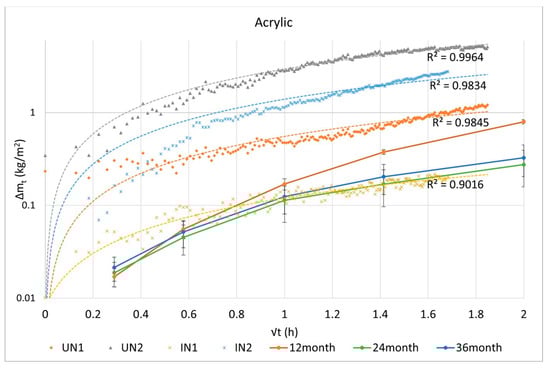
Figure 19.
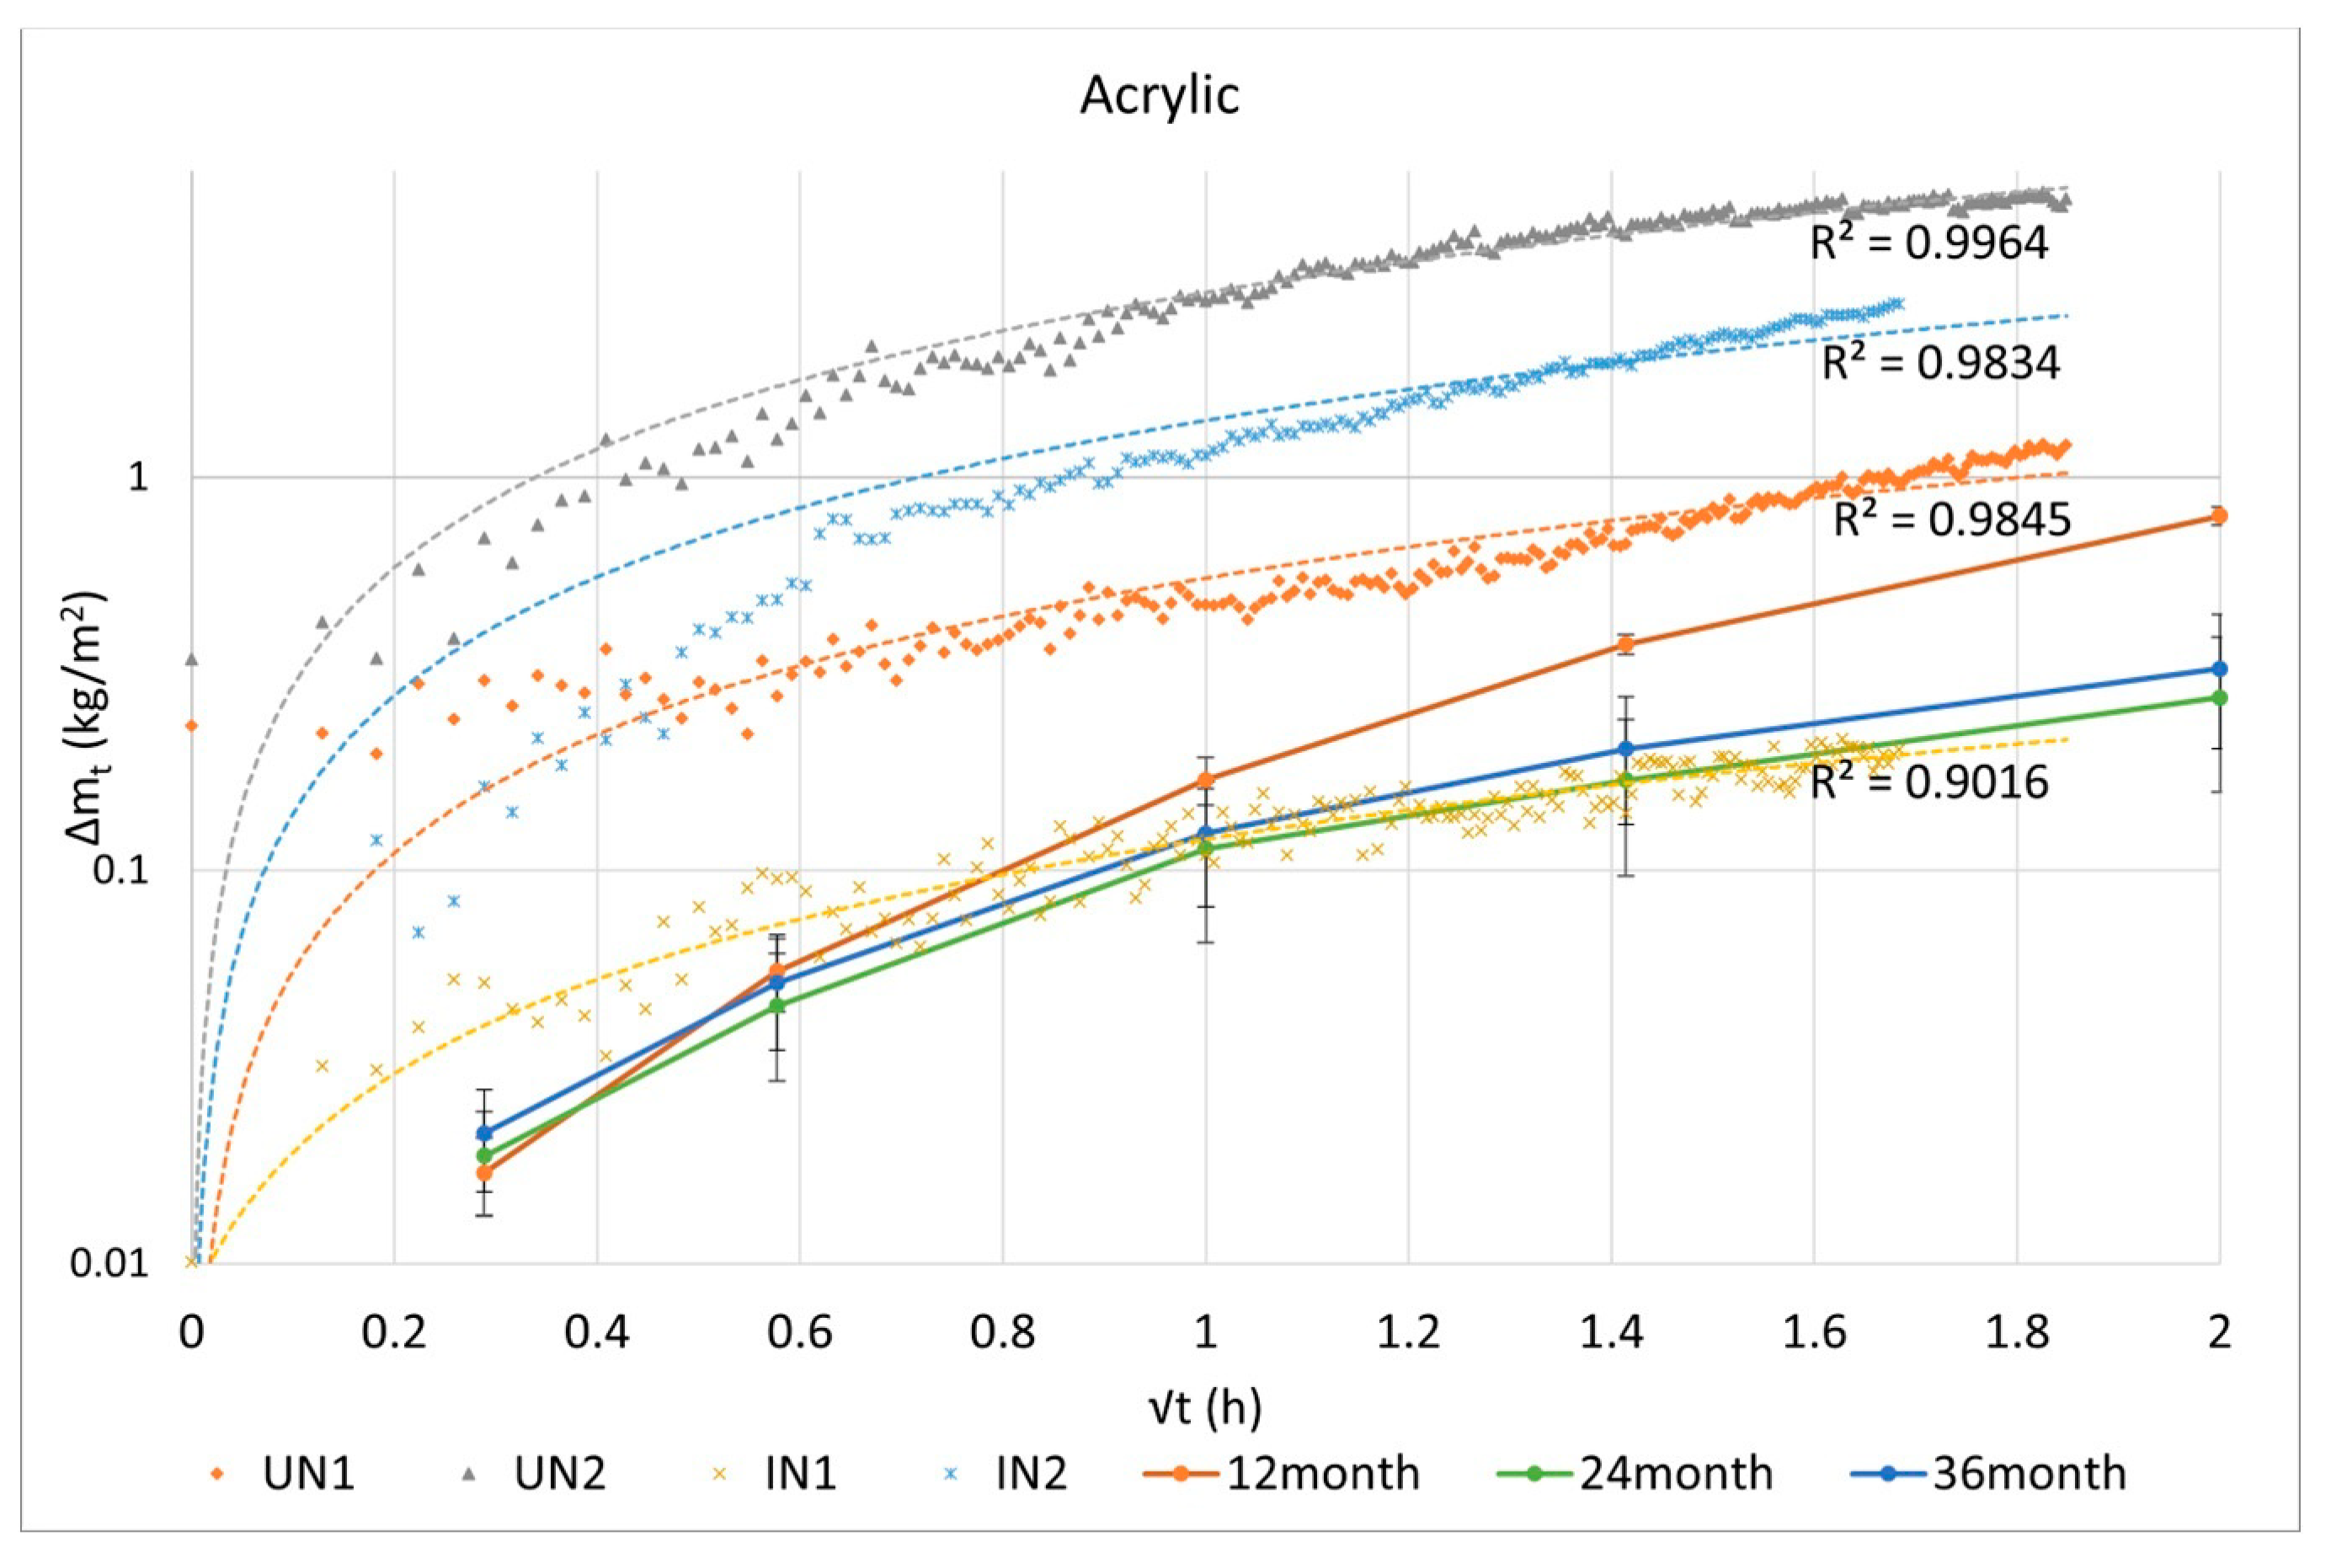
Comparison of weight gain from WDR and absorption test of acrylic-treated specimens.
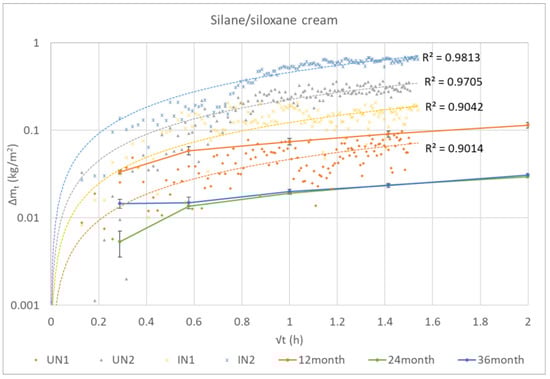
Figure 20.
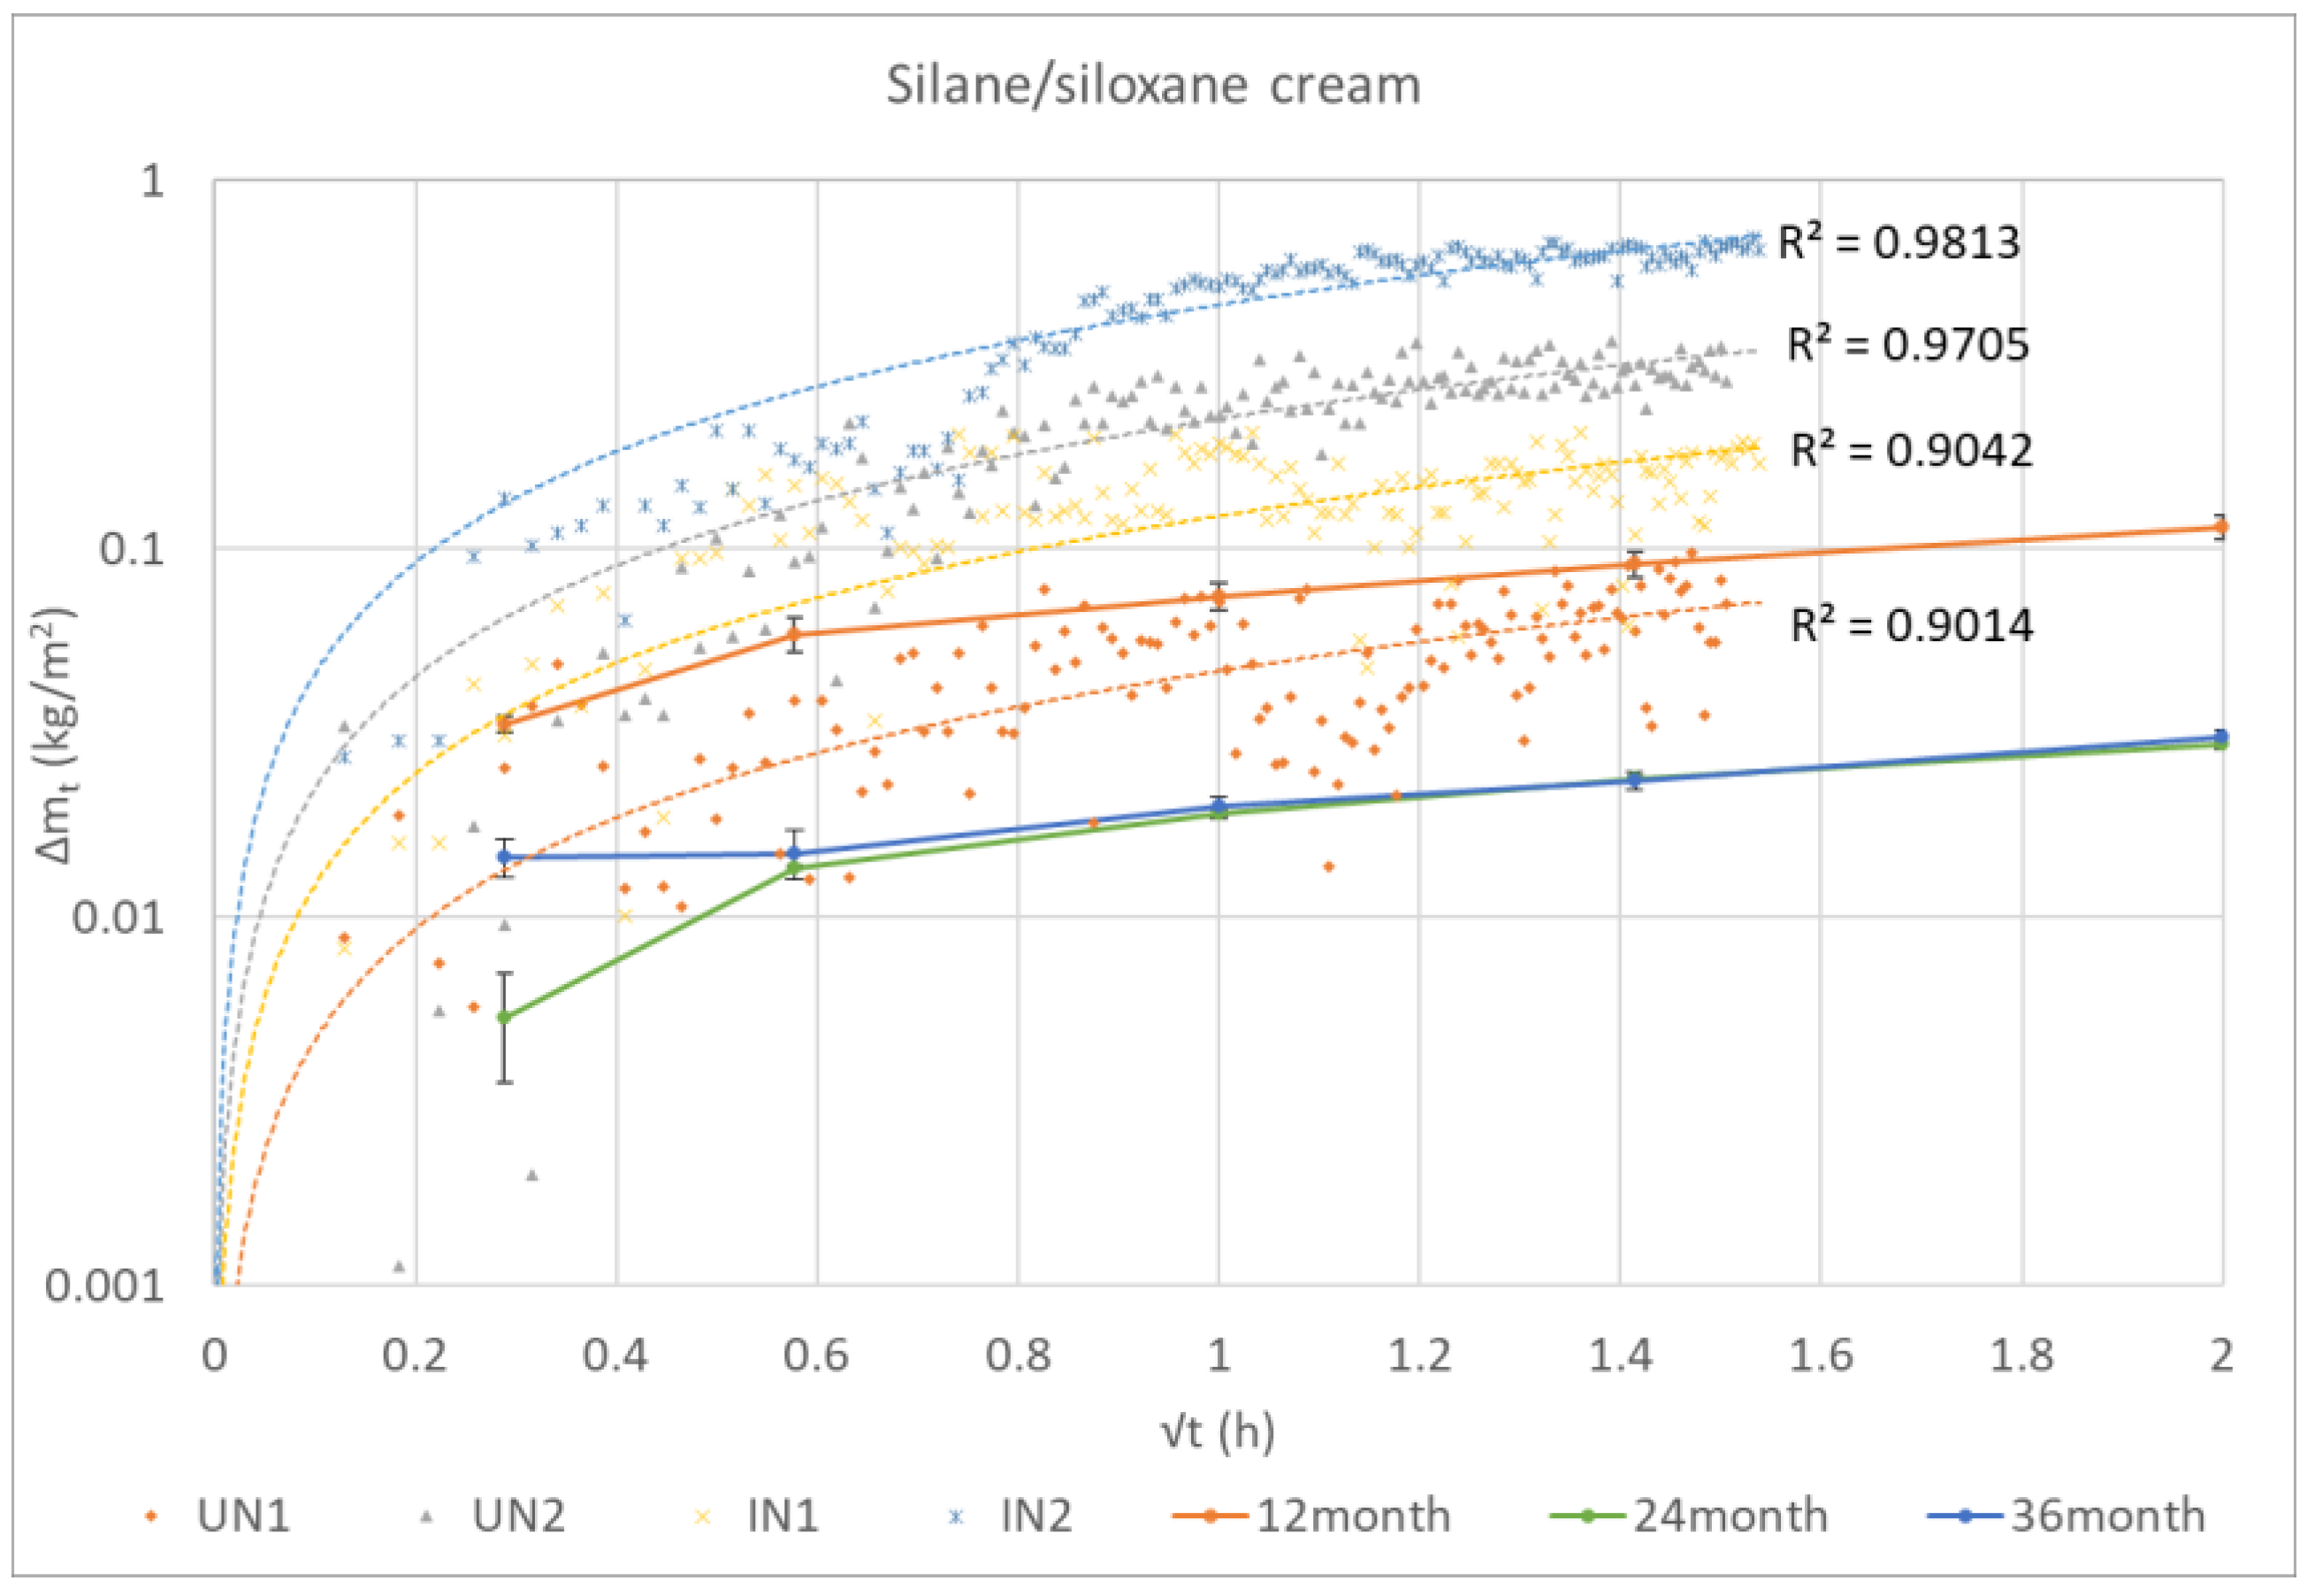
Comparison of weight gain from WDR and absorption test of silane-treated walls.
A logarithmic regression model represents the phenomenon well. For the two surface treatments, the first observation is that the rate of absorption is one order of magnitude smaller than the one for the untreated specimens. It can also be noted that the rate of absorption of the four specimens of each treatment presents a greater scatter than the untreated case, and it is one order of magnitude greater than the rate observed in the absorption test, except for the specimen with the best performance. These results also confirm that for the silane/siloxane treatment, the insulated cases are more absorptive than the uninsulated cases, while this cannot be confirmed for the acrylic treatment, which was reapplied before the insulated tests.
4.3. Correlation of Water Application and Wall Absorption Rate
The weight change from each test phase is summarised in Table 6, while the water application rate and total amount are defined in Table 4. Table 7 summarises the proportion of applied water absorbed for each test phase by each specimen. For the untreated cases, both uninsulated and insulated, the ratio of absorption in Phase 1 is greater than the ratio of absorption in Phase 3, notwithstanding the larger number of cycles. This also applies to most of the treated walls. This behaviour reflects the gradually reduced weight gain during the 6/8 wetting cycles shown in Figure 9b and Figure 14. On the other hand, most of the insulated cases show a negative impact on the drying phases with modest weight losses or indeed small weight gains. This can be related to the formation of water beads in the brick’s surface open pores which increases the water storage capacity and reduces the evaporation.
Table 7.
Ratio of applied water absorbed per test phase.
From the results obtained from the small-scale absorption test [23], the maximum water absorption capacity of brick and mortar can be calculated as 18.39% and 28.57% of the specimen volume, respectively. Thus, the maximum water absorption capacity of the external leaf of the wall specimens can be calculated by using Equation (1) based on the estimate of the volume of each material for each specimen:
W_V = (V_brick × W_brick + V_mortar × W_mortar)/(V_brick + V_mortar) × 100%
- W_V: maximum volume water absorption capacity of outer leaf of wall specimens (%);
- V_brick/V_mortar: volume of brick/mortar in outer leaf (m3);
- W_brick/W_mortar: maximum volume water absorption capacity of brick/mortar (%).
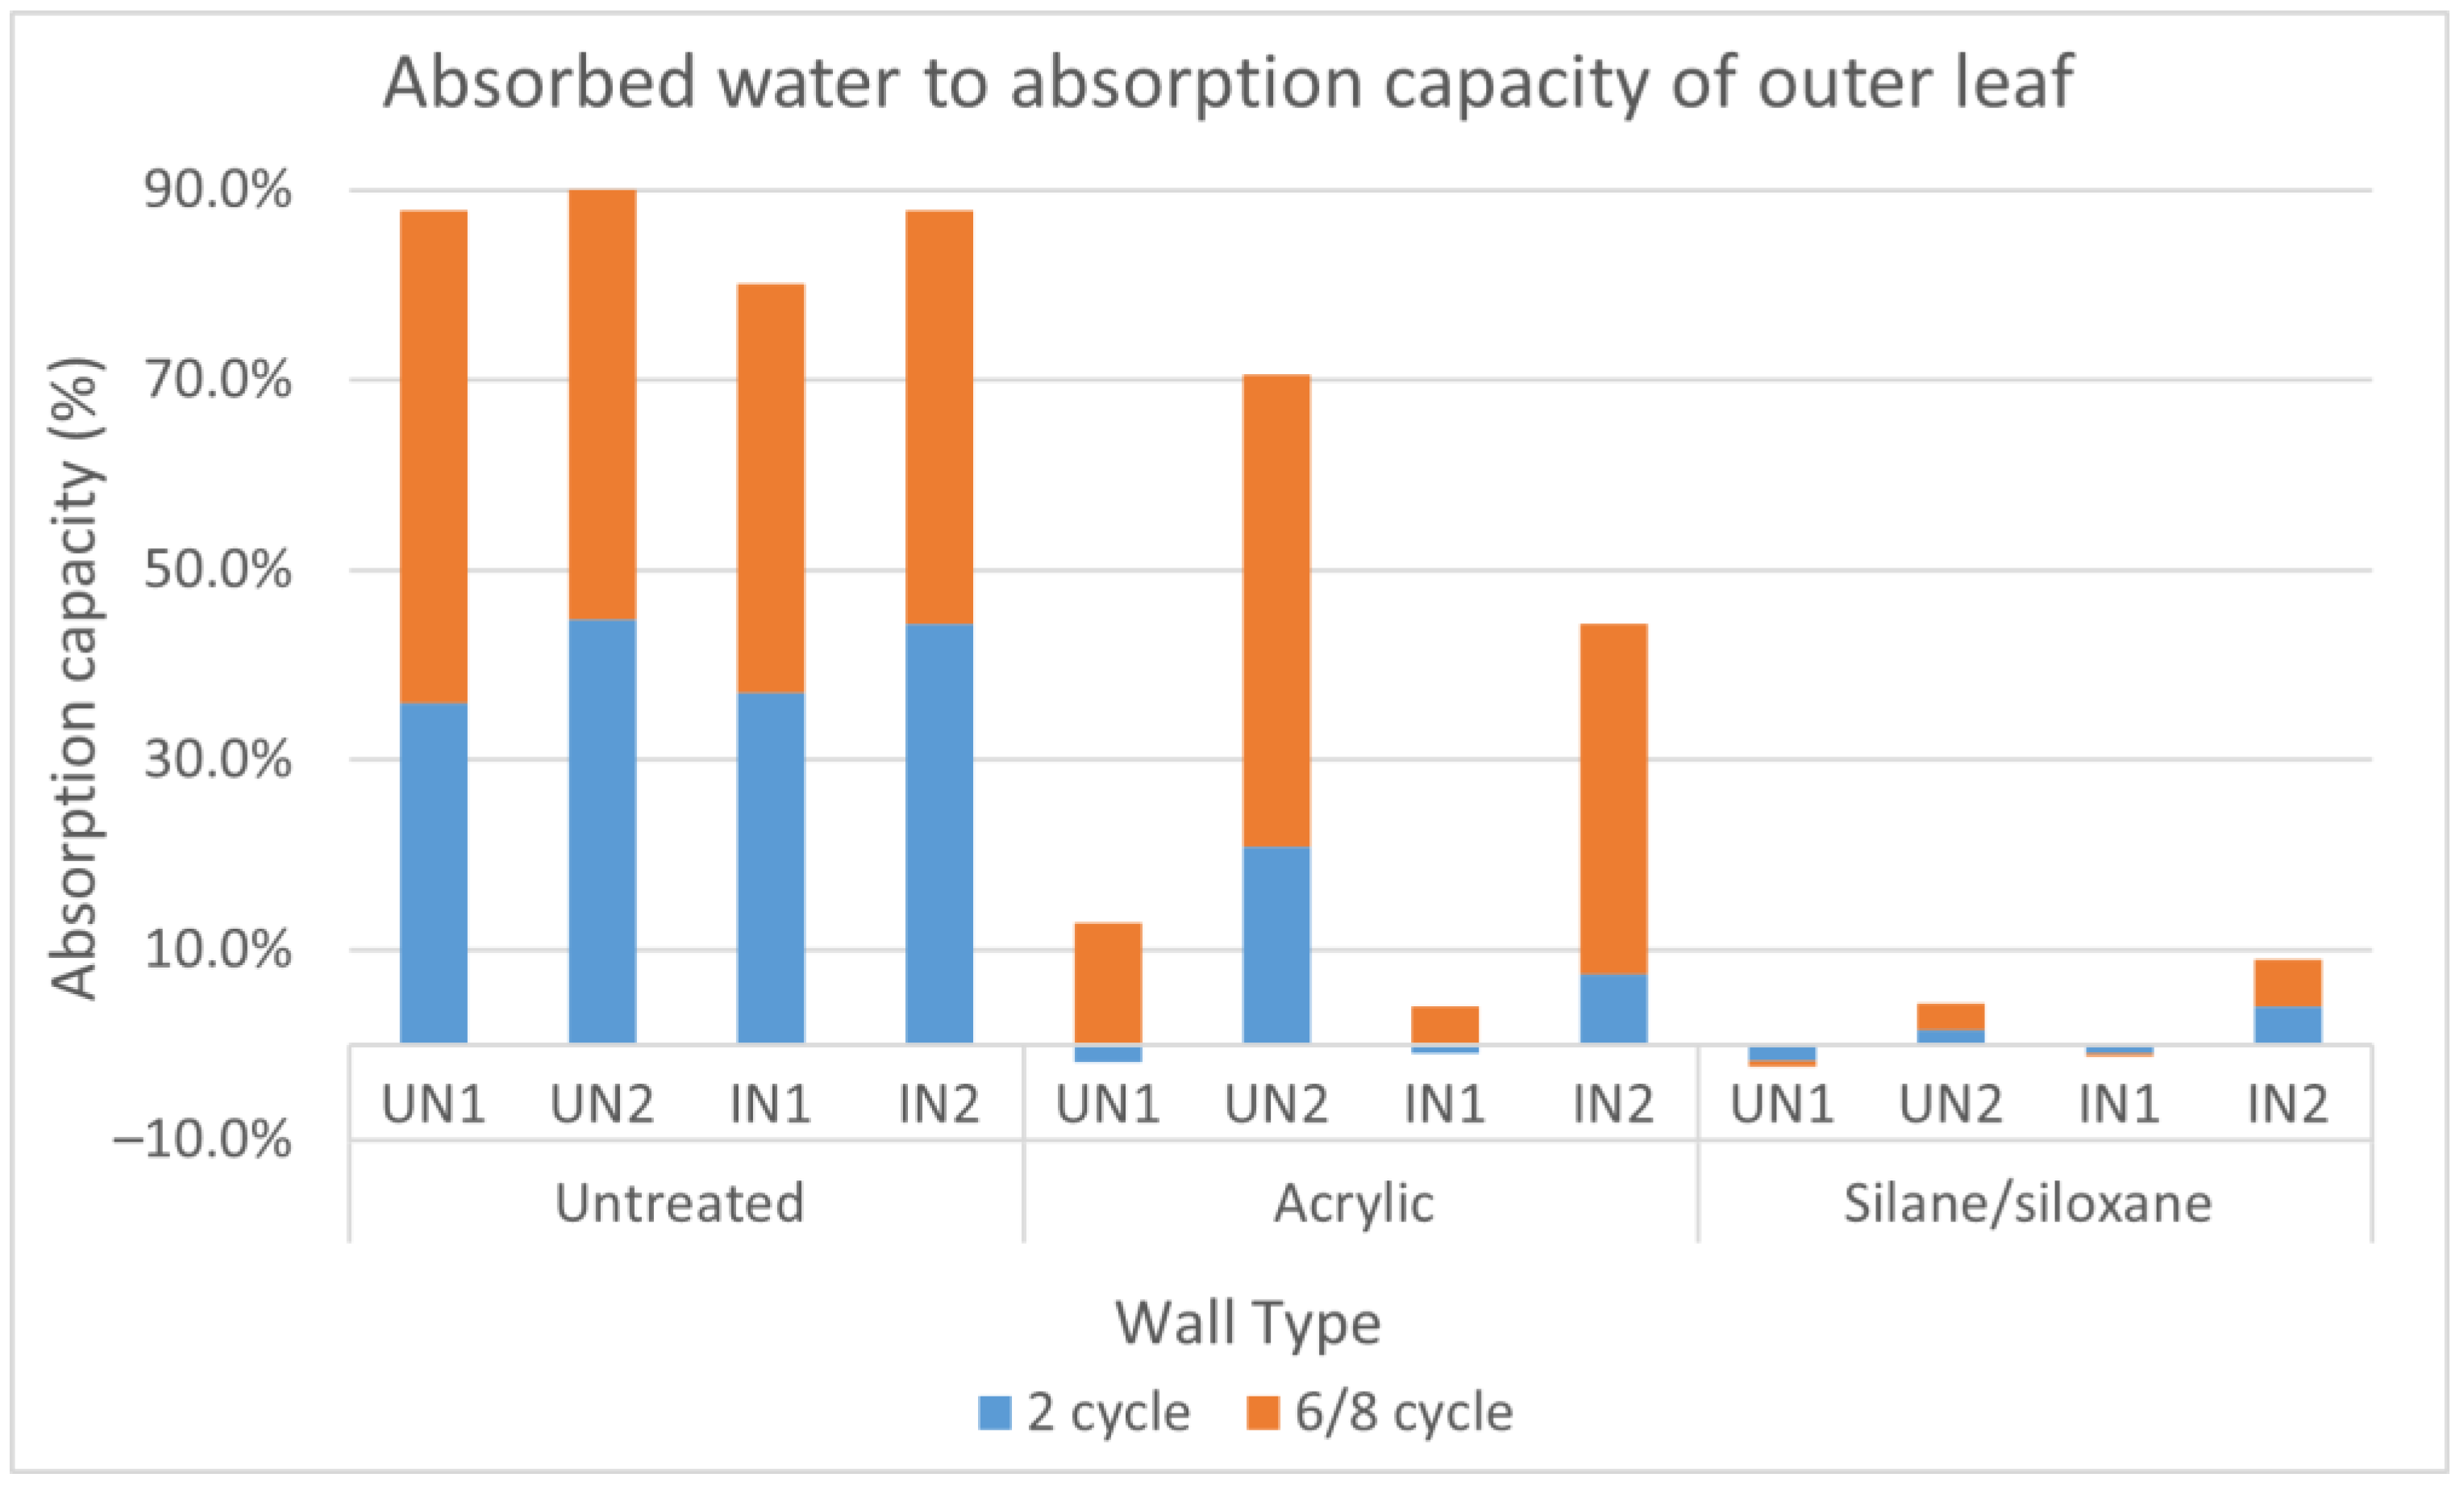
The resulting value is 21.27%. Based on the estimated absorption capacity together with the results in Table 7, the absorbed water to maximum water absorption capacity of the outer leaf per test phase can be obtained as shown in Figure 21. The total water gains of the untreated specimens from Phases 1 and 3 reach between 80% and 90% of the maximum absorption capacity. However, the ratios obtained from Phases 1 and 3 are very close, both reaching around 40% of the maximum absorption capacity. By combining the ratio of the dispersed water absorbed per test phase shown in Table 7, it is evident that the runoff rate increased significantly in Phase 3. On the other hand, both treated specimens showed minor gains or even no gains during Phase 1, while most of the gains in Phase 3 remain within 5% of the absorption capacity. For specimen Acrylic 2 with less ideal wall conditions, the reapplication of the treatment successfully reduced the overall ingress, reaching around a 13% reduction in absorption capacity in both wetting phases. Ultimately, from both Table 7 and Figure 21, it can be concluded that the silane/siloxane blend cream has the best and most consistent performance in reducing water ingress, while the acrylic-based liquid is capable of achieving a similar performance with almost no weight gain under moderate WDR simulated in Phase 1. However, its performance falls behind the silane/siloxane blend cream in the severe WDR event simulated in Phase 3.
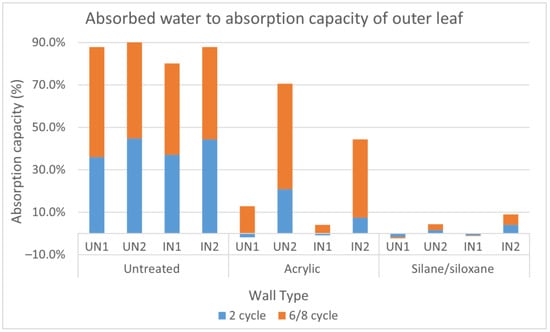
Figure 21.
Absorbed water to maximum water absorption capacity of outer leaf per test phase.
Overall, the results of the wall-scale WDR test on masonry cavity structures are in line with the findings in the bench test [23] although important limitations of the standard bench tests are identified in terms of representing the complex uptake and release of moisture in walls exposed to WDR.
Both the acrylic-based liquid and the silane/siloxane blend cream are capable of improving the waterproofing performance of masonry cavity walls, even in very severe exposure zones in the UK. In particular, under the testing protocol developed in this study, it is possible to define both the resistance to water absorption and the ability to dry between rain spells for both treatments. For modest exposure conditions (Phase 1), both treatments, when properly applied, are effective in both their water-repellent role and in retaining sufficient breathability, to the extent that the drying interval is sufficient to even reduce the specimens’ initial moisture content. When exposed to extreme conditions, (Phase 3), the waterproofing is still effective, especially for the silane/siloxane treatment. The drying process becomes more complex and in general less efficient; it is worth noting that both the HR sensors and the weight sensors registered an increase in moisture beyond the end of the wetting cycles and into the drying phases. The role played by the insulation is less immediately evident, and further testing with different values of cavity and type of insulation needs to be considered in order to obtain more robust results.
Author Contributions
Conceptualisation, D.D.; methodology, D.D., H.Z. and Y.A.; materials acquisition and preparation, H.Z.; experimental work, H.Z. and D.D.; formal analysis, D.D. and H.Z.; data curation, H.Z.; writing—original draft preparation, D.D. and H.Z.; writing—review and editing, D.D., H.Z. and Y.A.; visualisation, H.Z.; supervision, D.D. and Y.A.; project administration, D.D.; funding acquisition, D.D. and Y.A. All authors have read and agreed to the published version of the manuscript.
Funding
This research was partially funded by a studentship of the Department of Civil Environmental Geomatic Engineering, UCL. Funding was also received through the project ‘Waterproofing cavity walls to allow insulation in exposed areas’, funded by the UK Department for Business, Energy & Industrial Strategy (TRN 1303/04/2017), in collaboration with the UK Centre for Moisture in Buildings (UKCMB) and Building Research Establishment.
Data Availability Statement
Data generated during this study are available on direct request to the corresponding author. The data are not publicly available due to privacy.
Acknowledgments
We acknowledge the support of the technical staff at the UCL Department of Civil Environmental Geomatic Engineering.
Conflicts of Interest
The authors declare no conflicts of interest.
References
- Barlow, J. Private Sector Housebuilding: Structure and Strategies into the 21st Century; Council of Mortgage Lenders: London, UK, 2000. [Google Scholar]
- Ross, K. Non-Traditional Housing in the UK: A Brief Review; Council of Mortgage Lender: London, UK, 2002. [Google Scholar]
- Department for Levelling Up, Housing and Communities. English Housing Survey, 2020 to 2021: Subjective Overheating and Construction Type—Fact Sheet, Annex Tables; Department for Levelling Up, Housing and Communities: Wolverhampton, UK, 2022. [Google Scholar]
- National House Building Council NHBC Standards 2023; Section 6.1. External masonry walls, Section 6.1.6 Exposure. NHBC, NHBC House: Milton Keynes, UK, 2023.
- BS 8104; 1992 Code of Practice for Assessing Exposure of Walls to Wind-Driven Rain. British Standards Institution: Milton Keynes, UK, 1992.
- D’Ayala, D.; Aktas, Y.; Zhu, H. Waterproofing Cavity Walls to Allow Insulation in Exposed Areas: Appendix E (WDR Testing); Department for Business, Energy & Industrial Strategy: London, UK, 2021. [Google Scholar]
- BEIS. Domestic Private Rented Property: Minimum Energy Efficiency Standard—Landlord Guidance; Department for Business, Energy & Industrial Strategy: London, UK, 2017. [Google Scholar]
- Hinson, S.; Bolton, P. Energy Policy: An Overvie; Briefing Paper Number 8980, 22 December 2020; House of Commons Library: London, UK, 2020. [Google Scholar]
- BEIS. Annual Fuel Poverty Statistics in England 2020 (2018 Data); Department for Business, Energy & Industrial Strategy: London, UK, 2020. [Google Scholar]
- D’Ayala, D.; Aktas, Y.D. Moisture dynamics in the masonry fabric of historic buildings subjected to wind-driven rain and flooding. Build. Environ. 2016, 104, 208–220. [Google Scholar] [CrossRef]
- Erkal, A.; D’Ayala, D.; Stephenson, V. Evaluation of environmental impact on historical stone masonry through on-site monitoring appraisal. Geol. Soc. Lond. 2013, 46, 449–458. [Google Scholar] [CrossRef]
- Aktas, Y.D.; Shi, J.; Blades, N.; D’Ayala, D. Indoor mould testing in a historic building: Blickling Hall. Herit. Sci. 2018, 6, 51. [Google Scholar] [CrossRef]
- Lü, X. Modelling of heat and moisture transfer in buildings: I. Model program. Energy Build. 2002, 34, 1033–1043. [Google Scholar] [CrossRef]
- Aktas, Y.D.; D’Ayala, D.; Blades, N.; Calnan, C. An assessment of moisture induced damage in Blickling Hall in Norfolk, England, via environmental monitoring. Herit. Sci. 2017, 5, 5. [Google Scholar] [CrossRef]
- Charola, A.E. Water-Repellent Treatments for Building Stones: A Practical Overview. APT Bullet. J. Preserv. Technol. 1995, 26, 10–17. [Google Scholar] [CrossRef]
- Tsakalof, A.; Manoudis, P.; Karapanagiotis, I.; Chryssoulakis, I.; Panayiotou, C. Assessment of synthetic polymeric coatings for the protection and preservation of stone monuments. J. Cult. Herit. 2007, 8, 69–72. [Google Scholar] [CrossRef]
- Chiovitti, D.; Gonçalves, M.; Renzullo, A. Performance evaluation of water repellents for above grade masonry. J. Therm. Envel. Build. Sci. 1998, 22, 156–168. [Google Scholar] [CrossRef]
- Stefanidou, M.; Karozou, A. Testing the effectiveness of protective coatings on traditional bricks. Constr. Build. Mater. 2016, 111, 482–487. [Google Scholar] [CrossRef]
- Lubelli, B.; Cnudde, V.; Diaz-Goncalves, T.; Franzoni, E.; van Hees, R.P.; Ioannou, I.; Viles, H. Towards a more effective and reliable salt crystallization test for porous building materials: State of the art. Mater. Struct. 2018, 51, 55. [Google Scholar] [CrossRef]
- Roos, M.; König, F.; Stadtmüller, S.; Weyershausen, B. Evolution of silicone based water repellents for modern building protection. In Proceedings of the 5th International Conference on Water Repellent Treatment of Building Materials, Brussels, Belgium, 15–16 April 2008; pp. 15–16. [Google Scholar]
- Barbieri, E.; Trevisiol, F.; Pizzigatti, C.; Bitelli, G.; Franzoni, E. Evaluating water-repellents applied to brick masonry: An experimental study by thermal imaging and water transport properties’ characterization. Constr. Build. Mater. 2022, 356, 129319. [Google Scholar] [CrossRef]
- Lee, Y.Y.; Halim, M.S.; Aminudin, E.; Guntor, N.A. Thermal repellent properties of surface coating using silica. In IOP Conference Series: Materials Science and Engineering; IOP Publishing: Bristol, UK, 2017; Volume 271, p. 012020. [Google Scholar]
- Aktas, Y.D.; Zhu, H.; D’Ayala, D.; Weeks, C. Impact of surface waterproofing on the performance of brick masonry through the moisture exposure life-cycle. Build. Environ. 2021, 197, 107844. [Google Scholar] [CrossRef]
- Borsoi, G.; Esteves, C.; Flores-Colen, I.; Veiga, R. Effect of hygrothermal aging on hydrophobic treatments applied to building exterior claddings. Coatings 2020, 10, 363. [Google Scholar] [CrossRef]
- Esteves, C.; Ahmed, H.; Flores-Colen, I.; Veiga, R. The influence of hydrophobic protection on building exterior claddings. J. Coat. Technol. Res. 2019, 16, 1379–1388. [Google Scholar] [CrossRef]
- Soulios, V.; de Place Hansen, E.J.; Feng, C.; Janssen, H. Hygric behavior of hydrophobized brick and mortar samples. Build. Environ. 2020, 176, 106843. [Google Scholar] [CrossRef]
- Slapø, F.; Kvande, T.; Bakken, N.; Haugen, M.; Lohne, J. Masonry’s Resistance to Driving Rain: Mortar Water Content and Impregnation. Buildings 2017, 7, 70. [Google Scholar] [CrossRef]
- Hansen, T.K.; Bjarløv, S.P.; Peuhkuri, R.H.; Handen, K.K. Performance of hydrophobized historic solid masonry—Experimental approach. Constr. Build. Mater. 2018, 188, 695–708. [Google Scholar] [CrossRef]
- Lubelli, B.; Hees, R.V.; Groot, C.; Gunneweg, J. Risks of the Use of Water Repellents on Salt Contaminated Masonry: The Case of a Windmill in the Netherlands/Risiken beim Hydrophobieren von salzhaltigem Mauerweric Fallstudie anhand einer Windmühle in den Niederlanden. Restor. Build. Monum. 2007, 13, 319–330. [Google Scholar] [CrossRef]
- De Buergo Ballester, M.A.; González, R.F. Basic methodology for the assessment and selection of water-repellent treatments applied on carbonatic materials. Prog. Org. Coat. 2001, 43, 258–266. [Google Scholar] [CrossRef]
- Ogunmokun, F.A.; Liu, Z.; Wallach, R. The influence of surfactant-application method on the effectiveness of water-repellent soil remediation. Geoderma 2020, 362, 114081. [Google Scholar] [CrossRef]
- Santos, W.F.; Quattrone, M.; John, V.M.; Angulo, S.C. Roughness, wettability and water absorption of water repellent treated recycled aggregates. Constr. Build. Mater. 2017, 146, 502–513. [Google Scholar] [CrossRef]
- Shahreza, S.K.; Niklewski, J.; Molnár, M. Novel water penetration criterion for clay brick masonry claddings. Constr. Build. Mater. 2022, 353, 129109. [Google Scholar] [CrossRef]
- D’Ayala, D.; Aktas, Y.; Zhu, H. Waterproofing Cavity Walls to Allow Insulation in Exposed Areas: Appendix C (Bench Testing); Department for Business, Energy & Industrial Strategy: London, UK, 2021. [Google Scholar]
- Hammett, M. Brickwork and Paving: For House and Garden; Crowood: Ramsbury, UK, 2013. [Google Scholar]
- BEIS. Waterproofing Cavity Walls to Allow Insulation in Exposed Areas: Report; Department for Business, Energy & Industrial Strategy: London, UK, 2021. [Google Scholar]
- Brick Development Association. Use of Traditional Lime Mortars in Modern Brickwork. Properties of Bricks and Mortar Generally; Brick Development Association: London, UK, 2001. [Google Scholar]
- BS EN 12865:2001; Windows and Doors—Terminology—Terms Used in Windows and Doors Standards. British Standards Institution: Milton Keynes, UK, 2001.
- Lacasse, M.A.; Miyauchi, H.; Hiemstra, J.; Wolf, A.T.; Dean, S.W. Water penetration of cladding components–results from laboratory tests on simulated sealed vertical and horizontal joints of wall cladding. J. ASTM Int. 2009, 6, 1–29. [Google Scholar] [CrossRef]
- Calle, K.; Coupillie, C.; Janssens, A.; Van Den Bossche, N. Implementation of rainwater infiltration measurements in hygrothermal modelling of non-insulated brick cavity walls. J. Build. Phys. 2020, 43, 477–502. [Google Scholar] [CrossRef]
- BS EN 16809-1:2019; Thermal Insulation Products of Buildings. In-Situ Formed Products from Loose-Fill Expanded Polystyrene (EPS) Beads and Bonded Expanded Polystyrene Beads. Specification for the Bonded and Loose-Fill Products Before Installation. British Standards Institution: Milton Keynes, UK, 2019.
- BS EN 1602:2013; Thermal Insulating Products for Building Applications. Determination of the Apparent Density. British Standards Institution: Milton Keynes, UK, 2013.
- BS EN 12524:2000; Building Materials and Products. Hygrothermal Properties. Tabulated Design Values. British Standards Institution: Milton Keynes, UK, 2000.
- BS EN 1609:2013; Thermal Insulating Products for Building Applications. Determination of Short Term Water Absorption by Partial Immersion. British Standards Institution: Milton Keynes, UK, 2013.
- BS EN 12155; Curtain Walling Water-Tightness Laboratory Test under Static Pressure. British Standards Institution: Milton Keynes, UK, 2000.
- BS EN 13050:2011; Curtain Walling—Watertightness—Laboratory Test under Dynamic Condition of Air Pressure and Water Spray. British Standards Institution: Milton Keynes, UK, 2011.
- BS EN 13051:2001; Windows and Doors—Pedestrian Doorsets, Windows, Curtain Walling, Grilles, and Shutters—Burglar Resistance—Requirements and Classification. British Standards Institution: Milton Keynes, UK, 2001.
- BS EN 1027:2016; Windows and Doors—Air Permeability—Classification. British Standards Institution: Milton Keynes, UK, 2016.
- ASTM C1601-22a; Standard Test Method for Field Determination of Water Penetration of Installed Exterior Windows, Skylights, Doors, and Curtain Walls, by Uniform or Cyclic Static Air Pressure Difference. ASTM International: West Conshohocken, PA, USA, 2022.
- ASTM E514/E514M-20; Standard Test Method for Water Penetration and Leakage Through Masonry. ASTM International: West Conshohocken, PA, USA, 2020.
- BS 4315-2:1970; Specification for Tolerances on Form and Position for Holes and Slots in Fabricated Steel. British Standards Institution: Milton Keynes, UK, 1970.
- Rüther, P.; Time, B. External wood claddings–performance criteria, driving rain and large-scale water penetration methods. Wood Mater. Sci. Eng. 2015, 10, 287–299. [Google Scholar] [CrossRef]
- Amorim, M.; de Freitas, V.P.; Torres, I. Influence of Moisture on the Energy Performance of Retrofitted Walls-Experimental Assessment and Validation of an Hygrothermal Model. Int. J. Archit. Herit. 2023, 18, 477–491. [Google Scholar] [CrossRef]
- Hall, M.R. Assessing the environmental performance of stabilised rammed earth walls using a climatic simulation chamber. Build. Environ. 2007, 42, 139–145. [Google Scholar] [CrossRef]
- Arce Recatalá, M.; García Morales, S.; Van den Bossche, N. A new test standard to evaluate the watertightness of window-wall interfaces. In Proceedings of the 14th International Conference on Durability of Building Materials and Components, Ghent, Belgium, 29–31 May 2017; ISBN 978-1-5108-5675-2. [Google Scholar]
- Van Den Bossche, N.; Lacasse, M.A.; Janssens, A. A uniform methodology to establish test parameters for watertightness testing part II: Pareto front analysis on co-occurring rain and wind. Build. Environ. 2013, 63, 157–167. [Google Scholar] [CrossRef]
- Van Linden, S.; Van Den Bossche, N. Review of rainwater infiltration rates in wall assemblies. Build. Environ. 2022, 219, 109213. [Google Scholar] [CrossRef]
- Foulds, S.A.; Warburton, J. Significance of wind-driven rain (wind-splash) in the erosion of blanket peat. Geomorphology 2007, 83, 183–192. [Google Scholar] [CrossRef]
- Shahreza, S.K.; Niklewski, J.; Molnár, M. Experimental investigation of water absorption and penetration in clay brick masonry under simulated uniform water spray exposure. J. Build. Eng. 2021, 43, 102583. [Google Scholar] [CrossRef]
- Stephenson, V.; D’Ayala, D. Structural response of masonry infilled timber frames to flood and wind driven rain exposure. J. Perform. Constr. Facil. 2019, 33, 04019028. [Google Scholar] [CrossRef]
- BEIS. Waterproofing Cavity Walls to Allow Insulation in Exposed Areas: Appendix A (Wall Analysis); Department for Business, Energy & Industrial Strategy: London, UK, 2021. [Google Scholar]
- Met Office. UK Climate—Synoptic and Climate Stations. 2023. Available online: https://www.metoffice.gov.uk/research/climate/maps-and-data/uk-climate-averages/gcjjm7j5g (accessed on 20 September 2023).
- Abuku, M.; Blocken, B.; Roels, S. Moisture response of building facades to wind-driven rain: Field measurements compared with numerical simulations. J. Wind. Eng. Ind. Aerodyn. 2009, 97, 197–207. [Google Scholar] [CrossRef]
- Cacciotti, R. Brick masonry response to wind driven rain. Eng. Struct. 2020, 204, 110080. [Google Scholar] [CrossRef]
- Strandberg-de Bruijn, P.B.; Balksten, K. Energy and moisture in historic masonry walls retrofitted with hemp-lime. IOP Conf. Ser. Mater. Sci. Eng. 2019, 660, 012070. [Google Scholar] [CrossRef]
- Panico, S.; Herrera-Avellanosa, D.; Troi, A. Monitoring rising damp in solid masonry walls: An experimental comparison of five different methods. J. Build. Eng. 2023, 75, 106999. [Google Scholar] [CrossRef]
- BS EN ISO 15148:2002; Hygrothermal Performance of Building Materials and Products, Determination of Water Absorption Coefficient by Partial Immersion. British Standards Institution: Milton Keynes, UK, 2002.


Disclaimer/Publisher’s Note: The statements, opinions and data contained in all publications are solely those of the individual author(s) and contributor(s) and not of MDPI and/or the editor(s). MDPI and/or the editor(s) disclaim responsibility for any injury to people or property resulting from any ideas, methods, instructions or products referred to in the content. |
© 2024 by the authors. Licensee MDPI, Basel, Switzerland. This article is an open access article distributed under the terms and conditions of the Creative Commons Attribution (CC BY) license (https://creativecommons.org/licenses/by/4.0/).