Article

Harnessing Path Optimization to Enhance the Strength of Three-Dimensional (3D) Printed Concrete

College of Hydraulic and Environmental Engineering, China Three Gorges University, Yichang 443002, China
*
Author to whom correspondence should be addressed.
Buildings 2024, 14(2), 455; https://doi.org/10.3390/buildings14020455
Submission received: 12 January 2024 / Revised: 29 January 2024 / Accepted: 3 February 2024 / Published: 7 February 2024
(This article belongs to the Section Building Materials, and Repair & Renovation)

Abstract

:
The path-dependent strength of three-dimensional printed concrete (3DPC) hinders further engineering application. Printing path optimization is a feasible solution to improve the strength of 3DPC. Here, the mix ratio of 3DPC was studied to print standard concrete specimens with different printing paths using our customized concrete 3D printer, which features fully sealed extrusion and ultrathin nozzles. These paths include crosswise, vertical, arched, and diagonal patterns. Their flexural and compressive strengths were tested. In order to verify the tested results and expose the mechanism of strength enhancement, digital image correlation (DIC) was used to capture the dynamic gradual fracture in the flexural tests. Also, the meso- and microstructures of the 3D-printed concrete specimens were pictured. The results reported here show that arched-path concrete has 30% more flexural strength than others because it makes better use of filament-wise strength. The findings here provide a pathway to improve the strength of 3D-printed concrete by path optimization, boosting 3DPC’s extensive application in civil engineering.

1. Introduction

In recent years, three-dimensional-printed concrete (3DPC) has attracted more and more attention [1,2] in the research community and engineering applications, and it has been applied in a wide range of fields such as engineering of architectures, municipal roads and bridges, hydraulics, etc., because of its high efficiency, low cost, flexibility, intelligence, and automation [3,4]. Compared with traditional concrete, 3DPC brings many benefits, such as no need for formwork, rapid speed of construction, less labor, lower cost, and manufacturing complex shapes [5,6,7], etc. Currently, more and more houses, apartments, furniture, decorations, sculptures, bridges, etc., are being constructed by 3D printing worldwide [8,9], revolutionizing the construction industry [10,11,12].
Three-dimensional-printed concrete (3DPC) structures are constructed by the layer-stacking method [13] using a 3DPC printer. The construction process of a structure is divided into three stages: modeling, slicing, and printing. The former two are performed in digital style on a computer. In the slicing stage, the actual structures are sliced into a certain number of layers, filaments, and pathways. During the printing stage, in a single layer, fresh fluidic concrete is extruded through nozzles mounted on a rack or robotic arm [14,15] as the given filaments and pathways [16,17]. When the fresh layer of the 3DPC is continuously stacked, the old 3DPC layers keep hardening to maintain the process and avoid collapse due to their framework-free pattern until the 3DPC structure is completely printed [18,19,20]. This layered construction method introduces a novel construction approach in the construction industry, distinct from traditional one-time casting molds. Layered construction provides the possibility to achieve more complex and customized structures [21].
However, this kind of technology has not yet been fully applied because of its limited strength. In 3D printing construction, due to the generation of layers, there may be differences in the properties of the structure in different directions, resulting in anisotropy. This can have an impact on the mechanical characterization of 3DPC. In order to improve the practicability of 3DPC, it is necessary to find a way to improve its strength and enhance its load-carrying capacity [22,23]. Many attempts have been made. For instance, Hambach, M. et al. [24] enhanced the flexural strength and compressive strength of 3DPC by mixing Portland cement and reinforcing short fibers. Liu, M. et al. [25] proposed a 3D-printed fiber-reinforced mortar frame with basalt and carbon fibers. Li, Y. F. et al. [26] improved the extrudability, fluidity, setting time, and buildability of cement mortar suitable for 3D printing by adding carbon fibers. Li, Z. et al. [27] presented high-performance concrete suitable for 3D printing that incorporates micron materials based on fiber reinforcement. However, the mixing of admixtures with concrete slurry has a significant impact on the printability of concrete [28,29] and also complicates the printing process of 3DPC [30], which easily causes printing failure and increases the cost. Considering that 3DPC is stacked filament by filament in a layer and ignores the stage of the vibration [31], the inter-filament adhesion of 3DPC may slightly reduce the load-carrying capacity [32,33]. Therefore, in order to simplify the printing process and ensure the printability of 3DPC, an alternative style of strength improvement of 3DPC, printing path optimization, has gradually attracted attention. The virtue of this style lies mainly in avoiding the complexity of mixing with admixtures.
Path optimization is a biological evolution strategy that changes anisotropy into isotropy and enhances the strength of the material by means of making full use of the pros and bypassing the cons of materials [34]. For example, the cross-section of beetle elytra achieves high stiffness through particular microstructures [35]. In helicoidal composites, the layers of locally parallel filaments are laminated to each other in such a way that each adjacent layer is skewed by a constant angle from the layer below it. Using the contact among filaments to simulate the bonding of the soft matrix of the lobster cuticle, the axial strength of filaments is much higher than the contact strength between filaments [36]. Compared to other methods, changing the printing path guarantees the printability and efficiency of the product [35,36,37], which is indispensable when designing the structure of 3DPC. So, we tried to enhance the strength of 3DPC by changing the printing path [38,39,40].
Here, the mix ratio of 3DPC was studied to print standard concrete specimens with different printing paths using our customized concrete 3D printer, which features fully sealed extrusion and ultrathin nozzles. These paths include crosswise, vertical, arched, and diagonal patterns. Their flexural and compressive strengths were tested. In order to verify the tested results and expose the mechanism of strength enhancement, digital image correlation (DIC) was used to capture the dynamic gradual fracture in the flexural tests. Also, the meso- and microstructures of the 3D-printed concrete specimens were pictured. The findings here provide a pathway to improve the strength of 3D-printed concrete by path optimization, boosting 3DPC’s extensive application in civil engineering.

2. Materials, Fabrication, and Testing Methods
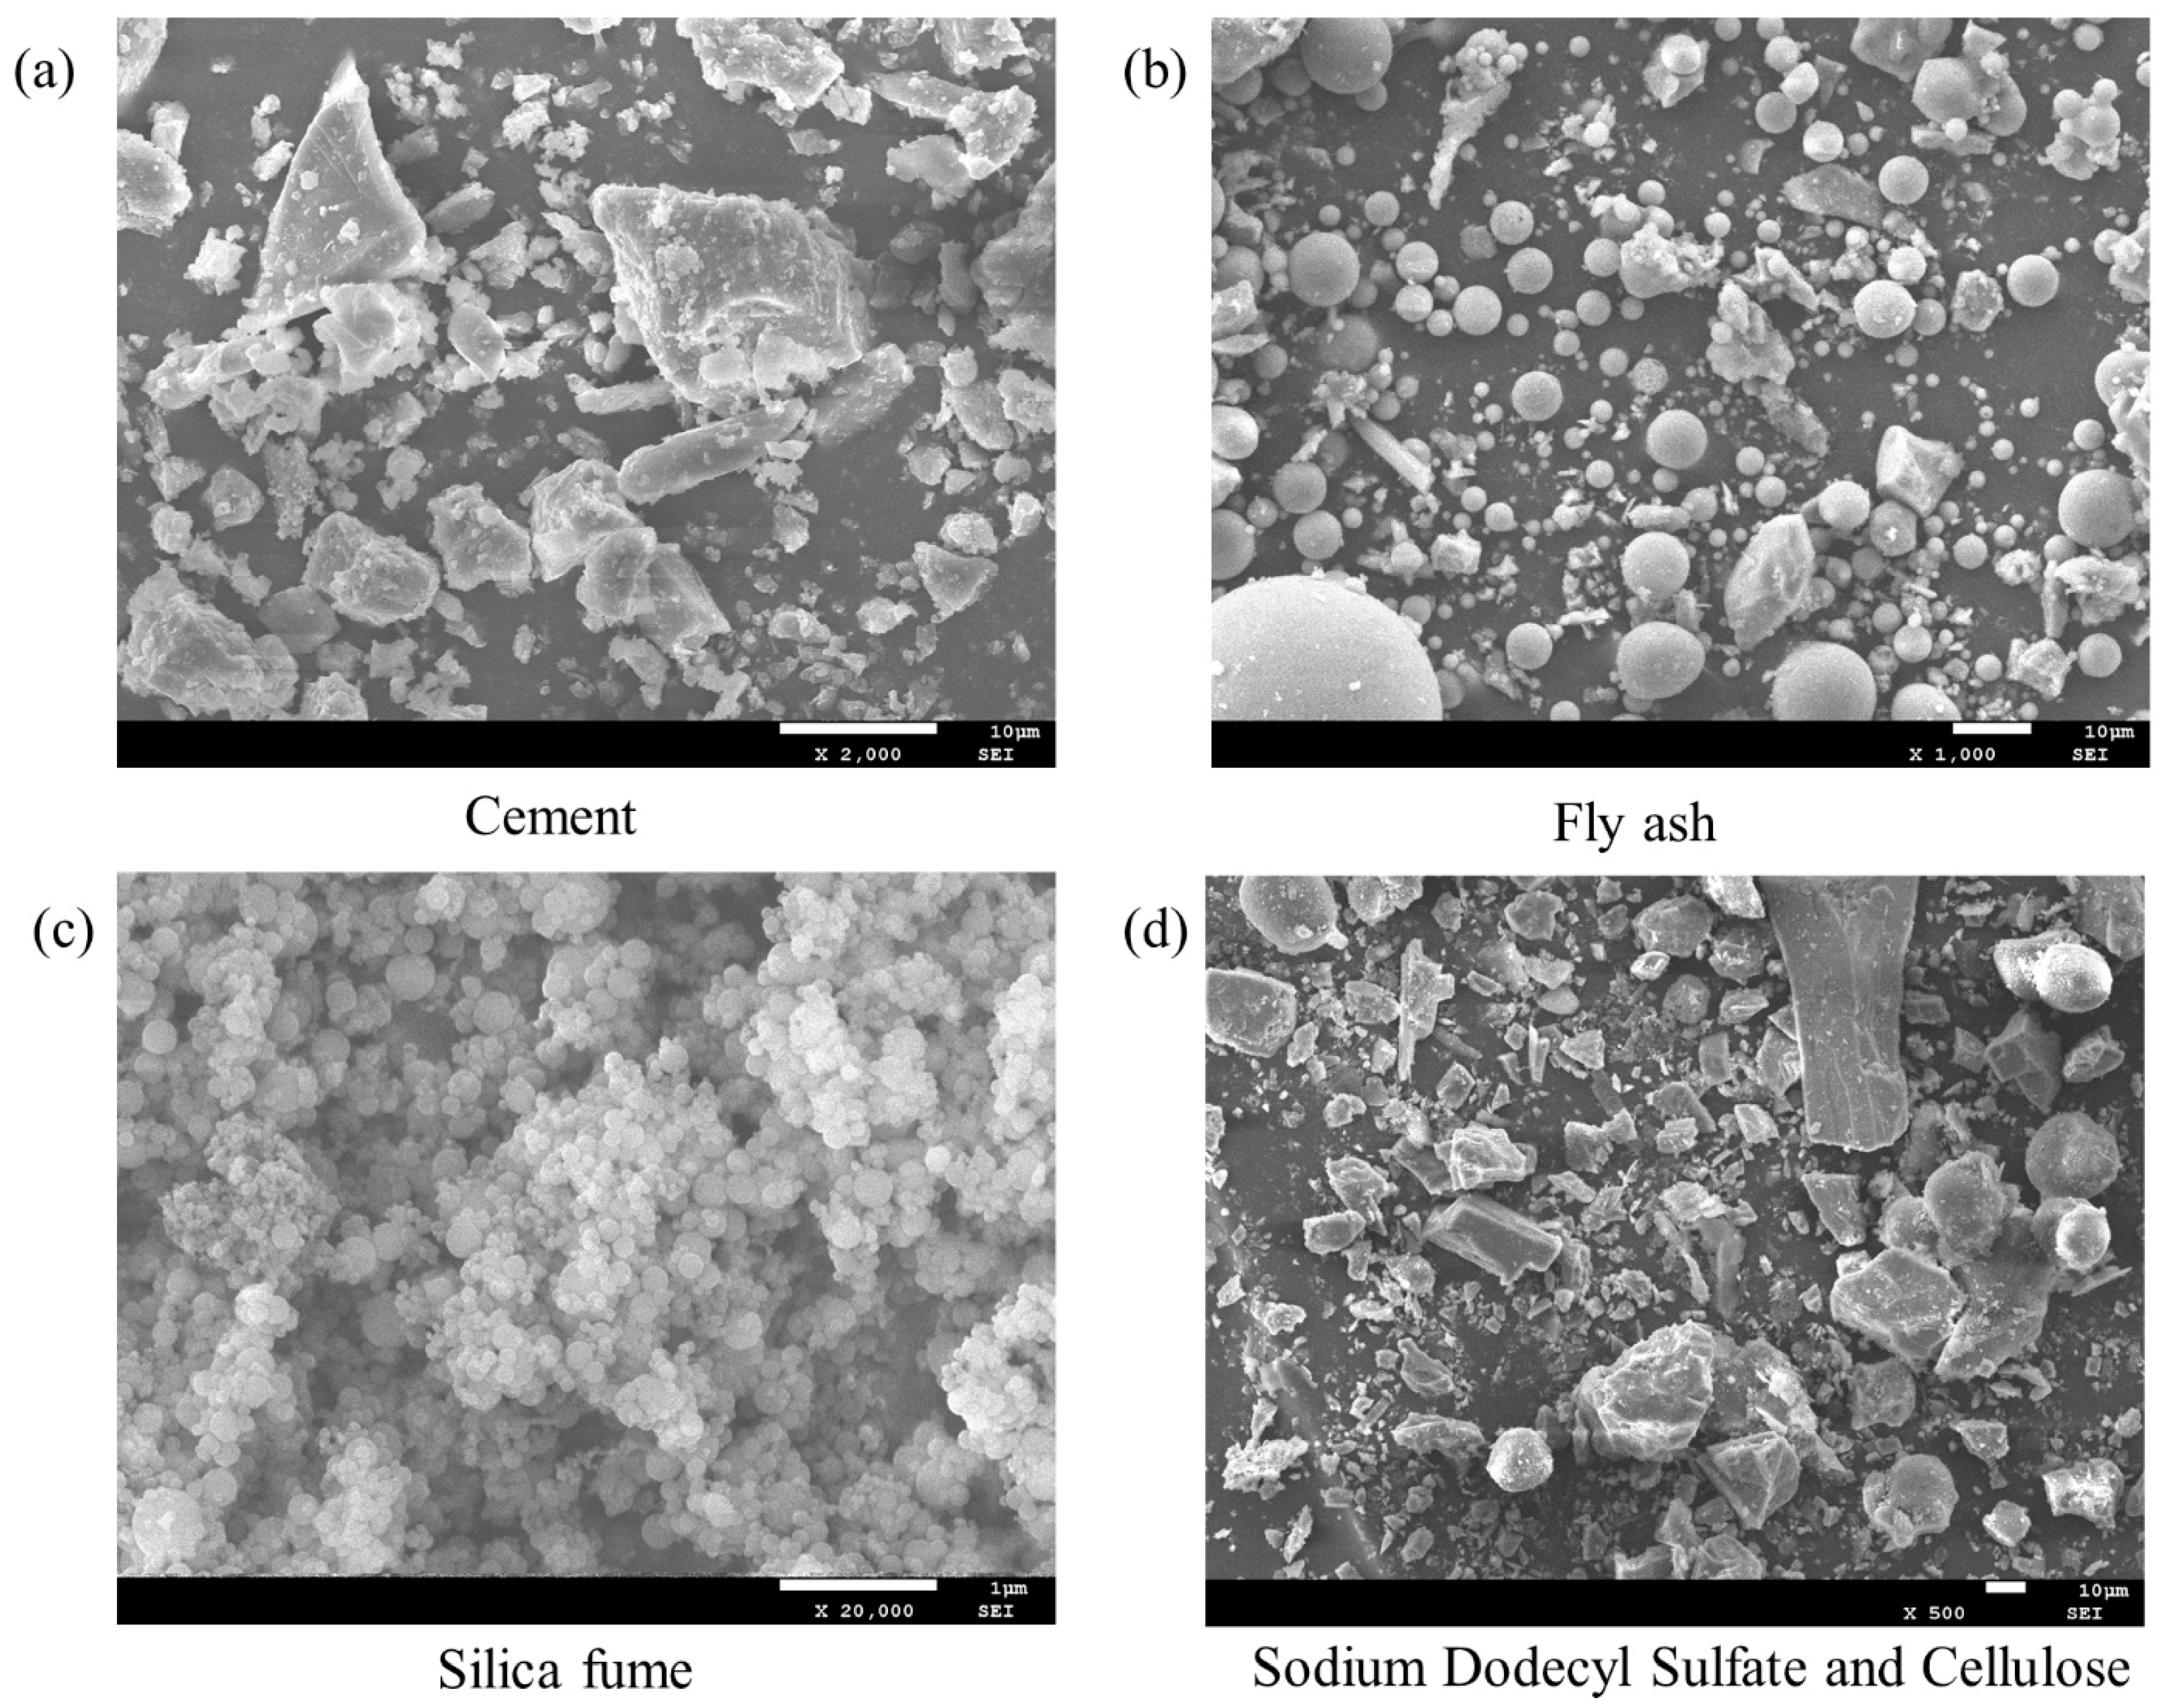
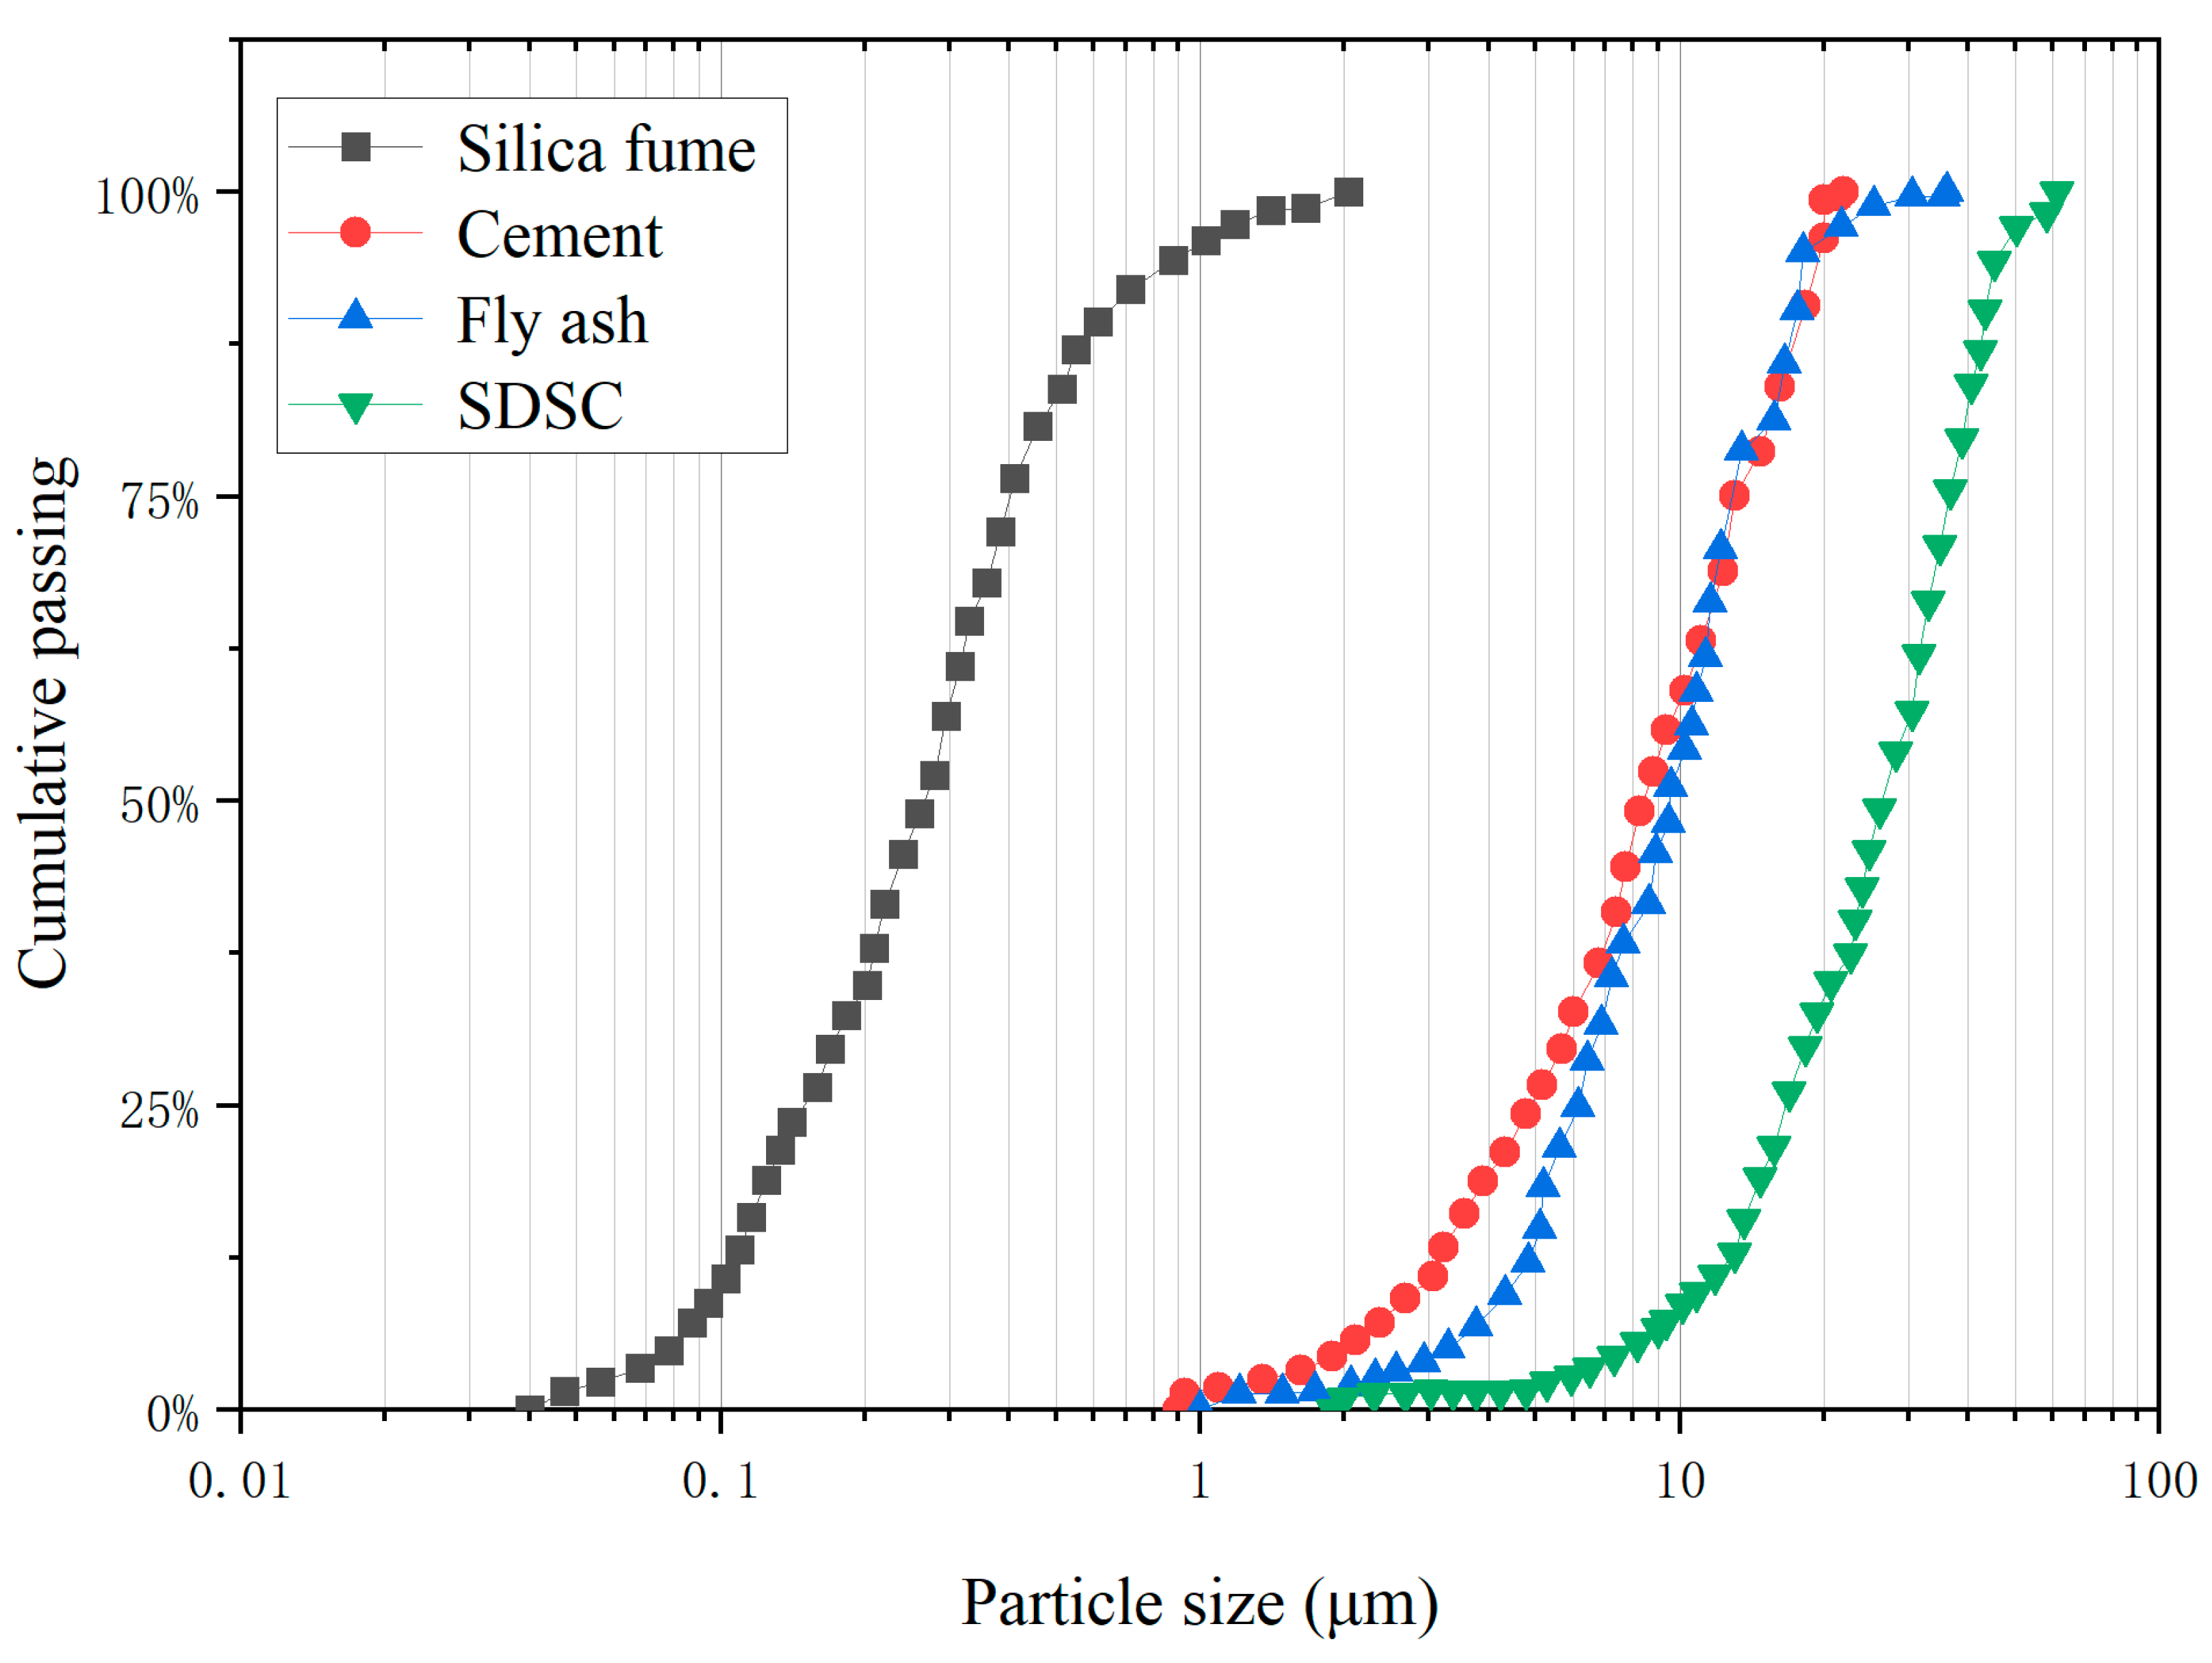
2.1. Mixing Design

In order to fabricate 3D-printed concrete specimens with different paths, we elaborately made the mix design, as shown in Table 1, which included different proportions of ingredients: cement, fly ash, silica fume, sand, water, sodium dodecyl sulfate, cellulose (SDSC), and water reducer.
The cement is ordinary Portland cement, whose main chemical composition consists of CaO, SiO2, Fe2O3, and Al2O3. Fly ash is a fine ash in the flue gas produced by coal combustion, which is composed of SiO2, Al2O3, Fe2O3, CaO, MgO, and SO3. Silica fume is a kind of ultrafine silica powder formed by the rapid oxidation and condensation of SiO2 and Si gas and oxygen in the air during the smelting of ferrosilicon alloy and industrial silicon. SDSC is a new type of cement mortar admixture composed of natural polymer materials, and it can enhance the strength of cement mortar and improve its workability and cohesiveness. The specific gravities of materials used are shown in Table 2. Silica fume and SDSC were introduced to reduce the shear force between particles and the friction of the slurry and the nozzle or pipe. As for the admixture, polycarboxylic acid high-performance water reducer was used as a water reducer to control the workability of the slurry.
Before the experiment, SEM was performed on the powders of four ingredients, namely, cement, fly ash, silica fume, and SDSC, and the microscopic photos of the four powders are shown in Figure 1. The angular irregular particles of the cement, PO 42.5, range from approximately 5 to 10 µm. Fly ash has a sphere-like shape with a diameter of 2–20 µm. The size of the silica fume grain is 1 µm. SDSC is aimed at improving the plasticity and consistency of the fluidic concrete with 20 µm grains. Figure 2 shows the particle size distributions (PSDs) of the materials used. Water reducer was introduced to guarantee the slump of the fluidic concrete.
The material ratio required is shown in Table 1.

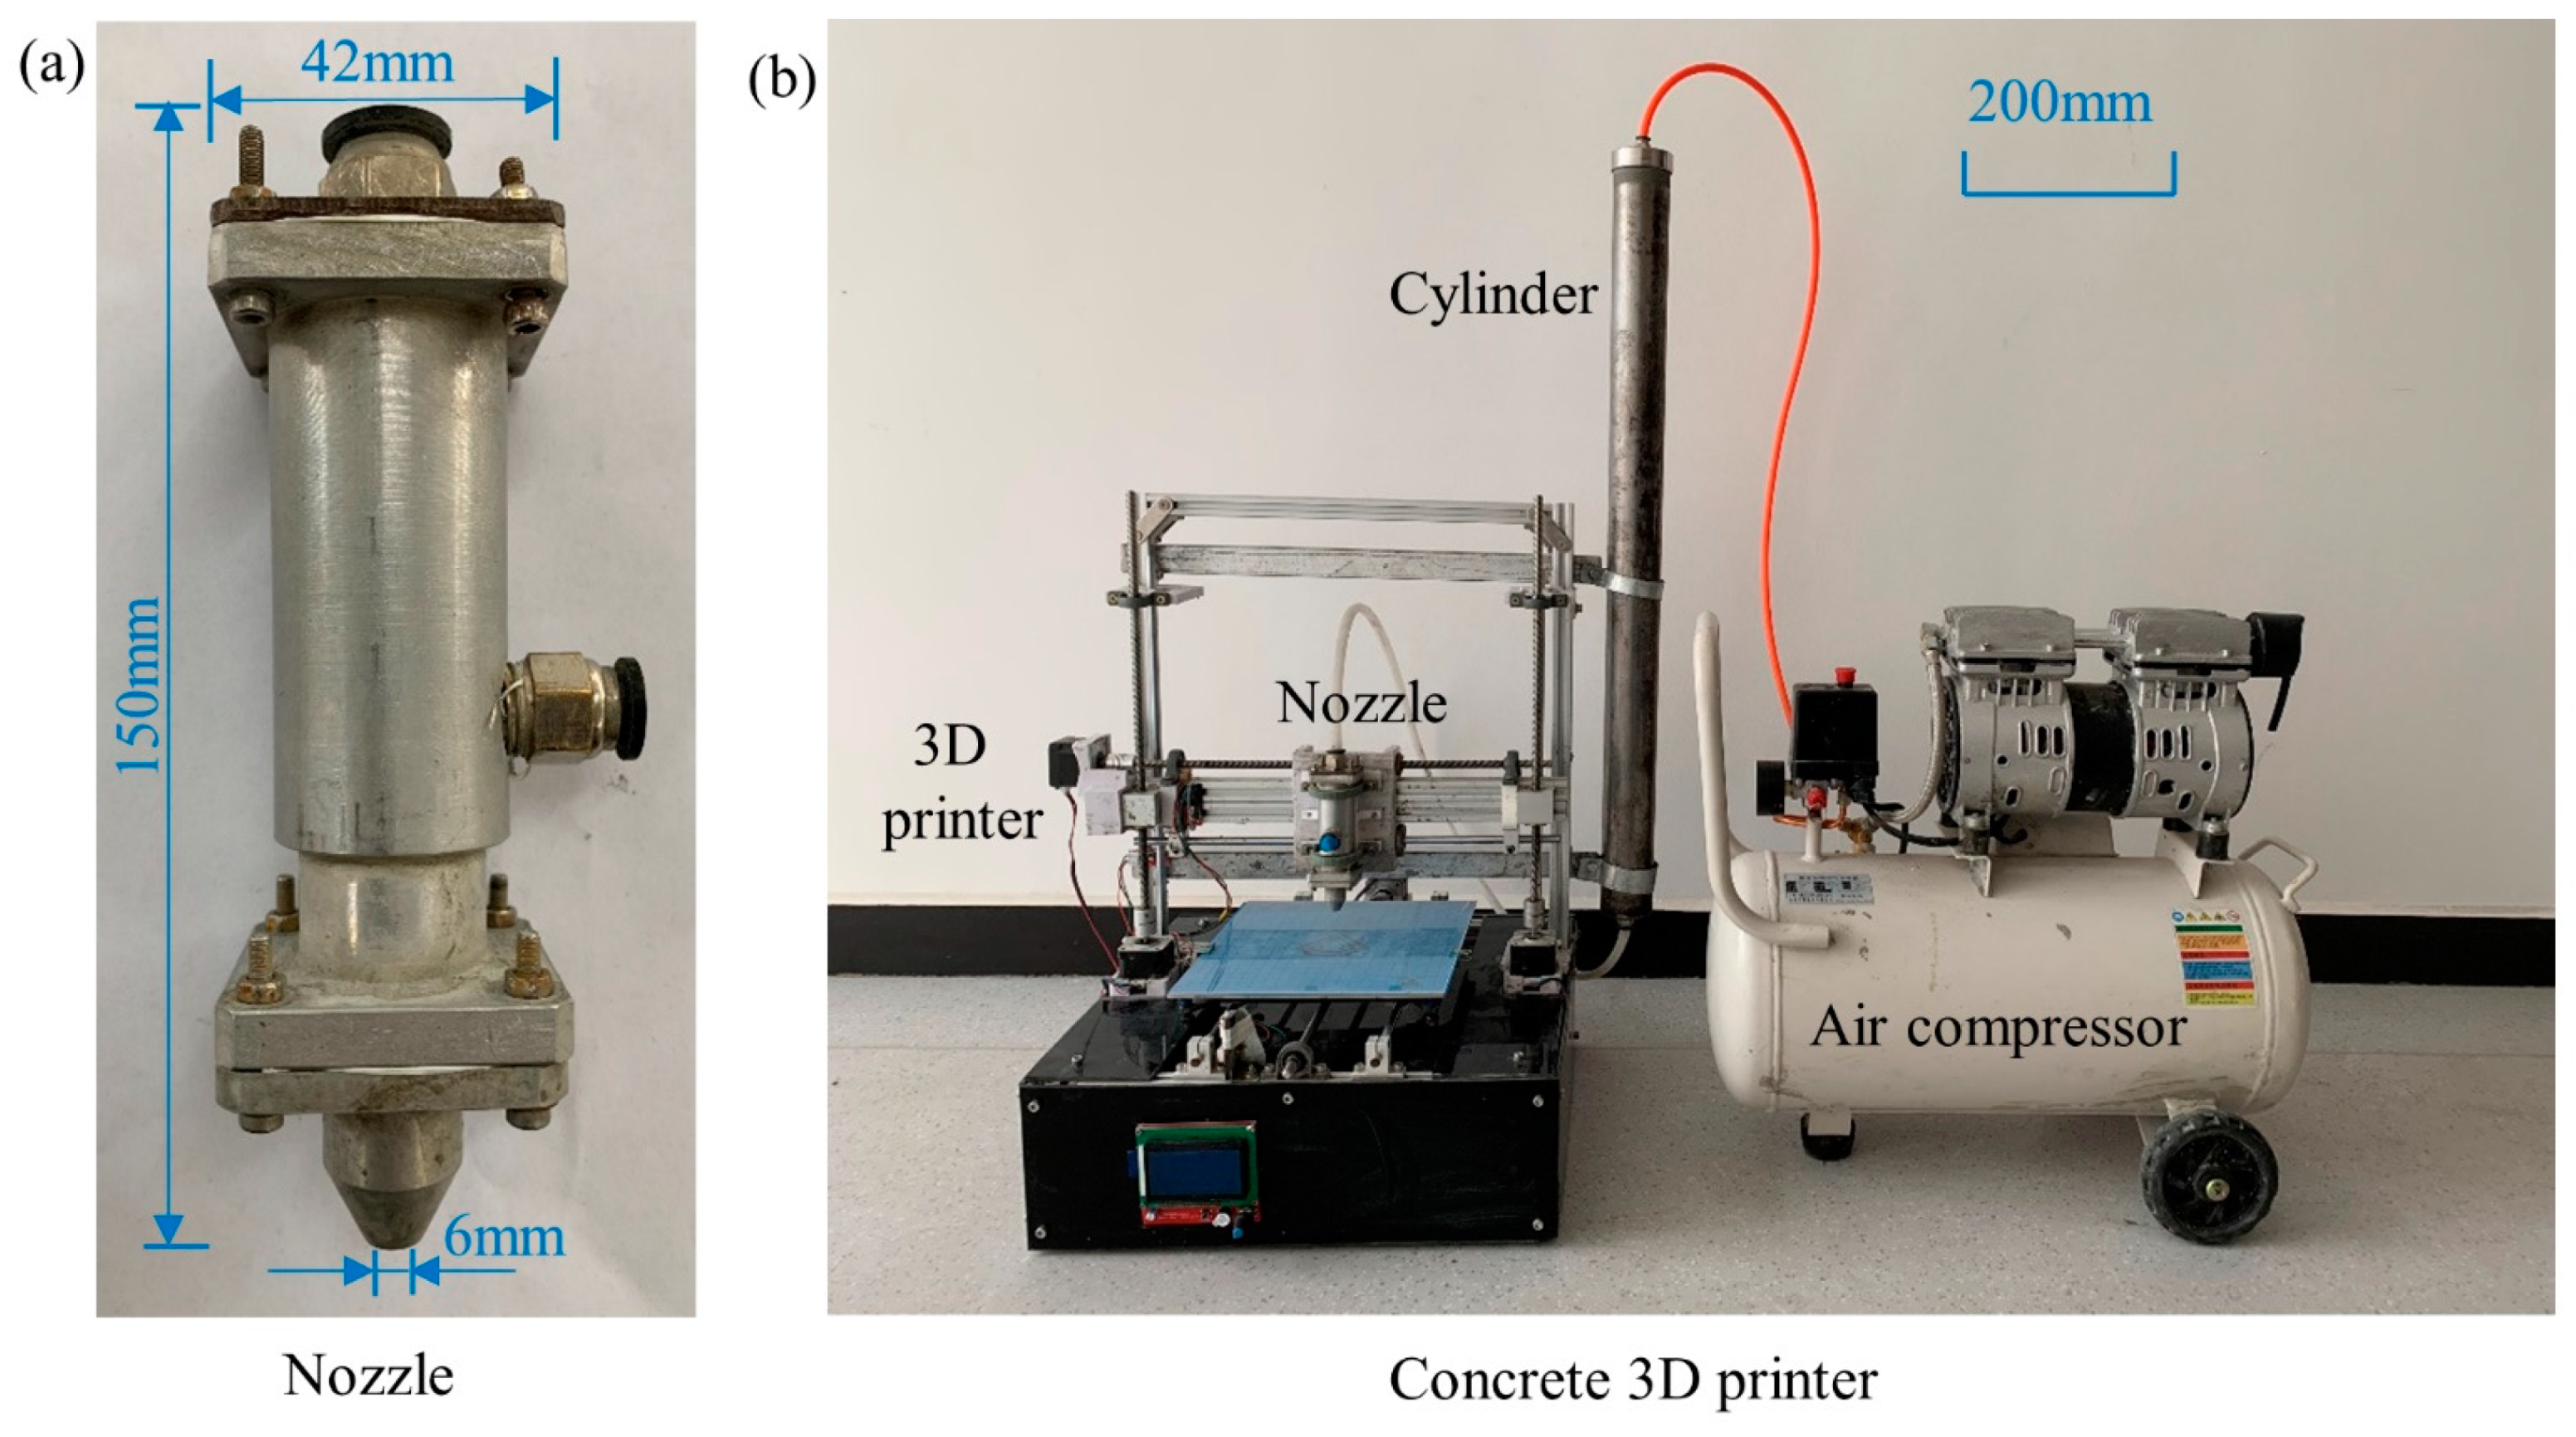
2.2. Desktop 3DPC Printer
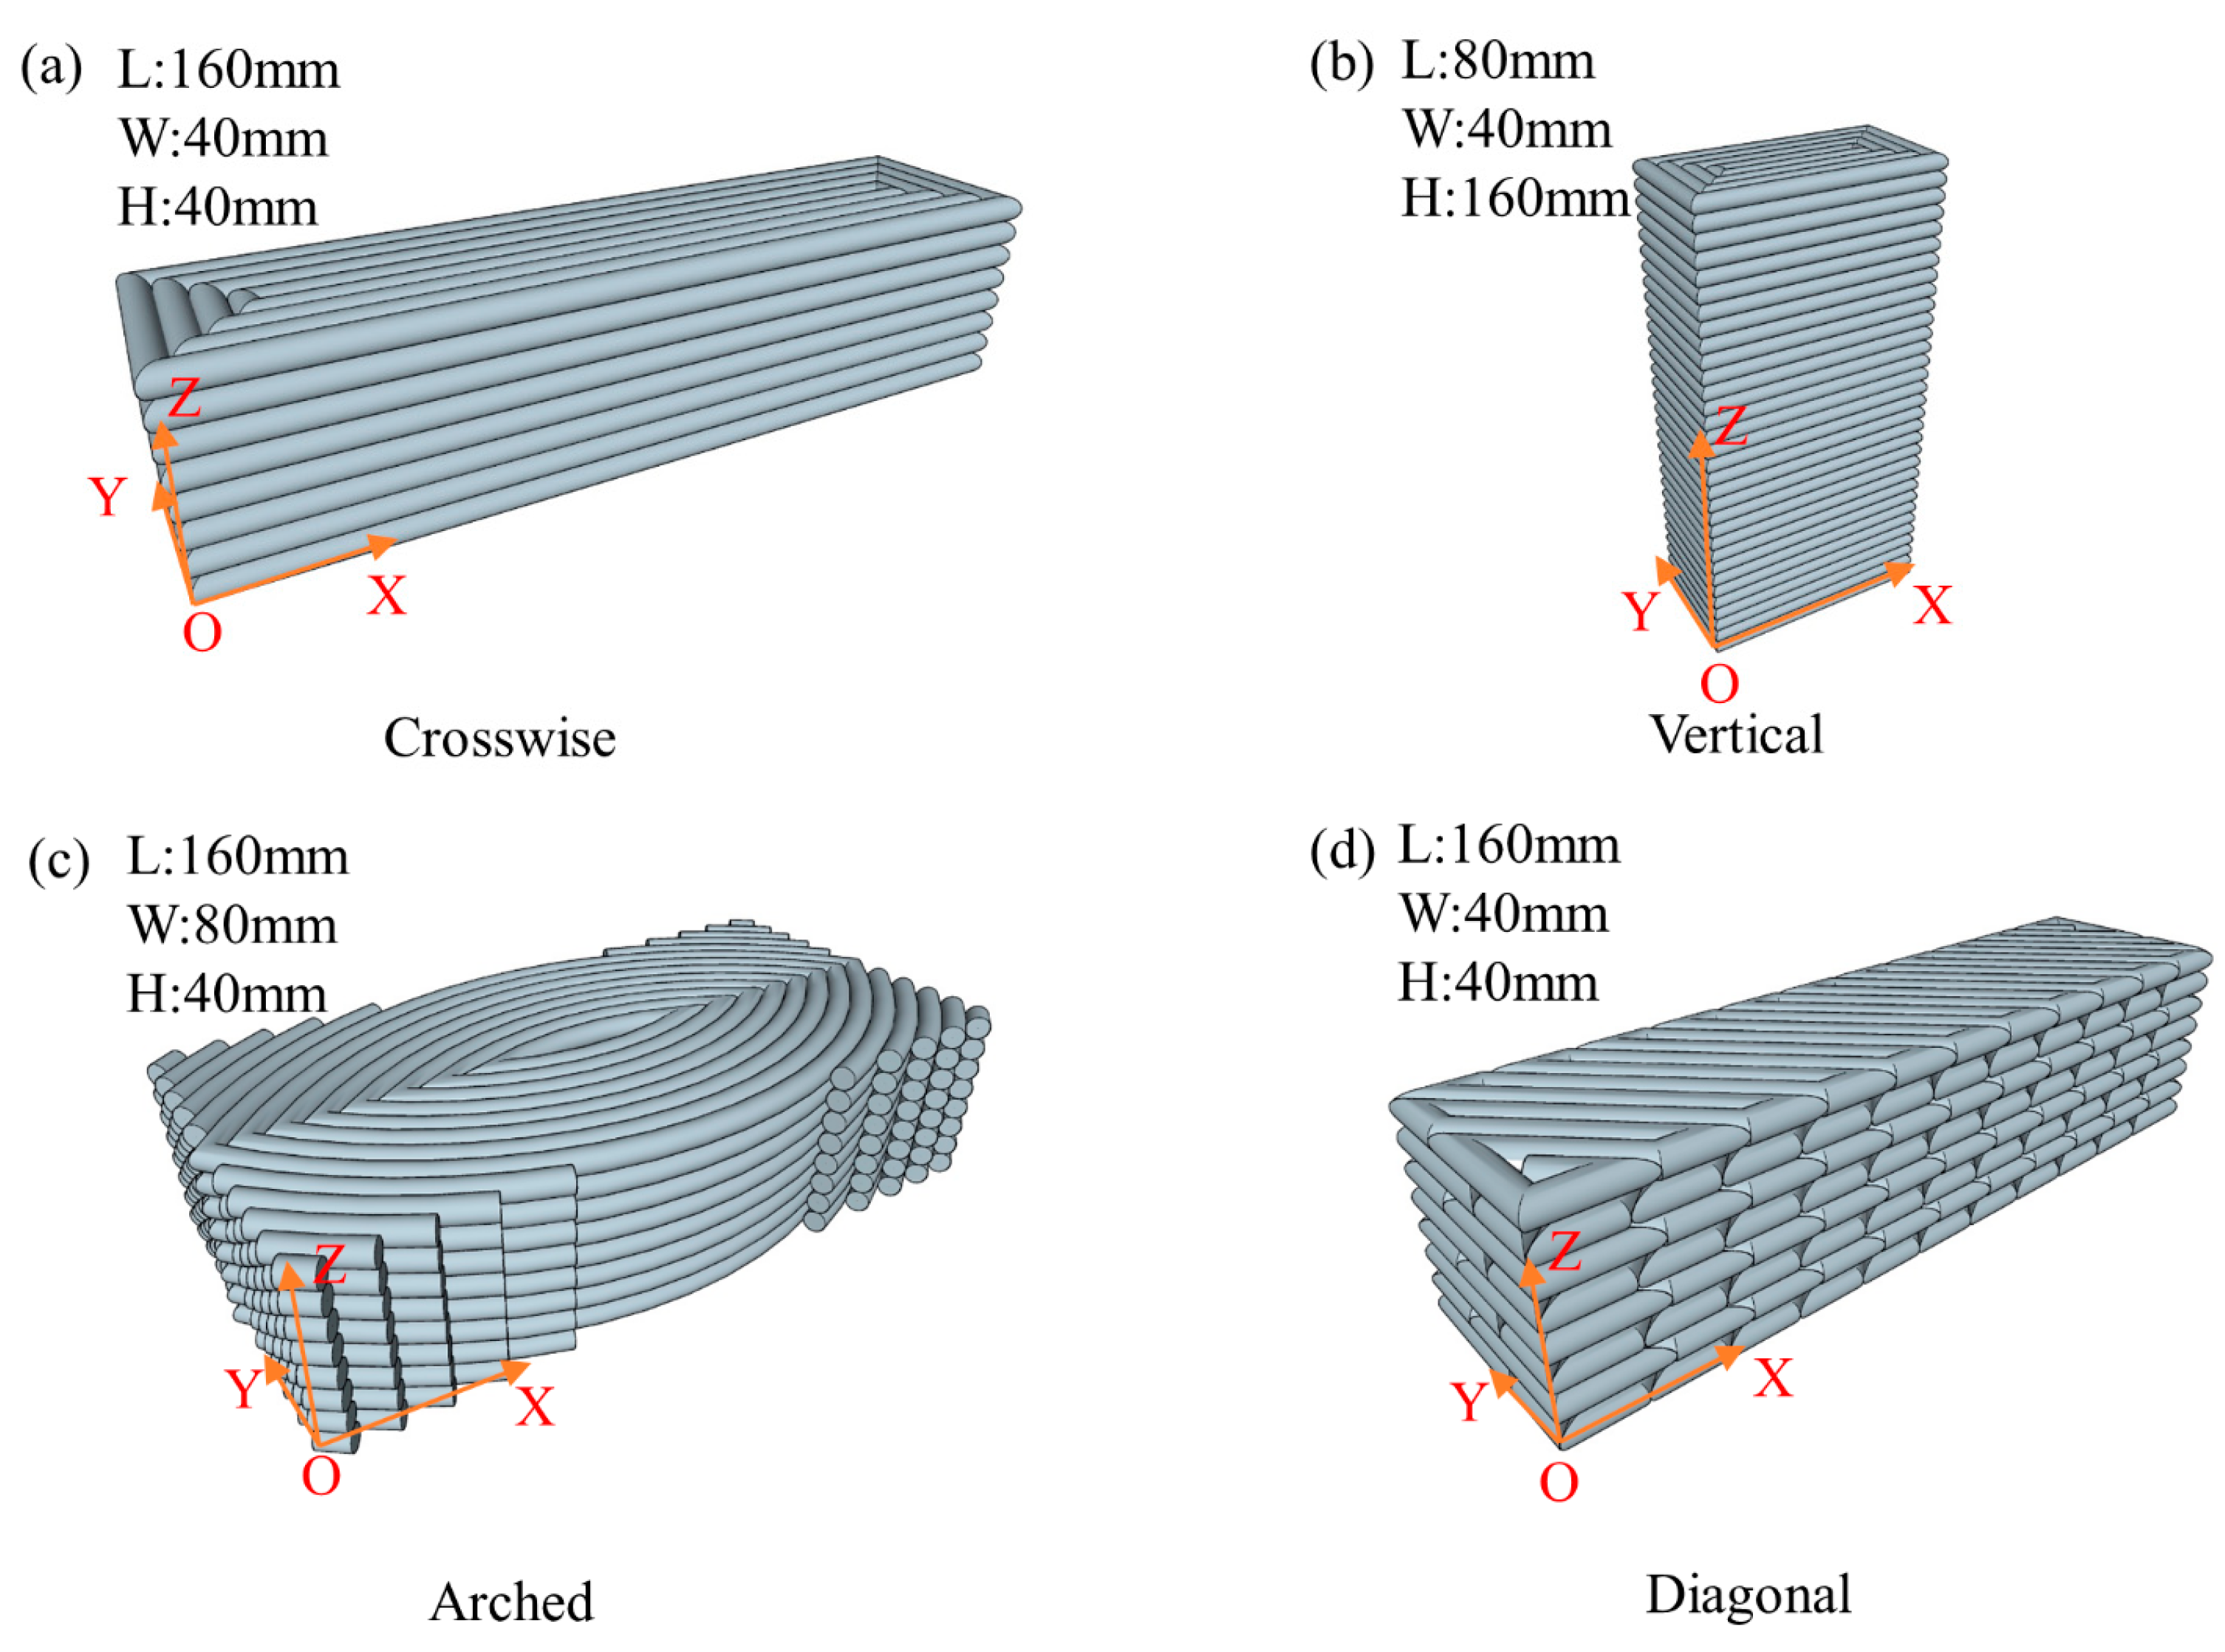
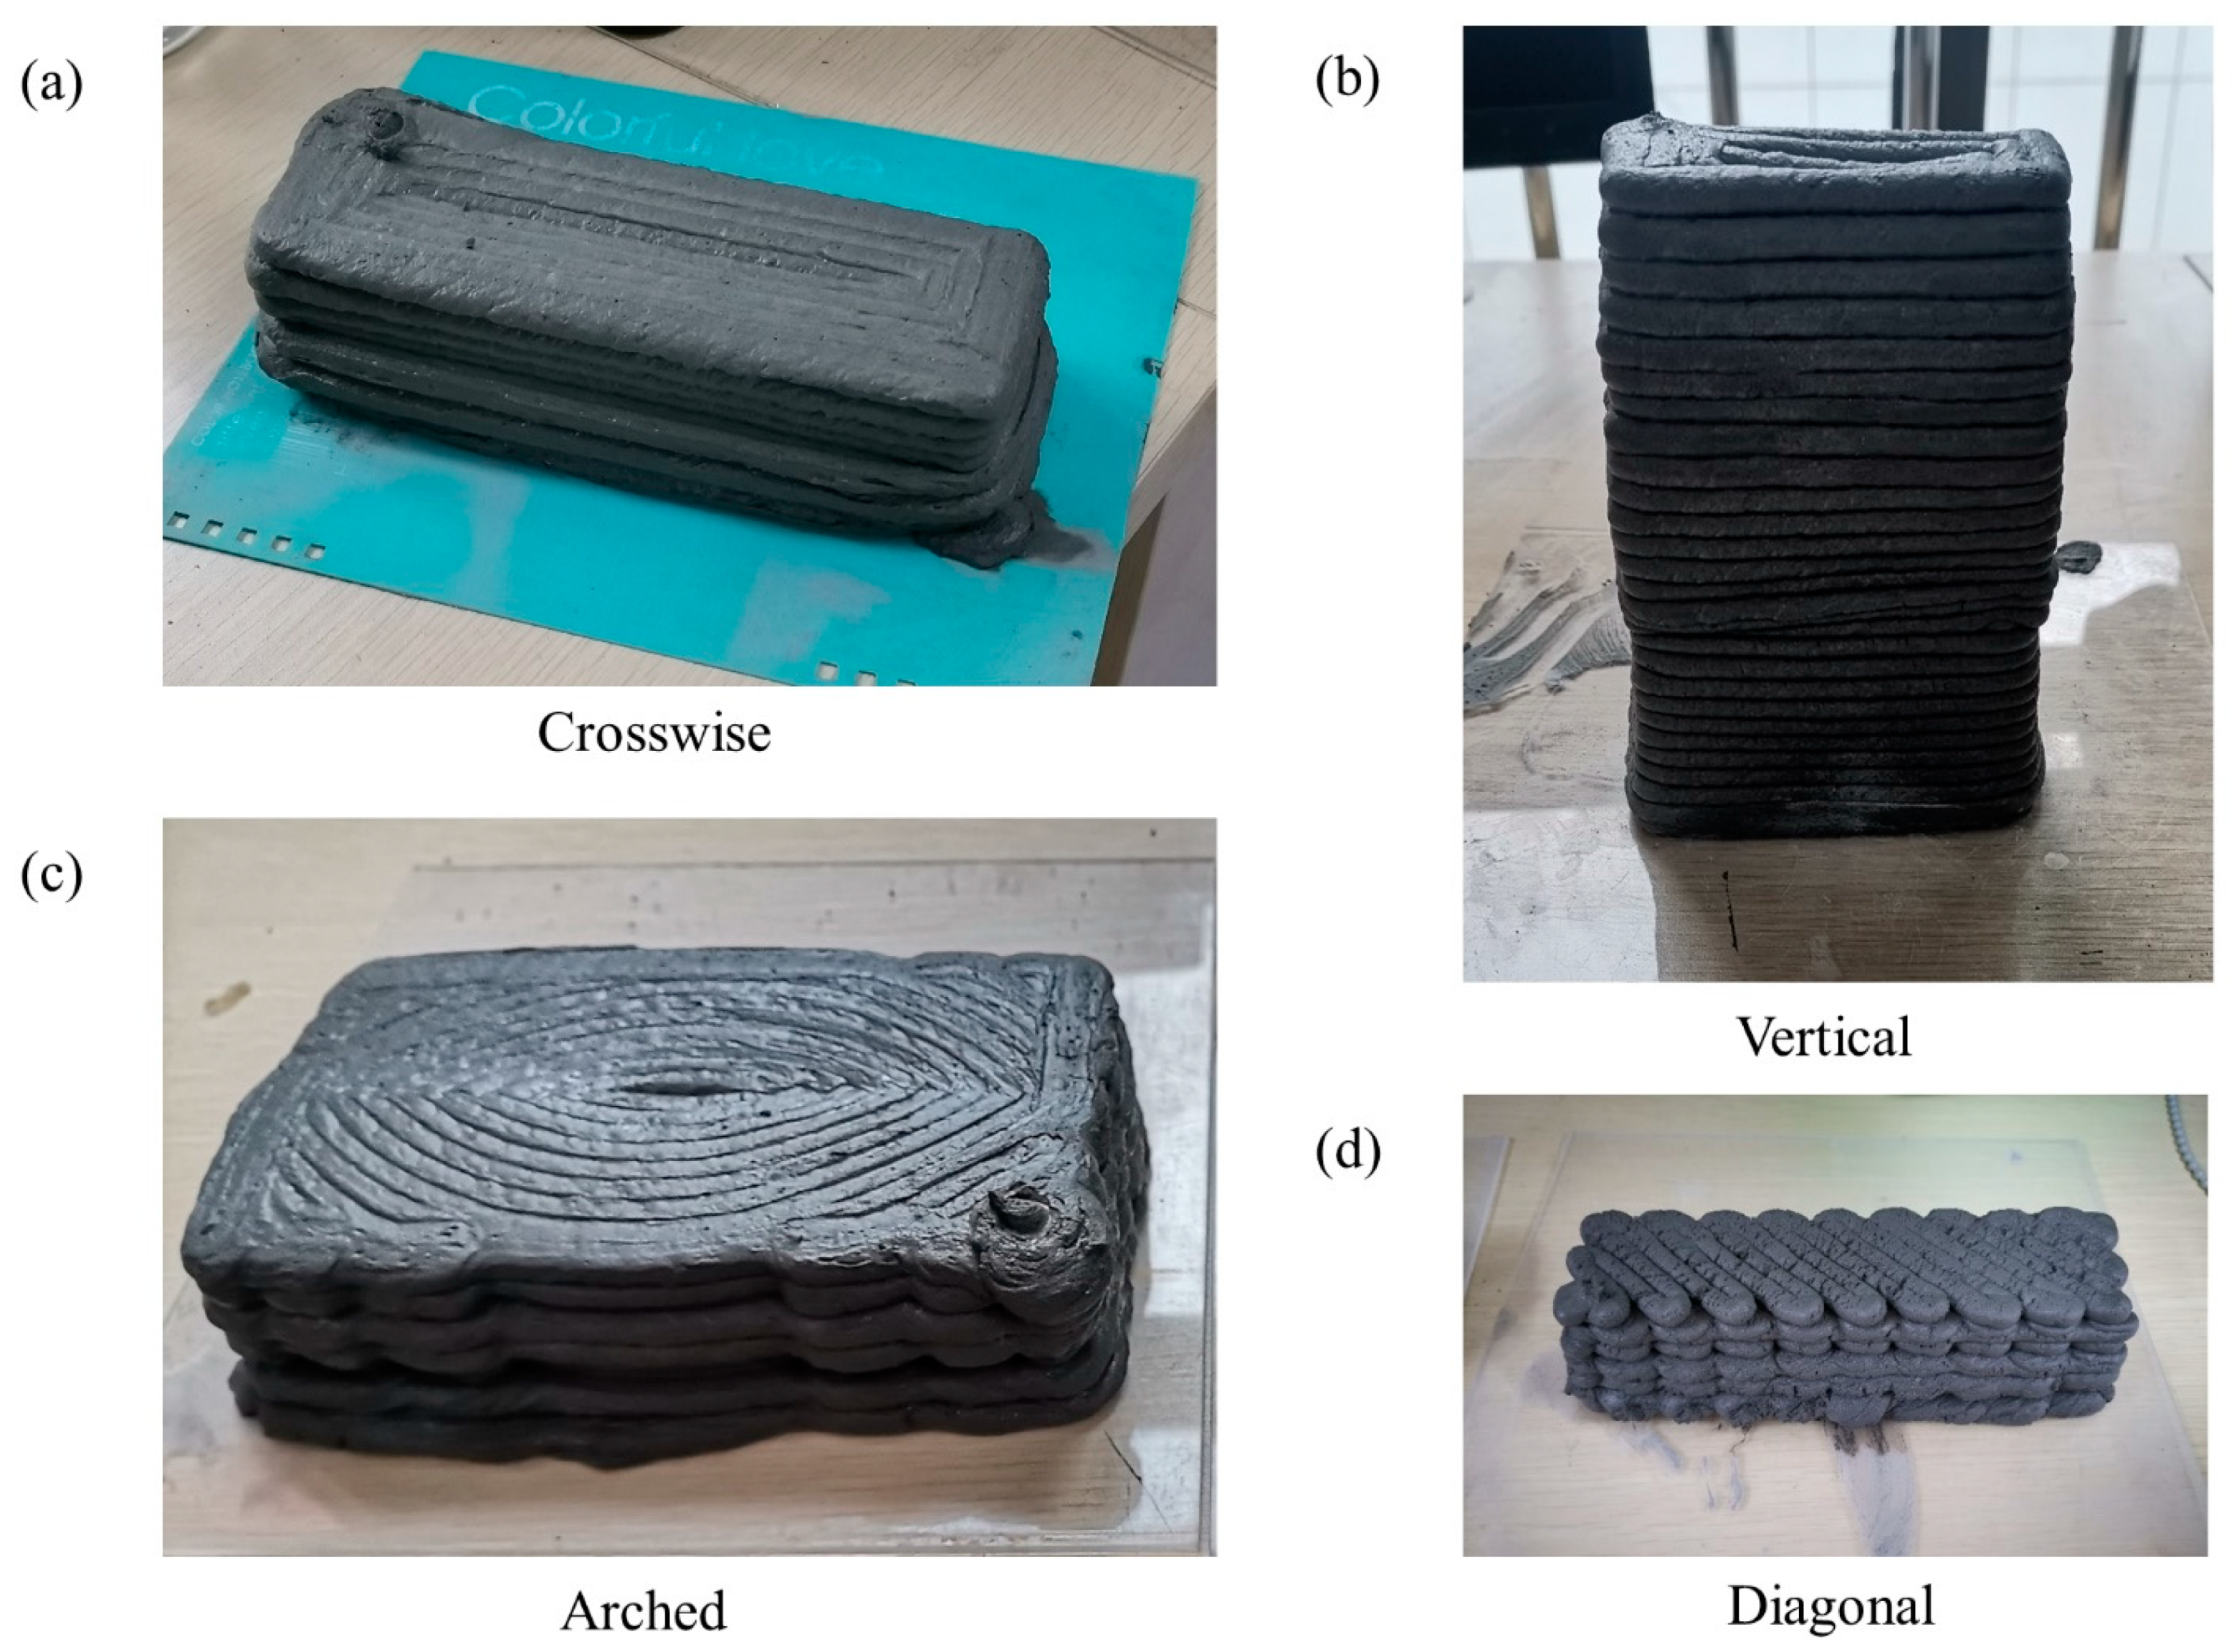
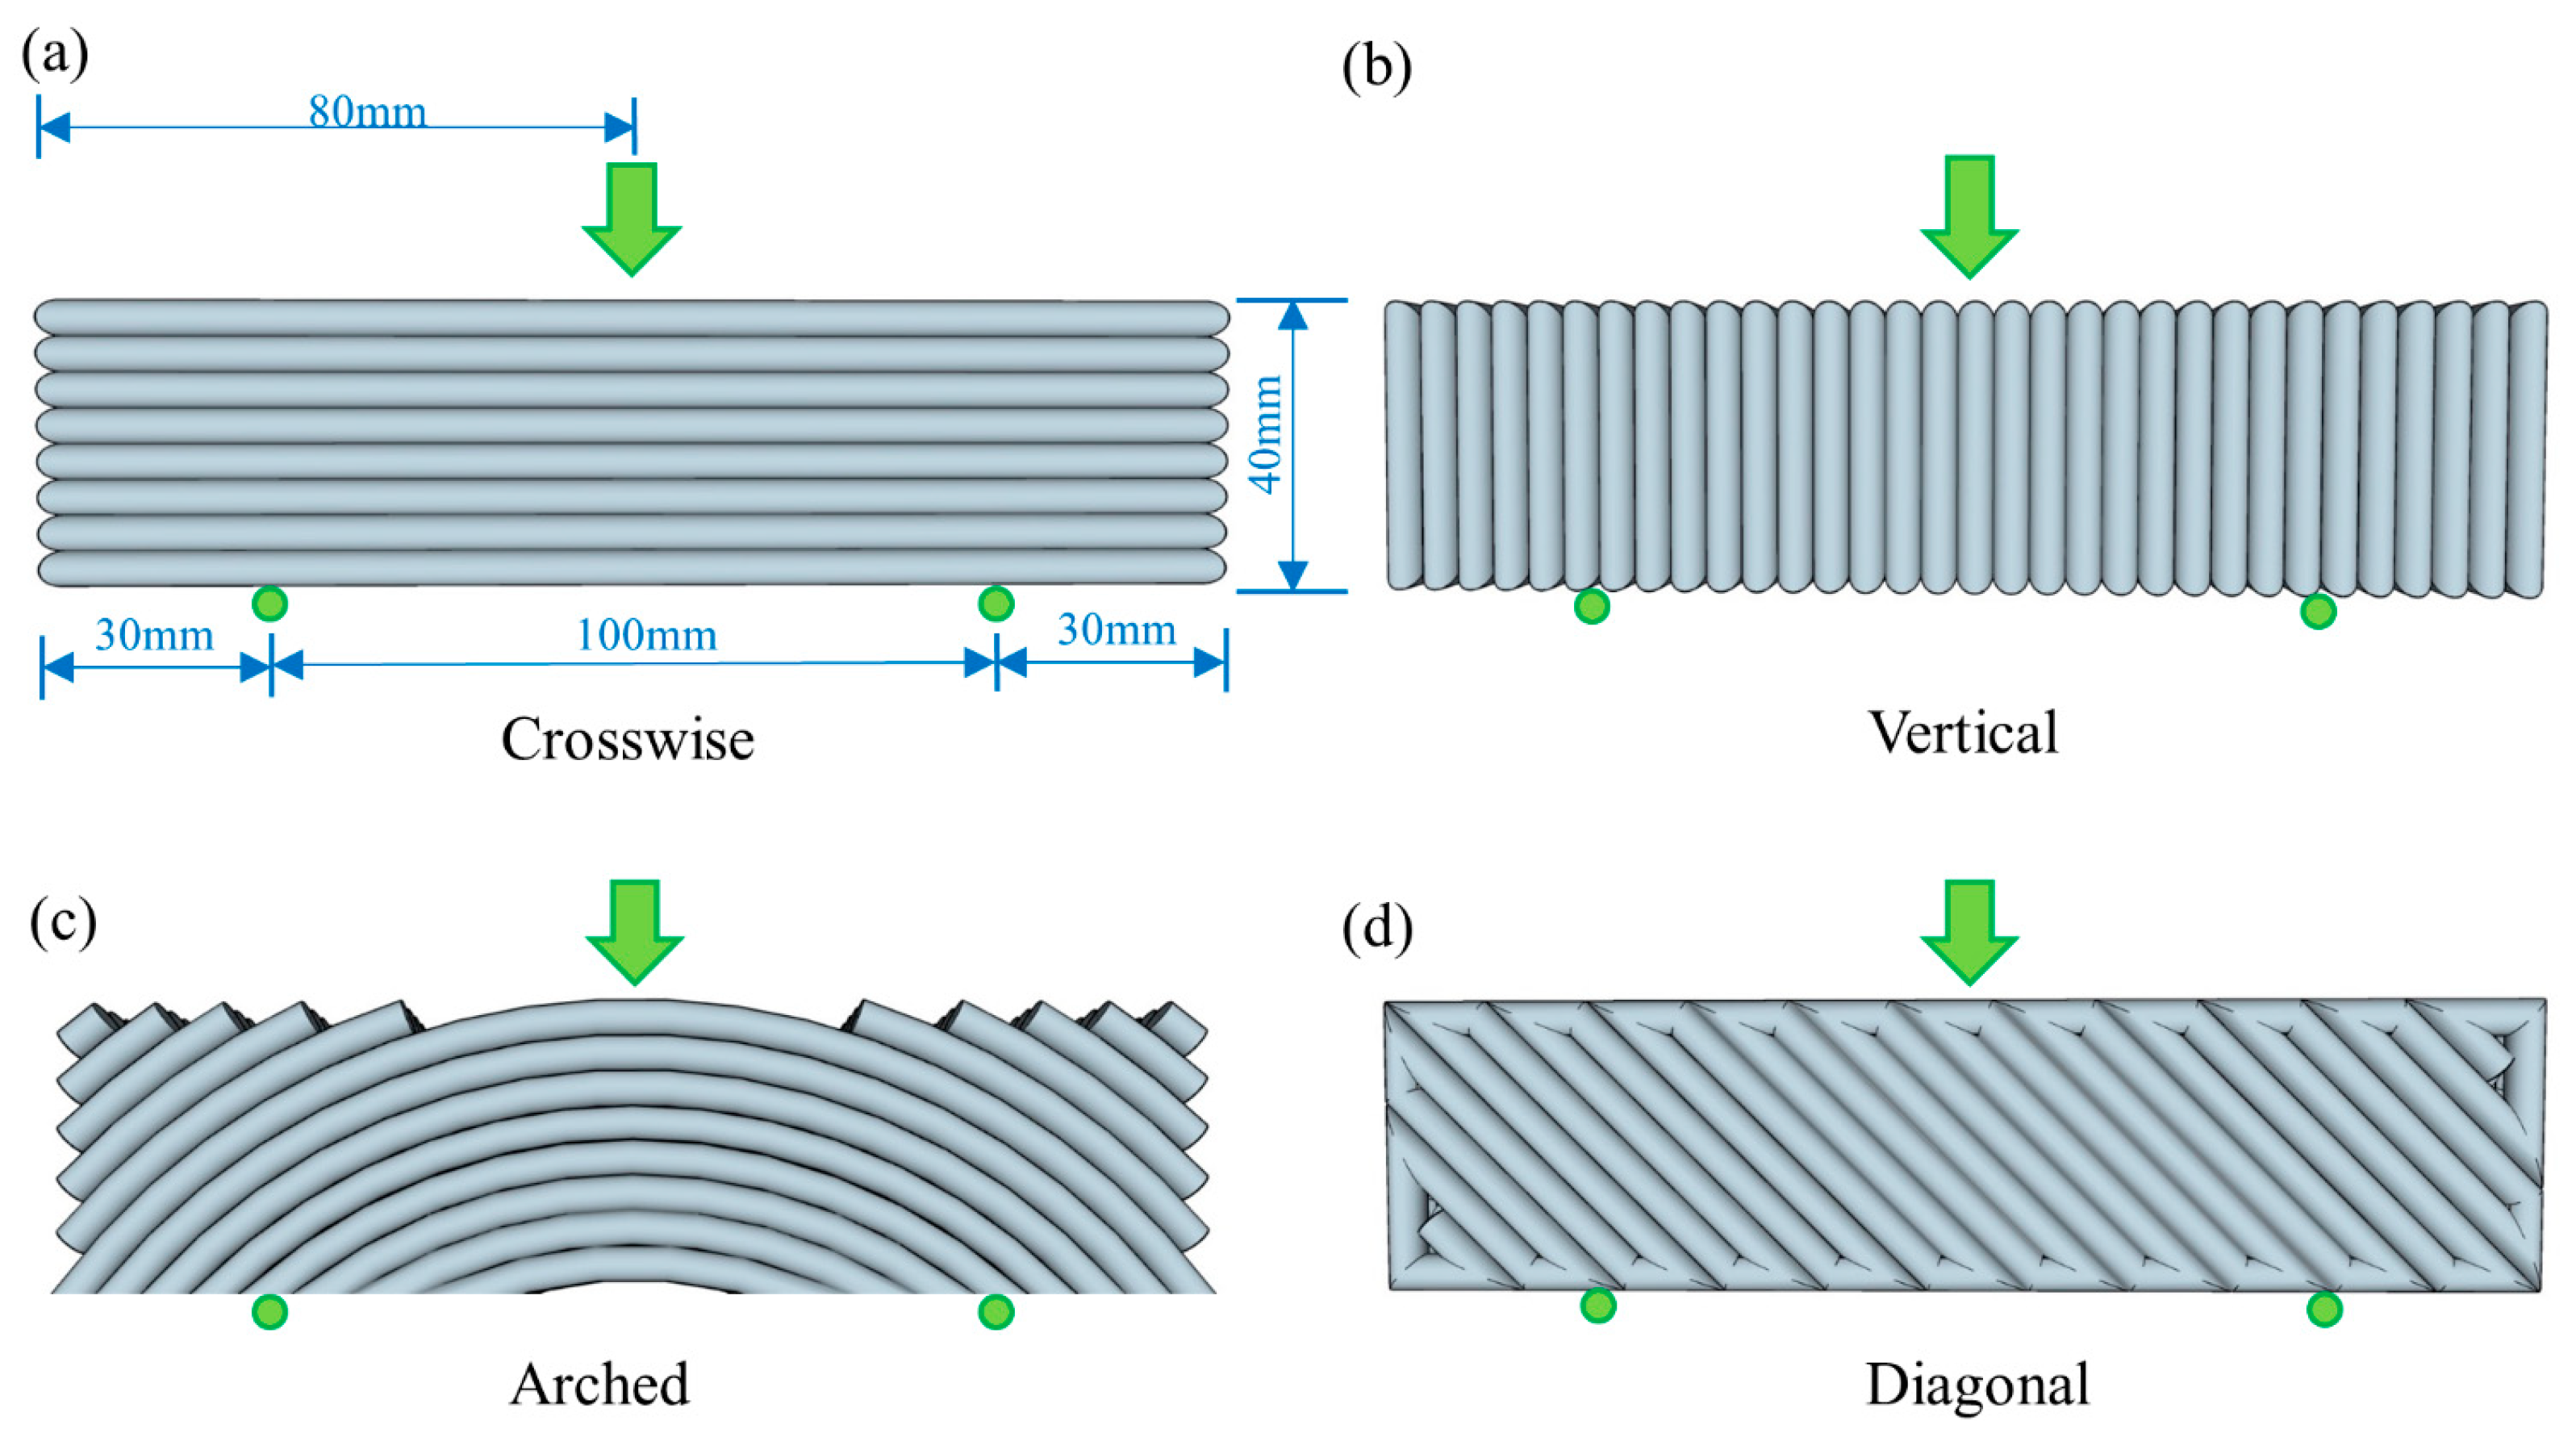
Our adopted concrete specimens were fabricated using a customized extrusion-based 3DPC printer, which consists of a gantry framework, a fluidic concrete delivery system, an extrusion system, the slice software (Ultimaker Cura 5.1.0), and the firmware with a maximum printable size of 200 × 200 × 200 mm3, as shown in Figure 3. The printer’s positioning accuracy is within 1 mm. The extruded fresh concrete layers are stacked into the desired specimens. As time goes by, the bottom fresh layers gradually solidify and become hard to supper the upcoming fresh layers. During the fabrication process, the nozzle moves as the given pathway, simultaneously, extrudes out the fresh concrete. The given pathway is set by the slice software and executed by the firmware.
The fresh fluidic concrete conveying system includes an air compressor, a piston, a pipe, and the material tank of the cylinder, as shown in Figure 3. The fresh fluidic concrete is sealed in the tank with the piston. The air pressure generated by the air compressor pushes the piston to extrude the fresh concrete into the pipe. Under the air pressure of 0.5 MPa, the fresh concrete is extruded out from the nozzle connected to the pipe. During the extrusion process, the moving pattern of the nozzle controls the figure of one layer. The diameter of the nozzle was 6 mm, and the thickness of the layer was set to 5 mm. The moving speed of the print nozzle was set to 15 mm/s. The printing process was controlled by the firmware. The 3D model of the specimens can be read by the slice software.
Four different printing paths of the specimens were fabricated: crosswise, vertical, arched, and diagonal. According to ASTM C39/C39M, the size of the specimens was set to 40 mm × 40 mm × 160 mm, as shown in Figure 4.

2.3. Fabrication

Fabrication of the specimens included four stages: fresh concrete, printing, hydration, and maintenance. Fresh concrete was made by blending cement, fly ash, silica fume, water, water reducer, and SDSC according to the mix ratio in Table 1 and stirring them. Then, the fresh concrete was sealed into the tank. Under air pressure, it was compressed into the nozzle and extruded. The extruded filaments were pasted into layers. Multiple layers construct the united specimen. When the upper layers are being extruded, the bottom older printing layers begin hydrating and hardening. Finally, the specimens with four different paths, as shown in Figure 5, were maintained at 20 °C in water for 28 days.

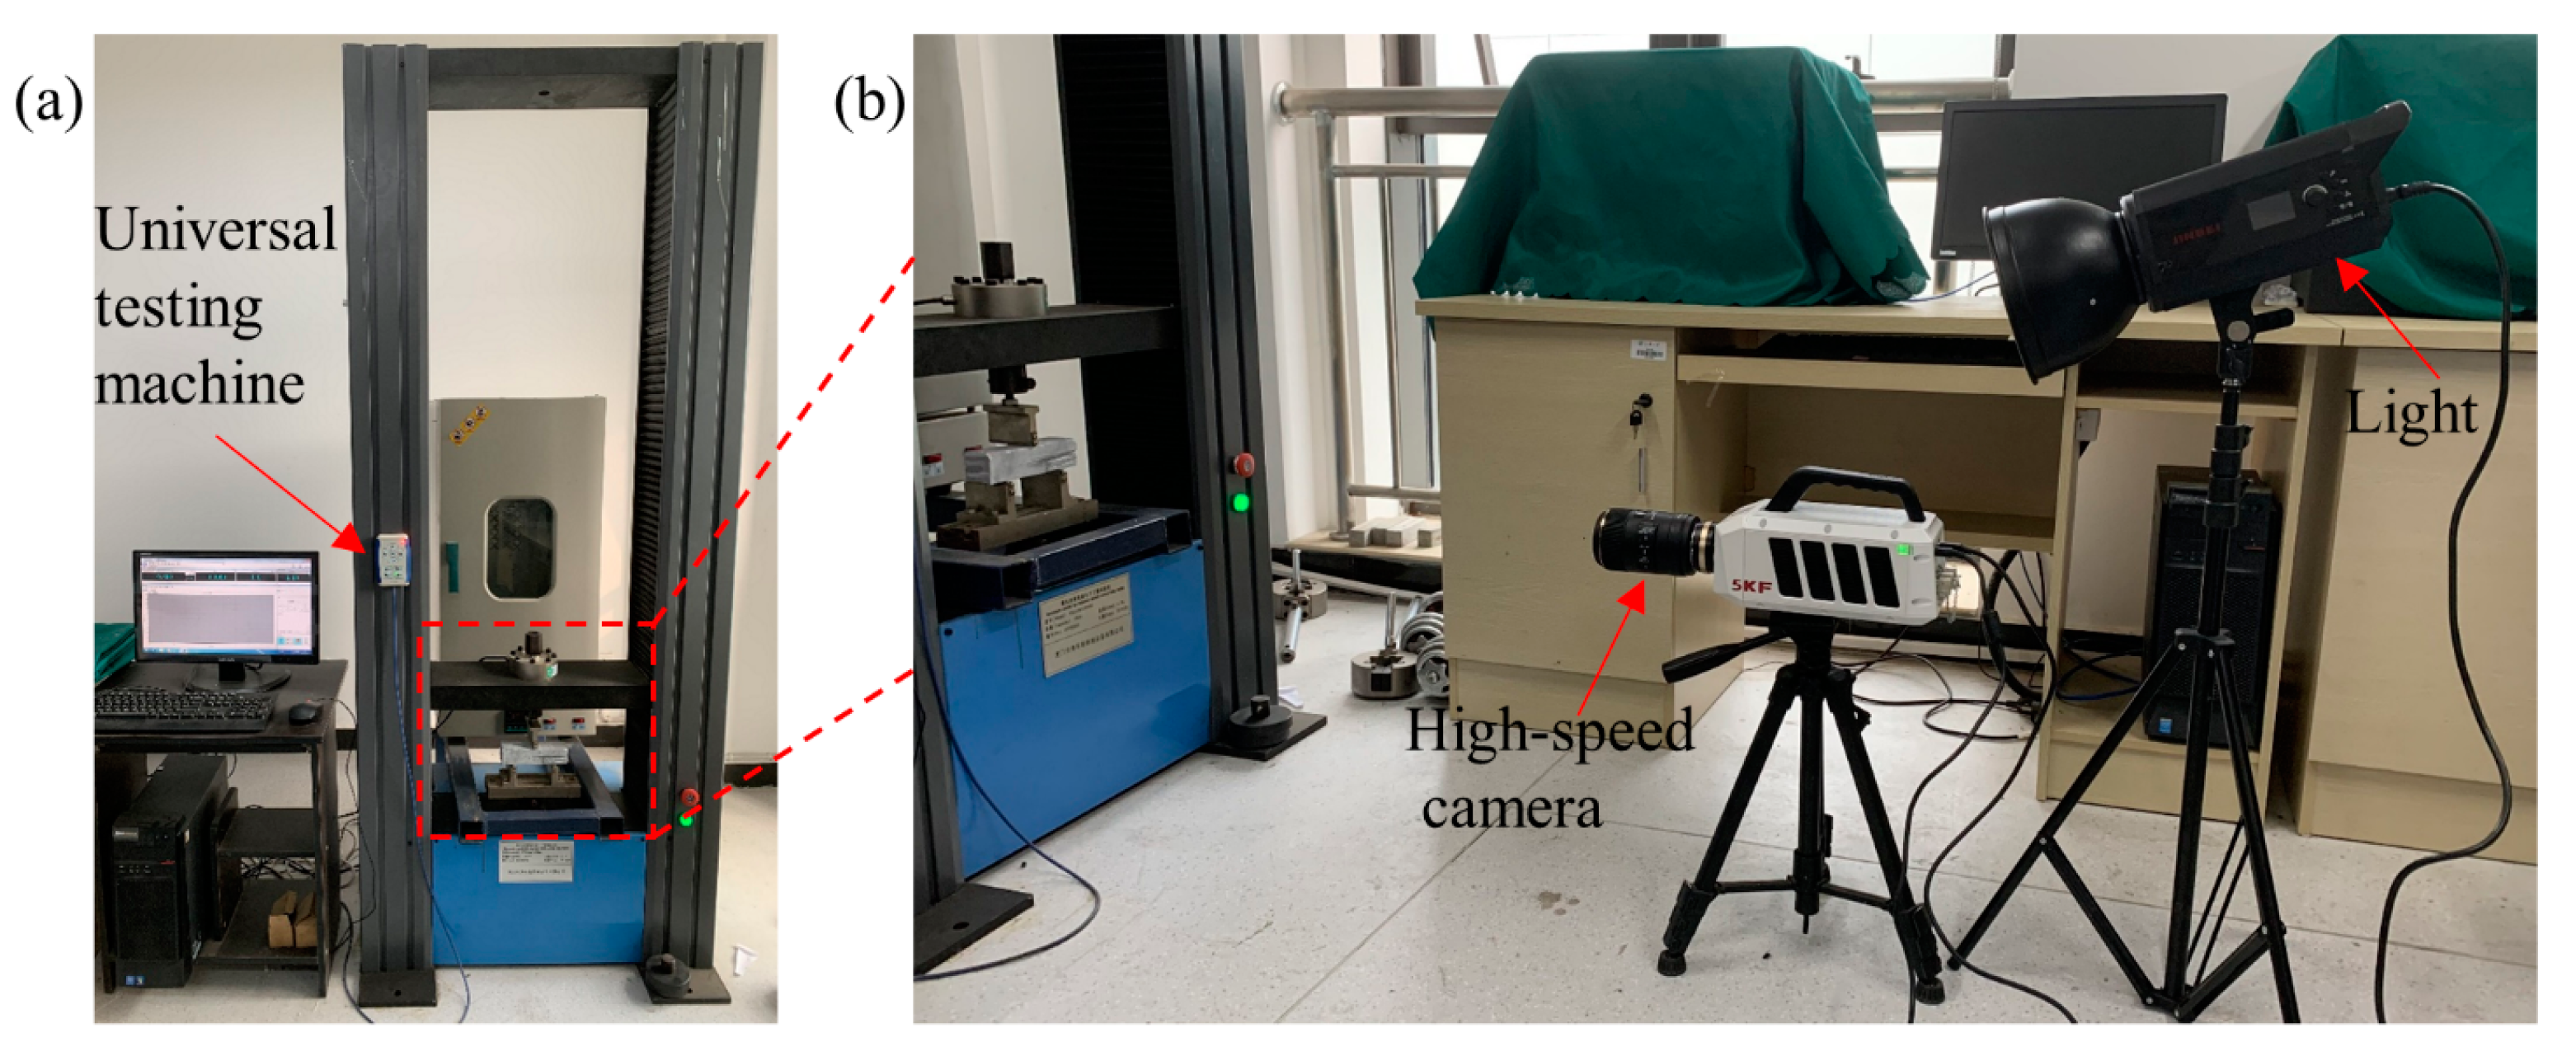
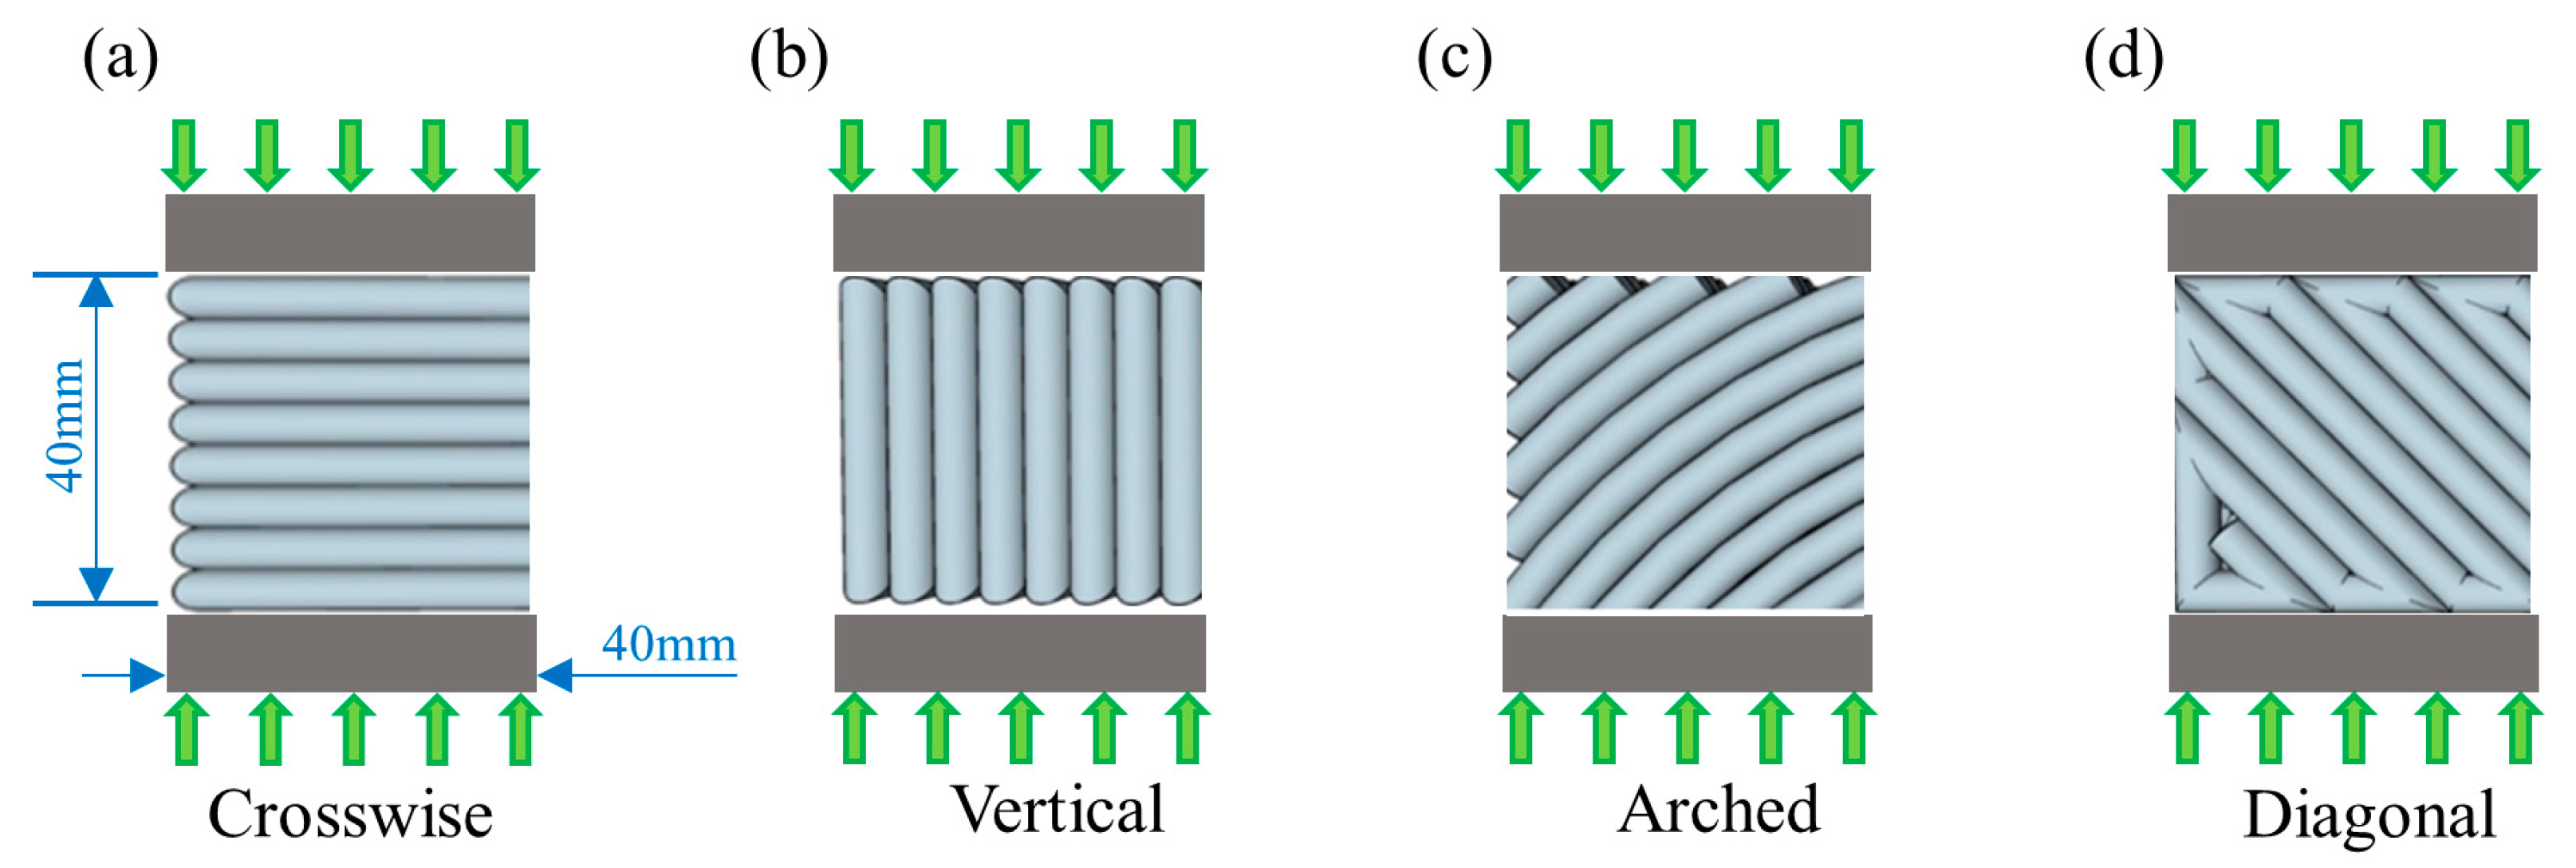
2.4. Testing Methods

Flexural and compressive tests were conducted according to ASTM C39/C39M. The concrete flexural test was performed using a universal mechanical testing machine. As shown in Figure 6, the loading patterns indicate that the crosswise specimen has filament tension, the vertical specimen has interlayer tension, the arched specimen has filament compression, and the diagonal specimen indicates a hybrid state. During the flexural test, a high-speed camera and DIC analysis were used to capture the fracture process, as shown in Figure 7.
The loading speed was set to 5 mm/s, and the capturing frequency of the camera was 50 images per second.
After the concrete flexural test, each specimen was broken into two pieces to be used for the following concrete compressive test. The schematic diagram of the compression test loading is shown in Figure 8. Each piece was placed into a 40 mm × 40 mm fixture for the compressive test to be crushed, and the relevant data of the compressive strength of each one were saved.

3. Results and Discussion

In order to expose the underlying mechanisms of the strength enhancement of printing path optimization, flexural and compressive tests were conducted. During the tests, the progressive fracture processes were captured to calculate fracture toughness. Also, microstructural tests were carried out to prove the experimental results.

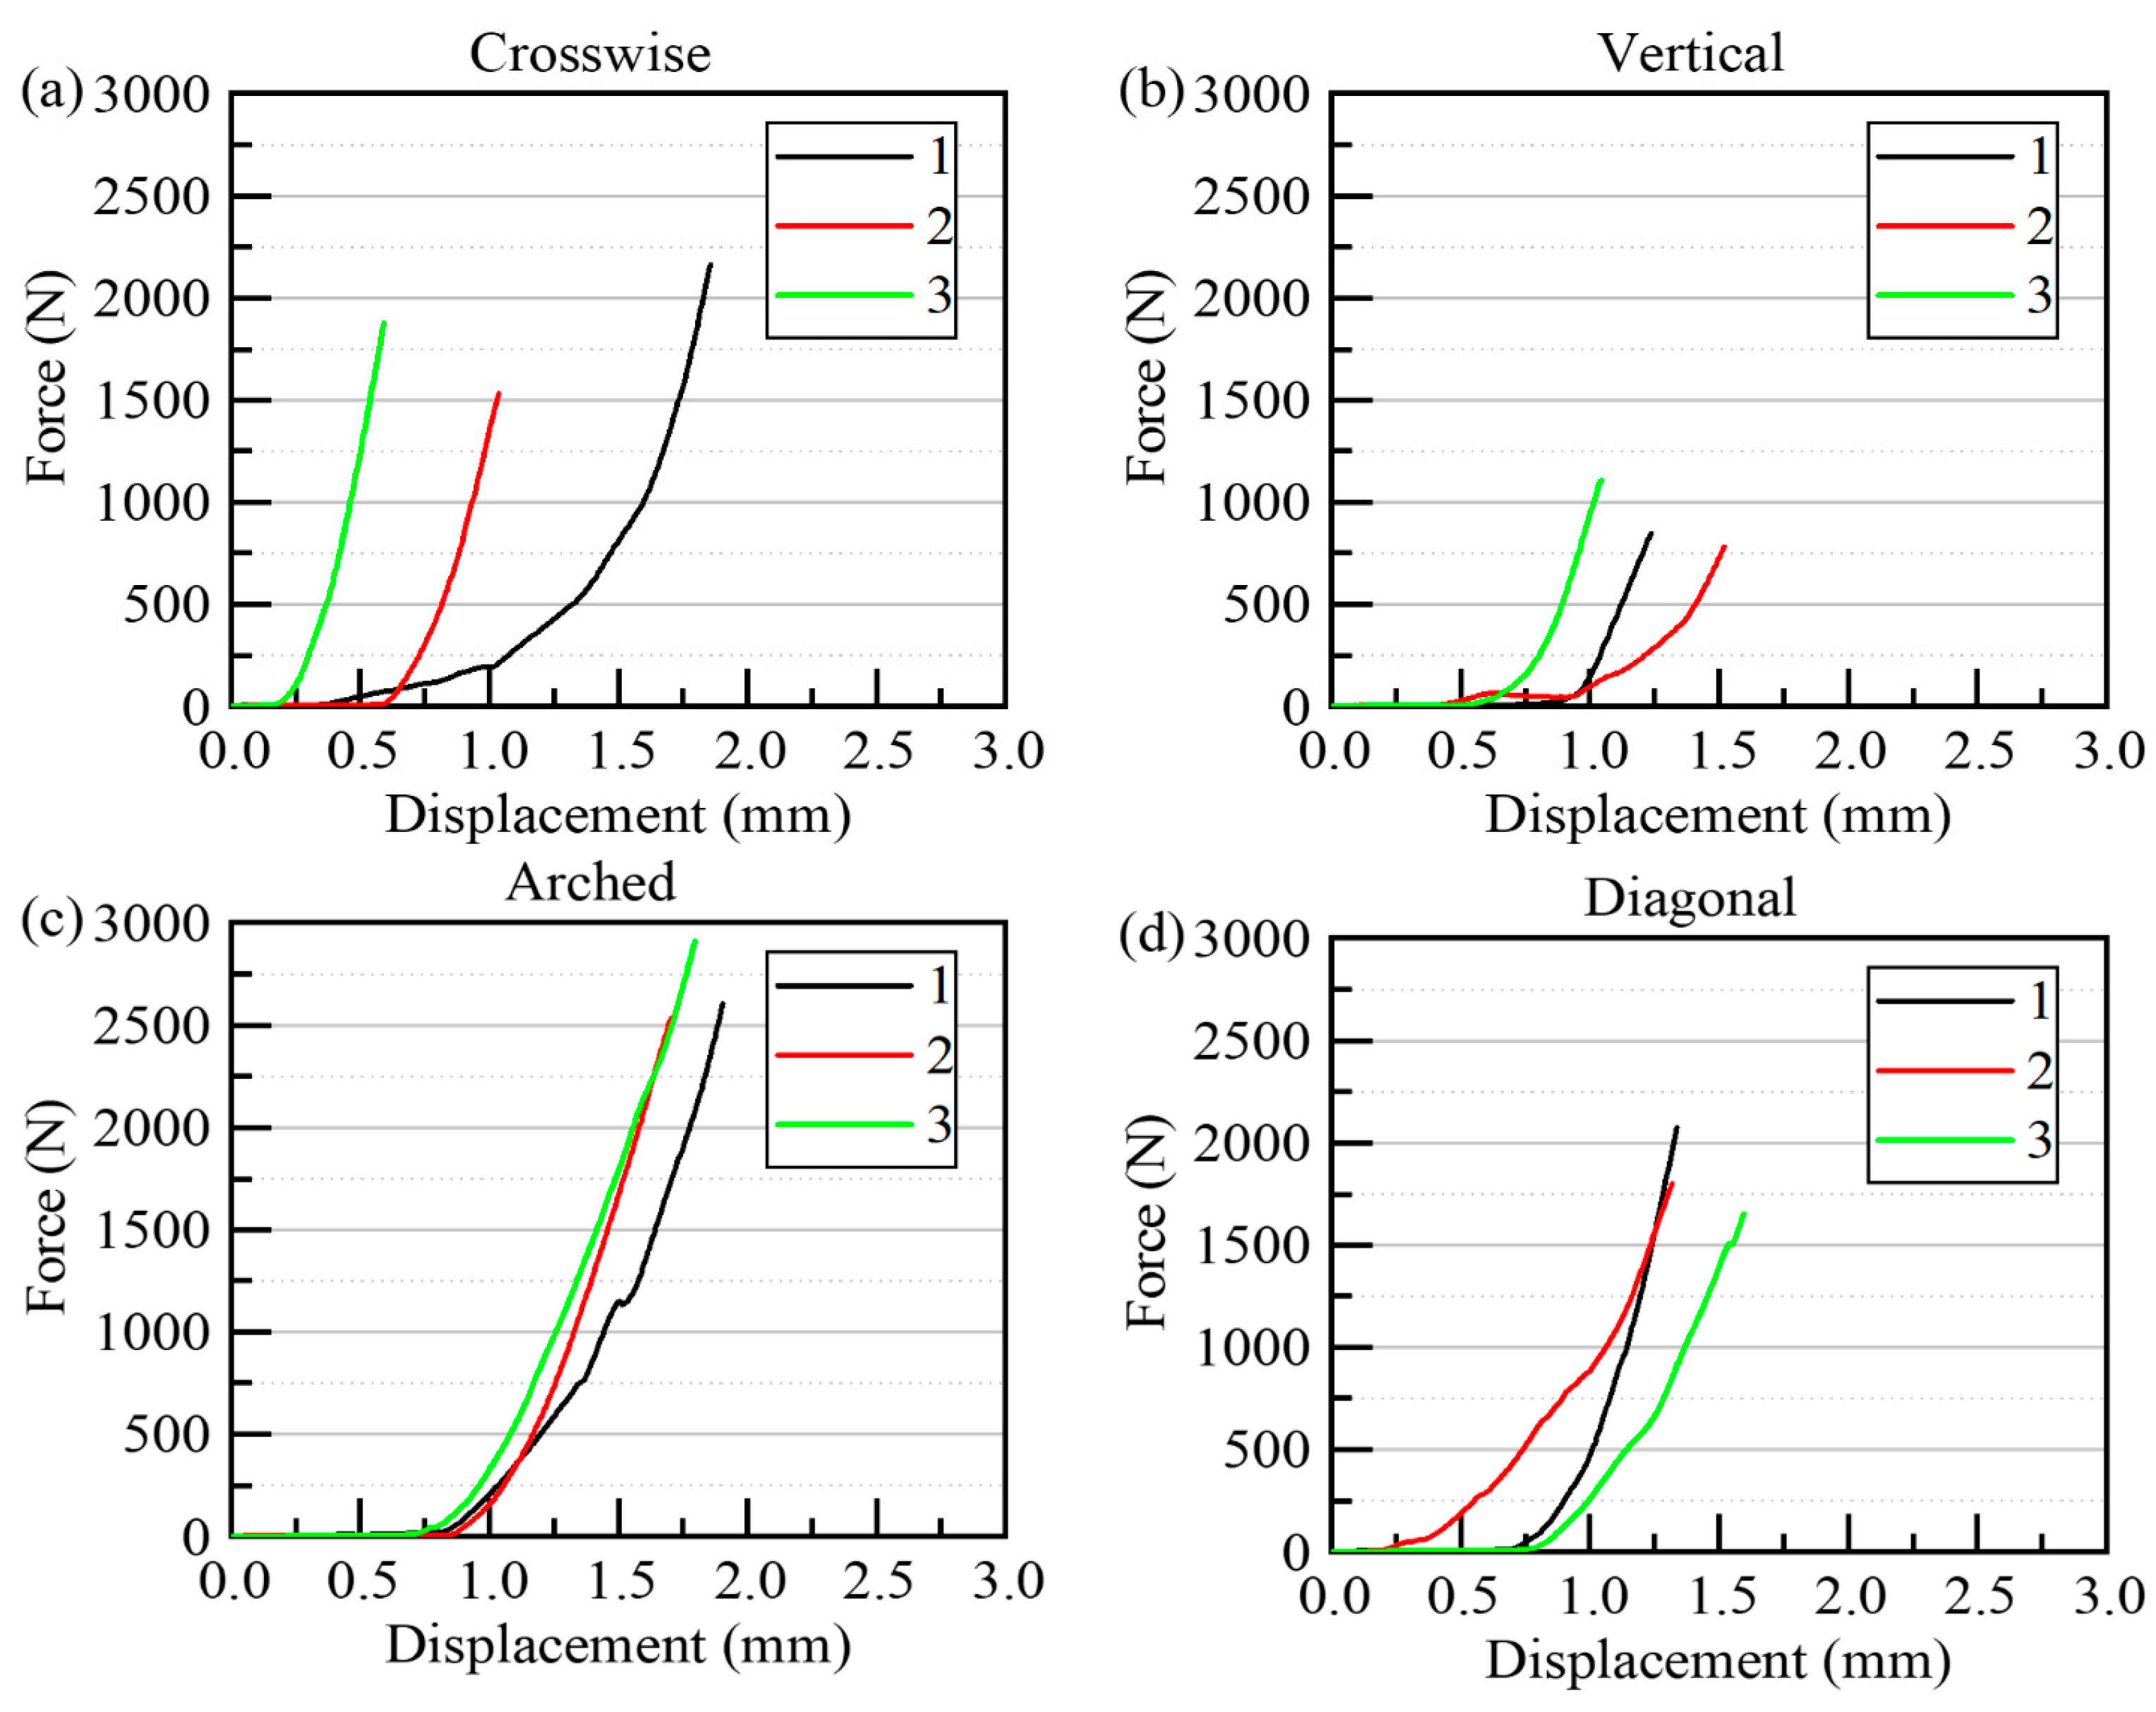
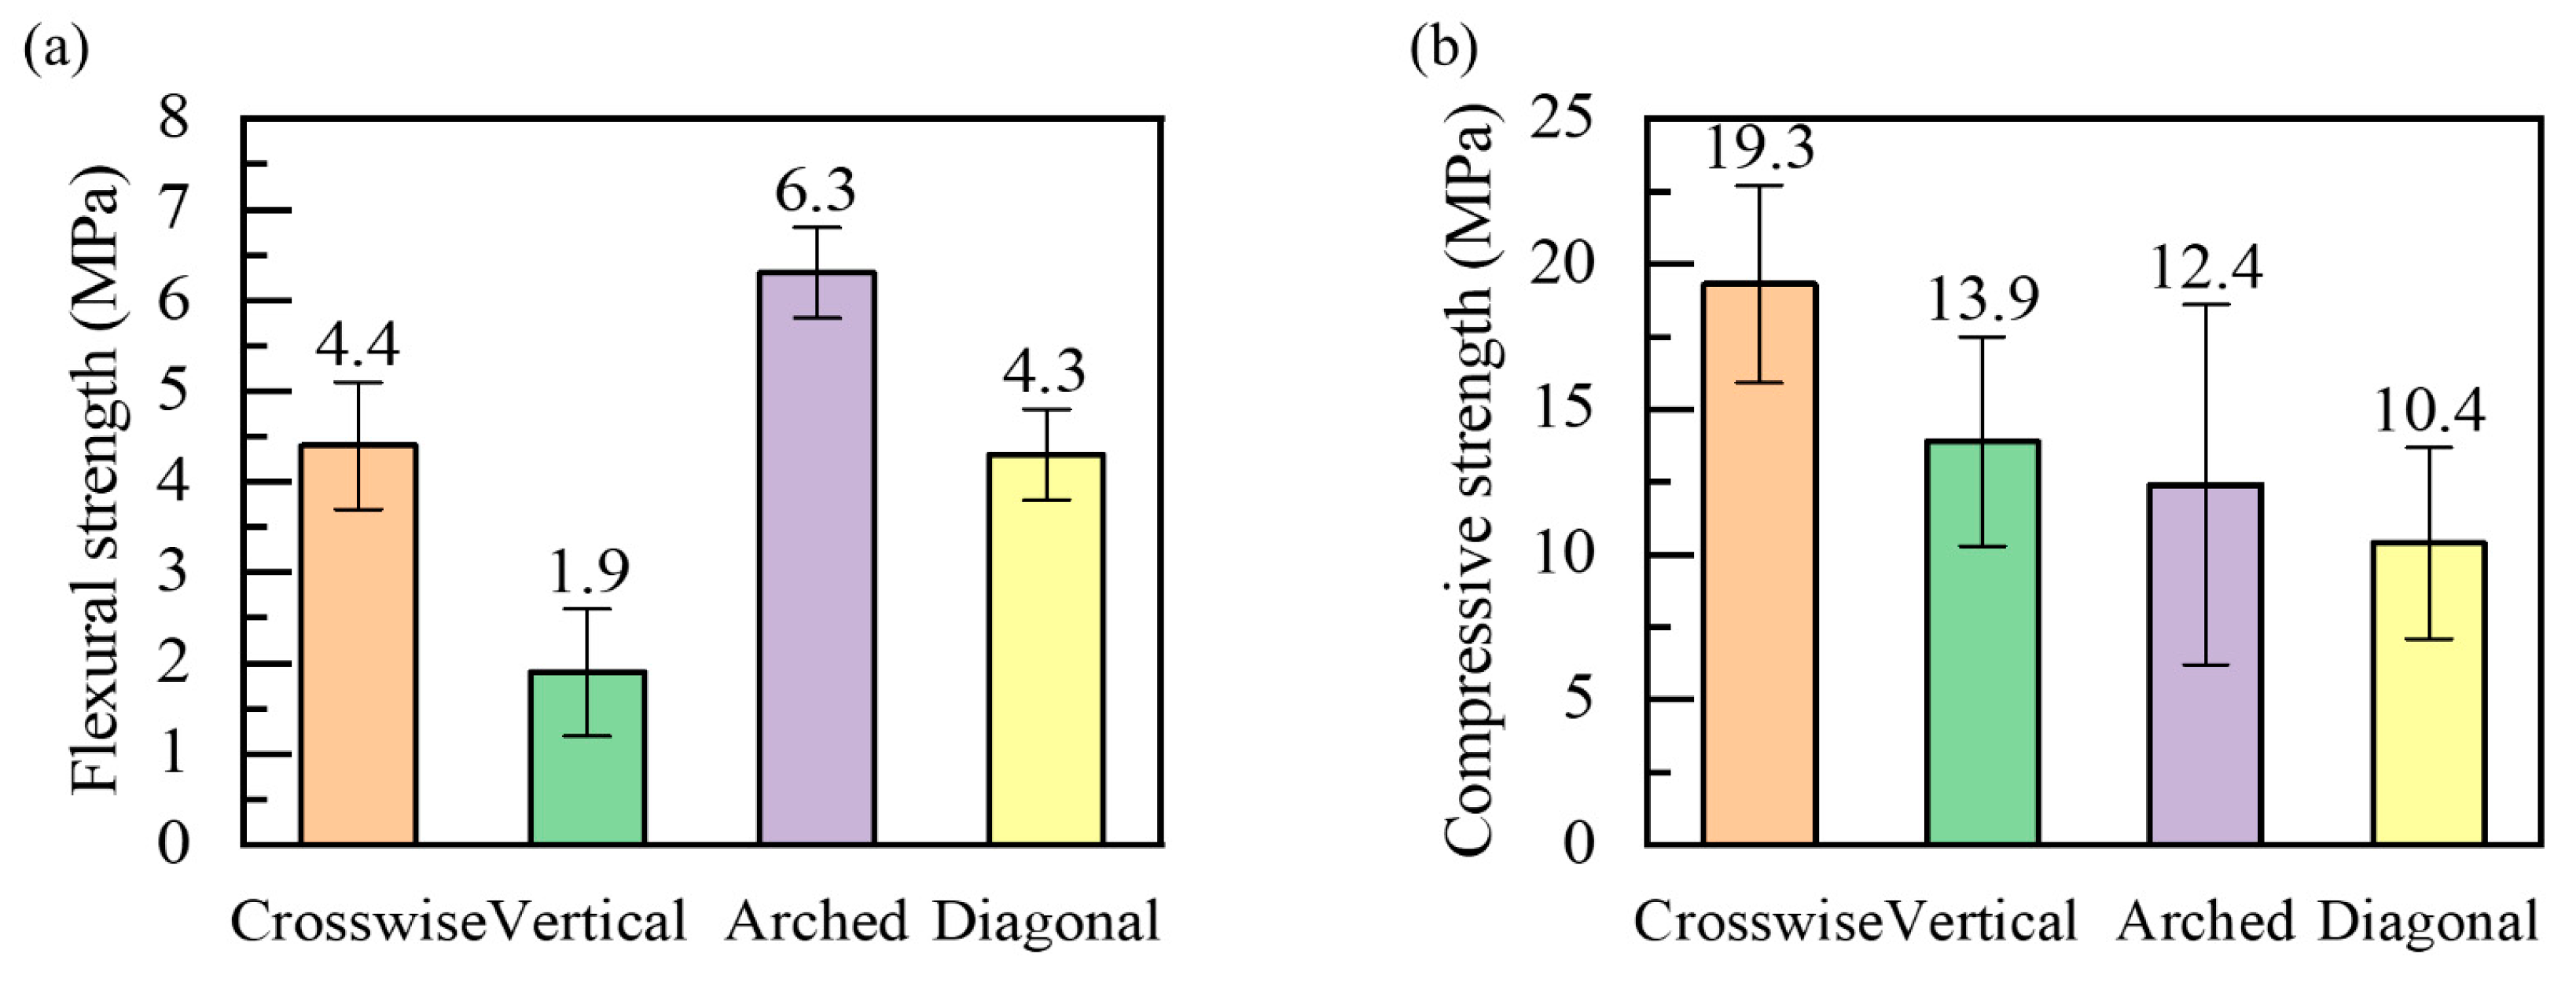
3.1. Flexural Strength

From the force–displacement curves of the flexural tests, as shown in Figure 9a–d, the average failure load that crosswise, vertical, arched, and diagonal specimens have is about 1800, 800, 2700, and 1800 N, respectively. Then, the flexural strength can be calculated by Equation (1):
f t s = 2 P π A = 0.637 P A
where fts is flexural strength, P is failure load, the maximum load before specimens fail under flexural stress; and A is the specimen’s split surface area.
The average flexural strength of the crosswise, vertical, arched, and diagonal specimens was calculated as 4.4, 1.9, 6.3, and 4.3 MPa, respectively, as shown in Figure 10a. Among them, the arched specimens have the highest, the vertical specimens have the smallest, and the diagonal and crosswise specimens are in the middle, approximately equal. The results reported here indicate that path optimization indeed enhances the flexural strength of 3DPC. Although their material composition and volume consumption are completely the same, the arched specimens have the best strength, 50%, 50%, and 200% more than the crosswise, diagonal, and vertical specimens. According to Figure 9, the arched specimens convert tension into compression, while the vertical specimens convert fully into tearing along the inter-filaments.
Compared with the other results of the flexural tests, the regulations obtained from our tests have been verified by other researchers [24,25,32]. The flexural strength of these four paths is analyzed as follows:
(1) The arched path greatly enhances the flexural strength of the specimens. The load on the arched specimens is located at the vault, as shown in Figure 9d, because concrete has higher compressive strength than tensile strength and the arched structure converts the tension of the concrete part into compression. Therefore, the arched specimens have high flexural strength.
(2) The crosswise specimens have normal flexural strength, which is almost equal to the diagonal specimens. The load direction on the crosswise specimens is perpendicular to the layer orientation, as shown in Figure 9a. The bottom layers of the specimens are stretched, and the direction of the principal stress can be parallel to the filaments. The load direction on the diagonal specimens forms an angle of 45° with the diagonal lines, as shown in Figure 9c, and the filaments in the cross-arranged diagonal path support each other, which enhances the flexural strength of the specimens.
(3) The vertical specimens have the lowest flexural strength. The load direction on the vertical specimens can be completely longitudinal to the layer orientation, as shown in Figure 9b. This indicates that the flexural strength largely depends on the interlayer adhesion between the layers. Due to the easy formation of cracks between layers, insufficient interlayer adhesion results in low flexural strength.

3.2. Compressive Strengths

The compressive strength can be calculated by Equation (2):
f c c = P A
where fcc is compressive strength, P is the maximum applied load, and A is the cross-sectional area of the specimen.
The average compressive strength of the crosswise, vertical, arched, and diagonal specimens was calculated as 19.3, 13.9, 12.4, and 10.4 MPa, respectively, as shown in Figure 10b. The load direction being perpendicular to the layer orientation results in compaction between layers, whereas the load direction being longitudinal to the layer orientation results in tearing between layers. Therefore, the crosswise specimens have remarkably higher compressive strength than the other three paths of the specimens. The little difference between the compressive strength of the vertical, arched, and diagonal specimens shows minor dependencies on the printing path in the compressive strength tests. It can be seen that the load direction, perpendicular or longitudinal to the layers obtained in 3D printing, has a major impact on the compressive strength.

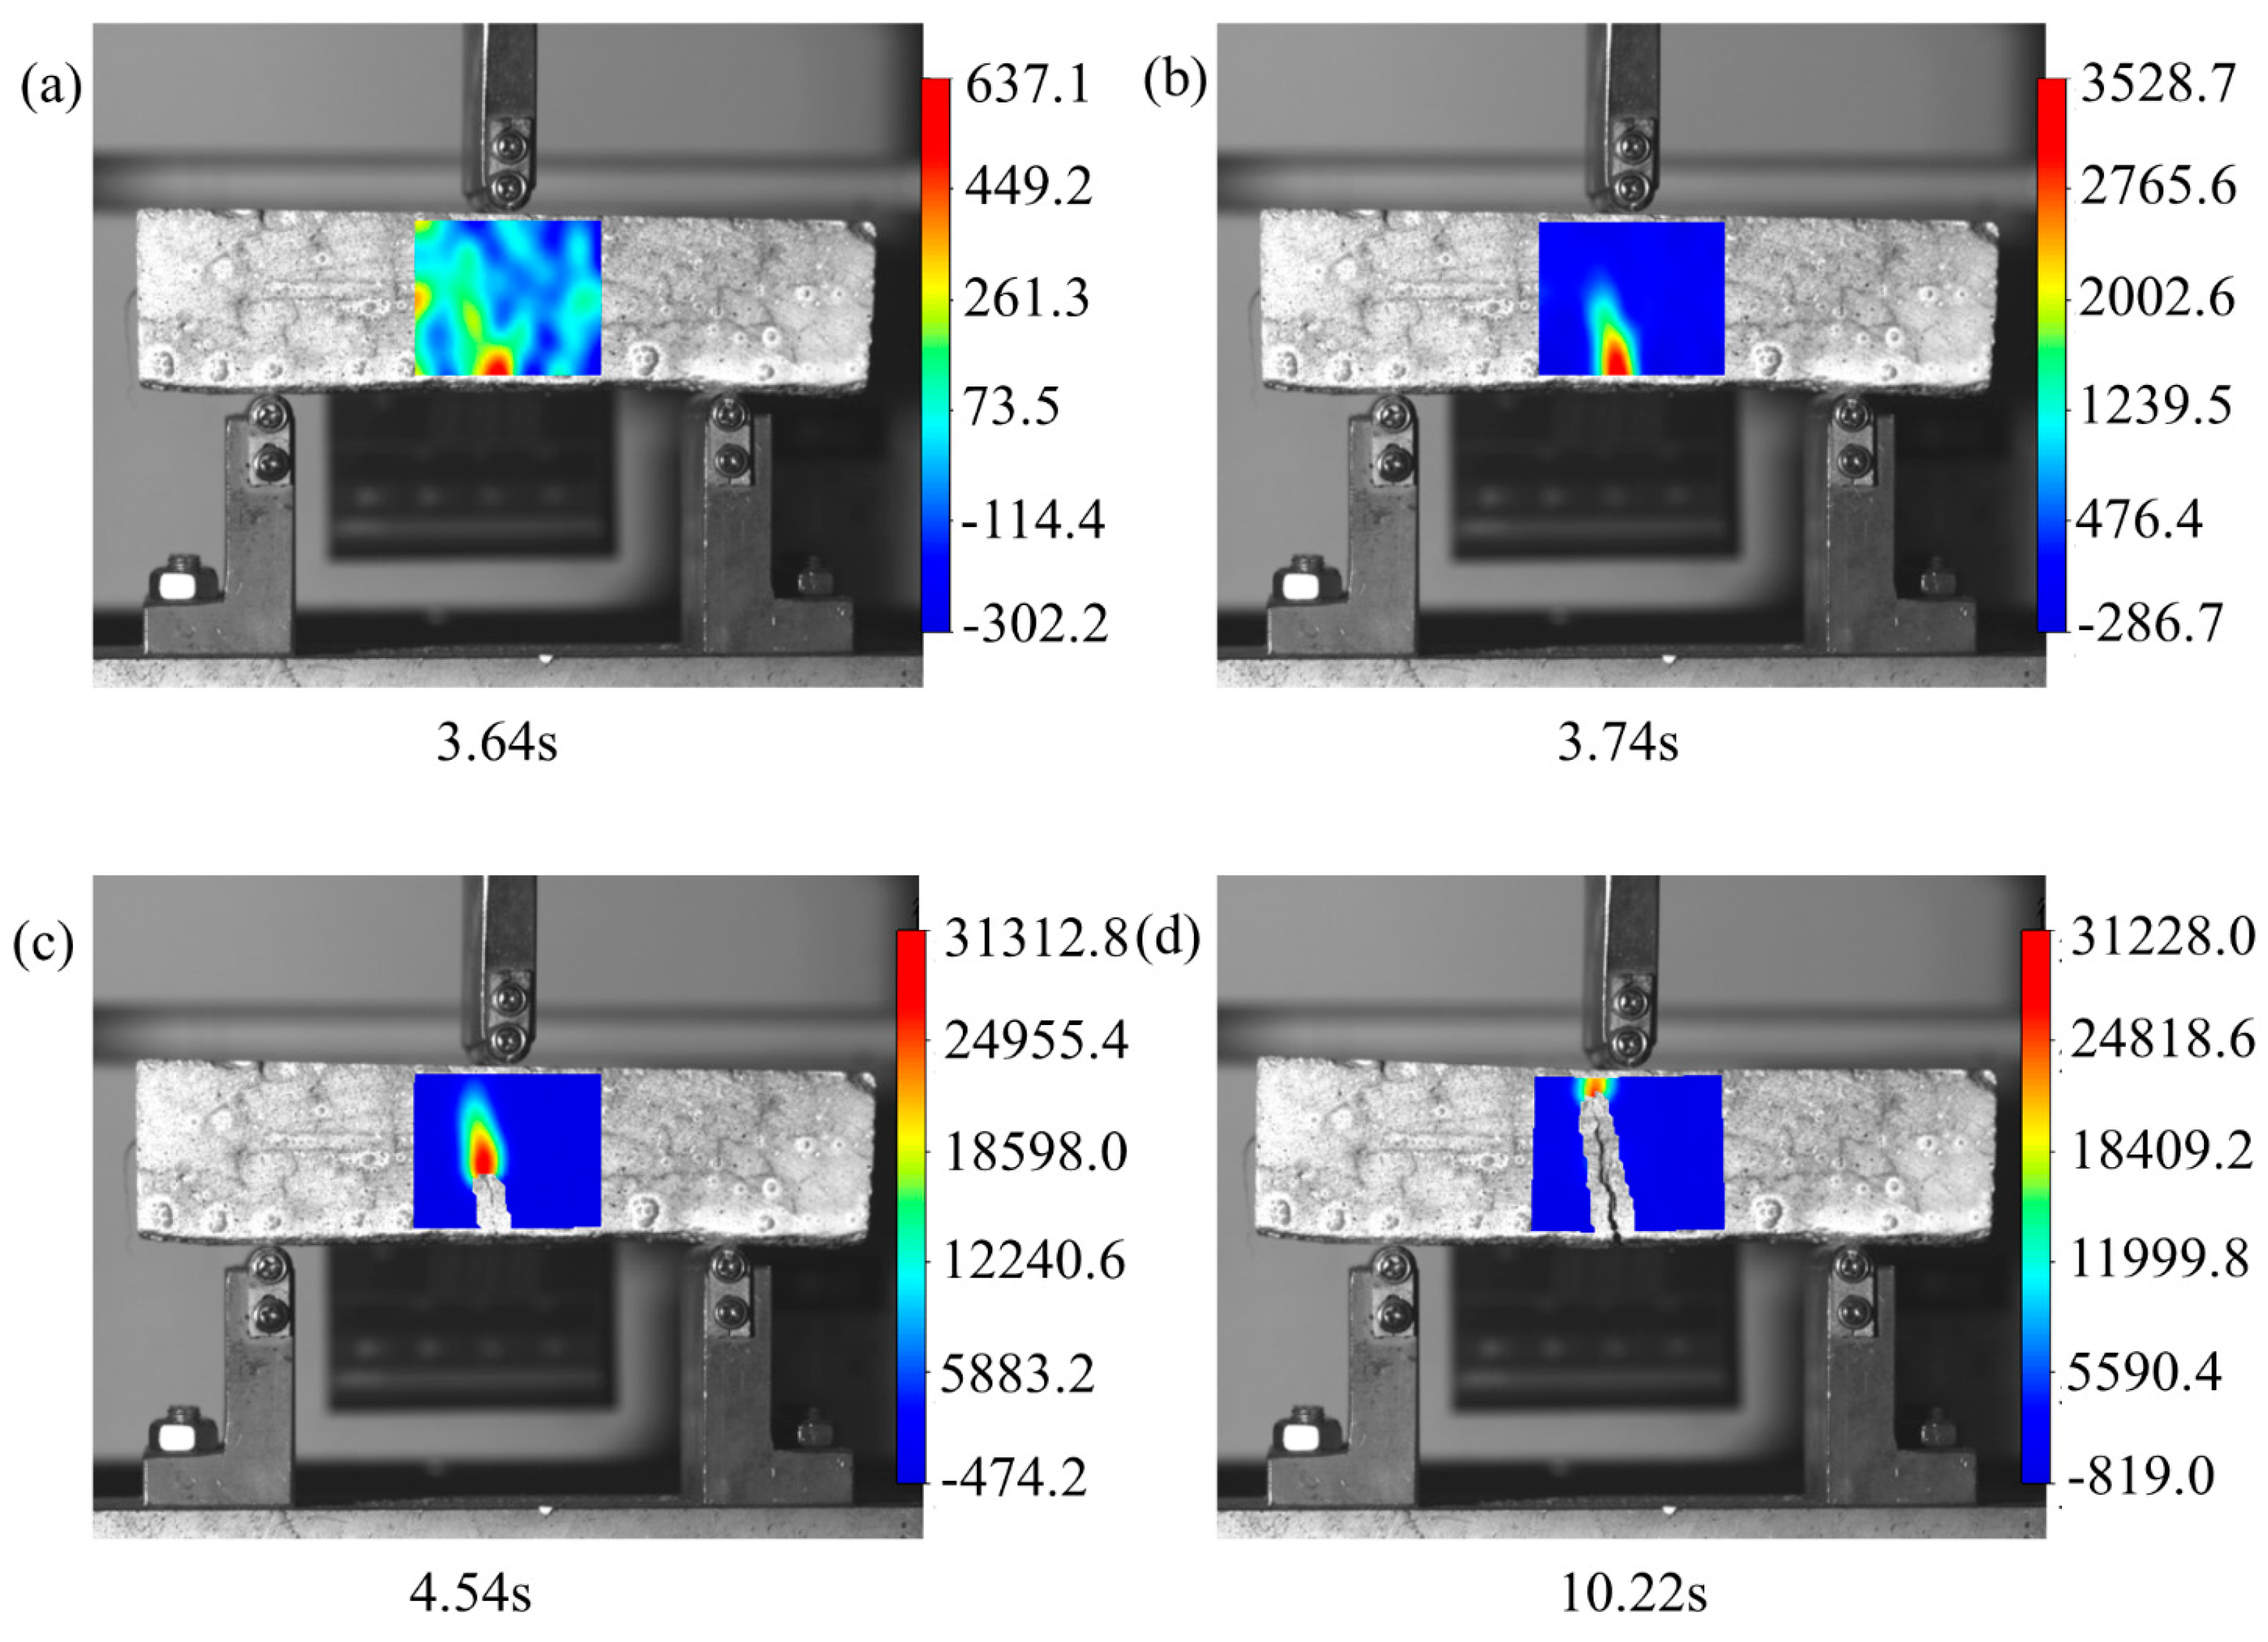
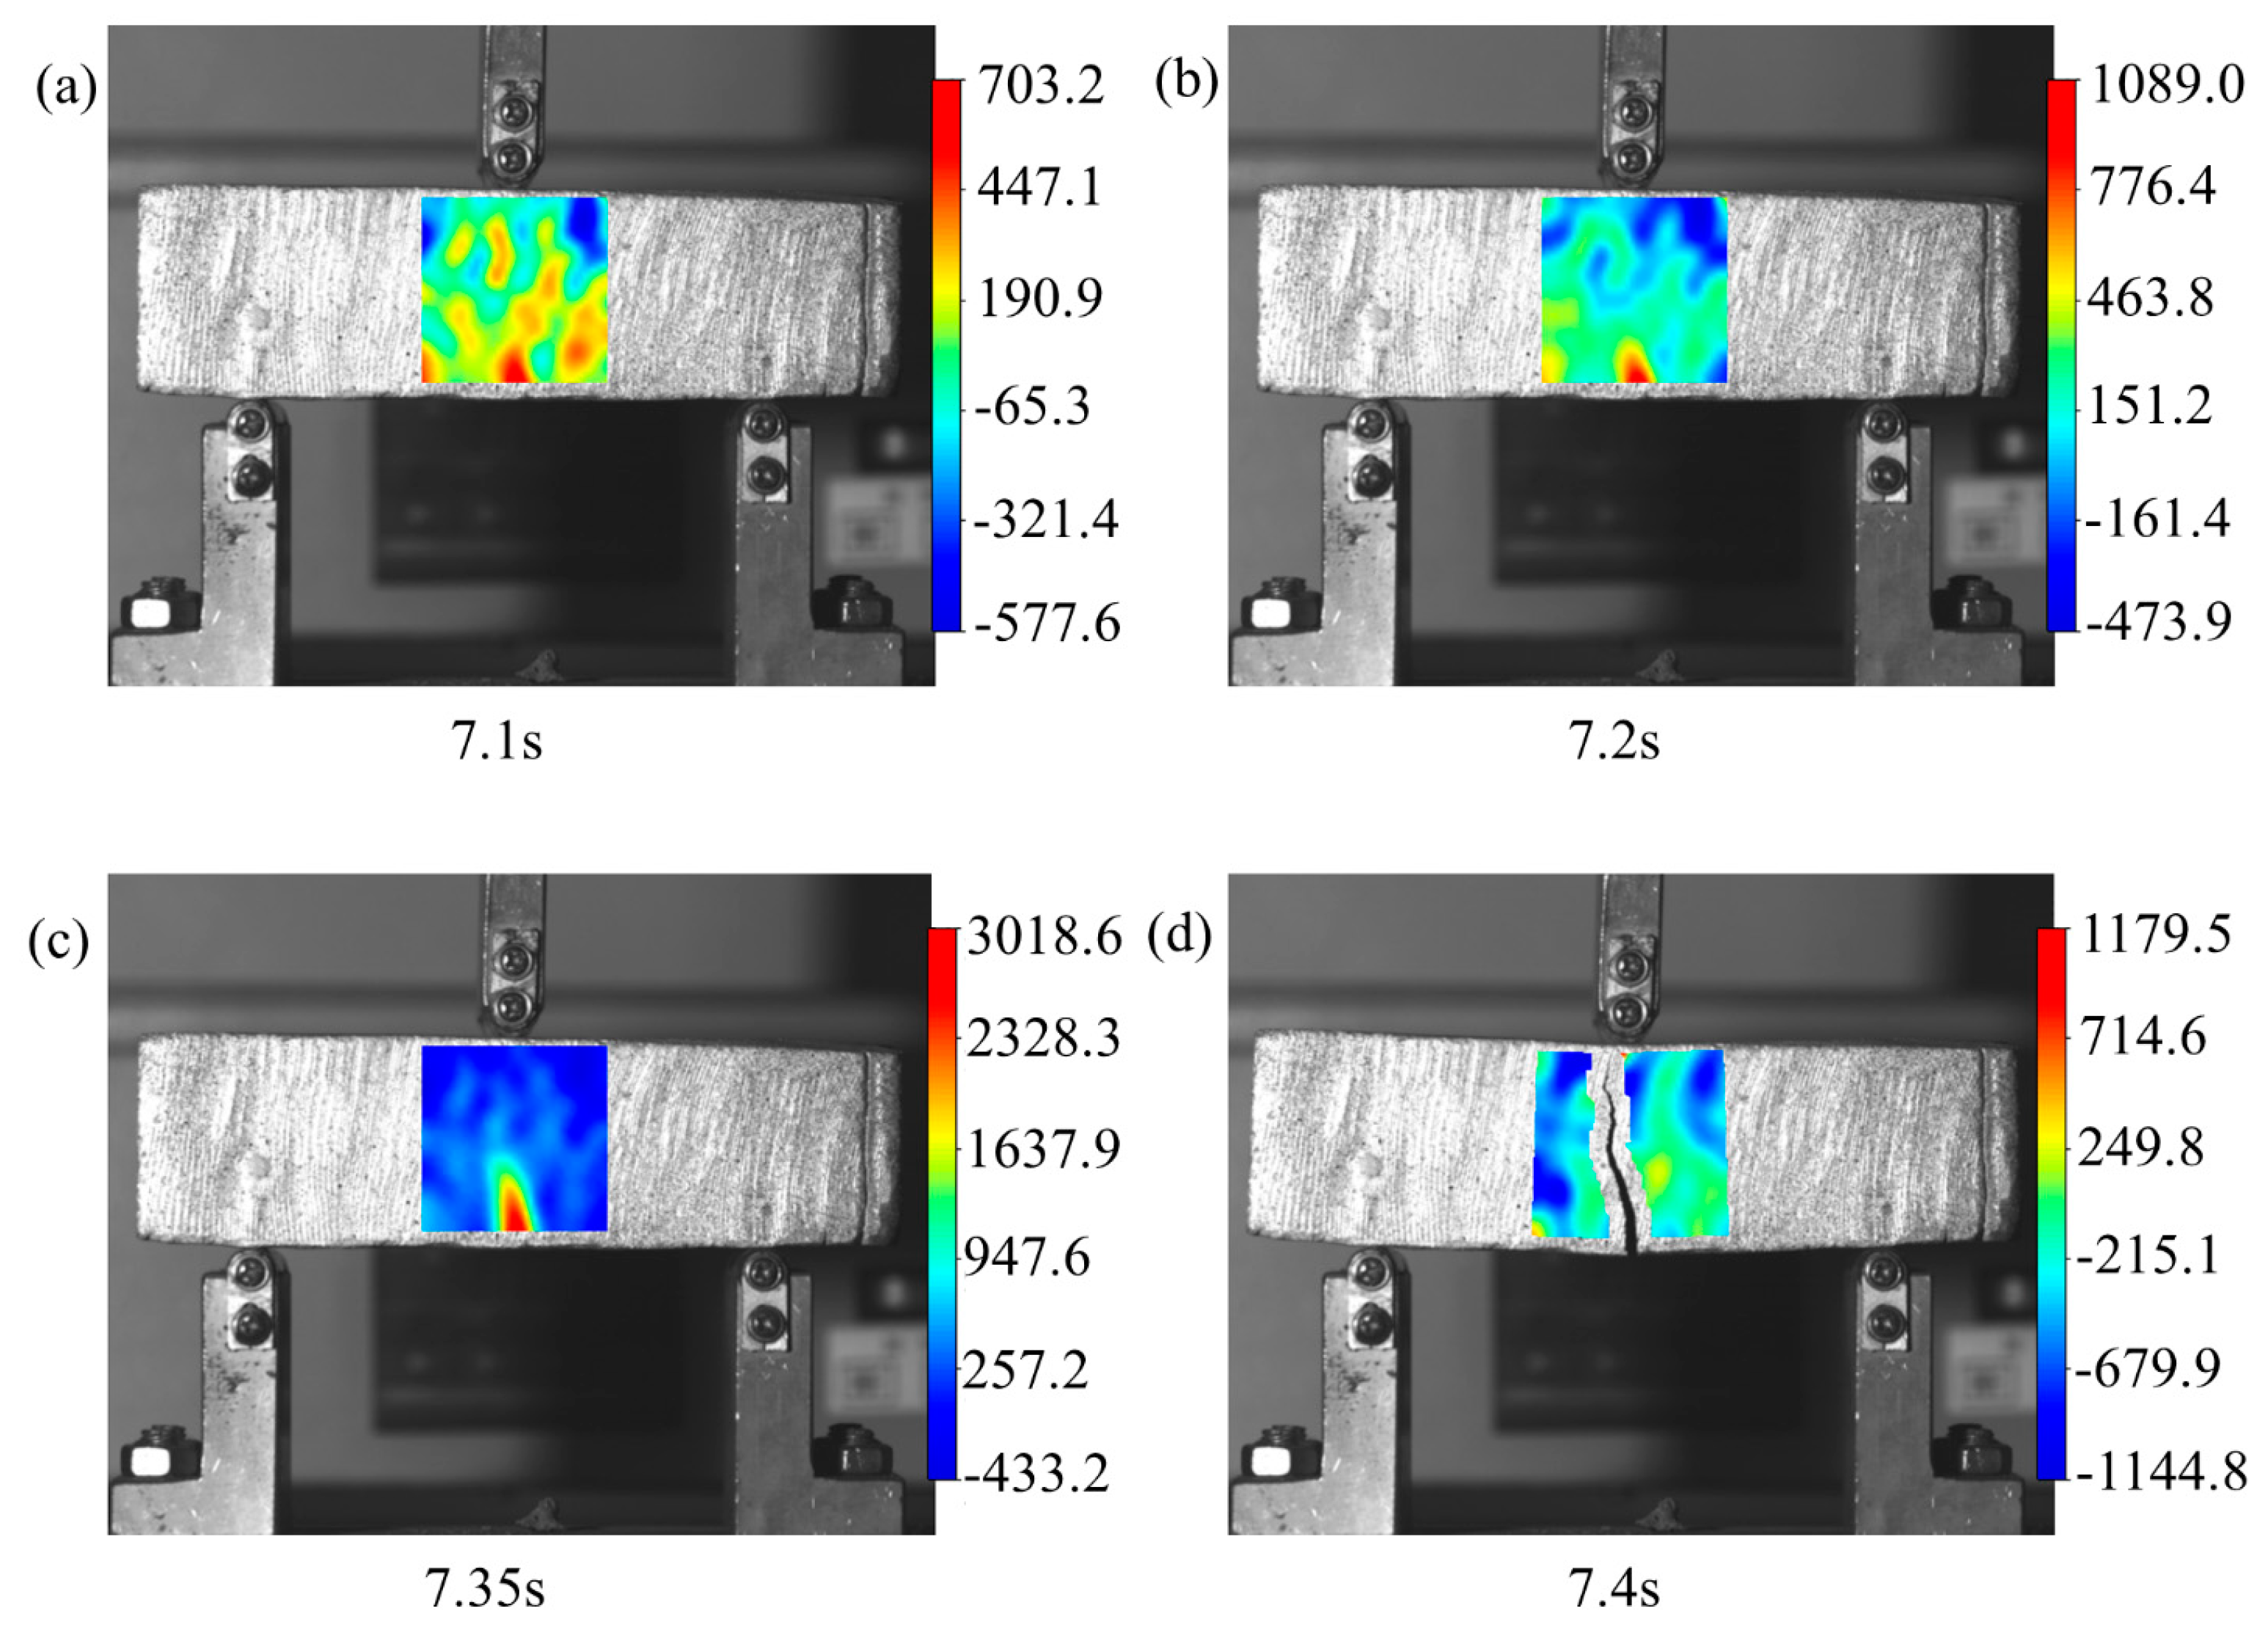
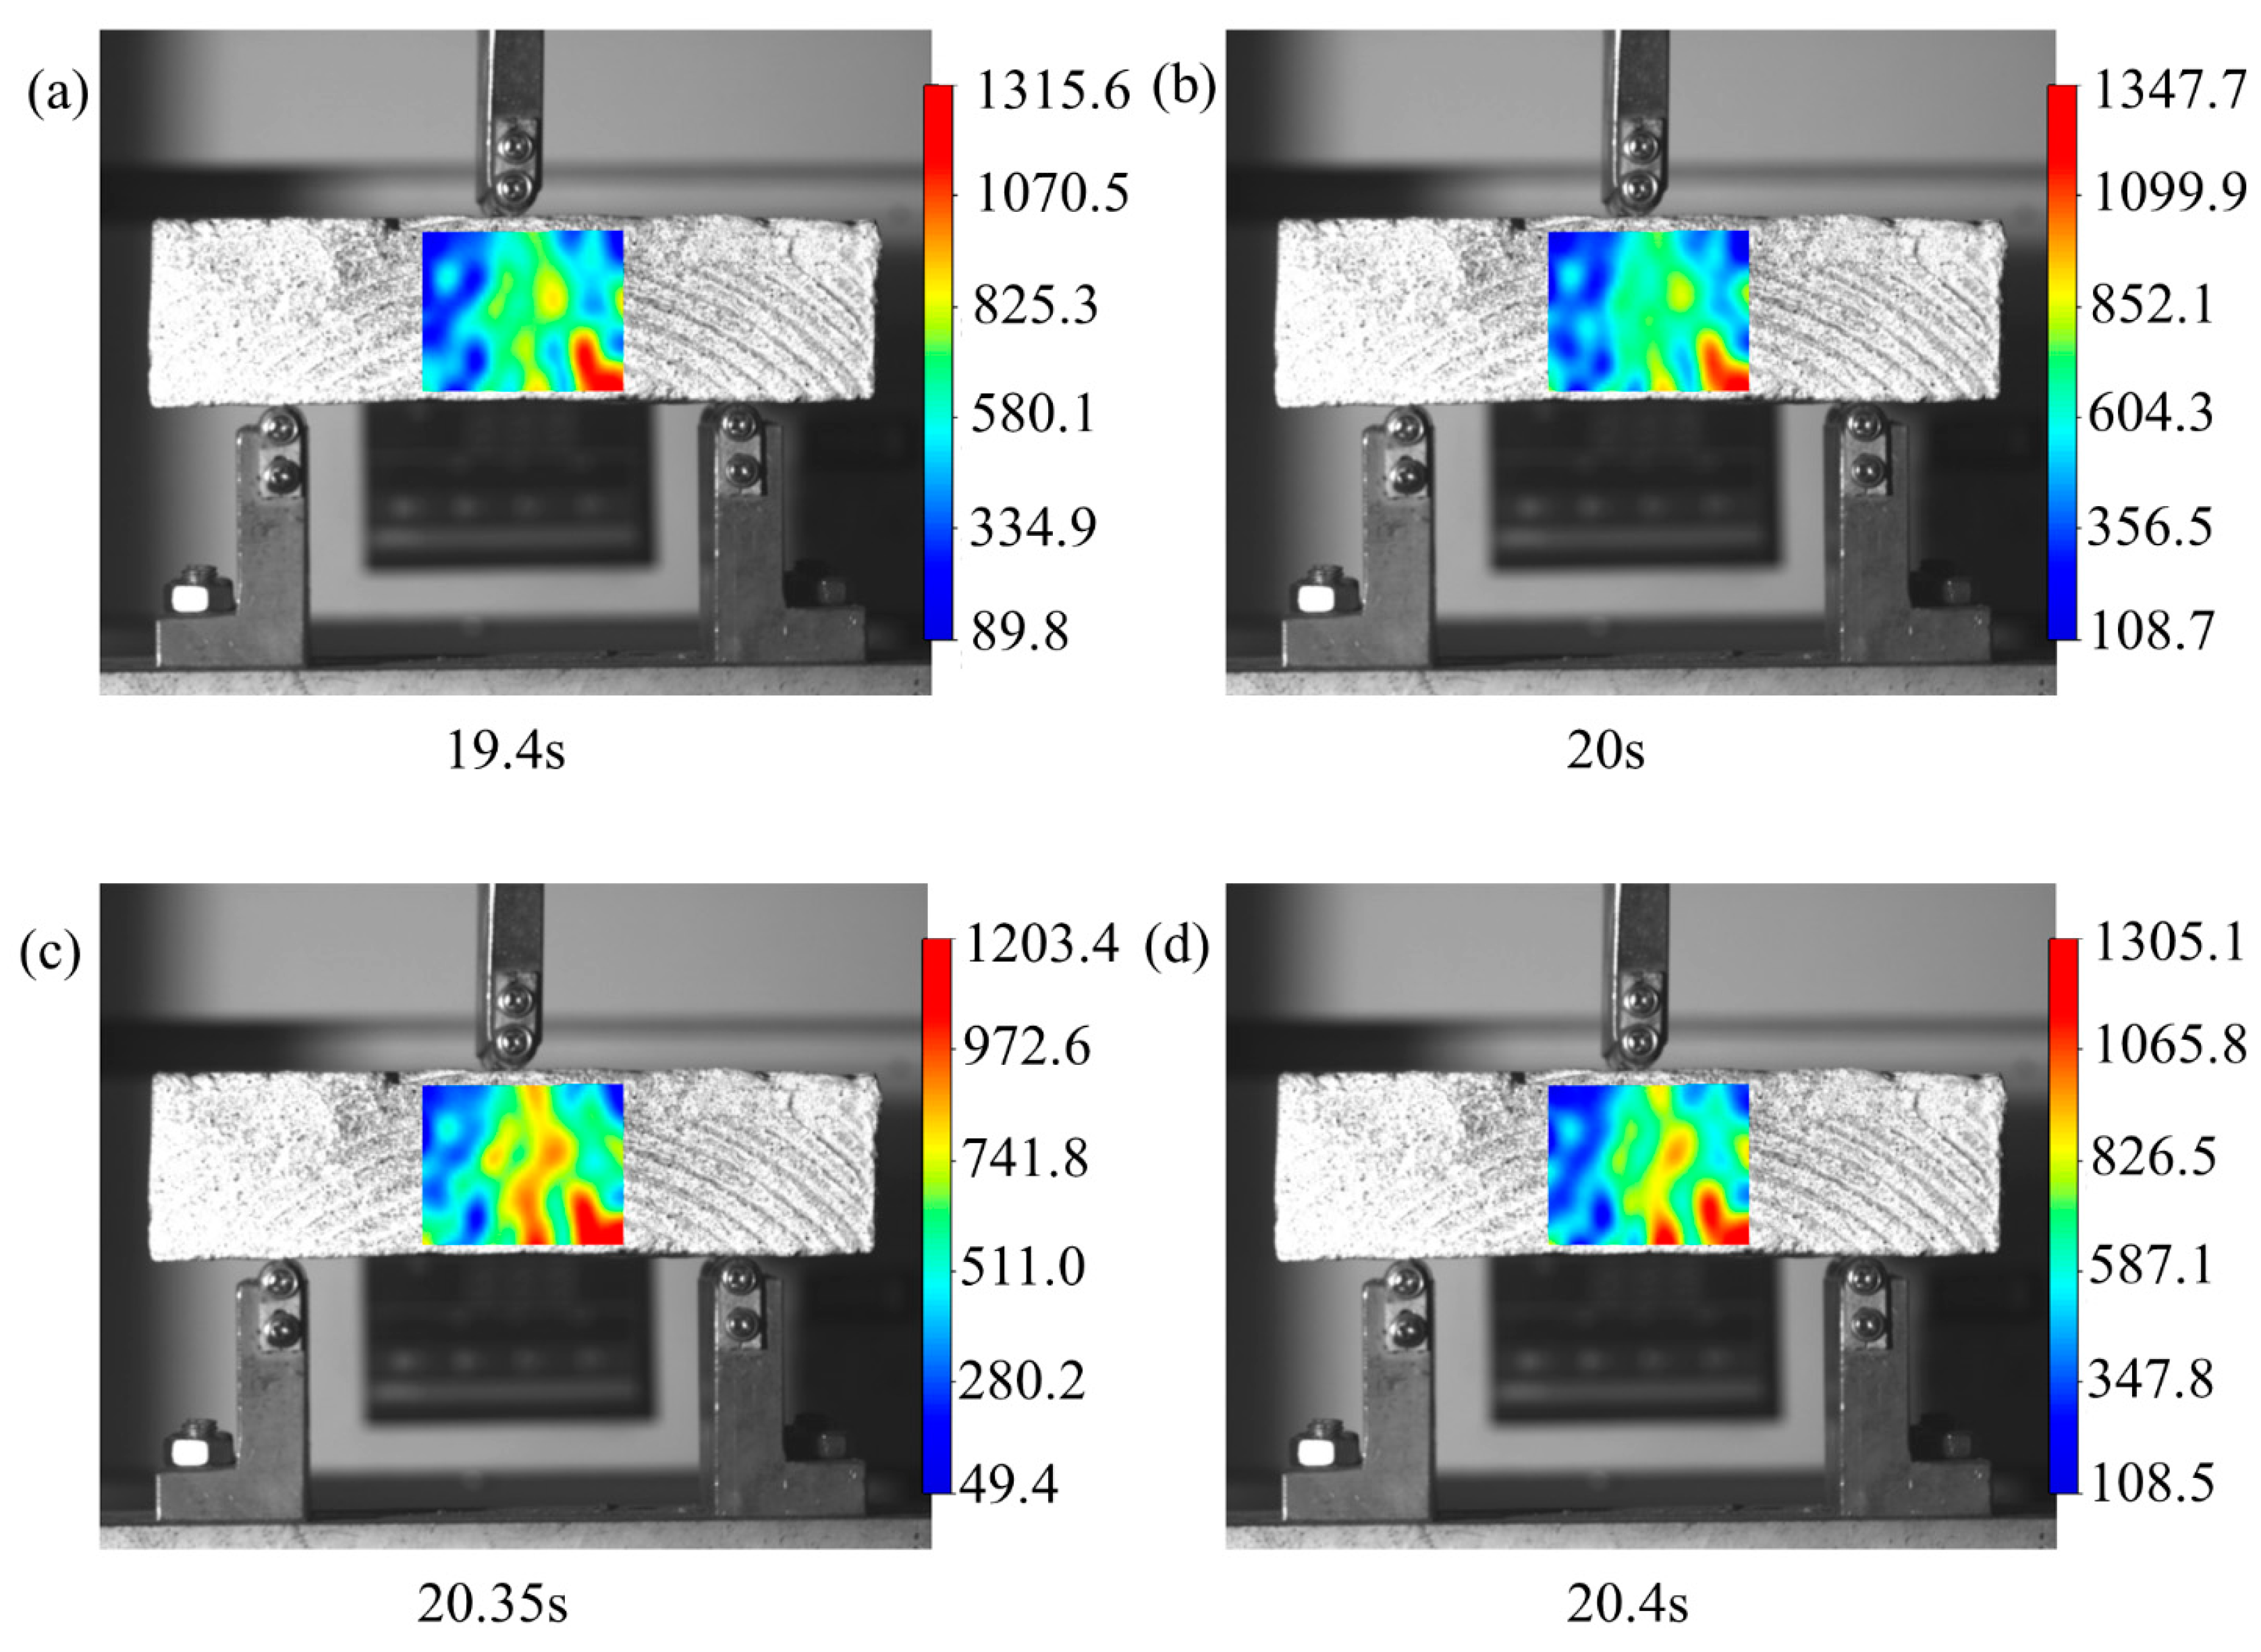
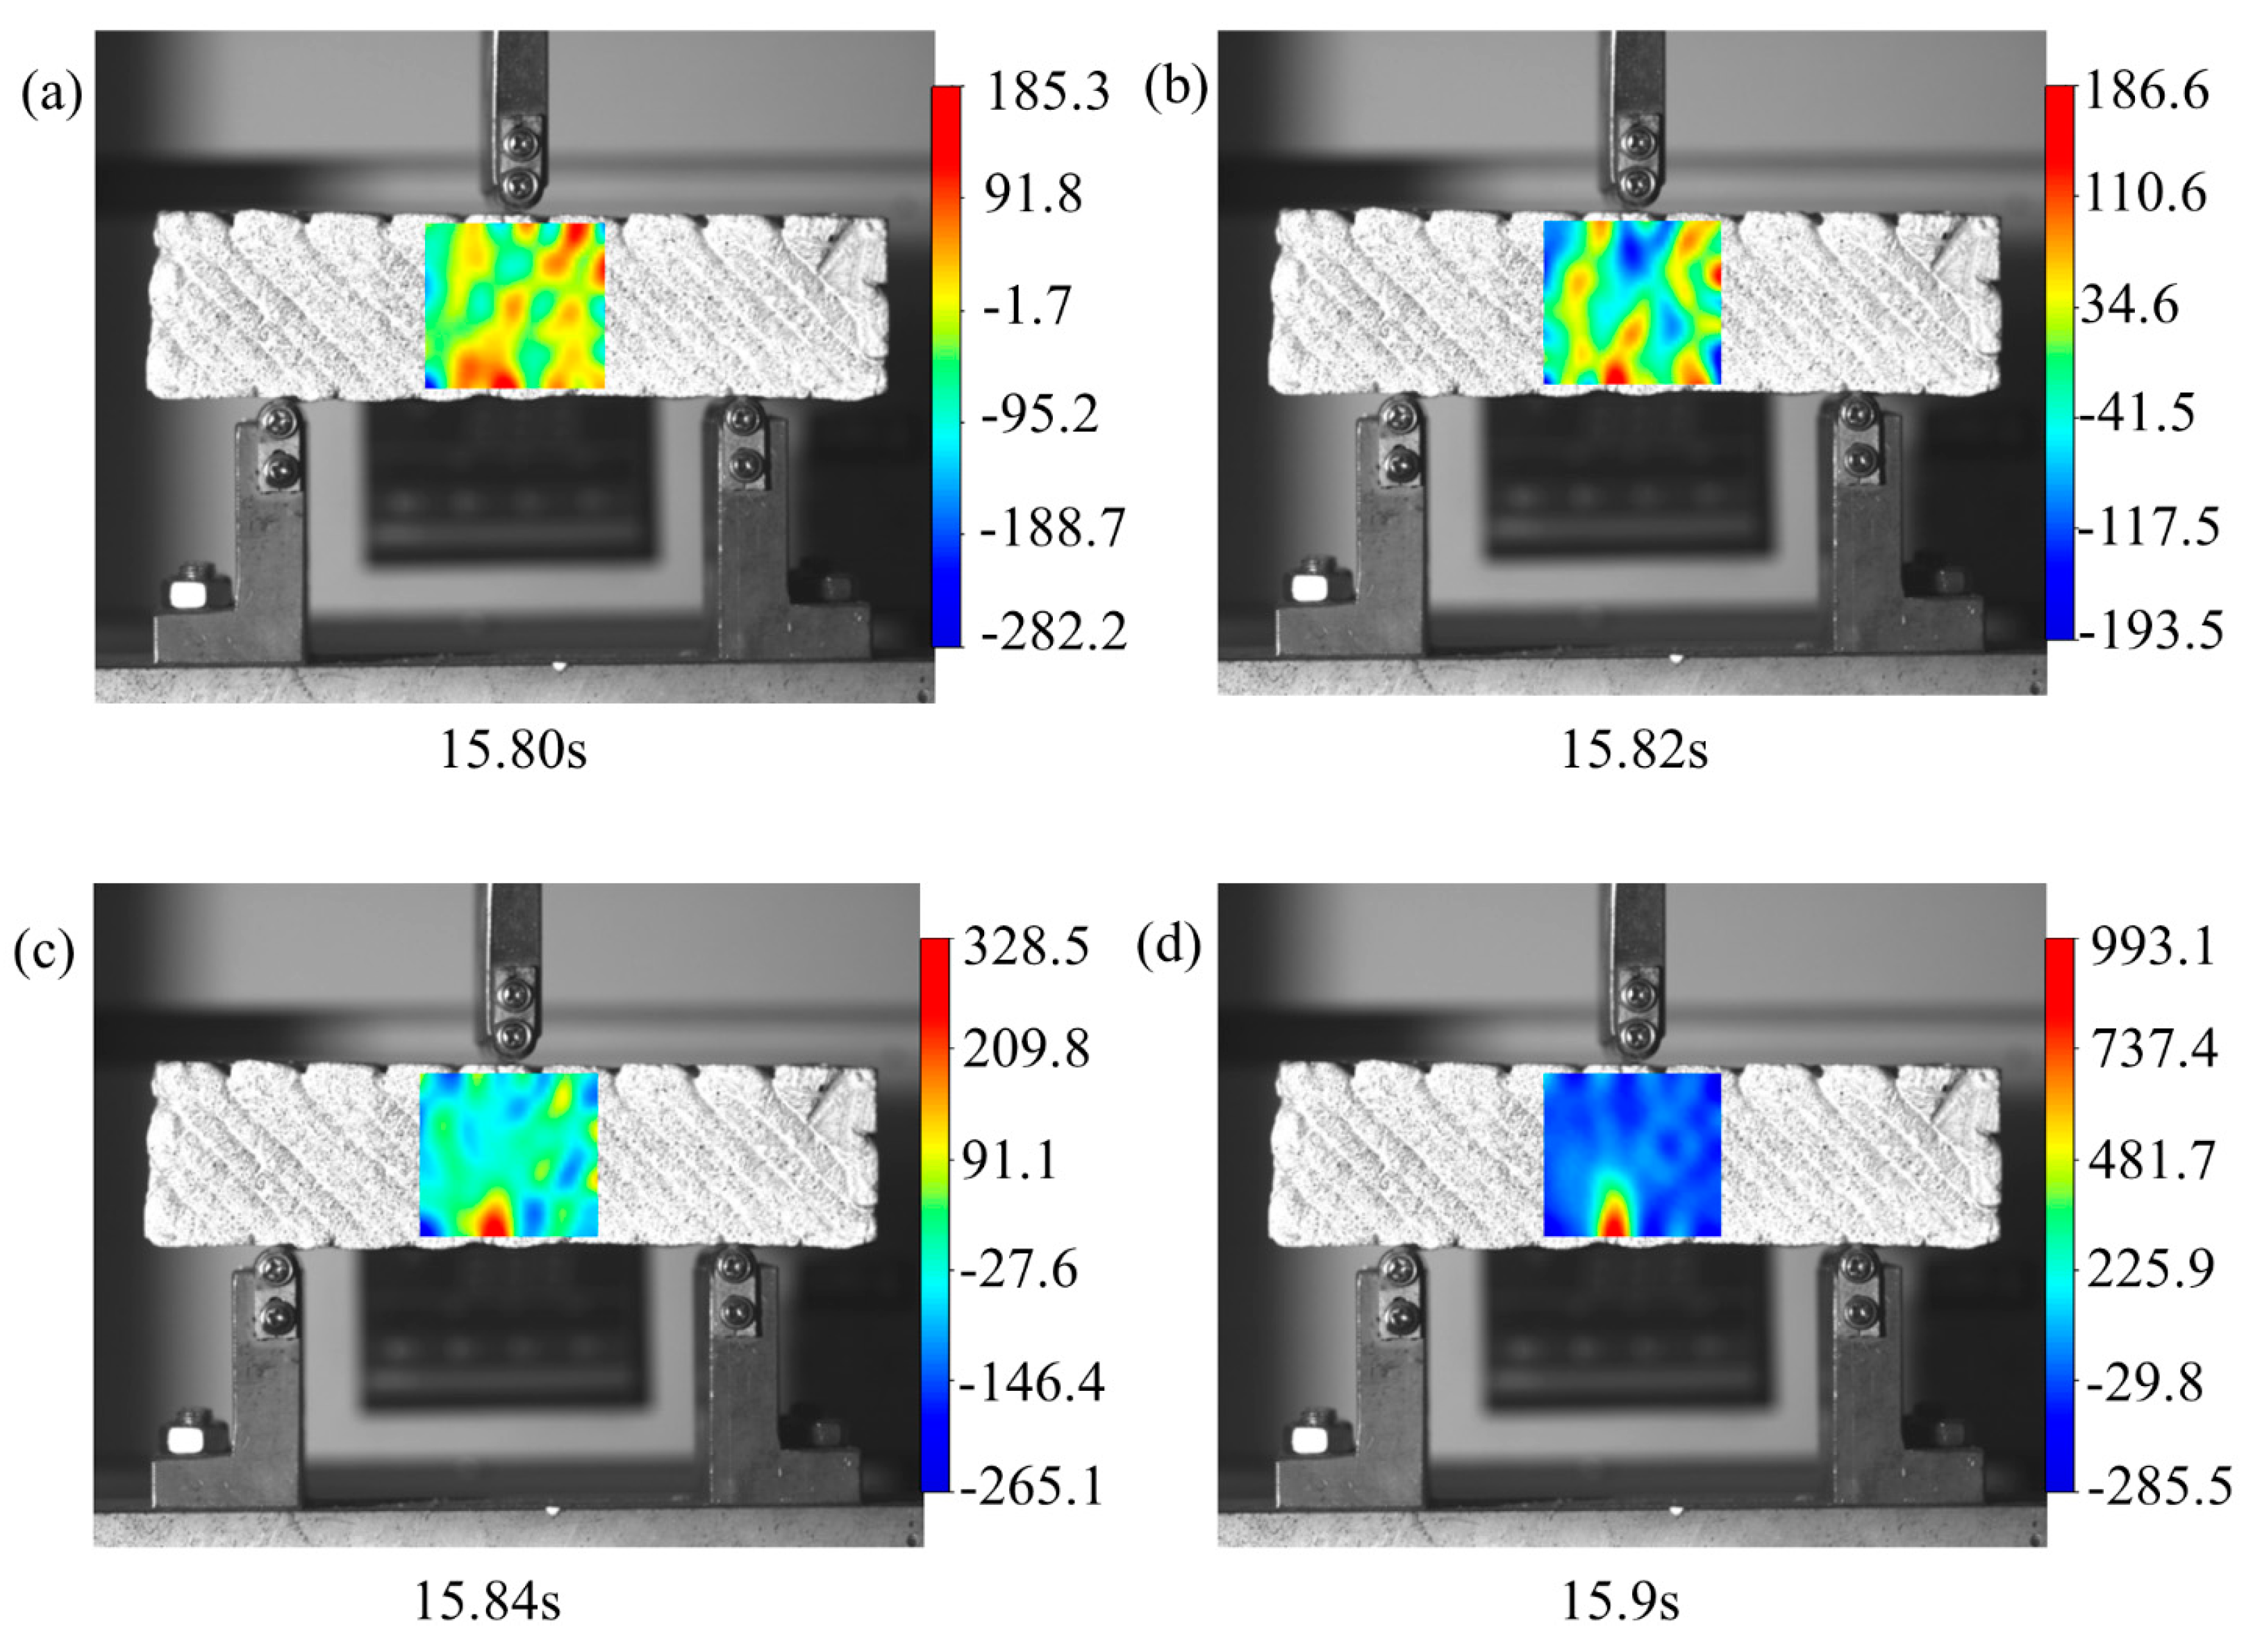
3.3. Progressive Fracture Process

DIC analysis diagrams were introduced to investigate the progressive fracture process, as shown in Figure 11, Figure 12, Figure 13 and Figure 14. The crack propagation time of the crosswise, vertical, arched, and diagonal specimens is about 6, 0.05, 0.02, and 0.05 s, respectively. The maximum strain of the crosswise, vertical, arched, and diagonal specimens is about 0.031, 0.003, 0.0013, and 0.001, respectively.
The fracture energy can be expressed using the stress–displacement curve obtained from the fracture mechanics tests. It can be calculated by Equation (3):
G Q = 0 ε 0 σ Q d ε Q
G Q is the fracture energy, σ Q is the stress at fracture, and ε Q is the displacement at fracture.
The fracture toughness of the specimens can be calculated by Equations (4) and (5) [38]:
K Q = F Q S B W 3 2 g 1 a W
g 1 a W = 3 a W   1 2 1.99 a W 1 a W 2.15 3.93 a W + 2.7 a W 2 2 1 + 2 a W 1 a W   3 2
where W is the width, S is the span, B is the thickness, a is the crack length, FQ is the critical load, and KQ is the fracture toughness.
With W = 0.04 m, S = 0.1 m, B = 0.04 m, a = 0.45, and W = 0.018 m, the fracture toughness can be obtained.
As shown in Table 3, it can be seen that the fracture toughness is highly correlated with the critical load, and the fracture toughness is directly related to fracture energy. The arched specimen has the largest fracture toughness and fracture energy, in keeping with the rule of flexural strength in this study.
The crack propagation time of the four printing paths of the specimens shows that only the crosswise specimens manifest ductile fracture, while the printing paths of the other three specimens manifest brittle fracture. By analyzing and comparing the fracture energy and fracture toughness of the crosswise specimens with the other three types of specimens, it can be observed that the ductile fracture in the crosswise specimens does not have the maximum fracture energy and fracture toughness. Therefore, its fracture process is closely related to the structure of the specimens. Due to only the load direction on the crosswise specimens being perpendicular to the layer orientation, the crack propagates from the bottom layer to the top layer of the specimens after cracking. So, the fracture process of the specimens that manifest ductile fracture can be extremely obvious.
The other three printing paths of the specimens have similar fracture processes. Because the load direction of the vertical, arched, and diagonal specimens is longitudinal to the layer orientation, the process of fracture shows a monolithic fracture rather than a stratified fracture. Therefore, these three paths of the specimens have a short crack propagation time, and the fracture process appears unobvious. However, the load duration of the crosswise, vertical, arched, and diagonal specimens is about 10, 7, 20, and 16 s, respectively. The arched specimens have the longest load duration, which verifies the results of the flexural strength tests in this study.

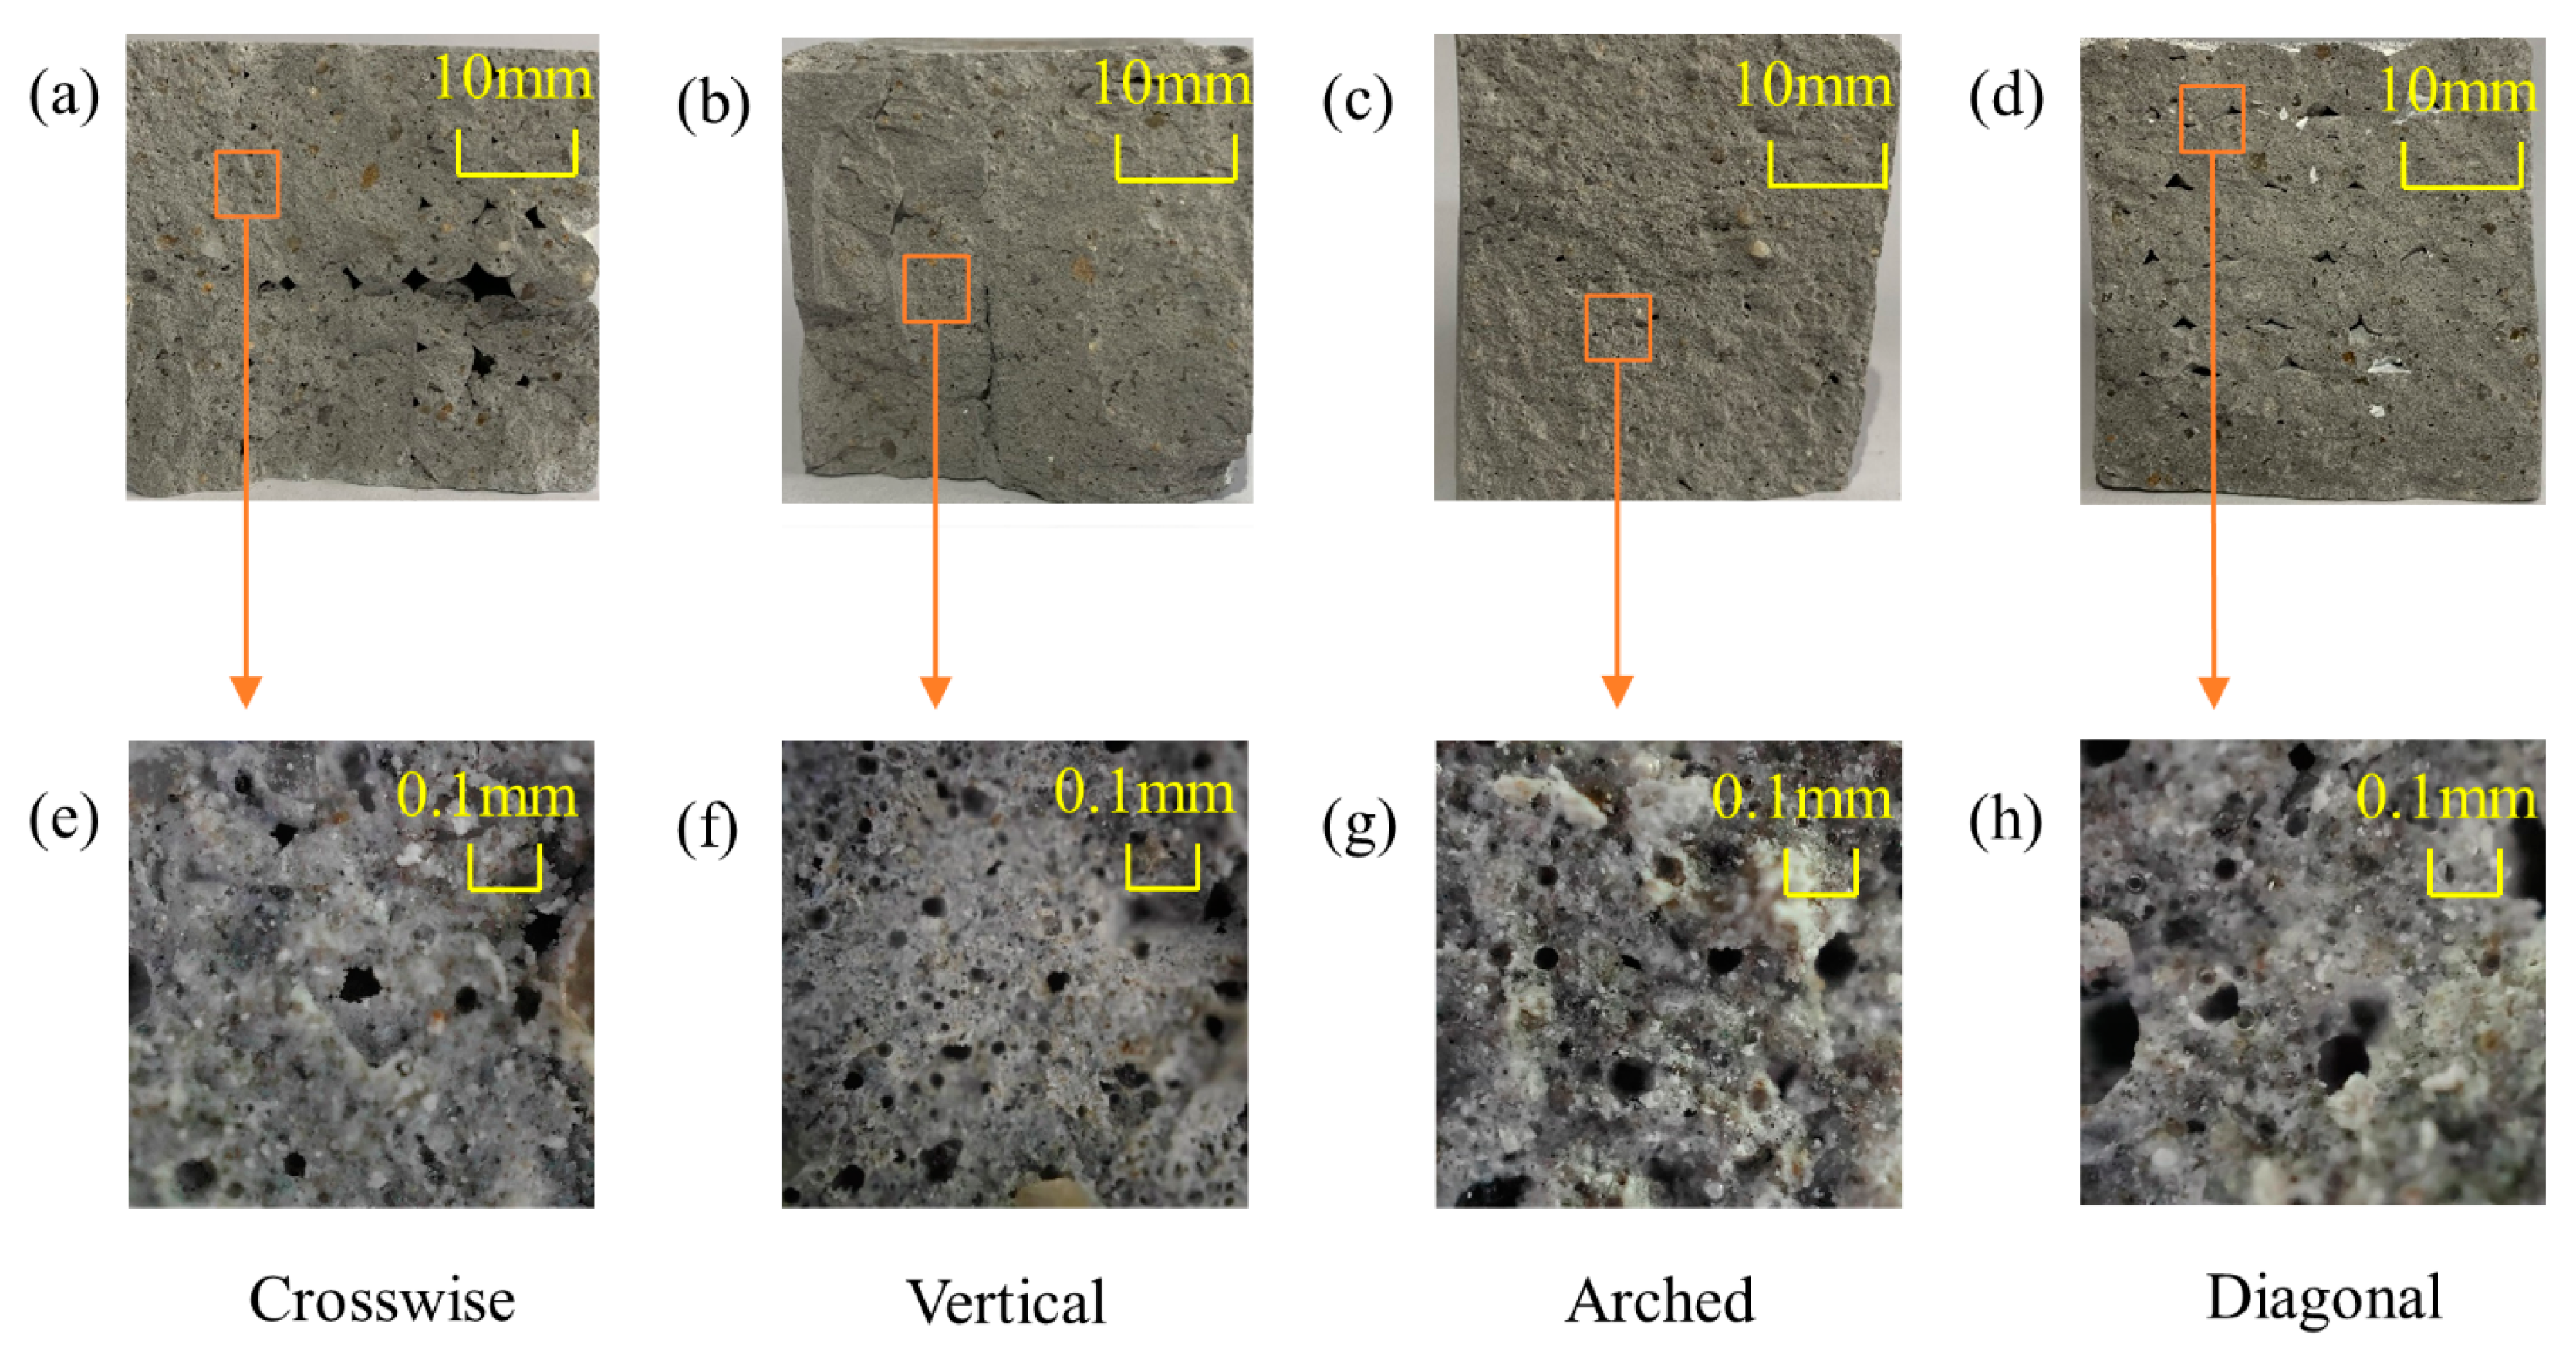
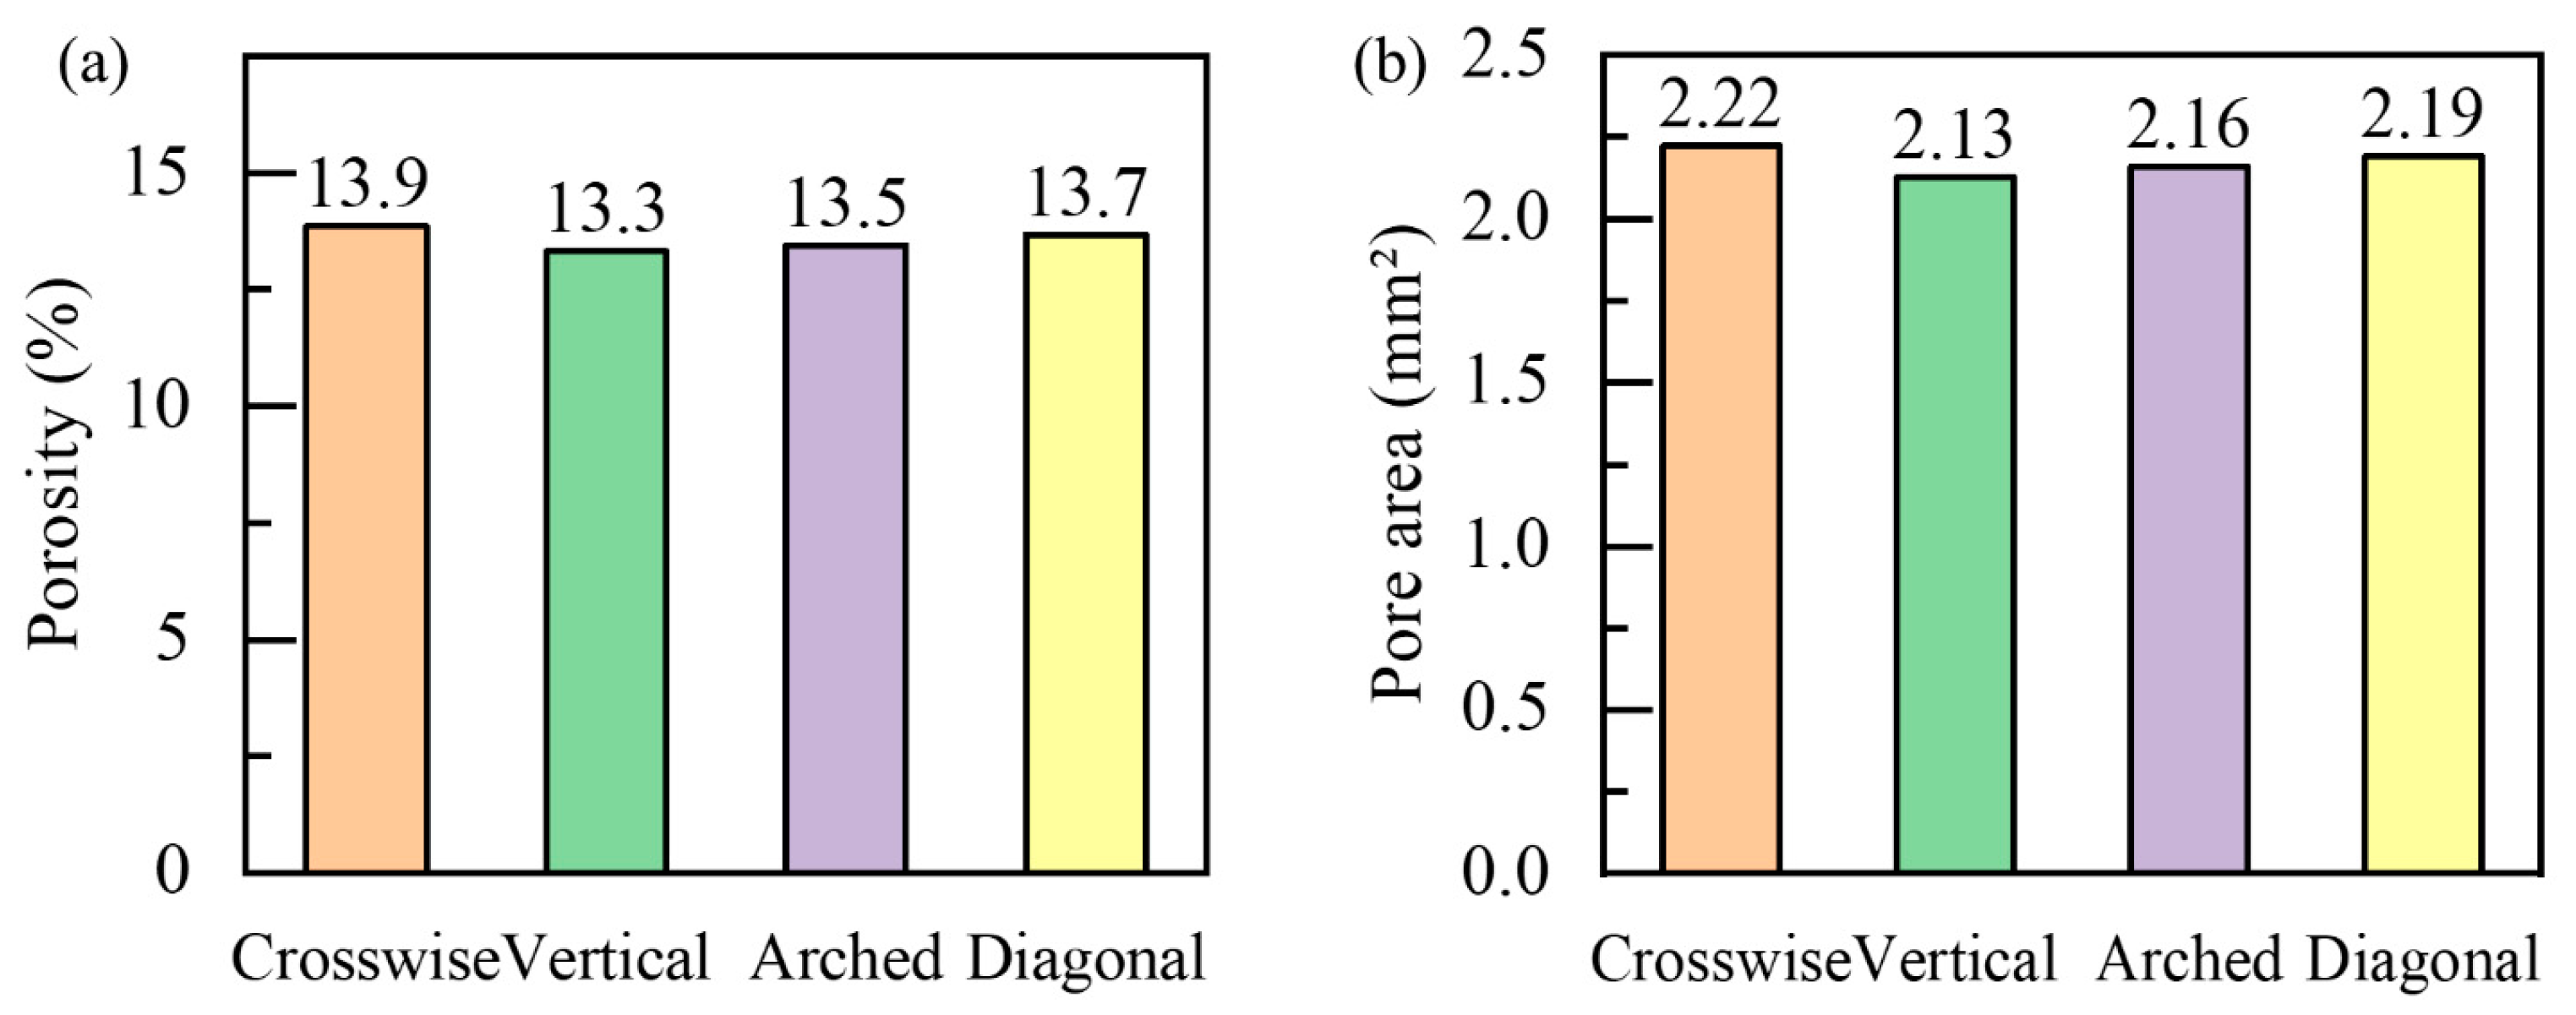
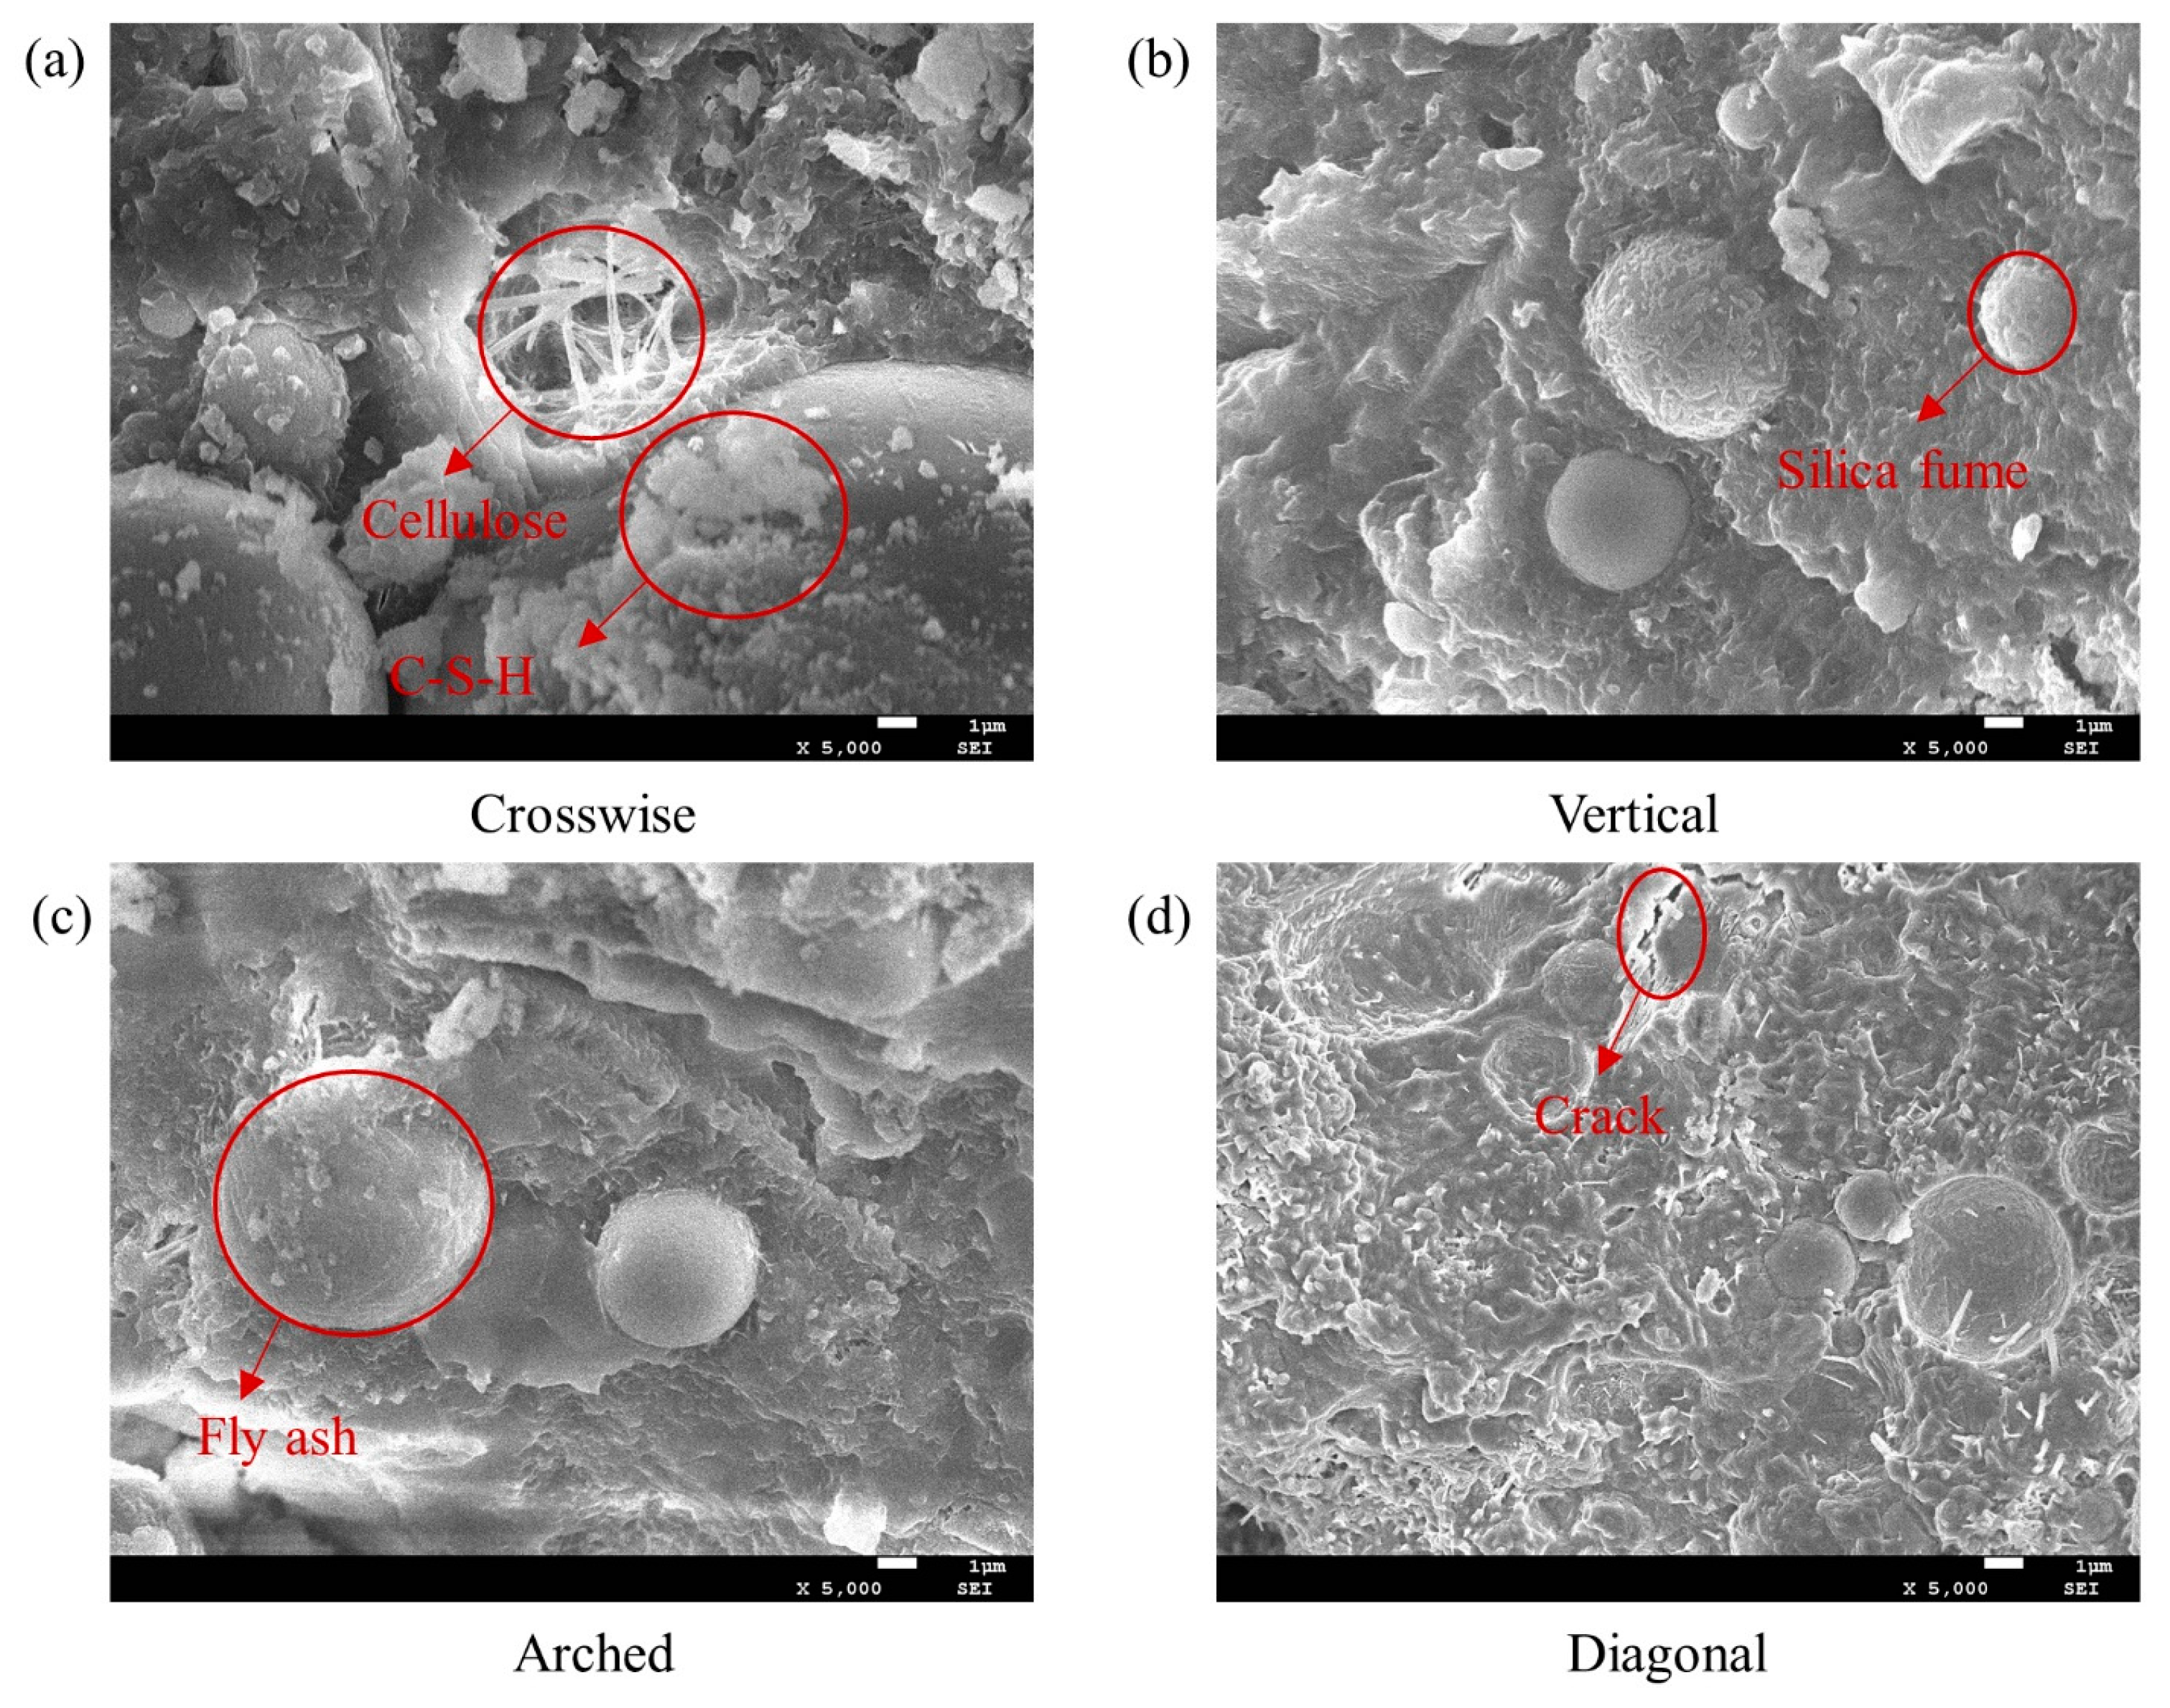
3.4. Meso- and Microstructures

As shown in Figure 15a–d, the macroscale comparison of the cross-sections of the specimens in the four paths shows that obvious voids occur in the printed specimens. Down to the mesoscale level, in Figure 15e–h, the cross-sectional voids, which are magnified 60 times, of the four paths have no difference, which is proved by the statistics of the proportion and total porosity area in Figure 16a,b.
Various porosities are evenly distributed in the four paths of the specimens, as shown in Figure 16 and Figure 17. The pores sizes of the crosswise specimens range from 0 to 0.1 mm2, vertical from 0 to 0.3 mm2, arched from 0 to 0.2 mm2, and diagonal from 0 to 0.4 mm2. It can be seen that the four paths of the specimens have approximately equal porosity because the voids are located in the filaments, which have no difference.
Further down to the microscale level, the comparison between the microscale images of these four paths indicates that calcium silicate hydrate (C-S-H) effectively adheres to silica fume, fly ash, SDSC, and sand, as shown in Figure 18. The microstructures of the four paths have no obvious difference because we used the same mix ratio of concrete. The same microstructures show that the printed filaments have the same strengths. The different strengths only depend on the different paths of 3DPC on the macroscale level. Therefore, path optimization is beneficial for the strength of 3DPC.

4. Conclusions

In summary, in order to obtain the optimized strength of 3DPC, we proposed four different printing paths of 3DPC, including crosswise, vertical, arched, and diagonal patterns. The mix ratio of 3DPC was studied to print standard concrete specimens using our customized concrete 3D printer, which features fully sealed extrusion and ultrathin nozzles. Flexural and compressive testing were carried out to compare the strength enhancement. In order to verify the tested results and expose the mechanisms of the strength enhancement, DIC was used to capture the dynamic gradual fracture in the flexural tests. The progressive fracture process verifies that arched-path concrete has the highest flexural strength. Also, the meso- and microstructures of the 3D-printed concrete specimens were pictured, which verifies that path optimization is beneficial for the strength of 3DPC. Some conclusions are as follows:
(1) Printing path optimization simplifies the printing process and ensures the printability of 3DPC, compared with the other methods, to enhance the strength of 3DPC.
(2) By making better use of filament-wise strength, the arched-path concrete specimen has 30% more flexural strength than the others.
(3) In the case of 3DPC that needs to be under compression, the crosswise path optimization method can enhance its compressive strength.
(4) Due to the perpendicular orientation of the load direction to the layer on the crosswise specimens, only the crosswise specimens manifest ductile fracture.
(5) The microstructures and pore sizes and distributions are similar among the four paths of the specimens, which demonstrates that the microscopic structure does not influence the strength of the specimens. The strength is only determined by the arrangement of the printed filaments.
The findings here provide a pathway to improve the strength of 3D-printed concrete by path optimization, boosting 3DPC’s extensive application in civil engineering. In a word, path optimization can indeed enhance the strength of 3DPC. It is necessary to choose the most appropriate printing path for different working conditions. But in this study, only four basic printing paths were tested. In further research, more intricate printing paths can be designed, or combinations of different printing paths can be explored. This can enhance the mechanical performance of 3D-printed concrete, not only improving its strength but also contributing to the aesthetic appeal of its structure.

Author Contributions

Methodology, X.J. and B.X.; Software, Y.L. (Yangbo Li); Formal analysis, Z.Y.; Data curation, X.J.; Writing—original draft, X.J. and Y.L. (Yujia Li); Writing—review & editing, Y.L. (Yangbo Li); Visualization, B.X. All authors have read and agreed to the published version of the manuscript.

Funding

This research received no external funding.

Data Availability Statement

The data presented in this study are available on request from the corresponding author.

Conflicts of Interest

The authors declare no conflict of interest.

References

  1. Hager, I.; Golonka, A.; Putanowicz, R. 3D printing of buildings and building components as the future of sustainable construction? Procedia Eng. 2016, 151, 292–299. [Google Scholar] [CrossRef]
  2. Zhu, B.; Pan, J.; Nematollahi, B.; Zhou, Z.; Zhang, Y.; Sanjayan, J. Development of 3D printable engineered cementitious composites with ultra-high tensile ductility for digital construction. Mater. Des. 2019, 181, 108088. [Google Scholar] [CrossRef]
  3. Feng, P.; Meng, X.; Chen, J.-F.; Ye, L. Mechanical properties of structures 3D printed with cementitious powders. Constr. Build. Mater. 2015, 93, 486–497. [Google Scholar] [CrossRef]
  4. Chung, J.; Lee, G.; Kim, J.-H. Framework for technical specifications of 3D concrete printers. Autom. Constr. 2021, 127, 103732. [Google Scholar] [CrossRef]
  5. Chen, Y.; Jansen, K.; Zhang, H.; Rodriguez, C.R.; Gan, Y.; Çopuroğlu, O.; Schlangen, E. Effect of printing parameters on interlayer bond strength of 3D printed limestone-calcined clay-based cementitious materials: An experimental and numerical study. Constr. Build. Mater. 2020, 262, 120094. [Google Scholar] [CrossRef]
  6. Vantyghem, G.; De Corte, W.; Shakour, E.; Amir, O. 3D printing of a post-tensioned concrete girder designed by topology optimization. Autom. Constr. 2020, 112, 103084. [Google Scholar] [CrossRef]
  7. Tay, Y.W.D.; Li, M.Y.; Tan, M.J. Effect of printing parameters in 3D concrete printing: Printing region and support structures. J. Am. Acad. Dermatol. 2019, 271, 261–270. [Google Scholar] [CrossRef]
  8. Ma, G.; Wang, L.; Ju, Y. State-of-the-art of 3D printing technology of cementitious material—An emerging technique for construction. Sci. China Technol. Sci. 2017, 61, 475–495. [Google Scholar] [CrossRef]
  9. Bos, F.; Wolfs, R.; Ahmed, Z.; Salet, T. Additive manufacturing of concrete in construction: Potentials and challenges of 3D concrete printing. Virtual Phys. Prototyp. 2016, 11, 209–225. [Google Scholar] [CrossRef]
  10. Xiao, J.; Ji, G.; Zhang, Y.; Ma, G.; Mechtcherine, V.; Pan, J.; Wang, L.; Ding, T.; Duan, Z.; Du, S. Large-scale 3D printing concrete technology: Current status and future opportunities. Cem. Concr. Compos. 2021, 122, 104115. [Google Scholar] [CrossRef]
  11. Panda, B.; Paul, S.C.; Mohamed, N.A.N.; Tay, Y.W.D.; Tan, M.J. Measurement of tensile bond strength of 3D printed geopolymer mortar. Measurement 2018, 113, 108–116. [Google Scholar] [CrossRef]
  12. Kruger, J.; Zeranka, S.; van Zijl, G. 3D concrete printing: A lower bound analytical model for buildability performance quantification. Autom. Constr. 2019, 106, 102904. [Google Scholar] [CrossRef]
  13. Mechtcherine, V.; Bos, F.P.; Perrot, A.; da Silva, W.R.L.; Nerella, V.N.; Fataei, S.; Wolfs, R.J.M.; Sonebi, M.; Roussel, N. Extrusion-based additive manufacturing with cement-based materials–production steps, processes, and their underlying physics: A review. Cem. Concr. Res. 2020, 132, 106037. [Google Scholar] [CrossRef]
  14. Buswell, R.A.; De Silva, W.R.L.; Jones, S.Z.; Dirrenberger, J. 3D printing using concrete extrusion: A roadmap for research. Cem. Concr. Res. 2018, 112, 37–49. [Google Scholar] [CrossRef]
  15. Muthukrishnan, S.; Ramakrishnan, S.; Sanjayan, J. Technologies for improving buildability in 3D concrete printing. Cem. Concr. Compos. 2021, 122, 104144. [Google Scholar] [CrossRef]
  16. Paul, S.C.; Tay, Y.W.D.; Panda, B.; Tan, M.J. Fresh and hardened properties of 3D printable cementitious materials for building and construction. Arch. Civ. Mech. Eng. 2018, 18, 311–319. [Google Scholar] [CrossRef]
  17. Revelo, C.F.; Colorado, H.A. Colorado, 3D printing of kaolinite clay ceramics using the Direct Ink Writing (DIW) technique. Ceram. Int. 2018, 44, 5673–5682. [Google Scholar] [CrossRef]
  18. De Schutter, G.; Lesage, K.; Mechtcherine, V.; Nerella, V.N.; Habert, G.; Agusti-Juan, I. Vision of 3D printing with concrete—Technical, economic and environmental potentials. Cem. Concr. Res. 2018, 112, 25–36. [Google Scholar] [CrossRef]
  19. Furet, B.; Poullain, P.; Garnier, S. 3D printing for construction based on a complex wall of polymer-foam and concrete. Addit. Manuf. 2019, 28, 58–64. [Google Scholar] [CrossRef]
  20. Lim, S.; Buswell, R.; Le, T.; Austin, S.; Gibb, A.; Thorpe, T. Developments in construction-scale additive manufacturing processes. Autom. Constr. 2012, 21, 262–268. [Google Scholar] [CrossRef]
  21. Qaidi, S.; Yahia, A.; Tayeh, B.A.; Unis, H.; Faraj, R.; Mohammed, A. 3D printed geopolymer composites: A review. Mater. Today Sustain. 2022, 20, 100240. [Google Scholar] [CrossRef]
  22. Perrot, A.; Rangeard, D.; Pierre, A. Structural built-up of cement-based materials used for 3D-printing extrusion techniques. Mater. Struct. 2015, 49, 1213–1220. [Google Scholar] [CrossRef]
  23. Zareiyan, B.; Khoshnevis, B. Effects of interlocking on interlayer adhesion and strength of structures in 3D printing of concrete. Autom. Constr. 2017, 83, 212–221. [Google Scholar] [CrossRef]
  24. Hambach, M.; Rutzen, M.; Volkmer, D. Properties of 3D-printed fiber-reinforced Portland cement paste. Cem. Concr. Compos. 2019, 79, 73–113. [Google Scholar] [CrossRef]
  25. Liu, M.; Huang, Y.; Wang, F.; Sun, J.; Ma, G. Tensile and flexural properties of 3D-printed jackets-reinforced mortar. Constr. Build. Mater. 2021, 296, 123639. [Google Scholar] [CrossRef]
  26. Li, Y.-F.; Tsai, P.-J.; Syu, J.-Y.; Lok, M.-H.; Chen, H.-S. Mechanical Properties of 3D-Printed Carbon Fiber-Reinforced Cement Mortar. Fibers 2023, 11, 109. [Google Scholar] [CrossRef]
  27. Li, Z.; Liu, H.; Nie, P.; Cheng, X.; Zheng, G.; Jin, W.; Xiong, B. Mechanical properties of concrete reinforced with high-performance microparticles for 3D concrete printing. Constr. Build. Mater. 2024, 411, 134676. [Google Scholar] [CrossRef]
  28. Alghamdi, H.; Neithalath, N. Synthesis and characterization of 3D-printable geopolymeric foams for thermally efficient building envelope materials. Cem. Concr. Compos. 2019, 104, 103377. [Google Scholar] [CrossRef]
  29. Alghamdi, H.; Nair, S.A.; Neithalath, N. Insights into material design, extrusion rheology, and properties of 3D-printable alkali-activated fly ash-based binders. Mater. Des. 2019, 167, 107634. [Google Scholar] [CrossRef]
  30. Li, Z.; Hojati, M.; Wu, Z.; Piasente, J.; Ashrafi, N.; Duarte, J.P.; Nazarian, S.; Bilén, S.G.; Memari, A.M.; Radlińska, A. Fresh and hardened properties of extrusion-based 3D-printed cementitious materials: A review. Sustainability 2020, 12, 5628. [Google Scholar] [CrossRef]
  31. Al-Qutaifi, S.; Nazari, A.; Bagheri, A. Mechanical properties of layered geopolymer structures applicable in concrete 3D-printing. Constr. Build. Mater. 2018, 176, 690–699. [Google Scholar] [CrossRef]
  32. Lim, J.H.; Zhang, X.; Ting, G.H.A.; Pham, Q.-C. Stress-cognizant 3D printing of free-form concrete structures. J. Build. Eng. 2021, 39, 102221. [Google Scholar] [CrossRef]
  33. Weng, Y.; Li, M.; Zhang, D.; Tan, M.J.; Qian, S. Investigation of interlayer adhesion of 3D printable cementitious material from the aspect of printing process. Cem. Concr. Res. 2021, 143, 106386. [Google Scholar] [CrossRef]
  34. Long, W.-J.; Lin, C.; Tao, J.-L.; Ye, T.-H.; Fang, Y. Printability and particle packing of 3D-printable limestone calcined clay cement composites. Constr. Build. Mater. 2021, 282, 122647. [Google Scholar] [CrossRef]
  35. Liu, Y.; Shen, J.; Li, Y.; Ge, X.; Li, Y. Enhanced high-strain-rate impact resistance of helicoidal composites by fused deposition modelling. Mech. Adv. Mater. Struct. 2021, 29, 7796–7808. [Google Scholar] [CrossRef]
  36. Lu, X.; Zhang, X.; Li, Y.; Shen, Y.; Ma, Y.; Meng, Y. Enhanced Low-Velocity Impact Resistance of Helicoidal Composites by Fused Filament Fabrication (FFF). Polymers 2022, 14, 1440. [Google Scholar] [CrossRef]
  37. Yan, R.; Wang, Y.; Luo, P.; Li, Y.; Lu, X. Fused filament fabrication of continuous optic fiber reinforced polylactic acid composites. Rapid Prototyp. J. 2021, 28, 766–776. [Google Scholar] [CrossRef]
  38. Moini, M.; Olek, J.; Youngblood, J.P.; Magee, B.; Zavattieri, P.D. Additive manufacturing and performance of architectured cement—Based materials. Adv. Mater. 2018, 30, e1802123. [Google Scholar] [CrossRef]
  39. Anderson, T.L. Fracture Mechanics: Fundamentals and Applications; CRC Press: Boca Raton, FL, USA, 2017. [Google Scholar]
  40. Breseghello, L.; Naboni, R. Toolpath-based design for 3D concrete printing of carbon-efficient architectural structures. Addit. Manuf. 2022, 56, 102872. [Google Scholar] [CrossRef]
Figure 1. SEM microscopic images of main ingredients: (a) cement, (b) fly ash, (c) silica fume, and (d) SDSC.
Buildings 14 00455 g001
Figure 2. Particle size distribution of different raw materials.
Buildings 14 00455 g002
Figure 3. (a) Extruder with 150 mm height and 6 mm nozzle; (b) customized concrete 3D printer.
Buildings 14 00455 g003
Figure 4. Modeling diagrams of four printing paths: crosswise (a), vertical (b), arched (c), and diagonal (d).
Buildings 14 00455 g004
Figure 5. Four different specimens: crosswise (a), vertical (b), arched (c), and diagonal (d).
Buildings 14 00455 g005
Figure 6. Schematic diagram of flexural test loading of four different printing paths: crosswise (a), vertical (b), arched (c), and diagonal (d).
Buildings 14 00455 g006
Figure 7. Machines used to capture fracture process of flexural test: (a) universal testing machine and (b) high-speed camera.
Buildings 14 00455 g007
Figure 8. Schematic diagram of compressive test loading of four different printing paths: crosswise (a), vertical (b), arched (c), and diagonal (d).
Buildings 14 00455 g008
Figure 9. Force–displacement diagram of four printing paths: crosswise (a), vertical (b), arched (c), and diagonal (d).
Buildings 14 00455 g009
Figure 10. (a) Flexural and (b) compressive strength diagrams of specimens for each printing path.
Buildings 14 00455 g010
Figure 11. (ad) DIC analysis diagram of fracture process of crosswise specimens.
Buildings 14 00455 g011
Figure 12. (ad) DIC analysis diagram of fracture process of vertical specimens.
Buildings 14 00455 g012
Figure 13. (ad) DIC analysis diagram of fracture process of arched specimens.
Buildings 14 00455 g013
Figure 14. (ad) DIC analysis diagram of fracture process of diagonal specimens.
Buildings 14 00455 g014
Figure 15. (a,e) Cross-sectional and mesoscale views of crosswise specimens; (b,f) cross-sectional and mesoscale view of vertical specimens; (c,g) cross-sectional and mesoscale view of arched specimens; (d,h) cross-sectional and mesoscale views of diagonal specimens.
Buildings 14 00455 g015
Figure 16. Comparison of total porosity (a) and pore area (b) of specimens made by four different paths.
Buildings 14 00455 g016
Figure 17. Comparison of pore distribution of specimens made by four different paths: crosswise (a), vertical (b), arched (c), and diagonal (d).
Buildings 14 00455 g017
Figure 18. SEM microscopic pictures, magnified 5000 times, of specimens in four printing paths: crosswise (a), vertical (b), arched (c), and diagonal (d).
Buildings 14 00455 g018
Table 1. Raw materials used for 3DPC material by mass ratio (g).
CementFly AshSilica FumeSandWaterSDSCWater Reducer
100050010062570018.512.5
Table 2. Chemical composition of source materials.
Components of BindersChemical Composition (Mass %)
CaOSiO2Fe2O3Al2O3MgOSO3
Cement>6523–254–65–85–7-
Fly ash8–1055–615–817–203–5<1
Silica fume0.1–195–980.1–20.5–2--
Sand<195–99<1<1<1-
Table 3. Fracture results of specimens with four different printing paths.
CrosswiseVerticalArchedDiagonal
FQ (kN)0.60.842.51.79
GQ (N·m−1)221161604487
KQ (kN·m−1.5)42960017861278
Disclaimer/Publisher’s Note: The statements, opinions and data contained in all publications are solely those of the individual author(s) and contributor(s) and not of MDPI and/or the editor(s). MDPI and/or the editor(s) disclaim responsibility for any injury to people or property resulting from any ideas, methods, instructions or products referred to in the content.

