Article

Mechanical Behaviors and Structure Safety of a Tunnel Crossing a Water-Rich Fault Fracture Zone—A Case Study

1
School of Civil Engineering, Chongqing Jiaotong University, Chongqing 400074, China
2
China Railway Construction Kunlun Investment Group Co., Ltd., Chengdu 610040, China
3
School of Architecture and Civil Engineering, Xihua University, Chengdu 610039, China
4
School of Civil Engineering, Southwest Jiaotong University, Chengdu 610031, China
*
Author to whom correspondence should be addressed.
Buildings 2024, 14(2), 475; https://doi.org/10.3390/buildings14020475
Submission received: 10 January 2024 / Revised: 5 February 2024 / Accepted: 7 February 2024 / Published: 8 February 2024
(This article belongs to the Section Building Structures)

Abstract

:
To study the potential disasters caused by tunnels crossing water-abundant fault areas, this study takes the Jinyunshan Tunnel as an example, and studies the groundwater flow law between different rock layers, the interaction between surrounding rock hydrostatic pressure and soil pressure, and the mechanical features and safety of the lining during construction by combining field tests and finite element simulation analysis. The results show that the displacement change rate of the tunnel vault reaches 2.8 mm/d, and the maximum earth pressure and hydrostatic pressure are 2.3 MPa and 1.15 MPa, respectively, both at the bottom of the tunnel in section II. When the tunnel enters the fault fracture zone from the V surrounding rock, the bending moment of the lining increases by 222.78% at the left haunch and 60.87% at the bottom of the right wall. The axial force of the right spandrel increases by 2579.2%, and the left spandrel increases by 221.18%. The safety factor of the two sections is greater than 2.4, indicating that the overall structure is in a safe state, but the safety factor of the second right shoulder is 2.54, which is close to the safety threshold of 2.4. The research results provide a basis for the safety design and construction safety of tunnels through water-rich sections in similar fault fracture zones, and provide a reference for reducing groundwater loss and protecting ecological vegetation.

1. Introduction

When a tunnel passes through a water-rich fracture zone area, it is susceptible to risks such as collapse, water gushing, significant deformation, surface water depletion, groundwater loss, and surface collapse, which may hinder the construction of the project and cause casualties [1,2,3,4,5,6,7]. Notable projects exemplifying these scenarios include the Dazhushan tunnel, Tabriz Metro tunnel, Yulinzi tunnel, Bifengsi tunnel, Qilianshan tunnel, etc. [8,9,10,11,12]. Despite the increasing number of tunnels in fracture zones with abundant water resources, the development of design theories for these tunnels has lagged behind the progress made in engineering construction. A series of technical challenges needs to be addressed, including the safety assessment of linings in water-abundant fracture zones, the distribution pattern of external hydrostatic pressure, and the mechanical features of the lining under the combined influence of water and soil pressures. In response to such problems, relevant scholars at home and abroad have conducted a lot of research [13,14,15,16,17,18,19].
The existing literature provides a substantial body of research on the subject of the influence factors within fault areas on the surrounding rock of tunnels, conducted by numerous scholars employing experimental and numerical simulation methodologies. Jeon et al. [20] investigated the influence of grouting in fault regions and the effects of weak rock mass on tunnel stability through a model test and numerical simulation. His research results show that the displacement deformation and plastic zone of the surrounding rock gradually increase as the distance between the excavation face and the fault zone decreases. Kun [21] conducted an in-depth analysis of the effects of fault zones on shallow buried tunnels, utilizing both field tests and computer simulations. The study revealed that the adverse impacts of fault fracture zones on shallow buried tunnels could be effectively mitigated by limiting the use of bolts, employing face nails, and through implementing umbrella arc and jet grouting techniques. Su [22] simulated the natural process of fault formation in fractured rock mass in the laboratory. The results demonstrated that compared to intact rocks mass, the strength of fractured rocks mass decreases obviously and deformation increases, with the degradation index ranging from 22.79% to 84.06%. Zhang et al. [23] used finite element analysis to study the variation rules of the displacement, stress, and plastic zones of shotcrete lining under different fault positions and thicknesses. They derived a multitude of approximate formulas applicable to fracture zone parameters from the deformation and strength equivalence theory. Huang [24] employed a physical model test and non-contact digital technology to investigate the displacement and deformation of tunnel rock mass, and examined the failure mechanism of the fault. The study revealed that the fracture zone near the spandrel exhibits a strain degradation effect on the stability of the adjacent rocks. Wang et al. [25] examined the processes of displacement, plastic expansion, and stress during the failure process of tunnel rock mass and discovered that the deep-buried soft rock roadway exhibits several distinct failure modes, including significant deformation, severe plastic deformation of the tunnel rock mass, and high stress concentration. Lei et al. [26] simulated the process of fluid flow into complex faults, and analyzed the laws of pressure diffusion, fracture development, damage propagation, and induced microseismical activity. The research shows that the boundaries of the fault zone are obvious, and it has the characteristics of low permeability for energy storing water and high permeability for destroying rock mass, while the failure area is defined with the presence of a fracture network. Furthermore, it was observed that the fracture density decreases exponentially with the distance from fault location. Fang [27] investigated the impact of fracture region positioning on the lining of underwater tunnels via numerical simulation. The findings indicate that as the fault region elevates above the tunnel axis, the displacement of the rock mass within the arch crown and spandrel becomes increasingly prominent, with the bending moment and axial force at the arch crown of the lining reaching their maximum. When the fault region extends across the entire tunnel, the safety of the lining reaches its minimum, accompanied by transverse displacement of the rock mass at the inverted arch. Li et al. [28] developed a two-dimensional fracture pore space model associated with fault development, employing area balance and geometric relationships. The results demonstrate that the geometric structure of the fault region, the physical properties of the medium in the fault, and the deformation mechanics influence the porosity of the fault slip layer and the generation and spatial distribution of pores in the fracture zone. Li [29] conducted an in-depth examination of the rupture damage mechanism within the rock mass stability concentration zone at the Jinchuan Hydropower Station spillway hole. The study revealed a significant correlation between the distribution of micro seismic events and the underlying geological conditions, as well as the construction process.
Percolation stress coupling theory has attracted the attention of numerous researchers, who have explored its application and development. Shrestha [30] examined the impact of groundwater on fault rock mass, revealing that hydrostatic pressure of less than 0.15 MPa led to an increase in deformation of up to 30%. Wu et al. [31] investigated the nonlinear dynamics of water burst using the Darcy–Brinkman flow equation, aiming to analyze changes in flow velocity and pore pressure when tunneling through the fracture zone. Their findings indicate that the pore pressure and velocity in front of the tunnel increase as the excavation angle decreases, while the pore pressure away from the fault area is higher than that through the fault region. As the working face approaches the fracture zone, the pore pressure decreases, and the flow in front of the working face increases. The water burst rate is the highest in the middle of the fault region, and the rate decreases with distance from the fault. Huang et al. [12] introduced a comprehensive water-bearing fault-prediction system that accurately predicted the geologic feature and spatial position of water-bearing faults in front of the tunnel, and detailed the application of this system in the Bifengsi high-speed railway tunnel. Wang et al. [32] conducted model tests to investigate the influences of filler ratio, thickness of fill, pore pressure, and the surrounding rock pressure within the fault. They obtained the Osmotic evolution law of the fault zone under different filling levels. An increase in seepage pressure leads to a more prominent division of the three-phase seepage state in fault-slip zones. This seepage pressure results in the erosion and loss of the backfill and water inflow. As the scale and development length of the fault increase, the risk of water burst also escalates. Wei et al. [33] used 3D discrete crack grid modeling technology to study the influence of cracks on underground excavation. Their research indicates that fracture strength primarily determines the stress and displacement deformation in rock masses. To uncover the inherent characteristics of these faults, Cheng et al. [34] studied the influence of time on strike-slip fault properties and activity intensity through numerical simulation. The findings reveal that the main feature of the fault segment is the near-vertical fracture, which presents the “ribbon” and “dolphin” effect in space. Chen et al. [35] adopted numerical simulation techniques to investigate the effects of factors such as the dip angle, fault width, time effects, activity rate, and friction coefficient within fault regions on the stability of rock masses. Their study demonstrated that these factors have varying degrees of influence on the surrounding rock of tunnels. Liu et al. [36] proposed a disaster-causing-factor evaluation system, which combined fuzzy synthetic evaluation and analytical hierarchy processes to optimize the early-warning and risk management of engineering disasters. The results indicate that this evaluation index possesses significant engineering practicality. Li et al. [37] utilized a numerical simulation approach, exemplified by the Xintian Coal Mine in Guizhou, to examine the process of roadway water inrush during roadway excavation. Their findings suggest that the primary factors influencing the safety thickness of water inrush are rock mass grade, depth of roadway, and pressure of fault water. Sun et al. [38] on the basis of field investigation and the study of joint structures, combined digital imaging technology with image processing software to put forward the concept and calculation method of fracture degree. It can quantitatively describe the fracture degree of rock mass, so that suitable reinforcement measures can be taken for the rock mass with different fracture degrees, and the rock mass can be classified using the proposed fracture degree. The preponderance of research on the seepage field and structural deformation of tunnels in water-abundant fault fracture areas is derived from numerical simulations or simplified empirical formulae, which possess limited applicability in engineering and fail to capture the authentic stress characteristics of tunnel lining structures and rock masses. In this domain, systematic research remains sparse. Field monitoring, which can better reflect the actual stress profiles of tunnel engineering, is still in its embryonic phase, primarily comprising single tests and evaluations. In addition, the research on combining in situ monitoring and numerical simulation with theory is still lacking. The excavation of a tunnel alters the initial stress field and seepage field of the rock mass, leading to a redistribution of these fields. This change in the seepage field, in turn, impinges on the stress state of the rock mass, prompting modifications in its rock structure. Consequently, the modification of the stress state within the rock mass also affects its seepage characteristics. The interdependence of the seepage and stress fields exerts a complex influence on both the supporting structure and the rock mass itself. Together, these fields compromise the rock mass’s inherent ability to stabilize itself, thereby increasing the load on the support structure. In extreme cases, this situation can lead to catastrophic events such as tunnel collapses or mud and water inrushes. To ensure that the construction of the tunnel does not impact groundwater recharge, an eco-friendly approach is adopted, promoting sustainability in the environment.
This study, using the Jinyunshan Tunnel as a case study, employs field tests and theoretical analyses to unravel the spatial–temporal evolution of groundwater across different rock layers, and investigates the mutual effect between groundwater pressure and soil pressure on the surrounding rock during tunnel excavation. Furthermore, the mechanical features and safety of lining are examined. Integration with a three-dimensional fluid–solid coupling calculation of the tunnel validates the reliability of site monitoring results and the practicability of excavation methods. The research results provide a reference for the safe construction selection of similar projects. At the same time, it can also reduce groundwater loss and protect ecological vegetation.

2. Project Description

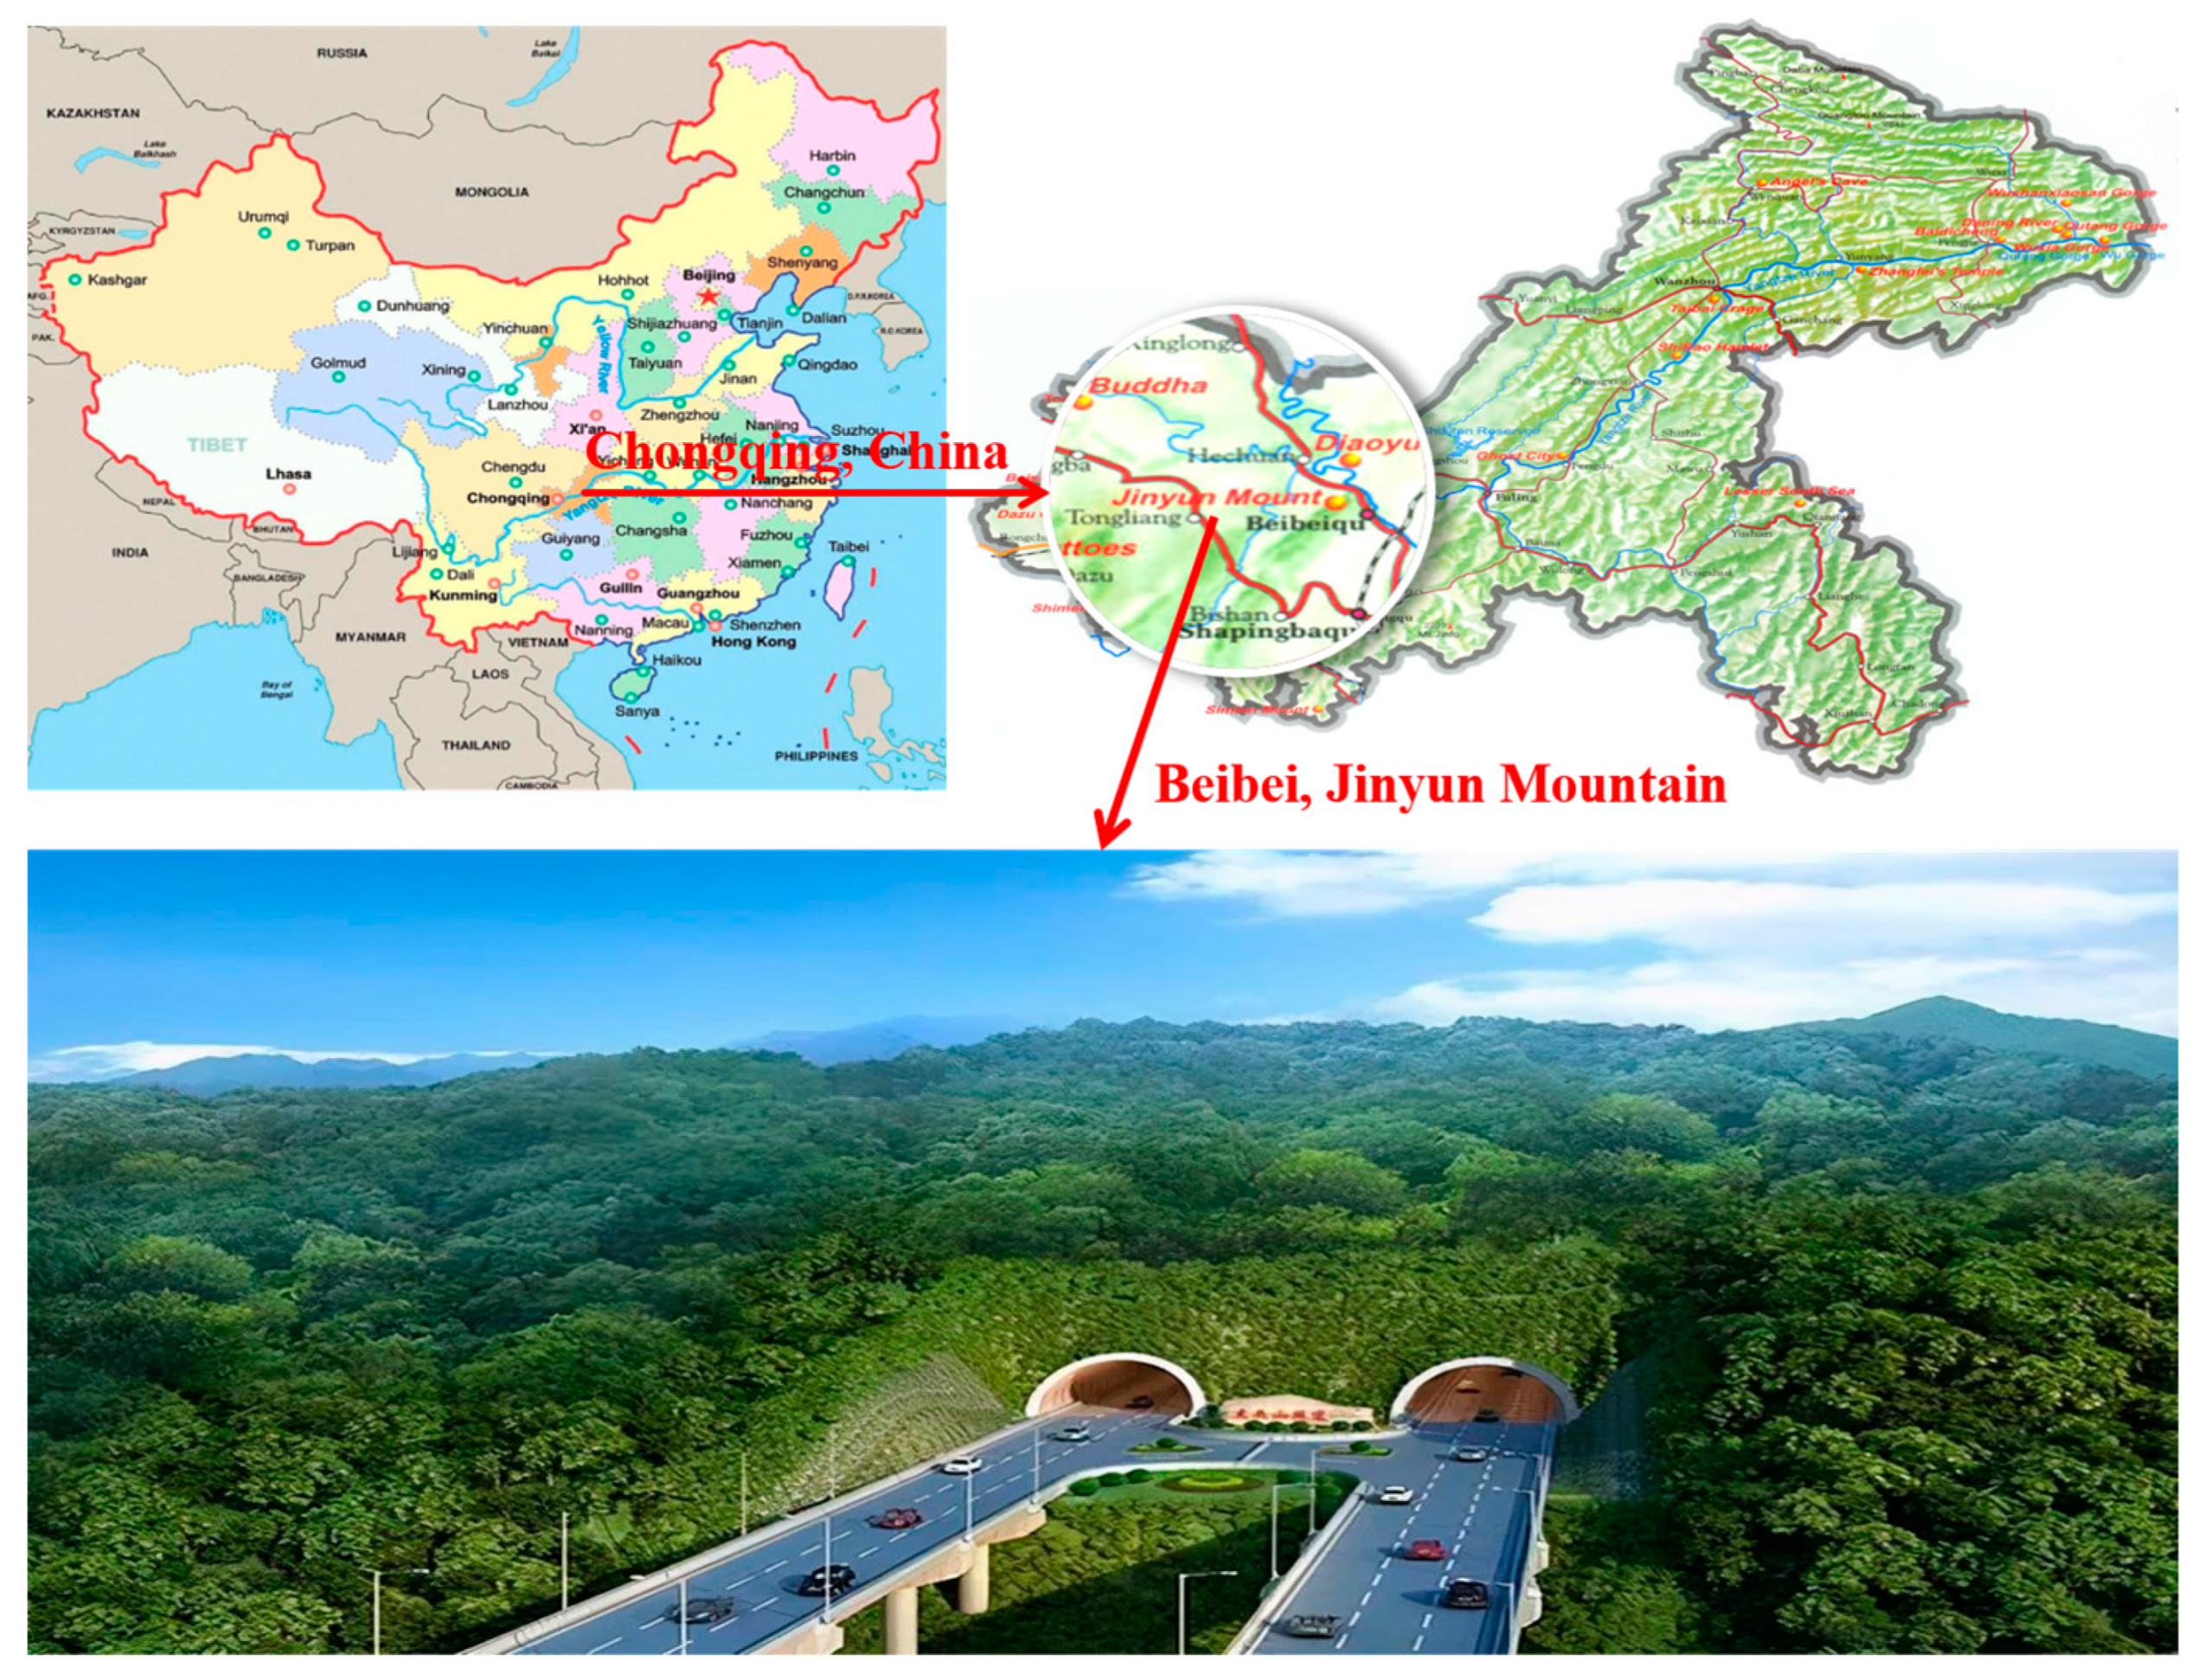
2.1. Engineering Overview

This study relies on the Jinyunshan tunnel at the Sui-Yu expressway complementary line (Beibei-Tongliang section) in Chongqing city, China, to investigate the rock mass deformation and the mechanical behaviors of the support structure when the tunnel crosses the water-abundant fault area. The Jinyunshan mountain, which is located in the central region of the bar-shaped mountain range, is the small-type branch of Huaying mountain. Its lateral topography and geomorphology are strictly controlled with the geological structure, showing a pattern of a wide trough valley and anticline mountain. The east and west sides of the Jinyunshan mountain are an oblique trough area, with the erosion of hilly terrain and the regional erosion datum. The Jinyunshan tunnel is a separate double-hole tunnel. The left tunnel is 2828 m long, with an elevation of 303.980–345.588 m. The right tunnel is 2845 m long, with an elevation of 303.978–345.815 m. It is buried at a maximum depth of 180.4 m, and the excavation height and span are about 15.5 m and 17.5 m, respectively. A fault zone (F1) is developed in the tunnel site, with a fault distance of 40–150 m and a dip angle of 60–85°. The rock mass near the fault is broken, and the occurrence is chaotic. Drill cores reveal that the F1 fault has extended to the karst trench valley section, and there is abundant water within the fault. The geographic position of the Jinyunshan tunnel is presented in Figure 1.

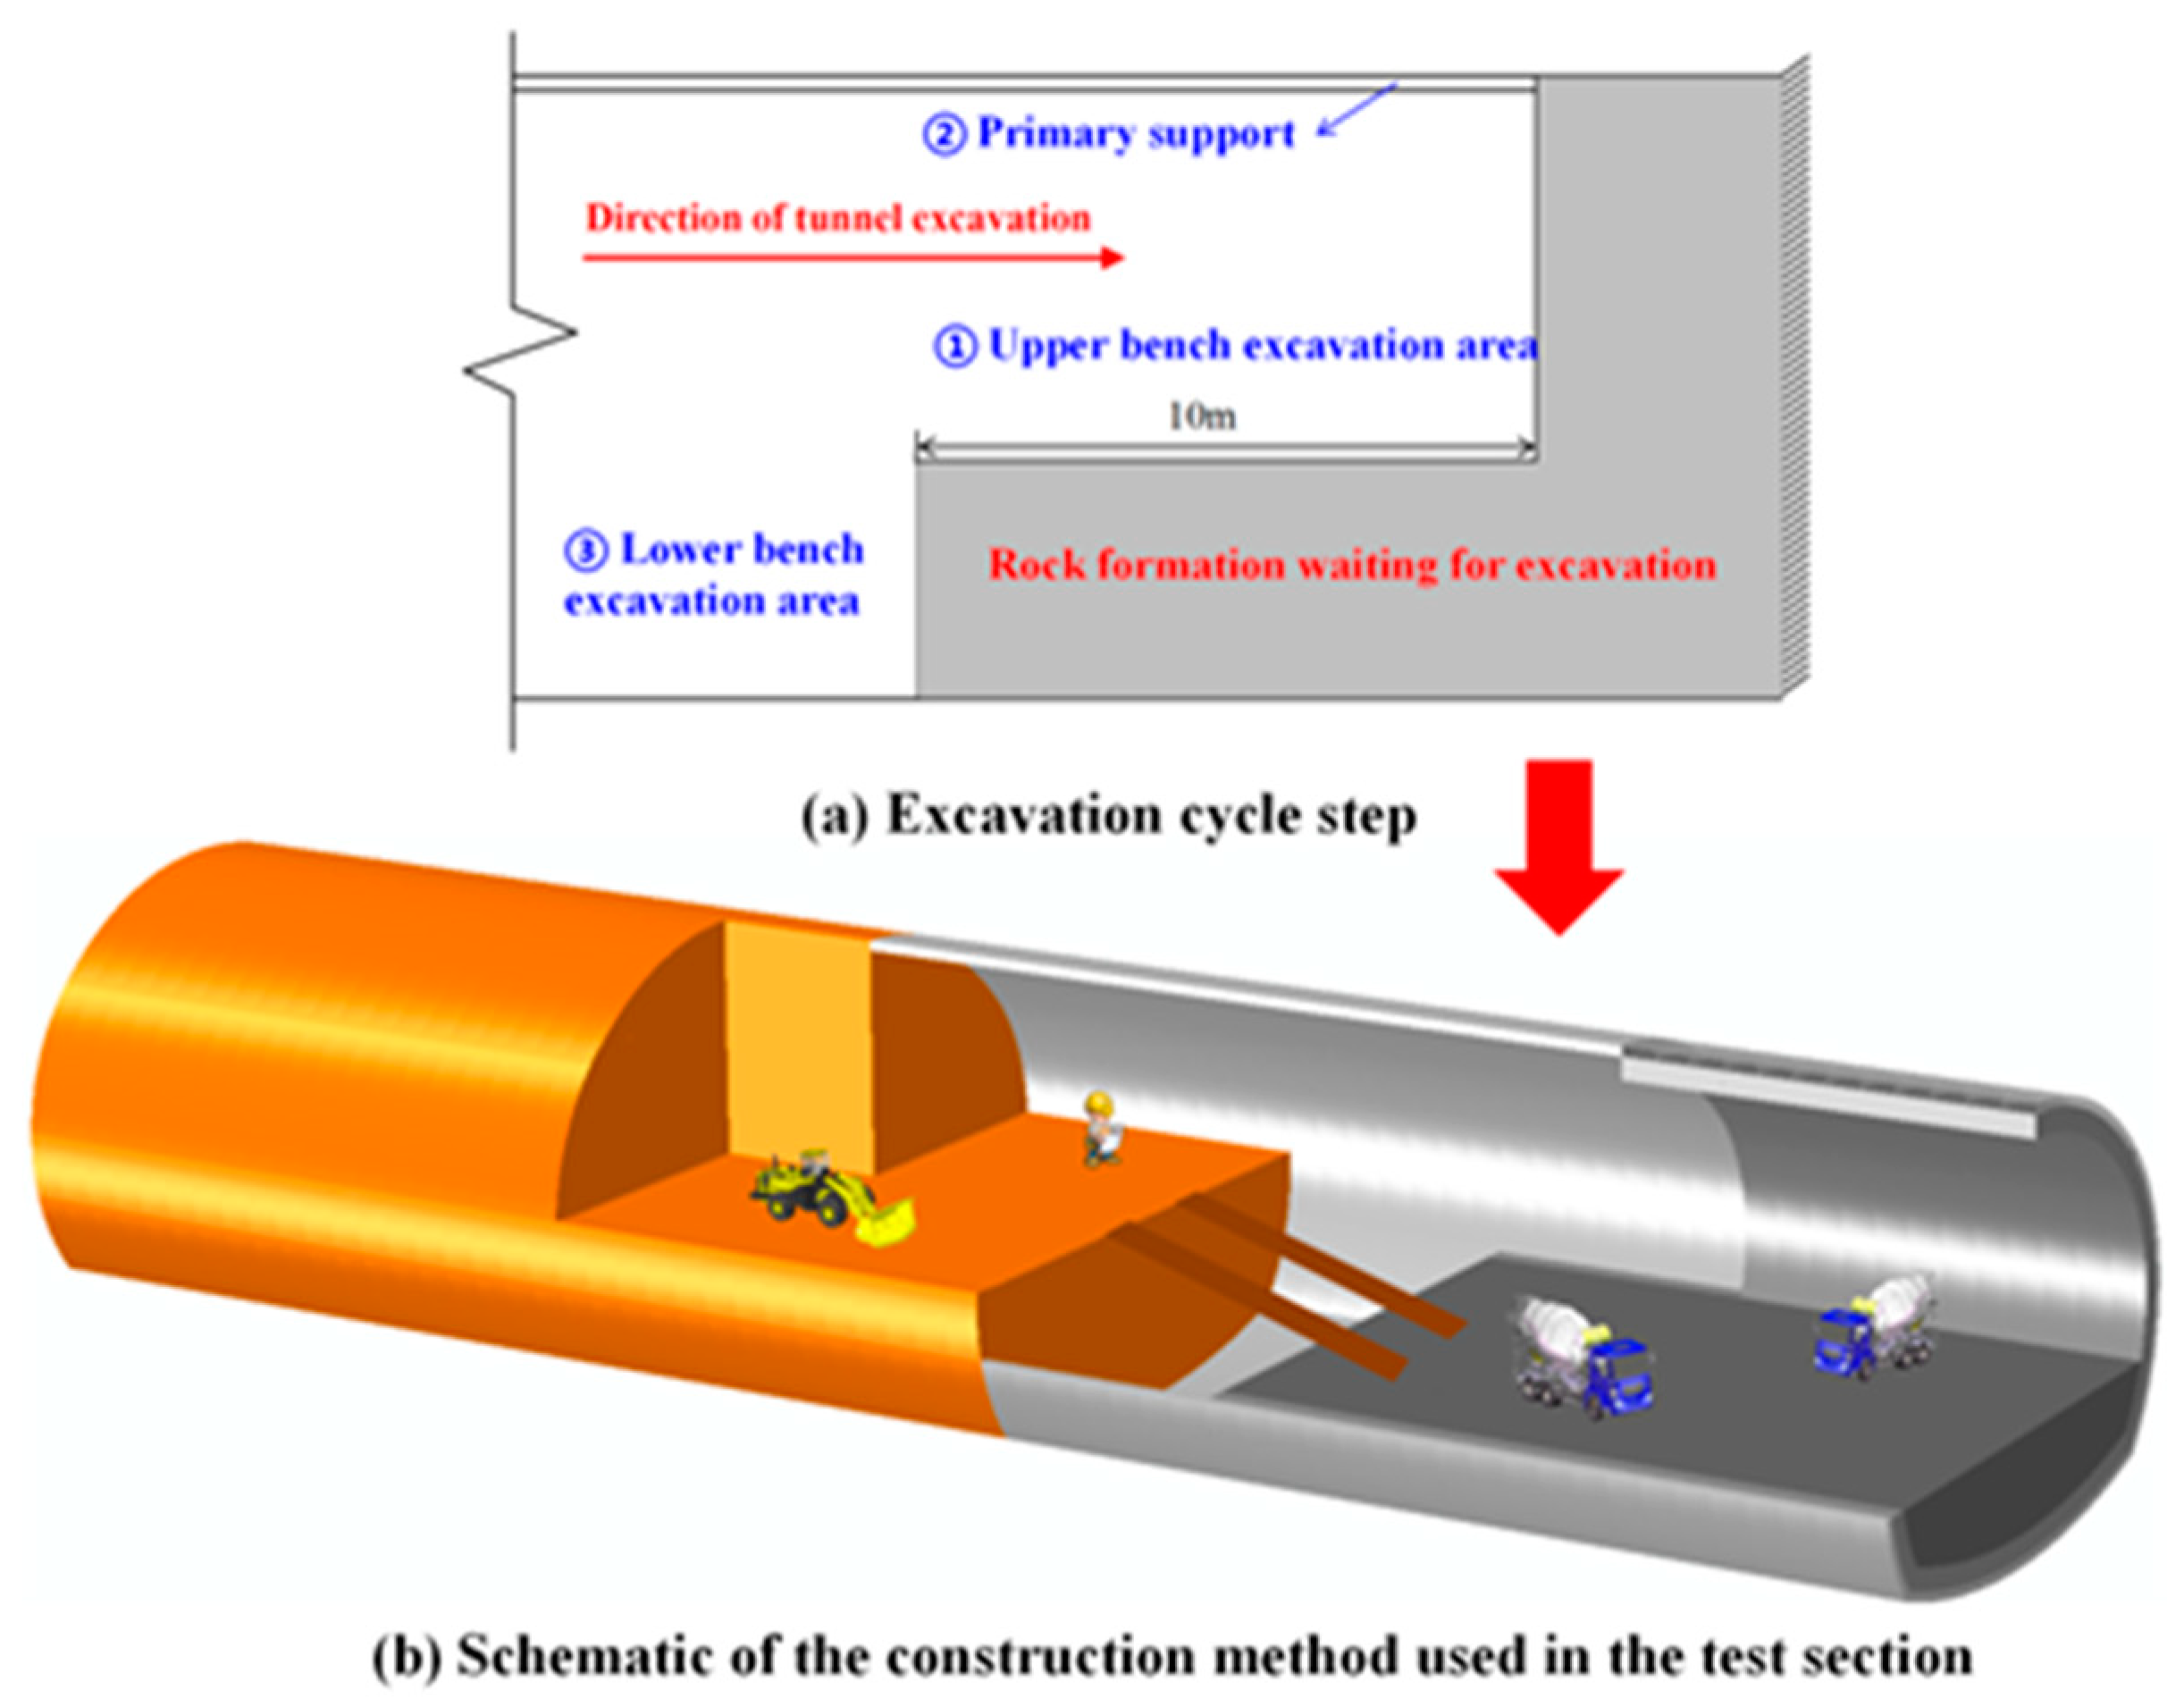
2.2. Excavation Method

The commonly used methods of tunnel excavation include the full-section excavation method, the step method, the middle partition wall method, and so on. Because the step method can increase the working face, the front and back interference is small, which is conducive to mechanized operation and high excavation efficiency, so the step method is the most commonly used method. The two-bench tunneling method is adopted for the Jinyunshan tunnel crossing the water-abundant fault area. The upper bench of the rock mass is first excavated, followed by the installation of temporary support on the excavated part, and then the lower bench of rock mass is excavated and the temporary support is installed, and the process is cyclic in sequence. The distance between the upper and lower bench excavation faces is 10 m. The construction of the lining starts when the location with initial support installed is 30 m away from the upper bench excavation face. The specific construction steps are illustrated in Figure 2.

3. Field Monitoring of Tunnel in Water-Abundant Fault Zone

3.1. Field Monitoring Program

The water-abundant fault area in the ZK4+880–ZK4+940 sections of Jinyunshan tunnel is selected for study. Among them, the monitoring section I is in grade V surrounding rock, while the monitoring section II is in the fault fracture zone, and both sections are 5 m away from the fault interface. The water and soil pressures in the rock mass outside the primary support are monitored with a DMKY-type pore water pressure transducer and DMTY-type soil pressure gauge, respectively. The strain on the secondary lining is monitored by a vibrating string concrete strain gage, while the displacement of the primary support is measured using a Laika TS09 plus-type Total station. The arrangement of monitoring components and monitoring points’ distribution are presented in Figure 3.

3.2. Analysis of In Situ Monitoring Results

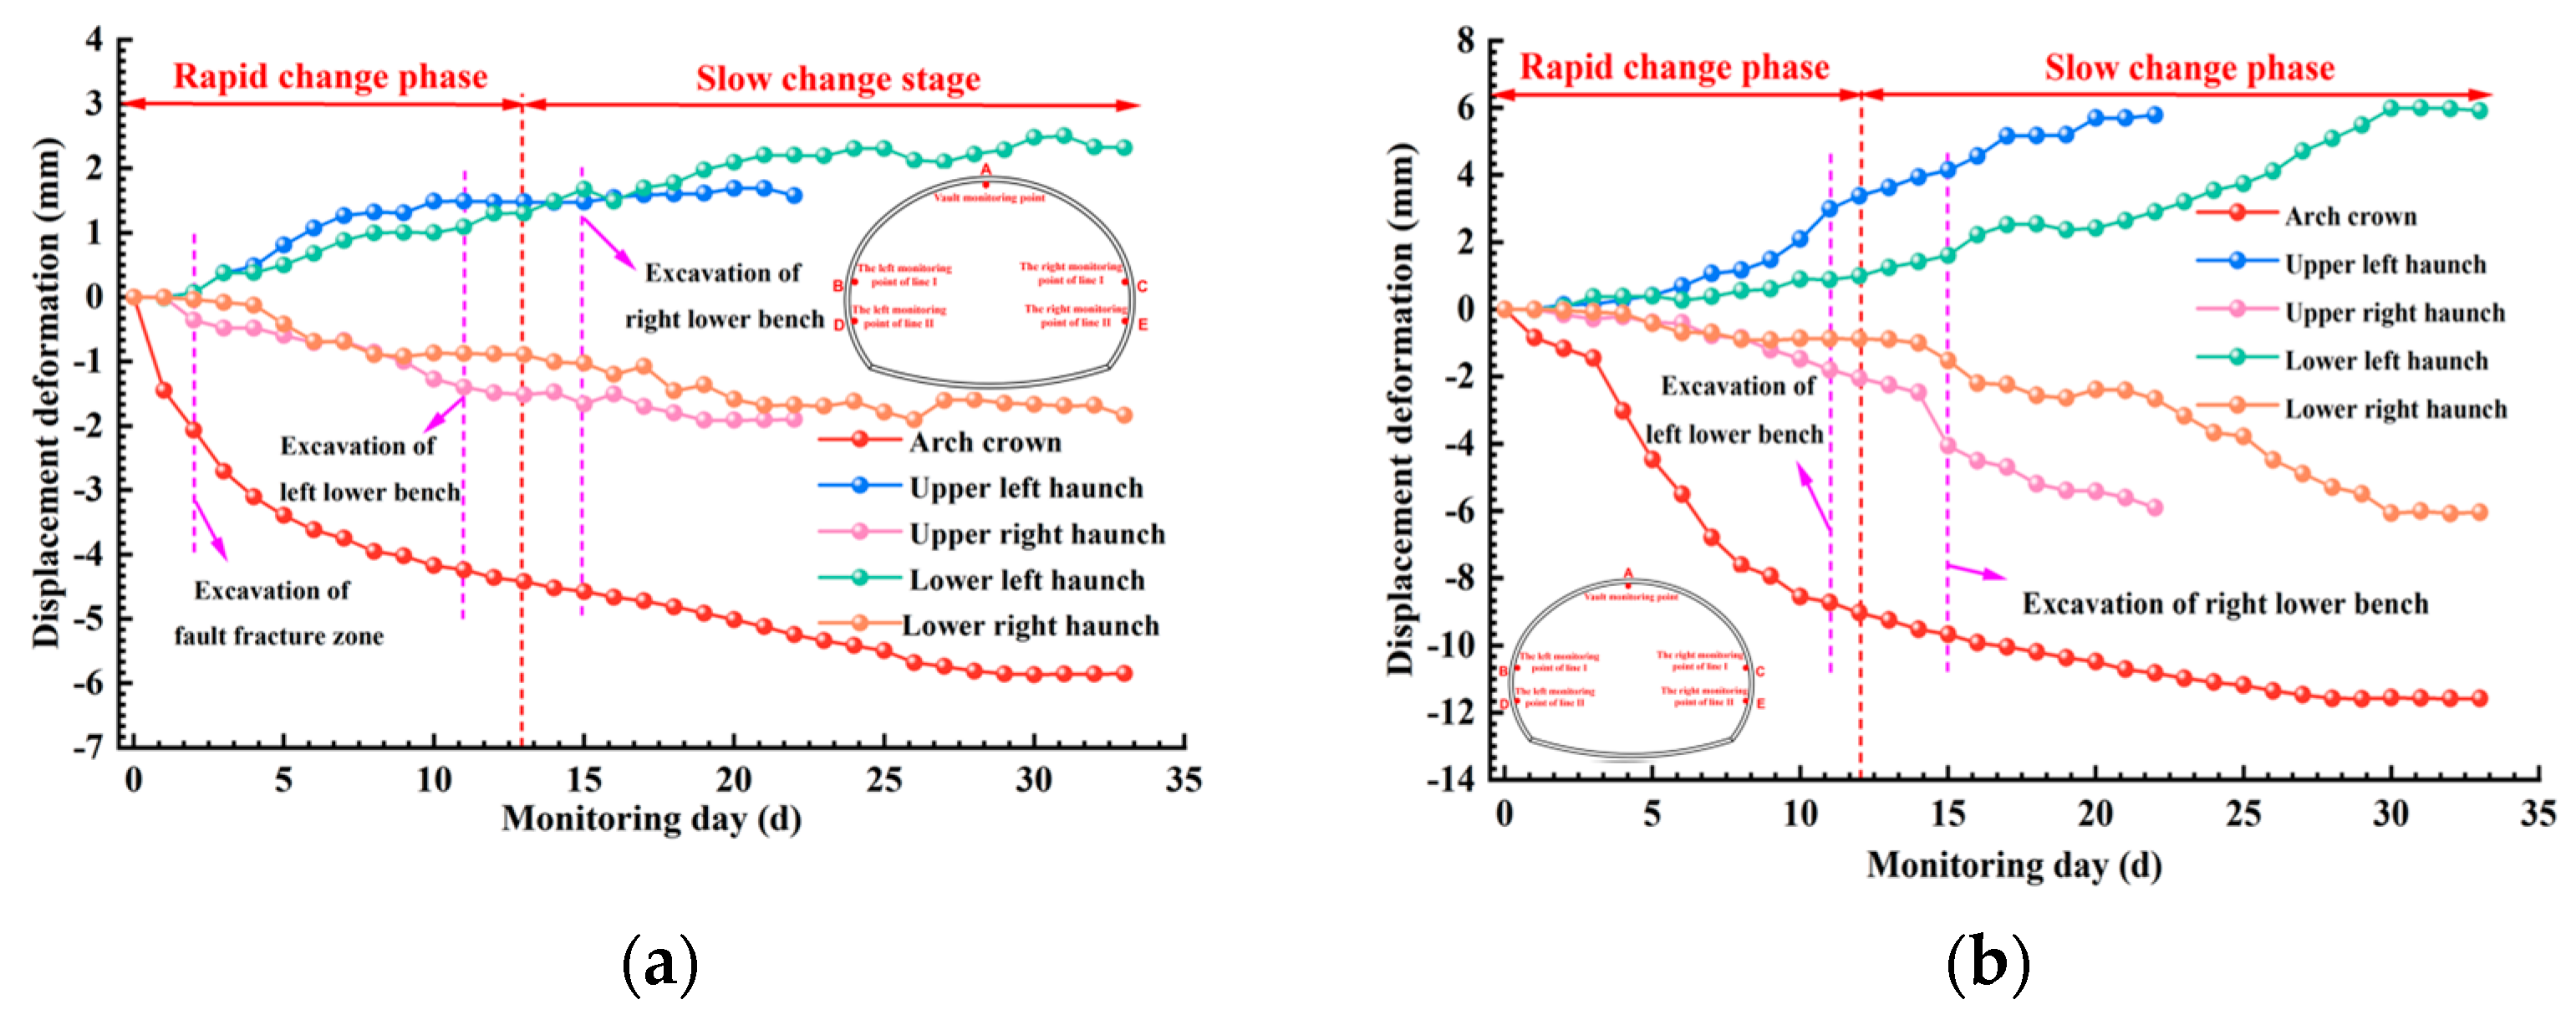
3.2.1. Vertical Displacement

The time-dependent displacement curves captured in the field monitoring are plotted in Figure 4. It is observed that the displacement curve of rock mass is roughly divided into two phases. The first phase is the rapid deformation phase (i.e., the upper bench excavation phase), in which the excavated rock mass is subjected to great disturbances with high frequency, and the deformation develops rapidly. The displacement in this phase accounts for 60–75% of the final cumulative displacement. The second phase is the slow deformation phase (i.e., the lower bench excavation phase), in which the rock mass is disturbed to some extent, but the disturbance has less impact compared to the upper bench excavation phase. The displacement in this phase accounts for only 25–40% of the final cumulative displacement.
The closer the excavation surface is to the fault area, the greater the arch crown settlement and the slower the rate of displacement development is at the arch haunch. This is because only the upper part of rock mass is excavated during this phase, while the lower part of the rock mass is still able to resist the deformation at the arch haunch. The vault settlement at section I continues to develop after the excavation face crosses the fault fracture zone. The rate of vault settlement gradually decreases until it stabilizes, only when sections I and II are more than 20 m and 24 m away from the face, respectively. The 2/3 of the total displacement at both sections occurs in the 1/3 of the monitoring period, and the final vault settlement at section II is one time larger than that at section I. Both the displacements and the rate of displacement growth at the vault are larger than those at the arch haunch in the two sections.

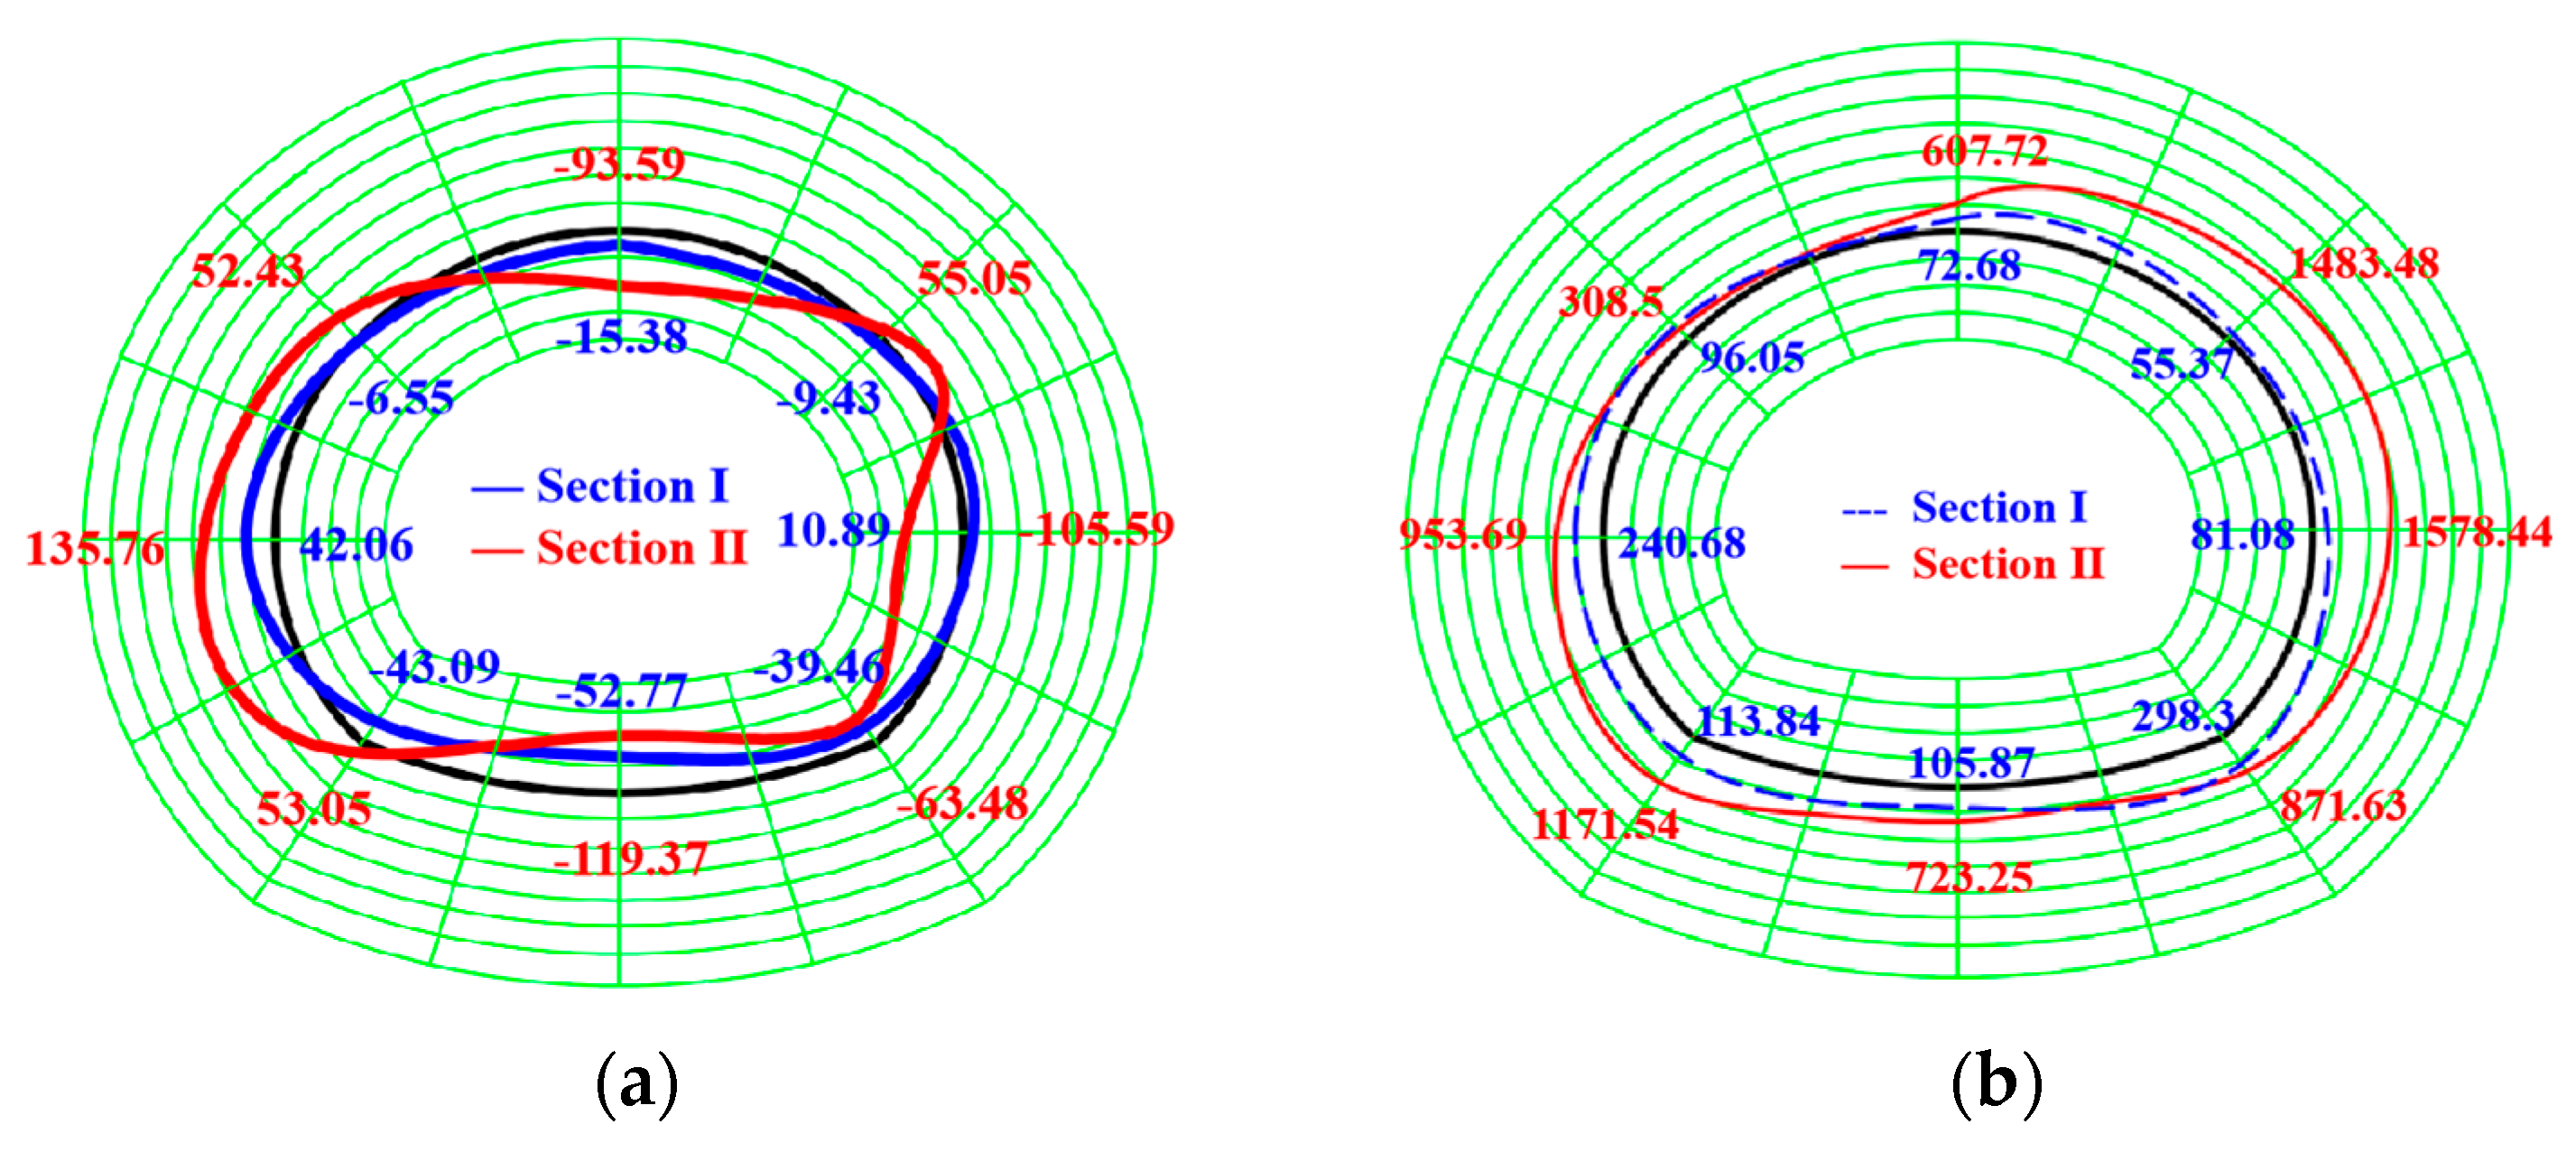
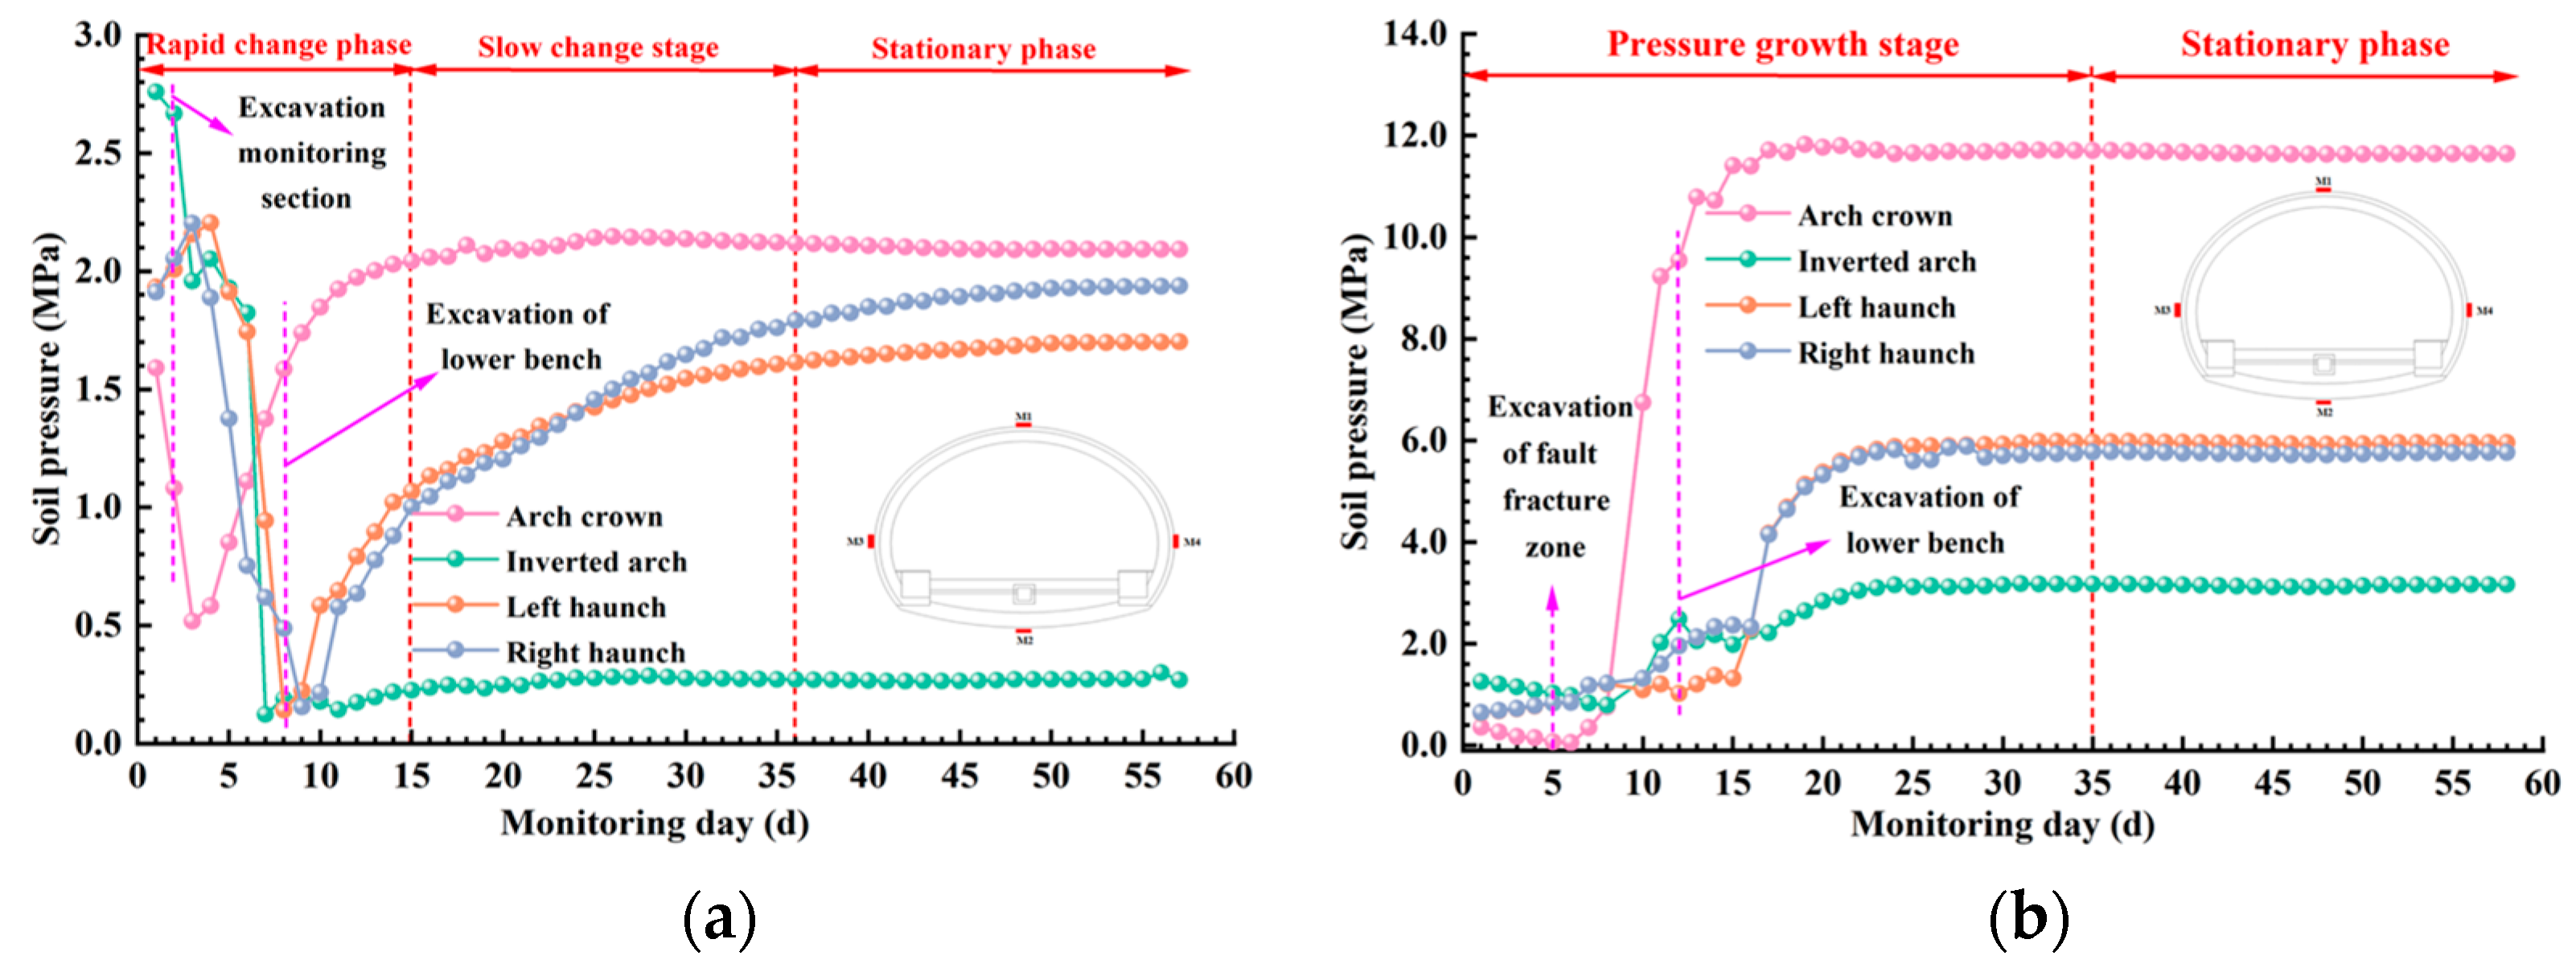
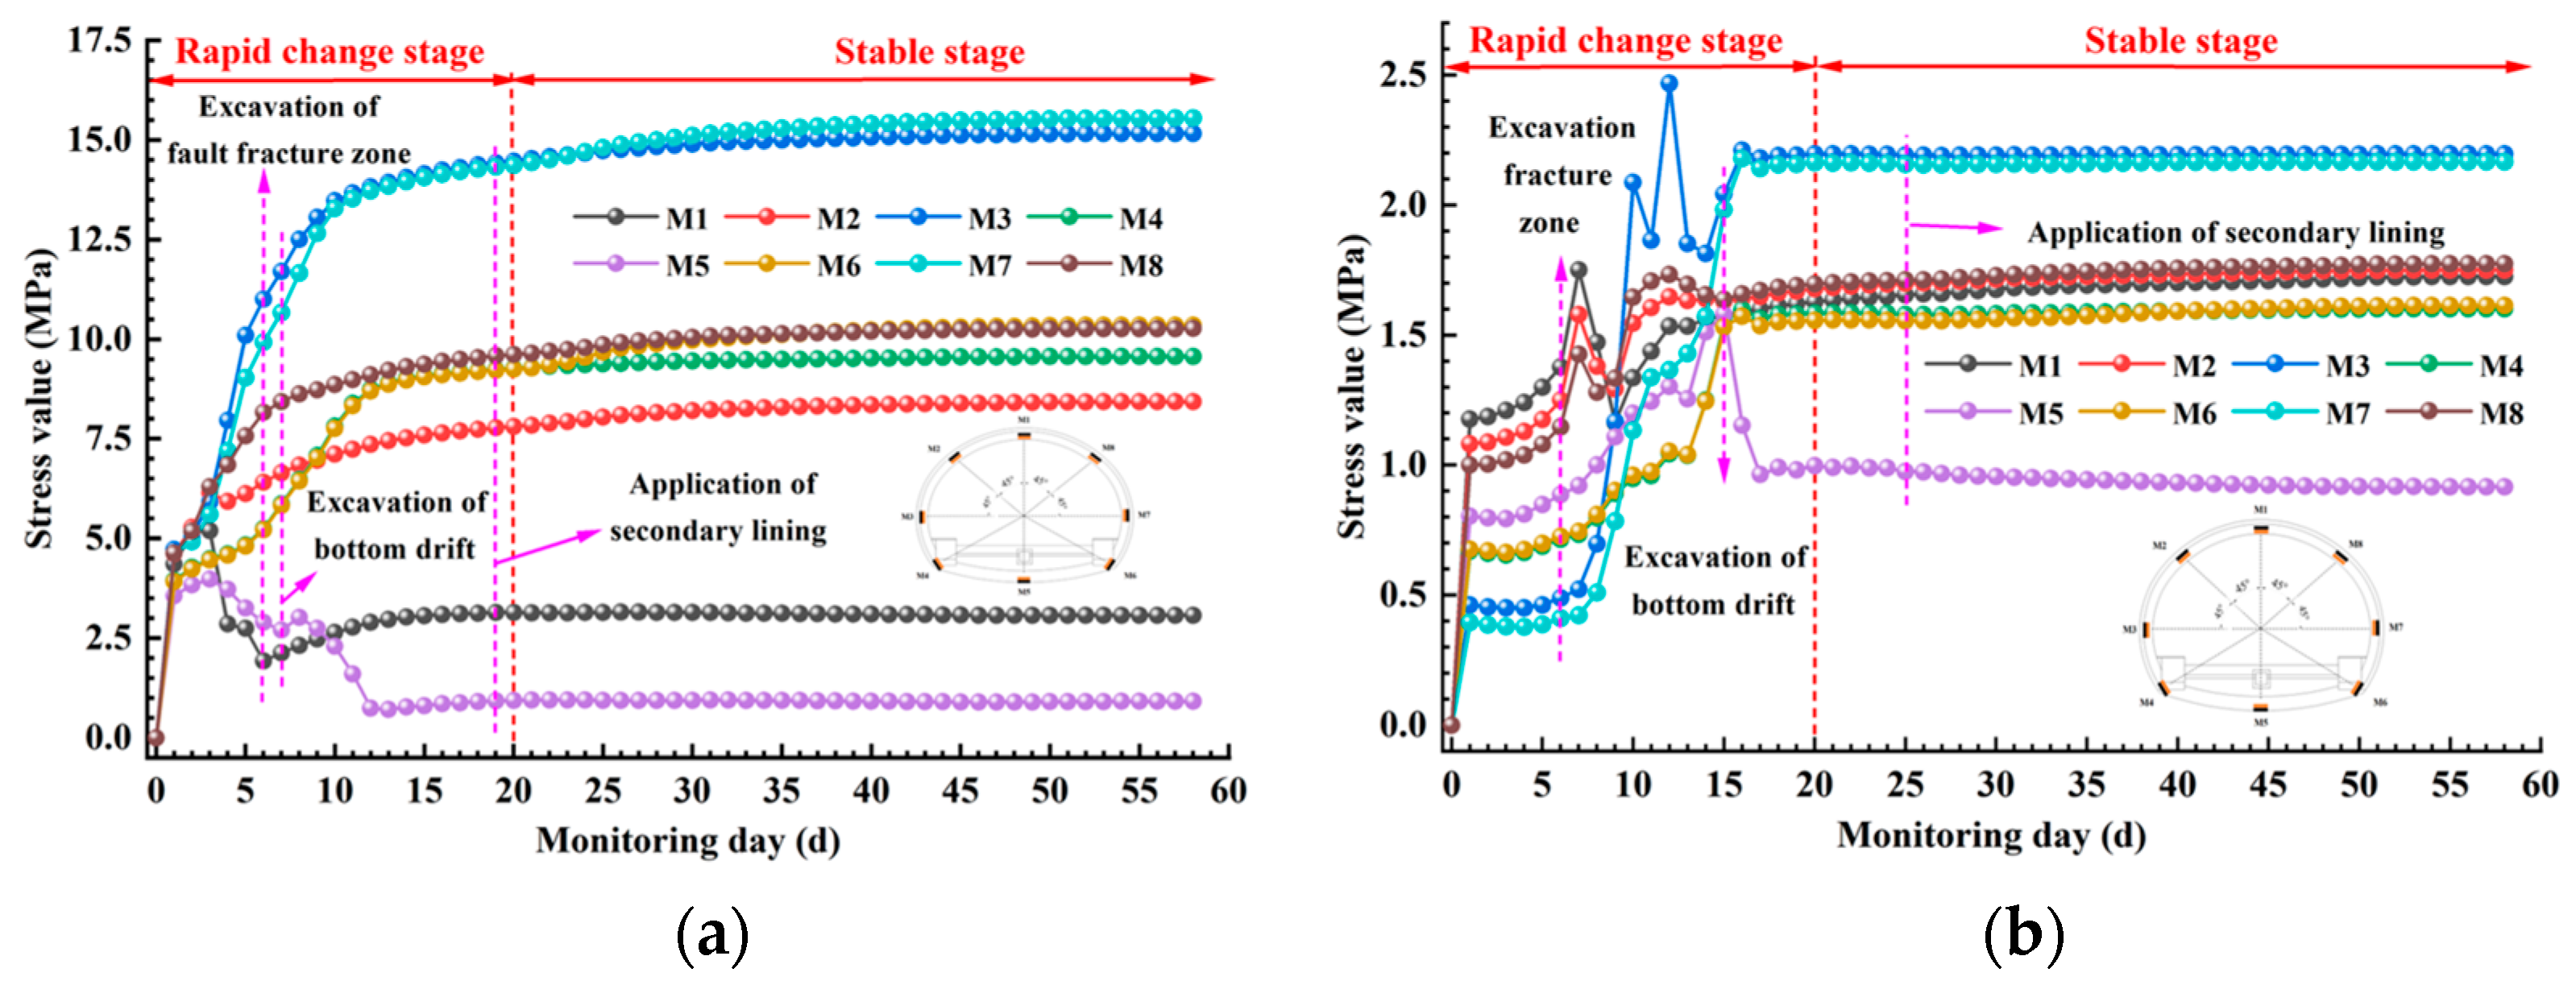
3.2.2. Soil Pressure

The time history curves of soil pressure are presented in Figure 5. The change curve of soil pressure can be divided into two phases (i.e., the rapid increase phase and the stabilizing phase). Before the installation of primary support, the excavated rock mass is in a “loose” state, with a soil pressure of 0. When the primary support is applied, the continuous rock mass deformation causes pressure to be generated between primary support and rock mass. Thereafter, the rock pressure starts to rise and then reaches equilibrium.
The growth rate of soil pressure is vault > right arch haunch > left arch haunch > inverted arch. The soil pressure at the vault grows from 2.19 MPa at section I to 11.74 MPa at section II, and the inverted arch grows from 0.37 MPa at section I to 3.26 MPa at section II, with growth rates of 436.07% and 781.08%, respectively. The growth rate of soil pressure at the vault is about twice larger than that at the inverted arch.

3.2.3. Hydrostatic Pressure

The time-dependent curves of hydrostatic pressure monitored on site are displayed in Figure 6. The hydrostatic pressure change curve of the rock mass behind the primary support can be divided into the rapid change phase, continuous change phase, and slow change phase.
The amount of hydrostatic pressure change during the rapid change phase is about 94.6% of the total change in section I, while it is only 67.35% in section II. The reason is that the porosity of the rock mass in section II is larger than that in section I, forming a “one-way water-blocking barrier” at the interface between the fracture area and Grade-V rock mass, which prevents the flow of groundwater from section II to section I. Therefore, hydrostatic pressure in section I falls sharply. Since section I has experienced a sharp drop in hydrostatic pressure during the rapid change phase, only a minimal change of hydrostatic pressure is observed in section I during the continuous change phase. Even though there is continuous groundwater replenishment in section II, its water loss is greater than water replenishment, so water pressure still decreases continuously in this phase. In summary, the property difference in the two rock masses makes section II more prone to water storage than section I. This requires more attention to be paid to changes in water pressure within the rock mass during construction to prevent safety accidents.

3.2.4. Internal Force Characteristics of the Lining
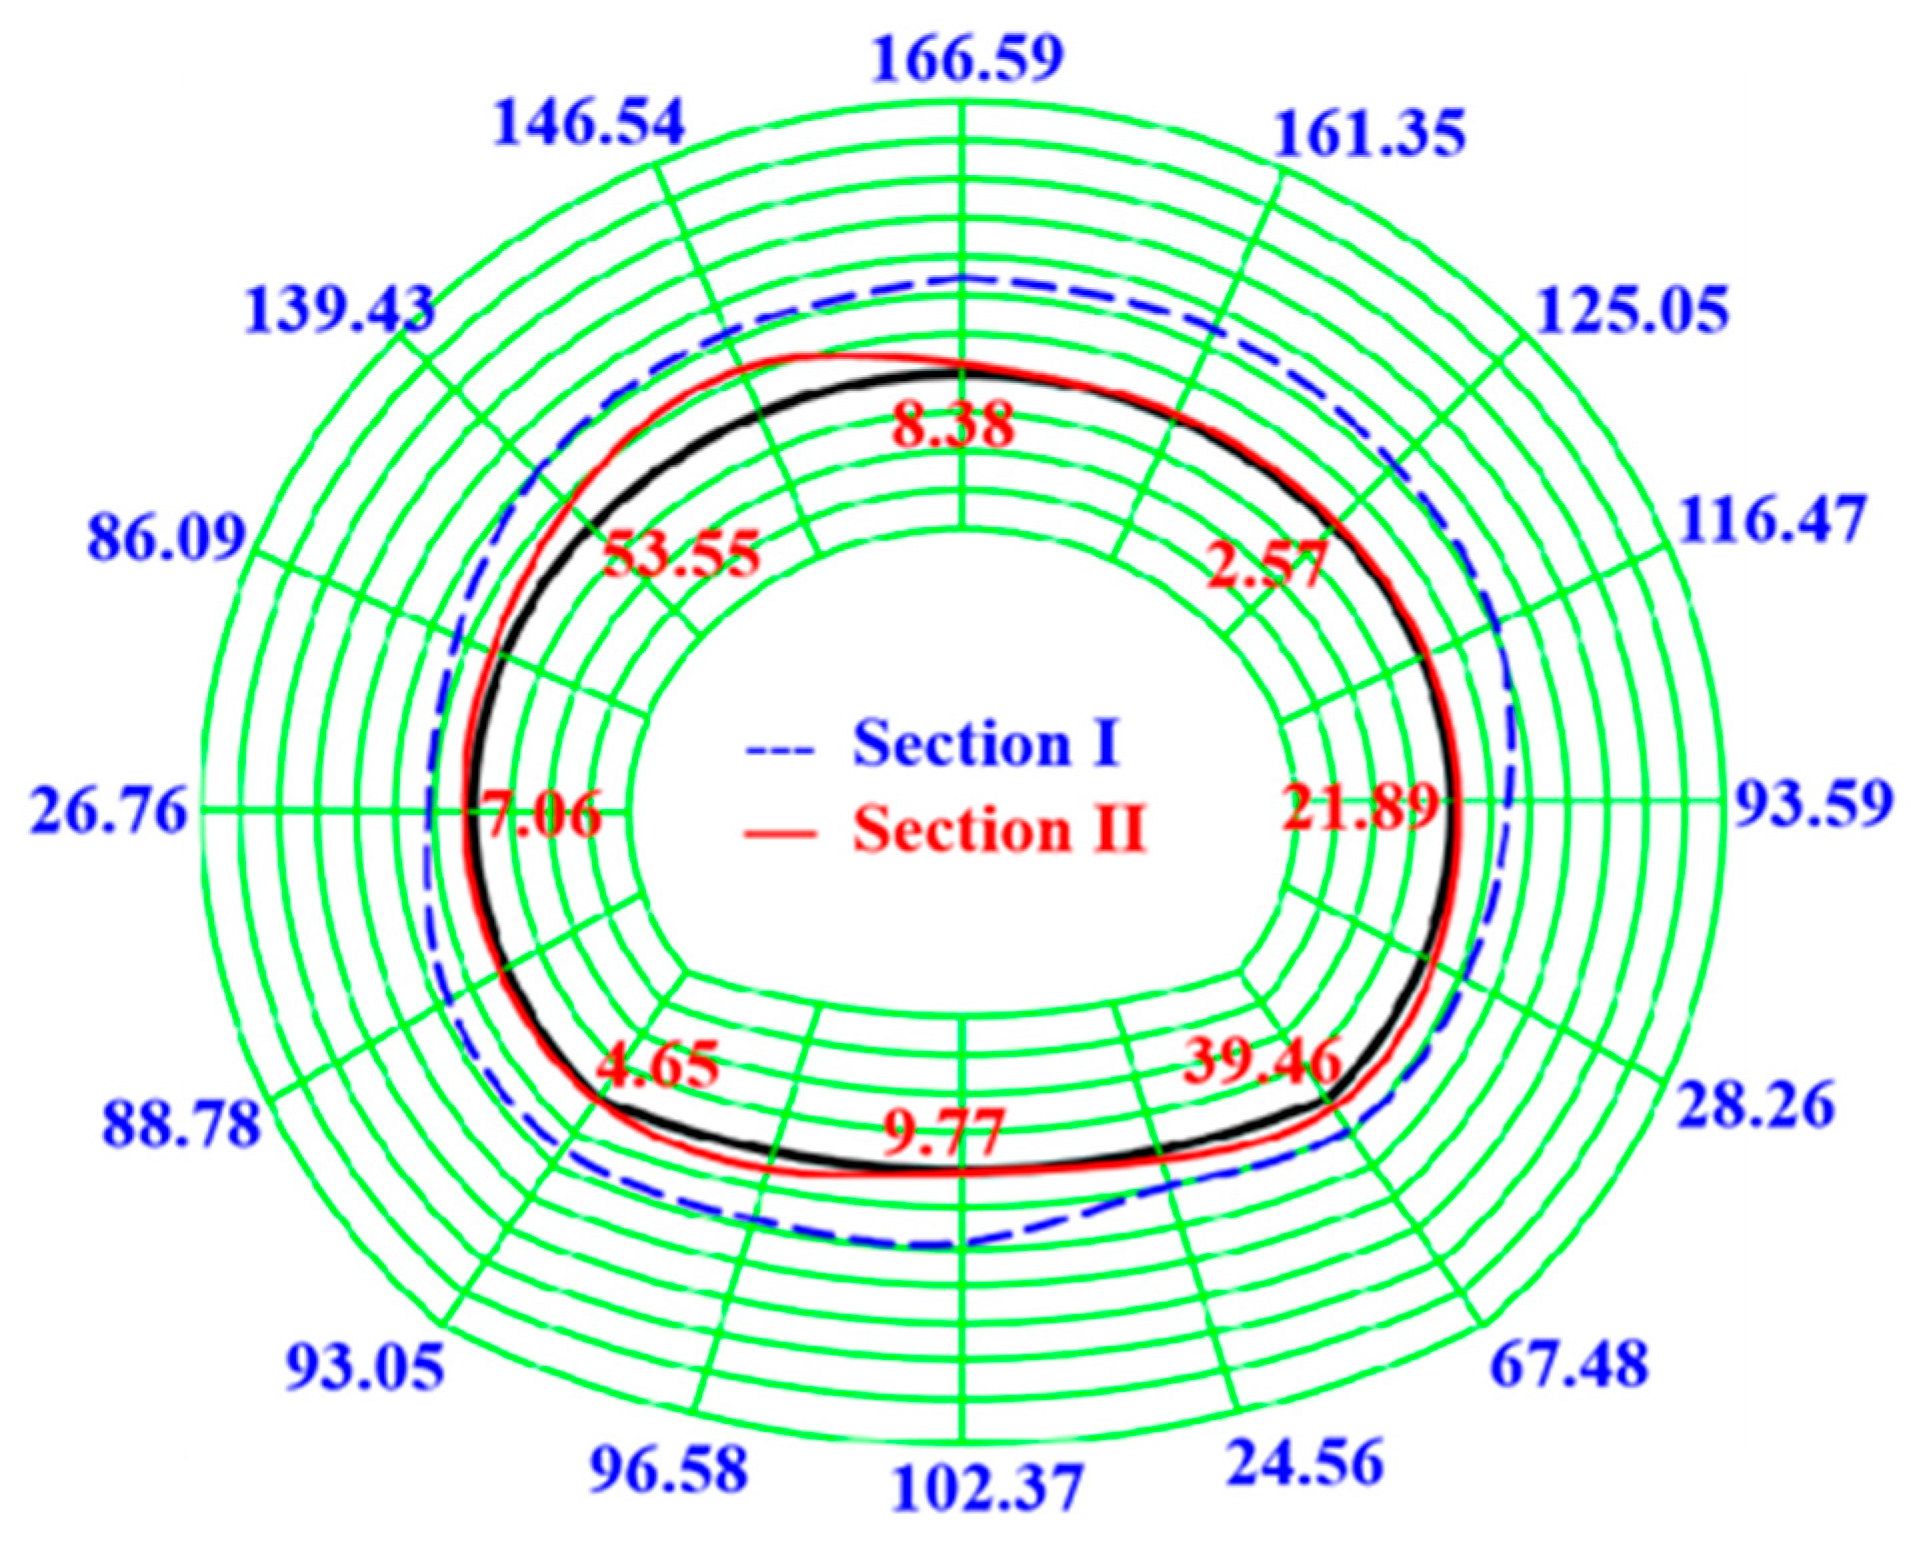
The internal force of the lining monitored on site is plotted in Figure 7. The bending moments of sections I and II are all butterfly-shaped with a center-to-lower left bias, while the axial force exhibits a “large in the middle and small at the upper and lower ends” distribution pattern.
When tunneling from section I to section II, the bending moment at the bottom of the left wall is the largest, while it is the smallest at the bottom of the right wall. The maximum positive and negative bending moments at the bottom of the left wall and bottom of the right wall are 149.78 kN·m and −63.48 kN·m, respectively, with an increased ratio of 139.78% and 60.87%, respectively. Overall, the lining on the left side of the tunnel axis has a positive bending moment, while that on right side has a negative bending moment. The axial force distribution of the lining in the two sections is basically the same. Since the self-stabilizing capacity of rock mass in section I is stronger than that in section II, the axial forces in section II are all larger than those in section I. The maximum and minimum axial forces in section I are located at the left haunch and the right spandrel, with the values of 240.68 kN and 55.37 kN, respectively, while those in section II are located at the right spandrel and the left spandrel, with the values of 1483.48 kN and 308.5 kN, respectively.

3.3. Safety Factor

With reference to the “Specifications for Design of Highway Tunnels: section I Civil Engineering” (JTG 3370.1-2018) [39], the safety factor is introduced to assess the safety of the lining.
When the eccentricity e 0 0.2 d , the ultimate strength of the lining is determined by the compressive strength of concrete. The safety factor of the lining is calculated with the following equation:
K = N φ α R a b d
where K is the safety factor of the concrete lining; N is the axial force of the lining; b and d are the cross-sectional width and thickness of the lining, respectively; φ and α are the eccentricity influence coefficients of the longitudinal bending coefficient and the axial force of the lining, α = 1 1.5 e / d ; and R a is the ultimate compressive strength of the lining.
When the e 0 > 0.2 d , the safety factor of the lining satisfies the following equation:
K = 1.75 R 1 b d φ 6 e 0 d 1
where R 1 is the ultimate tensile strength of the lining.
The “Specifications for Design of Highway Tunnels: section I Civil Engineering” (JTG 3370.1-2018) [39] states that the lining is in a safe condition when K > 2.4 . When 1.0 K 2.4 , the lining is in a dangerous state, and its shape and size need to be modified. When K < 1.0 , the lining is unable to bear the load [40].
The safety factors monitored in the field are shown in Figure 8. The safety factors for both sections are greater than 2.4, so the entire structure is a safe state. When tunneling from section I to section II, the safety factors at the arch crown and the right spandrel change the most. The safety factor at the right spandrel in section II is 2.57, which approaches the safety threshold of 2.4, and thus the right spandrel is the weak part of the entire structure. It is necessary to pay more attention to the tunnel arch spandrel during construction and appropriate reinforcement measures should be considered to ensure safe construction.

4. Numerical Analyses of Mechanical Behaviors of Tunnel Crossing Water-Abundant Fault Area

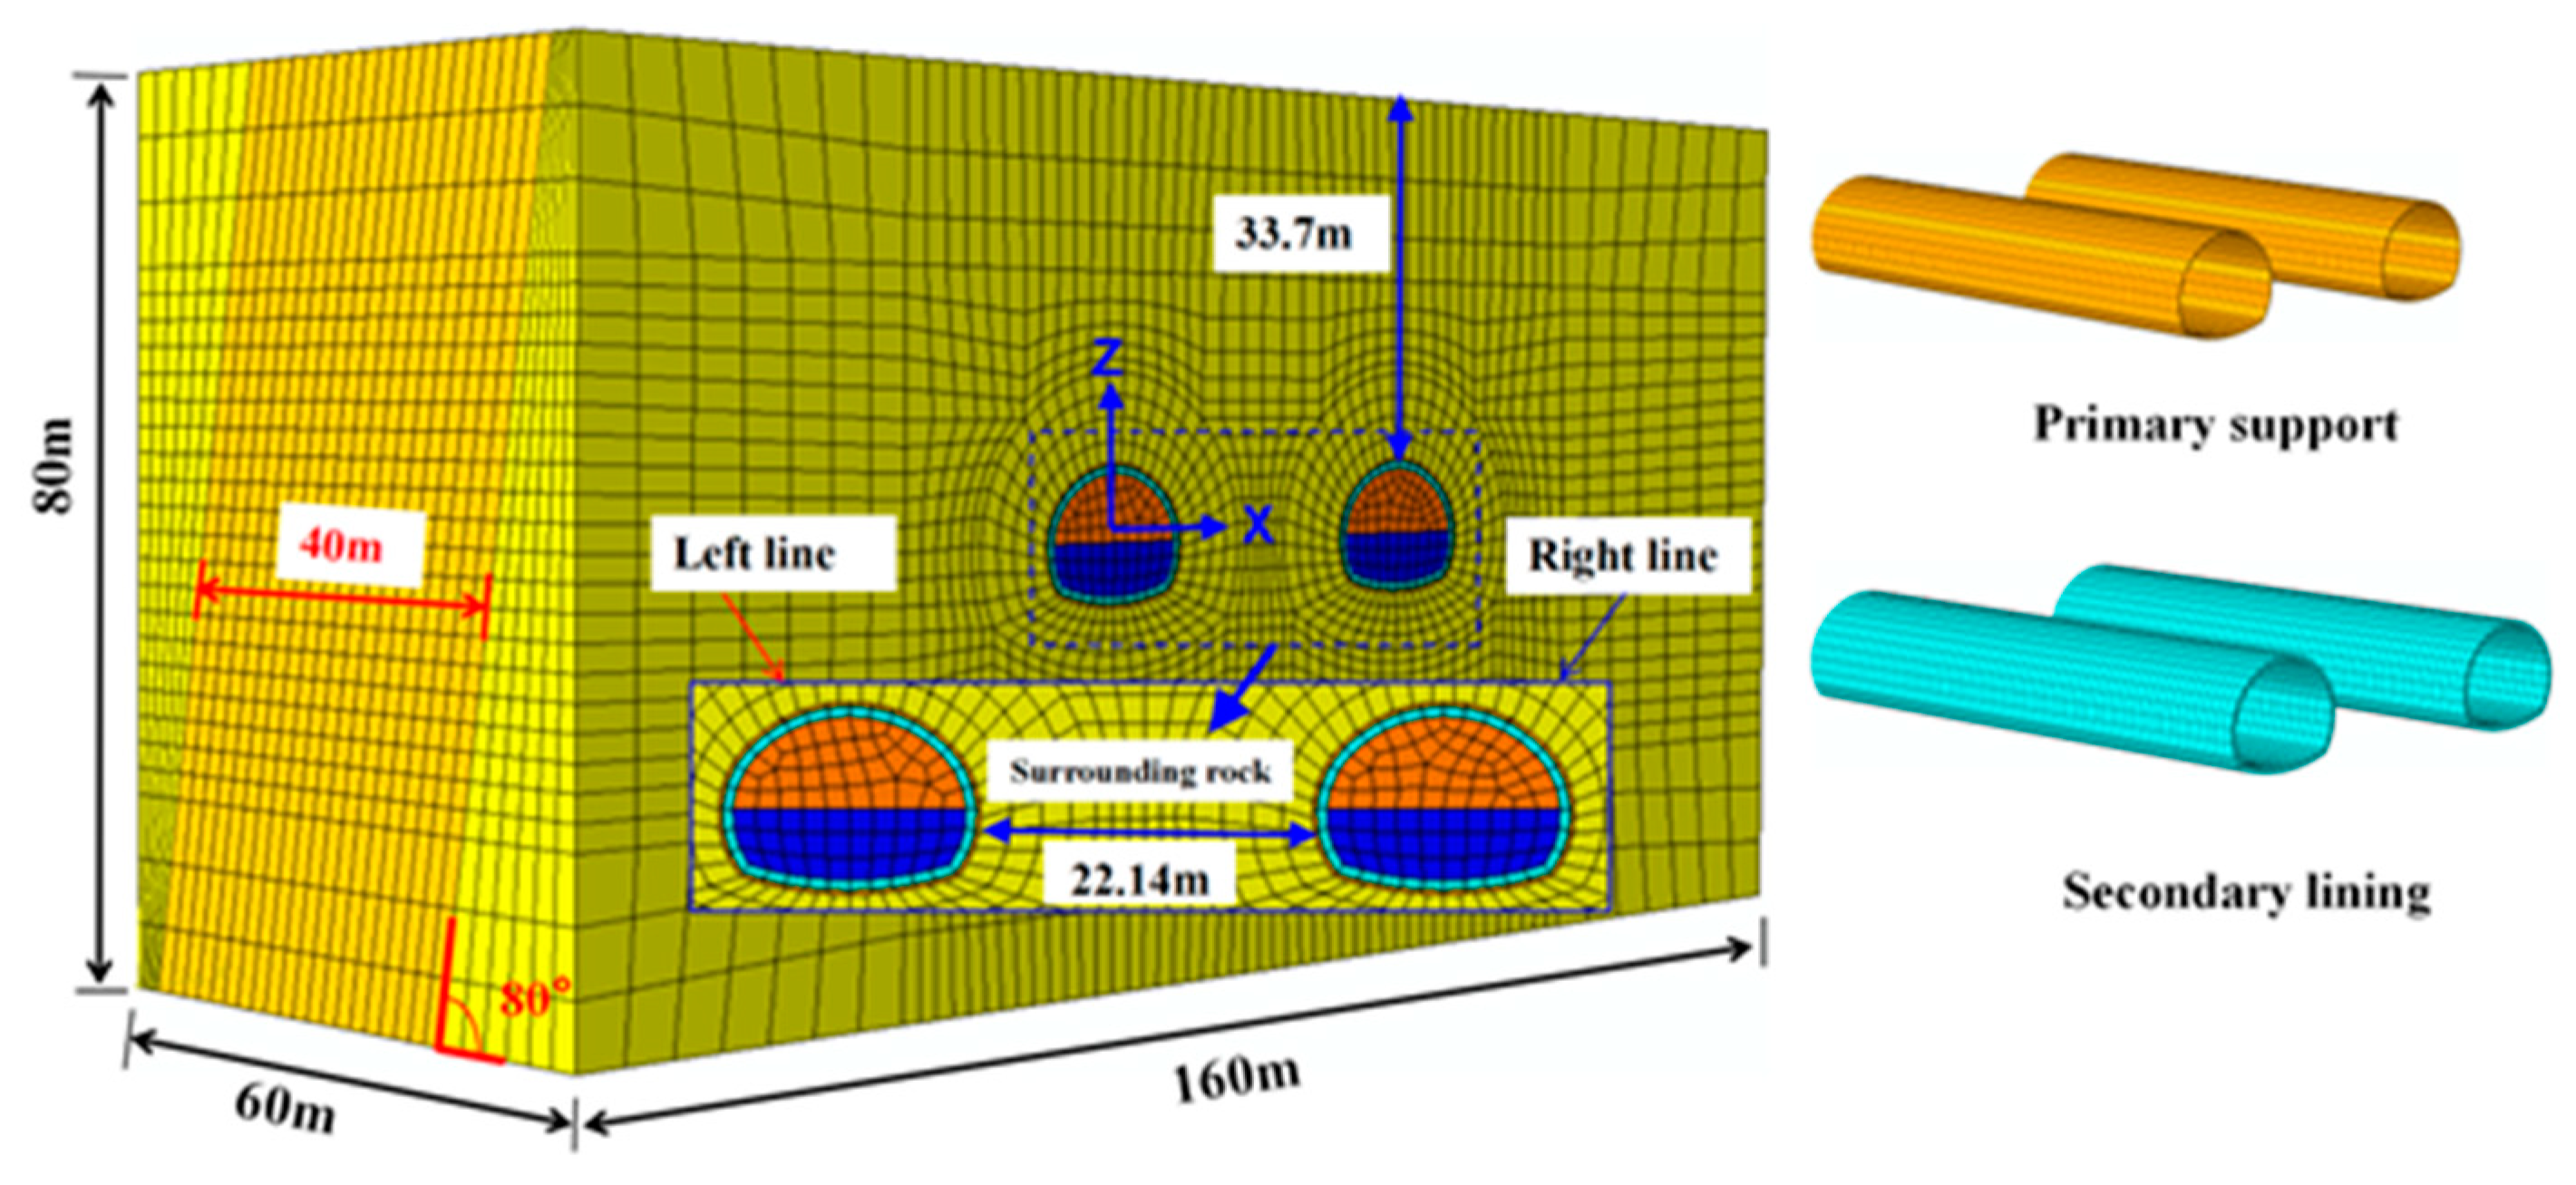
4.1. Establishment of Numerical Simulation Model

This study employs the finite element software ABAQUS 2020 for simulation; the development of the model is mainly based on the description of the design of the Jinyunshan tunnel (Figure 9) and an in-site construction program. Considering the influence of boundary effects on the model, the final dimensions of the model are X × Y × Z = 160 m (length) × 60 m (width) × 80 m (height), with a fault width of 40 m and a dip angle of 80°. The model is developed with 68,844 elements and 76,959 nodes. Considering that the tunnel depth is 140 m, an equivalent load of 2.8 × 10⁵ Pa and an equivalent pore pressure with a head of 100 m are applied to the top of the model to simulate the deeply buried water-abundant environment. Normal displacement constraints are set at the front, back, left, and right boundaries of the model, while the top is free and the bottom is fixed. The seepage model is isotropic, and the bottom, front, back, left, and right boundaries of the model are set as impermeable boundaries. The primary support and excavation face are set as permeable boundaries with a pore pressure of 0. The rock mass is saturated before the tunnel’s construction.

4.2. Principle of Fluid–Solid Coupling Calculation

The fluid–solid coupling in ABAQUS is divided into an indirect mode and direct mode. The fluid–solid coupling theory is based on Biot’s three-dimensional consolidation theory, Forchheimer’s penetration law, and the effective stress principle.

4.2.1. Penetration Law

For multiphase materials such as rocks and soils, the fluid flow in the pore medium is generally divided into the flow of liquids and the flow of pore gases. The permeation of liquids in ABAQUS satisfies the Forchheimer’s permeation law, where the permeability coefficient k ¯ is defined as follows:
k ¯ = k s ( 1 + β v w v w ) k
where k is the permeability coefficient of saturated soil; k s is the coefficient related to the degree of saturation; k s = S r 3 , S r is the degree of saturation; β is the coefficient reflecting the effect of velocity on the permeability coefficient; Darcy’s law is satisfied at β = 0 ; v w is the velocity of the fluid [41].

4.2.2. Effective Stress Principle

Stress in ABAQUS is positive in tension, while liquid pressure u w and gas pressure u a are positive in compression. Therefore, the effective stress principle in ABAQUS is slightly different from the expression in conventional geotechnics, with the following equation:
σ ¯ = σ + ( χ u w + ( 1 χ ) u a ) Ι
where σ is the total stress; σ ¯ is the effective stress; χ is related to the surface tension between the saturated soil and the liquid/gas, with χ = 1.0 when the soil is fully saturated, and when the soil is dry ( χ = 0 ). However, the stress in ABAQUS is simply taken as the degree of saturation, and the gas pressure is ignored.

4.3. Parameters of Numerical Model

Geological survey data reveal that the rock mass in the study section is Grade V. The stratum of the section is gray rock and breccia, and they are interfaced by the fault. The physical and mechanical parameters of the rock mass are selected according to the engineering investigation report, and the necessary corrections are made according to the parameters’ reduction requirements. The primary support and secondary lining adopt an ideal elasticity model, and the support structure is regarded as an impermeable medium.
The parameters of rock mass and the supporting structure are jointly determined according to the “Highway Tunnel Design Code” (JTG33701-2018) [39] and the “Sui-Yu expressway complementary line (Beibei-Tongliang section) geological investigation report”, and the detailed parameters are summarized in Table 1.

4.4. Layout of Monitoring Points in Numerical Simulation

To facilitate the comparison with the in situ monitoring data, the monitoring sections, and the locations of the monitoring points in the numerical model are consistent with those in the field monitoring. The monitoring items include the displacement of primary support, water pressure outside the primary support, soil pressure, and the structure’s internal force of the secondary lining. The monitoring point arrangement of the numerical model is displayed in Figure 10.

4.5. Results and Analysis

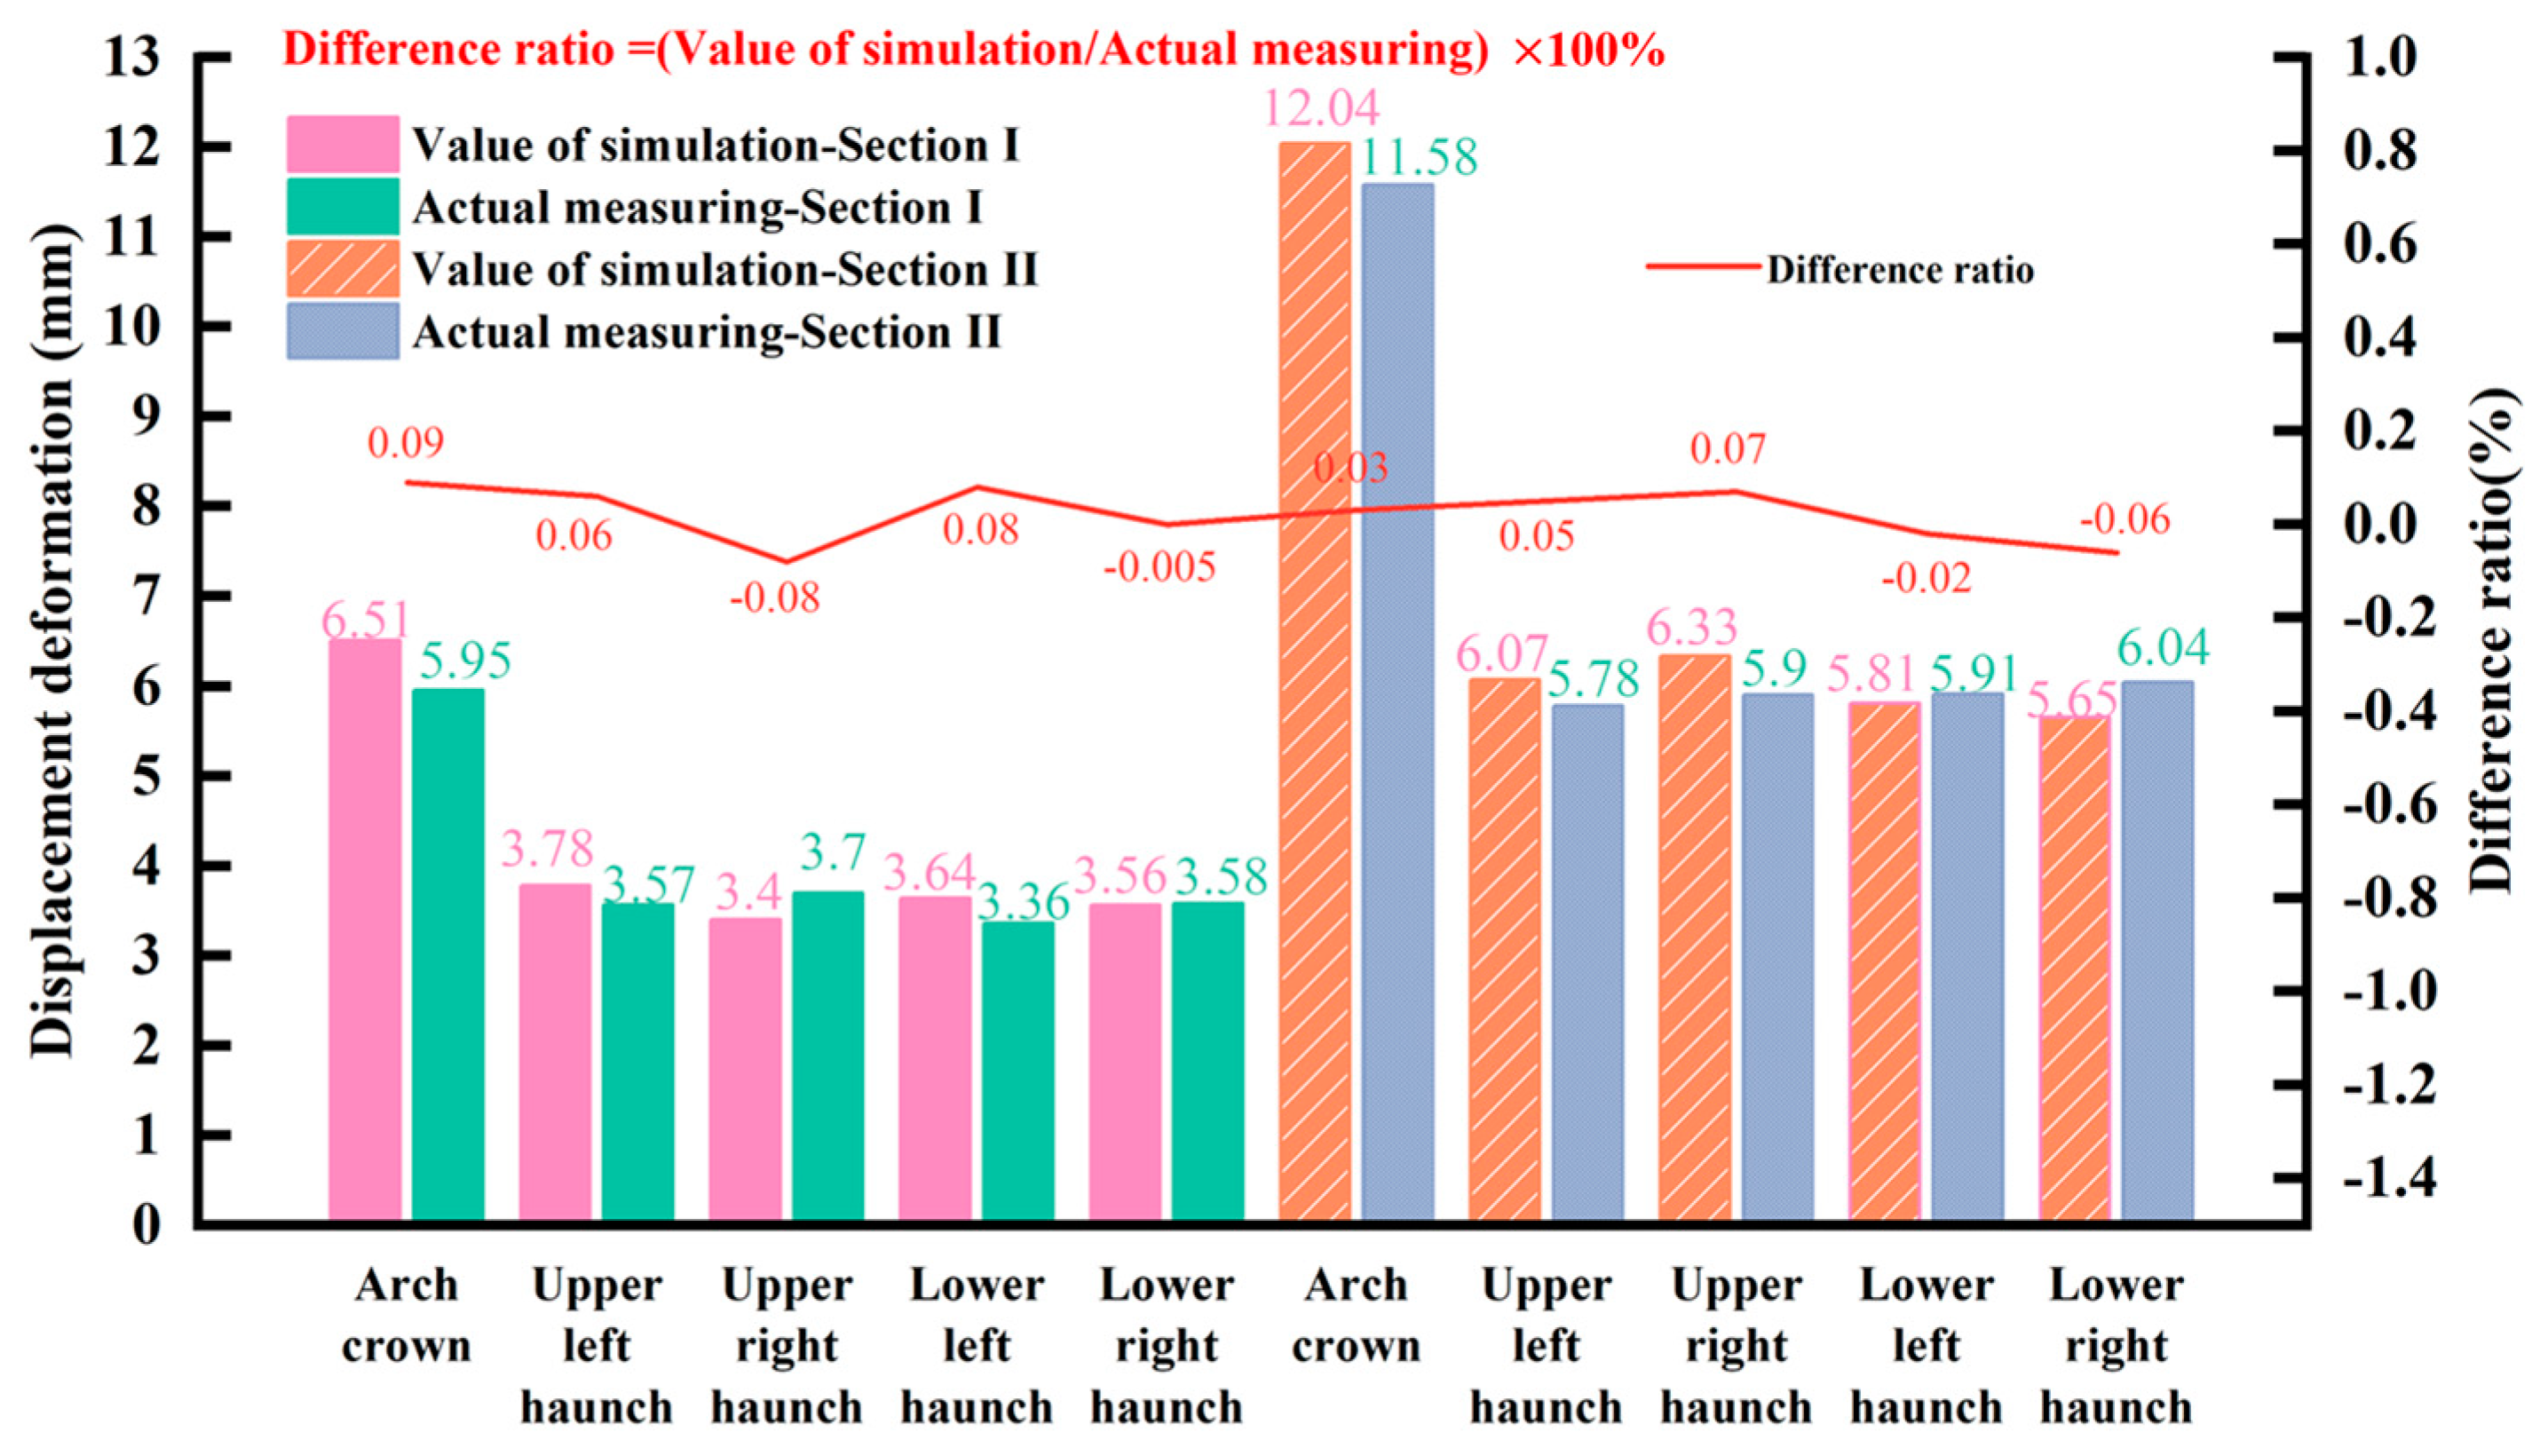
4.5.1. Characterization of Vertical Displacement Changes

The time-dependent displacement curves of the numerical simulation are illustrated in Figure 11. The change trend of the displacement can be divided into the excavation deformation phase and continuous deformation phase.
The overall trends of the displacement changes for the two sections are basically the same. However, due to the property difference of the rock mass in the two sections, the displacement at section II is about 50% larger than that at section I. When the excavation face advances to section I, the displacement at the arch haunch is only about 0.1 mm, while that at the vault is 0.5 mm. When the excavation face arrives at the fault area, the displacement at the arch crown of section I increases rapidly to 3 mm, with an increased rate of 500%, while the displacement at the arch haunch increases to 0.5 mm, with an increased rate of 400%. The displacement at the arch crown of section II increases from 0.1 mm to 8 mm and that at the arch haunch increases from 0.1 mm to 2 mm, with growth rates of 7900% and 1900%, respectively. It demonstrates that when tunnelling in the fracture area, the Grade-V rock mass installed with primary support also significantly deforms due to the extrusion of the fault area. When the excavation face just starts to enter the fault area, the vault yields a large deformation because of the deterioration of the rock mass. The large deformation may lead to rock fall at the interface. Due to the excavation disturbance of the right tunnel to the left tunnel, rock masses in the two sections still deform after the completion of the lining, and the displacement growth rate of the two sections is about 20–30%.
The comparison of the in situ monitoring results and the numerical simulation results regarding the vertical displacement is presented in Figure 12. The maximum displacement of the rock mass obtained from the in situ monitoring and the numerical simulation are both at the arch crown, and the final displacement values are basically the same, with a difference of less than 10%. The numerical simulation results differ slightly from the in situ monitoring results in the trend of the time-dependent displacement curve, but both have experienced two phases of the rapid deformation and slow deformation. Therefore, the numerical simulation results in this study can better reveal the deformation law of the primary support in practical engineering.

4.5.2. Characterization of Soil Pressure Changes

The soil pressure of the primary support acquired with numerical simulation are shown in Figure 13. The changes of soil pressure in section I are divided into three phases: rapid change phase (excavation phase), slow change phase, and stabilizing phase, while those in section II are divided into the rapid change phase (excavation phase) and stabilizing phase. This indicates that the ability of the rock mass in the fault area to restore self-stabilization is stronger than that of the better-quality rock mass.
It can be seen that the soil pressure in section I decreases sharply during the excavation phase, with a decrease from the initial 1.6 MPa to 0.5 MPa at the vault and a decrease from the initial 2.79 MPa to 0.1 MPa at the inverted arch. The rock mass in this phase is in the “unloading” state, and the decreased rate of soil pressure at the inverted arch is greater than that at the vault. When the primary support is completed, the soil pressure appears to “rebound” until it reaches stability. The soil pressure at the inverted arch changes very little, as the inverted arch is squeezed the least and the vault is squeezed the most. The soil pressure in section II during the excavation phase is smaller than that in section I, while the soil pressure “recovery” in section II during the support phase is faster than that in section I. Due to poor pressure-bearing and self-stabilizing capacities of rock mass in section II, the primary support and secondary lining bear most of the self-weight of the rock mass in the fault area after the completion of the primary support.

4.5.3. Characterization of Water Pressure Changes

The time-dependent curves of water pressure outside the primary support for both sections are displayed in Figure 14, which can be categorized into the three phases of rapid change (excavation phase), continuous change, and slow change.
At the beginning of excavation, the water pressure at each monitoring point in section I decreases sharply. When the excavation face reaches section I, the water pressure at the vault decreases from the initial 0.9 MPa to 0.4 MPa, while that at the inverted arch decreases from the initial 1.2 MPa to 0.6 MPa. The water pressure in section II at this point presents a slow decreasing tendency. The water pressure at the vault decreases from the initial 1.31 MPa to 1.25 MPa, while that at the inverted arch decreases from the initial 1.45 MPa to 1.39 MPa. The water pressure decreases continuously during the lower bench excavation of section I. However, when the primary support is completed, the water pressure at the arch haunch on both sides increases slightly due to the smaller permeability of the primary support than the rock mass. The water pressure keeps varying slowly until the lining is completed. The water pressure at each monitoring point in section II keeps decreasing at a certain rate since the beginning of excavation. The decrease of the water pressure declines after the completion of the secondary lining and then it maintains at a slow rate. The strong water resistance of rock mass in this section makes it difficult to discharge the water in the fault area through natural drainage, which brings great safety risks to tunnel construction. Therefore, the necessary measures should be taken to prevent the occurrence of hazards during construction.

4.5.4. Characterization of Structure Stress Changes of Secondary Lining

The time-dependent stress curves are displayed in Figure 15, which can be categorized into the rapid change phase (tunnel excavation and installation of primary support) and stabilizing phase (completion of secondary lining).
The implementation of the upper bench excavation results in a rapid increase in stress concentrations in two sections, with the stresses at all monitoring points in section I being smaller than those in section II. When the excavation face reaches section I, a sudden change occurs in the stress at each monitoring point within this section. The rate of stress growth at the arch haunch on both sides reaches its maximum, followed by the arch feet and arch spandrel. The stresses at the arch crown and inverted arch demonstrate negative growth, with the stress at the arch haunch being approximately 70–80% greater than those at the arch spandrel and the bottom of the left and right wall. Upon reaching the fault zone, the stresses at all monitoring points in section I, excluding the inverted arch (M5), display a growth trend, with the rate of growth remaining essentially constant. However, the stresses at the monitoring points of the upper bench in section II (vault M1, left and right arch spandrels M2 and M8) exhibit fluctuations. With the completion of the primary support, the stresses at the upper bench exhibit a steady increase following a temporary decrease. Simultaneously, the rock stresses at the arch haunch on both sides in this phase rapidly escalate from their minimum to maximum, with the rock mass at the arch haunch in section II bearing the majority of the rock stress. The excavation of the lower benches in sections I and II results in an increase in the stresses at the arch haunch on both sides, while the stress at the inverted arch decreases. Once the primary support of the upper and lower bench is closed, rock stress becomes essentially stable. Primary support effectively manages the growth of rock stress and prevents the deformation of weaker rock masses. The pronounced effects are observed at the interface between the Grade V rock mass and the fault zone. The stress distribution pattern in section I consists of arch haunch on both sides, bottom of the right wall, right arch spandrel, bottom of the left wall, left arch spandrel, arch crown, and inverted arch, in descending order. Similarly, in section II, the pattern is arch haunch on both sides, arch spandrel on both sides and arch crown, arch foot on both sides, and inverted arch, also in descending order.
The safety factors derived from the numerical simulations for both sections are presented in Figure 16. As depicted in Figure 16, the safety factors of the lining for both sections exceed 2.4, indicating that the structures in both sections are in a safe condition. The smallest safety factor of 26.76 in section I is located at the left arch haunch, suggesting a certain safety margin. The minimum safety factor of 2.57 in section II is situated at the right spandrel. During the construction process, special attention should be paid to the right arch spandrel in section II, and appropriate reinforcement measures should be taken to ensure safe construction. The simulation results of the safety factors are generally consistent with the field monitoring outcomes.

5. Conclusions

Based on the results of field monitoring and numerical simulation, this paper analyzes the variation law of the surrounding rock of a tunnel excavation in a water-rich fracture zone, calculates the internal force of the supporting structure safely, and verifies its safety. The conclusions are as follows:
(1)
When the upper and lower two-step methods are used to excavate the tunnel in the water-rich fracture zone, the displacement and deformation of the initial support mainly go through two stages: the rapid change stage and the slow change stage. The deformation mainly occurs before and after crossing the fault fracture zone. At this stage, the displacement change is the most severe, and the displacement change rate of the vault reaches 2.8 mm/d.
(2)
The field results show that the water pressure, soil pressure, and secondary lining structure of the surrounding rock of the tunnel have undergone rapid changes and stable stages. The maximum earth pressure of the tunnel surrounding the rock in sections I and II are 2.3 MPa and 11.8 MPa, respectively, and the growth rate of earth pressure decreases from the vault to the arch bottom. The maximum water pressure is 1.15 MPa at the bottom of the tunnel in section II.
(3)
Compared with the monitoring results of the internal force of the tunnel support structure, in the process of crossing the V-level surrounding rock to the fault fracture zone, the bending moment of the lining increases the most at the left arch waist and the smallest at the right arch foot, which increases by 222.78% and 60.87% respectively. The axial force of the right spandrel increases the most, and the left spandrel increases the least, increasing by 2579.2% and 221.18%, respectively.
(4)
The numerical simulation results show that the displacement deformation of the primary support of the tunnel, the soil pressure of the surrounding rock, the water pressure, and the stress law of the secondary lining structure are consistent with the field monitoring results. The minimum safety factor of section I is at the left arch waist, with a value of 26.76. The minimum safety factor in section II is at the right arch shoulder, with a value of 2.57, but it is greater than the safety threshold of 2.4, and the structure is relatively safe.
During construction, attention should be paid to the deformation of the arch shoulder in the fracture zone, and grouting reinforcement should be carried out in the fracture zone and the junction area of the fracture zone to reinforce the surrounding rock and reduce the loss of groundwater, to ensure that the construction of the tunnel does not affect the location of the groundwater watershed and the supply of surface water so that the ecological environment can continue to maintain balance.

Author Contributions

Conceptualization, L.C. and Y.D.; methodology, L.C. and Y.T.; software, L.C. and Y.T.; formal analysis, B.Y. and S.W.; investigation, S.W. and H.L.; data curation, Y.D. and B.Y.; writing—original draft, L.C. and Y.D.; writing—review and editing, Y.D., H.L. and Y.T.; visualization, L.C., Y.D., S.W. and Y.T.; supervision, Y.D. and B.Y. All authors have read and agreed to the published version of the manuscript.

Funding

This research was funded by Chongqing Sui-Yu Expressway Complementary Line Co., Ltd. Science and Technology Project, grant number YSFX-F. ZX-2022-003.

Data Availability Statement

The data used to support the findings of this study are available from the corresponding author upon request.

Conflicts of Interest

Author Biao Yang and Siqi Wang were employed by the company China Railway Construction Kunlun Investment Group Co., Ltd. The remaining authors declare that the research was conducted in the absence of any commercial or financial relationships that could be construed as a potential conflict of interest.

References

  1. Yu, Z.; Xue, G.; Zhou, C. Application of complex signal analysis to process ground penetrating radar data. Chin. J. Rock Mech. Eng. 2005, 24, 798–802. [Google Scholar]
  2. Li, L.; Li, S.; Cui, J. Experimental research on chemical grout for treating water inrush in rock mass. Chin. J. Rock Mech. Eng. 2009, 30, 3642–3648. [Google Scholar]
  3. Li, S.; Xue, Y.; Zhang, Q.; Li, S.; Li, L.; Sun, K.; Ge, Y.; Su, M.; Zhong, S.; Li, X. Key technology study on comprehensive prediction and early-warning of geological hazards during tunnel construction in high-risk karst areas. Chin. J. Rock Mech. Eng. 2008, 27, 1297–1307. [Google Scholar]
  4. Zhang, Q.; Xu, Z.; Li, S. Integrated advanced geological prediction methods and engineering application of karst tunnels. J. Shandong Univ. 2009, 39, 7–11. [Google Scholar]
  5. Chen, W.; Mang, G.; Dai, Y. Stability analysis of diversion tunnel for Jinping hydro-power station. Chin. J. Geotech. Eng. 2008, 30, 1184–1190. [Google Scholar]
  6. Li, L. Study on Catastrophe Evolution Mechanism of Karst Water Inrush and it Engineering Application of High-Risk Karst Tunnel. Master’s Thesis, Shandong University, Jinan, Shandong, 2011. [Google Scholar]
  7. Li, L.; Zhou, Z.; Li, S.; Xue, Y.; Xu, Z.; Shi, S. An attribute synthetic evaluation system for risk assessment of floor water inrush in coal mines. Mine Water Environ. 2015, 34, 288. [Google Scholar] [CrossRef]
  8. Bai, J.; Duan, S.; Liu, R.; Xin, L.; Tian, J.; Zhang, Q.; Ma, H. Evolution of delayed water inrush in fault fracture zone considering time effect. Arab. J. Geosci. 2021, 14, 1001. [Google Scholar] [CrossRef]
  9. Wu, Y.; Zhuang, G.; Liang, W.; Huang, L. Safety analysis of secondary lining of Yulinzi Tunnel based on field monitoring. Appl. Sci. 2023, 13, 8328. [Google Scholar] [CrossRef]
  10. Huang, R.; Huang, J.; Ju, N.; Li, Y. Automated tunnel rock classification using rock engineering systems. Eng. Geol. 2013, 156, 20–27. [Google Scholar] [CrossRef]
  11. Wang, Y.; Chen, F.; Sui, W.; Meng, F.; Geng, F. Large-scale model test for studying the water inrush during tunnel excavation in fault. Bull. Eng. Geol. Environ. 2022, 81, 238. [Google Scholar] [CrossRef]
  12. Huang, C.; Zhang, S.; Wu, S.; Gao, Y. Research and application of a comprehensive forecasting system for tunnels in water-bearing fault fracture zones: A case study. Arab. J. Geosci. 2022, 15, 171. [Google Scholar] [CrossRef]
  13. Liu, J.; Li, Z.; Zhang, X.; Weng, X. Analysis of Water and Mud Inrush in Tunnel Fault Fracture Zone—A Case Study of Yonglian Tunnel. Sustainability 2021, 13, 9585. [Google Scholar] [CrossRef]
  14. Zhang, J.; Li, S.; Zhang, Q.; Zhang, X.; Li, P.; Wang, D.; Weng, X. Mud inrush flow mechanisms: A case study in a water-rich fault tunnel. Bull. Eng. Geol. Environ. 2019, 78, 6267–6283. [Google Scholar] [CrossRef]
  15. Zhong, Z.; Li, Y.; Zhou, X. Research on the Safety Thickness of Tunnel Outburst Prevention in Water-Rich Fault Fracture Zone Based on Janssen’s Theory. Geofluids 2022, 2022, 6247439. [Google Scholar] [CrossRef]
  16. Guo, Y.; Kong, Z.; He, J.; Yan, M. Development and application of the 3D model test system for water and mud inrush of water-rich fault fracture zone in deep tunnels. Math. Probl. Eng. 2021, 2021, 8549094. [Google Scholar] [CrossRef]
  17. Lyu, G.; Zhou, C.; Jiang, N. Experimental and numerical study on tunnel blasting induced damage characteristics of grouted surrounding rock in fault zones. Rock Mech. Rock Eng. 2023, 56, 603–617. [Google Scholar] [CrossRef]
  18. Wang, H.; Chen, Z.; Liu, S.; Liang, M. Study on Technology of Surface Pre-grouting for Vertical Shaft in Broken and Water-rich Granite Strata of Gaoligong Mountain Tunnel of Dali-Ruili Railway. In IOP Conference Series: Earth and Environmental Science. IOP Publ. 2019, 218, 012125. [Google Scholar]
  19. Fan, H.; Li, L.; Chen, G.; Liu, H.; Gao, J.; Li, C.; Peng, X.; Zhou, S. Analysis method of the water inrush and collapse in jointed rock mass tunnels: A case study. Eng. Anal. Bound. Elem. 2023, 146, 838–850. [Google Scholar]
  20. Jeon, S.; Kim, J.; Seo, Y.; Hong, C. Effect of a fault and weak plane on the stability of a tunnel in rock—A scaled model test and numerical analysis. Int. J. Rock Mech. Min. Sci. 2004, 41, 658–663. [Google Scholar] [CrossRef]
  21. Kun, M.; Onargan, T. Influence of the fault zone in shallow tunneling: A case study of Izmir Metro Tunnel. Tunn. Undergr. Space Technol. 2013, 33, 34–45. [Google Scholar] [CrossRef]
  22. Su, H.; Jing, H.; Zhao, H.; Yu, L.; Wang, Y. Strength degradation and anchoring behavior of rock mass in the fault fracture zone. Environ. Earth Sci. 2017, 76, 179. [Google Scholar] [CrossRef]
  23. Zhang, Z.; Chen, F.; Li, N.; Swoboda, G.; Liu, N. Influence of fault on the surrounding rock stability of a tunnel: Location and thickness. Tunn. Undergr. Space Technol. 2017, 61, 1–11. [Google Scholar] [CrossRef]
  24. Huang, F.; Wu, C.; Ni, P.; Wan, G.; Zheng, A.; Jang, B.; Karekal, S. Experimental analysis of progressive failure behavior of rock tunnel with a fault zone using non-contact DIC technique. Int. J. Rock Mech. Min. Sci. 2020, 132, 104355. [Google Scholar] [CrossRef]
  25. Wang, X.; Zhang, Y.; Zhang, Q.; Wei, Y.; Liu, W.; Jiang, T. Space-time evolution characteristics of deformation and failure of surrounding rock in deep soft rock roadway. Sustainability 2022, 14, 12587. [Google Scholar] [CrossRef]
  26. Lei, Q.; Tsang, C. Numerical study of fluid injection-induced deformation and seismicity in a mature fault zone with a low-permeability fault core bounded by a densely fractured damage zone. Geomech. Energy Environ. 2022, 31, 100277. [Google Scholar] [CrossRef]
  27. Fang, W.; Wang, G.; Wang, C. Effect of the Location of Fault Fracture Zones on the Stability of Symmetrical Submarine Tunnels. Symmetry 2021, 13, 1111. [Google Scholar] [CrossRef]
  28. Li, X.; Xu, G.; Wu, C.; Wu, S.; Zu, A.; Chen, G.; Li, Z.; Xu, S.; Li, Y. Pure Void Space and Fracture Pore Space in Fault-Fractured Zones. Front. Earth Sci. 2021, 9, 683439. [Google Scholar] [CrossRef]
  29. Li, Z.; Mao, H.; Li, B.; Zhou, X.; Liao, G.; Chen, J. Stability Analysis and Fracture Mechanism of Surrounding Rock in a Hydraulic Tunnel Based on Micro seismic Monitoring. Appl. Sci. 2022, 12, 9362. [Google Scholar] [CrossRef]
  30. Shrestha, P.; Panthi, K. Groundwater effect on faulted rock mass: An evaluation of Modi Khola pressure tunnel in the Nepal Himalaya. Rock Mech. Rock Eng. 2014, 47, 1021–1035. [Google Scholar] [CrossRef]
  31. Wu, J.; Wang, X.; Wu, L.; Lu, Y.; Han, Y. Parametric Study of Water Inrush in a Tunnel Crossing a Fault Based on the “Three Zones” Fault Structure. KSCE J. Civ. Eng. 2022, 26, 3600–3619. [Google Scholar] [CrossRef]
  32. Wang, P.; Xu, J.; Li, C. Similar simulation test study on permeability evolution mechanism of fault sliding fracture zone. Arab. J. Geosci. 2022, 15, 548. [Google Scholar] [CrossRef]
  33. Wei, S.; Li, Y.; Shang, Y.; Sun, Y.; Li, K. Stability analysis of fractured rock mass around underground excavations based on a three-dimensional discrete fracture network. Environ. Earth Sci. 2022, 81, 65. [Google Scholar] [CrossRef]
  34. Cheng, X.; Ding, W.; Pan, L.; Zou, Y.; Li, Y.; Yin, Y.; Ding, S. Geometry and kinematics characteristics of strike-slip fault zone in complex structure area: A case study from the South No. 15 strike-slip fault zone in the Eastern Sichuan Basin, China. Front. Earth Sci. 2022, 10, 922664. [Google Scholar] [CrossRef]
  35. Chen, Z.; Zhou, Z.; He, C.; Jiang, C.; Wang, B.; Li, T. Influence of faults on the geo-stress field distribution and damage evolution mechanism of fracture zones. Bull. Eng. Geol. Environ. 2023, 82, 173. [Google Scholar] [CrossRef]
  36. Liu, J.; Zhang, X.; Li, X.; Li, Z.; Sun, C. A New Quantitative Evaluation Index System for Disaster-Causing Factors of Mud Inrush Disasters in Water-Rich Fault Fracture Zone. Appl. Sci. 2023, 13, 6199. [Google Scholar] [CrossRef]
  37. Li, B.; Liu, Z.; Wu, Q.; Long, J.; Liu, P.; Li, M. Prediction Model for Safe Width of Rock Mass Preventing Water Inrush from Fault in Excavation Roadway and Influencing Factors Analysis: A Case Study of the Xintian Coal Mine. Min. Metall. Explor. 2023, 40, 1225–1235. [Google Scholar] [CrossRef]
  38. Sun, N.; Liu, C.; Zhang, F.; Dong, M.; Li, Z. Accurate Identification of Broken Rock Mass Structure and Its Application in Stability Analysis of Underground Caverns Surrounding Rock. Appl. Sci. 2023, 13, 6964. [Google Scholar] [CrossRef]
  39. JTG 3370.1-2018; Specifications for Design of Highway Tunnels: Section I Civil Engineering. China Communications Press: Beijing, China, 2019.
  40. Chen, B.; Zhang, Z.; Tan, Y. Study on structural mechanical characteristics and safety warning of NATM tunnel in aquifer. Marine. Georesources Geotechnol. 2024, 42, 88–103. [Google Scholar] [CrossRef]
  41. SIMULIA. Abaqus Analysis: User’s Manual; Dassault Systems: Vélizy-Villacoublay, France, 2012; Available online: https://www.academia.edu/24831145/Abaqus_Analysis_Users_Manual (accessed on 5 February 2024).
Figure 1. Schematic map of the geographical location of the study region.
Buildings 14 00475 g001
Figure 2. Schematic diagram of two-bench tunneling method.
Buildings 14 00475 g002
Figure 3. Layout of monitoring points for field monitoring.
Buildings 14 00475 g003
Figure 4. Time-dependent displacement curves obtained in field monitoring. (a) section I; (b) section II.
Buildings 14 00475 g004
Figure 5. Time-dependent curves of soil pressure monitored in the field. (a) section I; (b) section II.
Buildings 14 00475 g005
Figure 6. The time-dependent curves of hydrostatic pressure monitored in the field.
Buildings 14 00475 g006
Figure 7. Field monitoring of lining internal diagram. (a) Bending moment (kN·m); (b) axial force (kN).
Buildings 14 00475 g007
Figure 8. Safety factors monitored in the field.
Buildings 14 00475 g008
Figure 9. The Model for Numerical Simulation.
Buildings 14 00475 g009
Figure 10. Schematic layout of monitoring sections and points in the numerical model. (a) Model side view; (b) schematic diagram of model monitoring points.
Buildings 14 00475 g010
Figure 11. Displacement curves of numerical simulations. (a) section I; (b) section II.
Buildings 14 00475 g011
Figure 12. The comparison of the numerical simulation results and the in situ monitoring data regarding vertical displacement.
Buildings 14 00475 g012
Figure 13. Change curves of soil pressure obtained with numerical simulations. (a) section I; (b) section II.
Buildings 14 00475 g013
Figure 14. Change curves of water pressure obtained with numerical simulations.
Buildings 14 00475 g014
Figure 15. Curves of structure stresses of secondary lining obtained with simulations. (a) section I; (b) section II.
Buildings 14 00475 g015
Figure 16. Comparison of safety factors obtained with numerical simulation and field monitoring. (a) section I; (b) section II.
Buildings 14 00475 g016
Table 1. Detailed mechanical parameters of rock mass.
NameDensity (kg/m3)Elastic Modulus (GPa)Poisson’s RatioCohesion (MPa)Angle of Internal Friction (°)Permeability Coefficient (m/s)Void Ratio
Grade-V Rock Mass22002.50.252.9395 × 10−80.3
Rock mass in Fault and Fracture Zone170010.320.7222 × 10−60.5
Primary Support250028.5390.2300508 × 10−90.1
Secondary Lining280033.6250.181000508 × 10−100.05
Disclaimer/Publisher’s Note: The statements, opinions and data contained in all publications are solely those of the individual author(s) and contributor(s) and not of MDPI and/or the editor(s). MDPI and/or the editor(s) disclaim responsibility for any injury to people or property resulting from any ideas, methods, instructions or products referred to in the content.

