
Effect of Na2CO3 Replacement Quantity and Activator Modulus on Static Mechanical and Environmental Behaviours of Alkali-Activated-Strain-Hardening-Ultra-High-Performance Concrete


Abstract
:1. Introduction
2. Test Program
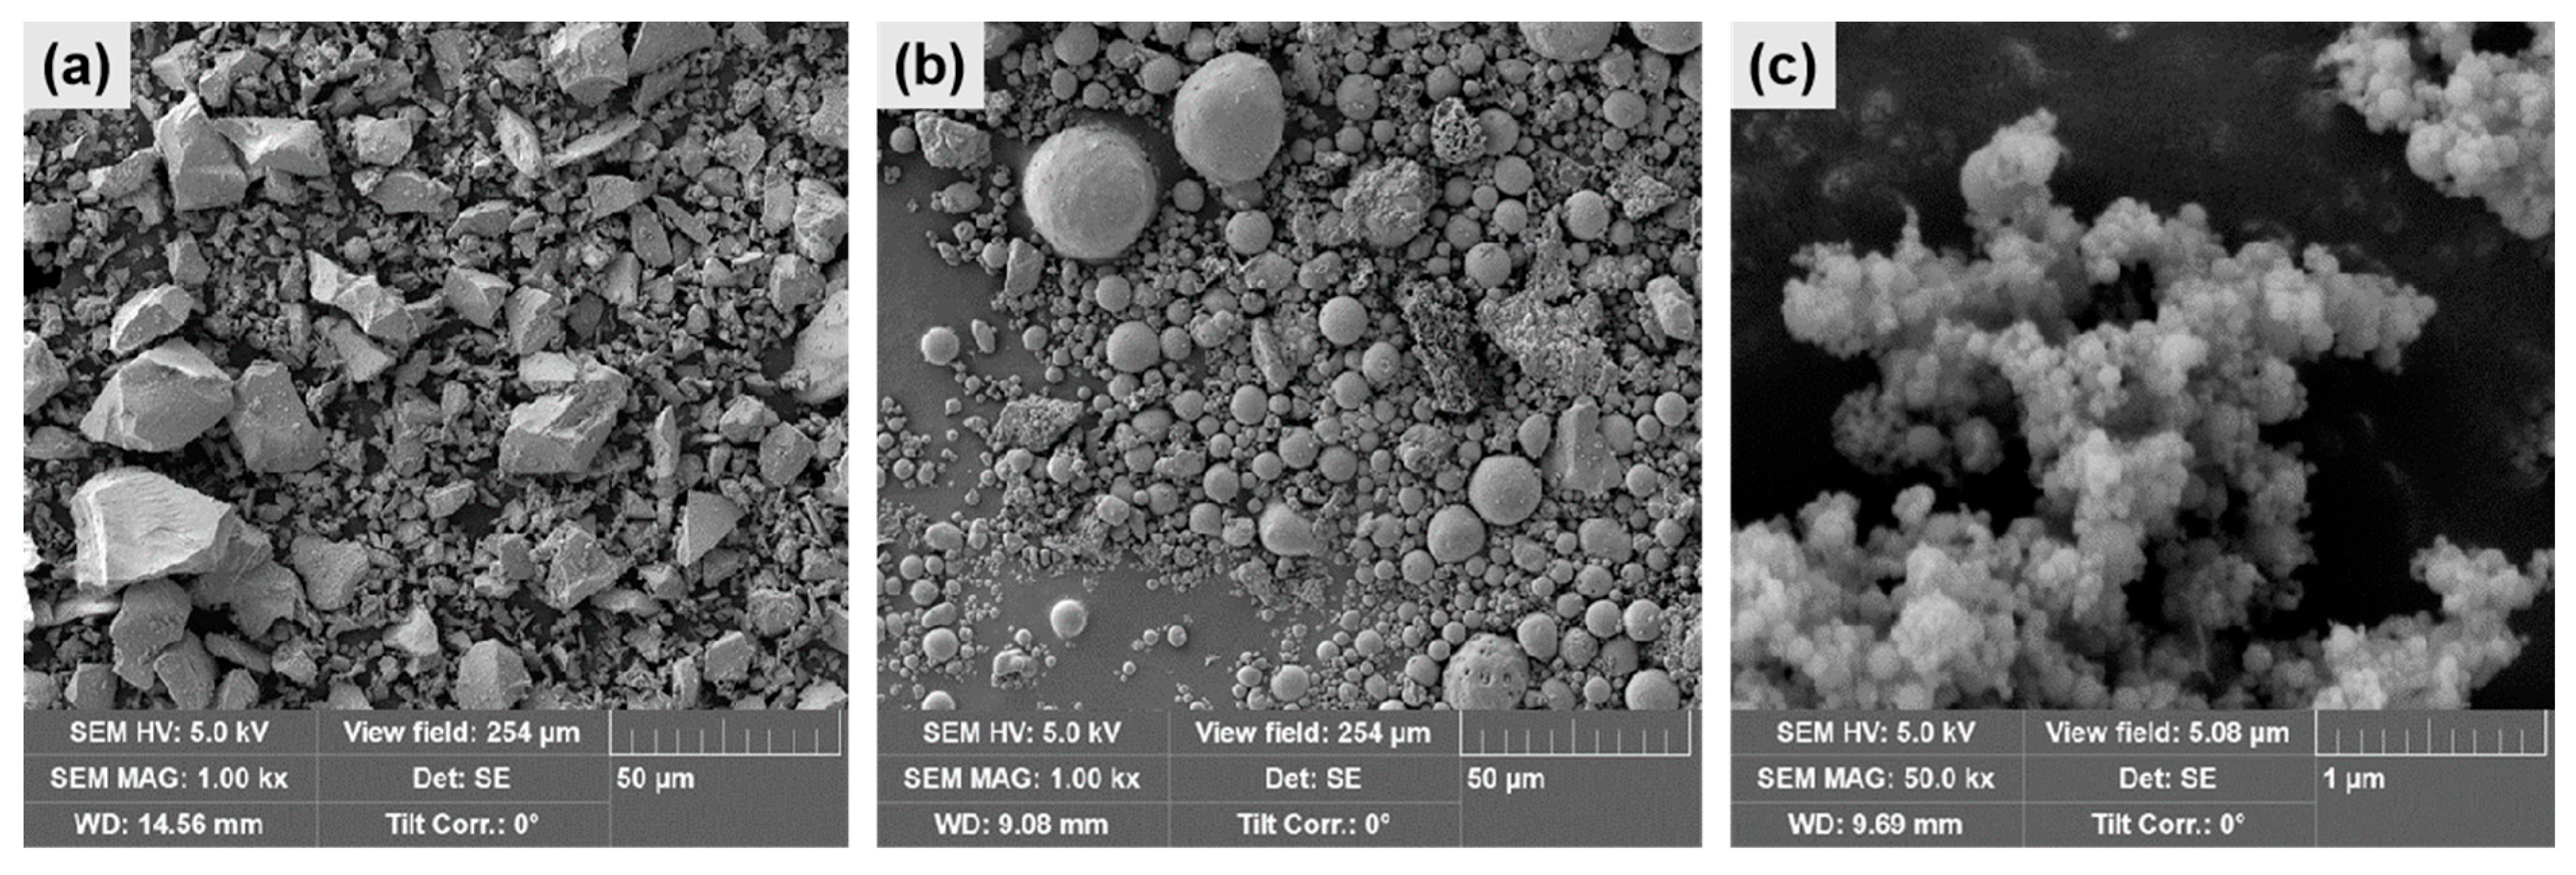
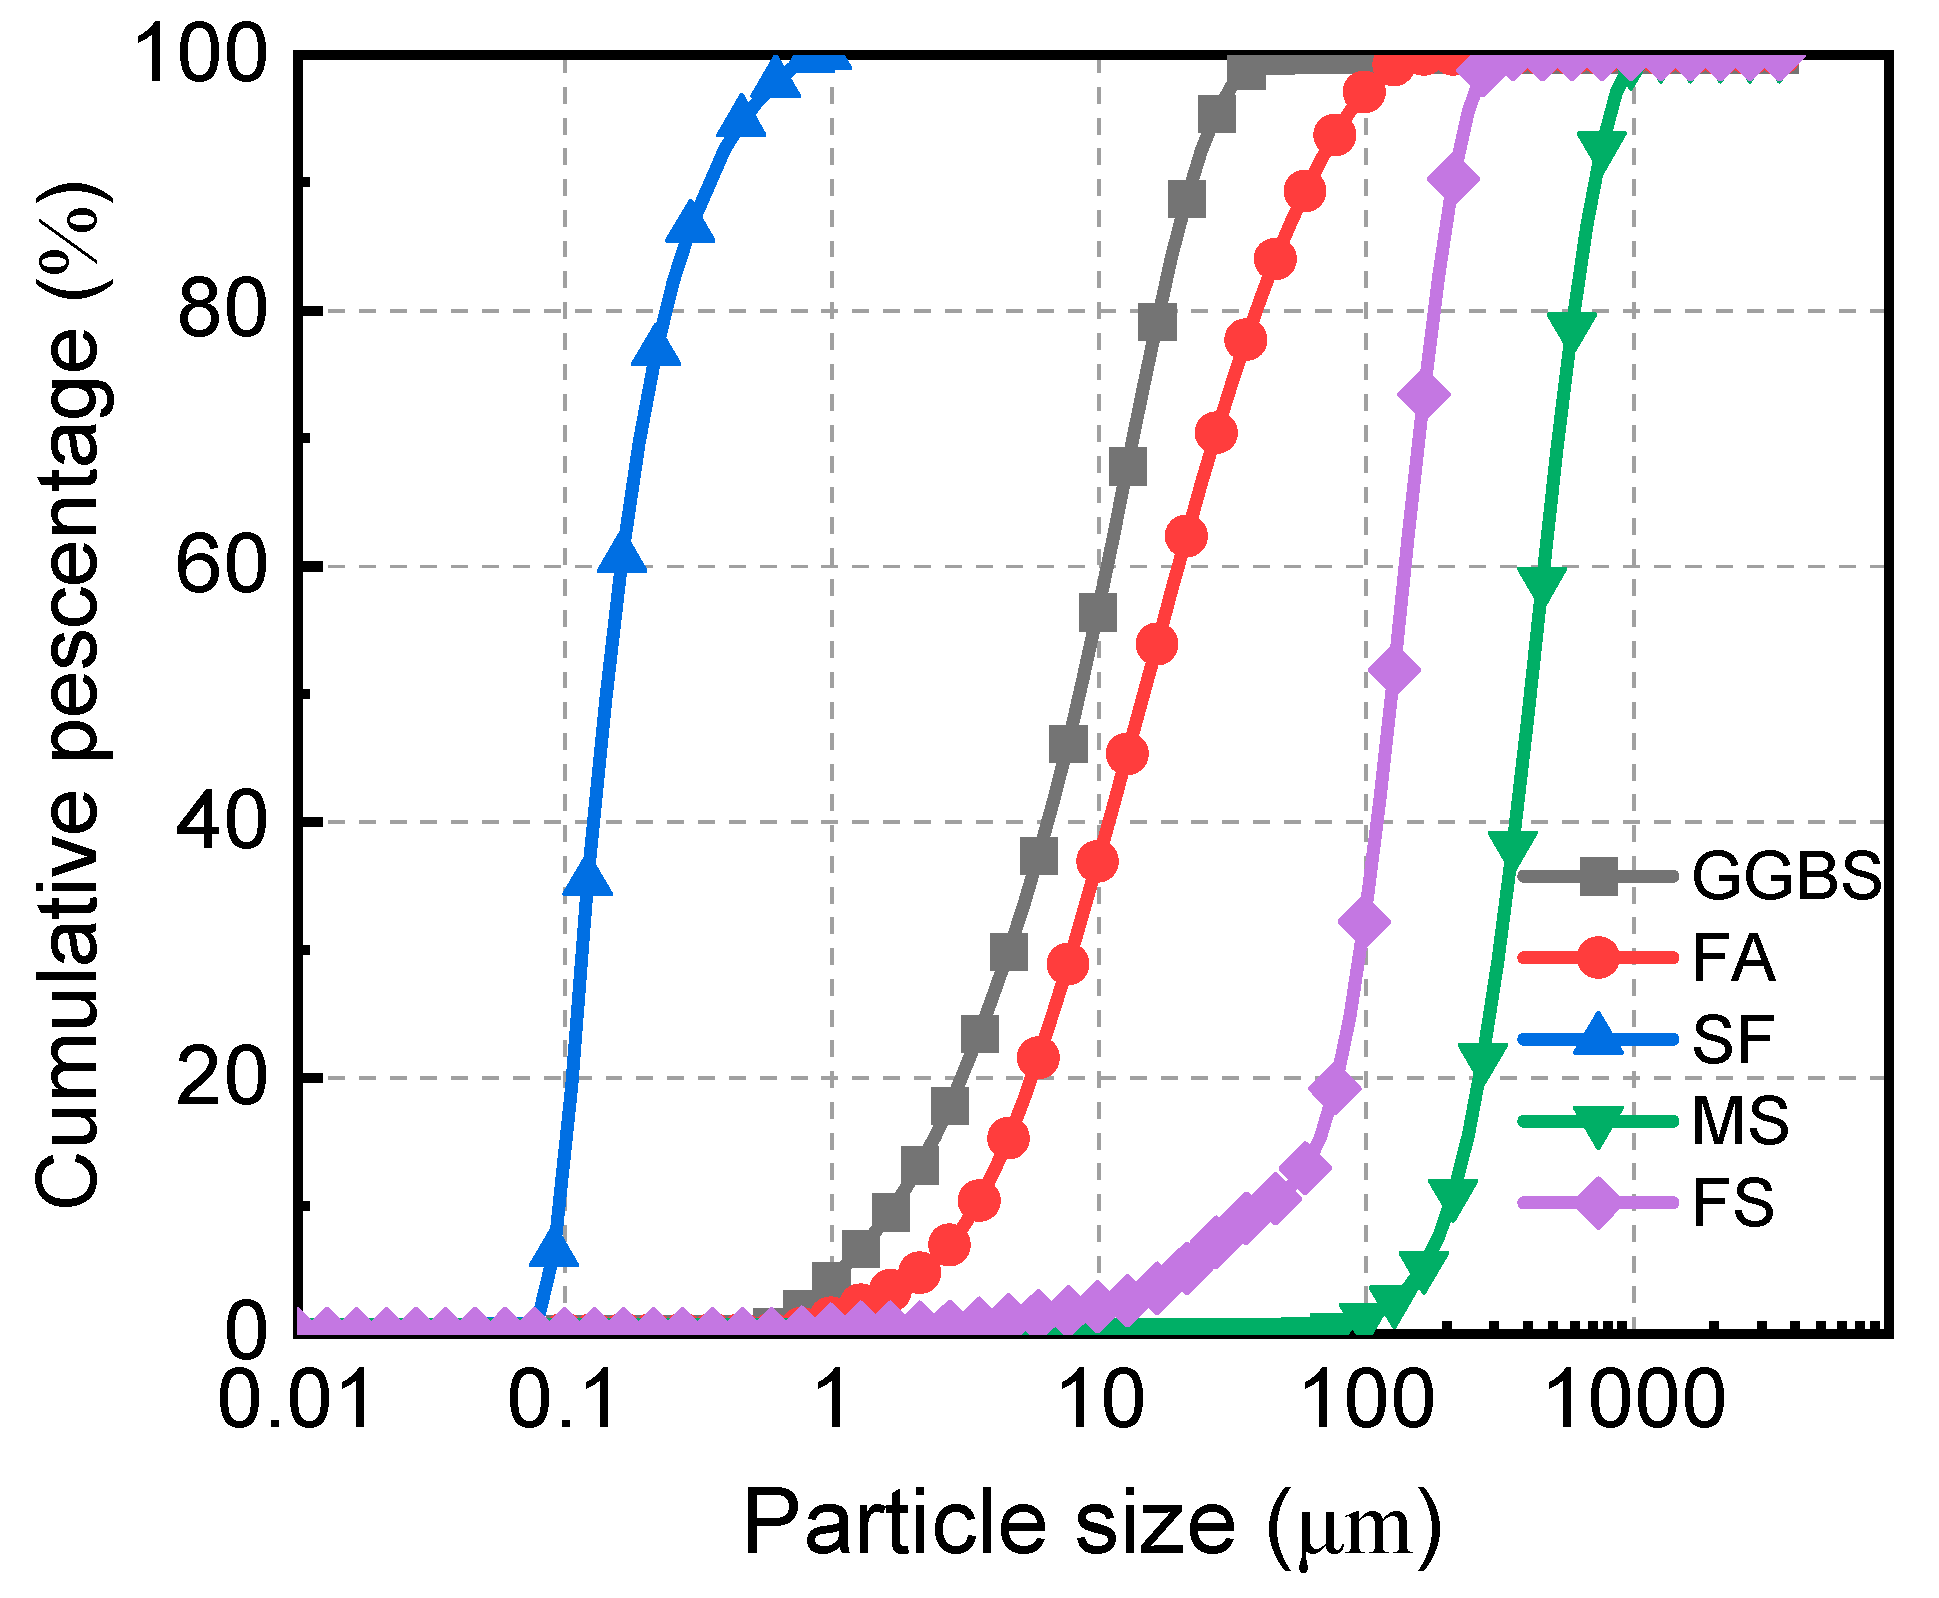
2.1. Materials
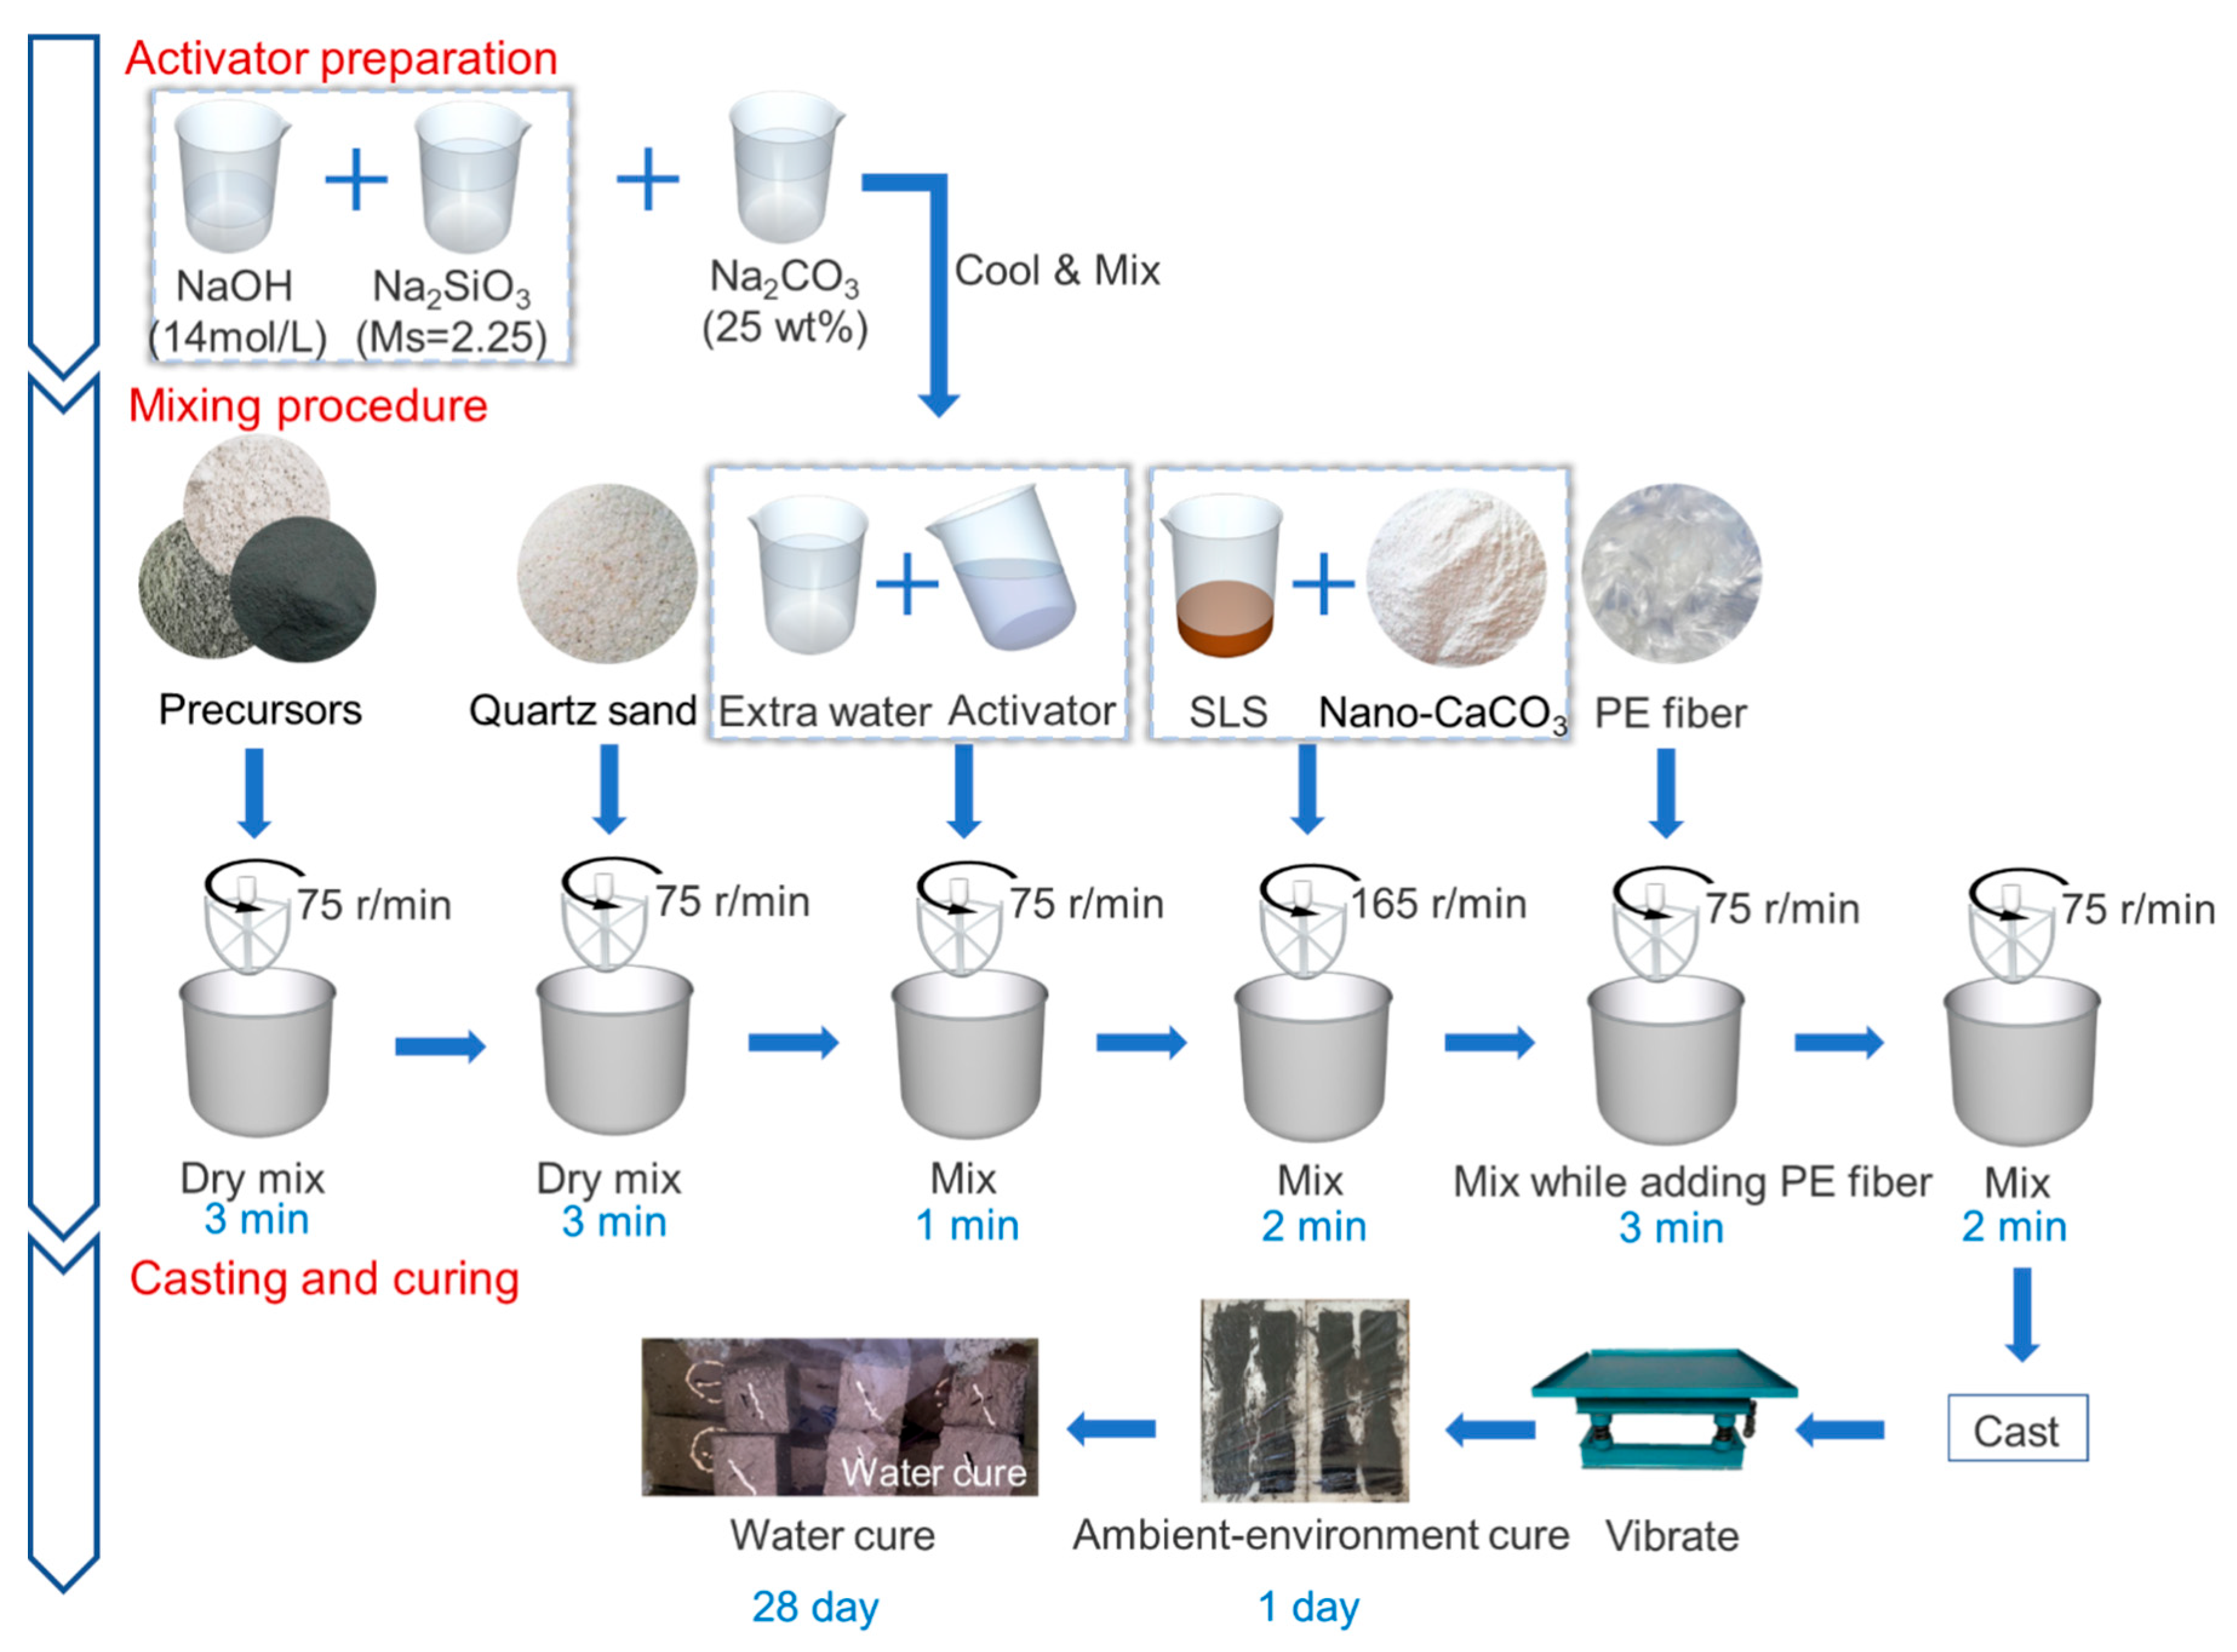
2.2. Specimens Preparation
2.3. Test Method
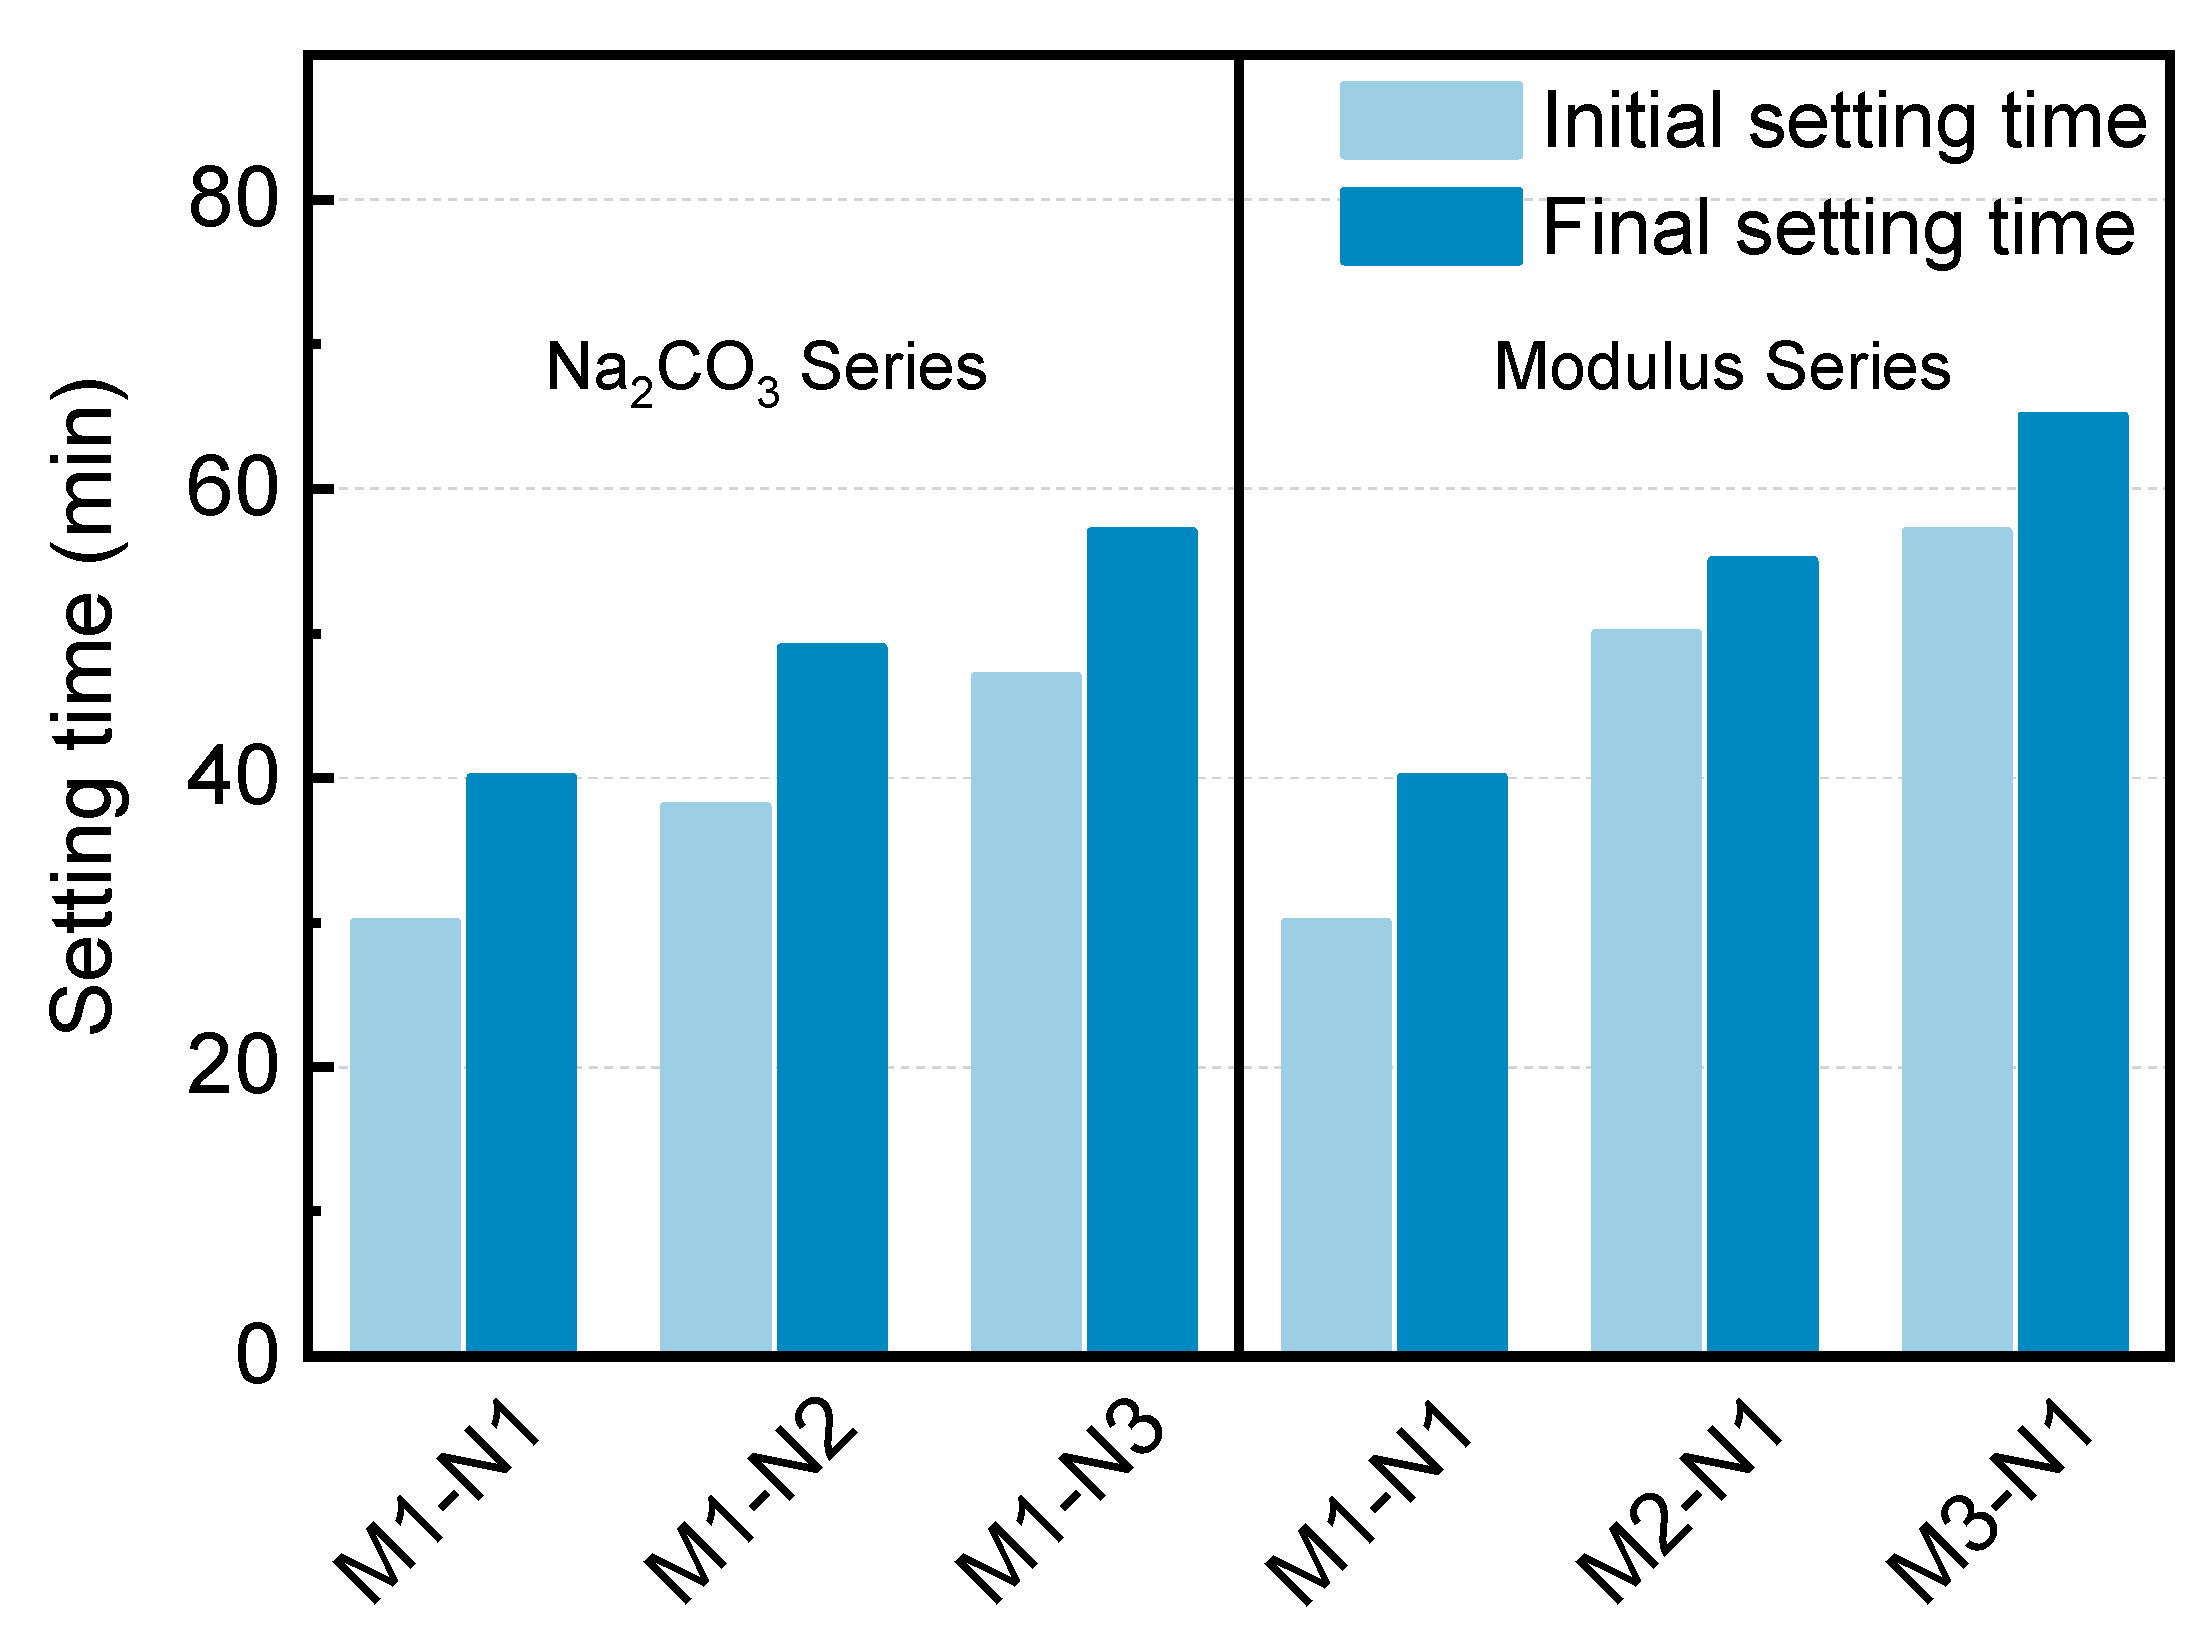
2.3.1. Setting Time
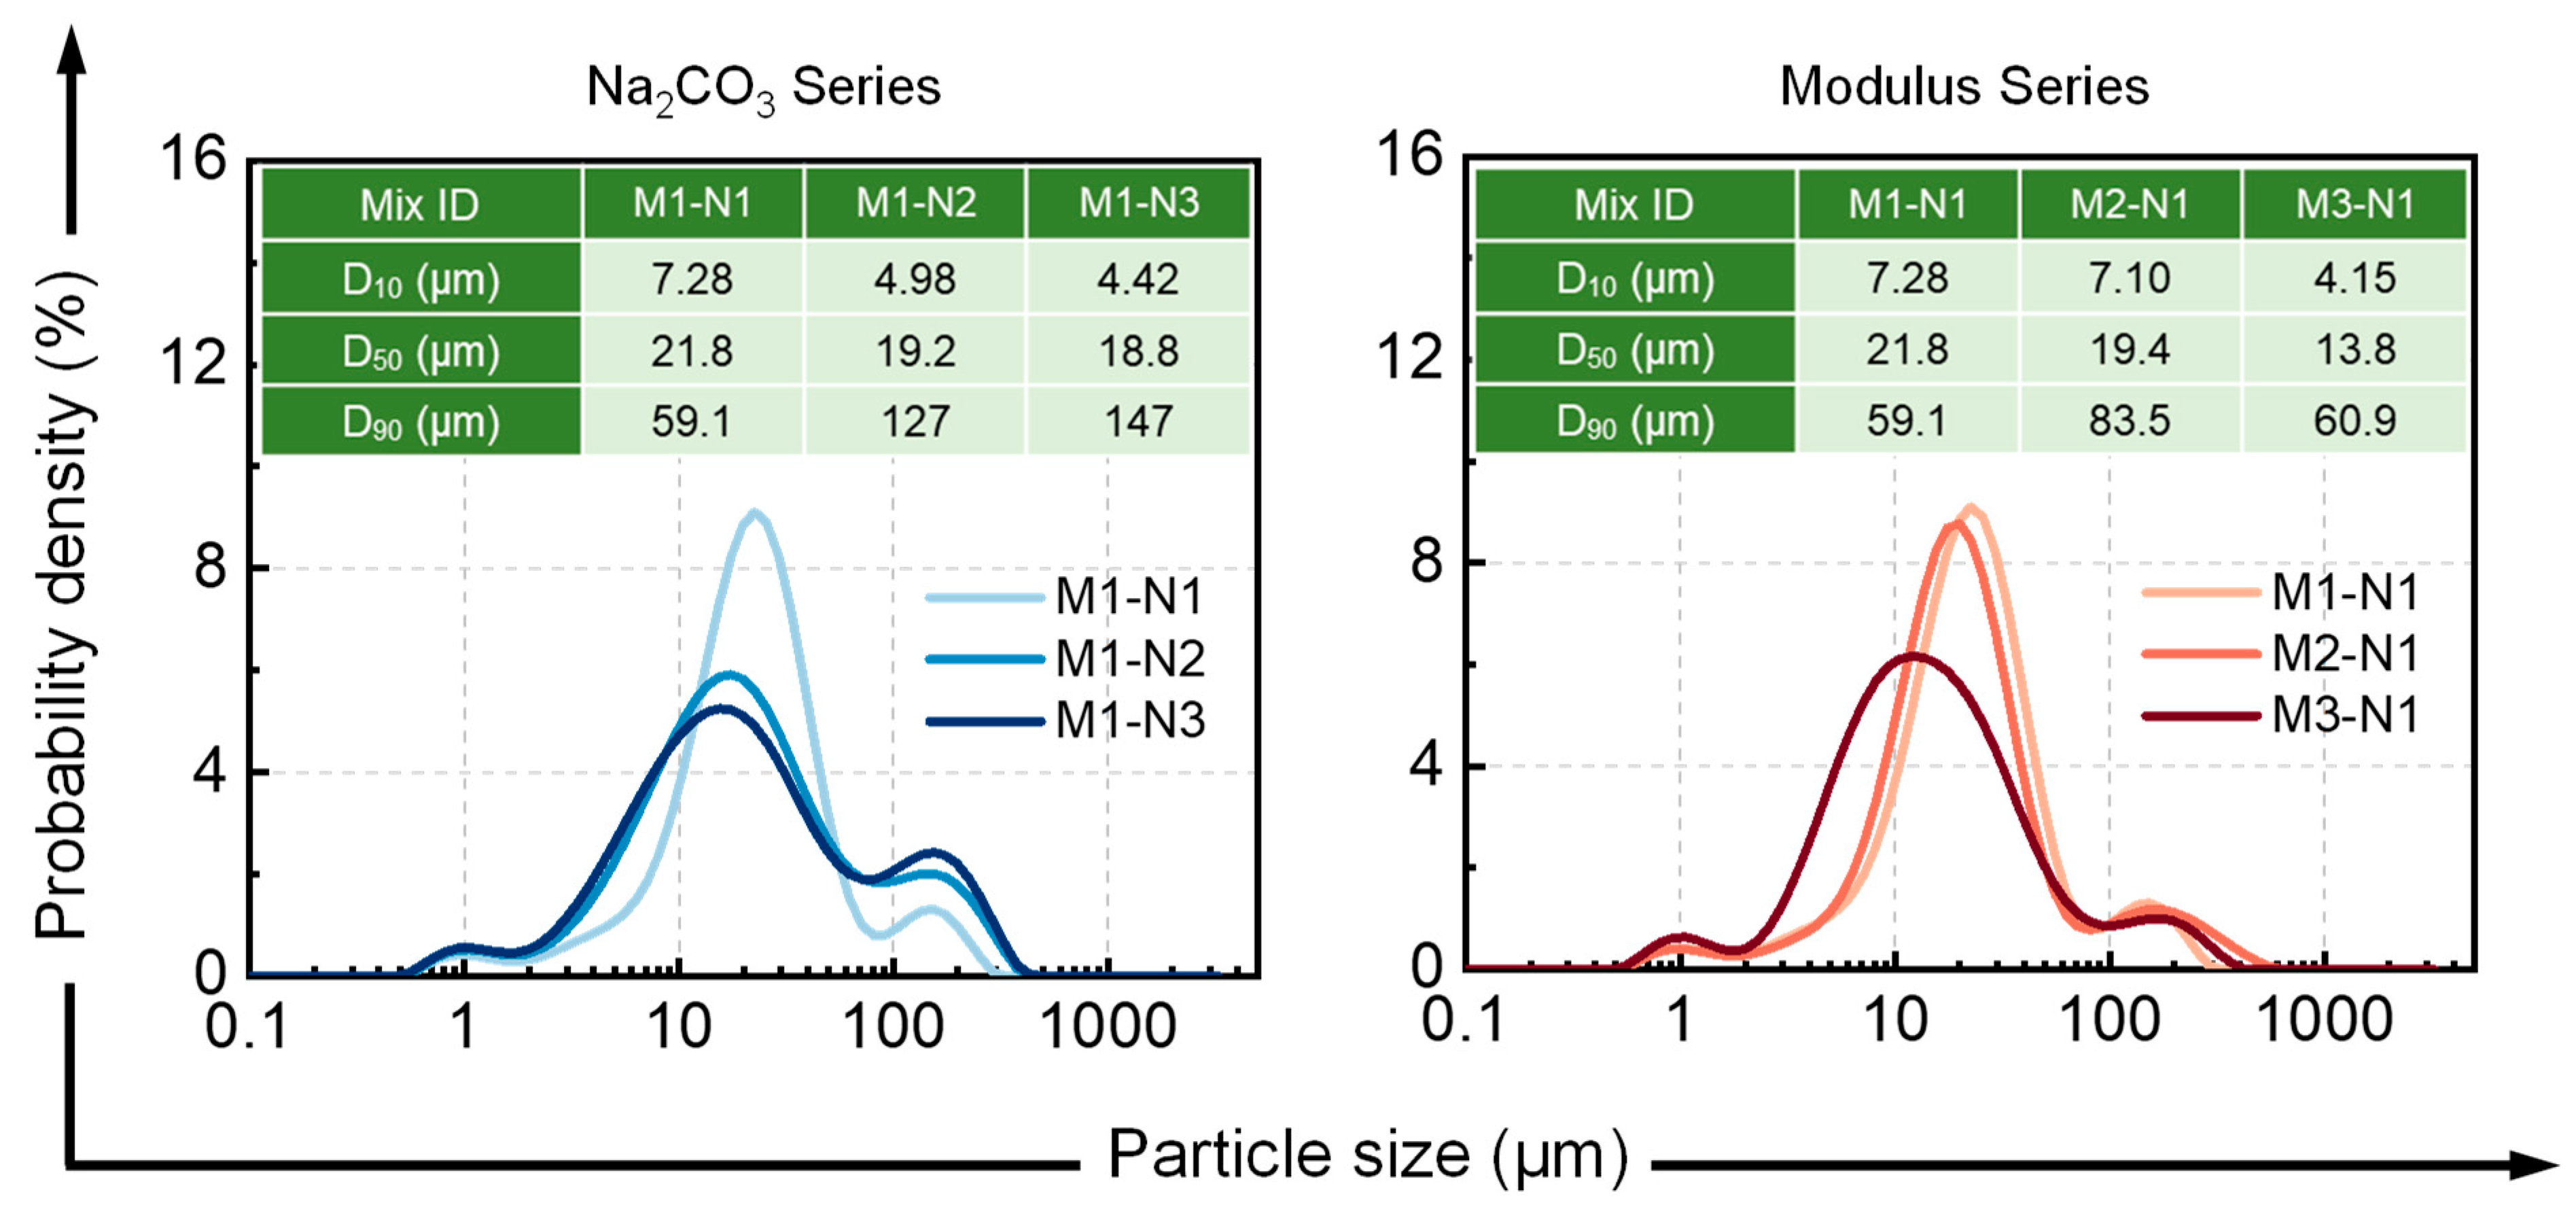
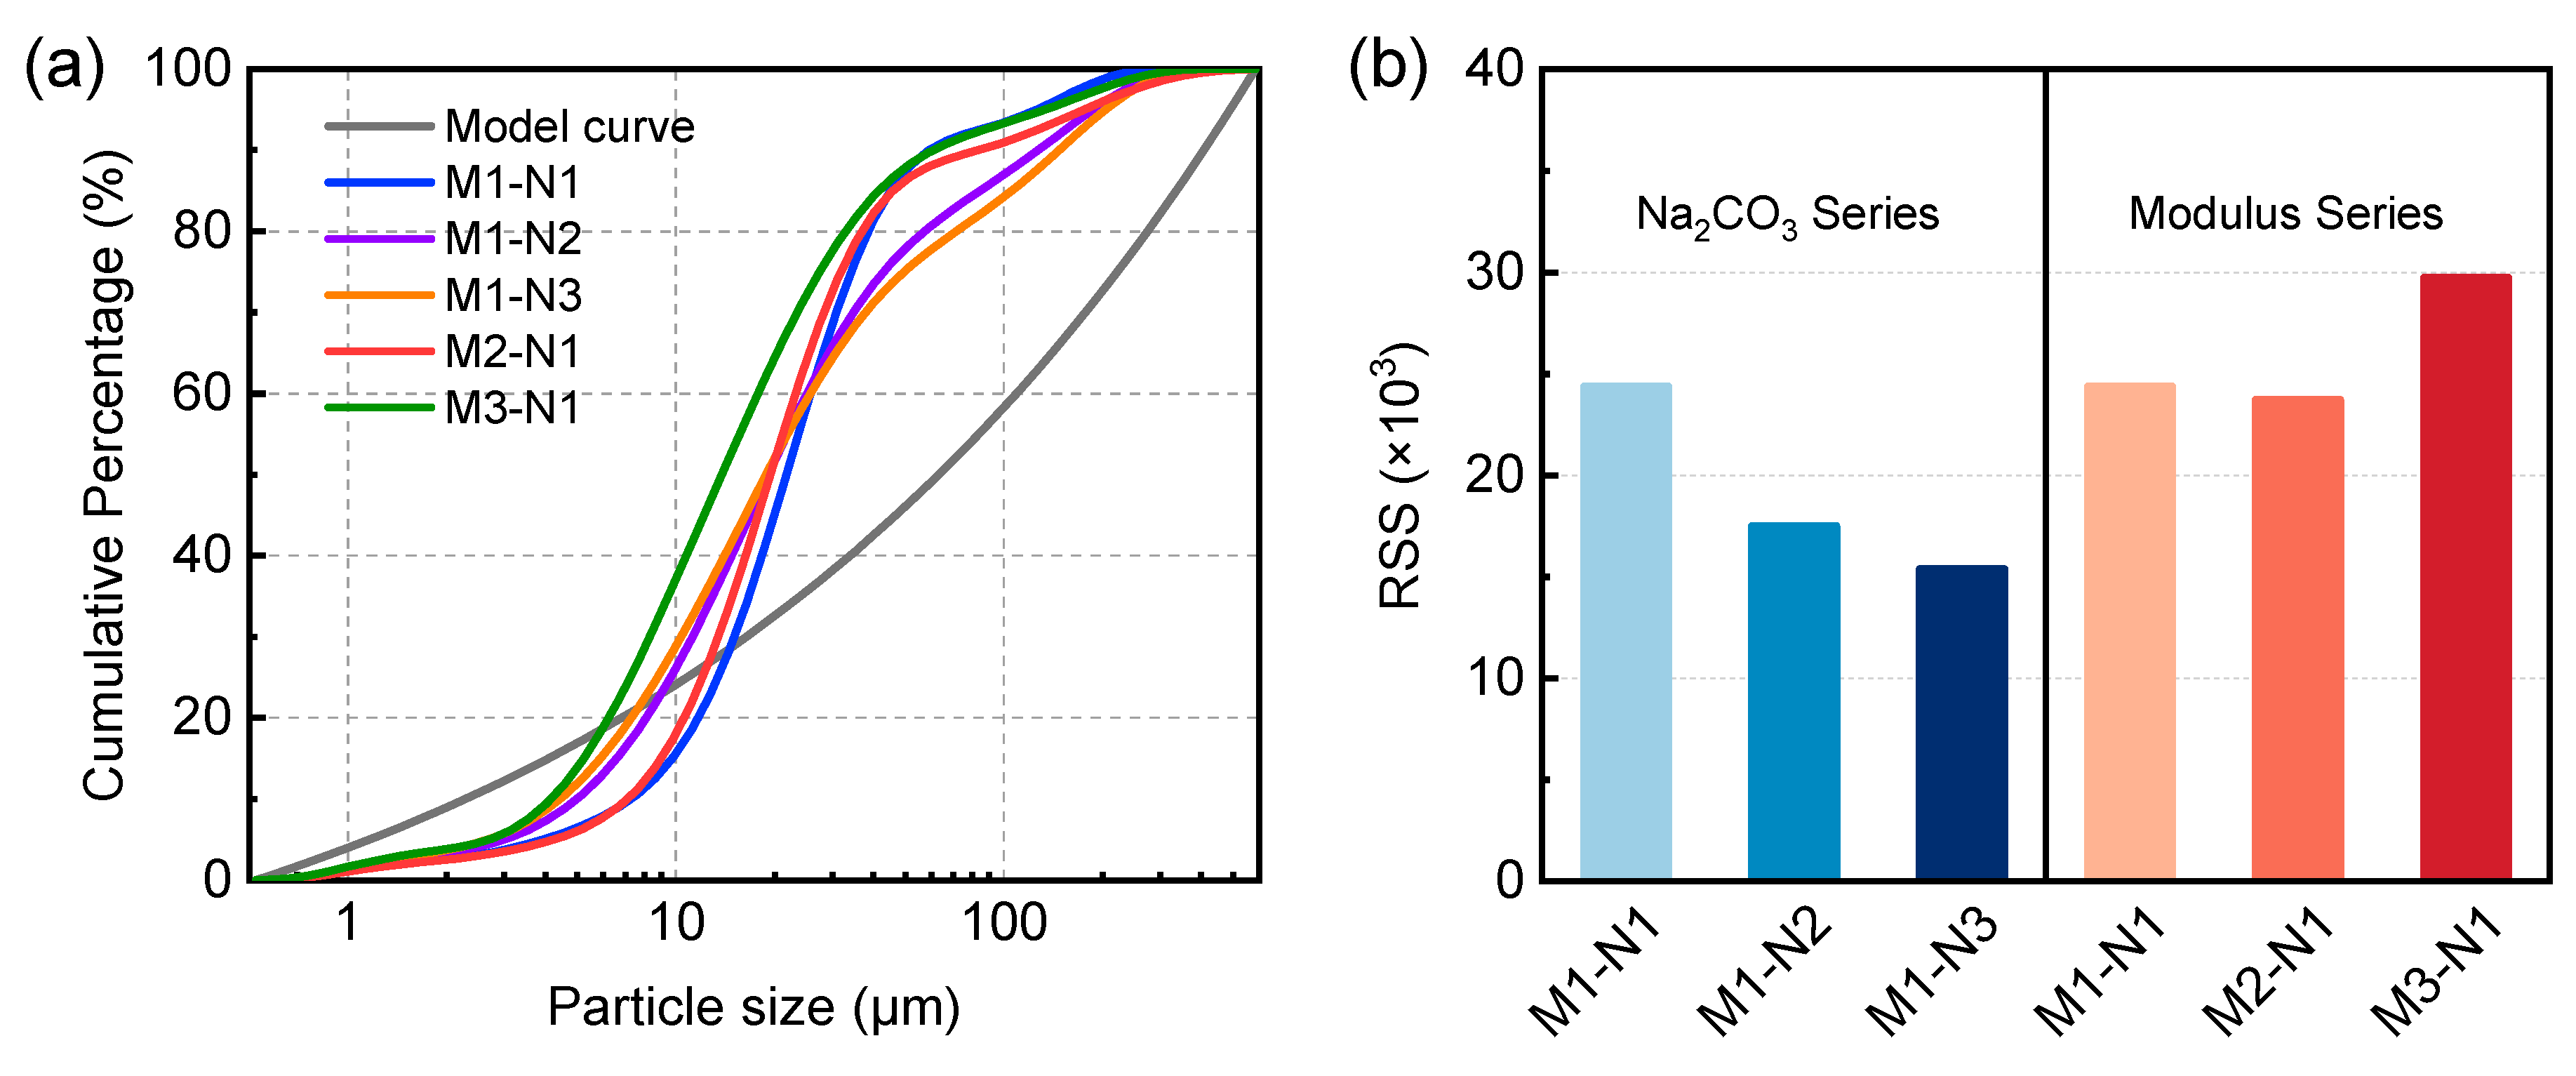
2.3.2. Size Distribution of Fresh Alkali-Activated Pastes
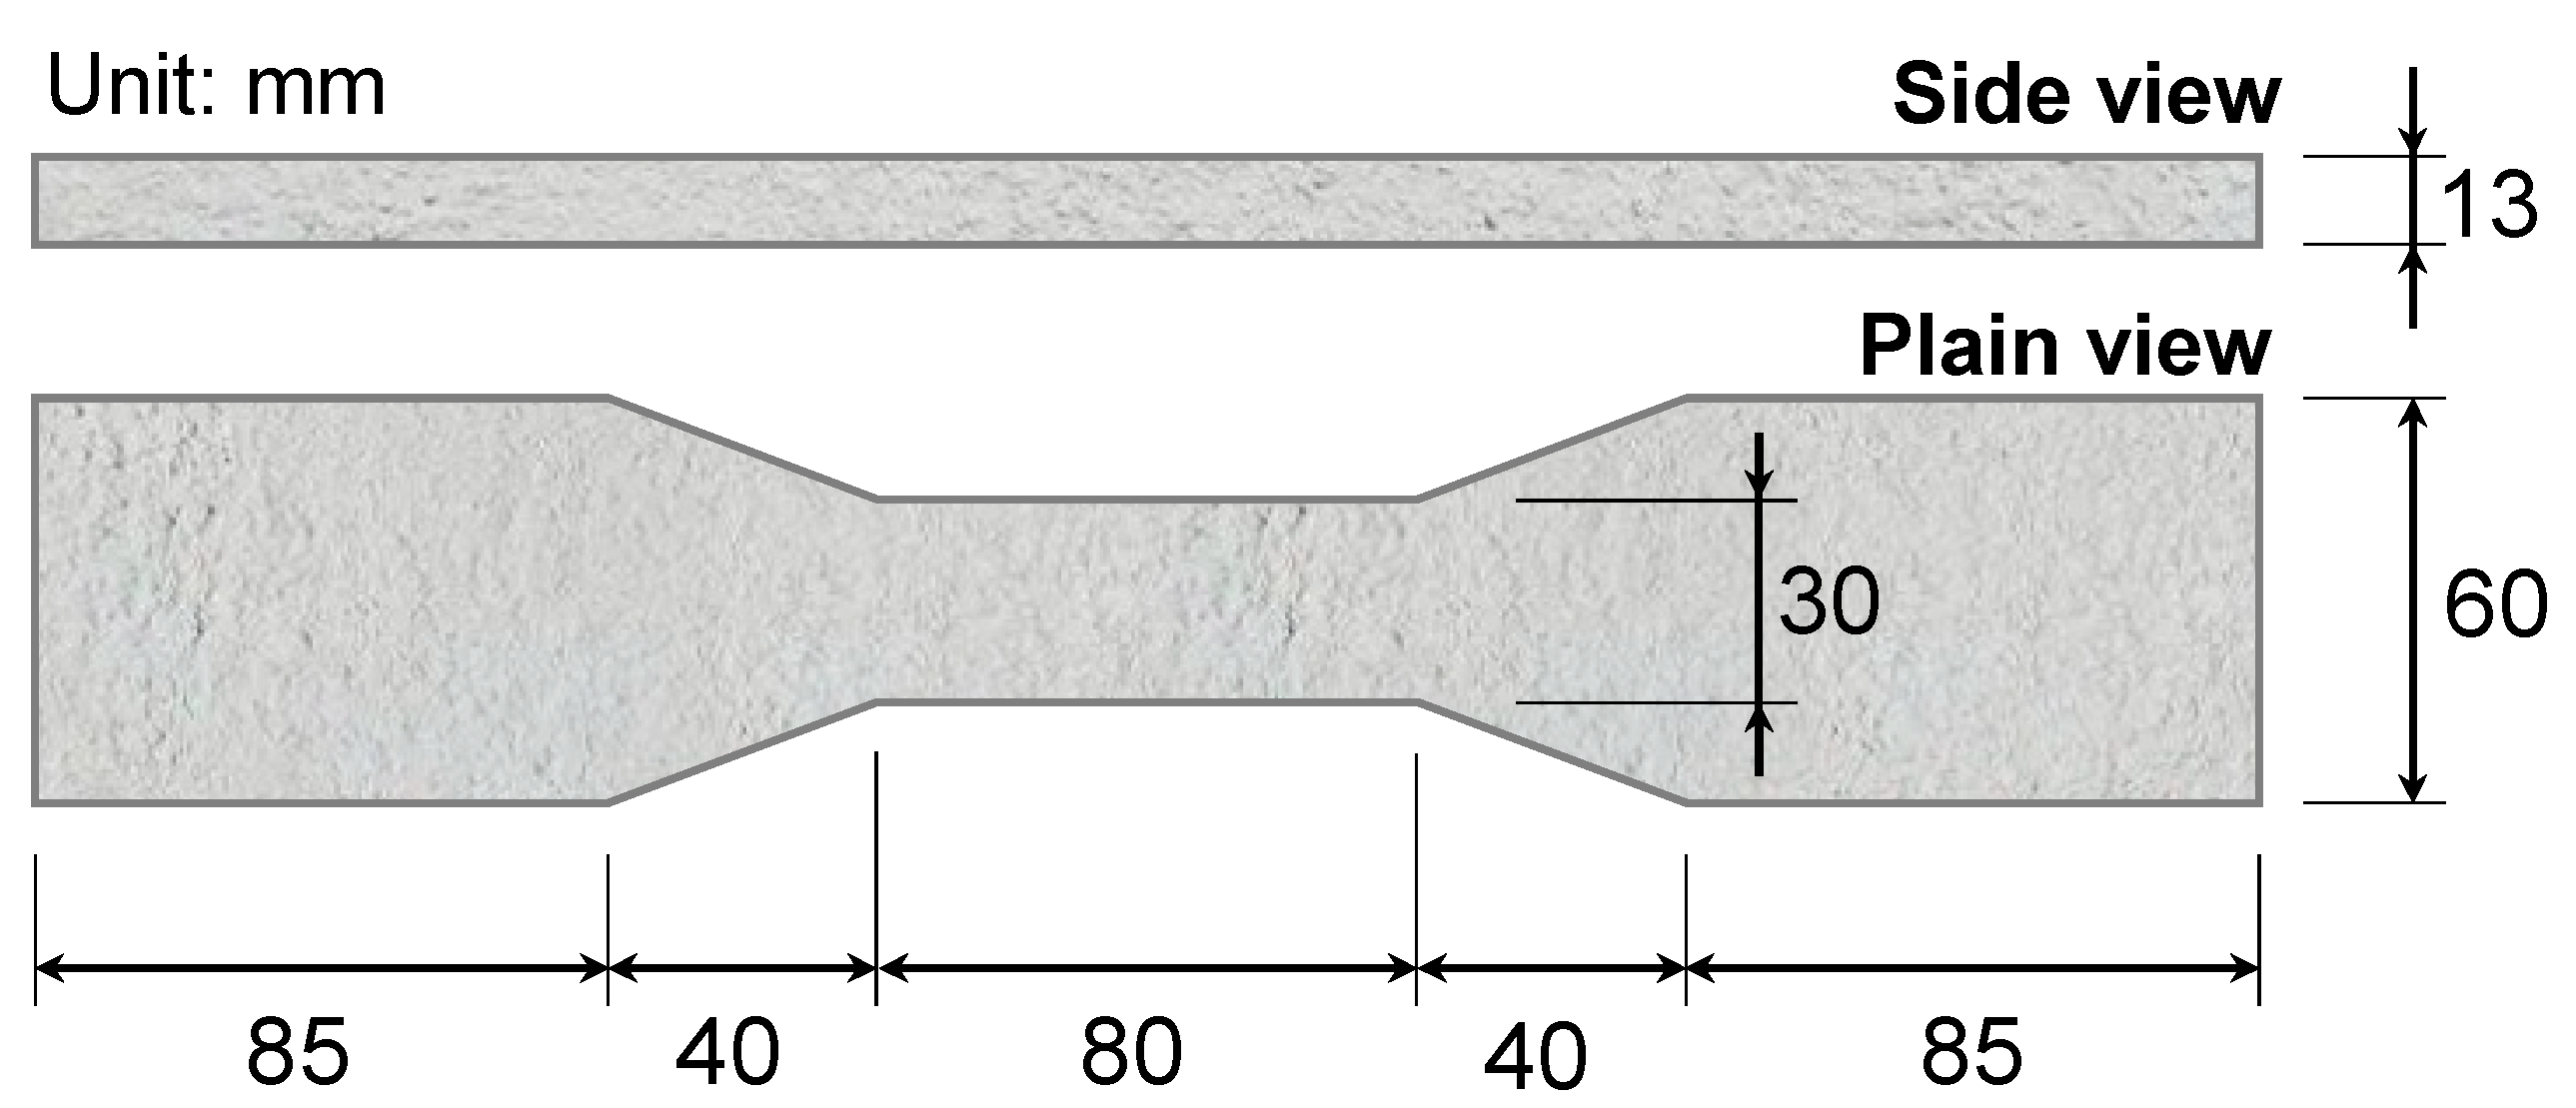
2.3.3. Mechanical Behaviors
2.3.4. X-ray Diffraction (XRD)
2.3.5. Scanning Electron Microscopy (SEM)
3. Results
3.1. Effect of Replacement Quantity of Na2CO3 and Modulus of Activator on Fresh Behavior
3.1.1. Setting Time
3.1.2. Size Distribution of Fresh Alkali-Activated Pastes
3.2. Effect of Replacement Quantity of Na2CO3 and Modulus of Activator on Compressive Strength
3.3. Effect of Replacement Quantity of Na2CO3 and Modulus of Activator on Tensile Behavior of ASUHPC
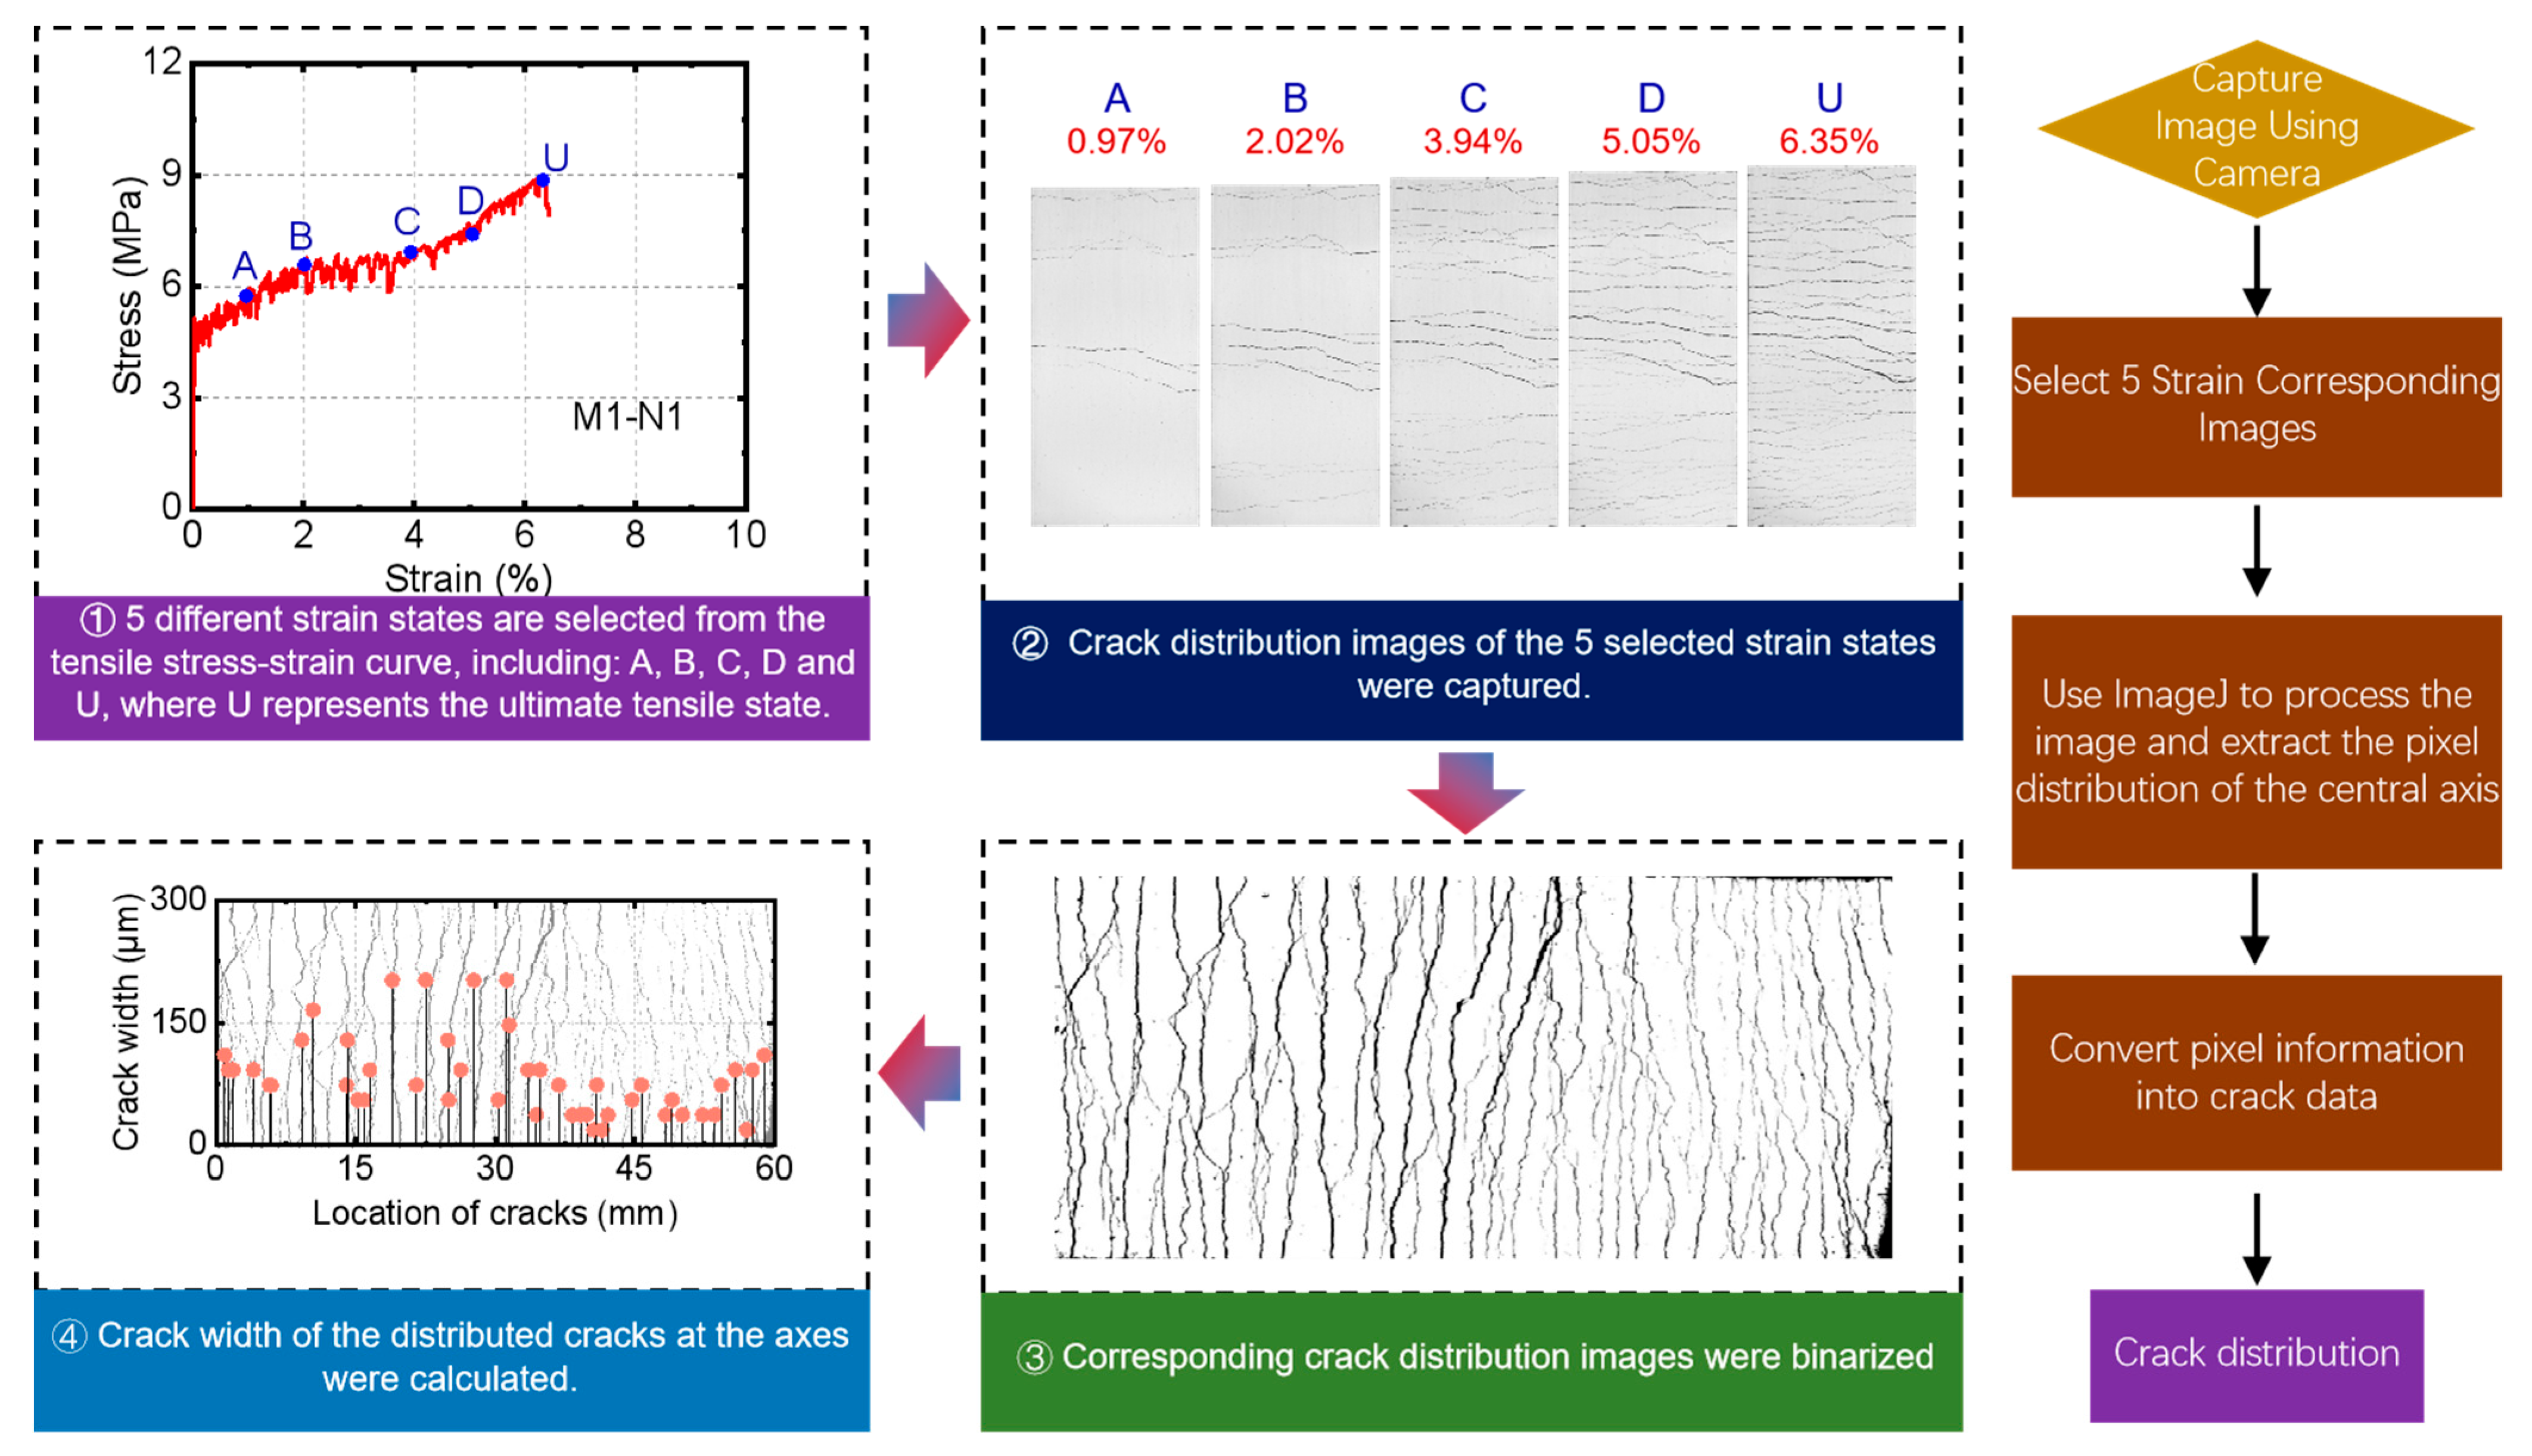
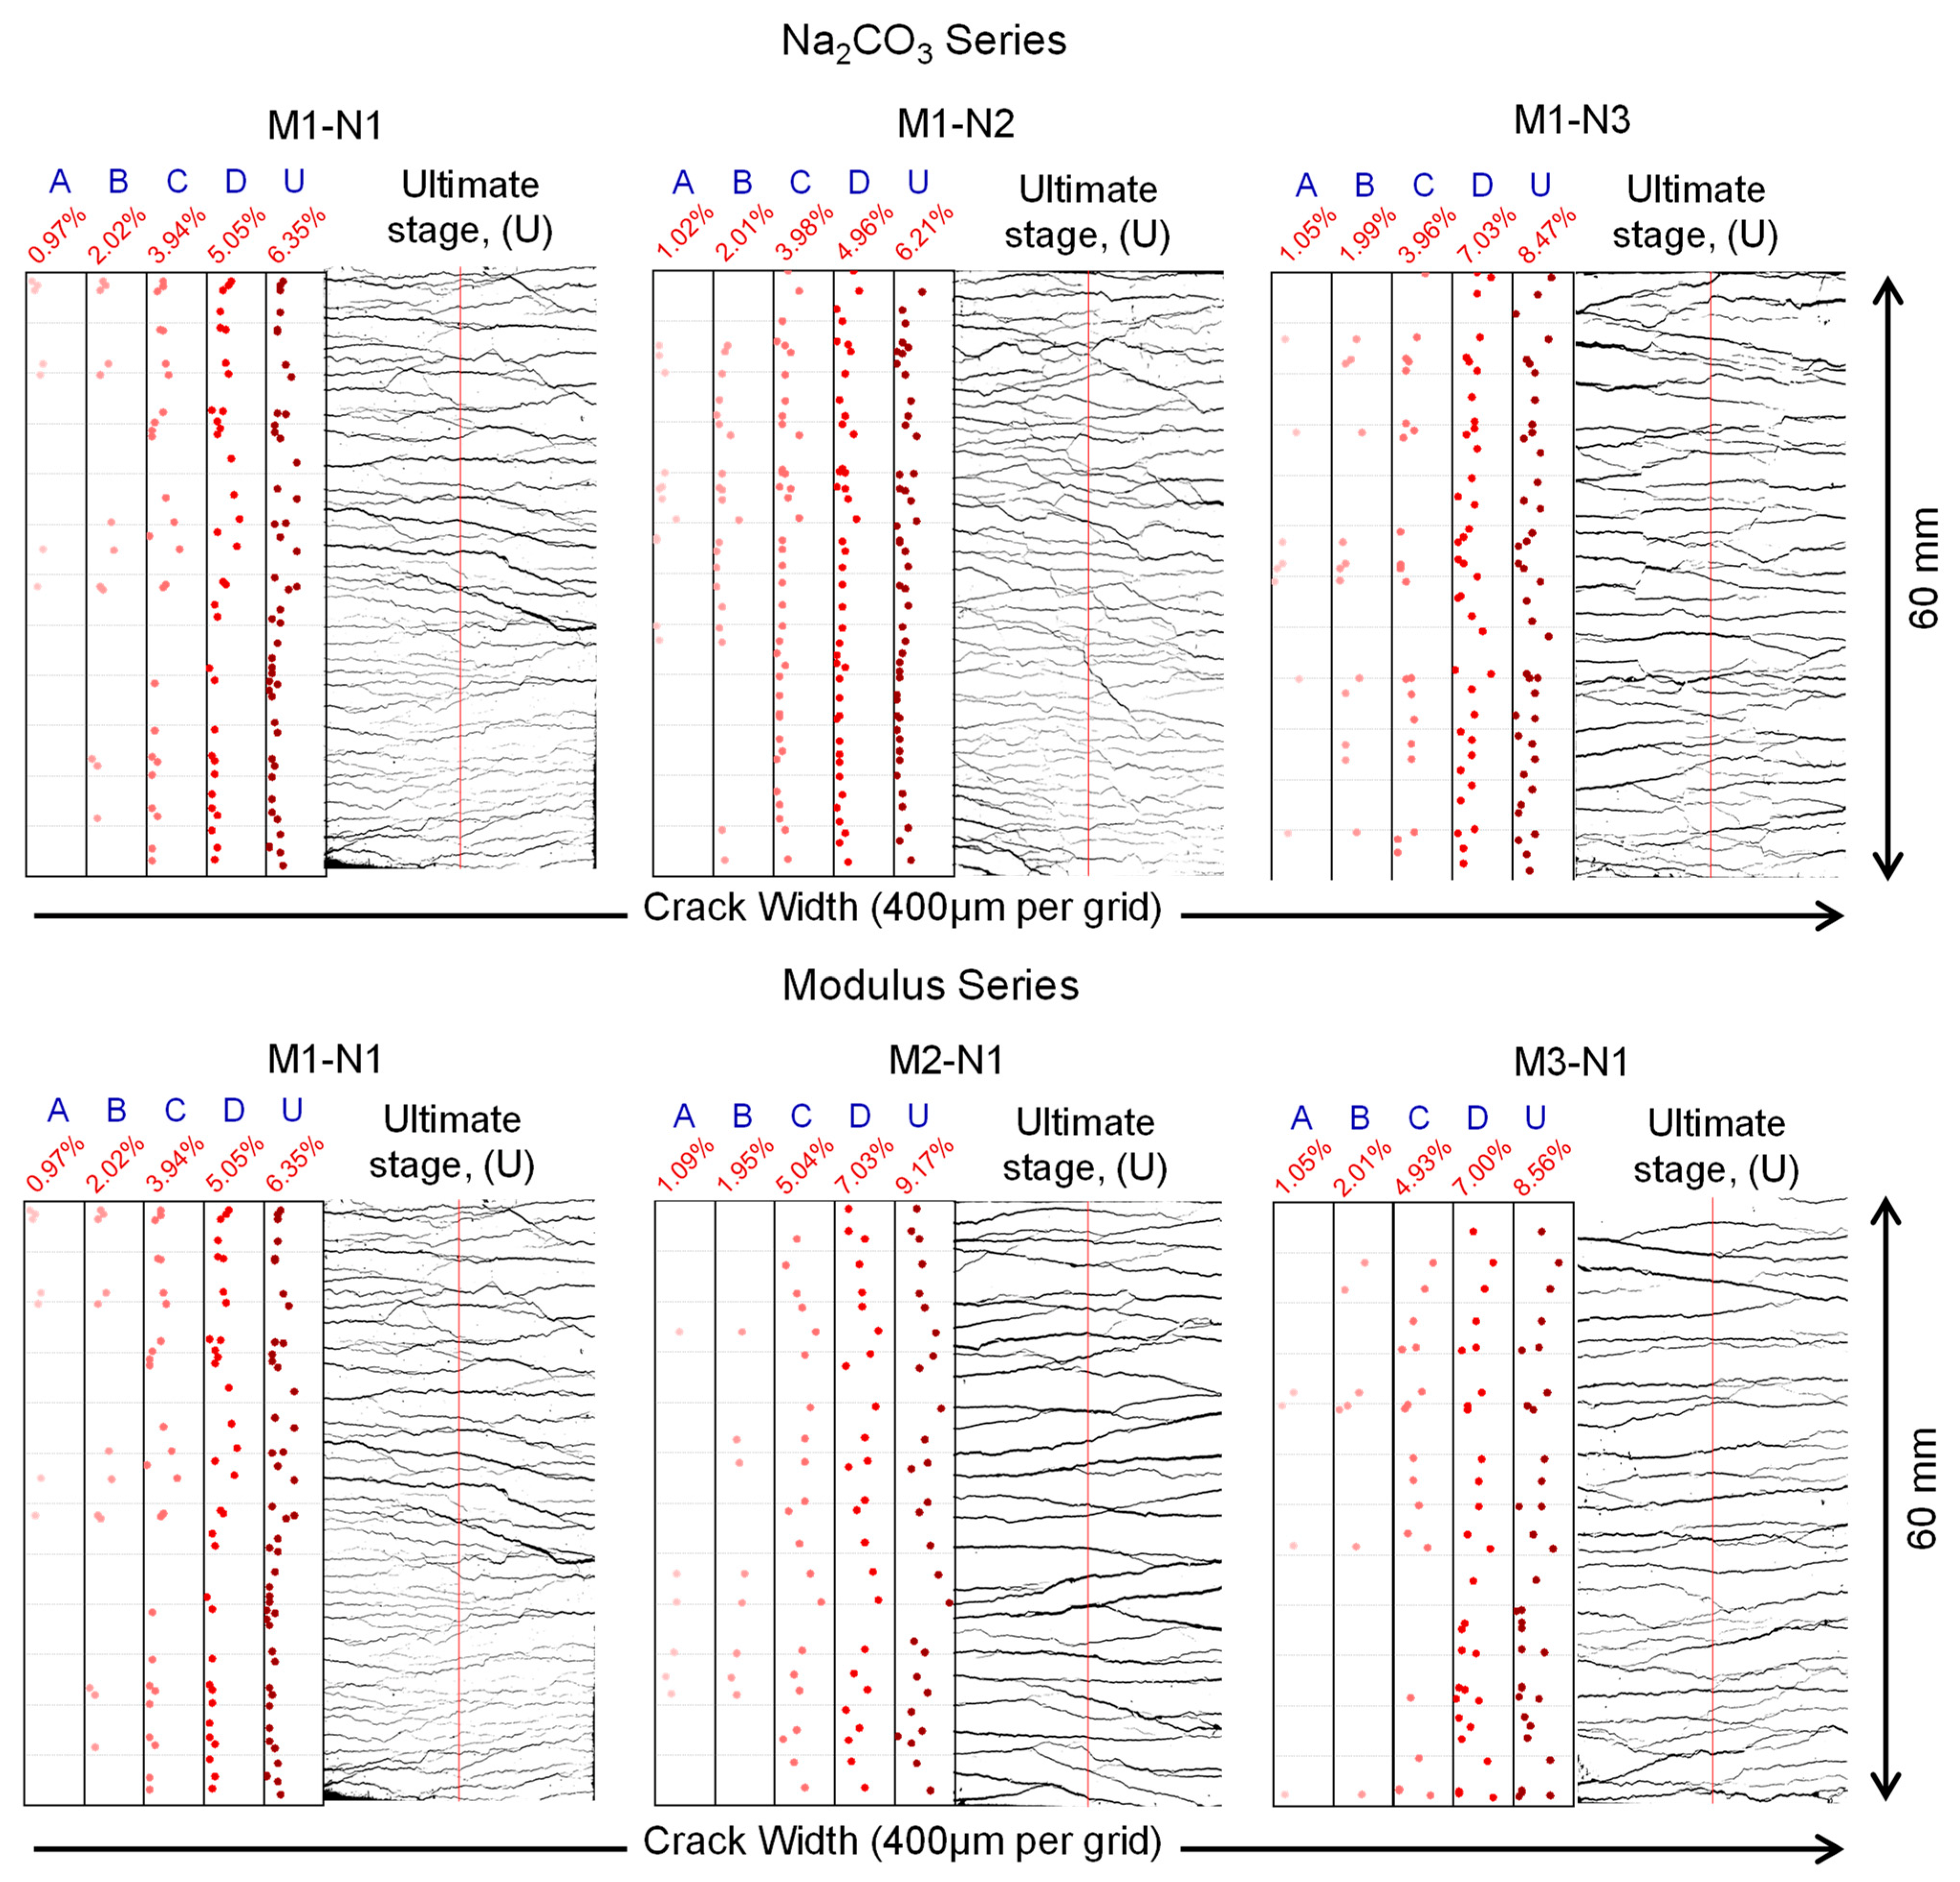
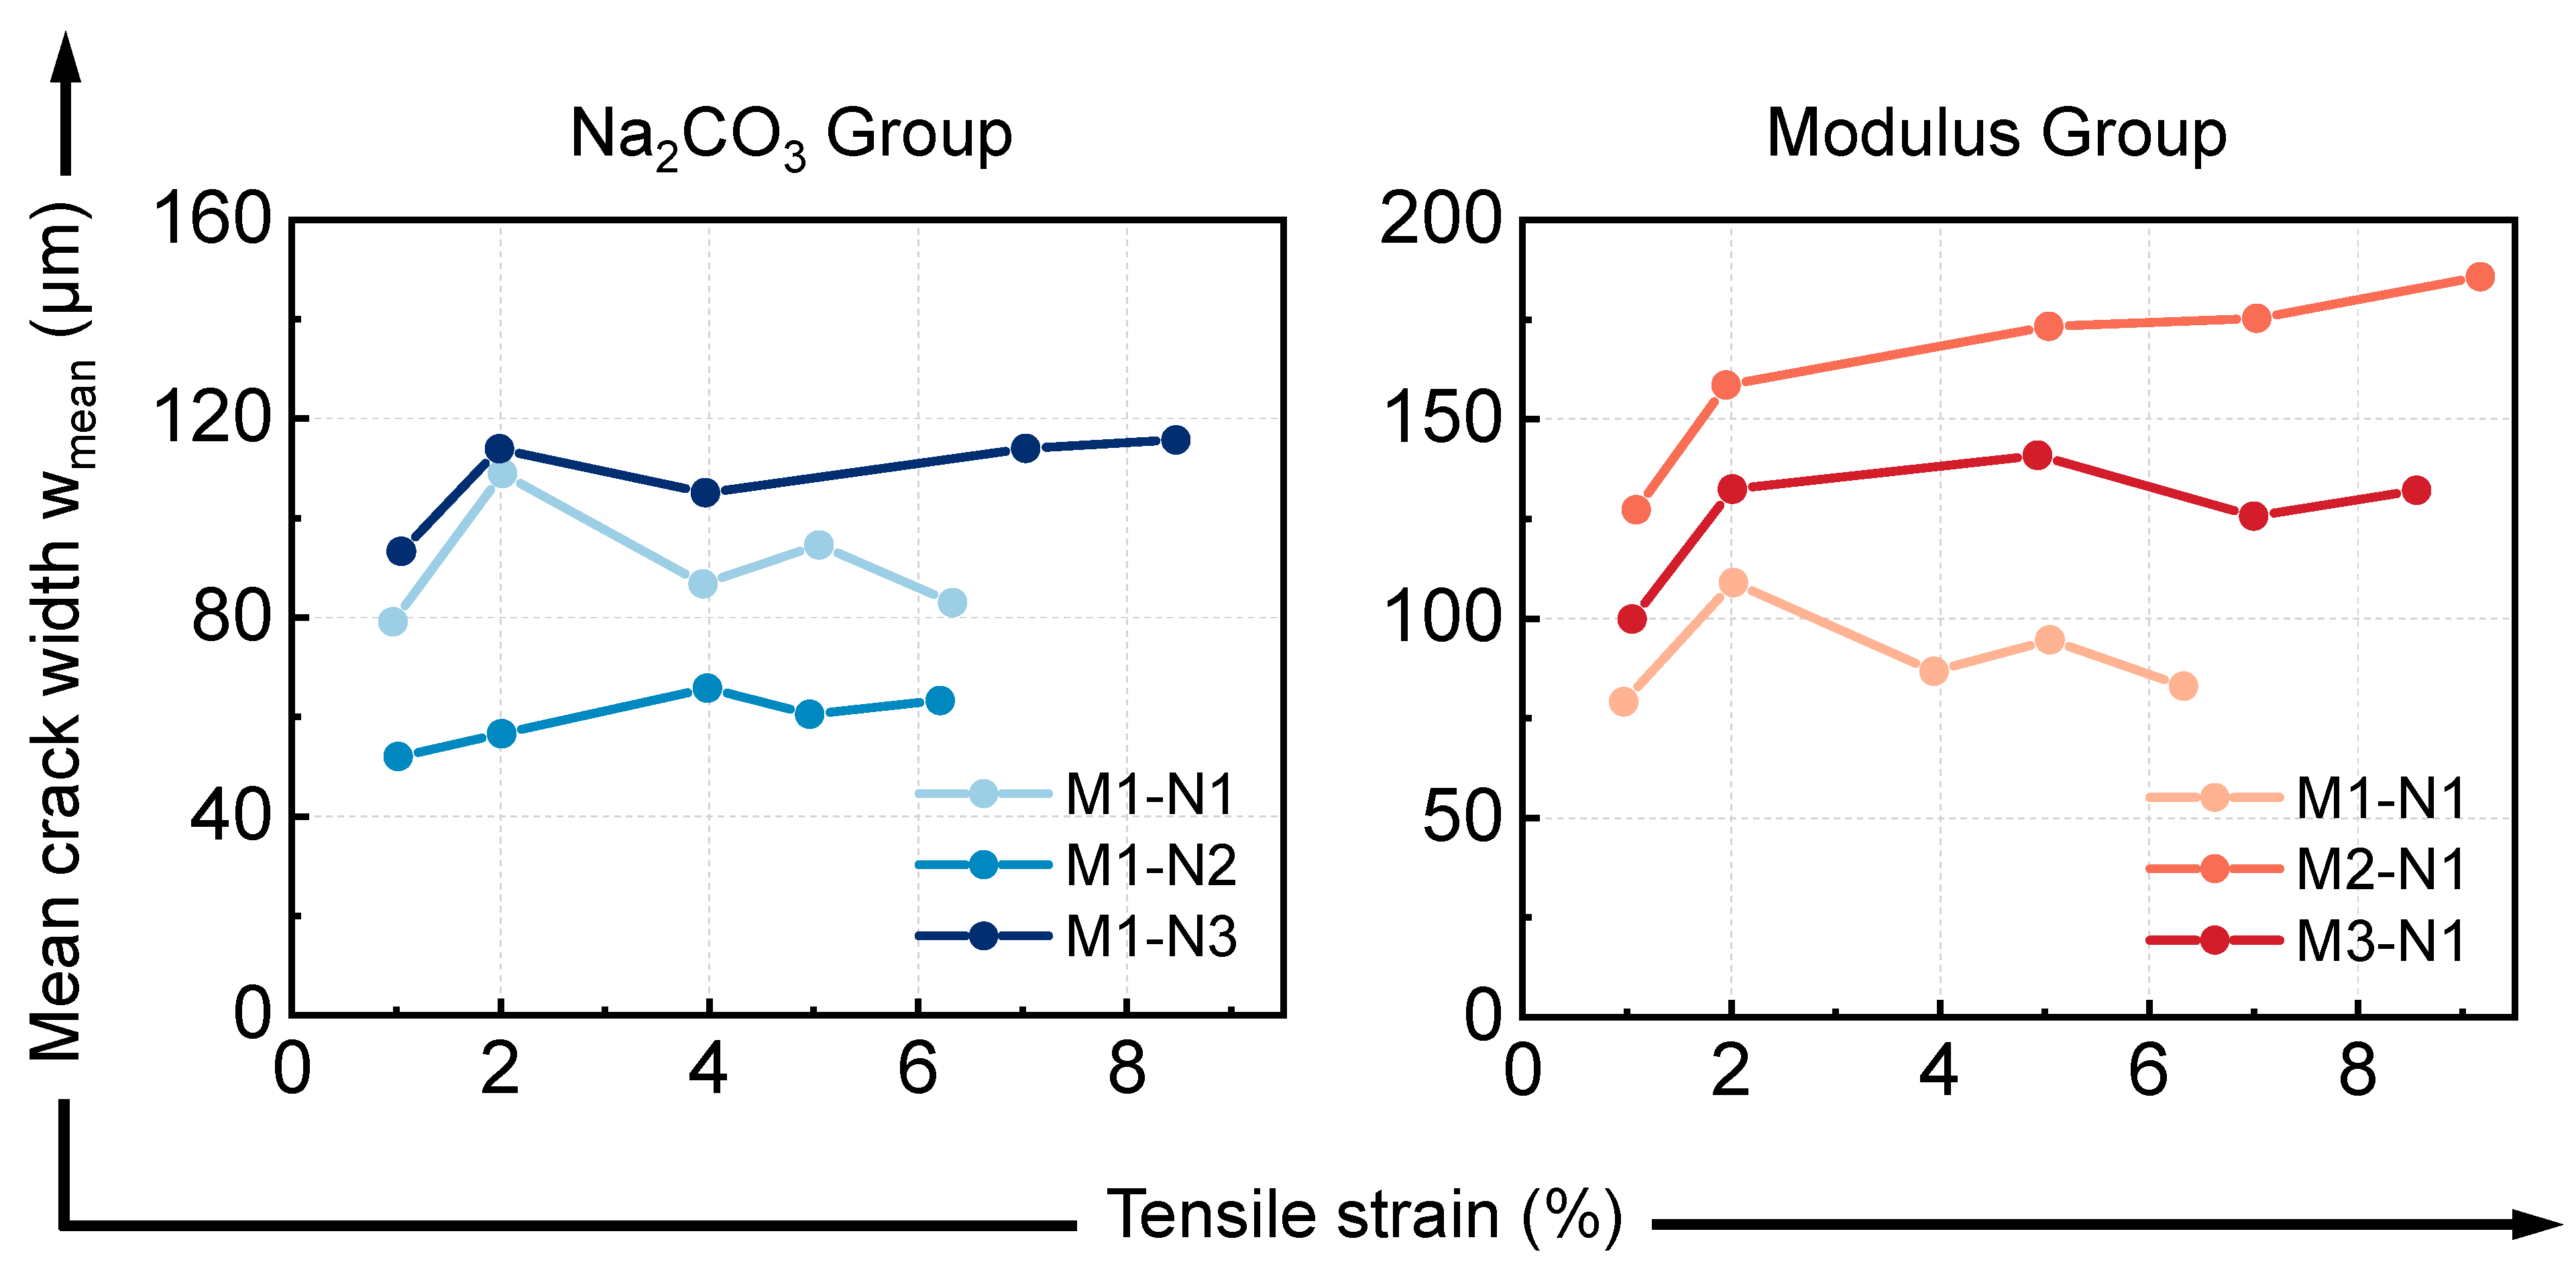
3.3.1. Cracking Behavior
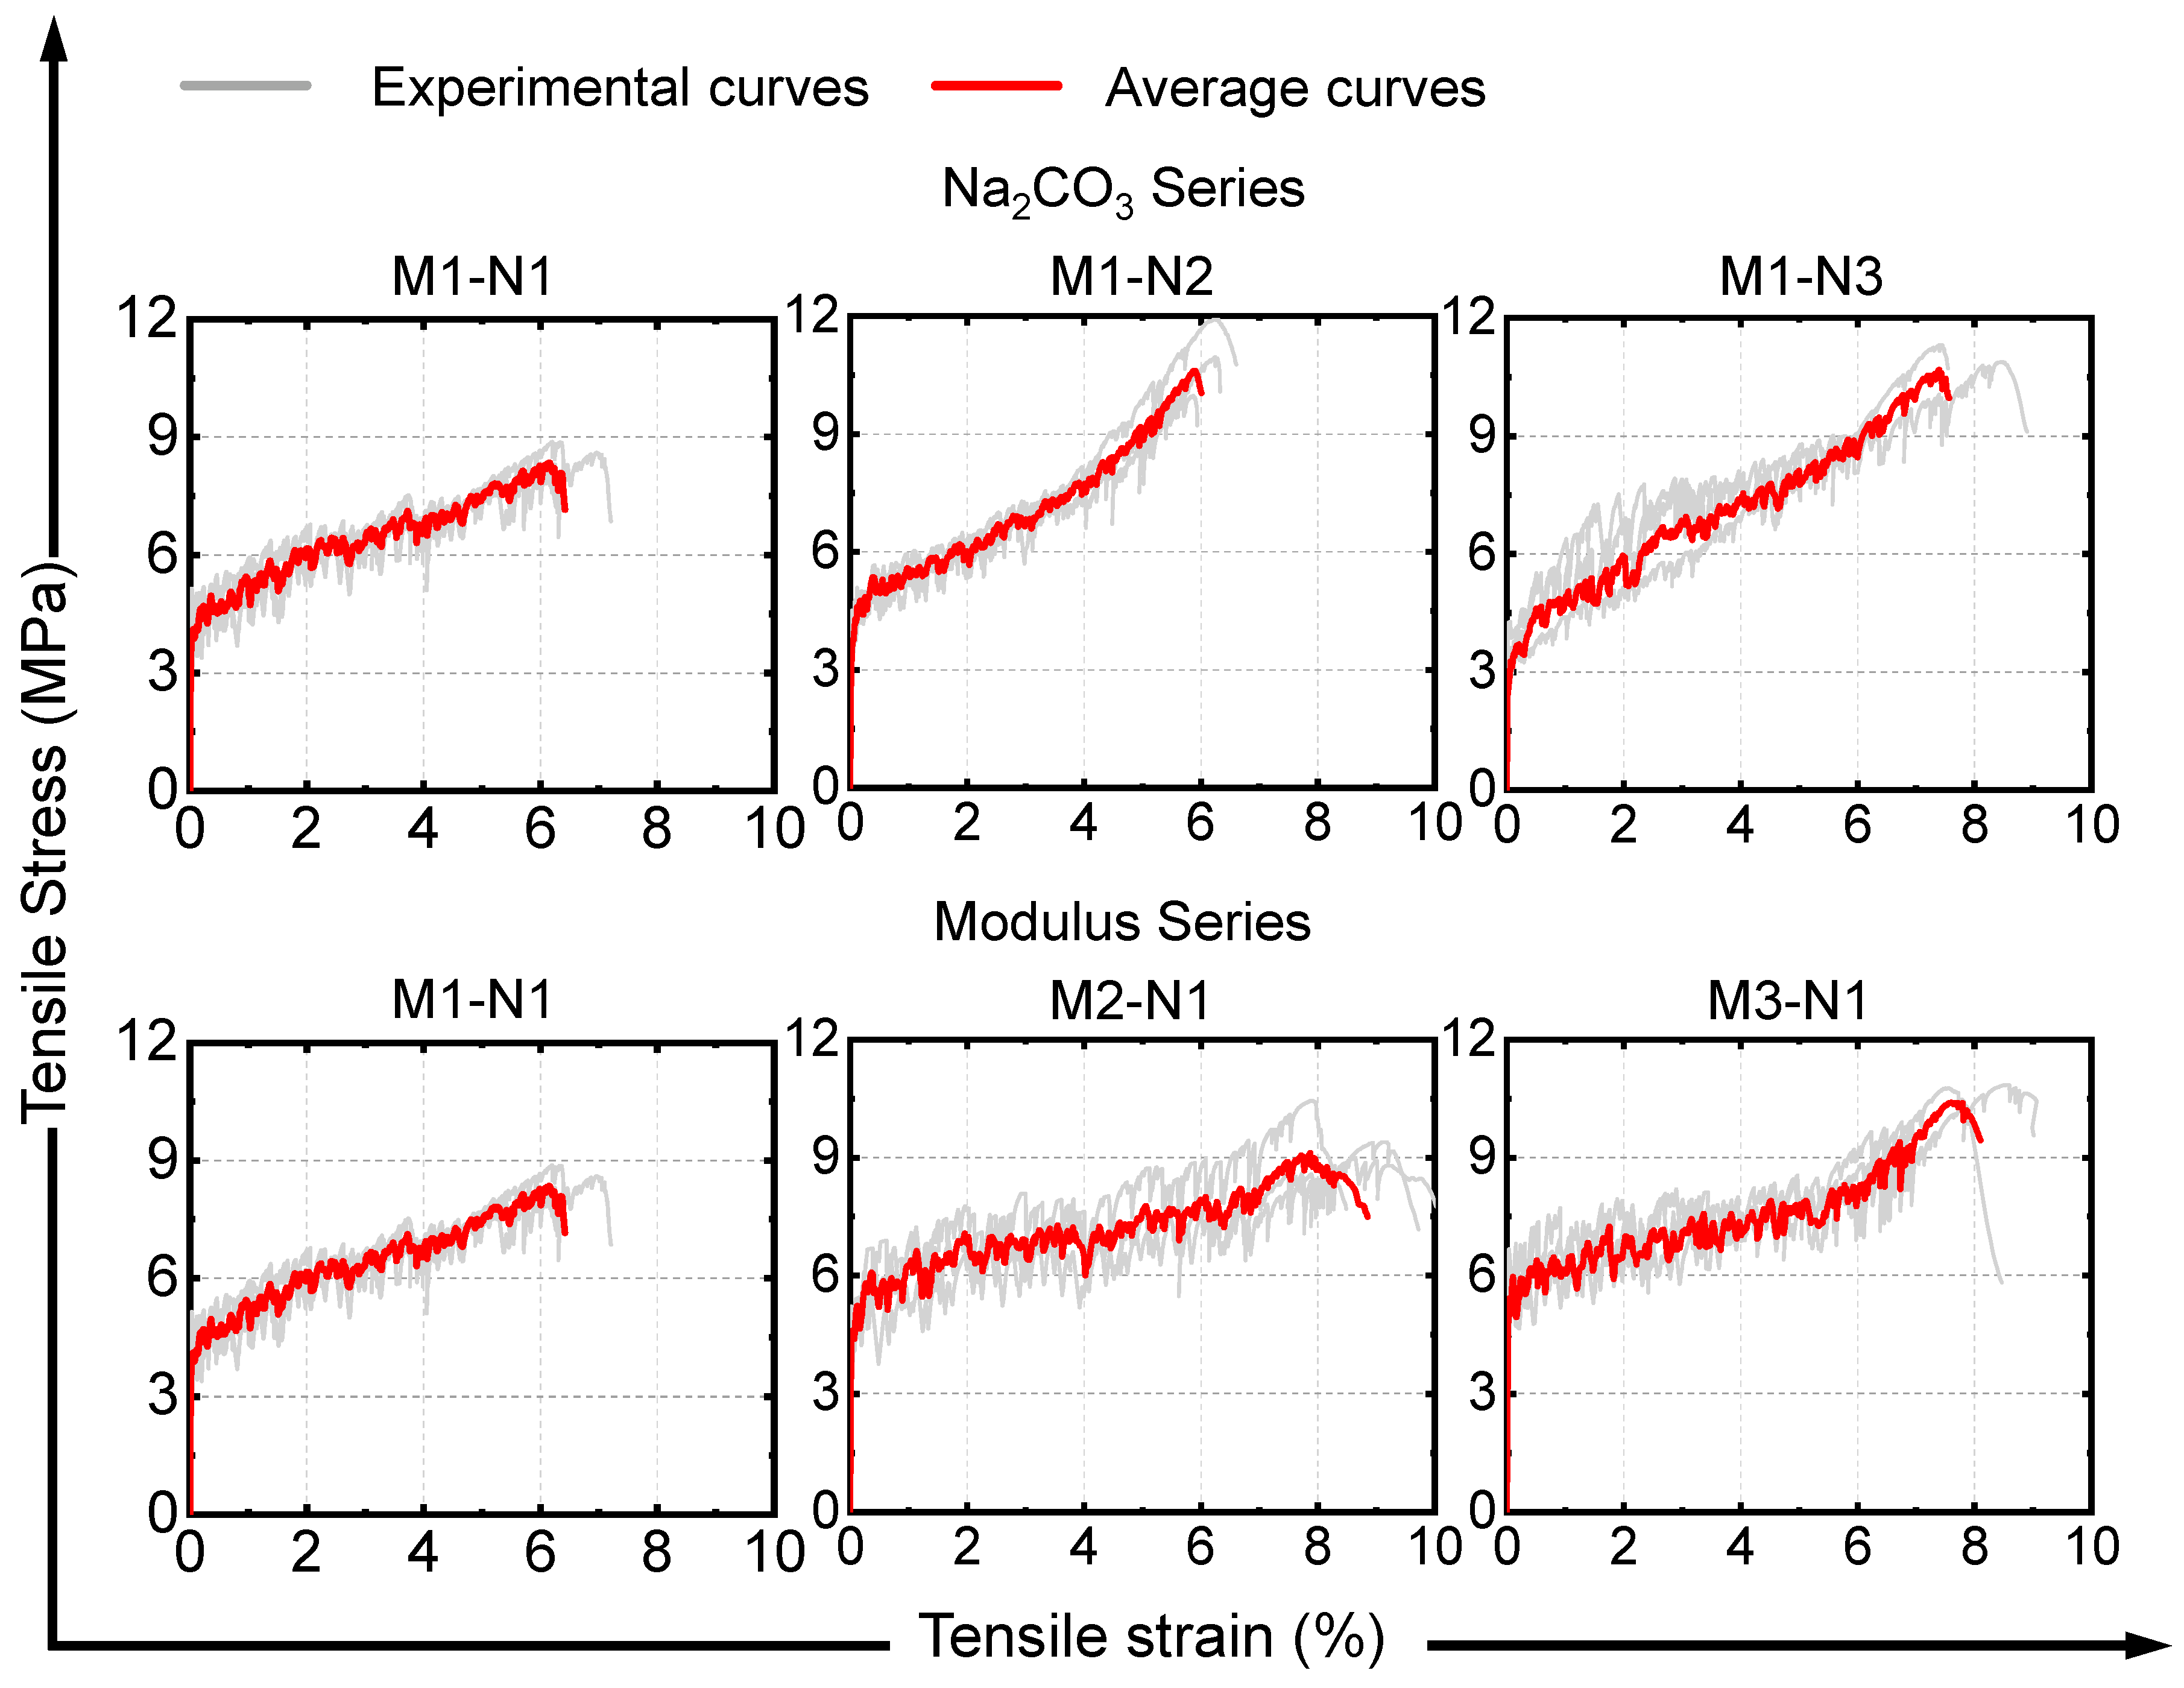
3.3.2. Tensile Stress-Strain Curve
3.4. Mineral Characterization
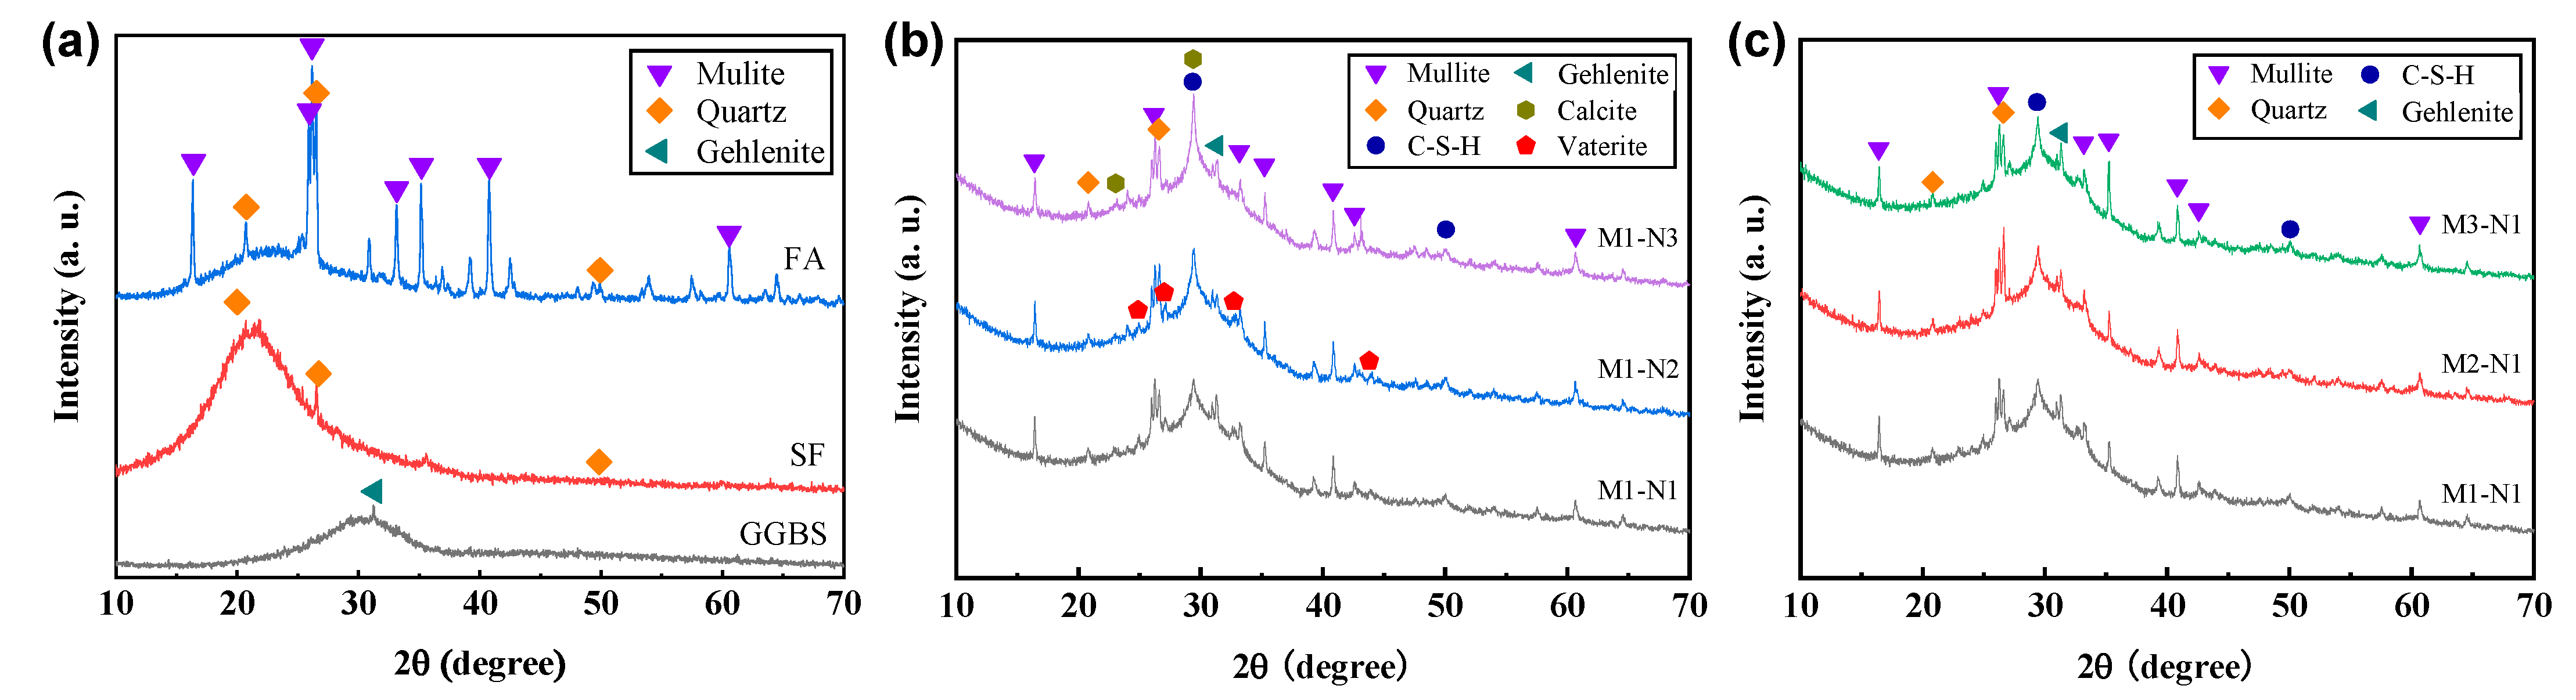
3.4.1. X-ray Diffraction
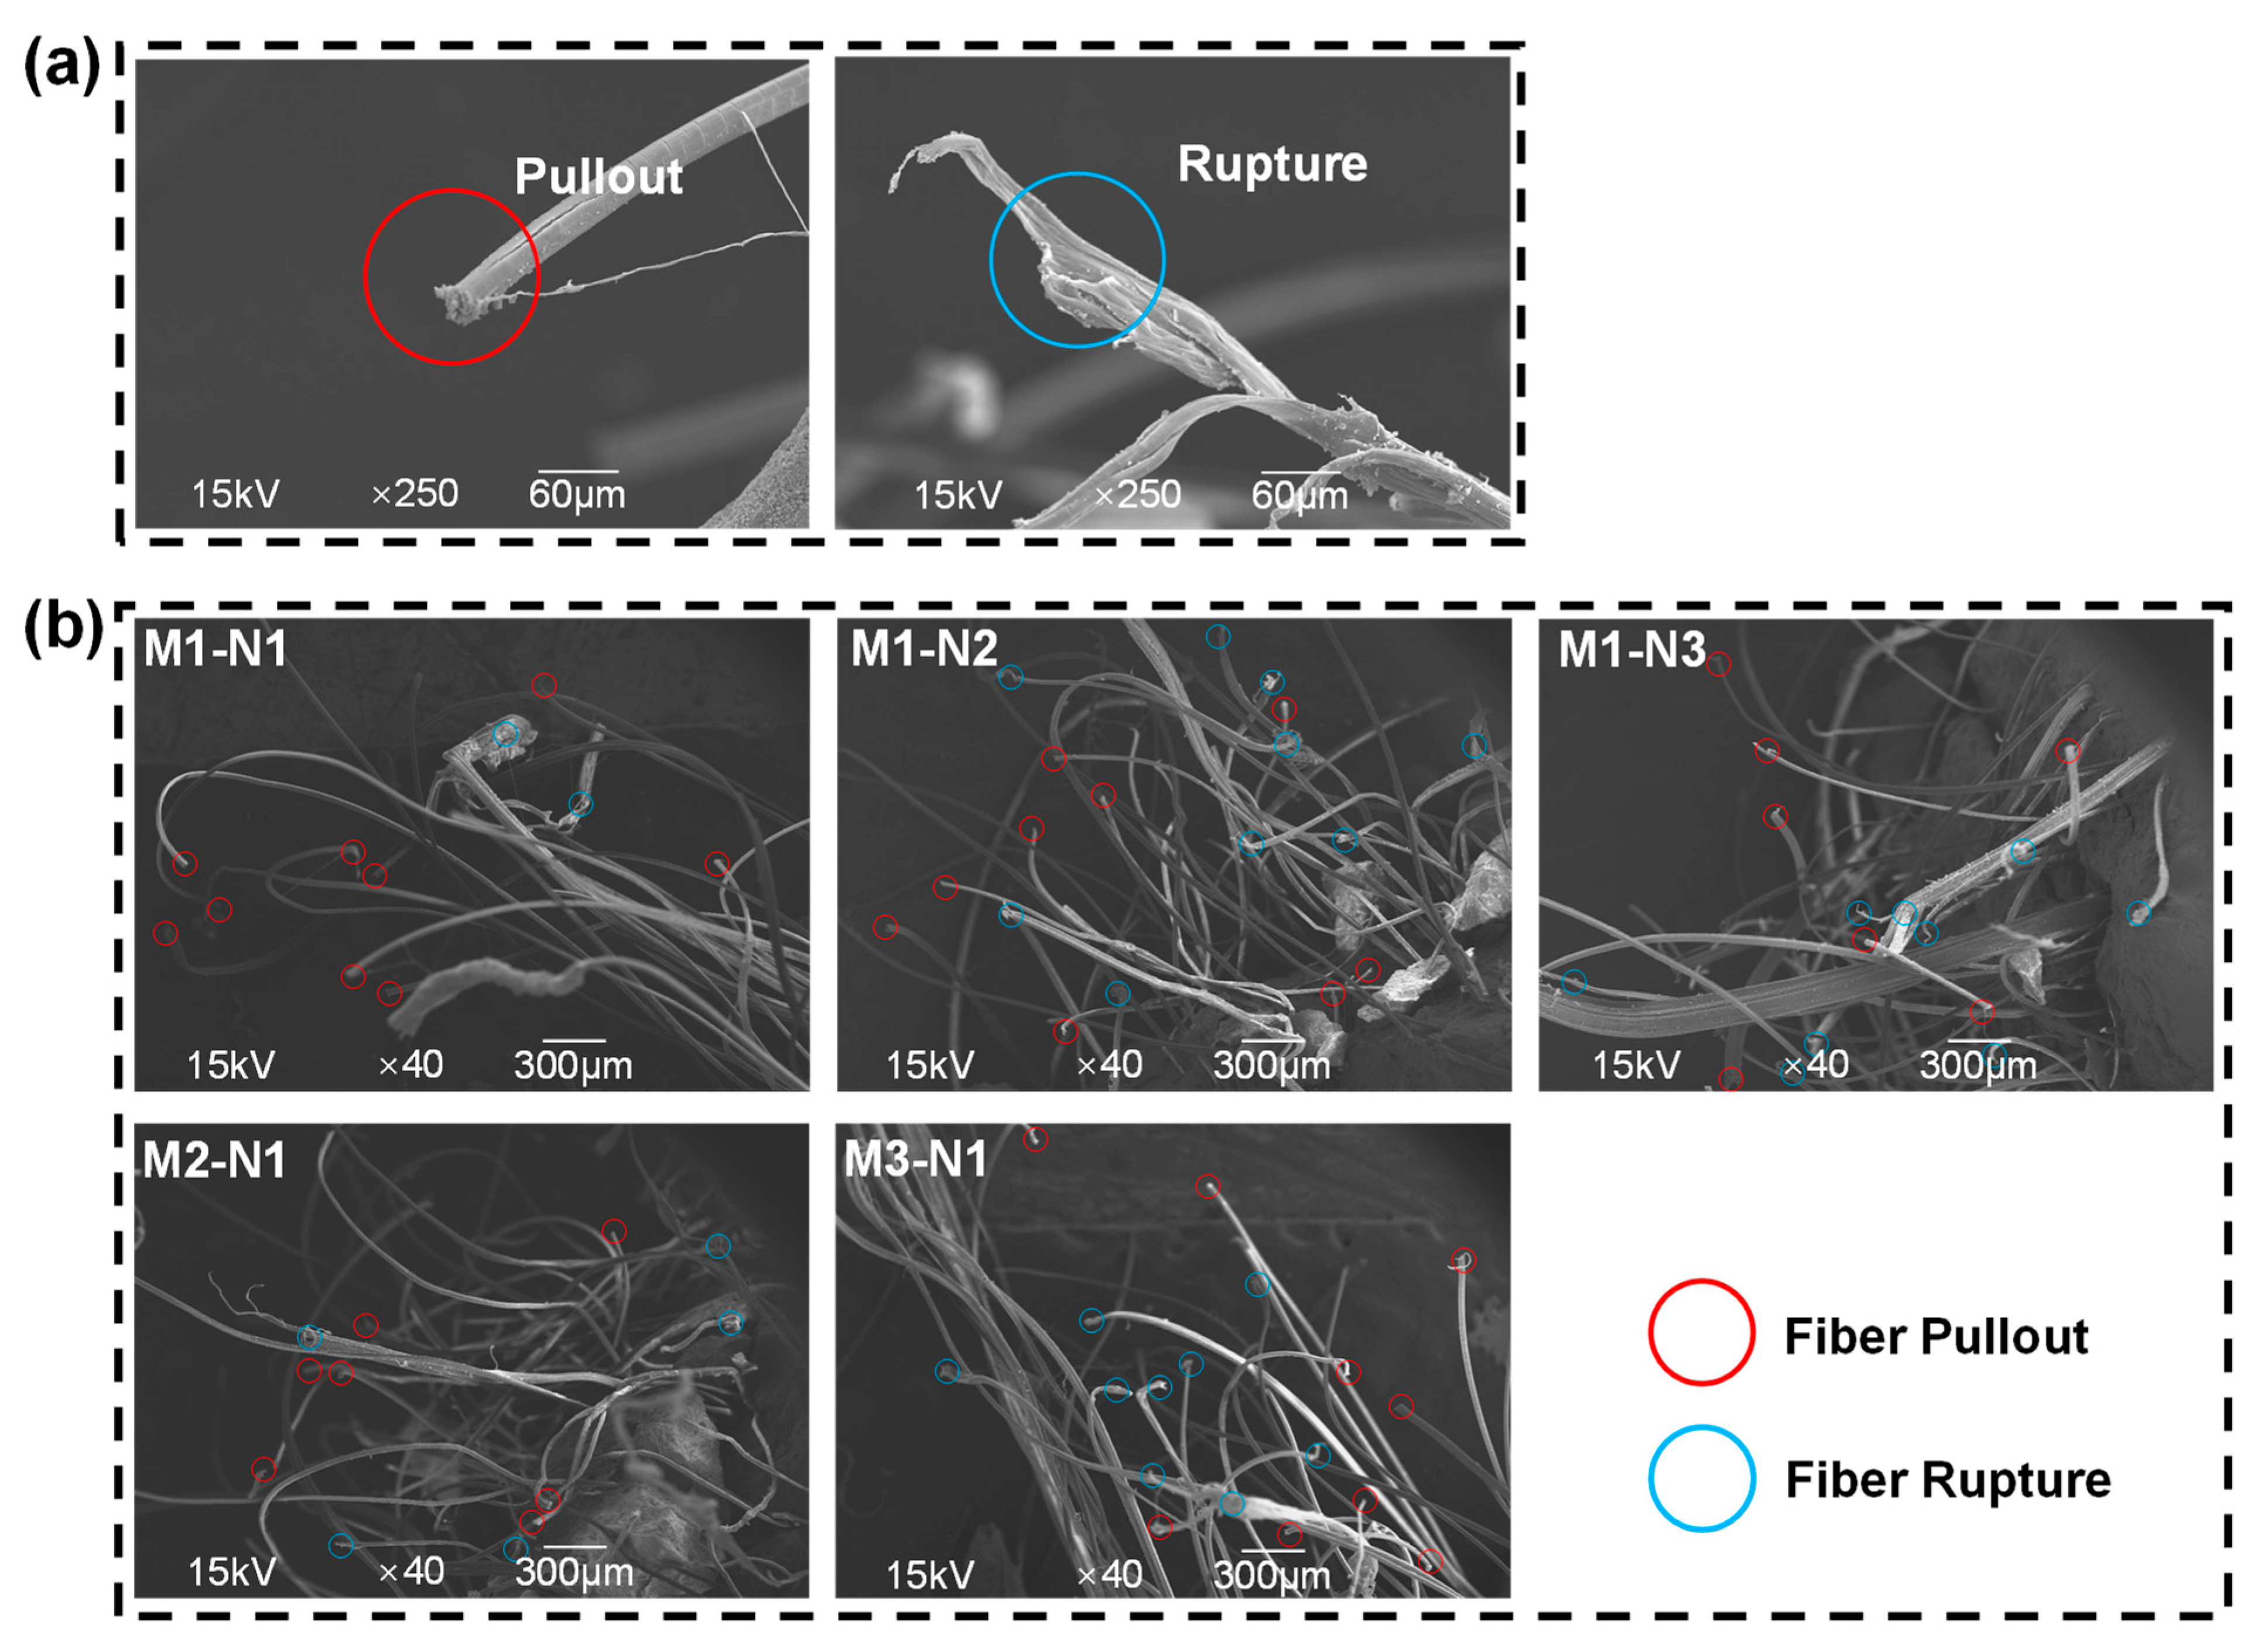
3.4.2. Scanning Electron Microscopy
4. Environmental Benefit Analysis
5. Conclusions
Author Contributions
Funding
Data Availability Statement
Conflicts of Interest
References
- Van Damme, H. Concrete material science: Past, present, and future innovations. Cem. Concr. Res. 2018, 112, 5–24. [Google Scholar] [CrossRef]
- Xi, B.; Al-Obaidi, S.; Ferrara, L. Effect of different environments on the self-healing performance of Ultra High-Performance Concrete—A systematic literature review. Constr. Build. Mater. 2023, 374, 130946. [Google Scholar] [CrossRef]
- Wang, S.; Wang, B.; Zhu, H.; Chen, G.; Li, Z.; Yang, L.; Zhang, Y.; Zhou, X. Ultra-high performance concrete: Mix design, raw materials and curing regimes—A review. Mater. Today Commun. 2023, 35, 105468. [Google Scholar] [CrossRef]
- Li, L.; Wang, B.; Hubler, M.H. Carbon nanofibers (CNFs) dispersed in ultra-high performance concrete (UHPC): Mechanical property, workability and permeability investigation. Cem. Concr. Compos. 2022, 131, 104592. [Google Scholar] [CrossRef]
- Yu, R.; Spiesz, P.; Brouwers, H. Development of an eco-friendly Ultra-High Performance Concrete (UHPC) with efficient cement and mineral admixtures uses. Cem. Concr. Compos. 2015, 55, 383–394. [Google Scholar] [CrossRef]
- Lin, J.-X.; Su, J.-Y.; Pan, H.-S.; Peng, Y.-Q.; Guo, Y.-C.; Chen, W.-S.; Sun, X.-L.; Yuan, B.-X.; Liu, G.-T.; Lan, X.-W. Dynamic compression behavior of ultra-high performance concrete with hybrid polyoxymethylene fiber and steel fiber. J. Mater. Res. Technol. 2022, 20, 4473–4486. [Google Scholar] [CrossRef]
- Akeed, M.H.; Qaidi, S.; Ahmed, H.U.; Faraj, R.H.; Mohammed, A.S.; Emad, W.; Tayeh, B.A.; Azevedo, A.R. Ultra-high-performance fiber-reinforced concrete. Part IV: Durability properties, cost assessment, applications, and challenges. Case Stud. Constr. Mater. 2022, 17, e01271. [Google Scholar] [CrossRef]
- Ganesh, P.; Murthy, A.R. Tensile behaviour and durability aspects of sustainable ultra-high performance concrete incorporated with GGBS as cementitious material. Constr. Build. Mater. 2018, 197, 667–680. [Google Scholar] [CrossRef]
- Lin, J.-X.; Song, Y.; Xie, Z.-H.; Guo, Y.-C.; Yuan, B.; Zeng, J.-J.; Wei, X. Static and dynamic mechanical behavior of engineered cementitious composites with PP and PVA fibers. J. Build. Eng. 2019, 29, 101097. [Google Scholar] [CrossRef]
- Zhu, H.; Hu, W.-H.; Mehthel, M.; Villette, T.; Vidal, O.S.; Nasser, W.N.; Li, V.C. Engineered cementitious composites (ECC) with a high volume of volcanic ash: Rheological, mechanical, and micro performance. Cem. Concr. Compos. 2023, 139, 105051. [Google Scholar] [CrossRef]
- Lương, Q.-H.; Nguyễn, H.H.; Nguyễn, P.H.; Kang, S.-T.; Lee, B.Y. Extremely-ductile alkali-activated slag-based composite with a tensile strain capacity up to 22%. Ceram. Int. 2023, 49, 12069–12078. [Google Scholar] [CrossRef]
- Liu, H.; Zhang, Q.; Li, V.; Su, H.; Gu, C. Durability study on engineered cementitious composites (ECC) under sulfate and chloride environment. Constr. Build. Mater. 2017, 133, 171–181. [Google Scholar] [CrossRef]
- Suryanto, B.; Tambusay, A.; Suprobo, P.; Bregoli, G.; Aitken, M. Seismic performance of exterior beam-column joints constructed with engineered cementitious composite: Comparison with ordinary and steel fibre reinforced concrete. Eng. Struct. 2022, 250, 113377. [Google Scholar] [CrossRef]
- Kunieda, M.; Hussein, M.; Ueda, N.; Nakamura, H. Enhancement of Crack Distribution of UHP-SHCC under Axial Tension Using Steel Reinforcement. J. Adv. Concr. Technol. 2010, 8, 49–57. [Google Scholar] [CrossRef]
- Park, S.H.; Kim, D.J.; Ryu, G.S.; Koh, K.T. Tensile behavior of Ultra High Performance Hybrid Fiber Reinforced Concrete. Cem. Concr. Compos. 2012, 34, 172–184. [Google Scholar] [CrossRef]
- Wille, K.; Kim, D.J.; Naaman, A.E. Strain-hardening UHP-FRC with low fiber contents. Mater. Struct. 2011, 44, 583–598. [Google Scholar] [CrossRef]
- Ranade, R.; Li, V.; Stults, M.D.; Heard, T.W.; Rushing, T. Composite Properties of High-Strength, High-Ductility Concrete. ACI Mater. J. 2013, 110, 413–422. [Google Scholar] [CrossRef]
- Yu, K.-Q.; Yu, J.-T.; Dai, J.-G.; Lu, Z.-D.; Shah, S.P. Development of ultra-high performance engineered cementitious composites using polyethylene (PE) fibers. Constr. Build. Mater. 2018, 158, 217–227. [Google Scholar] [CrossRef]
- Huntzinger, D.N.; Eatmon, T.D. A life-cycle assessment of Portland cement manufacturing: Comparing the traditional process with alternative technologies. J. Clean. Prod. 2009, 17, 668–675. [Google Scholar] [CrossRef]
- Chen, G.; Zheng, D.-P.; Chen, Y.-W.; Lin, J.-X.; Lao, W.-J.; Guo, Y.-C.; Chen, Z.-B.; Lan, X.-W. Development of high performance geopolymer concrete with waste rubber and recycle steel fiber: A study on compressive behavior, carbon emissions and economical performance. Constr. Build. Mater. 2023, 393, 131988. [Google Scholar] [CrossRef]
- Fu, Q.; Xu, W.; Zhao, X.; Bu, M.; Yuan, Q.; Niu, D. The microstructure and durability of fly ash-based geopolymer concrete: A review. Ceram. Int. 2021, 47, 29550–29566. [Google Scholar] [CrossRef]
- Shobeiri, V.; Bennett, B.; Xie, T.; Visintin, P. A comprehensive assessment of the global warming potential of geopolymer concrete. J. Clean. Prod. 2021, 297, 126669. [Google Scholar] [CrossRef]
- Nematollahi, B.; Qiu, J.; Yang, E.-H.; Sanjayan, J. Micromechanics constitutive modelling and optimization of strain hardening geopolymer composite. Ceram. Int. 2017, 43, 5999–6007. [Google Scholar] [CrossRef]
- Ambily, P.S.; Ravisankar, K.; Umarani, C.; Dattatreya, J.K.; Iyer, N.R. Development of ultra-high-performance geopolymer concrete. Mag. Concr. Res. 2014, 66, 82–89. [Google Scholar] [CrossRef]
- Wang, F.; Sun, X.; Tao, Z.; Pan, Z. Effect of silica fume on compressive strength of ultra-high-performance concrete made of calci-um aluminate cement/fly ash based geopolymer. J. Build. Eng. 2022, 62, 105398. [Google Scholar] [CrossRef]
- Liu, Y.; Zhang, Z.; Shi, C.; Zhu, D.; Li, N.; Deng, Y. Development of ultra-high performance geopolymer concrete (UHPGC): Influence of steel fiber on mechanical properties. Cem. Concr. Compos. 2020, 112, 103670. [Google Scholar] [CrossRef]
- Kan, L.-L.; Wang, W.-S.; Liu, W.-D.; Wu, M. Development and characterization of fly ash based PVA fiber reinforced Engineered Geopolymer Composites incorporating metakaolin. Cem. Concr. Compos. 2020, 108, 103521. [Google Scholar] [CrossRef]
- Alfimova, N.; Kozhukhova, N.; Zhernovskaya, I.; Shurakov, I.; Kozhukhova, M. Using of Citrogypsum in Alkali Activated Systems; Springer: Cham, Switzerland, 2023; Volume 307, pp. 17–22. [Google Scholar] [CrossRef]
- Sanyin, Z.; Qijun, Y.; Fei, Q.; Jiaqi, H.; Suhong, Y.; Ziyun, W.; Guobang, G. Setting and strength characteristics of alkali-activated carbonatite cementitious materials with ground slag replacement. J. Wuhan Univ. Technol. Sci. Ed. 2006, 21, 125–128. [Google Scholar] [CrossRef]
- Lao, J.-C.; Xu, L.-Y.; Huang, B.-T.; Dai, J.-G.; Shah, S.P. Strain-hardening Ultra-High-Performance Geopolymer Concrete (UHPGC): Matrix design and effect of steel fibers. Compos. Commun. 2022, 30, 101081. [Google Scholar] [CrossRef]
- Ohno, M.; Li, V.C. A feasibility study of strain hardening fiber reinforced fly ash-based geopolymer composites. Constr. Build. Mater. 2014, 57, 163–168. [Google Scholar] [CrossRef]
- Kozhukhova, N.I.; Alfimova, N.I.; Kozhukhova, M.I.; Nikulin, I.S.; Glazkov, R.A.; Kolomytceva, A.I. The Effect of Recycled Citrogypsum as a Supplementary Mineral Additive on the Physical and Mechanical Performance of Granulated Blast Furnace Slag-Based Alkali-Activated Binders. Recycling 2023, 8, 22. [Google Scholar] [CrossRef]
- Li, N.; Shi, C.; Zhang, Z.; Zhu, D.; Hwang, H.-J.; Zhu, Y.; Sun, T. A mixture proportioning method for the development of performance-based alkali-activated slag-based concrete. Cem. Concr. Compos. 2018, 93, 163–174. [Google Scholar] [CrossRef]
- Mousavinejad, S.H.G.; Sammak, M. An assessment of the effect of Na2SiO3/NaOH ratio, NaOH solution concentration, and aging on the fracture properties of ultra-high-performance geopolymer concrete: The application of the work of fracture and size effect methods. Structures 2022, 39, 434–443. [Google Scholar] [CrossRef]
- Alsalman, A.; Assi, L.N.; Kareem, R.S.; Carter, K.; Ziehl, P. Energy and CO2 emission assessments of alkali-activated concrete and Ordinary Portland Cement concrete: A comparative analysis of different grades of concrete. Clean. Environ. Syst. 2021, 3, 100047. [Google Scholar] [CrossRef]
- Rathod, N.; Chippagiri, R.; Ralegaonkar, R.V. Cleaner production of geopolymer materials: A critical review of waste-derived activators. Mater. Today Proc. 2023, in press. [Google Scholar] [CrossRef]
- Sandanayake, M.; Gunasekara, C.; Law, D.; Zhang, G.; Setunge, S. Greenhouse gas emissions of different fly ash based geopolymer concretes in building construction. J. Clean. Prod. 2018, 204, 399–408. [Google Scholar] [CrossRef]
- Luo, Q.; Liu, Y.; Dong, B.; Ren, J.; He, Y.; Wu, K.; Wang, Y. Lithium slag-based geopolymer synthesized with hybrid solid activators. Constr. Build. Mater. 2023, 365, 130070. [Google Scholar] [CrossRef]
- Neupane, K. Evaluation of environmental sustainability of one-part geopolymer binder concrete. Clean. Mater. 2022, 6, 100138. [Google Scholar] [CrossRef]
- Al-Noaimat, Y.A.; Ghaffar, S.H.; Chougan, M.; Al-Kheetan, M.J. A review of 3D printing low-carbon concrete with one-part geopolymer: Engineering, environmental and economic feasibility. Case Stud. Constr. Mater. 2023, 18, e01818. [Google Scholar] [CrossRef]
- Zheng, Y.; Rao, F.; Yang, L.; Zhong, S. Comparison of ternary and dual combined waste-derived alkali activators on the durability of volcanic ash-based geopolymers. Cem. Concr. Compos. 2023, 136, 104886. [Google Scholar] [CrossRef]
- Ma, C.; Zhao, B.; Guo, S.; Long, G.; Xie, Y. Properties and characterization of green one-part geopolymer activated by composite activators. J. Clean. Prod. 2019, 220, 188–199. [Google Scholar] [CrossRef]
- Wang, Y.-S.; Alrefaei, Y.; Dai, J.-G. Roles of hybrid activators in improving the early-age properties of one-part geopolymer pastes. Constr. Build. Mater. 2021, 306, 124880. [Google Scholar] [CrossRef]
- Bian, Z.; Jin, G.; Ji, T. Effect of combined activator of Ca(OH)2 and Na2CO3 on workability and compressive strength of alkali-activated ferronickel slag system. Cem. Concr. Compos. 2021, 123, 104179. [Google Scholar] [CrossRef]
- Burciaga-Díaz, O.; Betancourt-Castillo, I.; Montes-Escobedo, M.; Escalante-García, J. One-part pastes and mortars of CaO-Na2CO3 activated blast furnace slag: Microstructural evolution, cost and CO2 emissions. Constr. Build. Mater. 2023, 368, 130431. [Google Scholar] [CrossRef]
- GB/T 18046-2017; Ground Granulated Blast Furnace Slag Used for Cement and Concrete. China Architecture & Building Press: Beijing, China, 2017.
- ASTM C618-2019; Standard Specification for Coal Fly Ash and Raw or Calcined Natural Pozzolan for Use in Concrete. ASTM International: West Conshohocken, PA, USA, 2019.
- Ye, N.; Yang, J.; Liang, S.; Hu, Y.; Hu, J.; Xiao, B.; Huang, Q. Synthesis and strength optimization of one-part geopolymer based on red mud. Constr. Build. Mater. 2016, 111, 317–325. [Google Scholar] [CrossRef]
- Shen, W.; Zhou, M.; Xiao, L.; Ma, W.; Cai, Z. Morphology difference between the alkali activated cement and portland cement paste on multi-scale. J. Wuhan Univ. Technol. Sci. Ed. 2008, 23, 923–926. [Google Scholar] [CrossRef]
- GB/T 1346-2011; Test Methods for Water Requirement of Normal Consistency, Setting Time and Soundness of the Portland Cement. China Architecture & Building Press: Beijing, China, 2011.
- Zhang, D.-W.; Zhao, K.-F.; Li, H.; Wang, D.-M.; Wang, L.-L.; Zhang, G.-F. Dispersion properties of fly ash–slag powders under the different environment. Constr. Build. Mater. 2021, 296, 123649. [Google Scholar] [CrossRef]
- ASTM C109/C109M-20a; Standard Test Method for Compressive Strength of Hydraulic Cement Mortars (Using 2-in. Or [50-mm] Cube Specimens). ASTM International: West Conshohocken, PA, USA, 2016.
- Yokota, H.; Rokugo, K.; Sakata, N. JSCE Recommendations for design and construction of high performance fiber reinforced cement composites with multiple fine cracks. In High Performance Fiber Reinforced Cement Composites; Springer: Tokyo, Japan, 2008; pp. 1–16. [Google Scholar]
- Arunothayan, A.R.; Nematollahi, B.; Ranade, R.; Bong, S.H.; Sanjayan, J. Development of 3D-printable ultra-high performance fiber-reinforced concrete for digital construction. Constr. Build. Mater. 2020, 257, 119546. [Google Scholar] [CrossRef]
- Lei, D.-Y.; Li, M.-A.; Wang, P.-G.; Guo, L.-P.; Li, Y.; Liu, J.-P.; Zhang, P.; Li, S.-C.; Li, C.-C.; Li, Z.-H.; et al. Design of ultra-high strength, ultra-high ductility cementitious composites (UHS-UHDCC). Constr. Build. Mater. 2022, 322, 125914. [Google Scholar] [CrossRef]
- Xu, S.; Yuan, P.; Liu, J.; Pan, Z.; Liu, Z.; Su, Y.; Li, J.; Wu, C. Development and preliminary mix design of ultra-high-performance concrete based on geopolymer. Constr. Build. Mater. 2021, 308, 125110. [Google Scholar] [CrossRef]
- Lao, J.-C.; Xu, L.-Y.; Huang, B.-T.; Zhu, J.-X.; Khan, M.; Dai, J.-G. Utilization of sodium carbonate activator in strain-hardening ultra-high-performance geopolymer concrete (SH-UHPGC). Front. Mater. 2023, 10, 1142237. [Google Scholar] [CrossRef]
- Kanda, T.; Li, V.C. Practical Design Criteria for Saturated Pseudo Strain Hardening Behavior in ECC. J. Adv. Concr. Technol. 2006, 4, 59–72. [Google Scholar] [CrossRef]
- Yu, K.; Wang, Y.; Yu, J.; Xu, S. A strain-hardening cementitious composites with the tensile capacity up to 8%. Constr. Build. Mater. 2017, 137, 410–419. [Google Scholar] [CrossRef]
- Zhang, Z.; Yuvaraj, A.; Di, J.; Qian, S. Matrix design of light weight, high strength, high ductility ECC. Constr. Build. Mater. 2019, 210, 188–197. [Google Scholar] [CrossRef]
- Alrefaei, Y.; Dai, J.-G. Tensile behavior and microstructure of hybrid fiber ambient cured one-part engineered geopolymer composites. Constr. Build. Mater. 2018, 184, 419–431. [Google Scholar] [CrossRef]
- Gollakota, A.R.; Volli, V.; Shu, C.-M. Progressive utilisation prospects of coal fly ash: A review. Sci. Total Environ. 2019, 672, 951–989. [Google Scholar] [CrossRef] [PubMed]
- Shah, S.F.A.; Chen, B.; Oderji, S.Y.; Haque, M.A.; Ahmad, M.R. Improvement of early strength of fly ash-slag based one-part alkali activated mortar. Constr. Build. Mater. 2020, 246, 118533. [Google Scholar] [CrossRef]
- Zhao, S.; Xia, M.; Yu, L.; Huang, X.; Jiao, B.; Li, D. Optimization for the preparation of composite geopolymer using response surface methodology and its application in lead-zinc tailings solidification. Constr. Build. Mater. 2020, 266, 120969. [Google Scholar] [CrossRef]
- Wang, Y.; Ma, J.; Qing, L.; Liu, L.; Shen, B.; Li, S.; Zhang, Z. Accelerated carbonation pretreatment of municipal solid waste incineration fly ash and its conversion to geopolymer with coal fly ash. Constr. Build. Mater. 2023, 383, 131363. [Google Scholar] [CrossRef]
- Lv, Q.; Yu, J.; Ji, F.; Gu, L.; Chen, Y.; Shan, X. Mechanical Property and Microstructure of Fly Ash-Based Geopolymer Activated by Sodium Silicate. KSCE J. Civ. Eng. 2021, 25, 1765–1777. [Google Scholar] [CrossRef]
- Shi, Y.; Long, G.; Ma, C.; Xie, Y.; He, J. Design and preparation of ultra-high performance concrete with low environmental impact. J. Clean. Prod. 2019, 214, 633–643. [Google Scholar] [CrossRef]
- Turner, L.K.; Collins, F.G. Carbon dioxide equivalent (CO2-e) emissions: A comparison between geopolymer and OPC cement concrete. Constr. Build. Mater. 2013, 43, 125–130. [Google Scholar] [CrossRef]
- Yang, T.; Zhang, Z.; Zhang, F.; Gao, Y.; Wu, Q. Chloride and heavy metal binding capacities of hydrotalcite-like phases formed in greener one-part sodium carbonate-activated slag cements. J. Clean. Prod. 2020, 253, 120047. [Google Scholar] [CrossRef]
- Dong, Z.; Tan, H.; Yu, J.; Liu, F. A feasibility study on Engineered cementitious Composites mixed with coarse aggregate. Constr. Build. Mater. 2022, 350, 128587. [Google Scholar] [CrossRef]
- Jin, Q.; Li, V.C. Development of lightweight engineered cementitious composite for durability enhancement of tall concrete wind towers. Cem. Concr. Compos. 2018, 96, 87–94. [Google Scholar] [CrossRef]


| Mix IDs | GGBS | FA | SF | MS | FS | BaCl2 | Defoamer | SLS | NC | W/B a | N/B b | Activator Modulus | Na2CO3 (Na2O%) | PE Fiber |
|---|---|---|---|---|---|---|---|---|---|---|---|---|---|---|
| M1-N1 | 0.71 | 0.21 | 0.08 | 0.05 | 0.30 | 0.01 | 0.001 | 0.005 | 0.02 | 0.3 | 7% | 1.35 | 0 | 2 vol% |
| M1-N2 | 1.35 | 0.75 | ||||||||||||
| M1-N3 | 1.35 | 1.5 | ||||||||||||
| M2-N1 | 1.50 | 0 | ||||||||||||
| M3-N1 | 1.65 | 0 |
| Diameter (μm) | Length (mm) | Strength (MPa) | Elastic Modules (GPa) | Density (g/cm3) |
|---|---|---|---|---|
| 24 | 18 | 3000 | 116 | 0.97 |
| Oxide | GGBS | FA | SF |
|---|---|---|---|
| wt% | |||
| CaO | 34 | 4.01 | / |
| SiO2 | 34.5 | 53.97 | 94.73 |
| Al2O3 | 17.7 | 31.15 | / |
| SO3 | 1.64 | 2.2 | 0.2 |
| Fe2O3 | 1.03 | 4.16 | / |
| MgO | 6.01 | 1.01 | / |
| TiO2 | / | 1.13 | / |
| Others | 5.12 | 2.37 | 5.07 |
| LOI (%) | 0.84 | 4.6 | 1.5 |
| density (g/cm3) | 3.1 | 2.3 | 2.25 |
| D10 (μm) | 1.65 | 3.55 | 0.10 |
| D50 (μm) | 8.68 | 14.46 | 0.14 |
| D90 (μm) | 24.09 | 58.88 | 0.35 |
| Mix IDs | Tensile Strain (%) | Number of Cracks | Tensile Strain (%) | Weibull Distribution | ||||
|---|---|---|---|---|---|---|---|---|
| λ | k | R2 | wmean | sw | ||||
| M1-N1 | A: 0.97 | 7 | A: 0.97 | 87.86 | 3.57 | 0.885 | 79.14 | 24.58 |
| B: 2.02 | 12 | B: 2.02 | 122.11 | 2.96 | 0.938 | 108.98 | 40.06 | |
| C: 3.94 | 26 | C: 3.94 | 97.66 | 1.84 | 0.944 | 86.77 | 48.95 | |
| D: 5.05 | 34 | D: 5.05 | 106.70 | 1.95 | 0.964 | 94.61 | 50.53 | |
| U: 6.33 | 47 | U: 6.33 | 93.23 | 1.75 | 0.948 | 83.02 | 48.84 | |
| M1-N2 | A: 1.02 | 12 | A: 1.02 | 58.09 | 1.61 | 0.802 | 52.04 | 33.04 |
| B: 2.01 | 21 | B: 2.01 | 63.59 | 1.75 | 0.892 | 56.63 | 33.40 | |
| C: 3.98 | 39 | C: 3.98 | 74.06 | 1.85 | 0.890 | 65.78 | 36.89 | |
| D: 4.96 | 43 | D: 4.96 | 68.07 | 1.79 | 0.938 | 60.55 | 34.99 | |
| U: 6.21 | 48 | U: 6.21 | 70.99 | 1.72 | 0.939 | 63.29 | 37.90 | |
| M1-N3 | A: 1.05 | 8 | A: 1.05 | 104.92 | 1.80 | 0.932 | 93.30 | 53.65 |
| B: 1.99 | 13 | B: 1.99 | 128.20 | 2.63 | 0.887 | 113.90 | 46.61 | |
| C: 3.96 | 21 | C: 3.96 | 118.39 | 2.51 | 0.953 | 105.06 | 44.74 | |
| D: 7.03 | 39 | D: 7.03 | 128.67 | 2.07 | 0.967 | 113.98 | 57.84 | |
| U: 8.47 | 41 | U: 8.47 | 130.64 | 2.07 | 0.979 | 115.72 | 58.52 | |
| M2-N1 | A: 1.09 | 6 | A: 1.09 | 137.96 | 5.44 | 0.908 | 127.28 | 27.01 |
| B: 1.95 | 8 | B: 1.95 | 169.55 | 6.94 | 0.873 | 158.53 | 26.87 | |
| C: 5.04 | 21 | C: 5.04 | 193.57 | 3.14 | 0.973 | 173.21 | 60.47 | |
| D: 7.03 | 26 | D: 7.03 | 196.24 | 3.01 | 0.959 | 175.26 | 63.57 | |
| U: 9.17 | 28 | U: 9.17 | 208.58 | 2.78 | 0.982 | 185.68 | 72.29 | |
| M3-N1 | A: 1.05 | 4 | A: 1.05 | 111.10 | 3.41 | 0.654 | 99.83 | 32.30 |
| B: 2.01 | 7 | B: 2.01 | 149.33 | 2.46 | 0.909 | 132.45 | 57.43 | |
| C: 4.93 | 18 | C: 4.93 | 159.06 | 2.26 | 0.979 | 140.89 | 66.07 | |
| D: 7.00 | 30 | D: 7.00 | 141.30 | 1.81 | 0.971 | 125.62 | 71.79 | |
| U: 8.56 | 34 | U: 8.56 | 148.11 | 1.70 | 0.941 | 132.15 | 80.04 | |
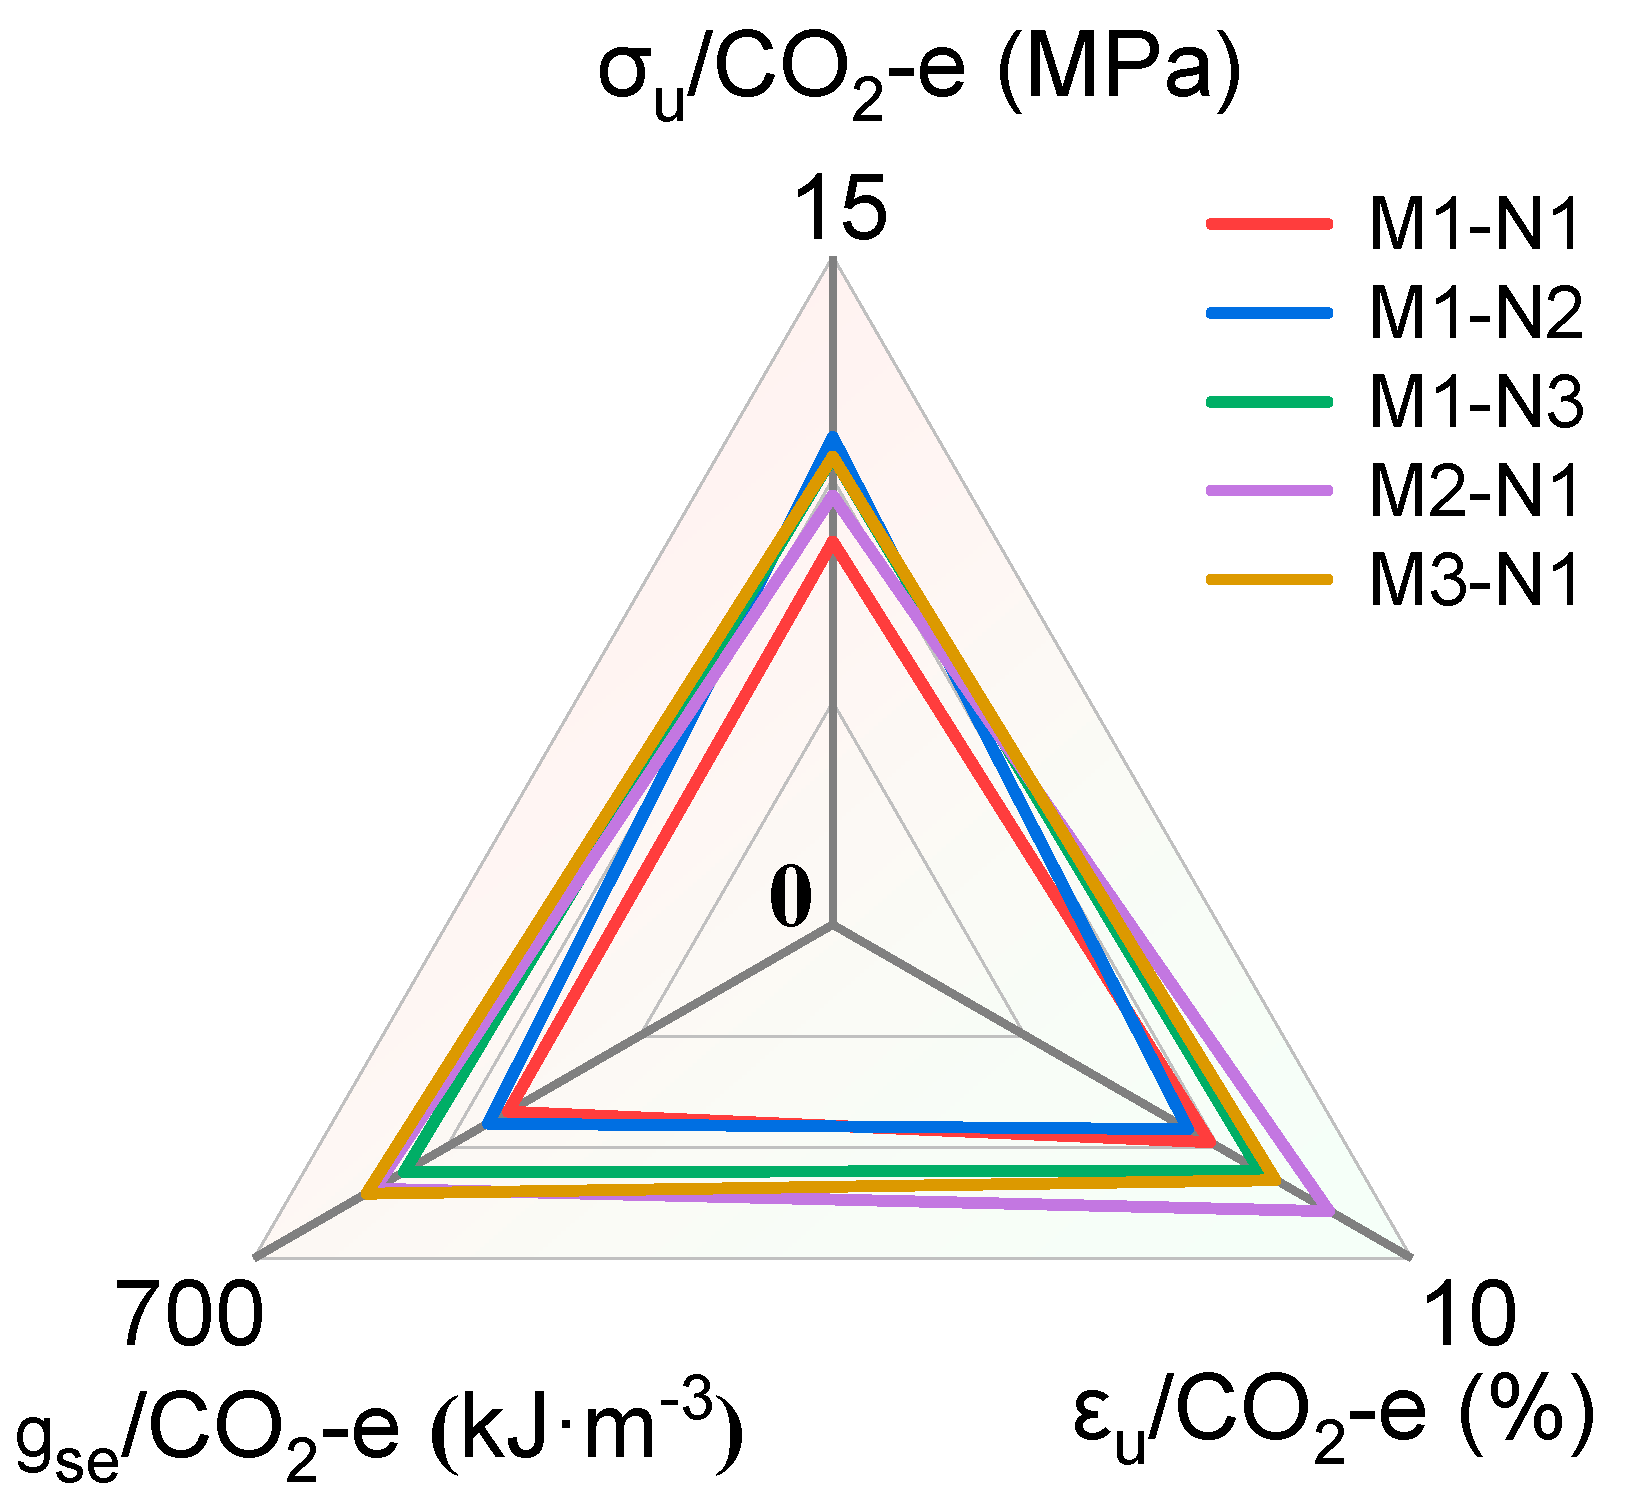
| Mix IDs | (MPa) | (MPa) | (%) | (kJ·m−3) |
|---|---|---|---|---|
| M1–N1 | 4.64 | 8.60 | 6.52 | 392.3 |
| M1–N2 | 3.92 | 10.94 | 6.13 | 416.8 |
| M1–N3 | 3.17 | 10.51 | 7.38 | 518.5 |
| M2–N1 | 4.74 | 9.64 | 8.58 | 553.6 |
| M3–N1 | 5.92 | 10.50 | 7.66 | 564.1 |
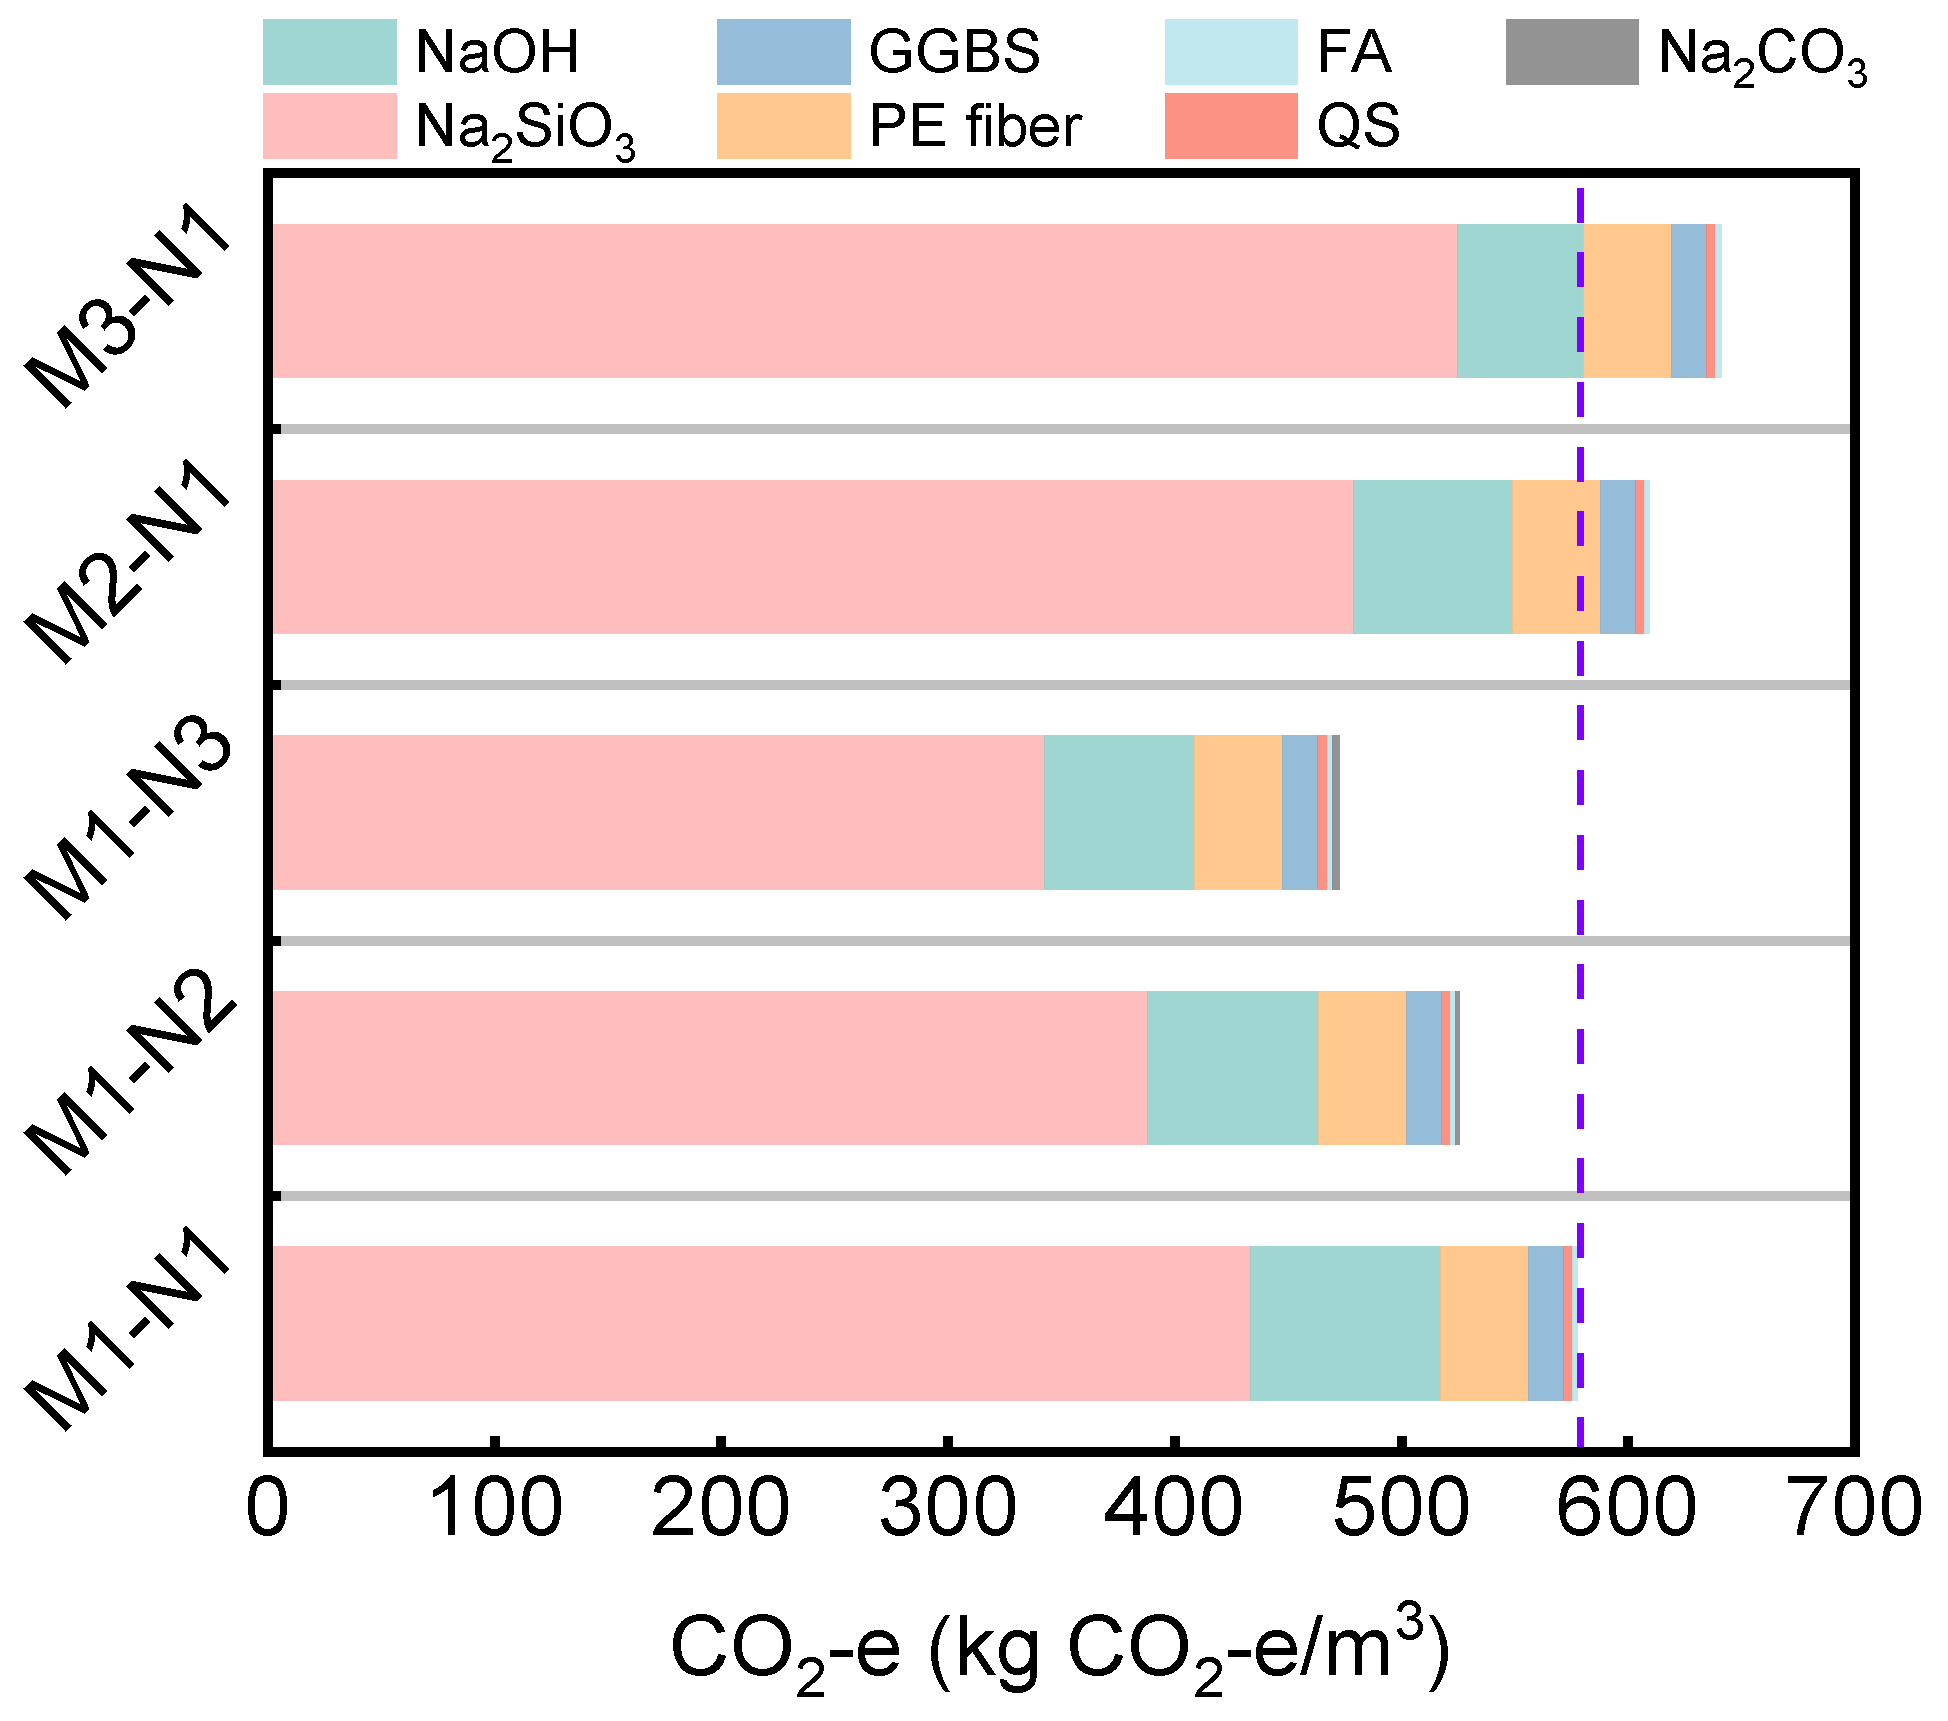
| Materials | Emission Factor (kg CO2-e/kg) | Mix IDs | Reference | ||||
|---|---|---|---|---|---|---|---|
| M1–N1 | M1–N2 | M1–N3 | M2–N1 | M3–N1 | |||
| GGBS | 0.019 | 15.58 | 15.58 | 15.58 | 15.58 | 15.58 | [67] |
| FA | 0.009 | 2.237 | 2.237 | 2.237 | 2.237 | 2.237 | [67] |
| SF | 0 | 0 | 0 | 0 | 0 | 0 | [68] |
| NaOH | 1.915 | 83.96 | 75.27 | 66.32 | 69.83 | 55.61 | [68] |
| Na2SiO3 | 1.222 | 433.3 | 388.1 | 342.5 | 479.2 | 524.8 | [68] |
| Na2CO3 | 0.111 | / | 1.657 | 3.325 | / | / | [69] |
| QS | 0.01 | 4.066 | 4.066 | 4.066 | 4.066 | 4.066 | [67] |
| PE fiber | 2 | 38.80 | 38.80 | 38.80 | 38.80 | 38.80 | [70] |
| CO2-e (kg CO2-e/m3) | / | 578.0 | 525.7 | 472.9 | 609.7 | 641.1 | / |
Disclaimer/Publisher’s Note: The statements, opinions and data contained in all publications are solely those of the individual author(s) and contributor(s) and not of MDPI and/or the editor(s). MDPI and/or the editor(s) disclaim responsibility for any injury to people or property resulting from any ideas, methods, instructions or products referred to in the content. |
© 2024 by the authors. Licensee MDPI, Basel, Switzerland. This article is an open access article distributed under the terms and conditions of the Creative Commons Attribution (CC BY) license (https://creativecommons.org/licenses/by/4.0/).
Share and Cite
Zhuo, K.-X.; Chen, G.; Luo, R.-H.; Chen, Y.-W.; Li, D.-H.; Lin, J.-X. Effect of Na2CO3 Replacement Quantity and Activator Modulus on Static Mechanical and Environmental Behaviours of Alkali-Activated-Strain-Hardening-Ultra-High-Performance Concrete. Buildings 2024, 14, 681. https://doi.org/10.3390/buildings14030681
Zhuo K-X, Chen G, Luo R-H, Chen Y-W, Li D-H, Lin J-X. Effect of Na2CO3 Replacement Quantity and Activator Modulus on Static Mechanical and Environmental Behaviours of Alkali-Activated-Strain-Hardening-Ultra-High-Performance Concrete. Buildings. 2024; 14(3):681. https://doi.org/10.3390/buildings14030681
Chicago/Turabian StyleZhuo, Ke-Xian, Gai Chen, Rui-Hao Luo, Yi-Wu Chen, De-Hui Li, and Jia-Xiang Lin. 2024. "Effect of Na2CO3 Replacement Quantity and Activator Modulus on Static Mechanical and Environmental Behaviours of Alkali-Activated-Strain-Hardening-Ultra-High-Performance Concrete" Buildings 14, no. 3: 681. https://doi.org/10.3390/buildings14030681