Abstract
Massive data can be collected from meters to analyze the energy use behavior and detect the operation problems of buildings. However, missing and abnormal data often occur for the raw data. Effective data filling and smoothing methods are required to improve data quality before conducting the analysis. This paper introduces a data filling method based on K-SVD. The complete dictionary is trained and then utilized to reconstruct incomplete samples to fill the missing or abnormal data. The impacts of the dictionary size, the data missing continuity, and the sample size on the performance of the proposed method are studied. The results show that a smaller dictionary size is recommended considering the computational complexity and accuracy. The K-SVD method outperforms traditional methods, showing a reduction in the MAPE and CVRMSE by 3.8–5.4% and 6.7–87.8%. The proposed K-SVD filling method performs better for non-consecutive missing data, with an improvement in the MAPE and CVRMSE by 0.1–4% and 5.1–6.7%. Smaller training samples are recommended. The method proposed in this study would provide an effective solution for data preprocessing in building and energy systems.
1. Introduction
With the rapid development of data-related theories and technologies, the data volume in building fields is increasing significantly [1]. The energy consumption data of buildings can be used to extract valuable information for data analysis, decision-making, operation optimization, and visualization [2,3]. Raw data collected from meters may have quality problems such as missing, abnormality, duplicated records, etc. Such situations can affect the accuracy of data mining results, leading to inappropriate data analysis and decision making [4,5,6]. It is necessary to deal with missing or abnormal data as the first step of preprocessing to improve data quality, as well as data analysis.
The missing building load data can be classified into three categories: isolated missing values, continuous missing variables, and continuous missing samples [7]. Concerning the relationship between missing data and variables in the dataset, the missing mechanisms can be broadly classified as missing completely at random (MCAR), missing at random (MAR), and not missing at random (NMAR) [8]. In building energy fields, the data missing are typically classified as missing completely at random or missing at random. Samples with missing data can be deleted or ignored, which is simple and direct, but may lead to the loss of valuable information [9]. Hence, the direct deletion method is appropriate only when the percentage of missing data is limited, or variables associated with the missing data have minor relevance to the overall data analysis [10,11,12]. Usually, the data cannot be deleted so data filling is necessary [10]. Moreover, an appropriate filling method can improve the data quality, as well as the data mining and analysis results, which is important for building energy management [13]. The filling methods for missing data can be classified into two types: statistical filling methods and machine learning filling methods [14,15].
The traditional method fills missing values with special values such as the mode, the mean, or the median [16]. These methods are simple, but they may lead to a change in the shape of the data distribution especially when the missing values are large in number [17]. The popular techniques in statistical methods include regression analysis, expectation maximization (EM) imputation, and multiple imputation [18]. Regression methods may cause a large bias in the estimates when the variables are nonlinearly correlated with each other or increase the correlation between the variables [17]. Therefore, the regression filling method is more effective only when there is a high correlation between the independent and dependent variables [19]. The EM filling method uses the distribution of the data to perform a maximum likelihood estimate (MLE) on the missing data [20]. It is suitable for large samples but the method is prone to falling into local extremes, computationally intensive, converges slowly [21], and the convergence rate is strongly influenced by the missing rate. The MI has the capability to address complex missing patterns and mitigate bias. However, its effectiveness relies on the accurate specification of the model [22].
Compared to statistical methods, machine learning filling methods are more widely used. Random forest (RF) is often used as a missing value imputation method for high-dimensional multivariate data [23,24]. However, complete datasets are required for training. To address this, scholars have proposed the missing forest (MF) algorithm based on RF. MF performs well on imputing missing values in large samples and outperforms methods such as the k-nearest neighbor algorithm (KNN) [25,26,27]. KNN is used in data imputation, filling the missing value with the mean of the nearest K values. This approach is simple to implement, fast, and well-filled, but it can be affected by noise [28,29]. The results show that the improved KNN by Density-Based Spatial Clustering of Application with Noise (DBSCAN) to eliminate outliers and noise interference significantly increases imputation accuracy [30,31]. Although the generative adversarial network (GAN) filling method exhibits superior filling accuracy compared to the EM, MF, etc., its filling speed is related to the data dimensionality rather than the missing rate. The computation is larger regardless of the data missing proportion [32]. A data complementation method based on the low-rank matrix filling theory was proposed in the study [33]. It requires relatively less data volume and computational resources, but it is easily disturbed by external data noise and the complexity of the model is relatively high. Additionally, it is difficult to impute data well for the continuous missing cases.
The energy consumption data of buildings generally exhibits features of times series, sparsity, and diversity [34]. The sparsity means that the daily load of the customer can consist of several sub-modes linearly. The diversity refers to the randomness and start–stop characteristics of the customer’s electricity consumption. The machine learning method, the K-SVD algorithm, perceives dictionaries for sparse representation. It is widely used in compressing facial images, face recognition, and camera calibration [35,36,37]. Load data can be expressed with these dictionary atoms linearly and sparsely [38]. It should be an effective method for data filling in building energy systems. Therefore, in this paper, a filling method based on K-SVD is proposed to fill the missing and abnormal energy consumption data of buildings. The performance of the proposed method is compared with the traditional method to validate the filling effect. The impact of factors such as the dictionary size, the missing characteristics, and the sample sizes are investigated.
The rest of this paper is organized as follows. In Section 2, the K-SVD-based data filling method is introduced. In Section 3, energy consumption data of one building and influencing factors are presented. In Section 4, the data filling results are analyzed considering the impact of the dictionary size, the missing continuity, and the training sample size. Conclusions are presented in Section 5.
2. Missing Data Filling Method Based on K-SVD
2.1. Introduction on K-SVD
The K-singular value decomposition (K-SVD) dictionary learning method is an algorithm for sparse representation. This method can construct a dictionary composed of all the atoms from the training set. Where the atoms are the basic usage patterns obtained through a data-driven approach that directly captures the characteristics of the target signal. Thus, the updated dictionary exhibits an improved adaptability to the target signal [38,39].
When the K-SVD is used for data filling, it is realized based on the decomposition and reconstruction of the energy usage patterns. The original load data, represented by YN×M, can be expressed as Equations (1)–(3):
where is the collected load matrix, represents the number of daily load data, represents the number of days, represents the load data at the i-th moment of the j-th day, represents the load vector at the i-th moment for all the complete collected data, and represents the j-th daily load curve.
The K-SVD dictionary learning algorithm is used to decompose the customer load into base vectors representing its usage patterns based on the training data. It aims to construct a dictionary matrix D comprising K prototype signal atoms. The collected load matrix YN×M is approximately decomposed through singular value decomposition (SVD) into a sparse linear combination of these atoms. It can be expressed mathematically as Equation (4).
where represents the complete dictionary matrix; represents the size of the dictionary; represents the encoding matrix; and represents a sparse linear combination coefficient for the load based on the dictionary in .
During the validation process of complete dictionary learning, the load data can be represented as a sparse matrix with only a few non-zero elements. This process commonly uses the matching pursuit (MP) algorithm or orthogonal matching pursuit (OMP) algorithm [40,41]. The OMP algorithm is selected due to a lower computational complexity, lower running time cost, and higher reconstruction accuracy [41,42]. The dictionary serves as the transformation domain in this process. The expression of this process is Equation (5).
where is the magnitude of the reconstruction error. represents the Frobenius norm, indicating the magnitude of the reconstruction error . The smaller the reconstruction error , the better the effect of dictionary learning. represents the 0 norm, and its value represents the number of non-zero elements in . is the threshold for sparsity constraint, which is used to constrain the number of non-zero elements in the encoding vector xi by ensuring its sparsity.
Subsequently, based on the complete dictionary, the load profile with missing data can be matched and encoded based on the base vector to determine the possible structure of the energy pattern. As shown in Equations (6) and (7), for the load profile with missing data , is set to ∅, where ∅ represents vacant values. Here, i belongs to , , and represents the number of missing values in the load profile. The first step is to encode the load curve slated for restoration utilizing the dictionary matrix. The expression of the encoding is given by Equation (8):
where is the successfully collected load data in the load curve with a length of . is the i-th dimensional (row) feature vector in . is the result of removing the feature row vectors corresponding to the missing moments from the dictionary matrix , is denoted as . is the reconstruction vector and the sparse coding vector obtained by based on the decomposition of , of which the values are composed of the usage patterns determined based on the successfully collected load data. These values represent the possible usage patterns of the load profile requiring repair.
Further, based on the reconstructed vector and the complete dictionary, the complete load curve is reconstructed employing Equations (9) and (10):
where is the reconstructed load profile, obtained by reconstructing the vector and the complete dictionary matrix . The variable represents the reconstructed load data in corresponding to the missing moment of acquisition.
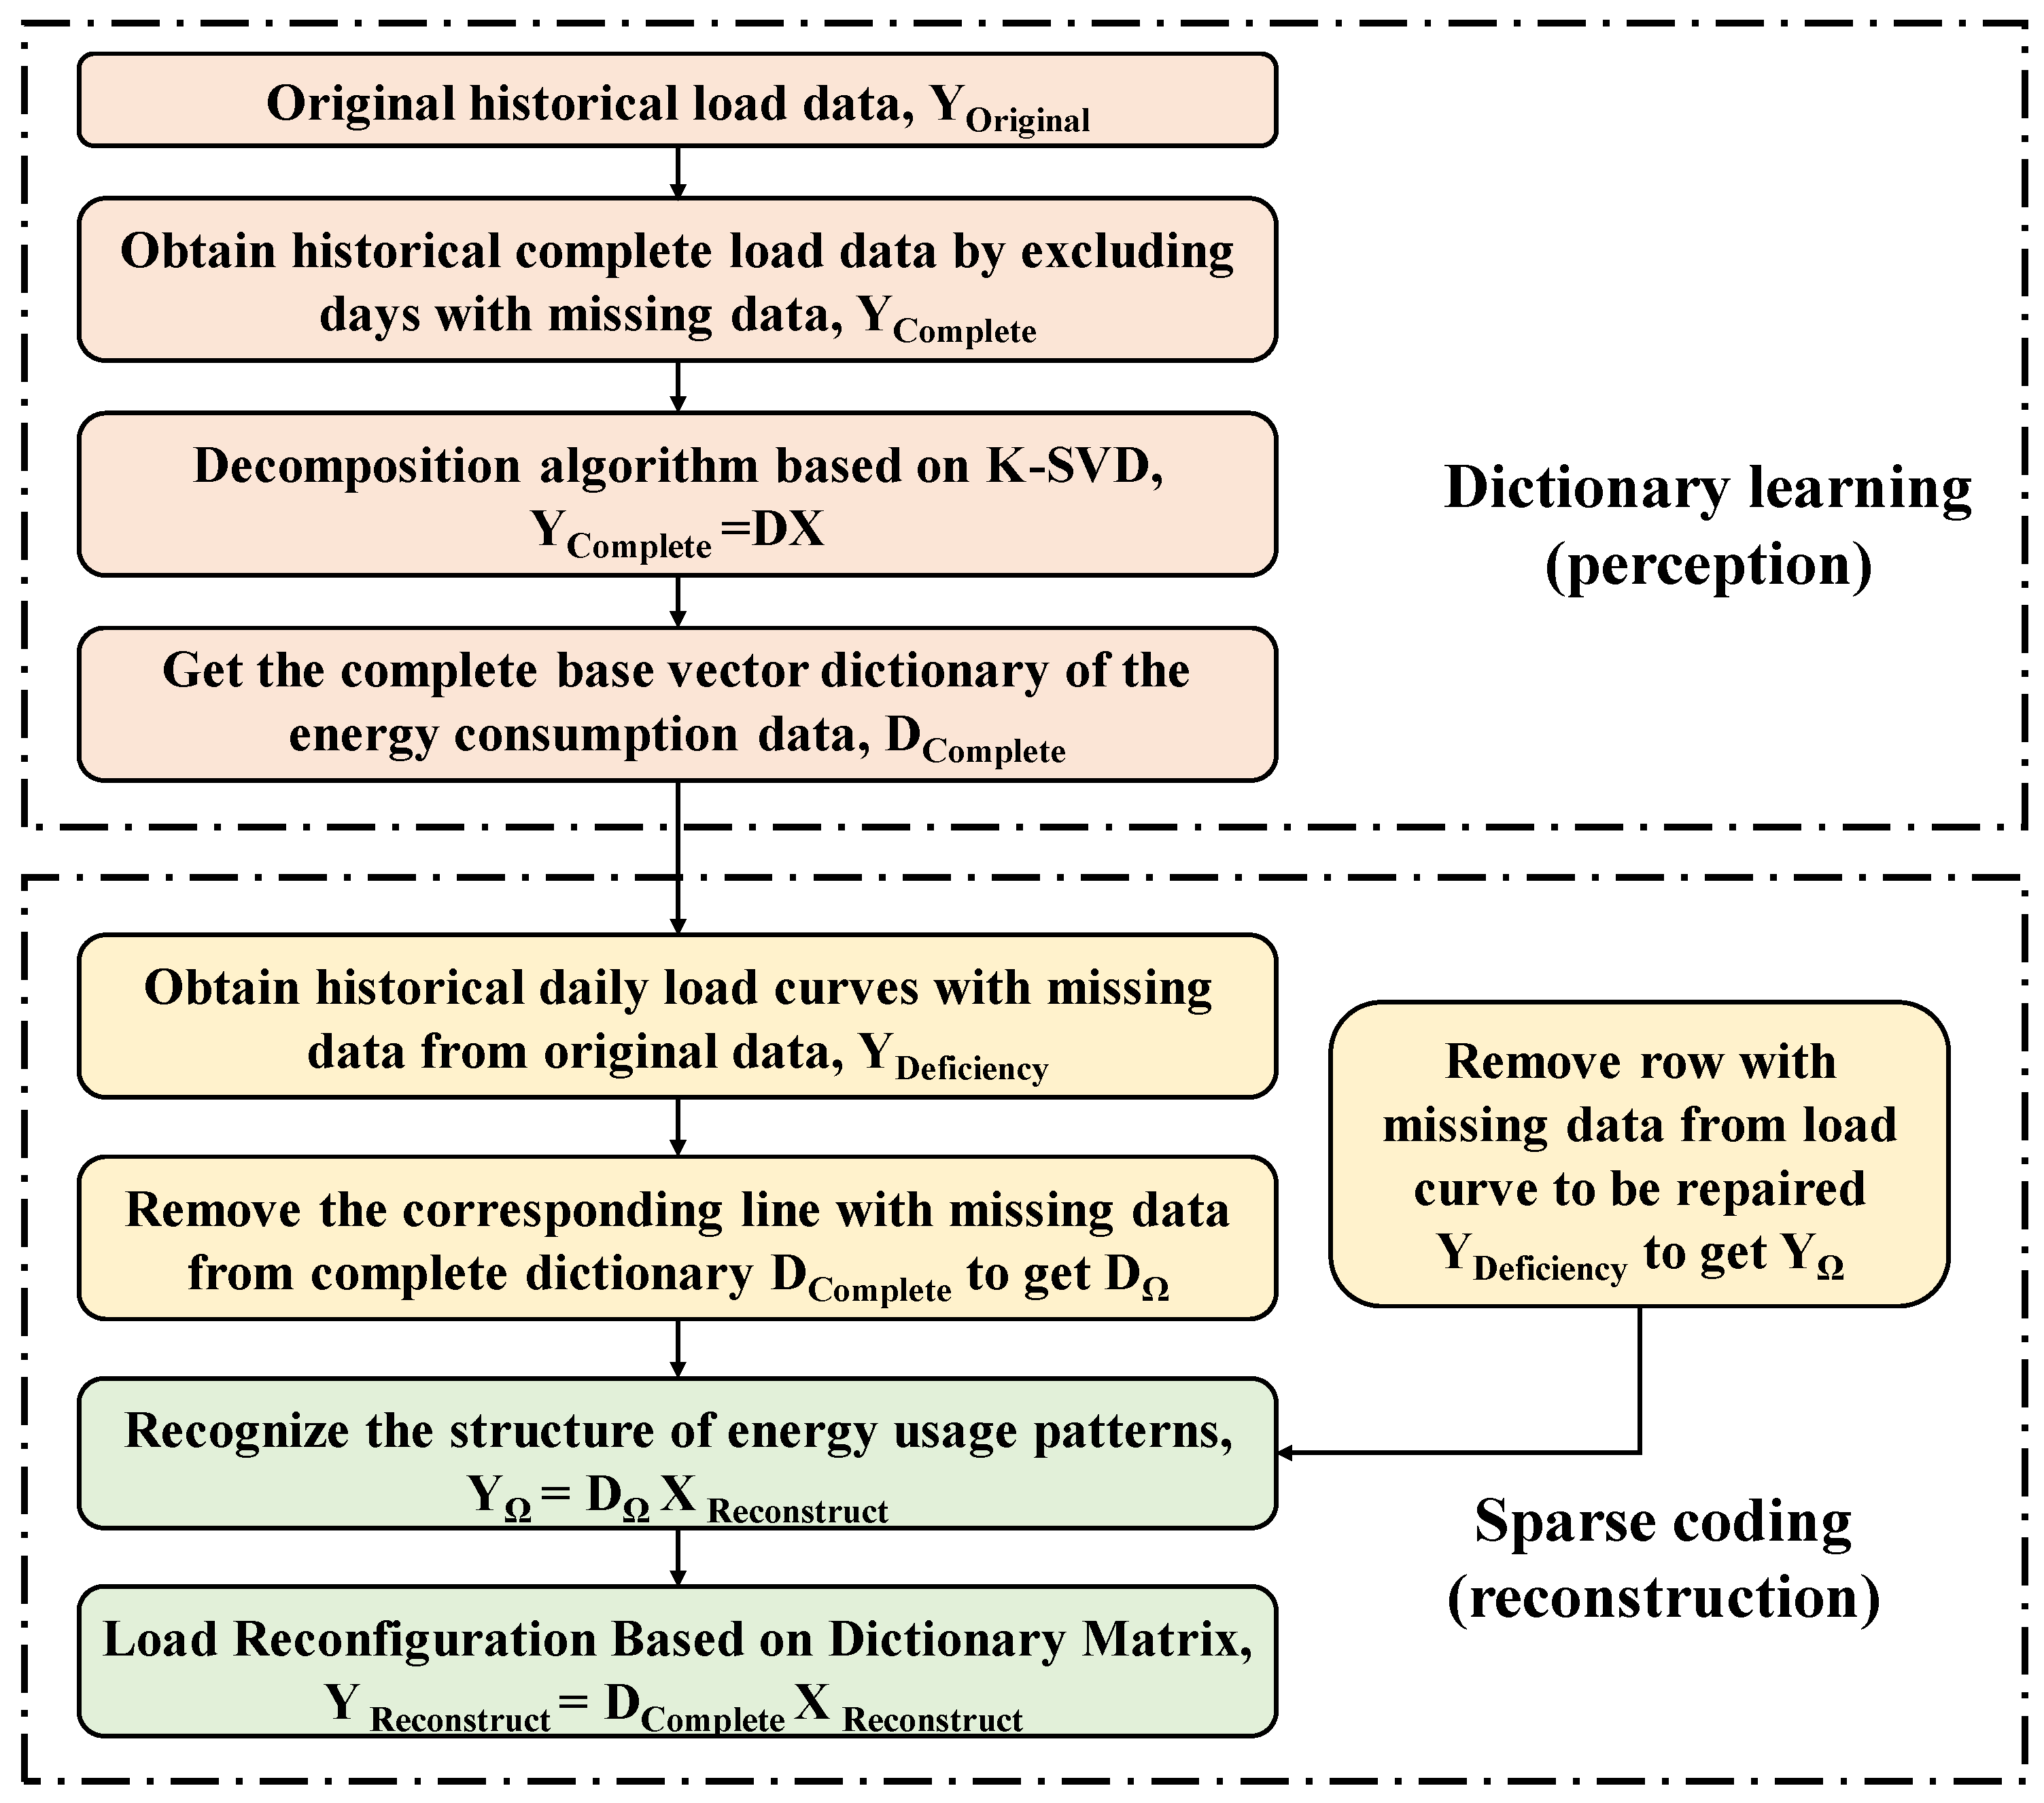
The data filling method based on K-SVD proposed in this paper is shown in Figure 1. It consists of two main parts: one involves dictionary learning, which perceives the energy usage patterns of the buildings. The second involves sparse coding and reconstructing the missing load data. The training samples are used to obtain the complete dictionary based on the K-SVD decomposition algorithm. Then, the row with missing and the corresponding rows in the dictionary are eliminated, and sparse coding identifies the structure of the energy consumption patterns to obtain the base vectors of the sample to be repaired.
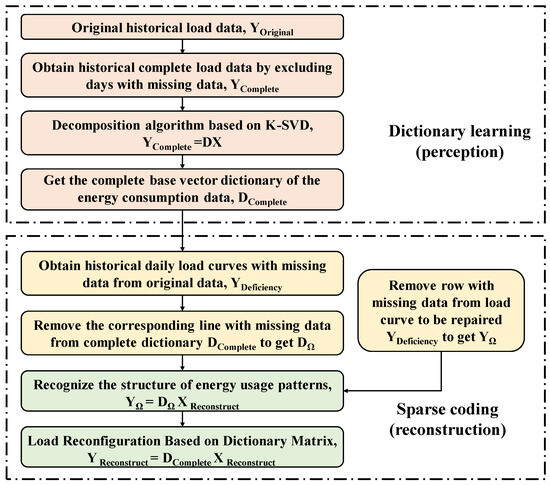
Figure 1.
The proposed data filling method based on K-SVD for building energy consumption data.
2.2. Evaluation Metrics
To evaluate and compare the performance of the data filling methods, two criteria are adopted as follows.
- (1)
- Mean Absolute Percentage Error (MAPE):
The MAPE can be calculated by Equation (11). A lower MAPE indicates a higher accuracy of the data imputation.
where At represents the actual load, kW; Ft represents the predicted or filled load, kW; and n represents the number of samples.
- (2)
- Coefficient of Variation of the Root Mean Square Error (CVRMSE):
The CVRMSE is a statistical indicator of accuracy as shown in Equation (12). A lower CVRMSE means that the data filling performance is better.
where At represents the actual load, kW; Ft represents filled load, kW; represents the average of the actual load, kW; and represents the number of samples.
3. Energy Consumption Data of a Building and Evaluation Scenarios
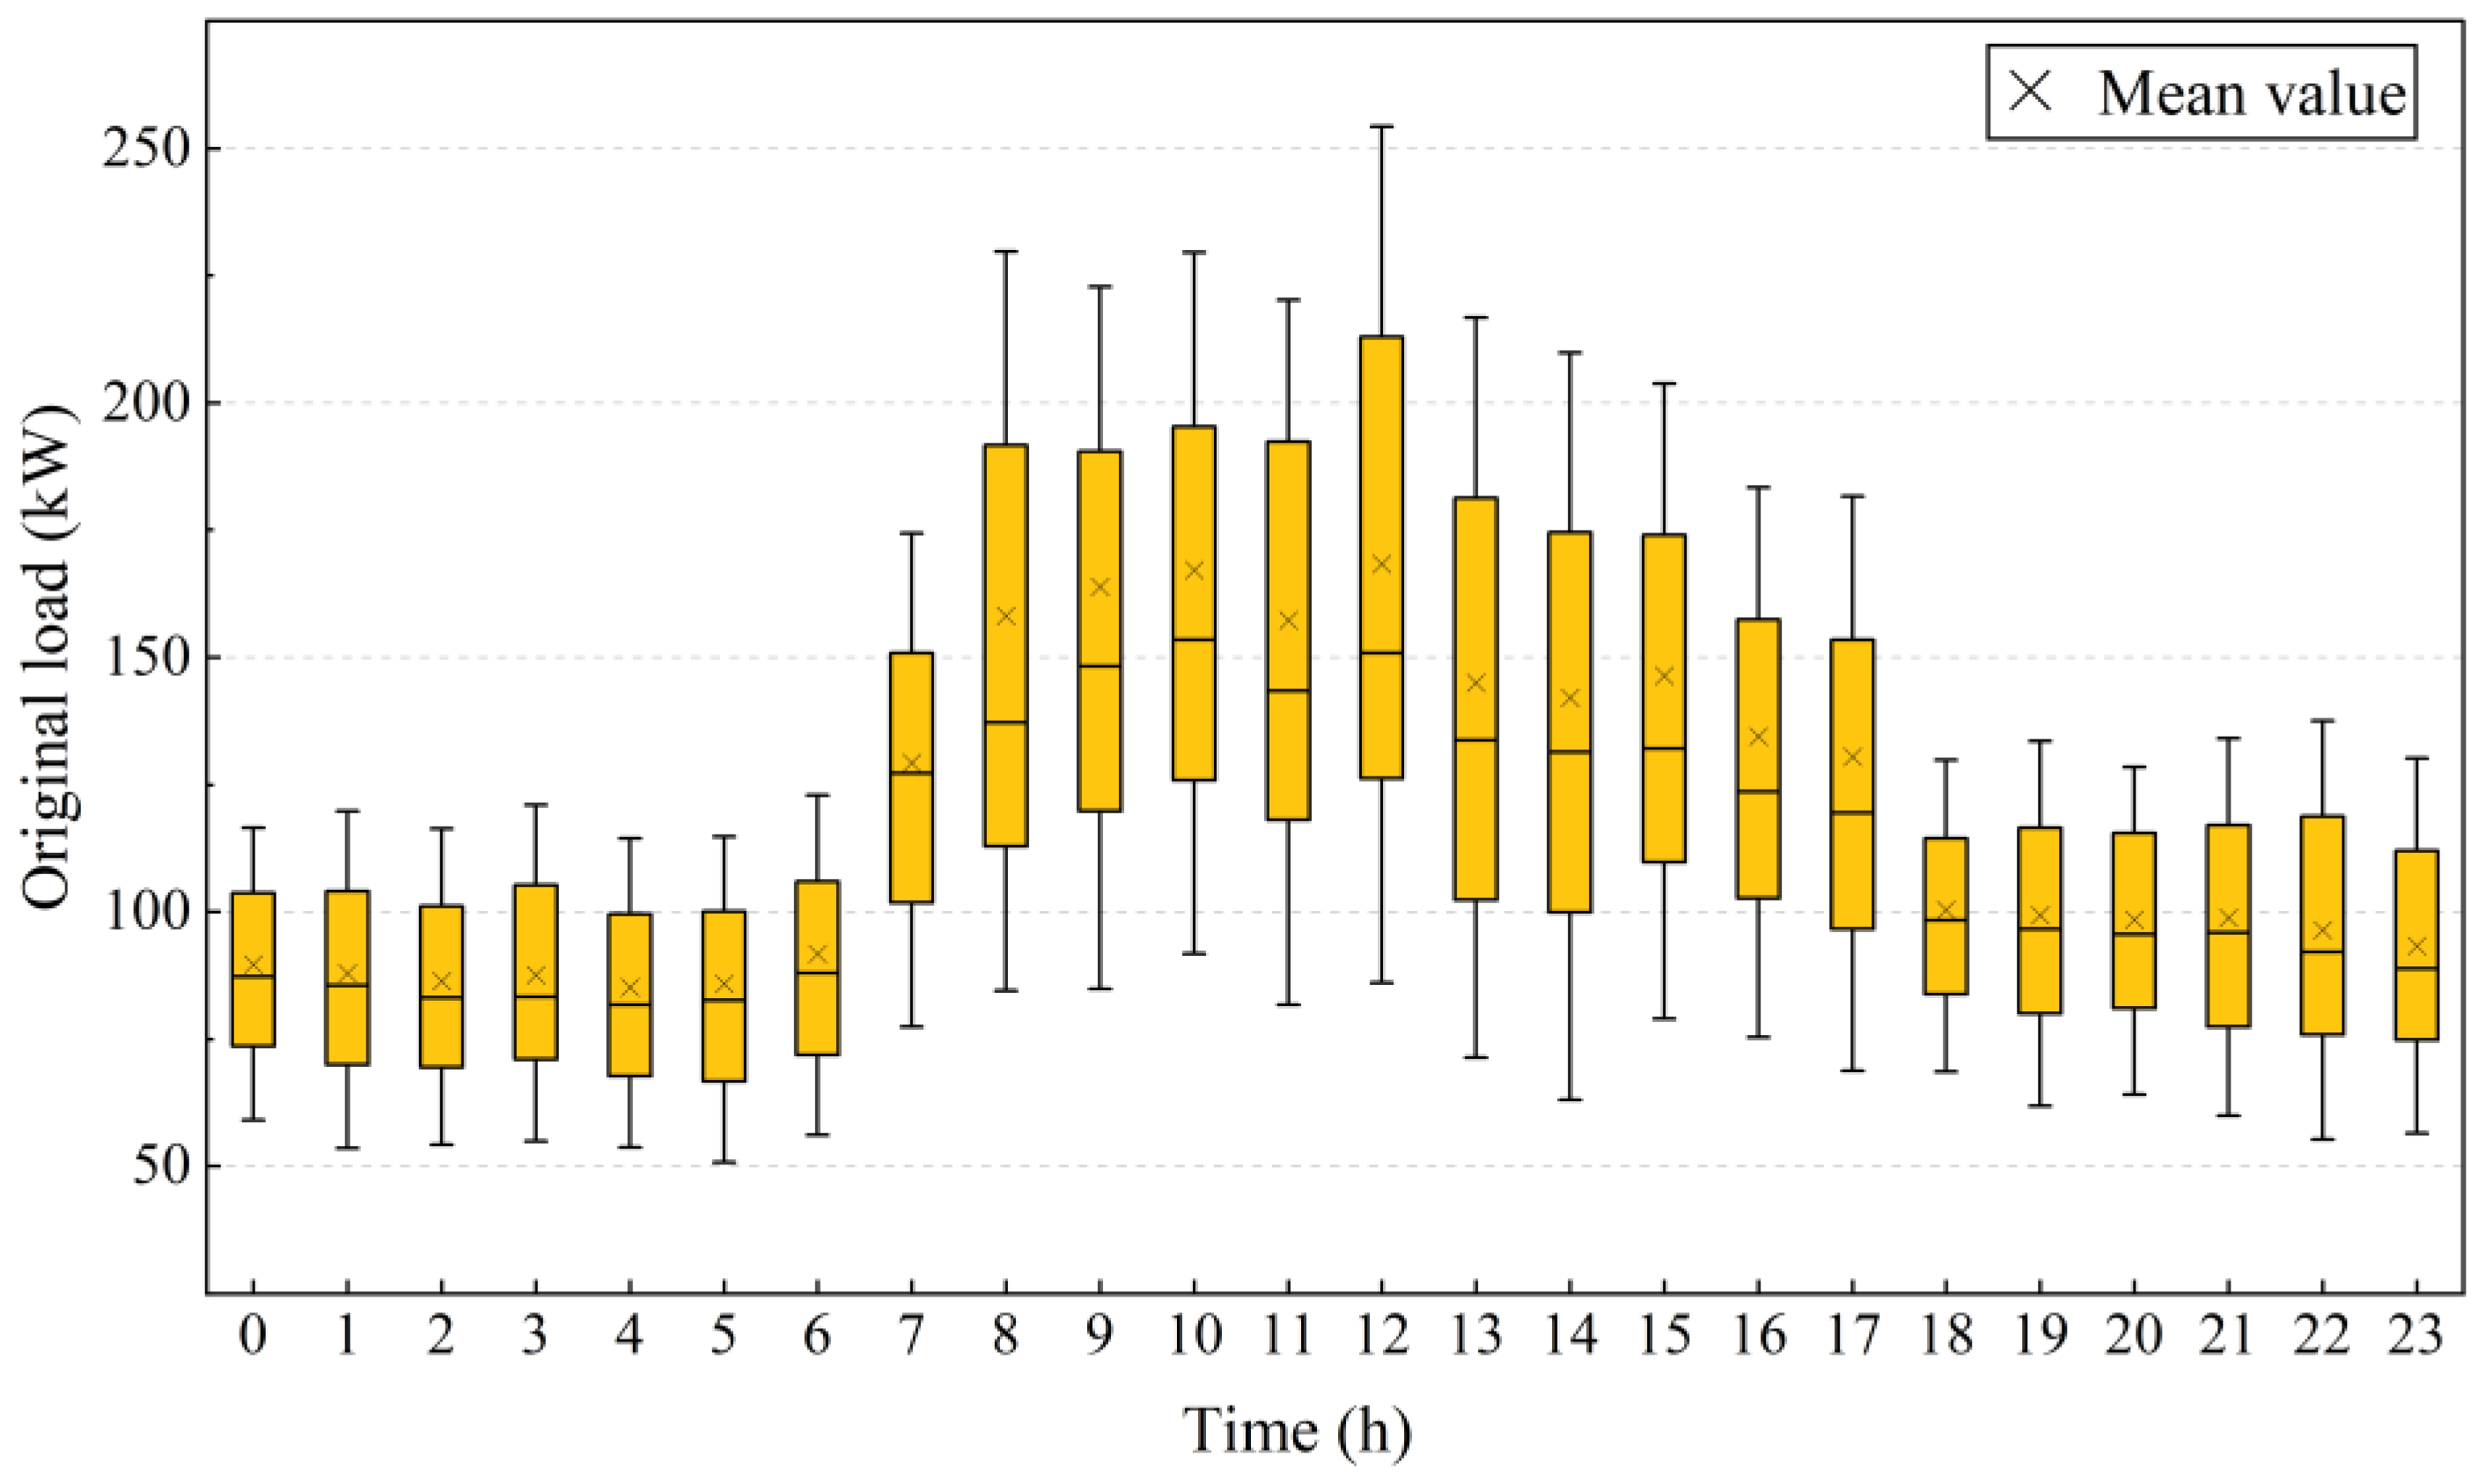
To verify the effectiveness of the proposed K-SVD method, the energy data of a hospital building in Wuhan from 31 October 2021 to 18 April 2022 are used. The local climate is hot in summer and cold in winter, and no district heating is supplied in the region. Totally, the hourly load data of 170 days are obtained, as shown in Figure 2. It shows that the energy consumption is higher from the end of December to February of the following year due to the heating demand of the building. The load is lower in the remaining months due to the transitional season. The hourly load distribution is shown in Figure 3. It shows that energy usage is higher from 7:00 to 17:00 due to the working hours of the building. The energy consumption is stable and lower during the non-working hours.
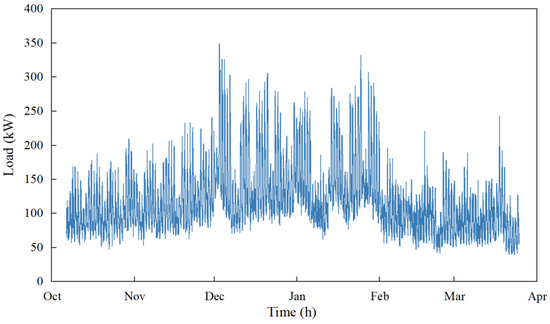
Figure 2.
Hourly load profile of the building from 31 October 2021 to 18 April 2022.

Figure 3.
Daily load distribution of the building at different hours.
To validate the method, several typical and commonly used methods are compared and explained as follows:
- (1)
- Method 1: It is interpolated based on the linear regression of the previous two adjacent data.
- (2)
- Method 2: The missing data are estimated by assuming the linear relationship between the data before and after it.
- (3)
- Method 3: The load at the same moment of the same weekday of the previous week is utilized to fill in the missing values. It is assumed the working pattern and energy consumption would not vary significantly in two weeks.
- (4)
- Method 4: The mean value of the load data obtained by Method 3 and the load data at the previous moment of the missing data is used.
- (5)
- Method 5: It fills the data with the mean of the data obtained by Method 1 and Method 3, considering the periodic and time-series characteristics of the load data.
- (6)
- Method 6: It fills the data with the mean of the data obtained by Method 2 and Method 3, also considering the periodic and time-series characteristics of the load data.
- (7)
- Method 7: The missing load data are filled with that at the same time of the nearest previous weekday or weekend. It is assumed that the working patterns and energy consumption do not change significantly for adjacent days of weekdays or weekends, respectively.
To better understand the performance of the proposed method, factors that affect the data filling performance are considered, including the dictionary size, the missing continuity, and the sample size. Details are explained as follows.
- Dictionary size: The dictionary size determines the complexity of the model. If the dictionary is too large, it may lead to overfitting. Conversely, if the dictionary is too small, it may lead to underfitting. Moreover, increasing the dictionary size may increase the computational complexity of the K-SVD algorithm. Thus, the influence of the dictionary size is evaluated.
- Missing continuity: It will affect the integrity of the information in the original data. Therefore, in this study, the continuity of the missing data is considered to show the advantages of the data filling method.
- Training sample size: The training sample size would affect the quality of the learned dictionary and the computational cost. Thus, the impact of the training sample size is considered and tested.
4. Result Analysis and Discussion
The performance of the proposed data filling method based on K-SVD is introduced in this section under various scenarios and compared with the traditional methods.
4.1. Impact of the Dictionary Size
The load data of the building from November and December of 2021 are selected to study the filling performance of the K-SVD method. Six days in December were randomly chosen, and each day had five randomly non-consecutive missing data. The remaining energy consumption data for December and November are used to obtain the dictionary, which is later utilized to reconstruct and fill in the missing data.
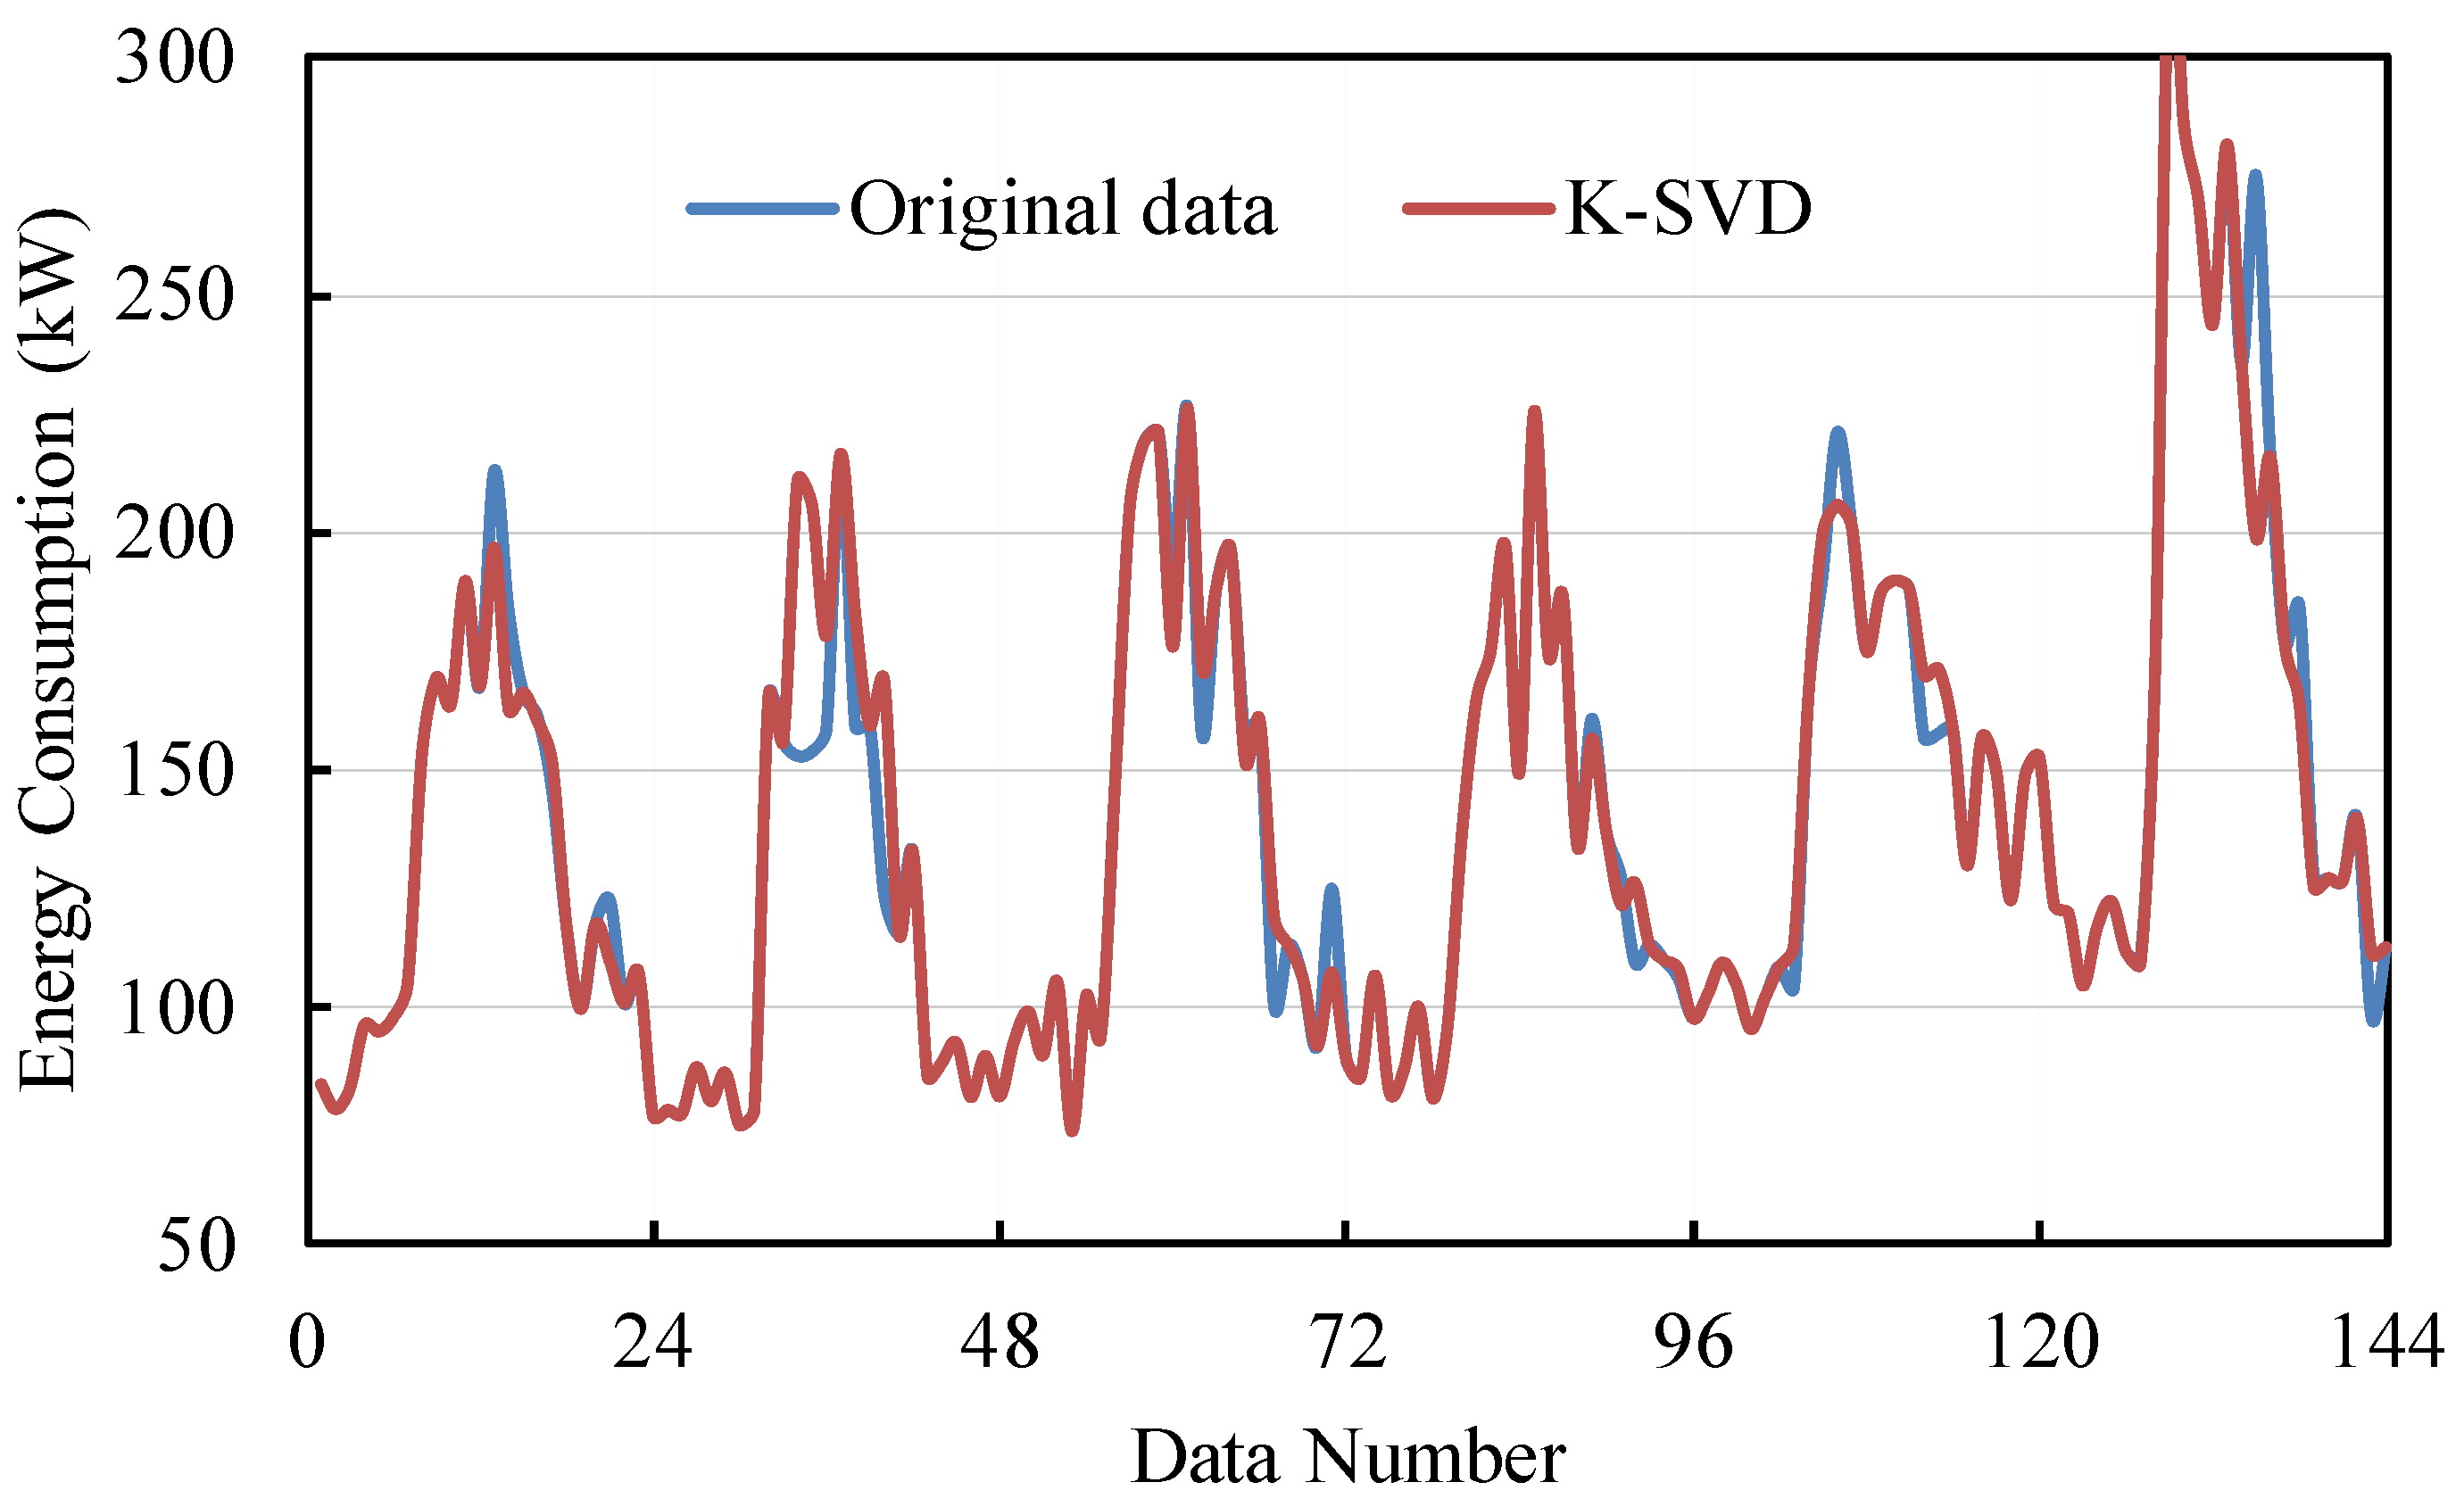
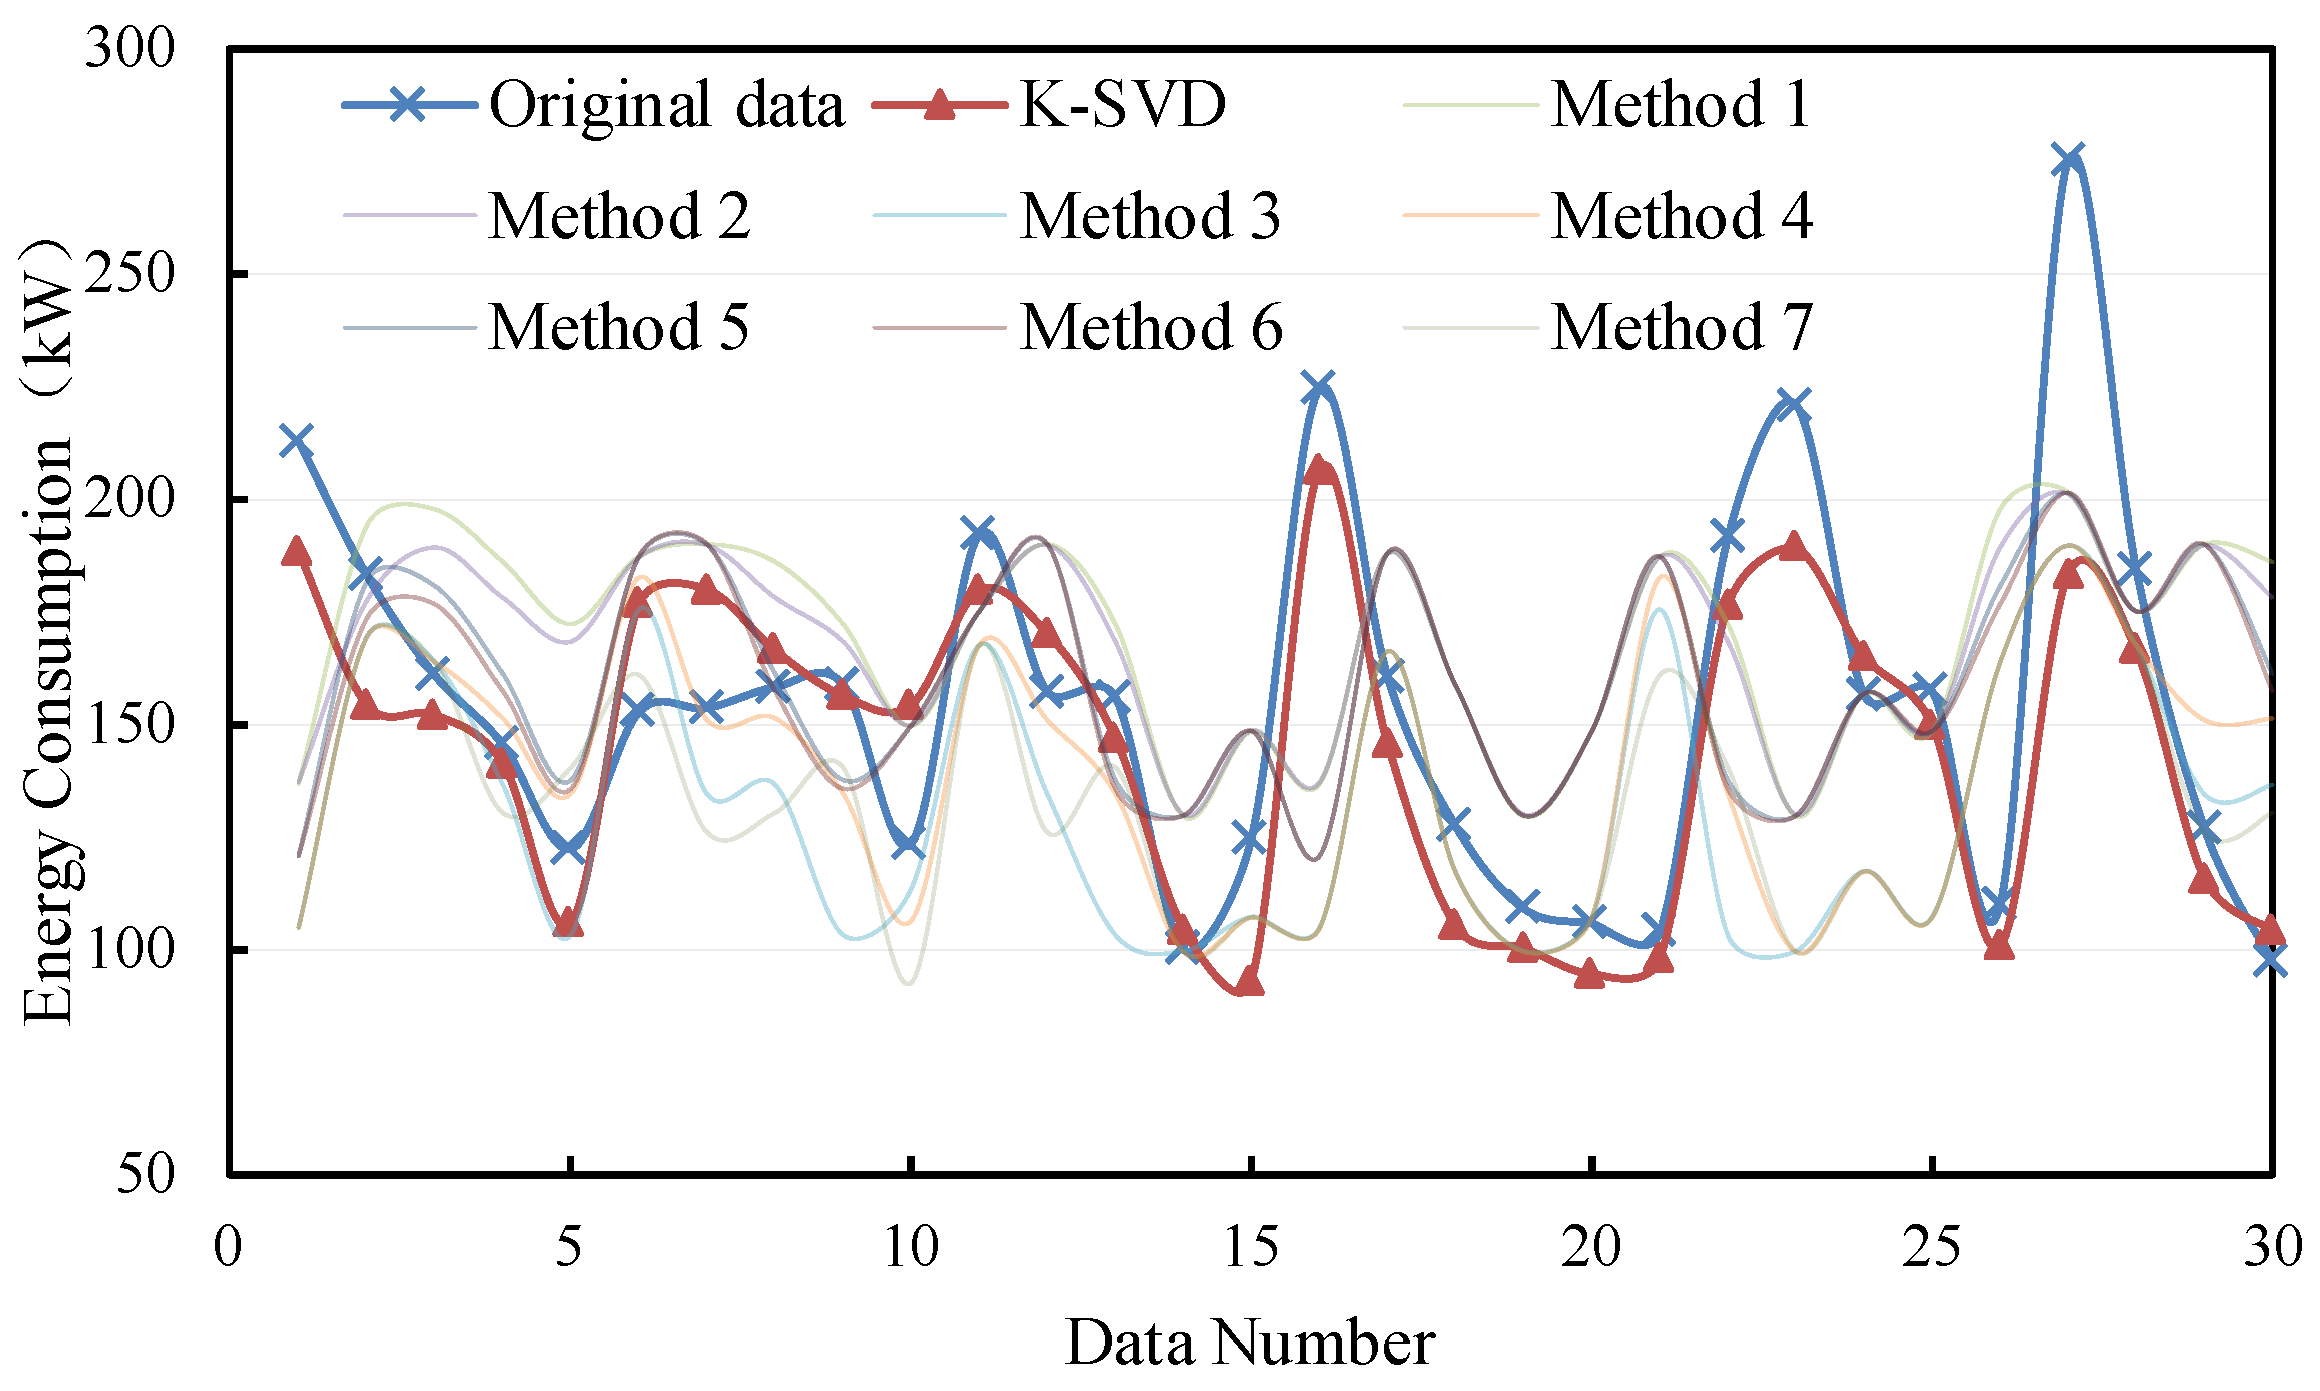
The filling performance is shown in Figure 4. It can be observed that the MAPE is approximately 11% to 15%, and the CVRMSE is around 15% to 20%. The MAPE and CVRMSE almost do not increase with k. When the dictionary size is too large, the model is sensitive to noise, and “overfitting” is more likely to occur, resulting in poorer generalization performance. Therefore, a small dictionary size is recommended, taking into account computational complexity considerations. The imputation results when the dictionary size is 2 are depicted in Figure 5. The filled data match well with the original data. This indicates that the proposed K-SVD method can fill the missing data with promising performance.
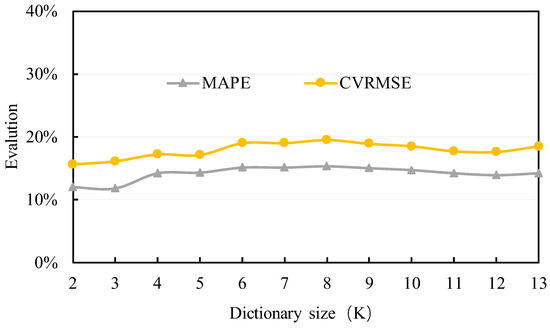
Figure 4.
The MAPE and CVRMSE of the data filling method based on K-SVD under different dictionary sizes.
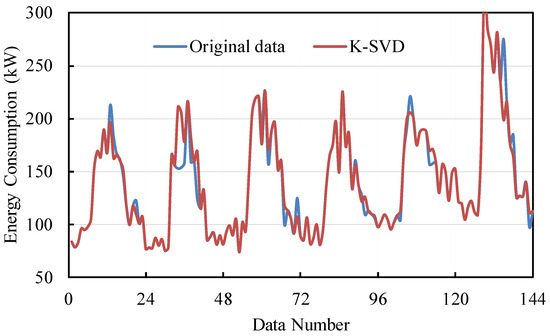
Figure 5.
The data imputation results of K-SVD.
4.2. Impact of the Missing Continuity
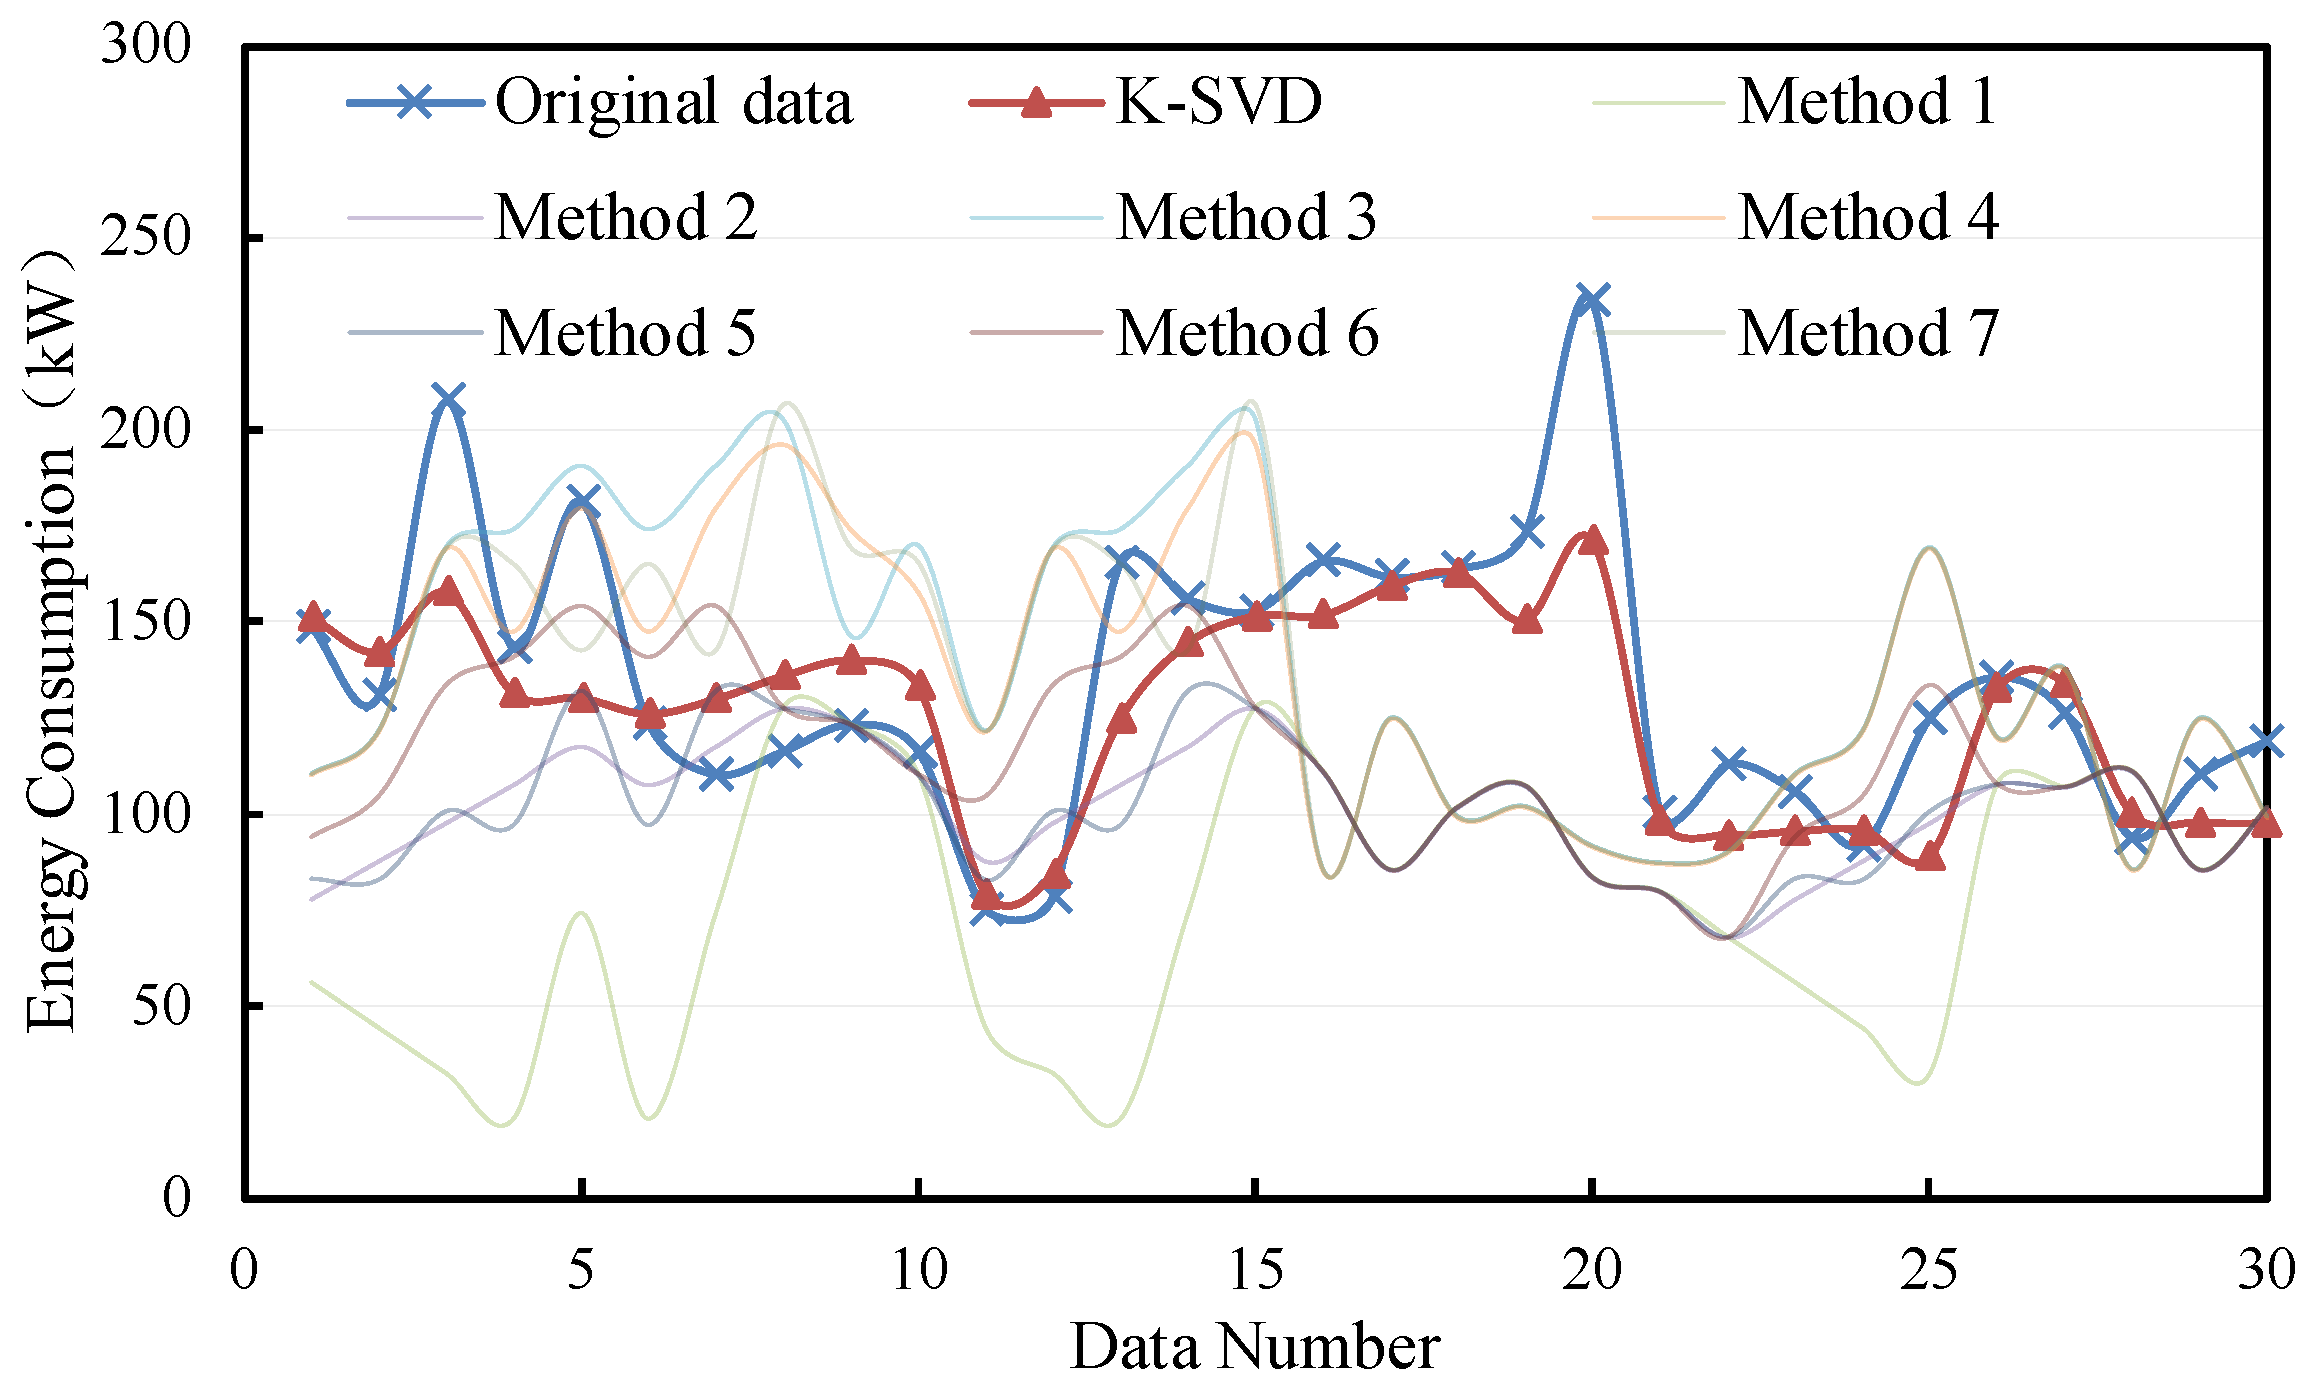
The filling performance of the K-SVD-based method under consecutive and non-consecutive missing energy consumption data is analyzed in this section. The load data for December are selected. Six days in December are selected randomly and five data points on each day are randomly eliminated. The remaining data from December and November are employed for dictionary learning. Then, the dictionary is used to fill the deleted data points. These five removed hours are, respectively, consecutive and non-consecutive in the two scenarios.
The filling results are shown in Table 1. It can be observed that most methods perform better filling in the non-continuous missing data compared with the continuous missing data. Particularly, the difference in the MAPE in filling the consecutive and non-consecutive missing data based on the K-SVD method is approximately 4%, and the difference in the CVRMSE is around 6.7%. Non-consecutive missing data imply relatively dispersed data absence with relatively less local information loss. The K-SVD-based method can more easily find dictionary representations for the non-consecutive missing. Conversely, the consecutive missing means more loss of local information, leading to increased difficulty in the imputation process.

Table 1.
Filling results of different missing types with small samples.
The K-SVD-based filling method can achieve better performance than the traditional methods with a lower MAPE and CVRMSE. The MAPE and CVRMSE of the proposed method are between 10.8% and 14.8%, and between 15.7% and 22.4%. On the other hand, the MAPE and CVRMSE of the other methods change from 13.4% to 42.9% and 18.5% to 57.9%. The filling deviation of the K-SVD method is relatively smaller. Particularly, the MAPE and the CVRMSE can be improved by 2.6–28.1% and 2.8–35.5%.
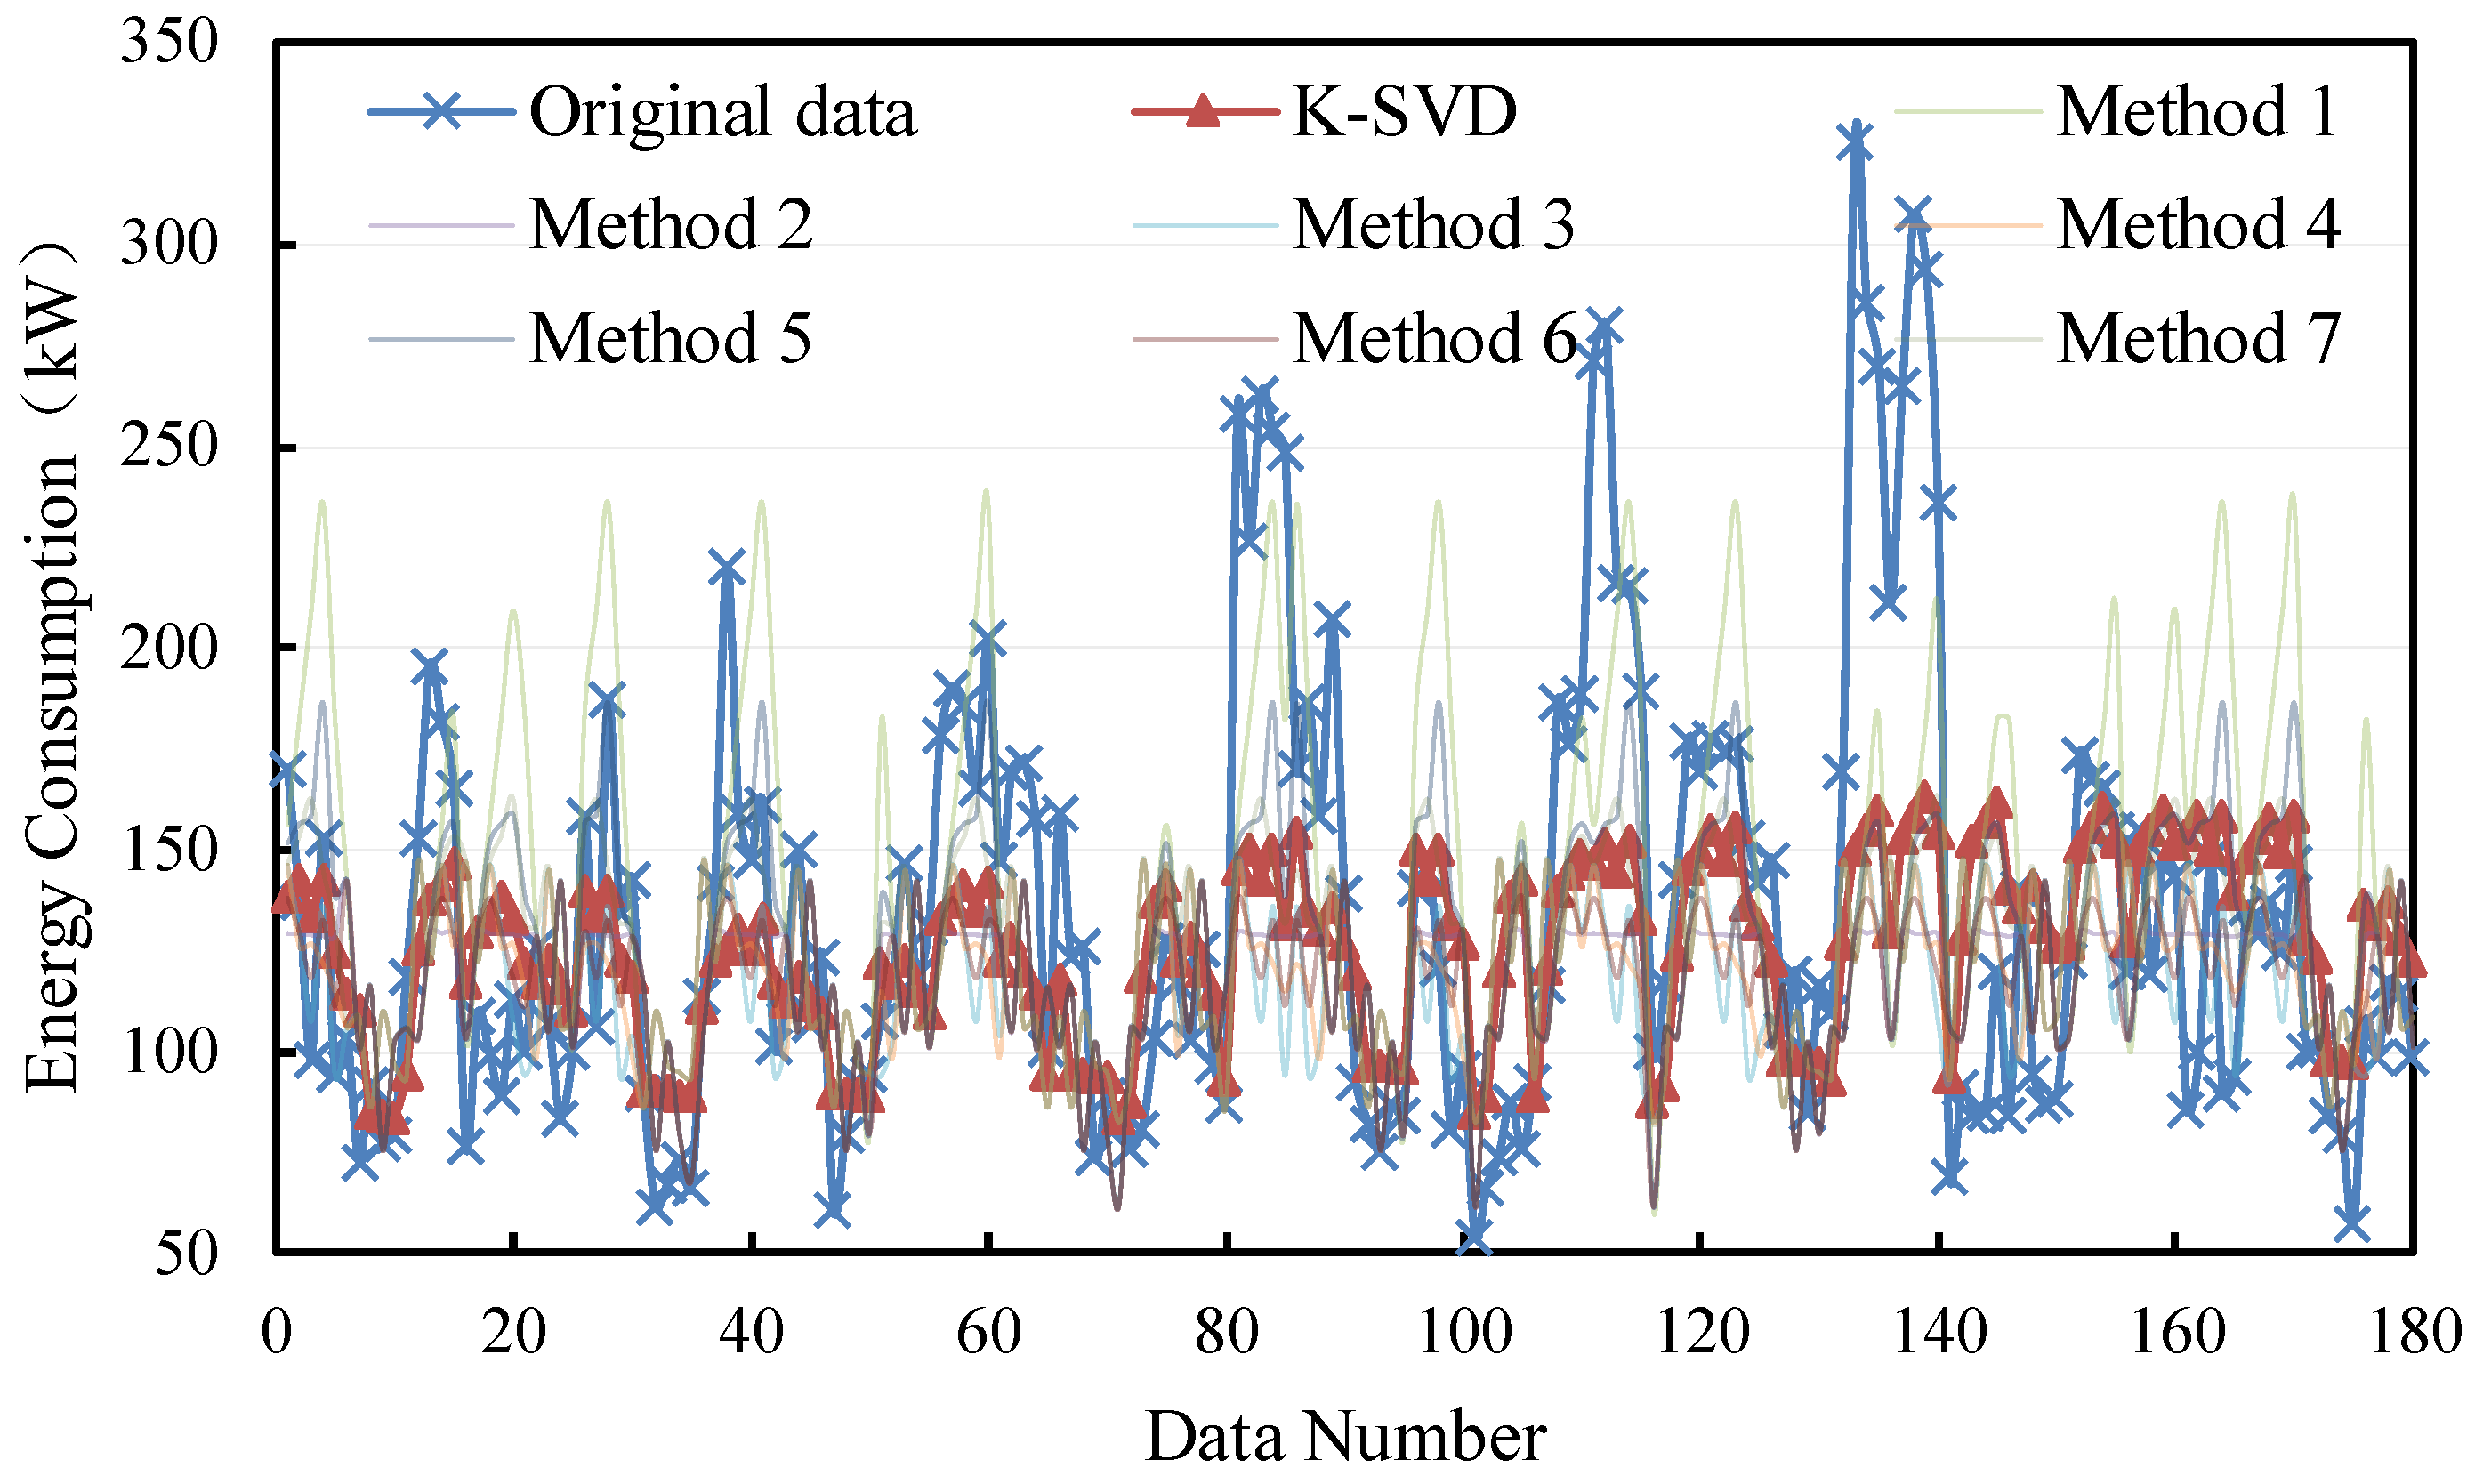
The filling results are shown in Figure 6 and Figure 7. It can be seen that most methods demonstrate better performance in filling the non-consecutive missing data. Moreover, the K-SVD-based filling method is mostly closer to the original data. The deviations of consecutive missing and non-consecutive missing are from 0 kW to 50 kW and from 0 kW to 100 kW, respectively.
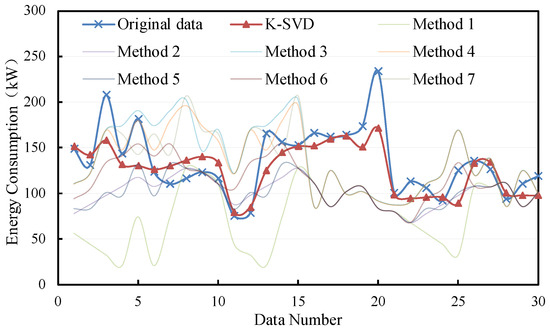
Figure 6.
Filling results of consecutive missing points with small samples.
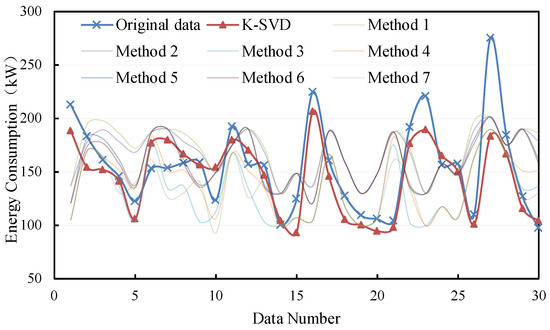
Figure 7.
Filling results of non-consecutive missing points with small samples.
4.3. Impact of the Sample Size
The filling performance of the K-SVD-based method considering the impact of the learning sample size is analyzed in this section. The smaller training sample size implies that only the data from November are used for dictionary learning, reconstruction, and imputation. A larger training sample size implies that the energy consumption data from November 2021 to April 2022 are used for dictionary learning. To ensure the same missing rate, 36 days and 6 days are randomly selected for large and small samples, respectively, with 5 h missing each day. These 5 h can be consecutive and non-consecutive.
The filling results of the proposed K-SVD method compared with traditional methods are shown in Table 2. It can be observed that the K-SVD method demonstrates a higher accuracy under the smaller learning sample size. The MAPE is between 9.3% and 9.4%, and the CVRMSE is between 12% and 17.1%. When the training sample is larger, the MAPE and CVRMSE are increased by 14.7–20.1% and 16.3–17%. When the sample size is small, the learned dictionary is more likely to capture the intrinsic features of the energy usage patterns. It can enhance the performance of imputation. In addition, the filling performance of all methods is better under non-consecutive missing compared with consecutive missing. The priority of the K-SVD-based filling method is stronger under smaller learning samples, with a much lower MAPE and CVRMSE.
Table 2.
Filling results of different sample sizes.
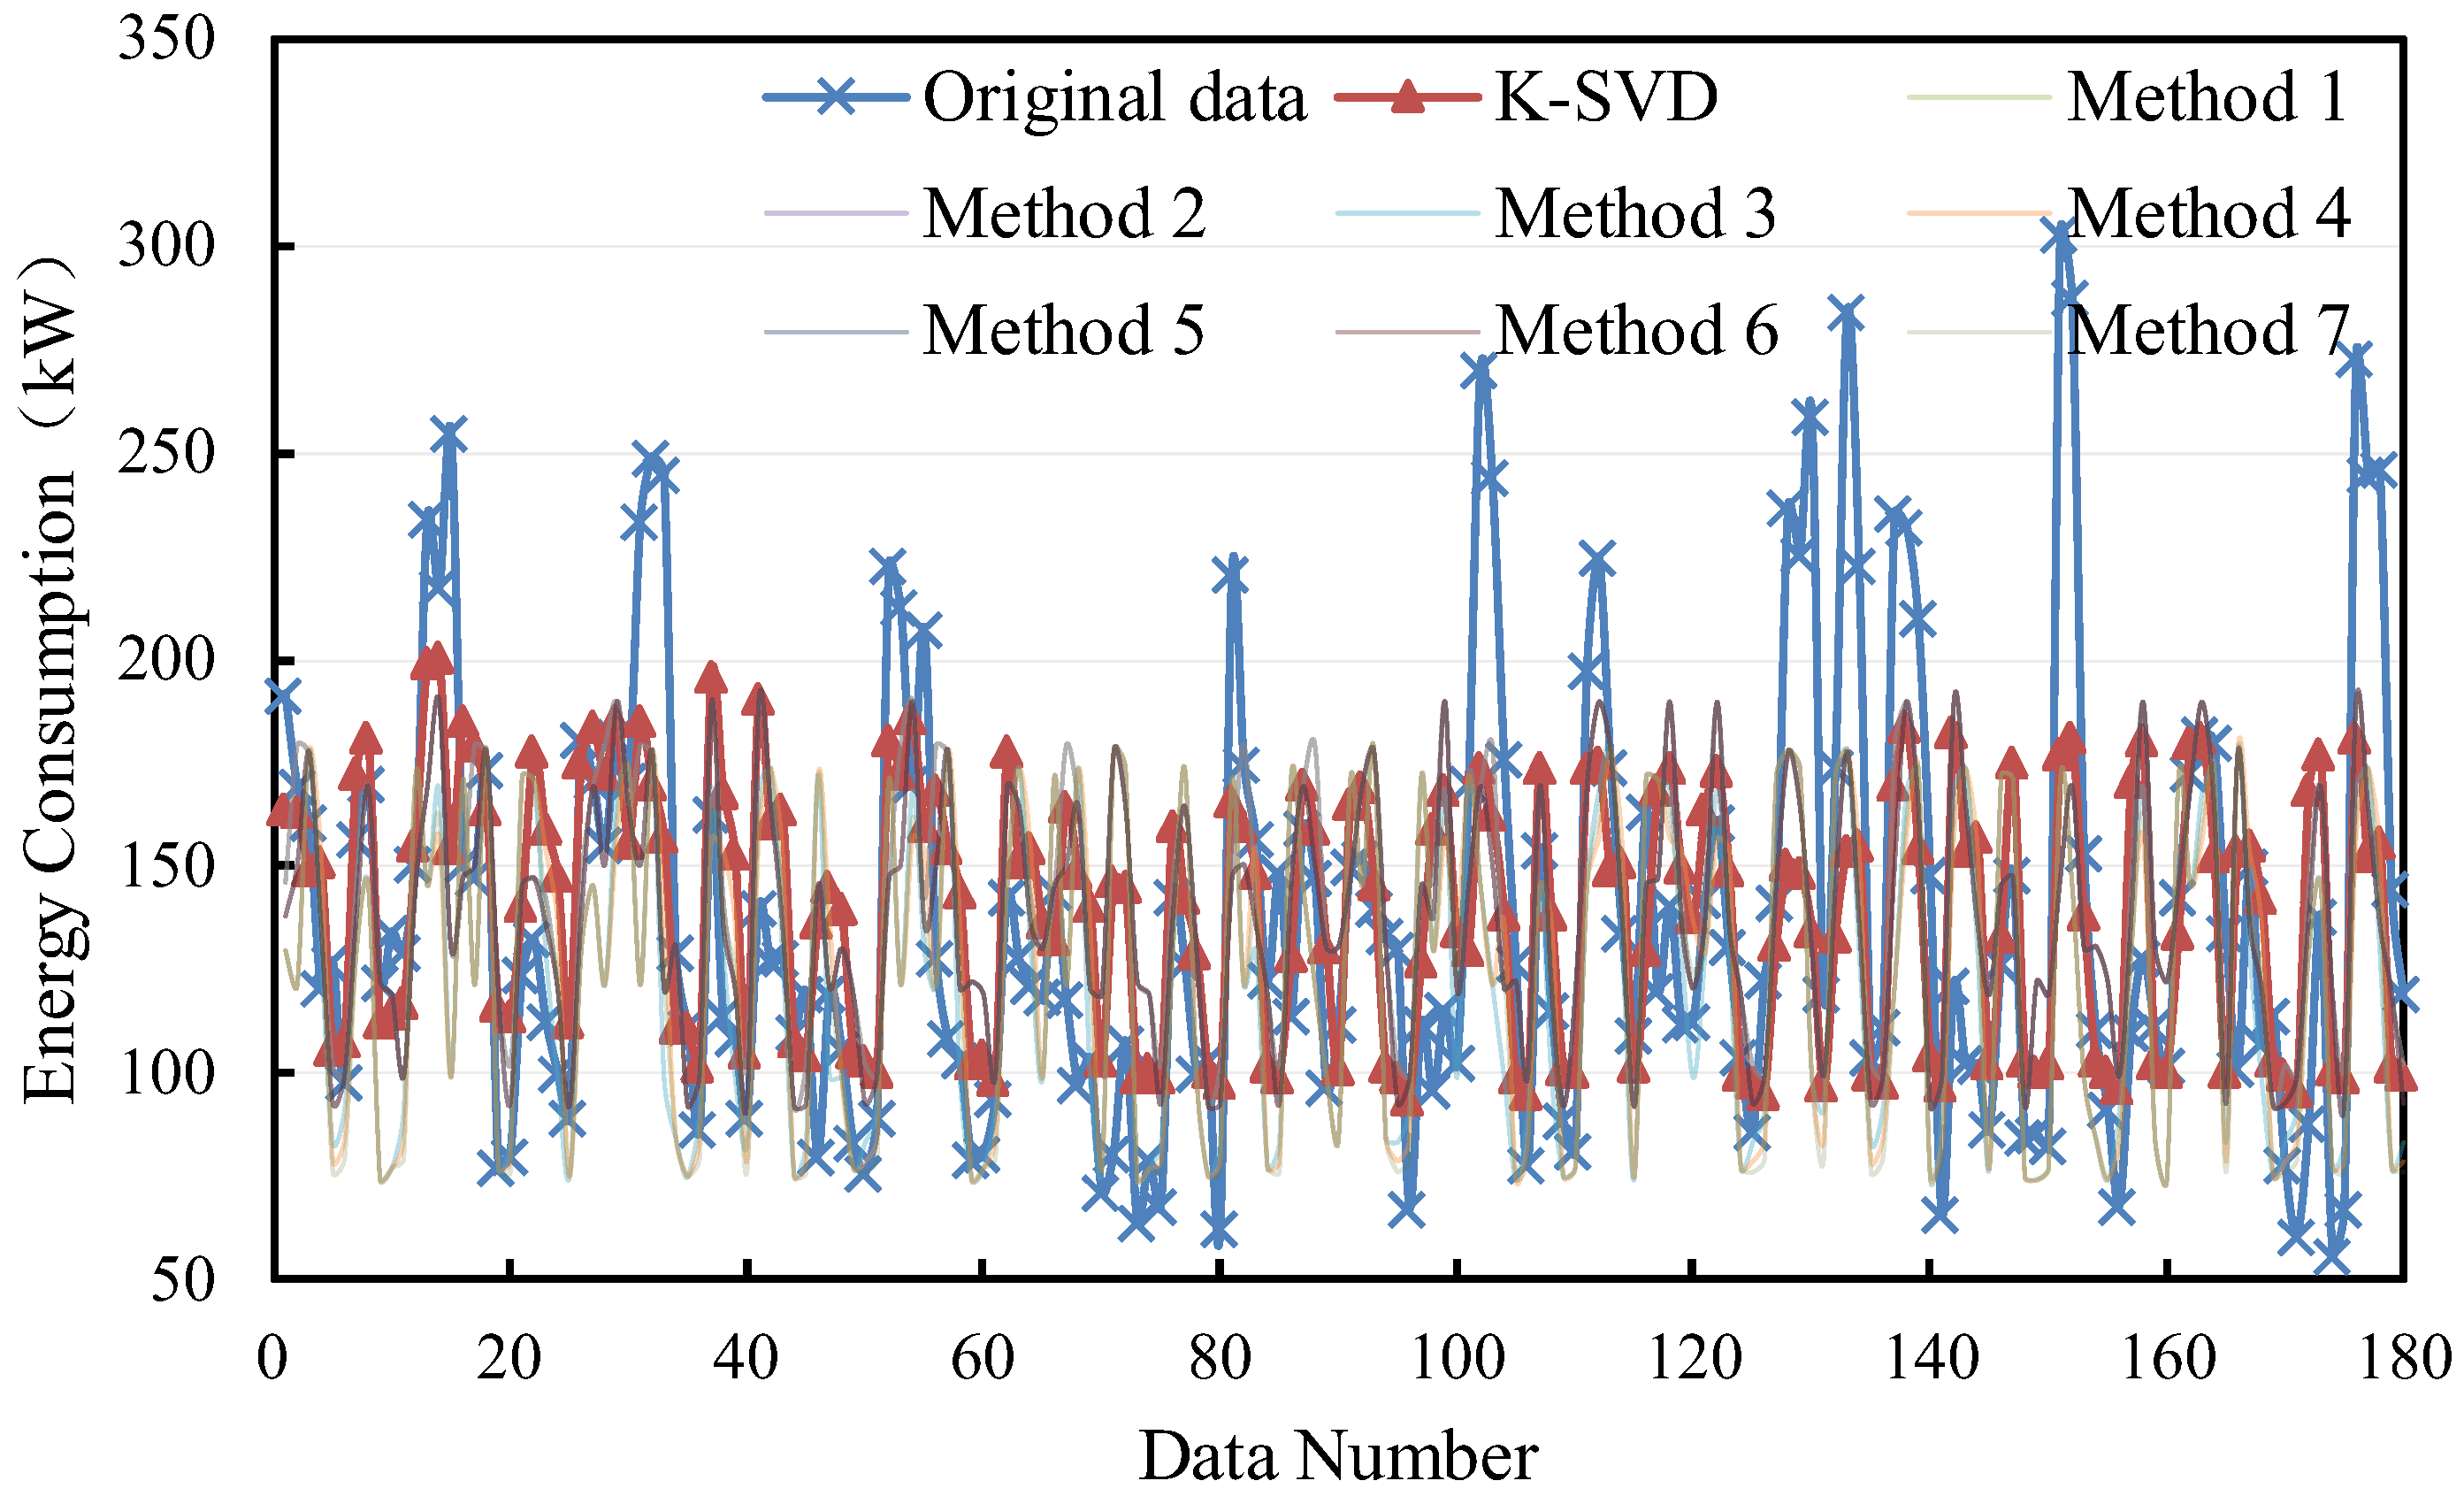
The filling results of the large sample are shown in Figure 8 and Figure 9. It can be found that all methods perform slightly better in non-consecutive missing values. The deviations based on the K-SVD method under consecutive missing and non-consecutive missing are from 0 kW to 150 kW and from 0 kW to 100 kW, respectively.
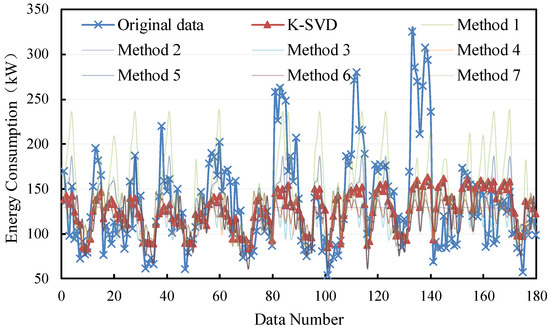
Figure 8.
Filling results of consecutive missing points with large samples.
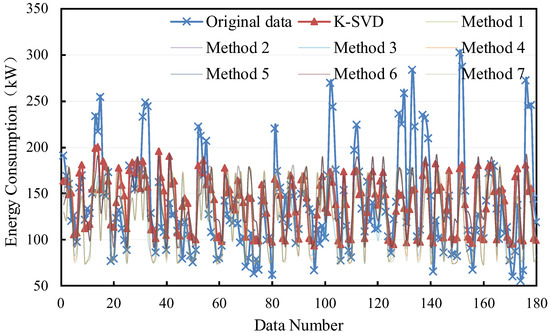
Figure 9.
Filling results of non-consecutive missing points with large samples.
5. Conclusions
A data imputation method based on K-SVD is proposed in this study aiming to fill the missing or abnormal building energy consumption data. To estimate the effectiveness of the proposed method, it is compared with the traditional linear interpolation and nearest neighbor interpolation methods, considering the influence of the dictionary size, missing continuity, and sample size. The following conclusions can be obtained based on the test on the building energy data:
- The proposed K-SVD-based method can fill the missing energy consumption data with high accuracy. The MAPE and CVRMSE are 10.8–14.8% and 15.7–22.4%. It shows a better imputation performance compared with other traditional methods, resulting in a decrease in the MAPE and CVRMSE by 3.8–45.4% and 6.7–87.8%.
- The increase in dictionary size would not lead to better filling accuracy, so a smaller size is recommended. However, the optimal size should be checked before being applied.
- The K-SVD-based method performs better for the non-consecutive missing data compared with the consecutive missing situation. The MAPE and CVRMSE for non-consecutive missing can be lower by 0.1–4% and 5.1–6.7% compared with that for consecutive missing data. However, the filling advantage of the proposed method is stronger for consecutive missing data compared with the traditional methods.
- The proposed method can achieve a higher filling accuracy when the learning sample size is small. The accuracy of the imputation method using K-SVD, based on the data of one month, evaluated by MAPE and CVRMSE, ranges from 9.3% to 9.4% and 12% to 17.1%. It is much lower than that with a large learning sample size.
The proposed K-SVD data filling methods in this paper would provide an effective technique for preprocessing building energy consumption data. Currently, we have only compared it with classical traditional methods. The comparisons with other filling alternatives will be conducted in the future work. Considering that the building energy usage pattern changes over time, the dictionary should be updated to improve the filling accuracy. Furthermore, the impact of the missing rate is not considered in this paper and it would also affect the performance of the K-SVD-based method. All these should be considered in further study.
Author Contributions
Conceptualization, L.S. and W.G.; methodology, W.G. and C.Z.; algorithm, L.S., M.L. and Z.L.; investigation, Y.Z. and X.H.; resources, M.L. and Z.L; writing—original draft preparation, L.S. and W.G.; writing—review and revise, W.G. All authors have read and agreed to the published version of the manuscript.
Funding
The research is funded by the program research and application of demand response potential evaluation technologies based on massive electricity data (no. B31532238944) supported by the State Grid Hubei Electric Power Research Institute.
Data Availability Statement
The data presented in this study are available on request from the corresponding author.
Conflicts of Interest
The authors declare no conflicts of interest.
References
- Hossain, E.; Khan, I.; Un-Noor, F.; Sikander, S.S.; Sunny, M.S.H. Application of Big Data and Machine Learning in Smart Grid, and Associated Security Concerns: A Review. IEEE Access 2019, 7, 13960–13988. [Google Scholar] [CrossRef]
- Zhang, Y.; Huang, T.; Bompard, E.F. Big data analytics in smart grids: A review. Energy Inform. 2018, 1, 8. [Google Scholar] [CrossRef]
- Huang, G. Missing data filling method based on linear interpolation and lightgbm. J. Phys. Conf. Ser. 2021, 1754, 012187. [Google Scholar] [CrossRef]
- Razavi-Far, R.; Farajzadeh-Zanjani, M.; Saif, M.; Chakrabarti, S. Correlation Clustering Imputation for Diagnosing Attacks and Faults with Missing Power Grid Data. IEEE Trans. Smart Grid 2020, 11, 1453–1464. [Google Scholar] [CrossRef]
- Wang, T.; Li, Y.; Deng, Z.; Liu, Y.; Li, Y.; Tan, M.; An, Z. Implementation of state-wide power quality monitoring and analysis system in China. In Proceedings of the 2018 IEEE Power & Energy Society General Meeting (PESGM), Portland, OR, USA, 5–10 August 2018; pp. 1–5. [Google Scholar]
- Ge, M.; Chren, S.; Rossi, B.; Pitner, T. Data Quality Management Framework for Smart Grid Systems. In Business Information Systems, proceedings of the 22nd International Conference, BIS 2019, Seville, Spain, 26–28 June 2019; Springer International Publishing: Cham, Switzerland, 2019; pp. 299–310. [Google Scholar]
- Liu, H.; Wang, Y.; Chen, W.J. Three-step imputation of missing values in condition monitoring datasets. IET Gener. Transm. Distrib. 2020, 14, 3288–3300. [Google Scholar] [CrossRef]
- Little, R.J.A.; Rubin, D.B. Statistical Analysis with Missing Data, 3rd ed.; John Wiley & Sons: Hoboken, NJ, USA, 1987. [Google Scholar]
- Abraham, W.T.; Russell, D.W. Missing data: A review of current methods and applications in epidemiological research. Curr. Opin. Psychiatry 2004, 17, 315–321. [Google Scholar] [CrossRef]
- Ahn, H.; Sun, K.; Kim, K.P. Comparison of Missing Data Imputation Methods in Time Series Forecasting. Comput. Mater. Contin. 2022, 70, 767–779. [Google Scholar] [CrossRef]
- Aydilek, I.B.; Arslan, A. A hybrid method for imputation of missing values using optimized fuzzy c-means with support vector regression and a genetic algorithm. Inf. Sci. 2013, 233, 25–35. [Google Scholar] [CrossRef]
- Myrtveit, I.; Stensrud, E.; Olsson, U.H. Analyzing data sets with missing data: An empirical evaluation of imputation methods and likelihood-based methods. IEEE Trans. Softw. Eng. 2001, 27, 999–1013. [Google Scholar] [CrossRef]
- Khan, S.I.; Hoque, A.S.M.L. SICE: An improved missing data imputation technique. J. Big Data 2020, 7, 37. [Google Scholar] [CrossRef]
- Dasarathy, B.V. Nearest Neighbor (NN) Norms: NN Pattern CLassification Techniques. 1991. Available online: https://www.semanticscholar.org/paper/Nearest-neighbor-(NN)-norms%3A-NN-pattern-techniques-Dasarathy/0b1d3ec2e6fe49aaf8dc068b8a812e9ef3f163fa (accessed on 21 January 2024).
- Xu, Y.; Ni, Y. Research on Missing Data Imputation Based on Conditional Variational Autoencoder. In Proceedings of the International Conference on Computer Information Science and Artificial Intelligence (CISAI), Kunming, China, 17–19 September 2021; pp. 726–730. [Google Scholar]
- Zou, D.; Xiang, Y.; Zhou, T.; Peng, Q.; Dai, W.; Hong, Z.; Shi, Y.; Wang, S.; Yin, J.; Quan, H. Outlier detection and data filling based on KNN and LOF for power transformer operation data classification. Energy Rep. 2023, 9, 698–711. [Google Scholar] [CrossRef]
- Jadhav, A.; Pramod, D.; Ramanathan, K. Comparison of Performance of Data Imputation Methods for Numeric Dataset. Appl. Artif. Intell. 2019, 33, 913–933. [Google Scholar] [CrossRef]
- Xiong, Z.; Guo, H.; Wu, Y. Review of Missing Data Processing Methods. Comput. Eng. Appl. 2021, 57, 27–38. [Google Scholar]
- Domagk, M.; Zyabkina, O.; Meyer, J.; Schegner, P. Trend identification in power quality measurements. In Proceedings of the Australasian Universities Power Engineering Conference (AUPEC), Orlando, FL, USA, 27–30 September 2015; pp. 1–6. [Google Scholar]
- Dempster, A.P.; Laird, N.M.; Rubin, D.B. Maximum likelihood from incomplete data via the EM algorithm. J. R. Stat. Soc. Ser. B (Methodol.) 1977, 39, 1–22. [Google Scholar] [CrossRef]
- Kiran, P.M.; Rao, A.; Ratnamala, B. An Efficient Approach for Filling Incomplete Data. Int. J. Comput. Appl. 2012. [Google Scholar]
- Carpenter, J.R.; Bartlett, J.W.; Morris, T.P.; Wood, A.M.; Quartagno, M.; Kenward, M.G. Multiple Imputation and Its Application; John Wiley & Sons: Hoboken, NJ, USA, 2023. [Google Scholar]
- Breiman, L.J.M.L. Random Forests. Mach. Learn. 2001, 45, 5–32. [Google Scholar] [CrossRef]
- Tang, F.; Ishwaran, H. Random Forest Missing Data Algorithms. Stat. Anal. Data Min. ASA Data Sci. J. 2017, 10, 363–377. [Google Scholar] [CrossRef]
- Amritkar, R.E.; Kumar, P.P. Interpolation of missing data using nonlinear and chaotic system analysis. J. Geophys. Res. Atmos. 1995, 100, 3149–3154. [Google Scholar] [CrossRef]
- Hong, S.; Sun, Y.; Li, H.; Lynn, H.S. Influence of parallel computing strategies of iterative imputation of missing data: A case study on missForest. arXiv 2020, arXiv:2004.11195. [Google Scholar]
- Stekhoven, D.J.; Bühlmann, P.J.B. MissForest—Non-parametric missing value imputation for mixed-type data. Bioinformatics 2011, 28, 112–118. [Google Scholar] [CrossRef]
- Pan, R.; Yang, T.; Cao, J.; Lu, K.; Zhang, Z. Missing data imputation by K nearest neighbours based on grey relational structure and mutual information. Appl. Intell. 2015, 43, 614–632. [Google Scholar] [CrossRef]
- Zhang, C.; Kai, J.; Feng, H.; Yang, T. The Nearest Neighbor Algorithm of Filling Missing Data Based on Cluster Analysis. Appl. Mech. Mater. 2013, 347–350, 2324–2328. [Google Scholar] [CrossRef]
- Wang, Y.; Lu, J.; Zhao, K. A locally weighted KNN algorithm based on eigenvector of SVM. Int. J. Wirel. Mob. Comput. 2020, 19, 256–266. [Google Scholar] [CrossRef]
- Chen, Y.; Zhou, L.; Pei, S.; Yu, Z.; Chen, Y.; Liu, X.; Du, J.; Xiong, N. KNN-BLOCK DBSCAN: Fast Clustering for Large-Scale Data. IEEE Trans. Syst. Man Cybern. Syst. 2021, 51, 3939–3953. [Google Scholar] [CrossRef]
- Hammad Alharbi, H.; Kimura, M. Missing Data Imputation Using Data Generated By GAN. In Proceedings of the the 3rd International Conference on Computing and Big Data, Taichung, Taiwan, 5–7 August 2020. [Google Scholar]
- Mao, X.; Wong, R.K.; Chen, S. Matrix Completion under Low-Rank Missing Mechanism. Stat. Sin. 2018, 31, 2005–2030. [Google Scholar] [CrossRef]
- Jin, W. Research on User Electricity Behavior Analysis and Electricity Optimization Strategy Based on Electricity Big Data. Master’s Thesis, ZhengJiang University, Zhejiang University Library, Hangzhou, China, 2021. [Google Scholar]
- Bryt, O.; Elad, M. Compression of facial images using the K-SVD algorithm. J. Vis. Commun. Image Represent. 2008, 19, 270–282. [Google Scholar] [CrossRef]
- Zhang, Q.; Li, B. Discriminative K-SVD for dictionary learning in face recognition. In Proceedings of the 2010 IEEE Computer Society Conference on Computer Vision and Pattern Recognition, San Francisco, CA, USA, 13–18 June 2010; pp. 2691–2698. [Google Scholar]
- He, H.; Li, H.; Huang, Y.; Huang, J.; Li, P. A novel efficient camera calibration approach based on K-SVD sparse dictionary learning. Measurement 2020, 159, 107798. [Google Scholar] [CrossRef]
- Aharon, M.; Elad, M.; Bruckstein, A. K-SVD: An algorithm for designing overcomplete dictionaries for sparse representation. IEEE Trans. Signal Process. 2006, 54, 4311–4322. [Google Scholar] [CrossRef]
- Rubinstein, R.; Zibulevsky, M.; Elad, M. Efficient Implementation of the K-SVD Algorithm using Batch Orthogonal Matching Pursuit. CS Technion 2008, 40. [Google Scholar]
- Mallat, S.G.; Zhifeng, Z. Matching pursuits with time-frequency dictionaries. IEEE Trans. Signal Process. 1993, 41, 3397–3415. [Google Scholar] [CrossRef]
- Pati, Y.C.; Rezaiifar, R.; Krishnaprasad, P.S. Orthogonal matching pursuit: Recursive function approximation with applications to wavelet decomposition. In Proceedings of the 27th Asilomar Conference on Signals, Systems Computers, Materials & Continua, Pacific Grove, CA, USA, 1–3 November 1993; Volume 41, pp. 40–44. [Google Scholar]
- Tropp, J.A.; Gilbert, A.C. Signal Recovery From Random Measurements Via Orthogonal Matching Pursuit. IEEE Trans. Inf. Theory 2007, 53, 4655–4666. [Google Scholar] [CrossRef]


Disclaimer/Publisher’s Note: The statements, opinions and data contained in all publications are solely those of the individual author(s) and contributor(s) and not of MDPI and/or the editor(s). MDPI and/or the editor(s) disclaim responsibility for any injury to people or property resulting from any ideas, methods, instructions or products referred to in the content. |
© 2024 by the authors. Licensee MDPI, Basel, Switzerland. This article is an open access article distributed under the terms and conditions of the Creative Commons Attribution (CC BY) license (https://creativecommons.org/licenses/by/4.0/).