Abstract
This research examined the modeling of productivity with thermal comfort using various models in a case study conducted in classrooms at a university in Southern Brazil. A total of thirteen models were selected after performing a literature review to identify the main models. Through the application of hierarchical clustering to separate the models into groups with similarities, the results identified four groupings: the first focused on temperature, the second associated age groups with Thermal Sensation Vote (TSV), the third compared different age groups, and the fourth highlighted “Model 11”, derived from structural equations in air-conditioned classrooms in China, revealing poor performance due to its incompatibility with temperature variations in productivity. Meanwhile, “Model 5”, developed using ordinary regression in air-conditioned offices in Japan, showed the lowest Root Mean Square Error (RMSE), emerging as the most accurate in predicting productivity associated with thermal comfort. The use of objective methods to assess productivity and the application of regression analysis in modeling, as identified in the literature review, is noteworthy. The evaluation of the models’ performance also explored the impact of the independent variables on their scope. Through cluster analysis, reasons behind discrepancies in model performance were identified, providing insights into best practices for representing the relationship between thermal comfort and productivity. These results offer valuable perspectives for developing more effective models in this field and reveal a wide methodological diversity in the approach to the subject.
1. Introduction
There has been a growing interest in human well-being within built spaces in recent years. This interest is driven by the increasing recognition of the financial benefits of improving Indoor Environmental Quality (IEQ). However, there is still a limited understanding of the interactions between the indoor environment and productivity [1]. Despite consistent studies highlighting the potential of IEQ to boost productivity and generate positive economic impacts, it is worrying to note that this relationship is often underestimated in traditional cost–benefit calculations related to building design and maintenance. One of the main obstacles to this underestimation is the lack of reliable connections between IEQ and productivity. Overcoming this gap requires additional research, in-depth analysis, and rigorous evaluations to establish consistent measurement and assessment methods [2].
IEQ is determined by the evaluation of four main building parameters that are commonly used: acoustic comfort, lighting quality, Indoor Air Quality (IAQ), and thermal comfort [3]; however, some other concepts and variables can be included, such as dust, water quality, humidity, and others. Specifically, thermal comfort is defined by the American Society of Heating, Refrigerating, and Air Conditioning Engineers (ASHRAE) as a state of mind that represents the level of satisfaction concerning the thermal environment. This conclusion is based on people’s subjective opinion [4].
Based on this, Fanger [5] developed a model capable of measuring the sensation of thermal comfort, called Predicted Mean Vote (PMV), which incorporates empirical data and equations related to skin temperature, body energy balance, and evaporation of sweat through the skin [6]. Another approach to analysis is adaptive comfort models, which were developed to mitigate the discrepancies observed in the Fanger model. This model sometimes tends to underestimate or overestimate thermal conditions, reflecting a complex issue influenced by factors other than the physiological aspects considered in the PMV, which assesses the heat balance between the body and the environment. These other factors include psychological, demographic, and anthropometric aspects. Tarantini, Pernigoto, and Gasparella [7] state that assessing thermal comfort in environments can reduce health-related costs and sick leave, increase employee operating rates, and lower production losses. However, this is only the first step and does not guarantee improvements.
Therefore, several authors have adopted statistical methods in their recent research as a complement to investigating thermal comfort. For example, time series analysis was employed to analyze Indoor Air Quality (IAQ) conditions and thermal comfort in real-time in a daycare center in Korea [8]. In addition, Principal Component Analysis (PCA) was used to propose a new control structure in multizone buildings in the United States [9]. Factor analysis was also used to evaluate Personalized Kitchen Air Supply (PKAS) to reduce exposure to cooking pollution and thermal discomfort in residential kitchens in China [10]. In addition to these approaches, survival analysis was applied to study participants’ reactions to dynamic thermal stimuli in offices in Norway [11], among other techniques.
In line with this theme, another statistical technique is hierarchical cluster analysis, which groups data into a hierarchical structure similar to a tree, known as a dendrogram. This approach naturally organizes clusters through branching, combining similar data sets [12]. A hierarchical cluster analysis was carried out based on data from the study by Bueno et al. [13] in classrooms with natural ventilation at a Brazilian university that was previously investigated. This study combines hierarchical cluster analysis and the k-means algorithm’s application but aims to examine the relationship between thermal dissatisfaction and student productivity. The approach proposed in this paper differs from the one suggested in [13] since the previous study did not use specific productivity models to categorize them based on their similarities and differences to help fill this knowledge gap previously identified by Appel-Meulenbroek, Clippard, and Pfnür [14].
This research addresses a significant lack in the field, highlighting the scarcity of studies investigating the links and experiments between productivity and the indoor environment, thus offering a more comprehensive perspective on this relationship and bringing to light a deeper understanding of the mutual influences between thermal comfort and productivity. Thus, the current work fills a gap in the existing literature and proposes a more holistic approach to analyzing the complex interaction between environmental factors and human performance. This contribution is valuable for advancing the state of the art in understanding the relationship between the indoor environment and productivity, providing insights that can guide future research and practice in designing spaces to optimize human performance.
2. Materials and Methods
2.1. PRISMA, Search Strategy and StArt
To explore the mathematical models and modeling techniques that represent the relationship between thermal comfort and productivity, the Preferred Reporting Items for Systematic Reviews and Meta-Analyses (PRISMA) were used [15]. This approach involves formulating combinations of keywords and Boolean operators for searching scientific academic databases. The PRISMA methodology has been widely used in this context, being applied in the classification of local climate zones [16], in the identification of the main areas of medical science that have used the Universal Thermal Climate Index (UTCI) [17], as well as research into alternative models for predicting thermal comfort [18].
The search strategy involves coding keywords and Boolean operators in the Scopus and Web of Science databases: (“productivity” OR “intellectual performance” OR “academic performance” OR “learning performance” OR “student performance” OR “cognitive performance”) AND ((“thermal comfort” OR “adaptive comfort” OR “thermal sensation” OR “thermal satisfaction”) AND (“high school” OR “university” OR “classroom” OR “office” OR “educational buildings” OR “educational environments” OR “chamber”)). Scopus and Web of Science databases were chosen because of their breadth of literature coverage, allowing the identification of relevant studies for this review and applying inclusion and exclusion criteria as specified in Table 1. These criteria guided the selection of articles by considering keywords, abstracts, and titles of publications over the years.

Table 1.
Inclusion and exclusion criteria.
Inclusion criteria were defined to ensure that the articles considered in the review were only available in English and were not restricted by specific periods, if they dealt with models relating to thermal comfort and productivity and were compatible with the environmental and personal parameters collected previously, such as air temperature, mean radiant temperature, relative humidity, clothing insulation, and air velocity. In addition, exclusion criteria were established to maintain the consistency and reliability of the results obtained. The State of the Art through Systematic Reviews (StArt) tool, version 2.3.4.2, was adopted to speed up the review process and complement the use of PRISMA. This tool not only facilitated the selection of the most pertinent articles but also provided a comprehensive visualization in its interface, displaying information such as abstracts, authors, titles, years, and places of publication. This feature significantly streamlined the review process, allowing inclusion and exclusion criteria to be applied directly in the program. This helped to improve the organization and structuring of the stages, resulting in the overall procedure optimization, as highlighted by Zamboni et al. [19]. After thoroughly analyzing the remaining studies, models that used parameters in line with the data applied in this study were chosen, specifically those collected during a recent IEQ Lab study developed by Bueno et al. [13].
2.2. Model Performance Comparison
As mentioned above, the selected models were applied to the data from Bueno et al. [13], which were collected between 23 March and 14 June 2022 during the fall in classrooms with natural ventilation, which held 42 students in 65 m2. A total of 519 valid responses were obtained through questionnaires and measurements taken in the morning, afternoon, and evening with a device similar to the BABUC-A microclimate station manufactured by Brüel and Kjaer, which monitored dry and wet bulb temperature, relative humidity, and globe temperature in real-time. At the same time, the questionnaire was aimed at collecting personal variables such as gender, age, clothing, height, and weight. The independent variables were then replaced by the values to calculate productivity in each model. The resulting values were then compared using the RMSE to assess the discrepancies between the model’s estimates and the observed values.
Regarding the performance of the models, some adaptations and considerations were necessary. The productivity value equivalent to 100%, calculated by the models, results in 100 or 1, depending on the model used. To carry out the comparison, the original equations, which calculated productivity on a scale from 0 to approximately 100, were adjusted to vary from 0 to about 1, facilitating the comparison. In addition, specific adaptations were made to the equations of the models developed by Kawakubo, Sugiuchi, and Arata [20], which were subsequently renamed models 5 and 6, as shown in Table 2.
Table 2.
Adaptation of models.
The models were adjusted to provide a score on a scale ranging from 1 to 13, reflecting changes in productivity ranging from a reduction of 60% about the standard (score 1) to an increase of 60% about the standard (score 13) at 10% intervals. Score 7 indicates no change, representing expected productivity. To calculate the variation value this scale represents directly, the equation was adapted as described in Table 2, adding 100% to the result. For example, for score 7 (no change), the productivity value is 100%, while for score 13, it is 160%. In this way, this scale is similar to the scales used in studies by Liu et al. [1], Kawakubo, Sugiuchi, and Arata [20], Geng et al. [21], Jiang et al. [22] and Wang et al. [23], which also take each individual’s average productivity value as a reference.
2.3. Hierarchical Cluster Analysis: Categorization of Models
The models were categorized based on similarities and differences using hierarchical cluster analysis of variables in IBM SPSS Statistics version 20. To do this, the method uses the productivity values generated by the different models to determine the formation of the groupings. The choice to use hierarchical variable clustering stands out compared to other techniques, such as k-means, in which the number of clusters is previously defined by the ana-list, resulting in a fixed number of clusters [24]. This prevents visualization of the clustering stages. However, hierarchical clustering offers the ability to visualize several solutions (clusters) on a single graph, allowing the grouping stages to be assessed. In this way, it is possible to observe the different levels of similarity between variables, following the formation of clusters, from the most specific to the most comprehensive. The process that characterizes hierarchical cluster analysis is explained by Bridges [25] as follows:
- The first step is to create a proximity matrix between the variables. This matrix captures the measure of similarity between all possible combinations of variables using the squared Euclidean distance. Smaller values indicate more excellent proximity between the variables and vice versa.
- Subsequently, clusters are formed by evaluating the similarity measures between groups or individual variables. At each stage, it is checked whether the two groups have the highest level of similarity; if so, these groups are combined.
- In the next stage, the process continues by checking whether any groups can be included in the previous combination due to their high level of similarity.
- The stages continue until all the variables have been grouped into a single set.
The graphical representation of the clustering process is known as a dendrogram, which displays a hierarchy of categories showing how the different elements are grouped into larger, more comprehensive categories. The models were grouped through cluster analysis based on their similarities in terms of productivity estimates. These groupings are then examined to identify patterns and determine whether they can be attributed to specific factors influencing the productivity calculation.
3. Results
3.1. Initial Results from Academic Databases
The results of the search for scientific journal articles, using the specific combination of keywords as defined and the PRISMA method, are shown in Figure 1, revealing the identification of 1422 relevant articles. The StArt software was then used in the selection and eligibility phase to solidify the studies, thus improving the literature review.
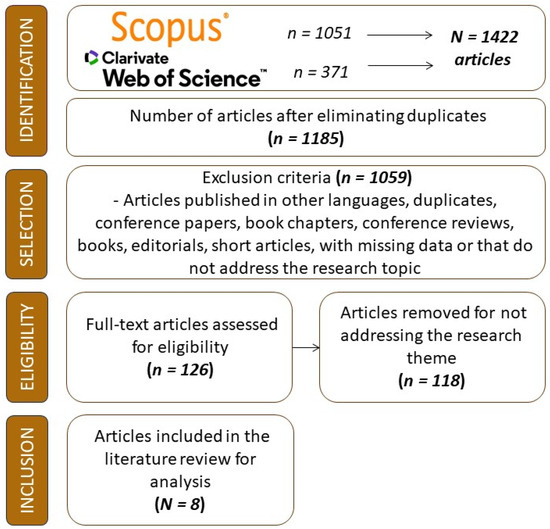
Figure 1.
PRISMA.
Initially, 1051 articles were identified in the Scopus database and 371 in the Web of Science. However, after applying the exclusion criteria, 126 articles remained for further evaluation. At this stage, each article underwent an analysis of the title, abstract, and keywords to determine its relevance to the research topic. After this evaluation, 118 articles were discarded because they did not fit the criteria of evaluating thermal comfort about productivity using models.
Considering that the case study adopted a percentage scale, studies that used absolute score scales in cognitive tests or other scales that would make comparison difficult were excluded. In addition, studies that investigated the effects of extreme conditions on mental activities were eliminated as they were not in line with the scope of the case study. As a result, eight articles that met the relevance criteria were selected and incorporated into the literature review on the subject in question, which contained 13 thermal comfort and productivity models.
3.2. Selected Models
The models derived from the relevant information in the studies are compiled in Table 3, showing their corresponding equations, evaluation method, location, country, and the sequence in which they were entered into SPSS.
Table 3.
Models selected from the literature review.
The Thermal Sensation Vote (TSV) in the models is the users’ subjective perception of thermal comfort indoors [28]. This system uses a 7-point scale as defined by ISO 7730 [29], ranging from −3 (Cold) to +3 (Hot), including intermediate degrees such as −2 (Cool), −1 (Slightly Cool), 0 (Neutral), +1 (Slightly Warm), and +2 (Warm). These perceptions were collected through direct interviews or questionnaires to characterize individuals’ thermal sensations [30].
These studies investigated the influence of different temperature conditions (10 °C to 32 °C) on human cognitive performance. The cognitive tests encompassed a variety of abilities, such as attention, memory, perception, and thinking, evaluating response time, accuracy in specific tasks, and neurobehavioral tests. The Relative Performance (RP) metric has been used to compare individual performance in a typical thermal condition against the average performance in all conditions evaluated in different studies [1,2,20,21,22,23,26,27].
3.3. Comparison of Model Performance
Considering the different methodologies used in each study and the specificity of the model equations, some of these models cannot be fully utilized with the data present in this case study. Specifically, models 12 and 4, which have 3rd-degree equations, were developed for specific temperature ranges. Model 12 was designed to represent data obtained from experiments in the 22 to 30 °C range, while Model 4 was created to represent data in the 10 to 20 °C range. As such, the curve projected by the models within these ranges resembles the typical curve expected for this type of study, resembling the parabola of a quadratic function.
However, it is essential to note that outside of these specific ranges, the behavior of the functions deviates, making the results invalid. This discrepancy cannot be considered a fault of the model itself, as it is inherent in its construction, and the resulting errors would be a consequence of its inappropriate application. Consequently, the decision was to use these models only within the temperature ranges for which they were initially developed. Models 5 and 6, designed for each gender, were applied to the data corresponding to each group. The metric used to assess performance was the RMSE, calculated for each model to the original data.
Despite the adaptations made to adjust the scales and make the data more comparable, it was decided to carry out the performance analysis comparing both the raw percentage data and the standardized data. Standardizing the data to z-score eliminates the original units, replacing them with a universal standard deviation [31]. This neutralizes differences between scales based on maximum or average productivity values, ensuring that all data shares the same average.
This approach makes it possible to analyze performance through the RMSE of standardized data as if the models were operating on the same scale based on average productivity. Comparing these standardized values can reveal differences in data distribution. When using raw data, the relationships analyzed in this study (between what is observed and predicted by the models) can be confused by the different scale references; standardization clarifies these relationships. After applying the models, the z-score was calculated for the original data series of the cases selected for each model and the series resulting from using these models.
3.4. Model Performance and Root Mean Square Error
Table 4 shows the results obtained when applying the models to the original data, including the average and standard deviation of the observed and calculated yields and the RSME value for raw and standardized data. The observed productivity refers to the initial data collected from the entire group, and its averages and standard deviations may vary depending on the model’s application to specific data cases. This means that when using the model in particular situations, statistical measures such as averages and standard deviations of the results may vary from the initial data, reflecting the influence of the specific application conditions.
Table 4.
Model performance.
The model performance evaluation based on the independent variable is depicted in Figure 2, where the models are arranged according to the increase in RMSE. When predicting productivity based on temperature, controlling the variables that affect the relationship between the factors is crucial.
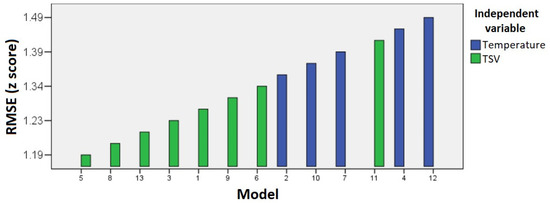
Figure 2.
Root Mean Squared Error (RMSE) for each model.
Each bar represents a model number from 1 to 13, with the vertical (y) axis indicating the RMSE. For instance, Model 5 has the lowest registered RMSE, indicating a lower root mean squared error of 1.19, suggesting higher precision in predicting productivity concerning thermal comfort for this specific model. On the other hand, Model 12 exhibits the highest RMSE, reaching 1.49, signifying a higher mean squared error in its predictions. Therefore, it is visually apparent to observe the variation in accuracy among the different models, identifying those with better predictive performance (shorter bars) and those with poorer performance (taller bars).
This graphical representation is crucial for evaluating and comparing the models’ accuracy, serving as a valuable tool in selecting the most suitable model for more precise predictions in productivity associated with thermal comfort contexts. In the referenced case study used for comparison, there was no intervention in the clothing worn by the participants, explaining the inferior performance (higher RMSE) of the temperature-based models.
One potential strategy to reduce error in this type of modeling is to incorporate the clothing insulation variable into a nonlinear multiple regression analysis. By doing so, it would be possible to consider the relationship between temperature and clothing insulation, which significantly influences the resulting thermal sensation within the model. This approach would allow a more comprehensive and accurate consideration of factors affecting productivity, potentially resulting in more precise predictions.
3.5. Hierarchical Cluster Analysis: Categorization of Models
In the clustering analysis of variables, models that do not apply to all data sets were excluded. For this analysis, all variables must have corresponding data for each case. Therefore, it is not feasible to include models that fit into different temperature ranges or apply to different genders in the same analysis. As a result, models 4, 5, 6, and 12 were removed from the study.
Table 5 displays the proximity matrix of the models analyzed in this study. More similar models are highlighted in green, indicating a smaller distance, while more different models are highlighted in red, representing a more considerable distance.
Table 5.
Proximity matrix.
Models 7 and 10 are the most similar (000.79), followed by 1 and 3 (010.63) and 2 and 10 (025.54). In contrast, models 11 and 13 (1363.08), 7 and 11 (1180.09), and 10 and 11 (1172.37) show the most significant differences between them. These numbers reflect the proximity or distance between the models based on the analyzed characteristics, which is essential for identifying patterns or groups in the data. Table 6 displays the clustering process, recording the order in which the models were progressively aggregated into clusters, using nine steps for cluster formation.
Table 6.
Stage of clustering.
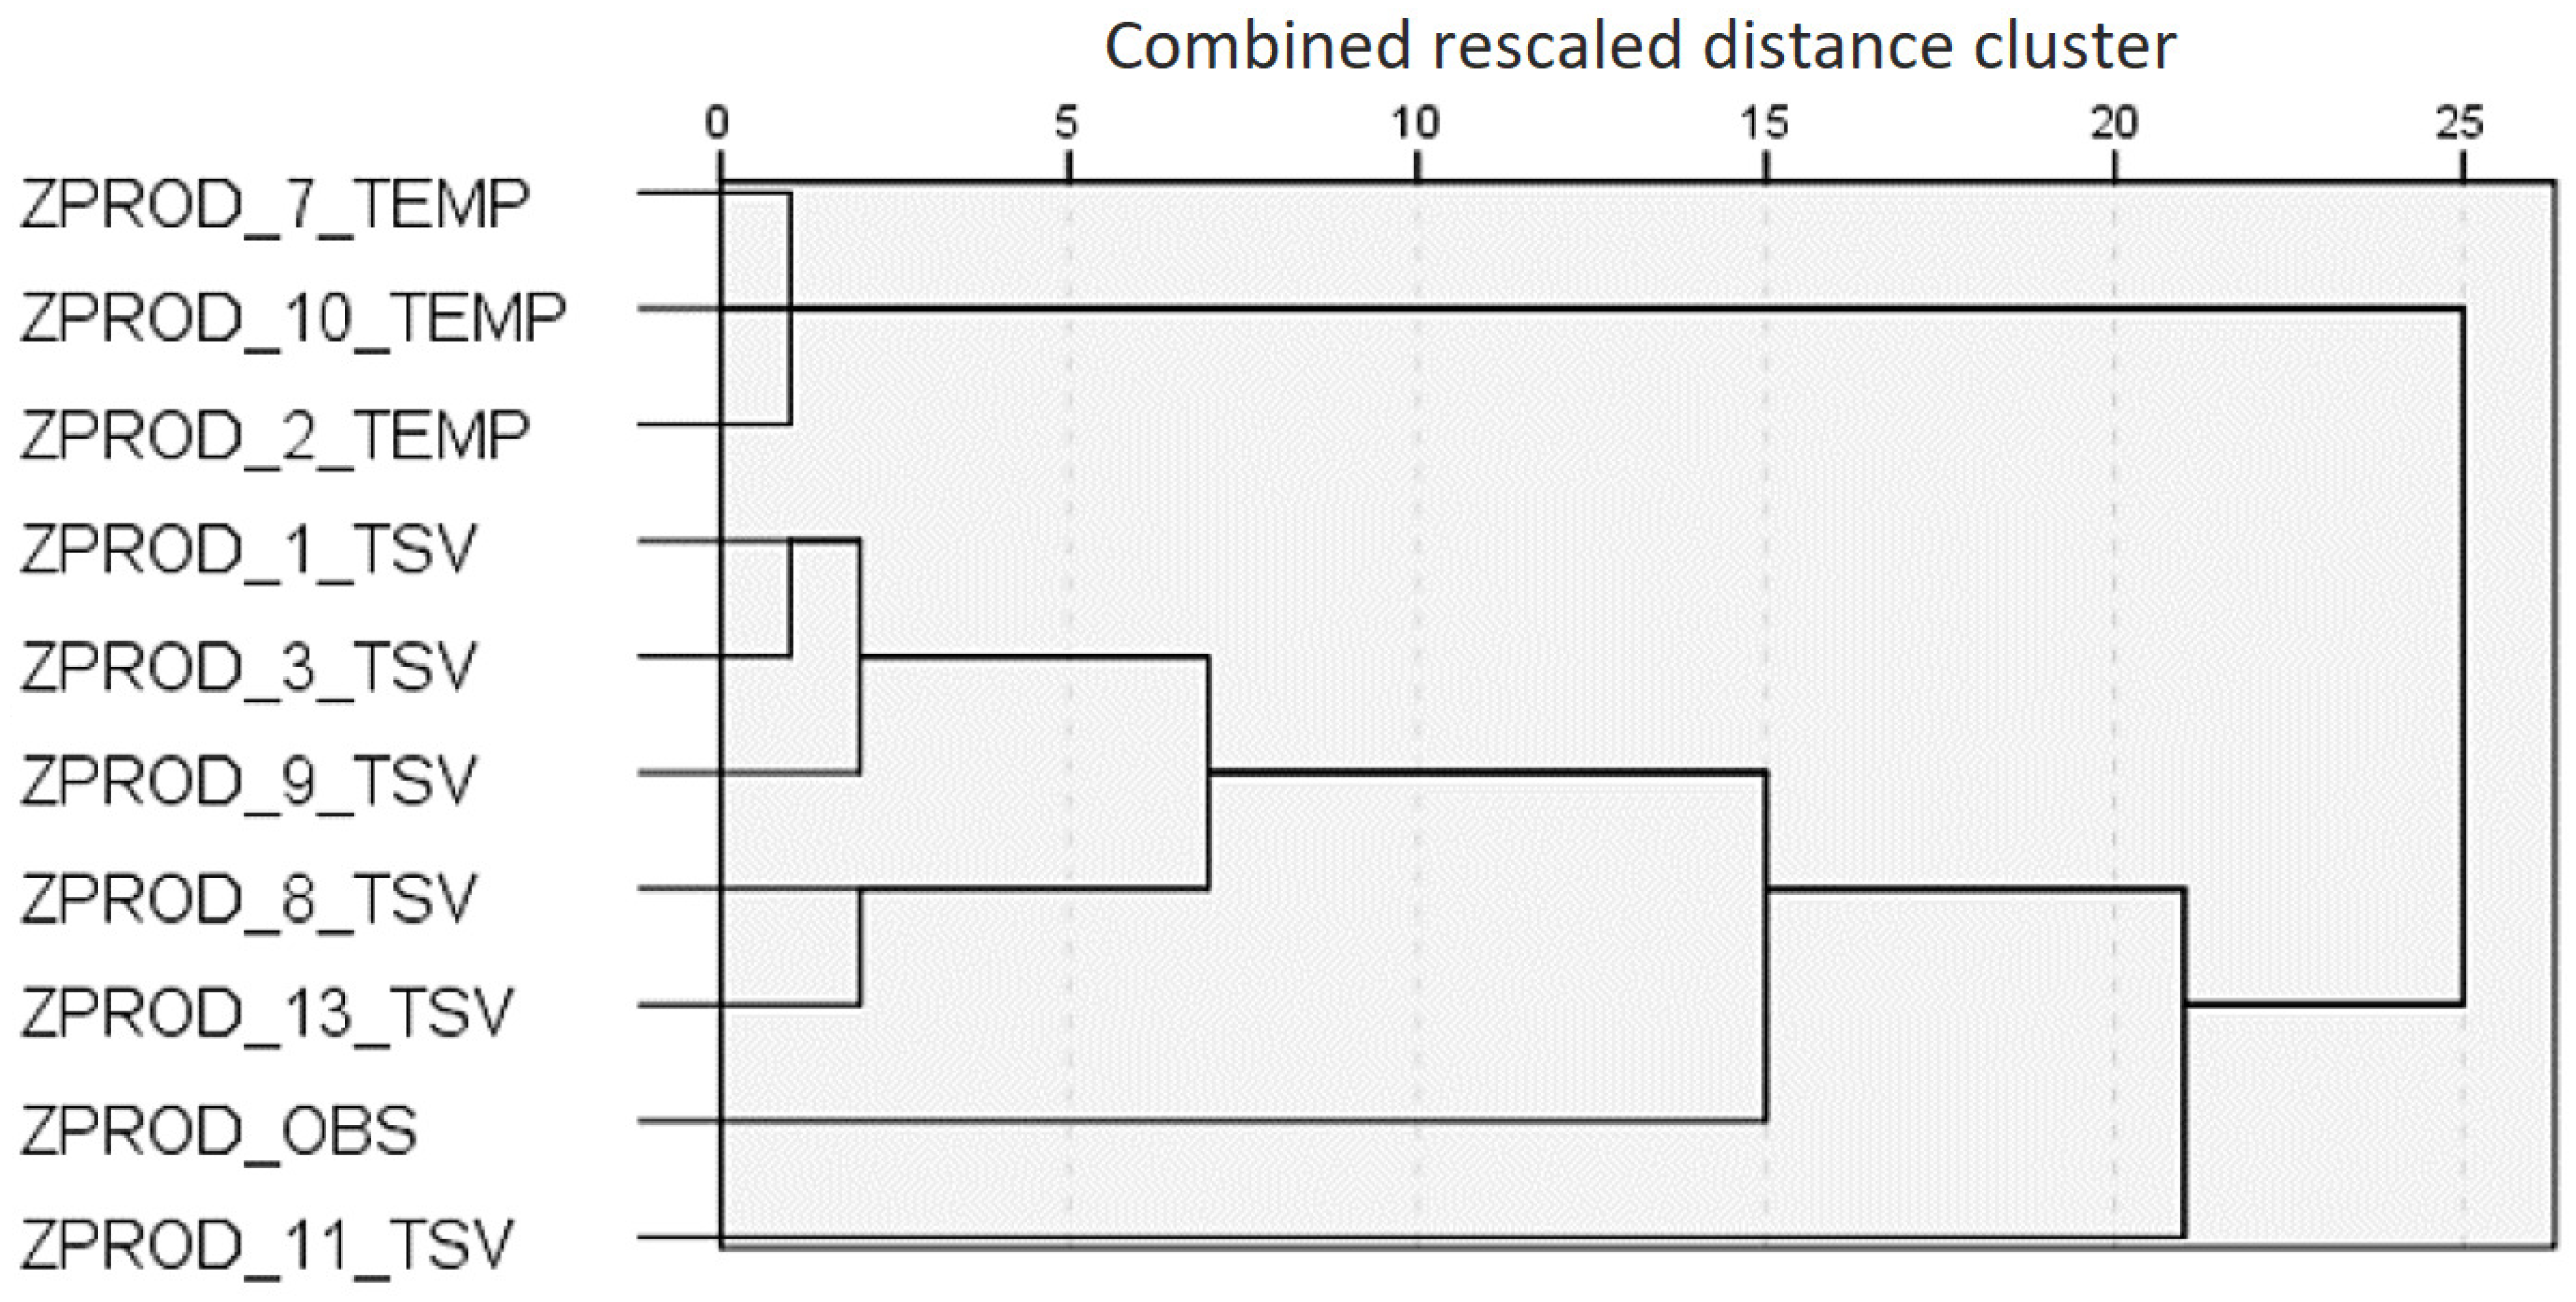
The clustering evolution is visualized through the dendrogram in Figure 3. To facilitate understanding of the patterns during the analyses, the independent variable employed by the model was incorporated into the series name following this standardization as follows: ZPROD [model number_independent variable]. In the case of the original data related to observed productivity, the nomenclature ZPROD_OBS was used.
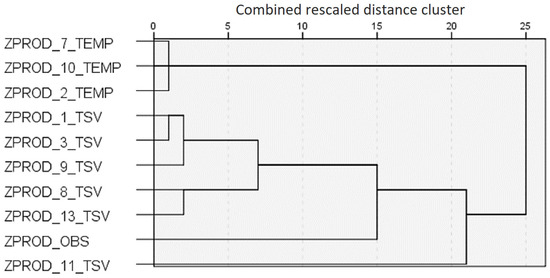
Figure 3.
Dendrogram.
The dendrogram resulting from the cluster analysis of the models reveals a remarkable coherence in the groupings, aligning with the performance similarities of each model within the context of the case study. Initially, the groupings merge models in an ascending performance sequence as follows: models 8, 13, 3, 1, 9, 2, 10, 7, and 11.
It is evident that as clusters are formed, models sharing similar variables are grouped. For example, models 2, 10, and 7 exhibit higher similarity and are grouped early (stages 1 and 3), while models 3, 1, and 9 form another cluster (stages 2 and 4), and models 8 and 13 are subsequently grouped (stage 5).
This evolution can be interpreted as follows:
- Clustering by the use of the temperature variable (cluster 1): Models 2, 10, and 7 share the use of this variable.
- Clustering by using TSV in studies with similar age groups (cluster 2): Models 3, 1, and 9 come from studies with participants in similar age ranges.
- Clustering by using TSV in studies with different age groups from the previous Cluster (cluster 3): Models 8 and 13 originate from studies with participants of different ages.
In a later stage (stage 8), Model 11 is the last to be aggregated into the models using TSV (cluster 4), aligning with its lower performance than other analyzed models. This fact might be associated with the study’s purpose of investigating the impact of changing environments with different temperatures on productivity. Another aspect revealed by the dendrogram is the inclusion of the original data variable (observed productivity) in the Cluster of models employing TSV before being grouped with the Cluster of models using temperature. This pattern aligns with the previous analysis, as the TSV models demonstrated better performance. In stage 9, the Cluster of models using temperature is finally grouped, highlighting the similarity between Model 2 and the original data variable. This is coherent as Model 2 stood out with better performance among the models using temperature.
The unity between the cluster analysis results and the models’ performance suggests the potential of the dendrogram as an exploratory tool for evaluating models found in the literature. It can serve as a guide to identify models that address similar aspects of a phenomenon. However, it is essential to consider that limitations in searching for models in the literature resulted in a reduced set, exploring only two variables. This analysis could be enhanced with a more extensive collection of models, encompassing different modeling methods and additional variables. Visualizing correlations between variables, reflecting similar performance for the studied case, could be an initial method for selecting models for more detailed investigations.
4. Discussion
4.1. Specific Aspects of Models and Their Contexts
Among the eight studies analyzed in the context of intellectual productivity, the majority, namely seven, employed objective approaches (methods such as cognitive tests and equivalents to assess participants’ performance). However, one study chose a subjective approach, using self-assessment to measure productivity.
Objective methods are grounded in evaluating actual performance through scores obtained in specific tests that analyze cognitive abilities. In contrast, subjective methods are related to individual perception of productivity, that is, how a person feels at a given moment. This type of personal assessment can occur directly by questioning the individual about their productivity on a percentage scale or by comparing current productivity with the usual average, as observed in the study by Kawakubo, Sugiuchi, and Arata [20], the only one that adopted a subjective method. Another personal approach includes using tools that consider not only self-perception of productivity but also other factors such as fatigue, mood state, physical symptoms, and satisfaction with performance, as seen in the case study conducted by Bueno et al. [13].
The studies present significant variations in their methodologies for calculating productivity. Among them, three studies use individual maximum productivity as a reference to calculate the percentage [2,26,27], while the other five studies employ everyone’s average productivity [1,20,21,22,23]. This discrepancy results in models with scales ranging from up to 100% to values that surpass this mark. However, all aim to minimize disparities among individuals. For instance, in the case study, the percentage is derived from the maximum productivity score that can be achieved.
Regarding thermal comfort, the studies used scales to directly evaluate comfort, such as the thermal satisfaction scale and the Thermal Sensation Vote (TSV). However, it is essential to note that the TSV does not directly reflect comfort, given that the same thermal sensation can be interpreted as comfortable by one individual and uncomfortable by another, as discussed in the relevant literature. This discrepancy is highlighted by the Predicted Percentage of Dissatisfied (PPD), which establishes that a minimum of 5% dissatisfaction is acceptable in a group exposed to the same thermal environment [32].
Another noteworthy point is the discrepancy in considering temperature: eight models use the TSV as an independent variable (models 1, 3, 5, 6, 8, 9, 11, and 13), while another five directly employ temperature (models 2, 4, 7, 10, and 12), resulting in even more pronounced divergences. Some studies consider factors like the thermal insulation of clothing, standardizing this variable to maintain constant conditions. However, this approach might not entirely capture the concept of adaptive comfort, which considers the measures individuals adopt to adjust to conditions, such as changing their clothing according to the situation.
Regarding study settings, two were conducted in climatic chambers (simulating classrooms), three in air-conditioned classrooms, two in air-conditioned offices, and one in a conventionally equipped office adapted for experiments. Only one study took place in a genuine environment with the usual users of that space [20], resembling this case study. Both employed online questionnaires with occupants to collect data in natural environments.
Most studies used regression analysis in the data analysis. Still, it is worth noting that the survey by Kawakubo, Sugiuchi, and Arata [20] opted for a more complex approach, the multilevel analysis. This method was chosen to account for the hierarchical structure of the data, acknowledging limitations found in traditional regression analyses and possibly enhancing model accuracy. In addition to multilevel analysis, other statistical techniques can be employed, such as structural equation modeling applied by Liu et al. [1]. This approach allows the examination of complex relationships between latent and observed variables, going beyond traditional linear analyses and offering a deeper understanding of interactions among study elements.
Some studies like those by Lan, Wargocki, and Lian [2], Geng et al. [21], Jiang et al. [22], and Cui et al. [26] provided financial compensation to participants, which might have influenced the results. In specific scenarios, it was observed that motivation might have a more significant impact on performance than temperature variation. This suggests that temperature fluctuations may have a less pronounced effect on performance under stable conditions.
In summary, evaluating these studies on productivity and thermal comfort revealed various methodological approaches and variables considered. These thorough analyses play a significant role in understanding the interaction between productivity and thermal comfort, providing valuable perspectives for future research and practical applications. This aligns with the purpose outlined by Nikolaou et al. [33] for conducting parametric studies of the most common characteristics present in the environment under investigation, highlighting the presence of indoor environment variability [34].
4.2. Root Mean Square Error (RMSE) and Hierarchical Clustering
For Zhang, Ortiz, and Bluyssen [35], generalizing problems related to Indoor Environmental Quality (IEQ) in classroom environments is challenging as they manifest differently among individuals. Likewise, searching for solutions becomes complex, making it impossible to study the relationship between solution and problem individually. In this context, the research highlights that grouping individuals emerges as the most effective solution, as explored in this study.
According to Feng et al. [36], using RMSE offers several advantages in evaluating model effectiveness. Specifically, this metric allows for the analysis of model performance and sensitivity, as demonstrated in this study, where Model 5 exhibited the lowest RMSE, proving to be the most accurate in predicting productivity concerning thermal comfort. These results are similar to those of Qi et al. [37], who investigated individuals using a methodology to assess factors influencing Thermal Sensation Vote (TSV). They proposed a model based on local body temperature, showing lower RMSE than other models.
Following the same line of research, Zhou et al. [38] developed the Predicted Mean Vote (PMVp), a thermal comfort model intended for low atmospheric pressure locations. They predicted people’s thermal sensation under four different conditions (0 km/26 °C, 3 km/26 °C, 4 km/26 °C, and 4 km/21 °C) and compared the results with Fanger’s original model [5]. The RMSE indicated that the new model was more accurate in terms of reality. To enhance these analyses, new technologies can be applied, as demonstrated by Ahmad et al. [39]. Using machine learning, they compared the ability to predict thermal comfort with and without spatial data. The RMSE revealed that including spatial parameters reduced the estimated error by approximately 11.8%, aligning with the results achieved in this study.
Karna and Gibert [40] emphasize the broad applicability of hierarchical cluster analysis methods in various contexts, aligning with the research theme on thermal comfort, productivity, and classrooms. Through this approach, it was possible to identify the formation of four distinct clusters as follows:
- Cluster 1 (Variable: Temperature):
- ○
- Models: 2, 10, and 7.
- ○
- Interpretation: These models share the use of the temperature variable in their methodologies or analyses. The clustering suggests that these models were developed to explore specific temperature-related effects. Therefore, they would have been development in order to investigate how temperature variation affects certain phenomena or results.
- Cluster 2 (TSV in similar age groups):
- ○
- Models: 3, 1, and 9.
- ○
- Interpretation: These models are grouped because they are derived from studies with participants in similar age groups. This suggests that TSV may significantly influence these specific age groups, and these models were developed to explore this relationship.
- Cluster 3 (TSV in different age groups from the previous Cluster):
- ○
- Models: 8 and 13.
- ○
- Interpretation: These models are grouped due to studies with participants of different ages compared to Cluster 2. This may indicate variations in the effects of TSV in other age groups. Analysis of these models may offer insights into how TSV influences different age groups.
- Cluster 4 (Model 11 as inferior performance):
- ○
- Model: 11
- ○
- Interpretation: Model 11 is placed in a later category, suggesting it performs less well than the other analyzed models. This may indicate that Model 11 may not fit as well as the others in terms of the use or influence of TSV. The mention of the impact of temperature variation on productivity also suggests that Model 11 may not be as effective in this specific study context.
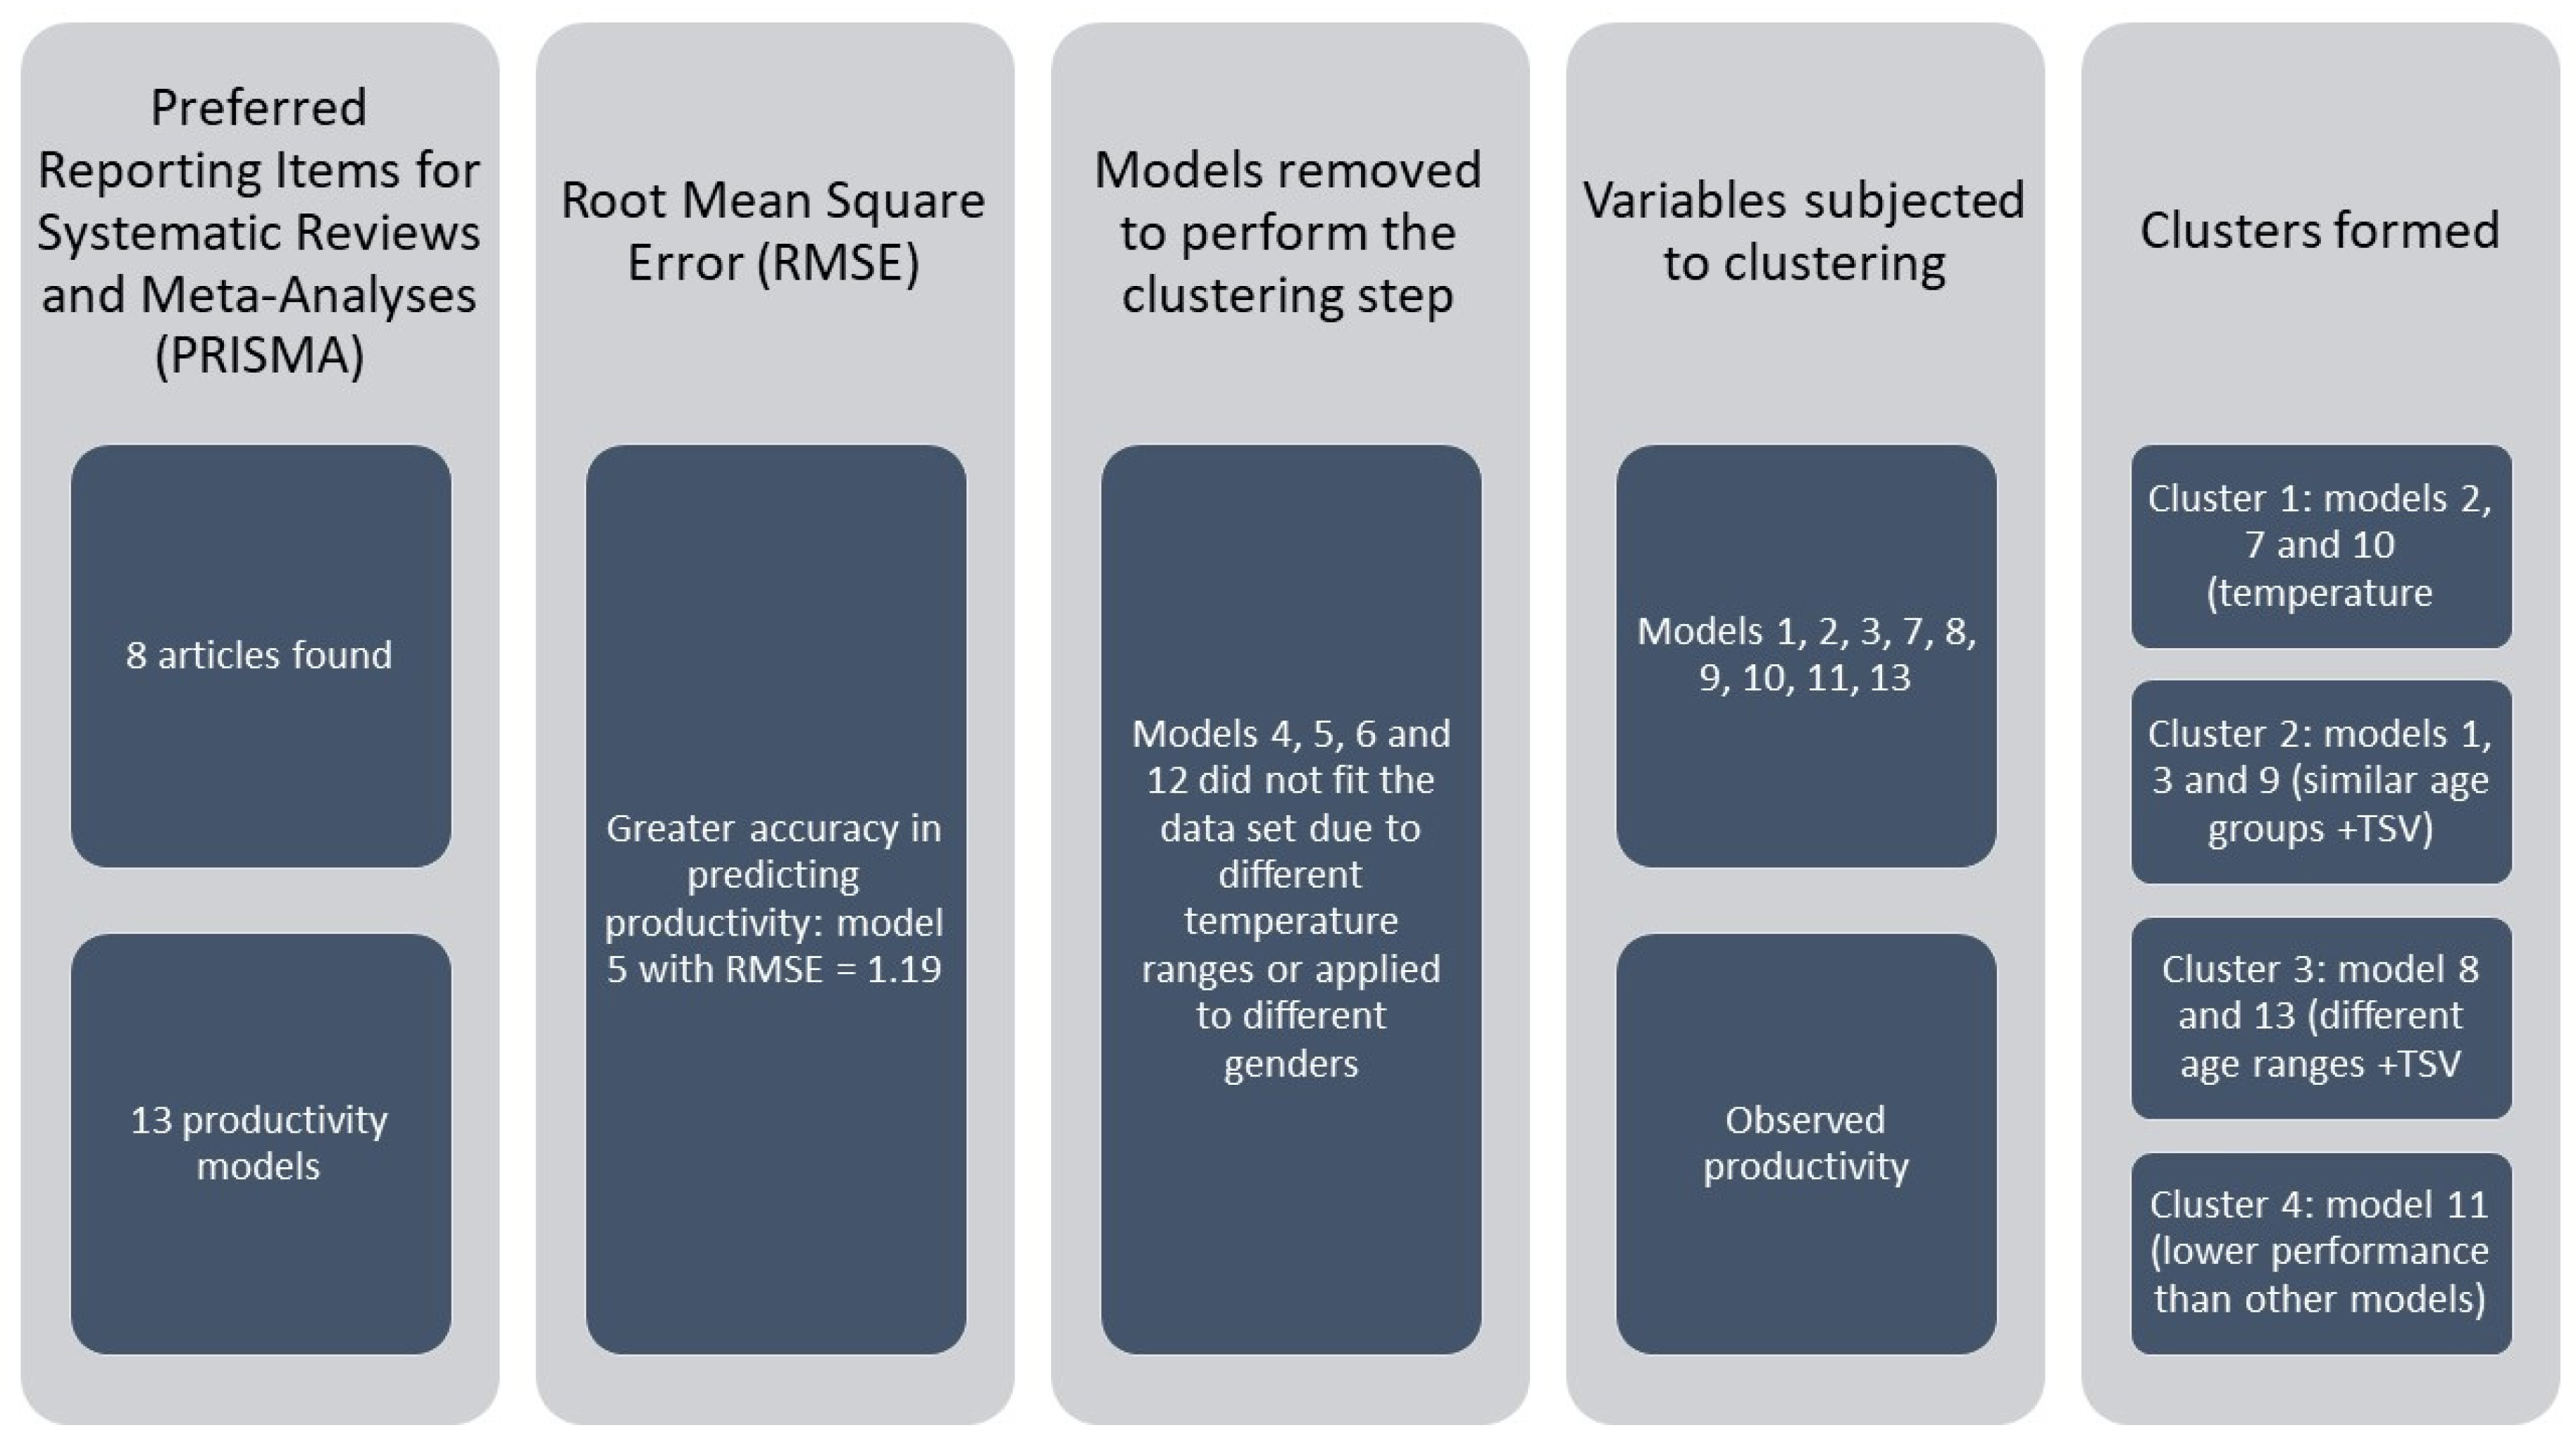
Interpreting these groupings explains how different variables, such as TSV and age groups, are explored in the studies or models. This helps to identify specific patterns and relationships, allowing for a more in-depth analysis of how these variables impact the results of the studies. This clustering approach makes organizing and interpreting a large amount of information more accessible, making it more straightforward to understand the relationships between different models or studies. In summary, Figure 4 shows all the results obtained during the research, covering aspects such as PRISMA and cluster analysis.
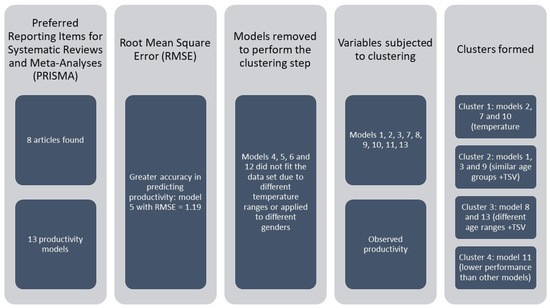
Figure 4.
Summary of results.
Additionally, the importance of age groups has been highlighted in previous research, such as that of Zheng et al. [41], which investigated the thermophysiological demands of older people in summer, identifying physiological stress points in different age groups. Similarly, Bennetts et al. [42] explored thermal comfort based on the aging of Australians, resulting in six clusters based on personal characteristics and knowledge, among other factors, enabling the formulation of new guidelines.
Based on investigations conducted by multiple researchers and referenced studies, there is a significant advancement in understanding thermal comfort and its relation to variables like temperature, Thermal Sensation Vote (TSV), and different age groups, particularly concerning their link with productivity. The use of RMSE in various analyses has been crucial in evaluating the accuracy and sensitivity of models, emerging as a valuable metric for measuring the performance of these studies.
The diverse range of approaches, from conceiving new models to implementing advanced technologies, illustrates the constant quest for more accurate and comprehensive methods for assessing thermal comfort. Moreover, segmentation into clusters provides a broad view of how these studies group based on specific variables, contributing significantly to understanding the different approaches researchers adopt.
Thus, consolidating these findings and future perspectives outlines a promising landscape for the ongoing advancement in the study and application of thermal comfort in various settings, emphasizing the importance of model accuracy and consideration of multidimensional factors in their assessment and practical application.
4.3. Limitations of the Study
The comparison of different models can be influenced by the characteristics of the sample and the peculiarities of a regression model. This may obstruct the effect of cluster formation. To illustrate, the scope of this study considered several elements as follows: the population included in the case study data, the environmental variables considered, the specific type of building where the data was collected, the selected comfort models, the scope of productivity analyzed, and the approach adopted to address the issue at hand. The data originated from a university in Southern Brazil, limiting the population sample to university students. This sample was carefully selected to represent that institution’s student population accurately. The collected environmental variables comprised air temperature, mean radiant temperature, and relative humidity in naturally ventilated environments.
The selection of models for comparative analysis was limited to those based on coinciding environmental and personal variables available in the data, thus enabling the application of this data to the models. These data included age, height, weight, collection date and time, gender, clothing insulation, thermal sensation, thermal preference, metabolic rate, estimated air velocity, and environmental variables mentioned. Additionally, models employing variables derived from available data, such as operational temperature calculated from air temperature and mean radiant temperature, were considered.
Another limitation worth considering is the origin of the models used in the study. None of these models were developed in Brazil or regions with similar climates. Notably, six of these models originated in China, while the others came from Japan and Korea. In addition, some of these models were designed for different contexts, such as offices and climate chambers. Despite the various activities in offices, it is essential to note that they share similarities with classroom activities, as both involve the same metabolic rate. Similarly, climate chamber models simulate conditions that occur in classrooms.
The scope of the analyzed productivity specifically focused on the intellectual domain. The models considered were developed for educational or office environments using data on cognitive activities such as learning, memory, and concentration. The strategy was to start from existing models to address the need to expand knowledge about the relationship between intellectual productivity and thermal comfort. Comparative and clustering analyses were conducted using established models to identify patterns in the data and knowledge gaps within the studied context.
The crucial issue of transferring and applying the models to the sample under analysis highlights the need for a deeper and more thorough investigation, considering the complexities presented, such as the different temperature ranges and the methodological and conceptual diversity mentioned above. The variability of these factors can significantly impact the generalizability and validity of the results. Ensuring the effective transfer of transnational and cross-sectional models is a considerable challenge and may constitute a distinct field of study. Exploring this aspect requires a critical analysis of the nuances associated with the origin of the models and a comprehensive assessment of the specific application conditions. Furthermore, the request to share thoughts and suggestions for future research reveals the importance of developing guidelines or recommendations for developers of future forecasting models. These guidelines could address specific issues related to the adaptability of models to different contexts, taking into account geographical, climatic, and methodological variations. Thus, by addressing model transfer in detail, researchers can contribute significantly to reducing the problem of model comparability, providing valuable insights for improving the effectiveness and applicability of these tools in various scenarios.
4.4. Gaps in Research and Future Trends
According to Li et al. [43], revitalizing built environments goes beyond mere concern for sustainability, potentially representing a powerful agent of transformation for health and productive efficiency. In this sense, several research trends are emerging to integrate thermal comfort to enhance people’s productivity.
Among these trends, adopting the Methodology for Computerized Textual Data Analysis stands out, which, through Natural Language, can assess productivity in the workplace. This methodology becomes an ally in quantifying productivity, enabling more effective management and precise evaluation strategies [44]. Moreover, it is crucial to investigate other elements that influence productivity, such as gender disparities and their relationship with thermal satisfaction, as well as the ideal temperature to maximize performance [20].
Another relevant strategy is implementing passive cooling interventions, which help understand how thermal comfort perception is linked to heat exposure and its impact on productivity. Considering current climate changes, this aspect gains even more importance and increasingly demands energy for cooling workspaces [45]. On the other hand, in colder contexts, introducing multi-temperature heating systems is essential to promote well-being, health, and productive efficiency [46].
Simultaneously with these interventions and systems, Xie et al. [47] propose using Personal Environmental Control (PEC) to enable occupants to regulate the environment according to their preferences. However, it is vital to investigate the freedom associated with this control, especially concerning energy efficiency, productivity, and thermal comfort. Complementarily, Siriwardhana and Moehler [48] suggest incorporating the perspectives of individuals involved in the built environment into studies to obtain more precise information about their experiences and understand the effects and impacts of these environments on individuals.
In addition, cluster analysis provided insights into the reasons behind discrepancies in model performance and demonstrated the need to consider interactions between independent variables for a complete understanding. This contributes to optimizing existing models and guides the development of new, more effective thermal comfort and productivity approaches. The steps taken to make the models comparable and the difficulties faced during this study highlight the importance of meticulousness in research. These lessons strengthen the validity of the results and provide a solid basis for future studies, promoting significant advances in understanding and optimizing the relationship between thermal comfort and productivity.
5. Conclusions
The complex understanding of the relationship between thermal comfort and productivity has been a persistent challenge for researchers, so this research set out to perform a comparative assessment of the existing models in the literature that estimate productivity based on thermal comfort. To this end, a hierarchical cluster analysis was carried out to identify gaps and patterns in the modeling.
The models identified in the literature review were predominantly based on regression analyses, often using second- and third-degree equations with a single dependent variable. Although including more variables can complicate modeling using nonlinear regression, this consideration can enrich the breadth and accuracy of the models. In particular, this approach can be advantageous when using objective measurements, such as temperature, to the detriment of individual and subjective responses, such as TSV. In addition, including the variable of thermal insulation of the clothing seeks to guarantee the applicability of the models in different environmental conditions, where the clothing can be standardized.
Productivity assessment revealed a predominance of objective methods compared to case studies based on subjective evaluations and natural environments. This discrepancy created limitations, which were especially apparent when trying to include models based on personal assessment in the cluster analyses so that it would be possible to identify patterns associated with their modeling, which were mainly influenced by the prevalence of studies conducted in controlled environments.
It is proposed as a perspective for future research to conduct cluster analyses with models based on subjective assessments from different studies. This analytical approach identified possible reasons behind disparities in model performances, offering new perspectives to enhance policies and practices in representing the relationship between thermal comfort and intellectual productivity. The potential of cluster analysis to deepen the understanding of the challenges in modeling this phenomenon is highlighted, as demonstrated in this study.
In summary, the comparative analysis of productivity models based on thermal comfort provided a comprehensive view of the complexities underlying this relationship. The low methodological and conceptual diversity in the approach to the subject, highlighted throughout this study, points to significant challenges in comparing and analyzing existing studies. However, to amplify the practical applicability of these findings, it is crucial to emphasize the importance of the results in the context of workplace design and the formulation of policies related to thermal comfort. Furthermore, when considering future research, a more specific exploration of enriching variables in the modeling is suggested, as well as a deeper analysis of the study’s limitations, including possible biases in model selection. A more explicit connection with practical applications, ethical and social considerations, and a conclusive summary of the main findings will provide a more robust and targeted conclusion, contributing to significant advances in understanding the relationship between thermal comfort and intellectual productivity.
Author Contributions
Conceptualization, I.M.d.L., I.L.N. and E.E.B.; methodology, I.M.d.L., I.L.N. and E.E.B.; software, I.M.d.L.; validation, E.E.B.; formal analysis, E.E.B.; investigation, I.M.d.L., I.L.N. and E.E.B.; resources, I.L.N.; data curation, I.M.d.L. and I.L.N.; writing—original draft preparation, I.M.d.L.; writing—review and editing, I.M.d.L., I.L.N. and E.E.B.; visualization, I.M.d.L., I.L.N. and E.E.B.; supervision, E.E.B.; project administration, E.E.B.; funding acquisition, I.L.N. All authors have read and agreed to the published version of the manuscript.
Funding
This research was funded by the “Coordenação de Aperfeiçoamento de Pessoal de Nível Superior” (CAPES)—financing code 001 and “The National Council for Scientific and Technological Development” (CNPq).
Data Availability Statement
The raw data supporting the conclusions of this article will be made available by the authors on request.
Conflicts of Interest
The authors declare no conflicts of interest.
Abbreviations
| ASHRAE | American Society of Heating, Refrigerating, and Air Conditioning Engineers |
| BLR | Binary Linear Regression |
| HLM | Hierarchical Linear Model |
| IAQ | Indoor Air Quality |
| IE | Indoor Environmental Quality |
| OR | Ordinary Regression |
| PCA | Principal Component Analysis |
| PEC | Personal Environmental Control |
| PH | Variation in productivity for men |
| PKAS | Personalized Kitchen Air Supply |
| PM | Variation in productivity for women |
| PMV | Predicted Mean Vote |
| PPD | Predicted Percentage of Dissatisfied |
| PR | Polynomial Regression |
| PRISMA | Preferred Reporting Items for Systematic Reviews and Meta-Analyses |
| RMSE | Root Mean Square Error |
| RP | Relative performance |
| RVA | Regression and Variance Analysis |
| SEM | Structural Equation Modeling |
| StArt | State of the Art through Systematic Reviews |
| T | Temperature |
| TSV | Thermal Sensation Vote |
| UTCI | Universal Thermal Climate Index |
References
- Liu, F.; Chang-Richards, A.; Wang, K.I.-K.; Dirks, K.N. Effects of Indoor Environment Factors on Productivity of University Workplaces: A Structural Equation Model. Build. Environ. 2023, 233, 110098. [Google Scholar] [CrossRef]
- Lan, L.; Wargocki, P.; Lian, Z. Quantitative Measurement of Productivity Loss Due to Thermal Discomfort. Energy Build. 2011, 43, 1057–1062. [Google Scholar] [CrossRef]
- Parkinson, T.; Parkinson, A.; de Dear, R. Continuous IEQ Monitoring System: Performance Specifications and Thermal Comfort Classification. Build. Environ. 2019, 149, 241–252. [Google Scholar] [CrossRef]
- ASHRAE Standard 55-2020; Thermal Environmental Conditions for Human Occupancy. American Society of Heating, Refrigerating, and Air Conditioning Engineer ASHRAE: Atlanta, GA, USA, 2021.
- Fanger, O.P. Thermal Comfort: Analysis and Applications in Environmental Engineering; McGraw-Hill: New York, NY, USA, 1970. [Google Scholar]
- Henriques, I.B.; Mady, C.E.K.; Oliveira Junior, S. Assessment of Thermal Comfort Conditions during Physical Exercise by Means of Exergy Analysis. Energy 2017, 128, 609–617. [Google Scholar] [CrossRef]
- Tarantini, M.; Pernigotto, G.; Gasparella, A. A Co-Citation Analysis on Thermal Comfort and Productivity Aspects in Production and Office Buildings. Buildings 2017, 7, 36. [Google Scholar] [CrossRef]
- Oh, S.; Song, S. Detailed Analysis of Thermal Comfort and Indoor Air Quality Using Real-Time Multiple Environmental Monitoring Data for a Childcare Center. Energies 2021, 14, 643. [Google Scholar] [CrossRef]
- Hu, G.; You, F. Multizone Building Control with Thermal Comfort Constraints under Disjunctive Uncertainty Using Data-Driven Robust Model Predictive Control. Adv. Appl. Energy 2023, 9, 100124. [Google Scholar] [CrossRef]
- Wu, Y.; Zhou, J.; Zhou, X.; Gao, J.; Cao, C.; Zeng, Y.; Li, J. Personalized Kitchen Air Supply for Reducing Individual Thermal Discomfort and Cooking Pollution Intake. Build. Environ. 2023, 245, 110921. [Google Scholar] [CrossRef]
- Favero, M.; Sartori, I.; Carlucci, S. Human Thermal Comfort under Dynamic Conditions: An Experimental Study. Build. Environ. 2021, 204, 108144. [Google Scholar] [CrossRef]
- Petegrosso, R.; Li, Z.; Kuang, R. Machine Learning and Statistical Methods for Clustering Single-Cell RNA-Sequencing Data. Brief. Bioinform. 2020, 21, 1209–1223. [Google Scholar] [CrossRef]
- Bueno, A.M.; Mendes da Luz, I.; Niza, I.L.; Broday, E.E. Hierarchical and K-Means Clustering to Assess Thermal Dissatisfaction and Productivity in University Classrooms. Build. Environ. 2023, 233, 110097. [Google Scholar] [CrossRef]
- Appel-Meulenbroek, R.; Clippard, M.; Pfnür, A. The Effectiveness of Physical Office Environments for Employee Outcomes: An Interdisciplinary Perspective of Research Efforts. J. Corp. Real Estate 2018, 20, 56–80. [Google Scholar] [CrossRef]
- Page, M.J.; McKenzie, J.E.; Boutron, I.; Hoffmann, T.C.; Mulrow, C.D.; Shamseer, L.; Tetzlaff, J.M.; Akl, E.A.; Brennan, S.E.; Chou, R.; et al. The PRISMA 2020 Statement: An Updated Guideline for Reporting Systematic Reviews. BMJ 2021, 71, n71. [Google Scholar] [CrossRef] [PubMed]
- Feng, W.; Liu, J. A Literature Survey of Local Climate Zone Classification: Status, Application, and Prospect. Buildings 2022, 12, 1693. [Google Scholar] [CrossRef]
- Romaszko, J.; Dragańska, E.; Jalali, R.; Cymes, I.; Glińska-Lewczuk, K. Universal Climate Thermal Index as a Prognostic Tool in Medical Science in the Context of Climate Change: A Systematic Review. Sci. Total Environ. 2022, 828, 154492. [Google Scholar] [CrossRef]
- Niza, I.L.; Broday, E.E. Thermal comfort conditions in Brazil: A discriminant analysis through the ASHRAE Global Thermal Comfort Database II. Build. Environ. 2022, 221, 109310. [Google Scholar] [CrossRef]
- Zamboni, A.; Thommazo, A.D.; Hernandes, E.C.M.; Fabbri, S.C.P.F. StArt Uma Ferramenta Computacional de Apoio à Revisão Sistemática. In Proceedings of the Brazilian Conference on Software: Theory and Practice-Tools Session, Salvador, Brazil, 23–27 September 2010; pp. 91–96. [Google Scholar]
- Kawakubo, S.; Sugiuchi, M.; Arata, S. Office Thermal Environment That Maximizes Workers’ Thermal Comfort and Productivity. Build. Environ. 2023, 233, 110092. [Google Scholar] [CrossRef]
- Geng, Y.; Ji, W.; Lin, B.; Zhu, Y. The Impact of Thermal Environment on Occupant IEQ Perception and Productivity. Build. Environ. 2017, 121, 158–167. [Google Scholar] [CrossRef]
- Jiang, J.; Wang, D.; Liu, Y.; Xu, Y.; Liu, J. A Study on Pupils’ Learning Performance and Thermal Comfort of Primary Schools in China. Build. Environ. 2018, 134, 102–113. [Google Scholar] [CrossRef]
- Wang, D.; Xu, Y.; Liu, Y.; Wang, Y.; Jiang, J.; Wang, X.; Liu, J. Experimental Investigation of the Effect of Indoor Air Temperature on Students’ Learning Performance under the Summer Conditions in China. Build. Environ. 2018, 140, 140–152. [Google Scholar] [CrossRef]
- Maroco, J. Análise Estatística: Com Utilização do SPSS; Edições Silabo, Lda: Lisbon, Portugal, 2003. [Google Scholar]
- Bridges, C.C. Hierarchical Cluster Analysis. Psychol. Rep. 1966, 18, 851–854. [Google Scholar] [CrossRef]
- Cui, W.; Cao, G.; Park, J.H.; Ouyang, Q.; Zhu, Y. Influence of Indoor Air Temperature on Human Thermal Comfort, Motivation and Performance. Build. Environ. 2013, 68, 114–122. [Google Scholar] [CrossRef]
- Kim, H.; Hong, T.; Kim, J.; Yeom, S. A Psychophysiological Effect of Indoor Thermal Condition on College Students’ Learning Performance through EEG Measurement. Build. Environ. 2020, 184, 107223. [Google Scholar] [CrossRef]
- Gnecco, V.M.; Pigliautile, I.; Pisello, A.L. Long-Term Thermal Comfort Monitoring via Wearable Sensing Techniques: Correlation between Environmental Metrics and Subjective Perception. Sensors 2023, 23, 576. [Google Scholar] [CrossRef] [PubMed]
- ISO 7730:2005; Ergonomics of the Thermal Environment—Analytical Determination and Interpretation of Thermal Comfort Using Calculation of the PMV and PPD Indices and Local Thermal Comfort Criteria. International Organization for Standardization: Geneva, Switzerland, 2005.
- Muhy Al-Din, S.S.; Ahmad Nia, H.; Rahbarianyazd, R. Enhancing Sustainability in Building Design: Hybrid Approaches for Evaluating the Impact of Building Orientation on Thermal Comfort in Semi-Arid Climates. Sustainability 2023, 15, 15180. [Google Scholar] [CrossRef]
- Pagano, R.R. Understanding Statistics in the Behavioral Sciences, 9th ed.; Cengage Learning: Belmont, CA, USA, 2009. [Google Scholar]
- Ruz, M.L.; Garrido, J.; Vázquez, F. Educational Tool for the Learning of Thermal Comfort Control Based on PMV-PPD Indices. Comput. Appl. Eng. Educ. 2018, 26, 906–917. [Google Scholar] [CrossRef]
- Nikolaou, T.G.; Kolokotsa, D.S.; Stavrakakis, G.S.; Skias, I.D. On the application of clustering techniques for office buildings’ energy and thermal comfort classification. IEEE Trans. Smart Grid 2012, 3, 2196–2210. [Google Scholar] [CrossRef]
- Virot, E.; Godet, J.; Khayath, N.; Ott, M.; Dazy, A.; de Blay, F. Cluster analysis of indoor environmental factors associated with symptoms of mite allergy. Ann. Allergy Asthma Immunol. 2019, 123, 280–283. [Google Scholar] [CrossRef]
- Zhang, D.; Ortiz, M.A.; Bluyssen, P.M. Clustering of Dutch school children based on their preferences and needs of the IEQ in classrooms. Build. Environ. 2019, 147, 258–266. [Google Scholar] [CrossRef]
- Feng, X.; Zainudin, E.B.; Wong, H.W.; Tseng, K.J. A Hybrid Ensemble Learning Approach for Indoor Thermal Comfort Predictions Utilizing the ASHRAE RP-884 Database. Energy Build. 2023, 290, 113083. [Google Scholar] [CrossRef]
- Qi, Y.; Wang, R.; Zhao, C.; Ding, C.; Du, C.; Zhang, J.; Zhang, X.; Chen, X.; Zhang, M.; Bie, Q.; et al. A Personalized Regression Model for Predicting Thermal Sensation Based on Local Skin Temperature in Moderate Summer Conditions. Energy Build. 2023, 301, 113719. [Google Scholar] [CrossRef]
- Zhou, B.; Huang, Y.; Nie, J.; Ding, L.; Sun, C.; Chen, B. Modification and Verification of the PMV Model to Improve Thermal Comfort Prediction at Low Pressure. J. Therm. Biol. 2023, 117, 103722. [Google Scholar] [CrossRef]
- Ahmad, S.A.; Zaki, S.A.; Azizan, A.; Md Taib, N.S. Performance of Machine Learning Algorithms Considering Spatial Effects Assessment for Indoor Personal Thermal Comfort in Air-Conditioned Workplace. E3S Web Conf. 2023, 396, 01064. [Google Scholar] [CrossRef]
- Karna, A.; Gibert, K. Automatic Identification of the Number of Clusters in Hierarchical Clustering. Neural Comput. Appl. 2022, 34, 119–134. [Google Scholar] [CrossRef]
- Zheng, G.; Wei, C.; Yue, X.; Li, K. Application of Hierarchical Cluster Analysis in Age Segmentation for Thermal Comfort Differentiation of Elderly People in Summer. Build. Environ. 2023, 230, 109981. [Google Scholar] [CrossRef]
- Bennetts, H.; Arakawa Martins, L.; van Hoof, J.; Soebarto, V. Thermal Personalities of Older People in South Australia: A Personas-Based Approach to Develop Thermal Comfort Guidelines. Int. J. Environ. Res. Public Health 2020, 17, 8402. [Google Scholar] [CrossRef]
- Li, B.; Tavakoli, A.; Wang, A.; Kaur, N.; Barnes, L.; Doryab, A.; Heydarian, A. Measuring Success, One Sensor at a Time: A Sensing Infrastructure for Longitudinal Workspace Behavior Monitoring. In Proceedings of the 10th ACM International Conference on Systems for Energy-Efficient Buildings, Cities, and Transportation, Istanbul, Turkey, 15–16 November 2023; ACM: New York, NY, USA, 2023. [Google Scholar]
- Marigo, M.; Carnieletto, L.; Moro, C.; Arcelli, T.; Ciloni, C.; Turchi, G.P.; De Carli, M.; Di Bella, A. Thermal Comfort and Productivity in a Workplace: An Alternative Approach Evaluating Productivity Management inside a Test Room Using Textual Analysis. Build. Environ. 2023, 245, 110836. [Google Scholar] [CrossRef]
- Latha, P.K.; Shanmugam, R.; Krishnamoorthy, M.; Venugopal, V. Rising Temperatures and Its Impacts on Thermal Comfort and Productivity—A Case Study from Select Workplaces in Southern India. In Lecture Notes in Civil Engineering; Springer Nature: Singapore, 2022; pp. 763–771. ISBN 9789811903038. [Google Scholar]
- Huang, S.; Zhou, F.; Liu, J.; Zhang, X. Comparison of Various Dual-Temperature Zones Space Heating Systems Based on Energy Cascade Utilization Principle. Appl. Therm. Eng. 2024, 236, 121606. [Google Scholar] [CrossRef]
- Xie, K.; Lee, M.; Khalid, R.; Zakka, V.G. The Impact of Personal Environmental Control on the Performance of Thermal Systems: Building Energy Consumption, Occupant Thermal Comfort, and Productivity. Energy Build. 2023, 298, 113552. [Google Scholar] [CrossRef]
- Siriwardhana, S.; Moehler, R.C. Enabling Productivity Goals through Construction 4.0 Skills: Theories, Debates, Definitions. J. Clean. Prod. 2023, 425, 139011. [Google Scholar] [CrossRef]


Disclaimer/Publisher’s Note: The statements, opinions and data contained in all publications are solely those of the individual author(s) and contributor(s) and not of MDPI and/or the editor(s). MDPI and/or the editor(s) disclaim responsibility for any injury to people or property resulting from any ideas, methods, instructions or products referred to in the content. |
© 2024 by the authors. Licensee MDPI, Basel, Switzerland. This article is an open access article distributed under the terms and conditions of the Creative Commons Attribution (CC BY) license (https://creativecommons.org/licenses/by/4.0/).