Abstract
Rapid urbanization across hot arid environments transforms local microclimates, yet linkages between density, layout, and outdoor thermal comfort remain inadequately characterized. This study investigates these correlations in the desert city of Biskra, Algeria. We conducted extensive in-situ measurement campaigns during peak summer and winter periods across six neighborhoods spanning low to high-rise density fabrics. We captured air temperature, humidity, and wind velocity to enable thermal comfort assessment via the Effective Temperature (ET) and Equivalent Temperature (TEK) stress indices. Index sensitivity to density metrics from 23–86% was explored through One-Variable-At-A-Time (OVAT) analysis. Results show marked summer comfort deterioration with rising density due to constrained ventilation. However, higher densities demonstrate superior winter warmth through wind blocking despite reduced sunlight exposure. Sharp nonlinear differences emerge between seasons. Precision density thresholds prove difficult to define conclusively given typological diversities. However, indicative ranges tied to hazards are identified, providing guidelines for informed climatic adaptation. This research delivers vital evidence to advance bioclimatic strategies for enhancing habitability amidst urban expansion across delicate hot deserts.
1. Introduction
The degradation of outdoor thermal comfort in arid urban regions presents growing public health risks, as the built terrain and dense construction exacerbate vulnerability to extreme heatwaves already intensified by global warming [1,2]. Studies reveal that just a 1–2 °C increase beyond heatwave temperature thresholds can trigger spikes in hospitalizations for life-threatening conditions like heat stroke, heat cramps, heat exhaustion, and heat syncope [3,4].
This amplification of heat risk stems from the modified microclimates of arid city areas. As massive localized urbanization and dense built terrain alter land cover and radiative dynamics in ways unsuitable for human heat regulation [5], customized microclimates emerge. Urban Heat Islands commonly boost air temperatures over adjacent rural surroundings by 2–4 °C via decreased ventilation, trapped solar radiation, and waste heat from human activities [6,7,8,9].
When high air temperatures (over 40 °C) combine with intense solar radiation and arid humidity levels under 25% in desert cities, excess mortality tends to occur, indicating climate change could multiply heat-health incidents [10]. There is a threshold wet-bulb temperature ceiling of 35–36 °C (heat index combining temperature and humidity) beyond which even healthy individuals swiftly experience physiological heat strain [11]. Prolonged exposure to summer conditions approaching or exceeding this human survivability limit causes cumulative damage—dehydration, fatigue, and kidney problems [12].
Beyond immediate risks like heat stroke, the hot and arid urban microclimates lower habitual outdoor comfort and mobility, negatively impacting public life quality and economic productivity [13]. With global urbanization and city growth worldwide leading to densification of built environments [14,15], quantifying the climatic impacts on outdoor thermal comfort becomes increasingly crucial.
Although previous studies have documented general Urban Heat Island and heat vulnerability issues as cities expand [16], linkages between specific measurable parameters of density and on-the-ground thermal comfort remain inadequately characterized. Much of the existing work has focused on isolated factors like vegetation, geometry, wind, and materials [7,8,9,17,18,19], rather than combined effects of density, size, and spatial arrangements on neighborhood thermal environments.
This gap needs to be addressed by investigating how variations in urban density and form affect outdoor thermal comfort through field measurements and modelling. The outcomes can help define density thresholds and spatial configurations optimized for outdoor liveability as cities grow facing climate change.
The urban form as a determinant key of the urban microclimate is defined by the overall layout, density and geometry of urban spaces and building structures [20]. Modifying parameters of the urban form provides potential pathways to climatic adaptation and enhanced habitability amidst expansion across arid regions, constituting a major premise of bioclimatic design thinking [21]. For example, deliberately manipulating urban density, the orientation of street canyons, and building heights/spacing could allow restoration of air flow or night flushing crucial for hot weather thermal regulation [22]. However, while indicative guidelines exist, exact specifications for bioclimatic urban forms remain empirically lacking due to few systematic studies quantitatively relating detailed on-site thermal comfort measurements to concurrently evaluated metrics of urban morphology [23]. Bridging this research gap to derive evidence-based bioclimatic development principles for extreme environments constitutes an essential priority at the intersection of climatology, sustainability science and urban planning.
In urbanizing arid lands cities specifically, rapid expansion and densification have raised concerns regarding deterioration in outdoor thermal comfort [24]. Addressing the following research questions is therefore critical: How significantly does manipulating density parameters impact summer and winter thermal comfort in arid lands cities? And what specific density and layout metrics best correlate with extensive field measurements of thermal comfort in these environments?
We consequently hypothesize that increasing density degrades outdoor summertime thermal comfort in arid lands cities amidst rapid expansion, whereas optimizing wind-oriented urban geometry can enhance simulated comfort levels during both hot and cold periods. Given these premises, the overarching objectives are, firstly, to quantify linkages between density metrics, layout factors and thermal comfort via extensive field measurement campaigns in arid lands cities including Biskra, Algeria; and, secondly, to provide architects, planners and policymakers in similarly arid global regions with evidence-based guidelines for informed, thermally-conscious development.
2. Research Method: In-Situ Measurement Data Coupled with the OVAT Sensitivity Analysis
This study employs a coupled methodology of in-situ measurements and One-Variable-At-a-Time (OVAT) sensitivity analysis to analyze the impact of urban density on outdoor thermal comfort [9,25,26]. In-situ measurements of air temperature, humidity, and wind speed will be collected at six urban sites with differing building densities. These real-world observations capture the microclimate conditions across a range of urban densities.
OVAT sensitivity analysis will then systematically vary the urban density parameter in thermal comfort models while holding other inputs constant. This will quantify the isolated impact of density changes on the effective temperature (ET) and equivalent temperature (TEK) comfort indices. The rationale for using OVAT analysis is as follows: (a) It is consistent with the measurement and simulation approaches in urban microclimate research. (b) It straightforwardly isolates the sensitivity of ET and TEK to density changes. (c) It is easier to implement than global sensitivity methods. (d) It allows targeted exploration of the density influence.
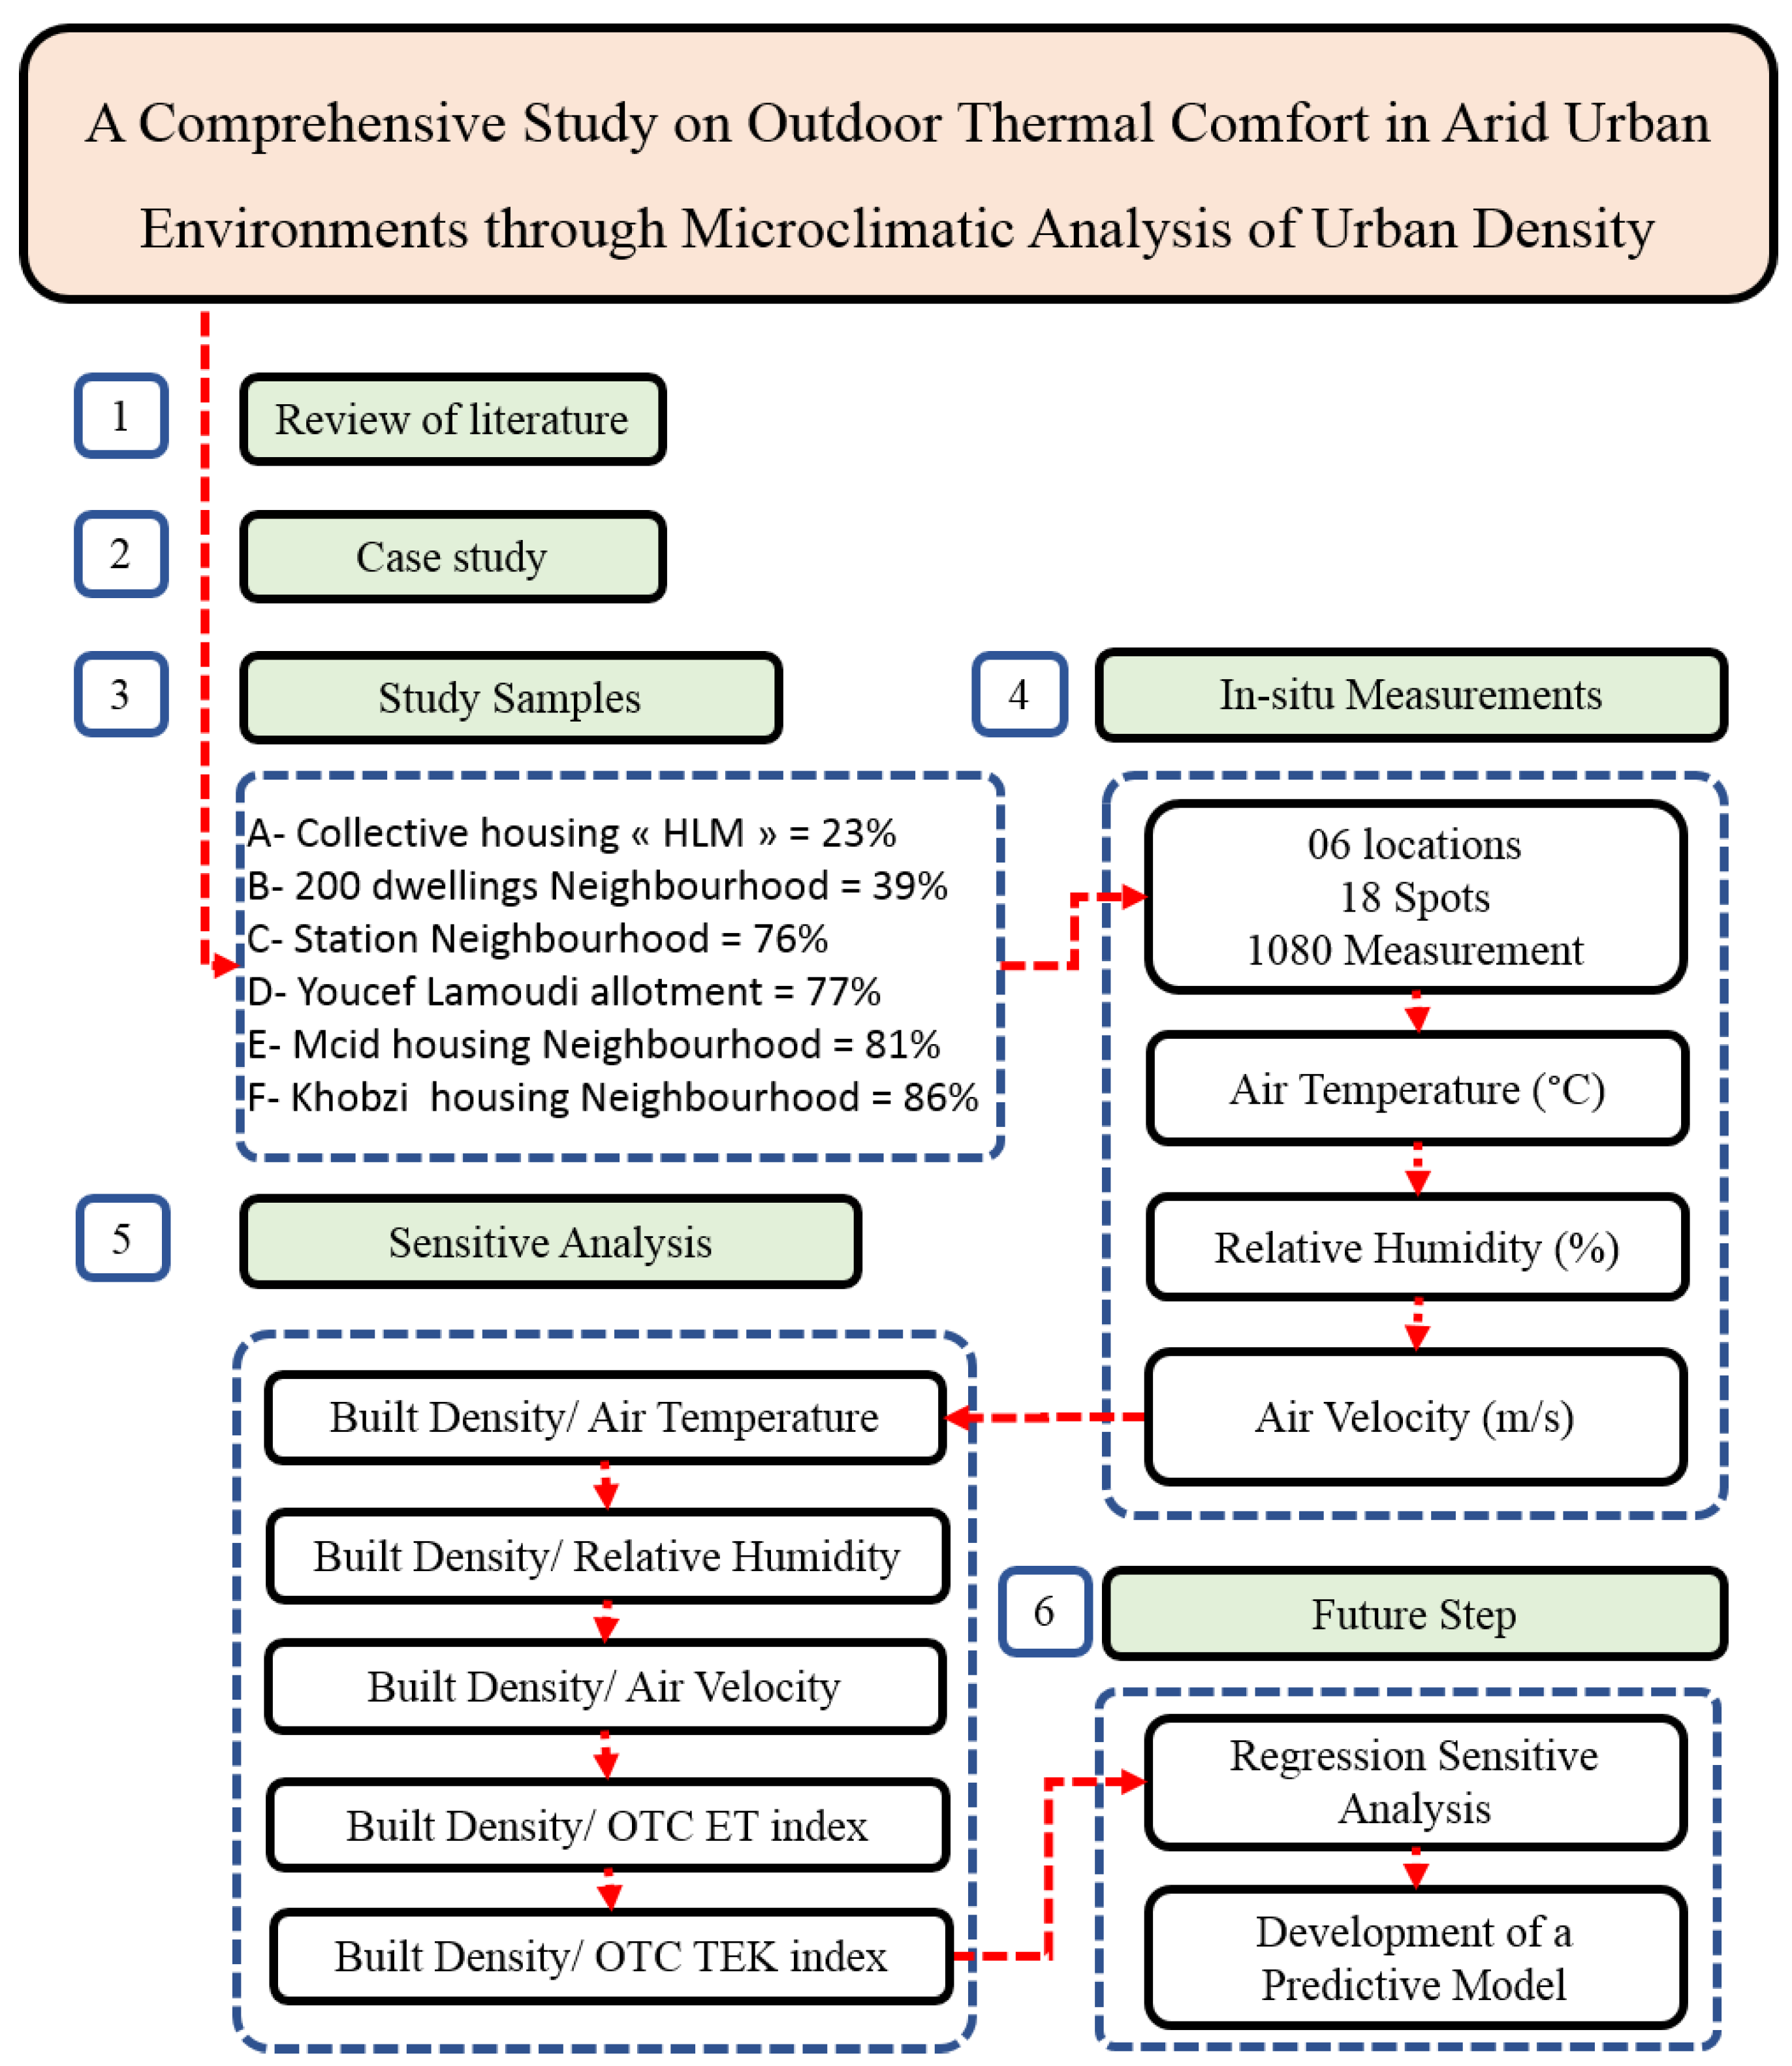
The overall methodology will consist of the following (Figure 1):
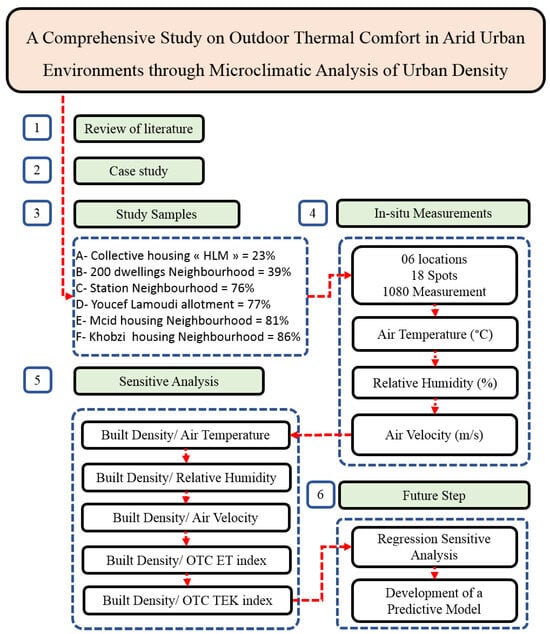
Figure 1.
Research framework.
- In-situ measurement of microclimate variables across different urban densities
- Development of outdoor thermal comfort models incorporating the measured data
- OVAT analysis of models, systematically varying urban density
- Analysis of density impact on ET and TEK to quantify sensitivity
- Mapping of density-thermal comfort relationship based on findings
This density-focused in-situ measurement and sensitivity analysis couples the strengths of real-world urban data and isolation of density’s effect on thermal comfort. It is targeted to provide enhanced understanding of outdoor thermal experience within cities of different built-up densities in arid lands.
2.1. Case Study
The case study city of Biskra is located in an extreme hot arid desert climate zone, providing an ideal testbed for evaluating outdoor thermal comfort [7]. Biskra lies in southeast Algeria at the northern edge of the Sahara desert (34°48′ N, 5°44′ E, 88 m altitude) [27]. The city sits at the southern foothills of the Saharan Atlas Mountains; however, the surrounding terrain is dominated by the vast Sahara.
Biskra features an intensely hot desert climate (Köppen classification: BWh) [8], with average high temperatures ranging from 29 °C in winter up to 40 °C in summer. The hottest period runs from 8 June–10 September annually. The solar radiation load is extreme given the clear-sky conditions, with July seeing the annual maximum sunshine duration. Winds are often calm, especially in recent decades as urban growth and declining vegetation have slowed air currents. Rainfall is scarce (141 mm/year) but sudden storms may arise [28].
This climate backdrop subjects Biskra residents to strong heat stress [27]. The region thus provides an analogue for outdoor human thermal comfort studies under temperature extremes and low humidity. Exploring the Biskra urban microclimate gives insights into architectural interventions needed to moderate intense heat in hot arid cities globally. The desert city’s history also provides a case to study how adaptive comfort varies with progressive introduction of modern urban fabrics contrasting traditionally adapted forms.
2.2. Selection of the Samples Studied
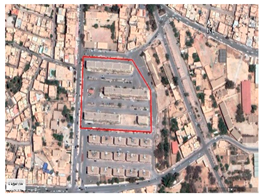
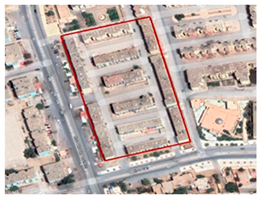
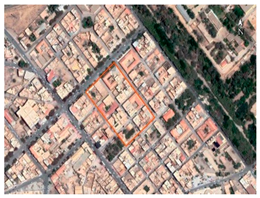
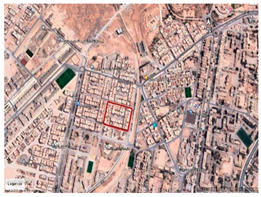
Over time, the growth of the city of Biskra has seen the emergence of various urban forms. An extensive typo-morphological analysis focusing on the evolution of Biskra’s urban fabric revealed six predominant fabrics across planning eras: Old collective tissue; Modern collective tissue; Old planned individual tissue; Modern planned individual tissue; Unplanned irregular individual tissue; and Unplanned regular individual tissue. Each era has given birth to a distinct urban fabric, characterized by unique morphological features.
Faced with this diversity and morphological richness, and with the objective of highlighting the impact of urban density on outdoor thermal comfort, we have undertaken a typo-morphological analysis of the city of Biskra, based essentially on the criterion of built density. The sampling of fabrics was done by selecting six representative neighborhoods (typical sampling) (Table 1).

Table 1.
Selected study samples from the city of Biskra.
The in-situ measurement campaign targeted urban sites across a range of residential density profiles from low-rise suburban to high-rise compact centers. The sites were categorized into three representative density grades:
First density grade—Low-density fabrics: this included the 23% density social housing district (HLM) consisting of loose bar forms as well as the 39% density 200 East El-Alia housing blocks arranged in bars with interior courtyards.
Second density grade—Medium-density fabrics: this encompassed the 76% density train station district with checkerboard style individual housing along with the 77% density Youcef Lamoudi planned subdivision containing organized individual housing units.
Third density grade—High-density fabrics: the final grade covered the 81% density traditional irregular housing fabric within the Mcid district and 86% density self-constructed consistent individual housing located in the Khobzi district.
Together, these 6 sites provide a targeted density range from open suburban forms to congested urban centers for sampling microclimate parameters. The consistent grading into low, medium, and high-density clusters allows for analysis of outdoor thermal comfort performance relative to urban morphologies of increasing compactness and enclosure across the selected districts.
2.3. In-Situ Measurements Selection Period
The in-situ measurement period is strategically targeted on the hottest summer week (5–11 July 2023) and the coldest winter week (17–23 January 2023) based on historical averages. Measurements begin on the first weekday of each week to capture three weekdays given the consistency of meteorological conditions.
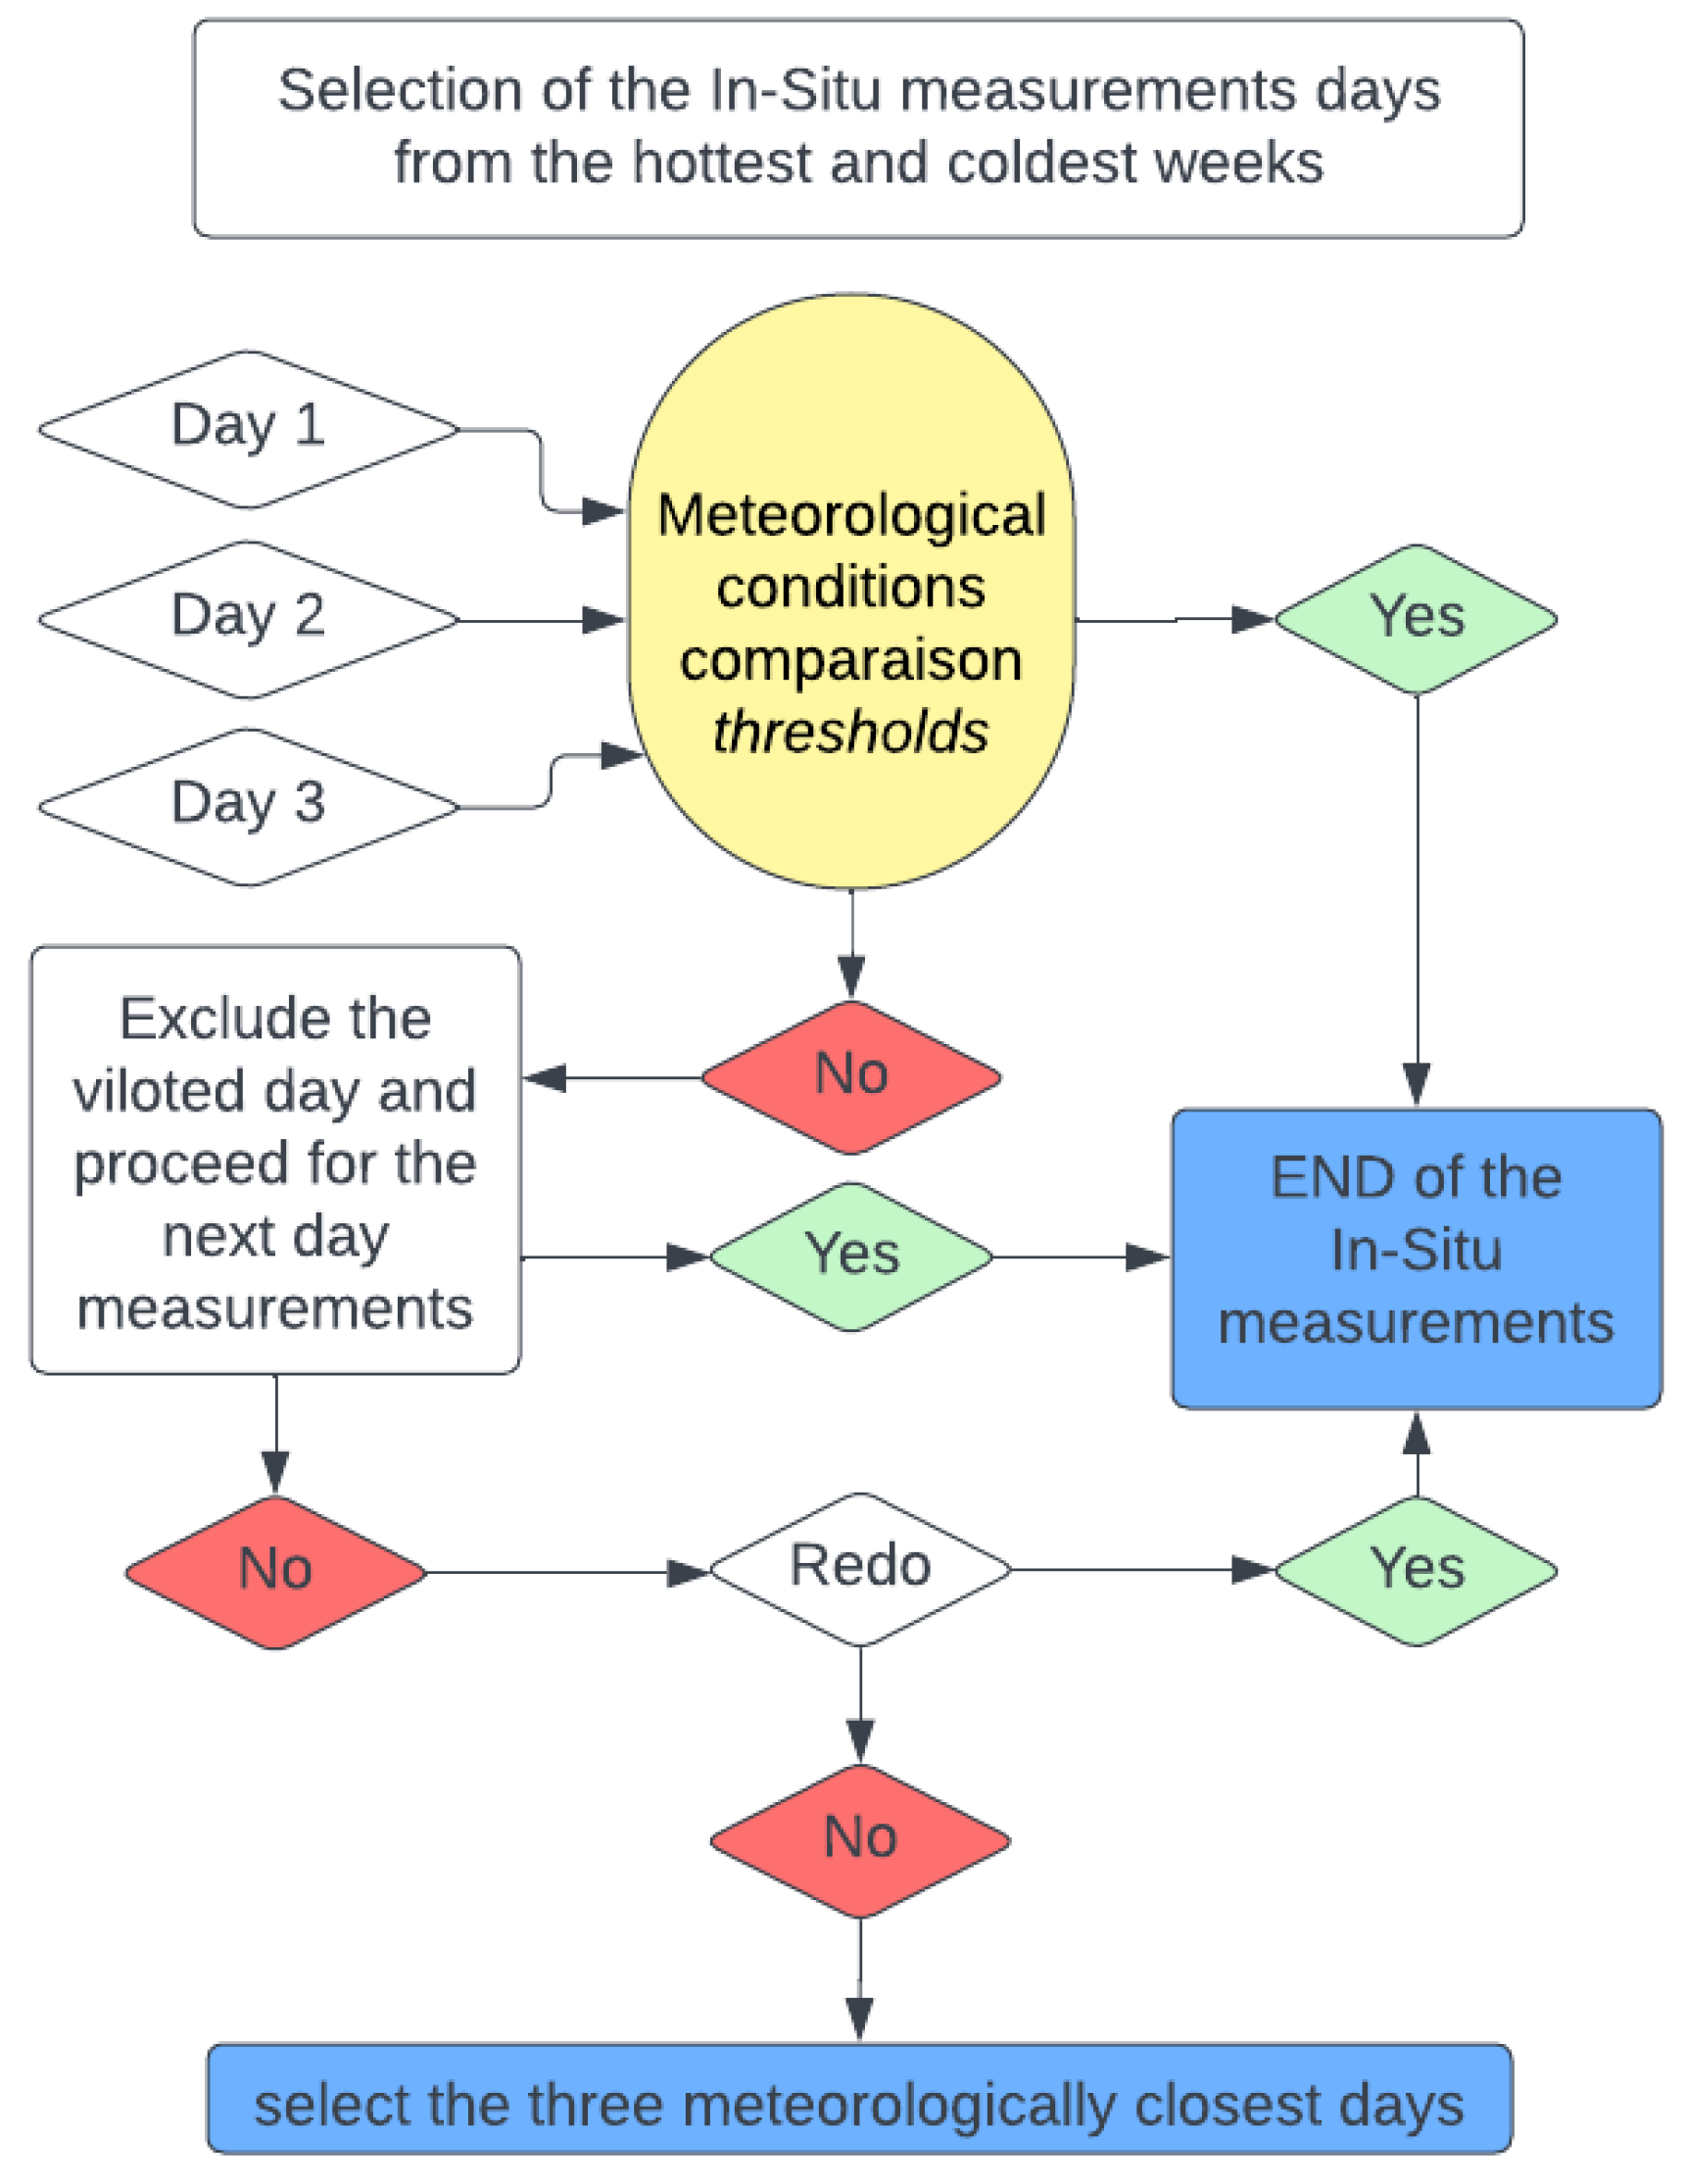
The specific measurement days are selected based on stringent consistency criteria across key climate variables over the 3-day period:
- Global radiation difference between days < 100 W/m2
- Air temperature difference < 1 °C
- Relative humidity difference < 10%
- Wind velocity difference < 3 m/s
- Cloud cover difference < 10 unit
- Rainfall difference < 5 mm
If a day violates the consistency thresholds relative to the two other measurement days, it is excluded and the next weekday is measured instead. This screening ensures representative days with maximum similarity for robust microclimate sampling. For the hottest week of 2023, the 1st, 2nd, and 3rd days passed all consistency checks and were selected. For the coldest week of 2023, the 2nd, 3rd and 4th days met all criteria and were selected (Figure 2).
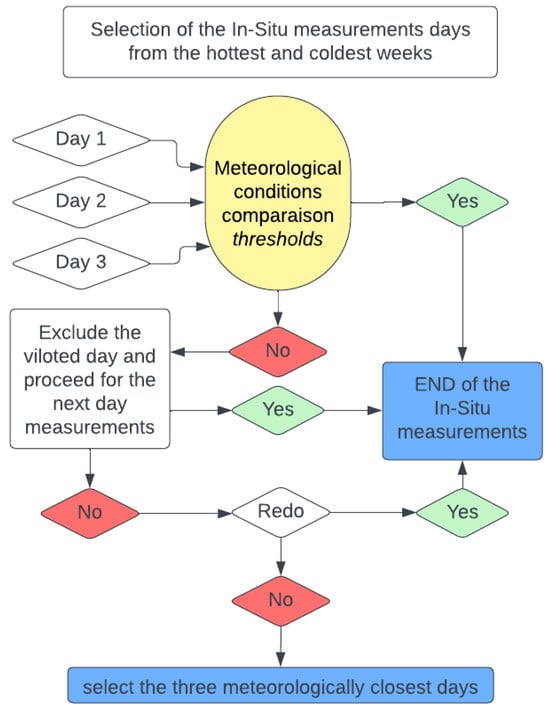
Figure 2.
Method of the In-Situ Measurements selection days.
The meteorological verification utilizes publicly available data (Table 2 and Table 3) from the Biskra Airport WMO station (ID: 605250, Lat: 34.8° N, Long: 5.733° E), located proximal to the study area. Comparison to this reference station guarantees the measurement days exemplify typical winter minimum and summer maximum conditions for the region.

Table 2.
Meteorological conditions of the selected days of the hottest week.

Table 3.
Meteorological conditions of the selected days of the coldest week.
2.4. In-Situ Measurements Protocol
An extensive in-situ measurement campaign was carried out to capture outdoor thermal comfort variables across varying urban densities during hot and cold periods. Measurements were taken over three successive days within the hottest summer week of 5–7 July 2023 and the coldest winter week of 18–20 January 2023. Daily measurements spanned from 04:00 a.m. in the morning until 10:00 p.m. in the evening.
The Testo 480 digital meter was utilized to measure key parameters of air temperature (Ta), relative humidity (Hr), and wind speed (V) at the selected urban sites. As a high-precision instrument, the Testo 480 allows for accurate measurement, analysis and logging of all relevant thermal comfort parameters within a single device [29] (Appendix A).
Measurements were taken across six specific urban sites representing a range of density conditions from low-rise suburban neighborhoods to high-rise compact centers. At each site, the measurement was replicated at three distinct points for robust sample collection, totaling 18 measurement points across the study area. Furthermore, measurements were sampled at each point across 10 consistent times throughout the diurnal cycle (Appendix A).
In total, 1080 in-situ measurements were collected during the intensive multi-day summer and winter campaigns for inclusion in the analysis, providing a detailed spatial-temporal profile of urban outdoor thermal comfort indicators across hot, cold, and transitional outdoor conditions. The dataset provides the necessary input resolution to apply advanced numerical calculation approaches to evaluate urban density impacts on the selected thermal stress indices of interest.
2.5. Evaluation of Outdoor Thermal Comfort
The assessment of outdoor thermal comfort in this study is based on the numerical calculation of the Effective Temperature index (ET) and the Equivalent Temperature Index (TEK) using the OuTTherma calculator model Ver 1.0 [30]. OuTTherma is an online application developed specifically for evaluating outdoor thermal comfort across multiple locations and times. It allows for simultaneous evaluation of up to 20 different measurement sites at 12 times per day.
OuTTherma leverages the most widely used and validated heat stress indices, including TEK, TSP, ET, HUMIDEX, TEP, Y index, WBGT, DI, and CPI for assessment. The calculator computes index values based on site measurements of air temperature, humidity, wind speed, and mean radiant temperature as inputs. OuTTherma dynamically outputs index values along with color-coded visualizations indicating heat stress risk levels for each time and location.
In this study, OuTTherma v1.0 was applied to meteorological measurements collected during targeted summer and winter measurement campaigns at the study site. The ET and TEK indices were numerically computed in OuTTherma using the campaign’s air temperature, humidity, and wind speed. This enabled dynamic outdoor thermal comfort evaluation across the most representative hot and cold periods. Output ET and TEK values were then analyzed to quantify heat stress distribution and variation.
3. Results and Discussion
3.1. Sensitivity of the Air Temperature Profile to Urban Density Variation
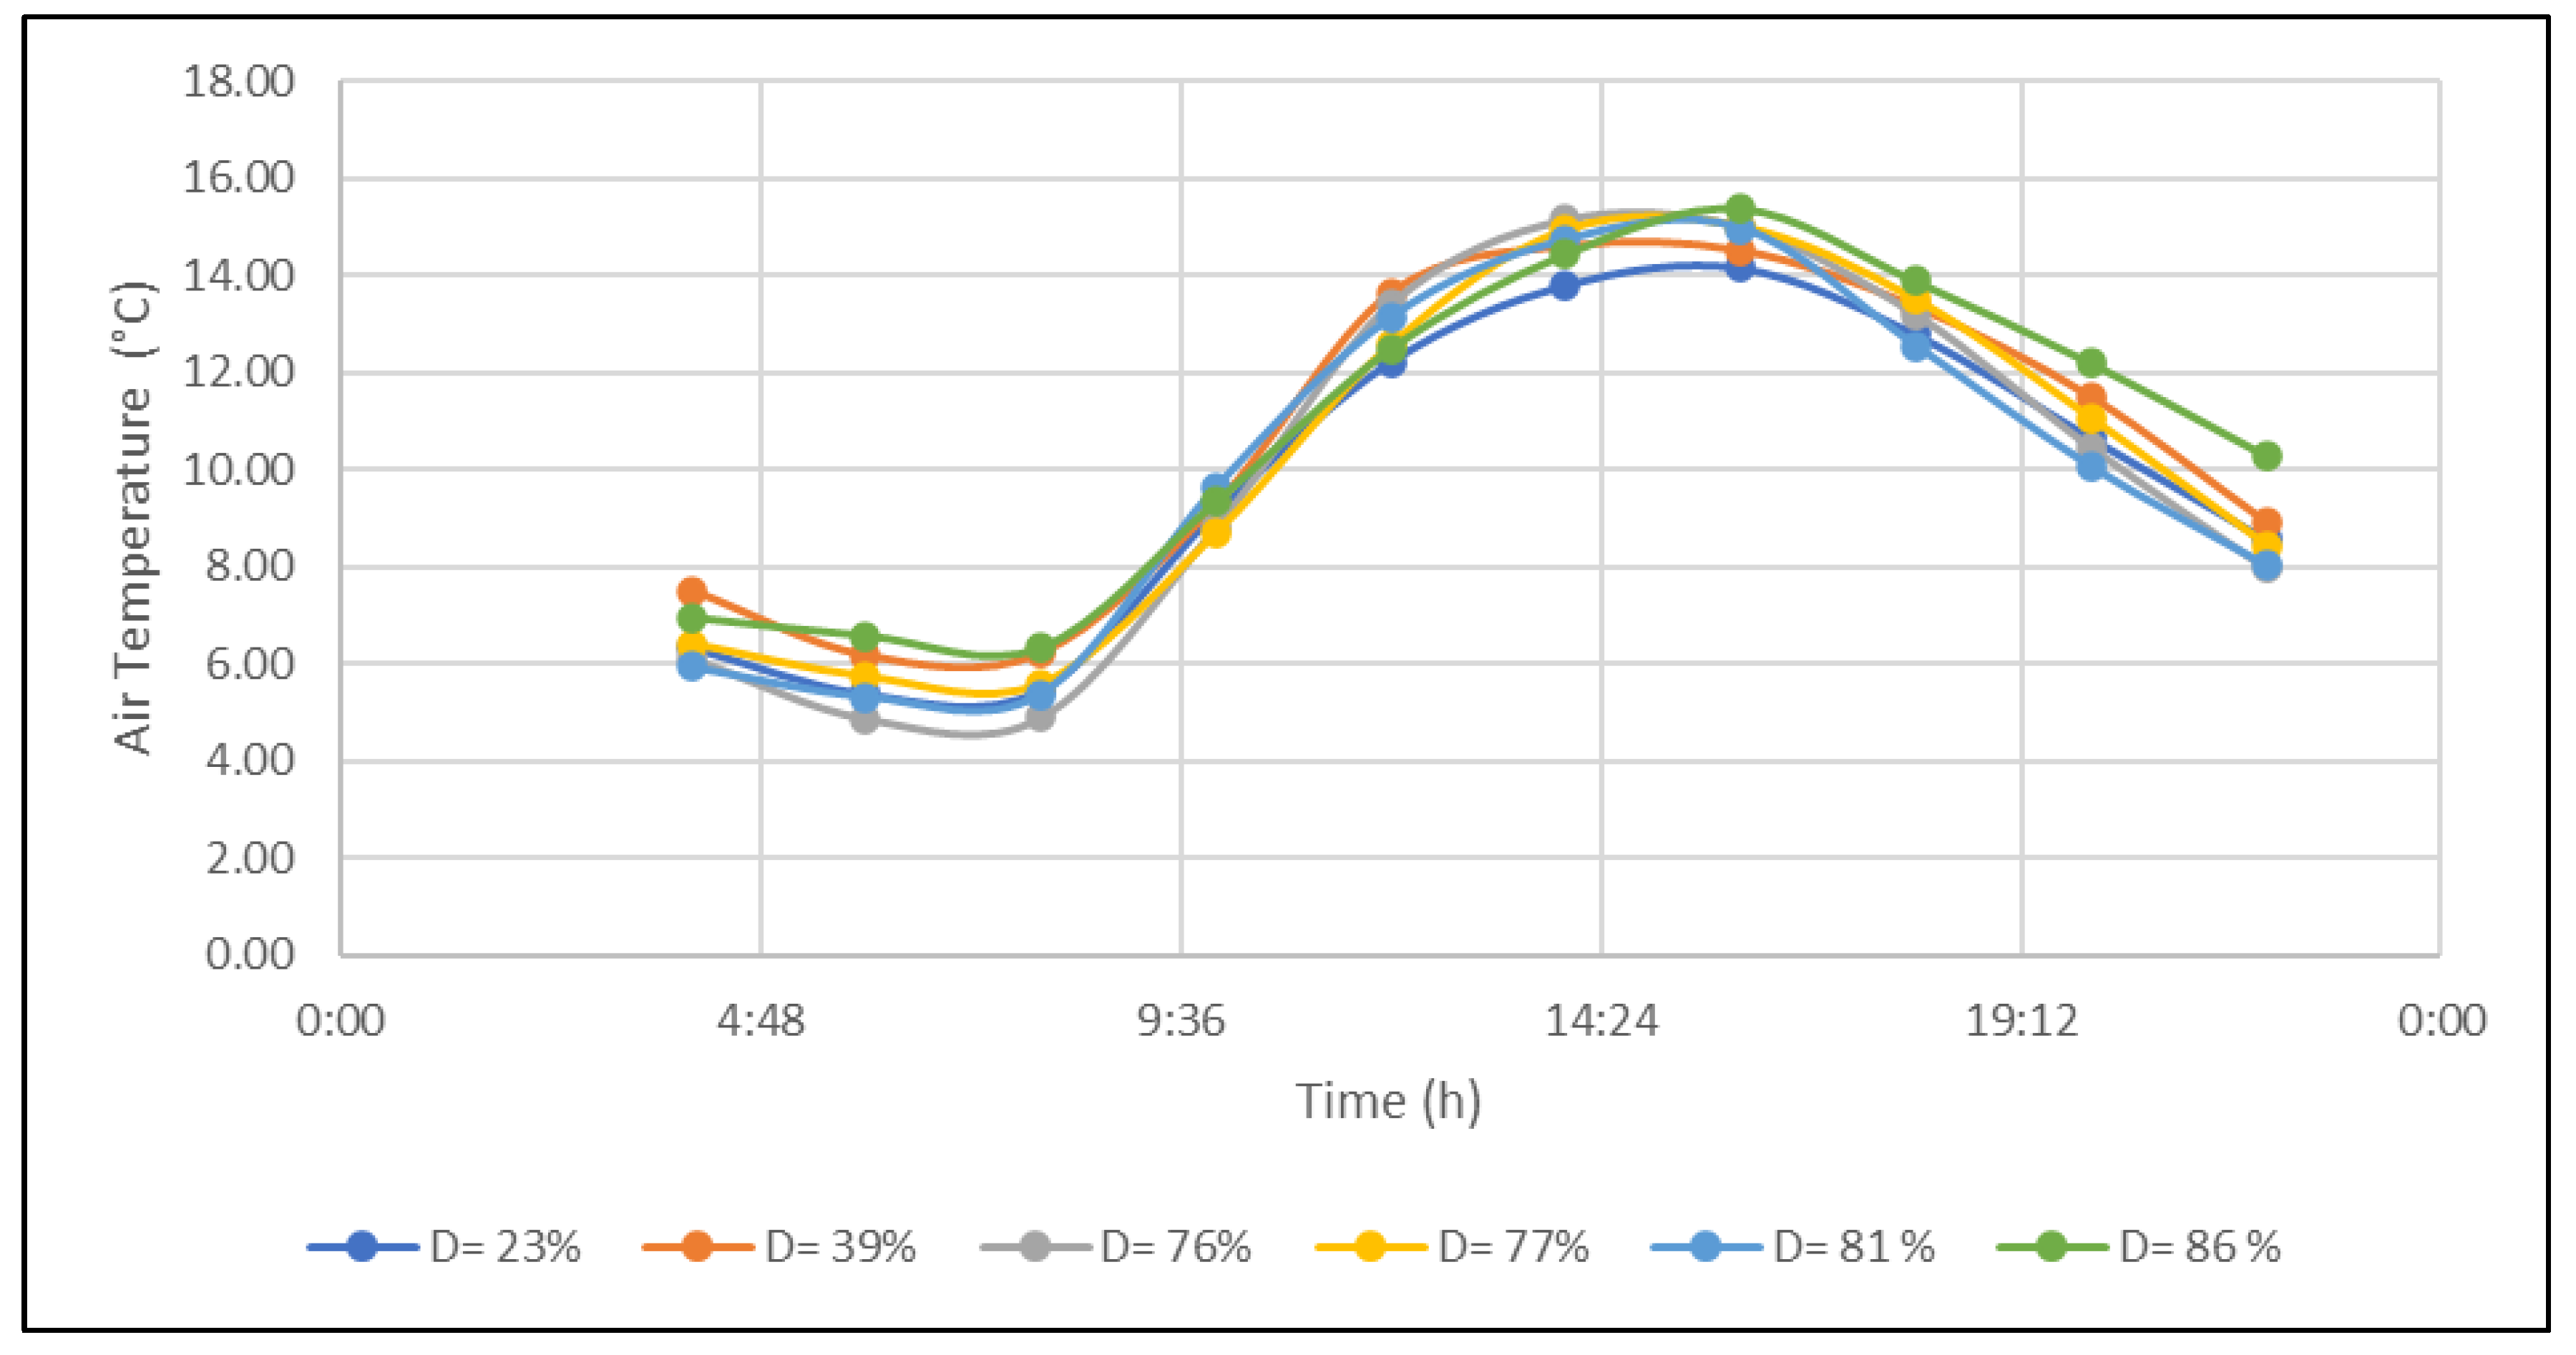
The evolution of temperature over the measured days in winter shows similar trends across all density values, with some key differences in maximum and minimum temperatures. Temperatures gradually increase from early morning, reaching peak values around 4 p.m. They then decrease throughout the evening to reach minimum values around 7 a.m. the following day (Table 4, Figure 3).

Table 4.
The average air temperature (Ta) over the winter in-situ measurement period.
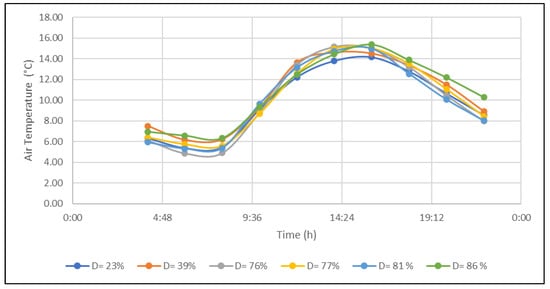
Figure 3.
Evolution of the average air temperature (Ta) over the winter in-situ measurement period.
From 4–8 a.m., densities 23%, 76%, 77%, and 81% record lower minimum temperatures than 39% and 86%, with 76% reaching the absolute minimum at 4.91 °C at 7 a.m. Transitioning to mid-morning, between 8 a.m.–12 p.m. all densities show a steady increase, reaching very close peak values from 8–10 a.m. At noon, the highest temperature of 13.63 °C is recorded at 39% density.
Furthermore, from 12–4 p.m. temperatures continue rising across all densities. The maximum of 15.39 °C is reached by the 86% density in this period. The 23% density records the lowest values. Subsequently, between 4–10 p.m., temperatures drop across all densities, following similar trends. Densities 23%, 76%, 77%, and 81% fall to lower minimums than 39% and 86%, with 81% reaching the lowest temperature of 8.03 °C. Density 86% records the highest values in this phase.
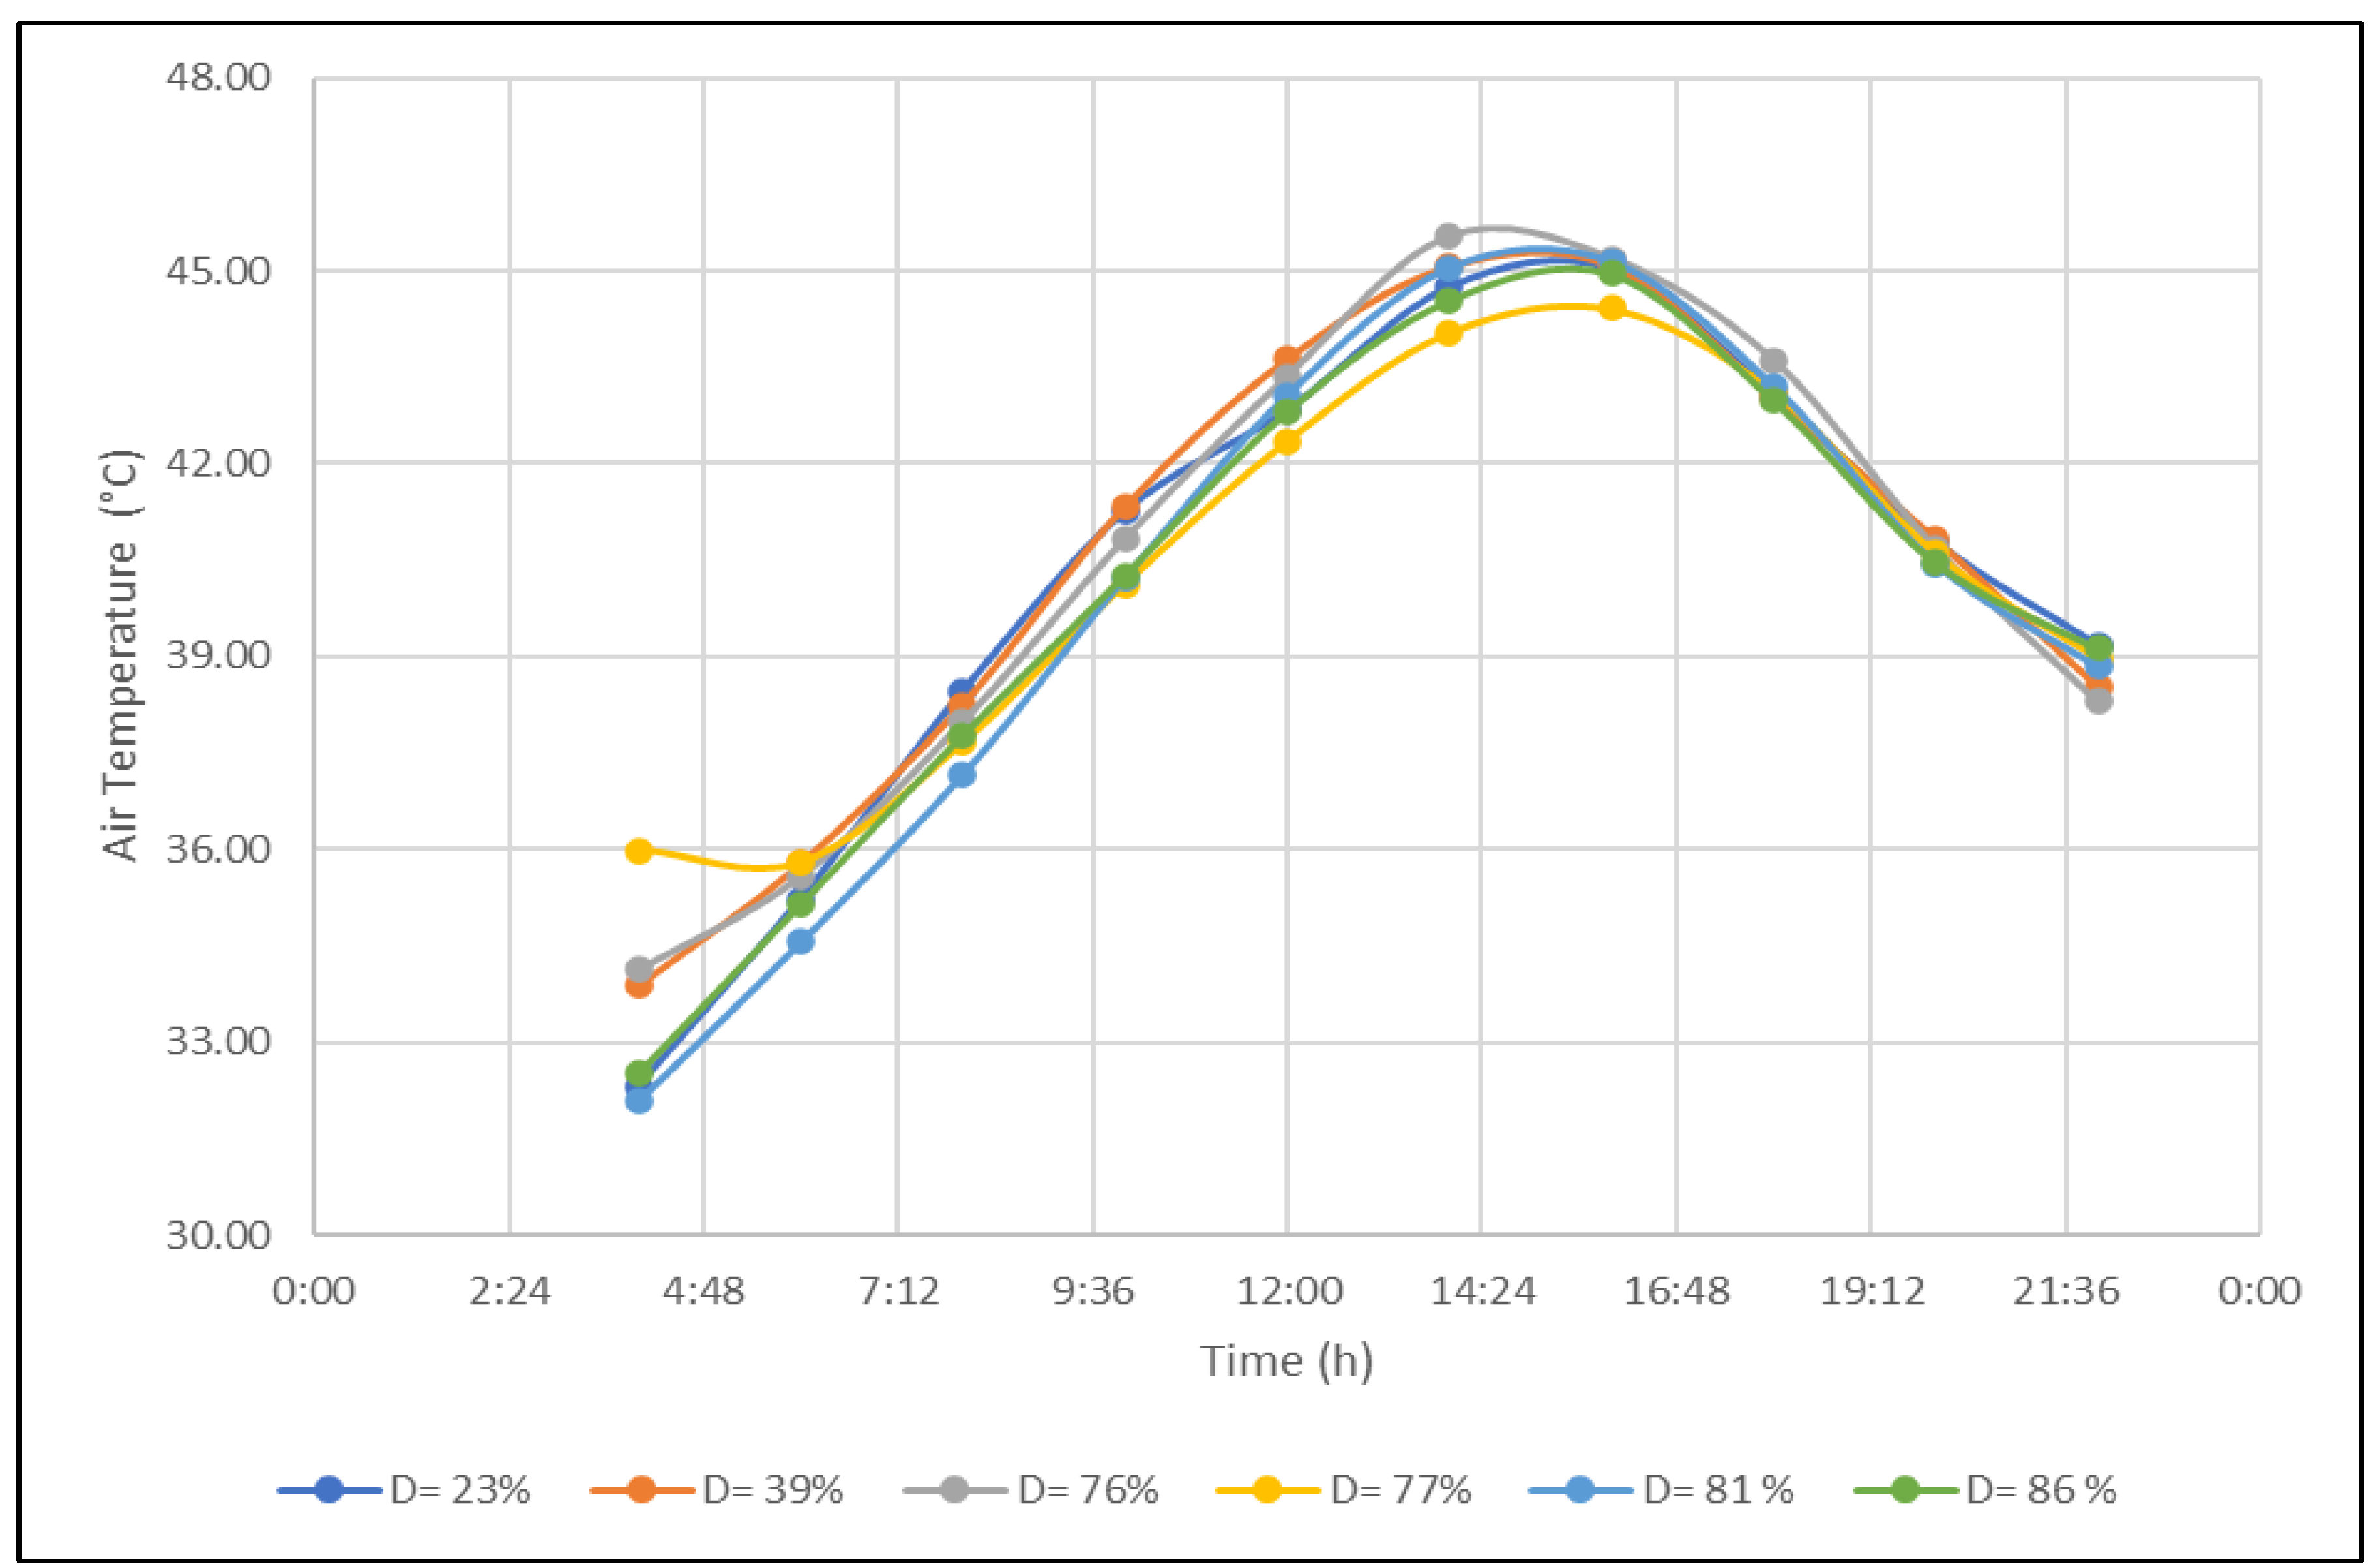
The evolution of air temperature over the measured summer days shows similar overall trends across densities, with some differences in maximum and minimum values. Temperatures increase gradually from morning, reaching peak values around 4 p.m. They then decrease overnight to reach minimum values around 4 a.m. (Table 5, Figure 4).

Table 5.
The average air temperature (Ta) over the summer in-situ measurement period.
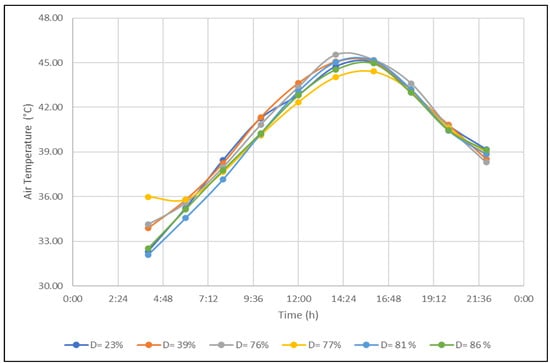
Figure 4.
Evolution of the average air temperature (Ta) over the summer in-situ measurement period.
Specifically, from 4–8 a.m., densities 23%, 81%, and 86% record lower minimums than 39%, 76%, and 77%. The absolute minimum of 32.09 °C is reached by the 81% density at 4 a.m. Transitioning to mid-morning, between 8 a.m.–12 p.m., temperatures increase across all densities, following a similar upward trend. Density 39% records higher peak values than other densities, reaching a maximum of 43.63 °C at noon.
Furthermore, from 12–4 p.m., the temperature rise continues, with density 76% reaching the highest value of 45.52 °C in this phase. Densities 23% and 39% record the lowest temperatures. Subsequently, between 4–10 p.m., all densities show a decreasing temperature trend, with very close values. Density 76% drops to the lowest temperature of 38.30 °C.
3.2. The Reactivity of Air Velocity in the Context of Shifting Urban Density Landscapes
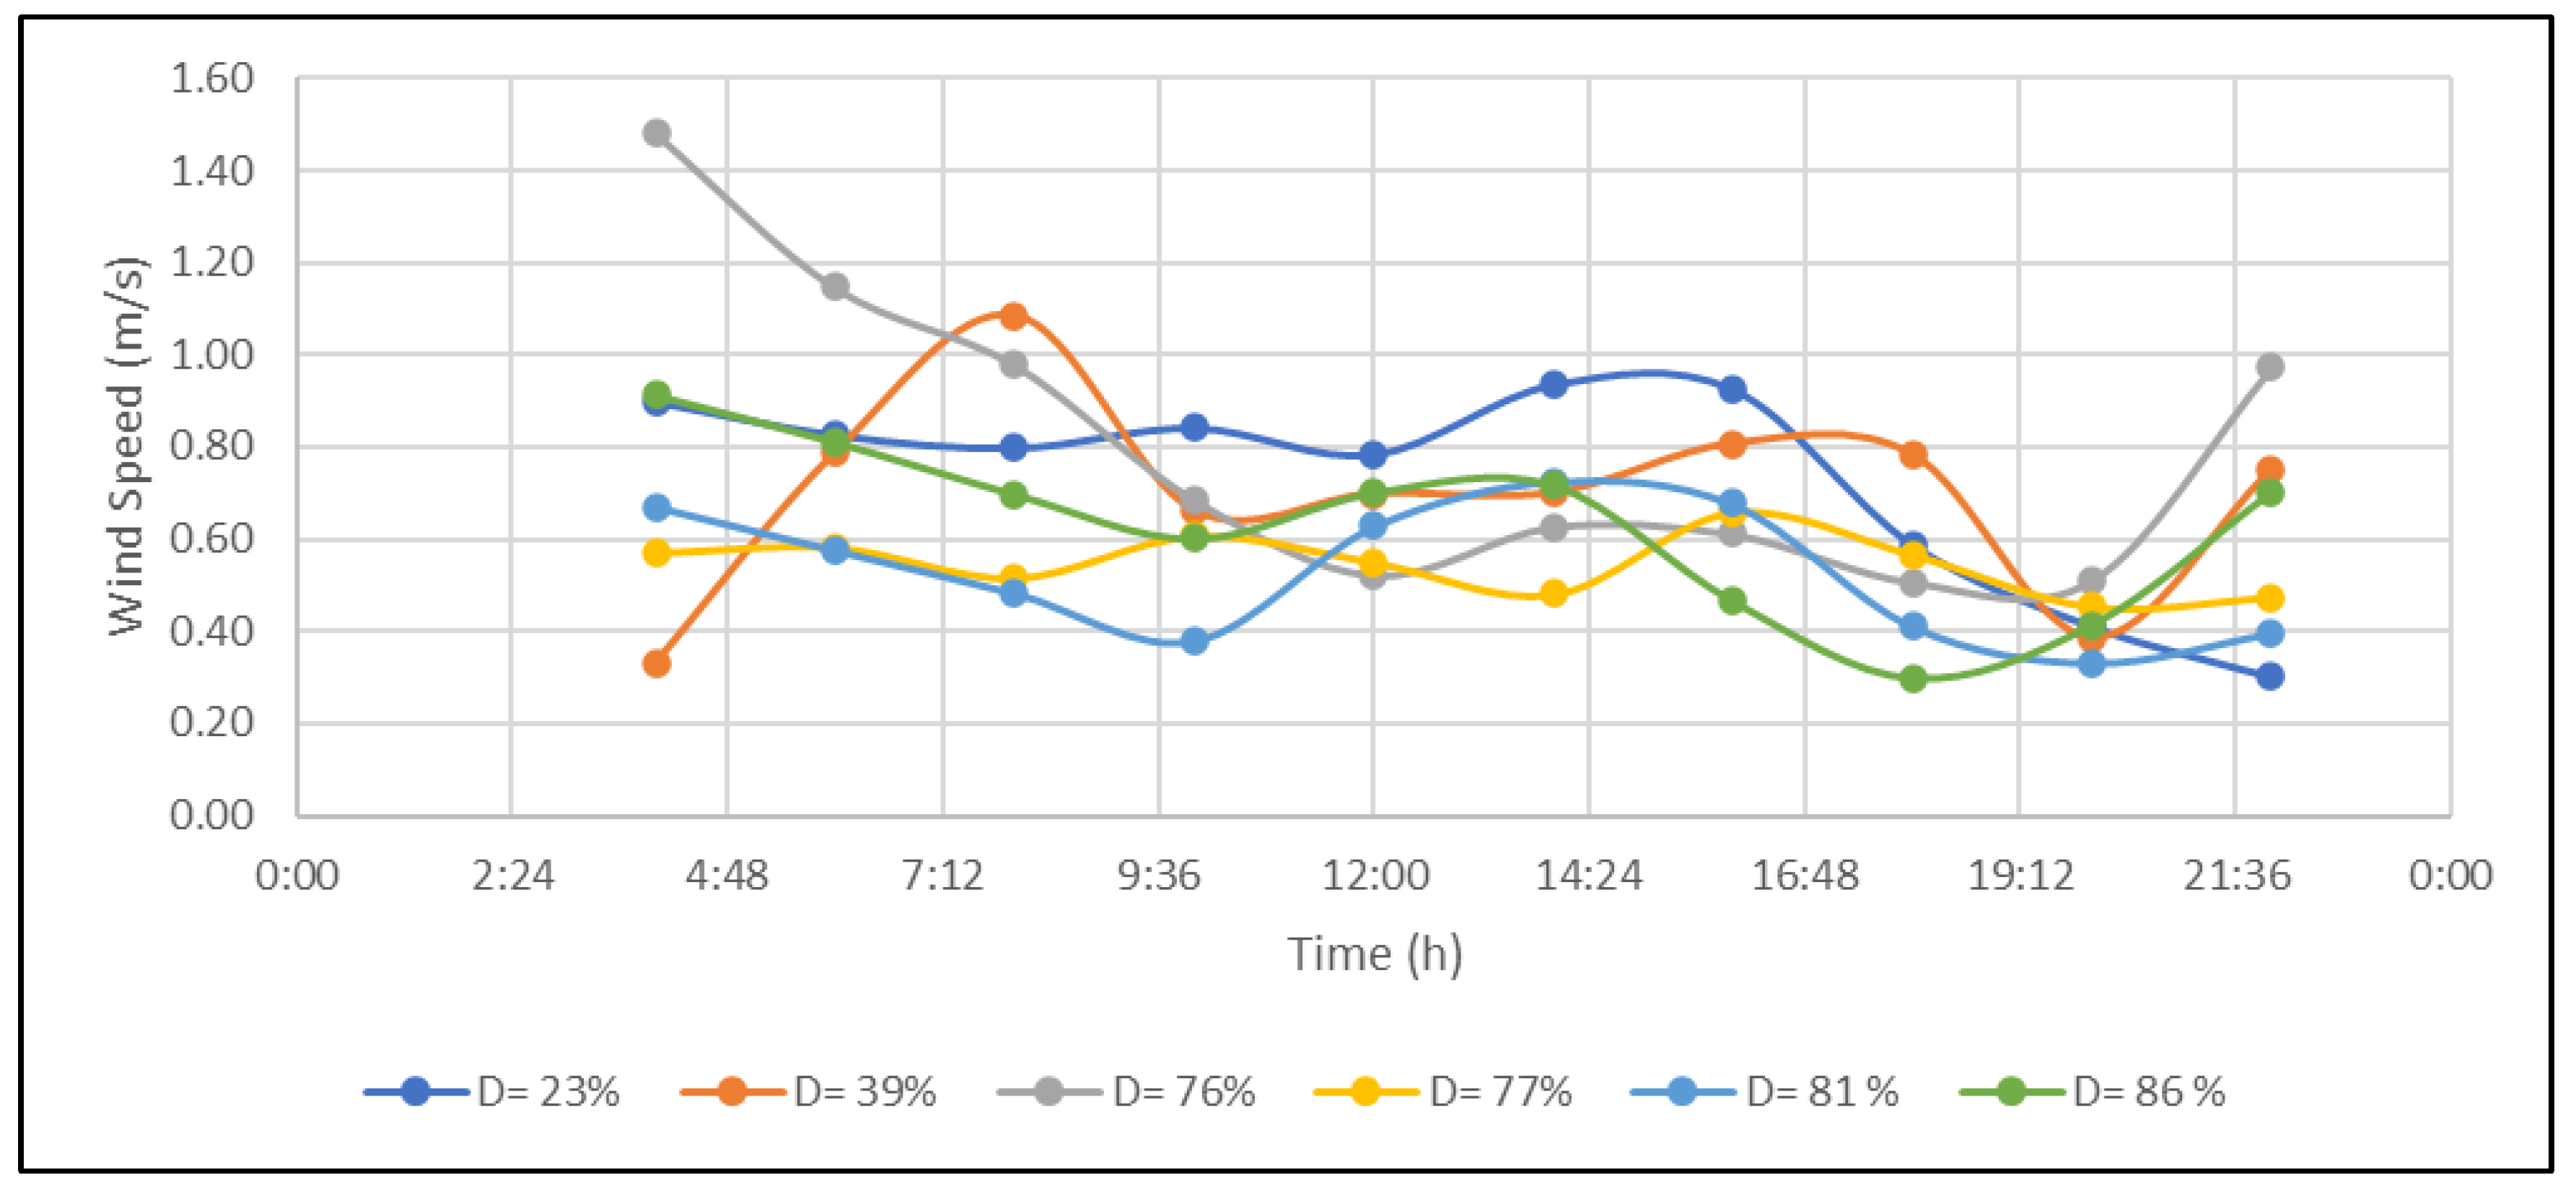
The evolution of wind speed over the measured winter days shows remarkable disturbances across all densities during certain periods. Specifically, from 4–10 a.m., speeds are varied and dispersed, indicating a disturbed period across densities. The maximum speed of 1.48 m/s is reached by density 76% at 4 a.m. (Table 6, Figure 5).

Table 6.
The average wind speed (V) over the winter in-situ measurement period.
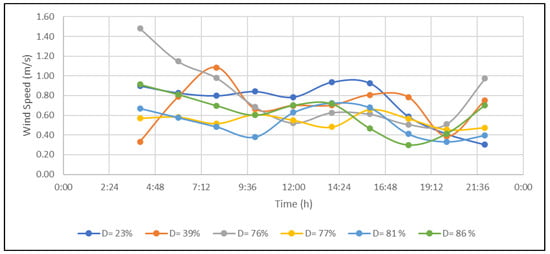
Figure 5.
Evolution of the average wind speed (V) over the winter in-situ measurement period.
Transitioning to mid-morning through evening, between 10 a.m.–8 p.m., a calmer period emerges with all densities recording relatively close, stable values. However, density 23% observes the highest maximum speeds in this phase. Furthermore, from 8–10 p.m., the disturbance in speed resumes for densities 39%, 76%, and 86%, with 76% reaching a maximum of 0.97 m/s. Meanwhile, densities 23%, 77%, and 81% maintain stability.
Overall, while some periods show fluctuation, wind speeds across densities indicate both disturbed and calm periods during the winter measurement days.
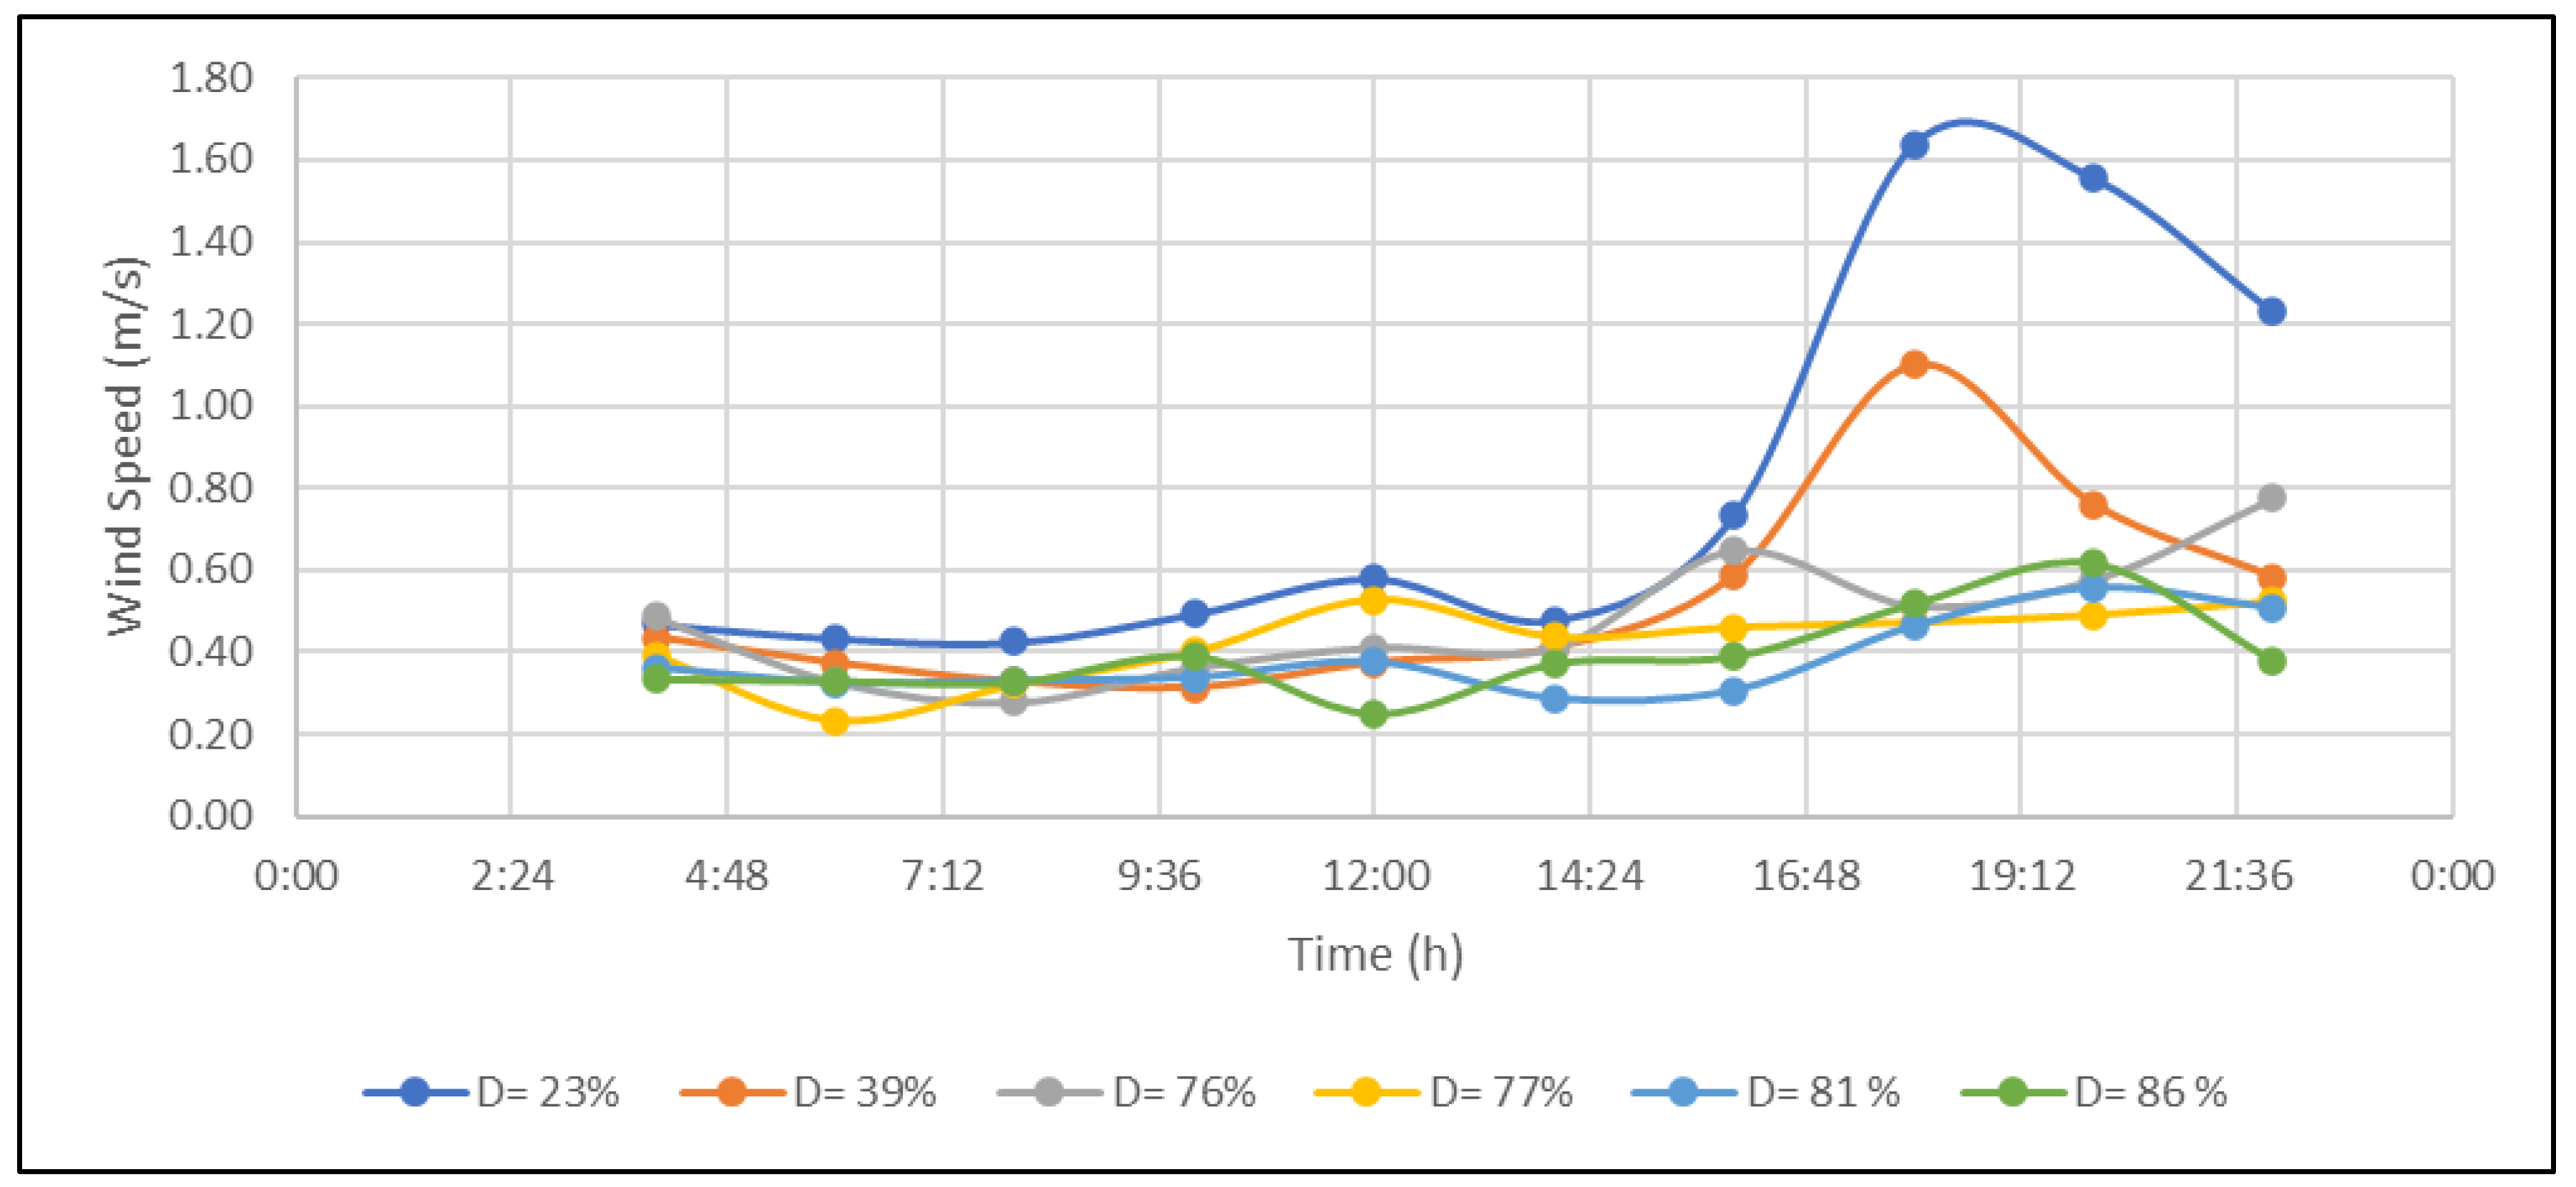
The evolution of air velocity over the measured summer days indicates general stability across all densities for most of the day, with some notable disturbances arising towards evening. Specifically, from 4 a.m.–4 p.m. a calm period emerges, with very close, low speeds recorded across all densities. Density 23% registers slightly higher velocities than others, reaching a maximum of 0.73 m/s at 4 p.m. (Table 7, Figure 6).

Table 7.
The average wind speed (V) over the summer in-situ measurement period.
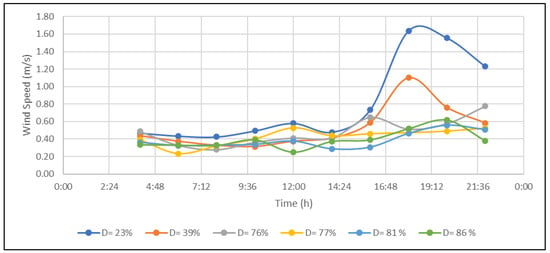
Figure 6.
Evolution of the average wind speed (V) over the summer in-situ measurement period.
Transitioning to late afternoon and evening, between 4–10 p.m., a more disturbed pattern occurs, with varied and dispersed speeds. Densities 23% and 39% observe higher values than other densities in this phase. The absolute maximum velocity of 1.64 m/s is reached by density 23% at 6 p.m. Overall, while most of the daylight hours see stable, low air velocities across densities, disturbances increase in the evening periods during the measured summer days. Density 23% records the highest speeds both during the calm early periods and the fluctuating later phase.
3.3. The Variability of Relative Humidity against the Backdrop of Fluctuating Urban Density
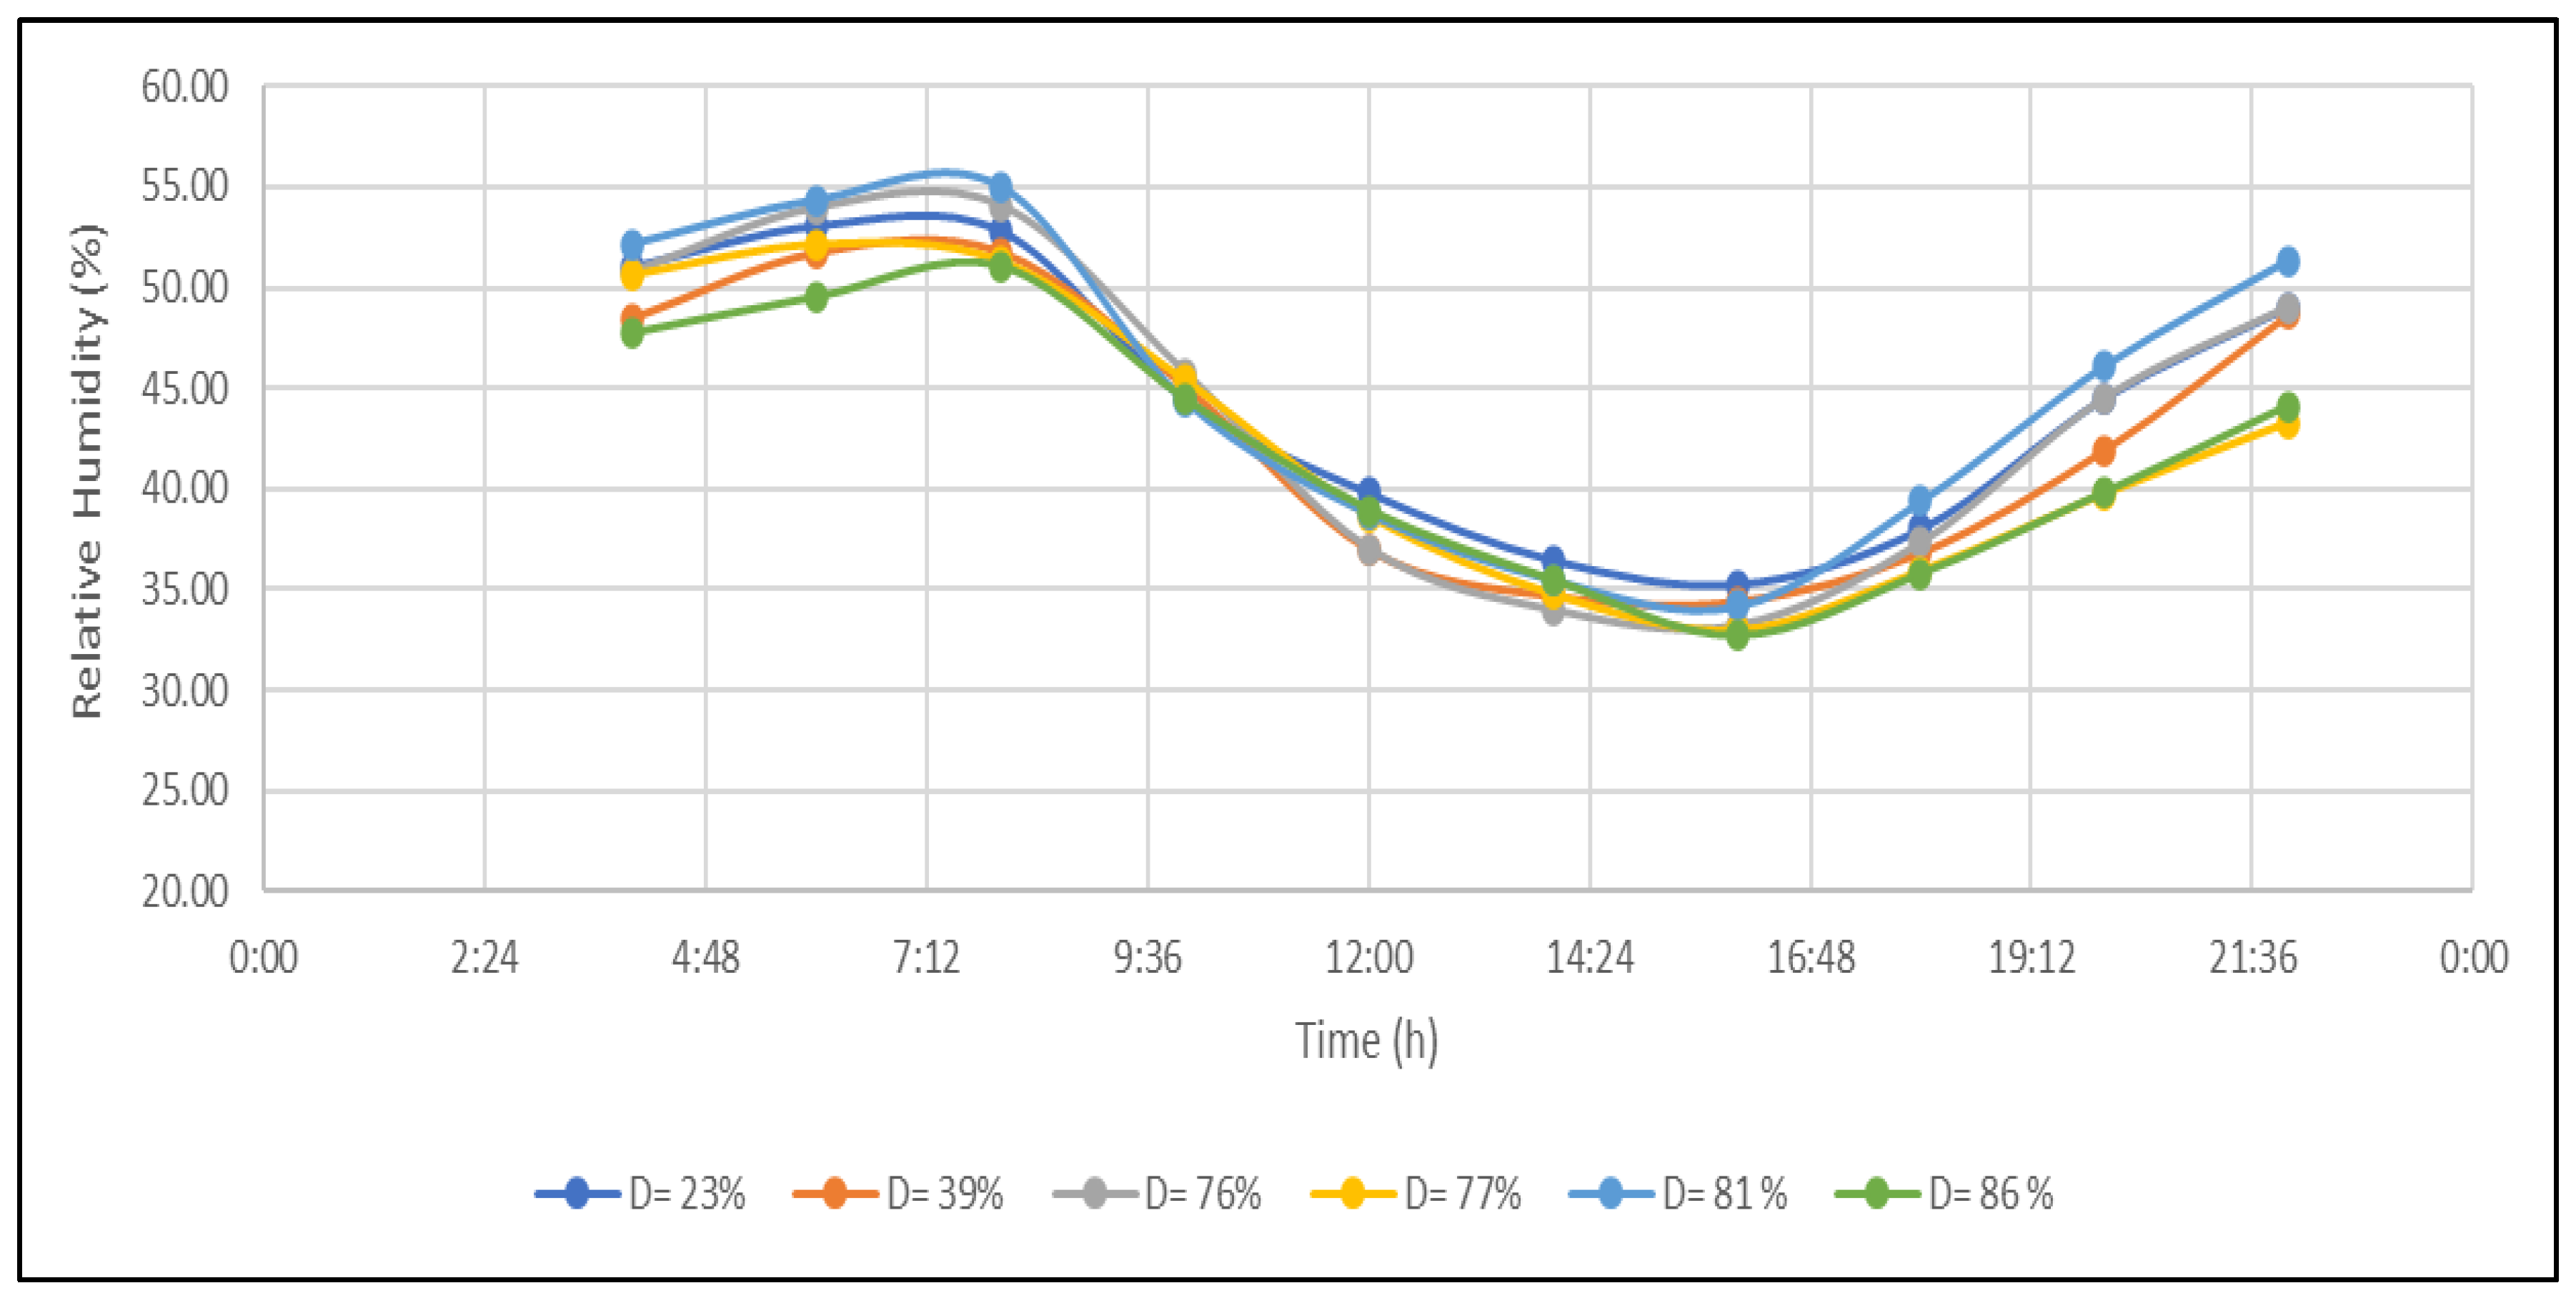
The evolution of relative humidity over the measured winter days shows similar trends across all densities, with some key differences in maximum and minimum values. Specifically, humidity levels increase gradually from morning, reaching peak values around 8 a.m. They then decrease to minimum values at around 4 p.m., before rising again overnight to secondary maximums by 10 p.m. (Table 8, Figure 7).

Table 8.
The average relative humidity (RH) over the winter in-situ measurement period.
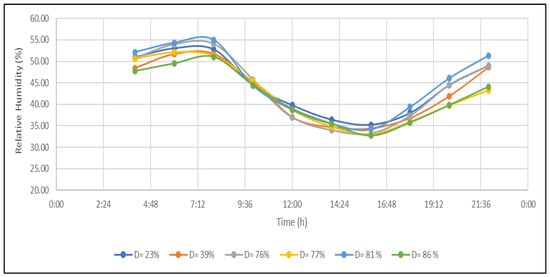
Figure 7.
Evolution of the average relative humidity (HR) over the winter in-situ measurement period.
In more detail, from 4–8 a.m., densities 76%, 77%, and 81% record higher maximum humidity levels than 39% and 86%, with 81% peaking at 54.96% by 8 a.m. Transitioning to mid-morning and afternoon, between 8 a.m.–4 p.m., all densities show a downward trend in humidity, reaching very close minimum values. The absolute minimum of 32.70% occurs at density 86% during this period.
Furthermore, from 4–10 p.m. humidity resumes its upward trajectory. Densities 23%, 39%, 76%, and 81% surpass 77% and 86% with higher peak values during this evening phase, although none exceed the initial 81% morning maximum. Overall, humidity evolution maintains a consistent daily cyclical pattern across winter densities, despite some variability in peak amplitudes.
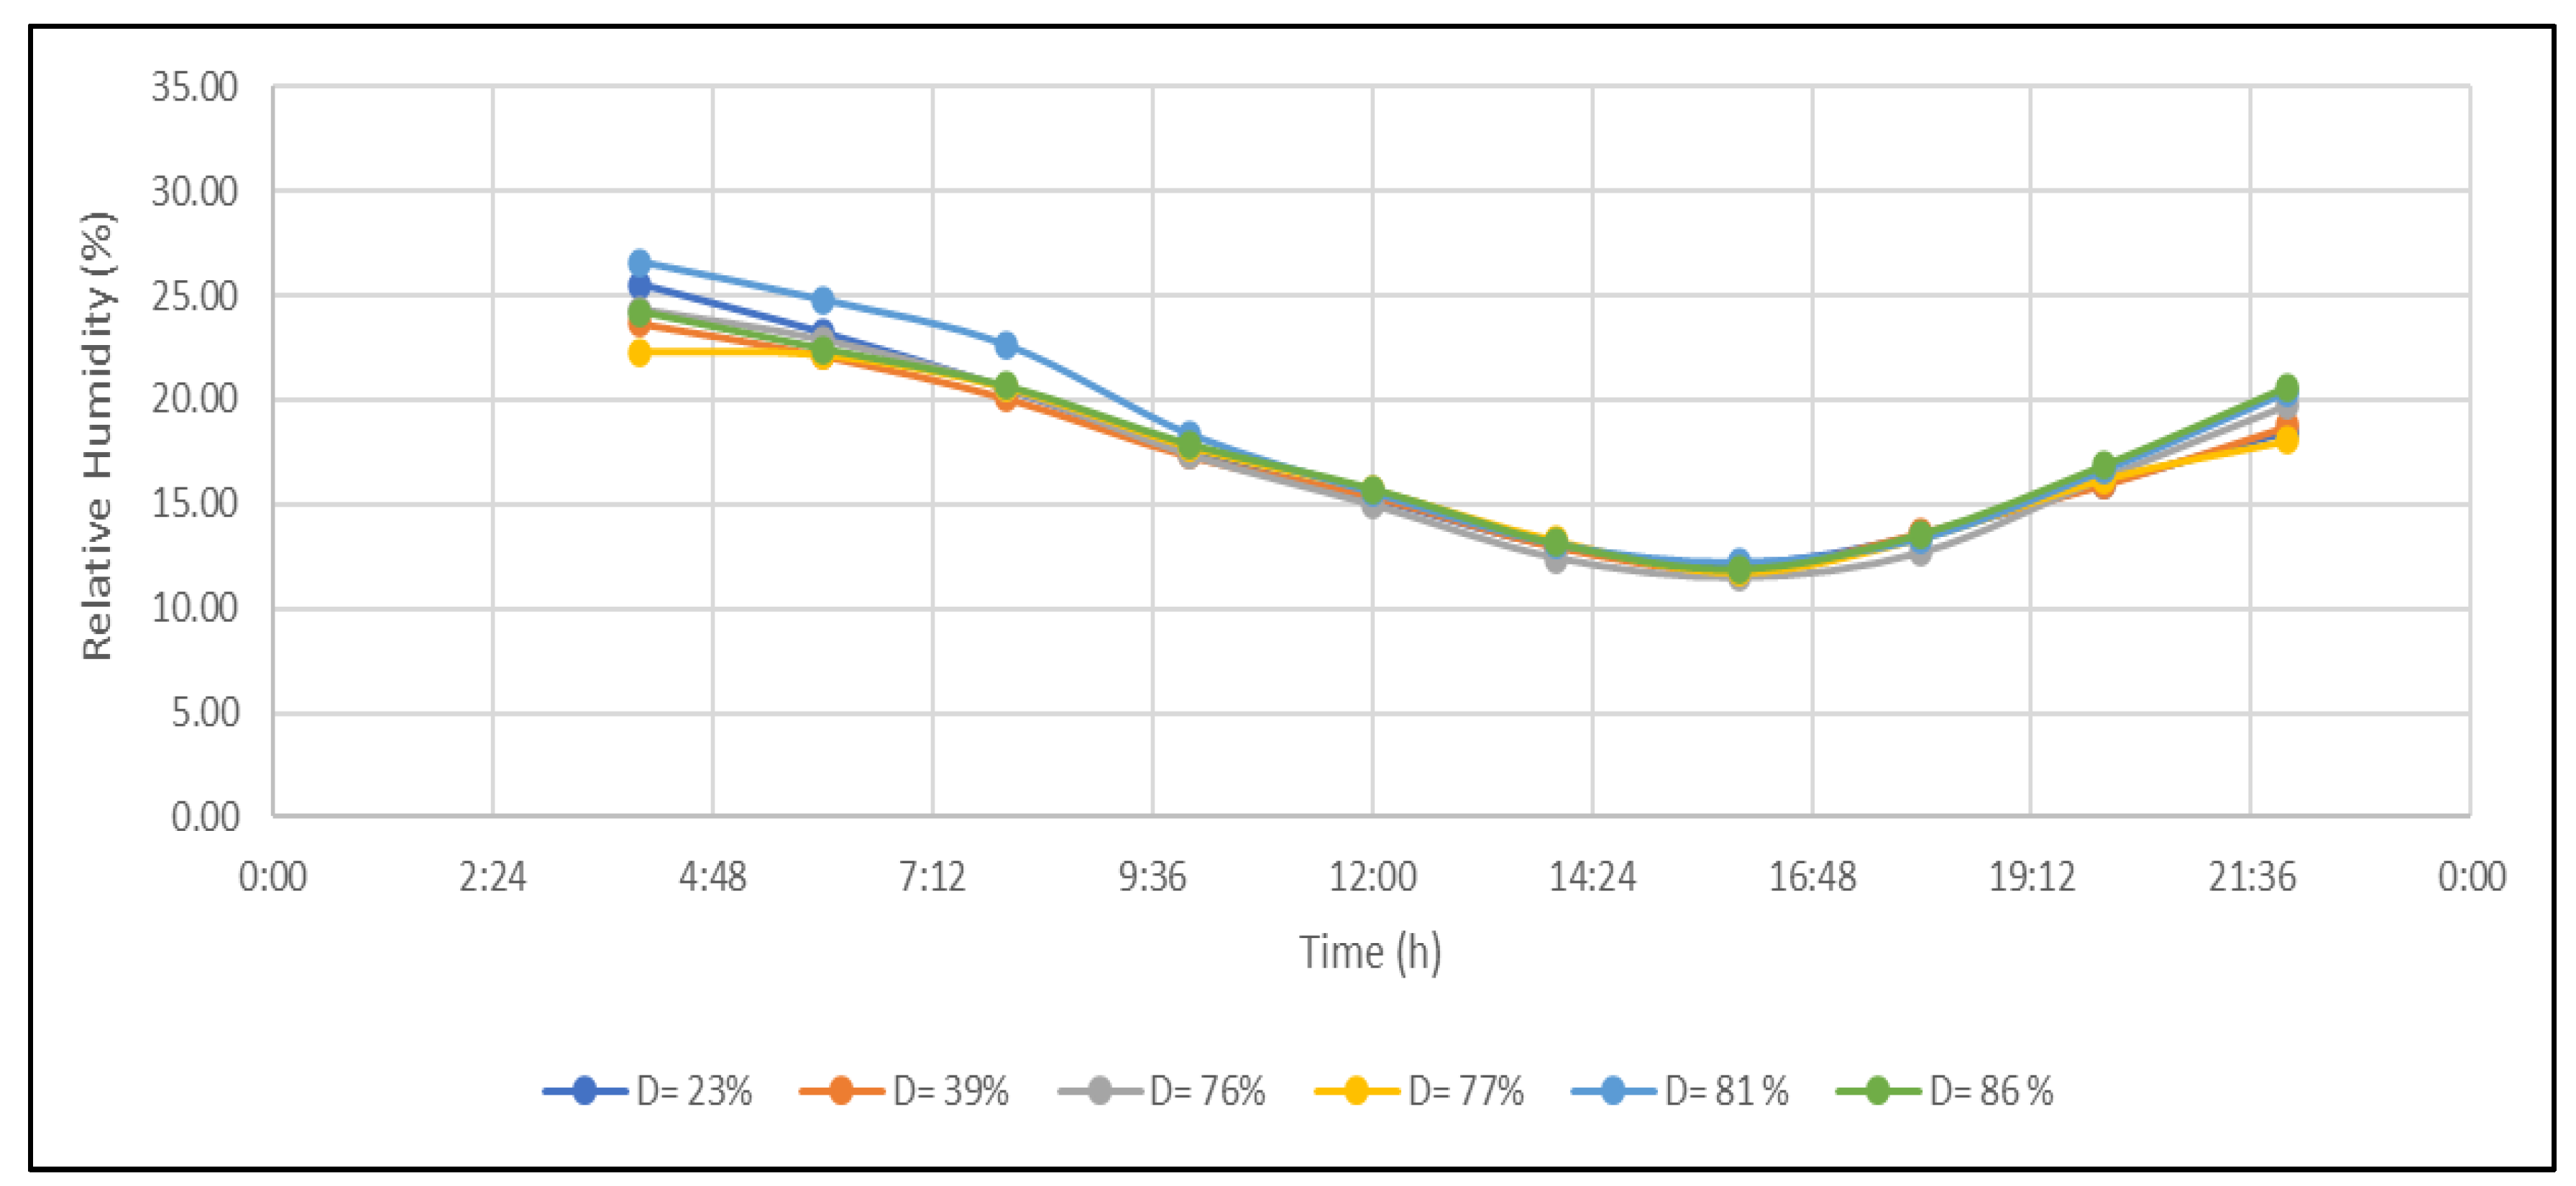
The evolution of relative humidity over the measured summer days indicates a consistent downward and then upward humidity trend pattern across all densities. Specifically, humidity levels are seen to decrease during the daylight hours, reaching minimum values at around 4 p.m. for all densities (Table 9, Figure 8).

Table 9.
The average relative humidity (HR) over the summer in-situ measurement period.
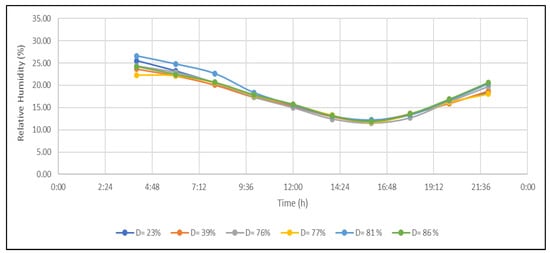
Figure 8.
Evolution of the average relative humidity (HR) over the summer in-situ measurement period.
In particular, from 4 a.m.–4 p.m., the downward trend is similar across densities, with very close, low values recorded. Density 76% registers the absolute minimum humidity level of 11.46% during this period. Transitioning to late afternoon and evening from 4–10 p.m., humidity subsequently resumes an increasing trajectory across densities, still maintaining very close alignment in the trends. Density 86% observes the highest humidity values in this phase, peaking at 20.62%.
Overall, the humidity evolution over summer days follows synchronized downward and upward phases among all densities. Minimum levels are reached in the afternoon around 4 p.m., and maximum values overnight around 10 p.m., despite small inter-density variability.
3.4. The Sensitivity of Effective Temperature to Urban Density Alteration
The evaluation of outdoor thermal comfort through the ET index in this experiment shows the existence of five comfort zones during both summer and winter (Hot—Warm—Cool—Cold—Very Cold). However, there is an absence of two comfort zones (Comfort—Fresh).
3.4.1. The First Day
The Hot zone records maximum values of 100% in densities 39% and 77%, and average values between 90–93% in densities 23%, 76%, and 81%. Meanwhile, density 86% shows the minimum value at 87%. Transitioning to the Warm zone, a maximum value of 13% occurs in density 86%, while average values of 7–10% are seen in densities 23%, 76%, and 81%. However, the Warm zone registers 0% in densities 39% and 77% (Table 10).

Table 10.
The ET index for the OTC evaluation in percentage for the first day.
Furthermore, the Cool zone reaches a peak value of 67% in density 39%, and shows average values ranging from 50–60% in densities 23%, 76%, 77%, and 81%. Yet it drops to a minimum of 47% in density 86%. Additionally, the Cold zone observes a maximum value of 53% in density 86%, and average ratings between 43–50% in densities 76%, 77%, and 81%. In contrast, minimums emerge in densities 23% and 39% at 33–37%. Finally, Very Cold peaks at 3% solely in densities 23% and 76%, while recording 0% across all other densities.
Overall, zone distribution patterns demonstrate differences across densities, with optimal peak values occurring at various densities for each zone.
3.4.2. The Second Day
The Hot zone records a sole maximum value of 100% in density 77%, and average ratings of 90% in densities 23%, 39%, 76%, and 86%. The minimum value of 80% occurs in density 81%. Transitioning to the Warm zone, a maximum of 20% emerges in density 81%, and average values of 10% are seen in densities 23%, 39%, 76%, and 86%. However, the Warm zone drops to 0% in density 77% (Table 11).

Table 11.
The ET index for the OTC evaluation in percentage for the second day.
Furthermore, the Cool zone peaks at 60% in density 39%, and shows average values around 53–57% in densities 81% and 86%. Yet it reaches minimums between 40–47% in densities 23%, 76%, and 77%. Additionally, the Cold zone hits a maximum of 53% in density 77%, and sees an average rating of 40% in density 23%. However, it drops to minimums between 33–37% in densities 39%, 76%, 81%, and 86%.
Finally, the Very Cold zone peaks at 23% solely in density 76%, and plateaus at average values of 13% in densities 23% and 86%, and 7–10% in densities 39% and 81%. A minimum of 0% occurs in density 77%. Overall, the zone distributions demonstrate marked variability across densities, with each density achieving optimal peaks for certain zones.
3.4.3. The Third Day
The Hot zone hits maximum values of 100% in densities 76% and 77%, while plateauing at 90% across other densities. Transitioning to the Warm zone, peak values of 10% occur in densities 23%, 39%, 81%, and 86%. However, the Warm zone drops to 0% in densities 76% and 77% (Table 12).

Table 12.
The ET index for the OTC evaluation in percentage for the third day.
Furthermore, the Cool zone observes a maximum of 53% in density 86%, and average values between 40–47% emerge in densities 39%, 76%, 77%, and 81%. Yet it reaches a minimum of 33% in density 23%. Additionally, the Cold zone peaks at 67% in density 23%, and averages between 53–60% in densities 39%, 77%, and 81%. In contrast, minimums of 43% and 47% show up in densities 76% and 86%.
Finally, Very Cold peaks solely in density 76% at 13%, while recording 0% across all other densities. In summary, zone distributions vary markedly based on density, with each density achieving maximum values for certain zones.
The results obtained during the three days of the summer period show that all urban densities record very high values in the hot zone, especially the medium densities. This is justified by the marked extreme temperatures in the arid and hot climate. However, a slight decrease is observed in dense fabrics, especially in density 81%. This is attributed to the shading provided during sunny hours as well as the presence of other variables, such as the existence of greenery.
The results obtained during the three days of the winter period show a remarkable variation: Firstly, dense fabrics and loose fabrics, especially density 39%, are cooler than fabrics with medium density (76% and 77%). This presents the balance offered by these two types of density, namely:
Dense fabrics (81% and 86%) have shown the ability to protect open space from cold winds; however, they have recorded a weakness in storing thermal energy from morning sunlight.
Density 39% has shown a great capacity for storing solar energy; however, it exhibits a slight weakness in protecting open space against cold winds. This observation is justified by the presence of other morphological and geometric factors in this collective neighborhood, such as the height of buildings and compactness.
Secondly, it is observed that loose fabrics, especially density 23%, as well as neighborhoods with medium density, are colder than dense fabrics. This is explained by the flow of cold winds. Additionally, they present a remarkable imbalance in the “sunlight/airflow” equation.
3.4.4. Holistic Reading of the Relation ET/Urban Form
The results of this study elucidated linkages between simulated Equivalent Temperature (ET) and manipulated urban density levels. Analyzing six density configurations revealed significant ET variation across summer and winter seasons. Our investigations indicate worsening thermal sensation with greater neighborhood enclosure. However, past an 81% density threshold, slight ET improvements occur—dense built-up structures provide shade lowering peak summer ET while also blocking cold winds raising minimum winter ET. In contrast, low build-up below 45% density remains prone to winter wind chill lowering ET.
Precisely delineating density thresholds for ideal year-round ET comfort proves challenging given such seasonal trade-offs. Optimizing this factor requires balancing cooler period solar access with sufficient ventilation to mitigate heat strains. This highlights the additional need to tune building heights and street canyon orientations that channel wind through tightly-packed urban zones. Adjusting morphology configurations in tandem with density modulation can help maintain ET within livable ranges annually despite expansion of extreme desert cities like Biskra.
The coupled modeling and field measurements provide vital guidelines that informed manipulation of density, porosity, and layout factors can sustain comfortable outdoor thermal parameters amid rapid development of arid built terrains.
3.5. The Sensitivity of the Equivalent Temperature Profile to Urban Density Change
The evaluation of outdoor thermal comfort through the TEK index in this experiment shows the existence of five comfort zones during summer and winter (Hot—Warm—Moderate Hazard—Cold—Very Cold). However, the comfort zone is notably absent.
3.5.1. The First Day
The Hot zone registers equal, symmetric values of 80% across all densities. Similarly, the Warm zone plateaus at equivalent ratings of 20% in all densities. Transitioning to the Moderate Hazard zone, a maximum emerges at 20% in density 81%, while average values between 10–17% occur in densities 39%, 76%, and 77%. However, minimums of 3% and 7% show up in densities 23% and 86%, respectively (Table 13).

Table 13.
The TEK index for the OTC evaluation in percentage for the first day.
Furthermore, the Cold zone peaks at 57% in density 86%, and hits average values around 50% in densities 23% and 39%. Yet it drops to minimums ranging from 33–40% in densities 76%, 77%, and 81%. Additionally, Very Cold peaks between 47–50% in densities 23%, 76%, and 77%, while plateauing at average values of 40% in densities 39% and 81%. However, it falls to a minimum of 37% in density 86%.
In summary, while Hot and Warm zones maintain symmetry across densities, distributions vary significantly amongst other zones, each one achieving distinct maximums and minimums at different densities.
3.5.2. The Second Day
The Hot zone hits maximum values of 80% in densities 23%, 76%, 81%, and 86%, while averaging 77% in density 77%. The sole minimum of 73% occurs in density 39%. Transitioning to the Warm zone, a single peak emerges at 27% in density 39%, and 23% surfaces on average in density 77%. Yet the Warm zone drops to minimum values across densities 23%, 76%, 81%, and 86% (Table 14).

Table 14.
The TEK index for the OTC evaluation in percentage for the second day.
Furthermore, the Moderate Hazard zone peaks solely at 3% in density 86%, while recording 0% among all other densities. Additionally, the Cold zone reaches dual maximum values of 57% in densities 81% and 86%, averaging between 50–53% in densities 23%, 39%, and 76%. However, a minimum of 43% occurs in density 77%.
Finally, Very Cold peaks at 50% and 57% in densities 76% and 77% respectively, averaging 47% in densities 23% and 39%. In contrast, density minimums of 43% and 40% arise in 81% and 86%. In summary, peak values emerge distinctly at different densities for each zone, leading to variability in hazard zone distributions.
3.5.3. The Third Day
The Hot zone hits dual maximum values of 100% in densities 76% and 77%, averaging 90% in densities 23% and 39%. However, minimums of 87% and 83% occur in densities 81% and 86%, respectively. Transitioning to the Warm zone, peaks of 13% and 17% arise in densities 81% and 86%, while plateauing at average values of 10% in densities 23% and 39%. In contrast, the Warm zone drops to 0% in densities 76% and 77% (Table 15).

Table 15.
The TEK index for the OTC evaluation in percentage for the third day.
Furthermore, the Moderate Hazard zone peaks solely at 3% in densities 76%, 77%, and 86%, recording 0% across all other densities. Additionally, the Cold zone reaches maximum values of 50–53% in densities 23% and 39%, respectively, averaging 47% in density 86%. Yet it drops to minimums between 40–43% in densities 76%, 77%, and 81%.
Finally, Very Cold peaks highly between 53–60% in densities 76%, 77%, and 81%, averaging 50% in densities 23% and 86%. A sole minimum occurs at 47% in density 39%. In summary, each hazard zone achieves distinct peak ratings at different densities, demonstrating asymmetry in zone distributions.
The results obtained during the three days of the summer period show that all urban densities record very high values in the hot zone, especially the medium densities. This is justified by the extreme temperatures prevalent in the arid and hot climate. However, a slight decrease is observed in dense fabrics, resulting from the shade they provide during sunny hours and the presence of other variables, such as greenery. A slight decrease was also observed in the density of 39%, manifested by the shading provided by this sample as well. This is due to the presence of other morphological factors, such as building height and compactness.
The results obtained during the three days of the winter period show a remarkable variation:
Firstly, dense fabrics are more moderate than loose fabrics, justified by their ability to protect open space from cold winds. However, they showed a slight weakness in storing thermal energy from morning sunlight.
Secondly, it is observed that loose fabrics, especially the density of 23%, as well as neighborhoods with medium density, are cooler than dense fabrics. This difference is attributed to the flow of cold winds. Additionally, they exhibit a noticeable imbalance in the “sunlight/air flow” equation.
3.5.4. Holistic Reading of the Relation TEK/Urban Form
The results of this investigation helped elucidate the relationship between outdoor Thermal Equivalent Temperature (TEK) levels and urban density. Across the six densities evaluated via simulation, we noted significant TEK variation between summer and winter seasons. Our analyses reveal deteriorating thermal sensation with increasing neighborhood enclosure. However, beyond 81% density, slight TEK recuperation occurs—dense, closely-packed structures provide shade, lowering summer TEK, while blocking cold winds, raising winter TEK. In contrast, lower densities under 45% remain vulnerable to winter wind chill, which lowers TEK.
Defining exact optimal density thresholds proves challenging amidst such thermal sensation trade-offs across seasons. The ideal density balance facilitates solar access in cooler periods while enabling ventilation to dissipate heat stress. This highlights the need to incorporate other factors, such as building heights and canyon orientation, that restore wind flow through dense builds. Adjusting such layout parameters alongside density can maintain TEK levels within comfortable habitability limits year-round despite expansion of desert cities such as Biskra.
4. Conclusions
This extensive study systematically evaluated the impacts of manipulating urban density parameters on outdoor thermal comfort and heat stress distribution in Biskra, a rapidly expanding desert city located in an extreme hot arid climate zone.
Through rigorous in-situ measurement campaigns conducted during peak summer and winter weeks, we captured high-resolution profiles of key comfort variables including air temperature, humidity, and wind velocity at targeted urban morphologies spanning detached low-rise suburban to compact high-rise centers. In total, 1080 metrological datapoints were compiled to enable advanced thermal comfort assessment.
We subsequently leveraged these granular real-world observations as inputs for numerical modelling of the prevalent ET and TEK thermal stress indices via the calibrated OuTTherma computational tool. Index ratings were mapped across low, medium, and high-density grades, and analyzed for sensitivity to density changes between 23% (social housing) to 86% (self-constructed fabric) extremes through systematic OVAT exploration.
Key conclusions are the following:
- Marked deterioration in outdoor summertime thermal comfort was correlated with increasing urban density, validating our core hypothesis regarding density correlations. ET hot zone prevalence escalated from 87% to 100% between lowest and highest densities amidst the extreme heat. However, slight comfort improvements began emerging beyond 81% density due to enhanced shading.
- Wintertime (cold period) thermal patterns exhibited more complex nonlinearity, unlike the summer trends. Beyond sharing heightened very cold prevalence, both lower (39%) and higher (81%, 86%) densities demonstrated superior ambient warmth over transitional mid-range densities. This indicates urban geometry also strongly mediates cold wind flows.
- Optimal wintertime warmth manifests through balancing sunlight absorption capacity with wind blocking protection. While higher densities better prevented icy winds, weaker sunlight penetration produced colder daytime conditions. Conversely, lower suburban densities allowed greater sunlight infiltration but struggled to slow cold air currents.
- Precise density thresholds are difficult to define conclusively, given the diversity of typologies studied. However, indicative ranges tied to thermal hazards have been identified. Densities below 45% appear vulnerable to cold winds in winter, while those over 78% restrict ventilation excessively in summer. Densities between 50% and 75% deliver more balanced “sunlight-airflow” equations across seasons.
In summary, this investigation thoroughly quantified urban density impacts on human thermal comfort through extensive field evidence gathering and stress index modelling. It delivers vital insights into bioclimatic design tradeoffs in hot arid cities, charting density adaptation pathways essential for future climate resilience planning. We next aim to correlate additional geometric metrics, such as building heights and urban canyon orientations, with human thermal comfort to derive enhanced development guidelines.
Author Contributions
Conceptualization, A.E.B. and A.A.; methodology, A.E.B. and A.A.; software, A.E.B. and M.A.; validation, A.E.B. and S.A.; formal analysis, A.E.B., E.N. and A.A.; investigation, A.E.B., B.A. and A.A.; resources, A.E.B. and A.A.; data curation, A.E.B. and A.A.; writing—original draft preparation, A.E.B. and A.A.; writing—review and editing, A.E.B., A.M. and A.A.; visualization, A.E.B. and L.T.D.; supervision, A.A. and S.B.; project administration, A.E.B. and A.A.; funding acquisition, L.T.D. and A.G. All authors have read and agreed to the published version of the manuscript.
Funding
This research has been funded by Scientific Research Deanship at University of Ha’il—Saudi Arabia through project number RG-23 018.
Data Availability Statement
Data are available upon request.
Conflicts of Interest
The authors declare no conflicts of interest.
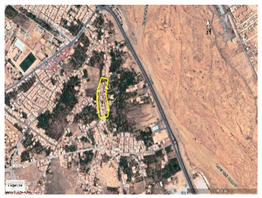
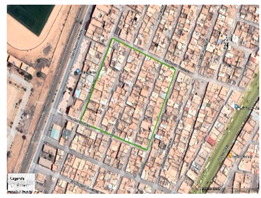
Appendix A. The Selected Measurement Points for the In-Situ Measurement
| The Sample | The Three Measurement Points |
| Site 01: | 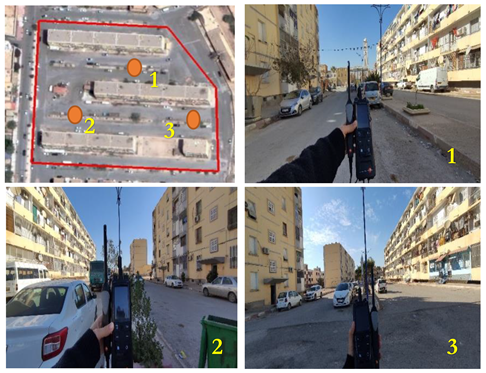 |
| Site 02: | 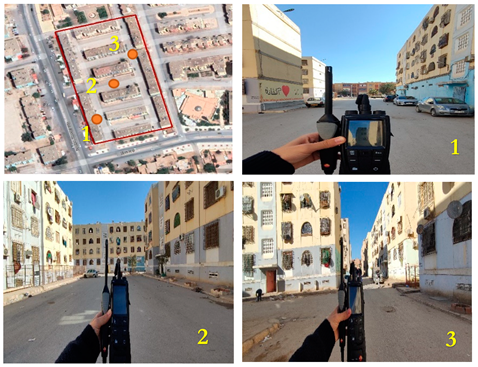 |
| Site 03: | 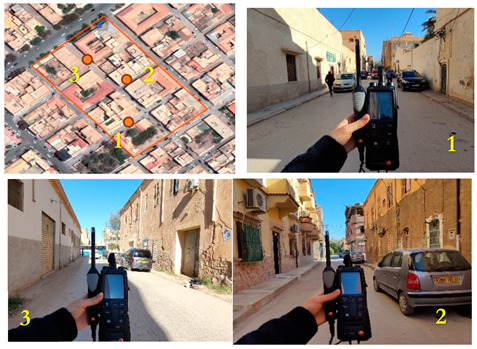 |
| Site 04: | 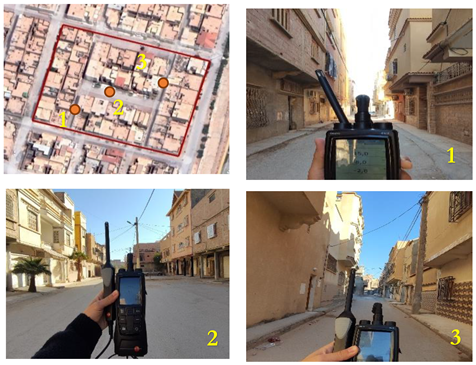 |
| Site 05: | 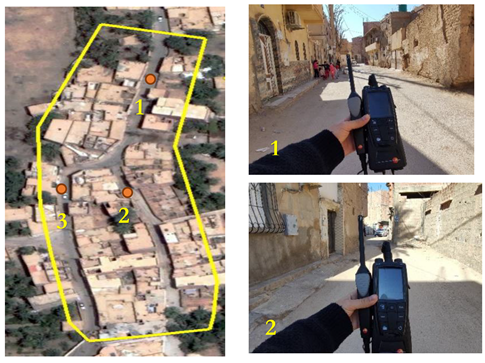 |
| Site 06: | 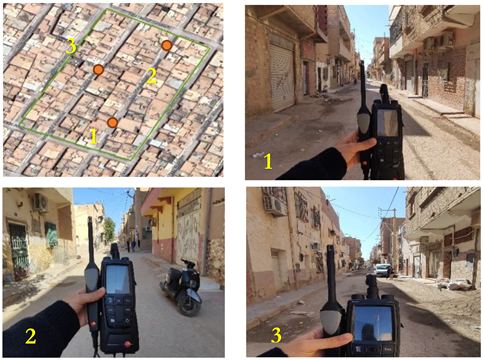 |
References
- Irfeey, A.M.M.; Chau, H.-W.; Sumaiya, M.M.F.; Wai, C.Y.; Muttil, N.; Jamei, E. Sustainable Mitigation Strategies for Urban Heat Island Effects in Urban Areas. Sustainability 2023, 15, 10767. [Google Scholar] [CrossRef]
- Oğur, A. Uneven Resilience of Urban and Rural Areas to Heatwaves. J. Des. Resil. Archit. Plan. 2023, 4, 78–94. [Google Scholar]
- Winklmayr, C.; Matthies-Wiesler, F.; Muthers, S.; Buchien, S.; Kuch, B.; An der Heiden, M.; Mücke, H.G. Heat in Germany: Health Risks and Preventive Measures. J. Health Monit. Mücke 2023, 8 (Suppl. S4), 3. [Google Scholar]
- Chambers, J. Global and Cross-Country Analysis of Exposure of Vulnerable Populations to Heatwaves from 1980 to 2018. Clim. Chang. 2020, 163, 539–558. [Google Scholar] [CrossRef]
- Njungwi, N.W. Assessing the Impact of Rapid Urbanization and Associated Land Use Land Cover Variability on the Micro Climatic Conditions of Busan Metropolitan Area: The Urban Heat Island Effect. Ph.D. Thesis, Pukyong National University, Busan, Republic of Korea, 2021. [Google Scholar]
- Karimi, A.; Pir, M.; García-Martínez, A.; Moreno-Rangel, D.; Gachkar, D.; Gachkar, S. New Developments and Future Challenges in Reducing and Controlling Heat Island Effect in Urban Areas. J. Environ. Gachkar Dev. Sustain. 2023, 25, 10485–10531. [Google Scholar] [CrossRef]
- Matallah, M.E.; Atef, A.; Shady, A. Spatiotemporal Thermal Comfort Assessment within Multi-Configurations of an Agricultural Oasis Settlements in Arid Climate; Sustainable Building Design Lab, Univeristy of Liege: Liege, Belgium, 2023. [Google Scholar]
- Matallah, M.E.; Djamel, A.; Atef, A.; Shady, A. Assessment of the Outdoor Thermal Comfort in Oases Settlements. Atmosphere 2020, 11, 185. [Google Scholar] [CrossRef]
- Ahriz, A.; Fezzai, S.; Mady, A.A. Predicting the Limits of the Oasis Effect as a Cooling Phenomenon in Hot Deserts. J. Desert 2019, 24, 255–266. [Google Scholar]
- Obe, O.B.; Tobi, E.; Gerald, M. Assessing Heat Risk in a Sub-Saharan African Humid City, Lagos, Nigeria, Using Numerical Modelling and Open-Source Geospatial Socio-Demographic Datasets. J. City Mills Environ. Interact. 2023, 20, 100128. [Google Scholar]
- Sharma, M.; Alam, S.; Narendra, M.; Kant, S. Occupational Heat Stress under High-Heat Furnace Work Environments—A Comprehensive Review on Developing Countries. J. Therm. Eng. 2021, 7 (Suppl. S14), 2068–2092. [Google Scholar] [CrossRef]
- Winkler, H.; Lawrence, J. Human Physiological Limitations to Long-Term Spaceflight and Living in Space. Aerosp. Med. Hum. Perform. 2023, 94, 444–456. [Google Scholar] [CrossRef]
- Damyanovic, D.; Anna, G.; Karl, G.; Florian, G.; Reinwald, F. Cool Public Spaces for the Cities: A Climate-Fit Approach to the Urban Design of Public Streetscapes and Squares–to Climate-Responsive Cities. In Research Handbook on Urban Design; Edward Elgar Publishing: Cheltenham, UK, 2024; pp. 331–348. [Google Scholar]
- Perić, A.; Yingying, J.; Sacha, M.; Liana, R. Green Cities: Utopia or Reality? Evidence from Zurich, Switzerland. Sustainability 2023, 15, 12079. [Google Scholar] [CrossRef]
- Haifler, Y.T.; Fisher-Gewirtzman, D. Urban Well-Being in Dense Cities. In Proceedings of the 38th eCAADe, Online, 16–17 September 2020; The Institute of Architecture, Technische Universität: Berlin, Germany, 2020. [Google Scholar]
- Hsu, A.; Glenn, S.; Tirthankar, C.; Diego, M.; Manya, D. Disproportionate Exposure to Urban Heat Island Intensity across Major Us Cities. J. Nat. Commun. 2021, 12, 2721. [Google Scholar] [CrossRef]
- Fineschi, S.; Loreto, F. A Survey of Multiple Interactions between Plants and the Urban Environment. Front. For. Loreto Glob. Chang. 2020, 3, 30. [Google Scholar] [CrossRef]
- Matallah, M.E.; Atef, A.; Shady, A. Quantification of the Outdoor Thermal Comfort Process: Simulation & Calculation Data; Sustainable Building Design Lab: Liege, Belgium, 2020. [Google Scholar]
- Ahriz, A.; Zemmouri, N.; Fezzai, S. Ksour of the Sahara Desert as a Great Lesson of Sustainable Urban Design in Hot Desert Oases. Int. J. Adv. Sci. Res. Eng. (IJASRE) 2017, 3, 109–118. [Google Scholar]
- Ji, H.; Peng, Y.; Ding, W. A Quantitative Study of Geometric Characteristics of Urban Space Based on the Correlation with Microclimate. Sustainability 2019, 11, 4951. [Google Scholar] [CrossRef]
- Mauree, D.; Naboni, E.; Coccolo, S.; Dasun Perera, A.T.; Nik, V.T.; Scartezzini, J.-L. A Review of Assessment Methods for the Urban Environment and Its Energy Sustainability to Guarantee Climate Adaptation of Future Cities. Renew. Sustain. Energy Rev. 2019, 112, 733–746. [Google Scholar] [CrossRef]
- Muniz-Gäal, L.P.; Cotrim Pezzuto, C.; de Carvalho, M.F.H.; Moreira Mota, L.T. Urban Geometry and the Microclimate of Street Canyons in Tropical Climate. Build. Environ. 2020, 169, 106547. [Google Scholar] [CrossRef]
- Ma, X.; Leung, T.M.; Chau, C.K.; Yung, E.H.K. Analyzing the Influence of Urban Morphological Features on Pedestrian Thermal Comfort. Urban Clim. 2022, 44, 101192. [Google Scholar] [CrossRef]
- Kumar, P.; Sharma, A. Study on Importance, Procedure, and Scope of Outdoor Thermal Comfort—A Review. Sustain. Cities Soc. 2020, 61, 102297. [Google Scholar] [CrossRef]
- Ahriz, A.; Mesloub, A.; Djeffal, L.; Alsolami, B.M.; Ghosh, A.; Abdelhafez, M.H.H. The Use of Double-Skin Façades to Improve the Energy Consumption of High-Rise Office Buildings in a Mediterranean Climate (Csa). Sustainability 2022, 14, 6004. [Google Scholar] [CrossRef]
- Ahriz, A.; Mesloub, A.; Elkhayat, K.; Alghaseb, M.A.; Abdelhafez, M.H.; Ghosh, A. Development of a Mosque Design for a Hot, Dry Climate Based on a Holistic Bioclimatic Vision. Sustainability 2021, 13, 6254. [Google Scholar] [CrossRef]
- Qaoud, R.; Boumerzoug, A.; Bouthaina, S.; Djamal, A.; Shady, A. Assessing the Influence of Neighborhood Urban Form on Outdoor Thermal Conditions in the Hot Dry City of Biskra, Algeria. Ain Shams Eng. J. 2023, 14, 102525. [Google Scholar] [CrossRef]
- WeatherSpark. Climate and Average Weather Year Round in Biskra. Available online: https://weatherspark.com/y/51506/Average-Weather-in-Biskra-Algeria-Year-Round (accessed on 12 December 2023).
- TESTO. Testo 480—Digital Temperature, Humidity and Air Flow Meter. Available online: https://portal.testo.com/en-TH/testo-480/p/0563-4800 (accessed on 12 December 2023).
- Ahriz, A. Outtherma Version 1.0. [Open-Source Web App]. University of Tebessa. 2019. Available online: https://docs.google.com/spreadsheets/d/1Lyk0aB2ziauHobbFZweepsR-RH2SWMMlCQIUxuQ40j4/edit?usp=sharing (accessed on 12 December 2023).
Disclaimer/Publisher’s Note: The statements, opinions and data contained in all publications are solely those of the individual author(s) and contributor(s) and not of MDPI and/or the editor(s). MDPI and/or the editor(s) disclaim responsibility for any injury to people or property resulting from any ideas, methods, instructions or products referred to in the content. |
© 2024 by the authors. Licensee MDPI, Basel, Switzerland. This article is an open access article distributed under the terms and conditions of the Creative Commons Attribution (CC BY) license (https://creativecommons.org/licenses/by/4.0/).

