
Predicting the Displacement Variation of Rehabilitated Foundation of Onshore Wind Turbines Using Machine Learning Models

 , ,
, ,
Abstract
1. Introduction
2. Engineering Example Analysis
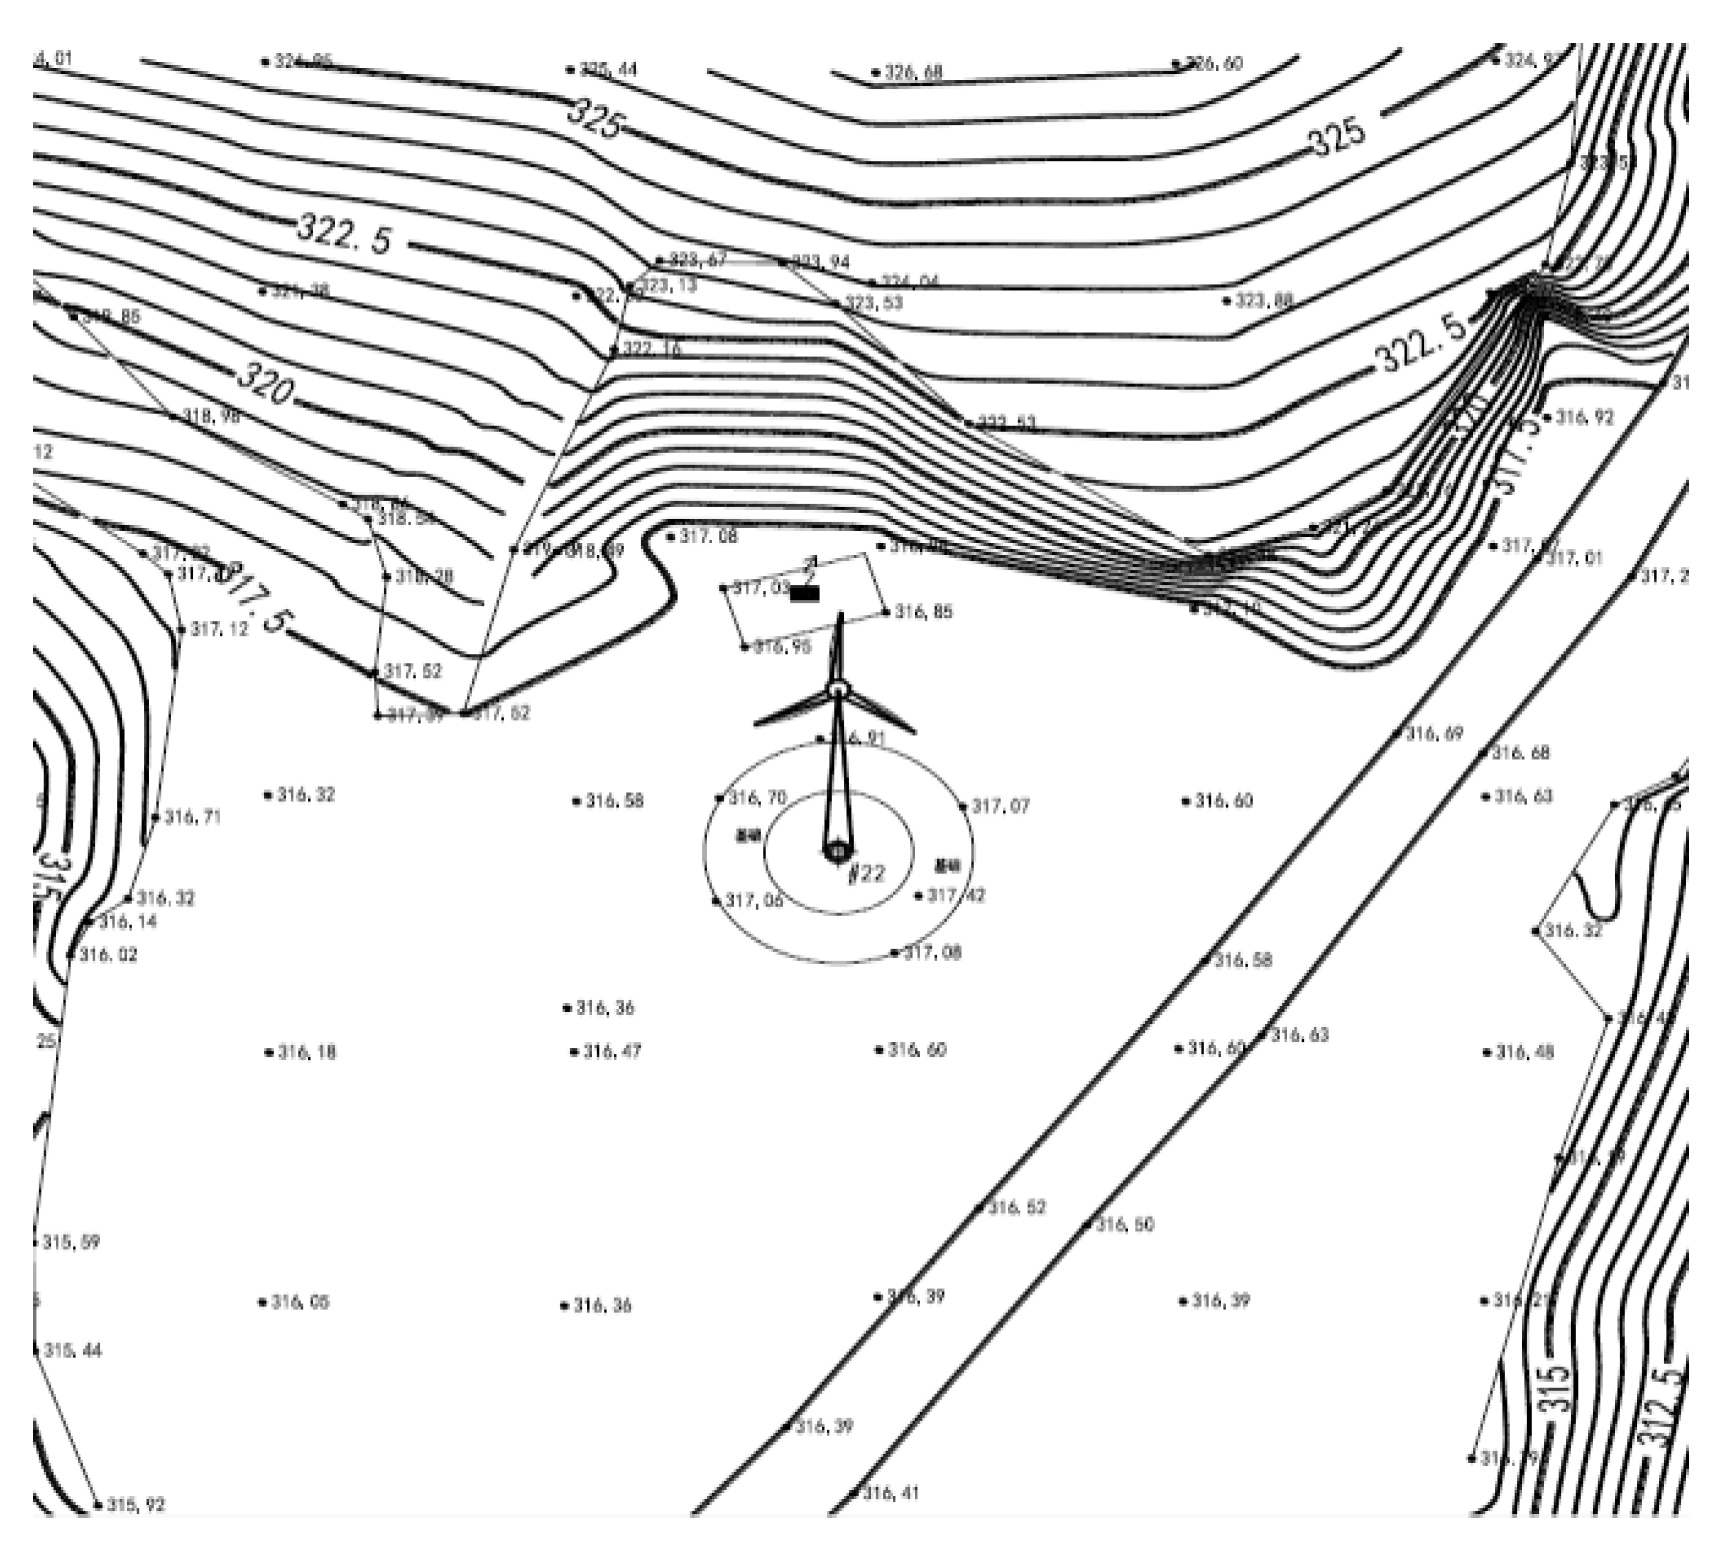
2.1. Project Profile
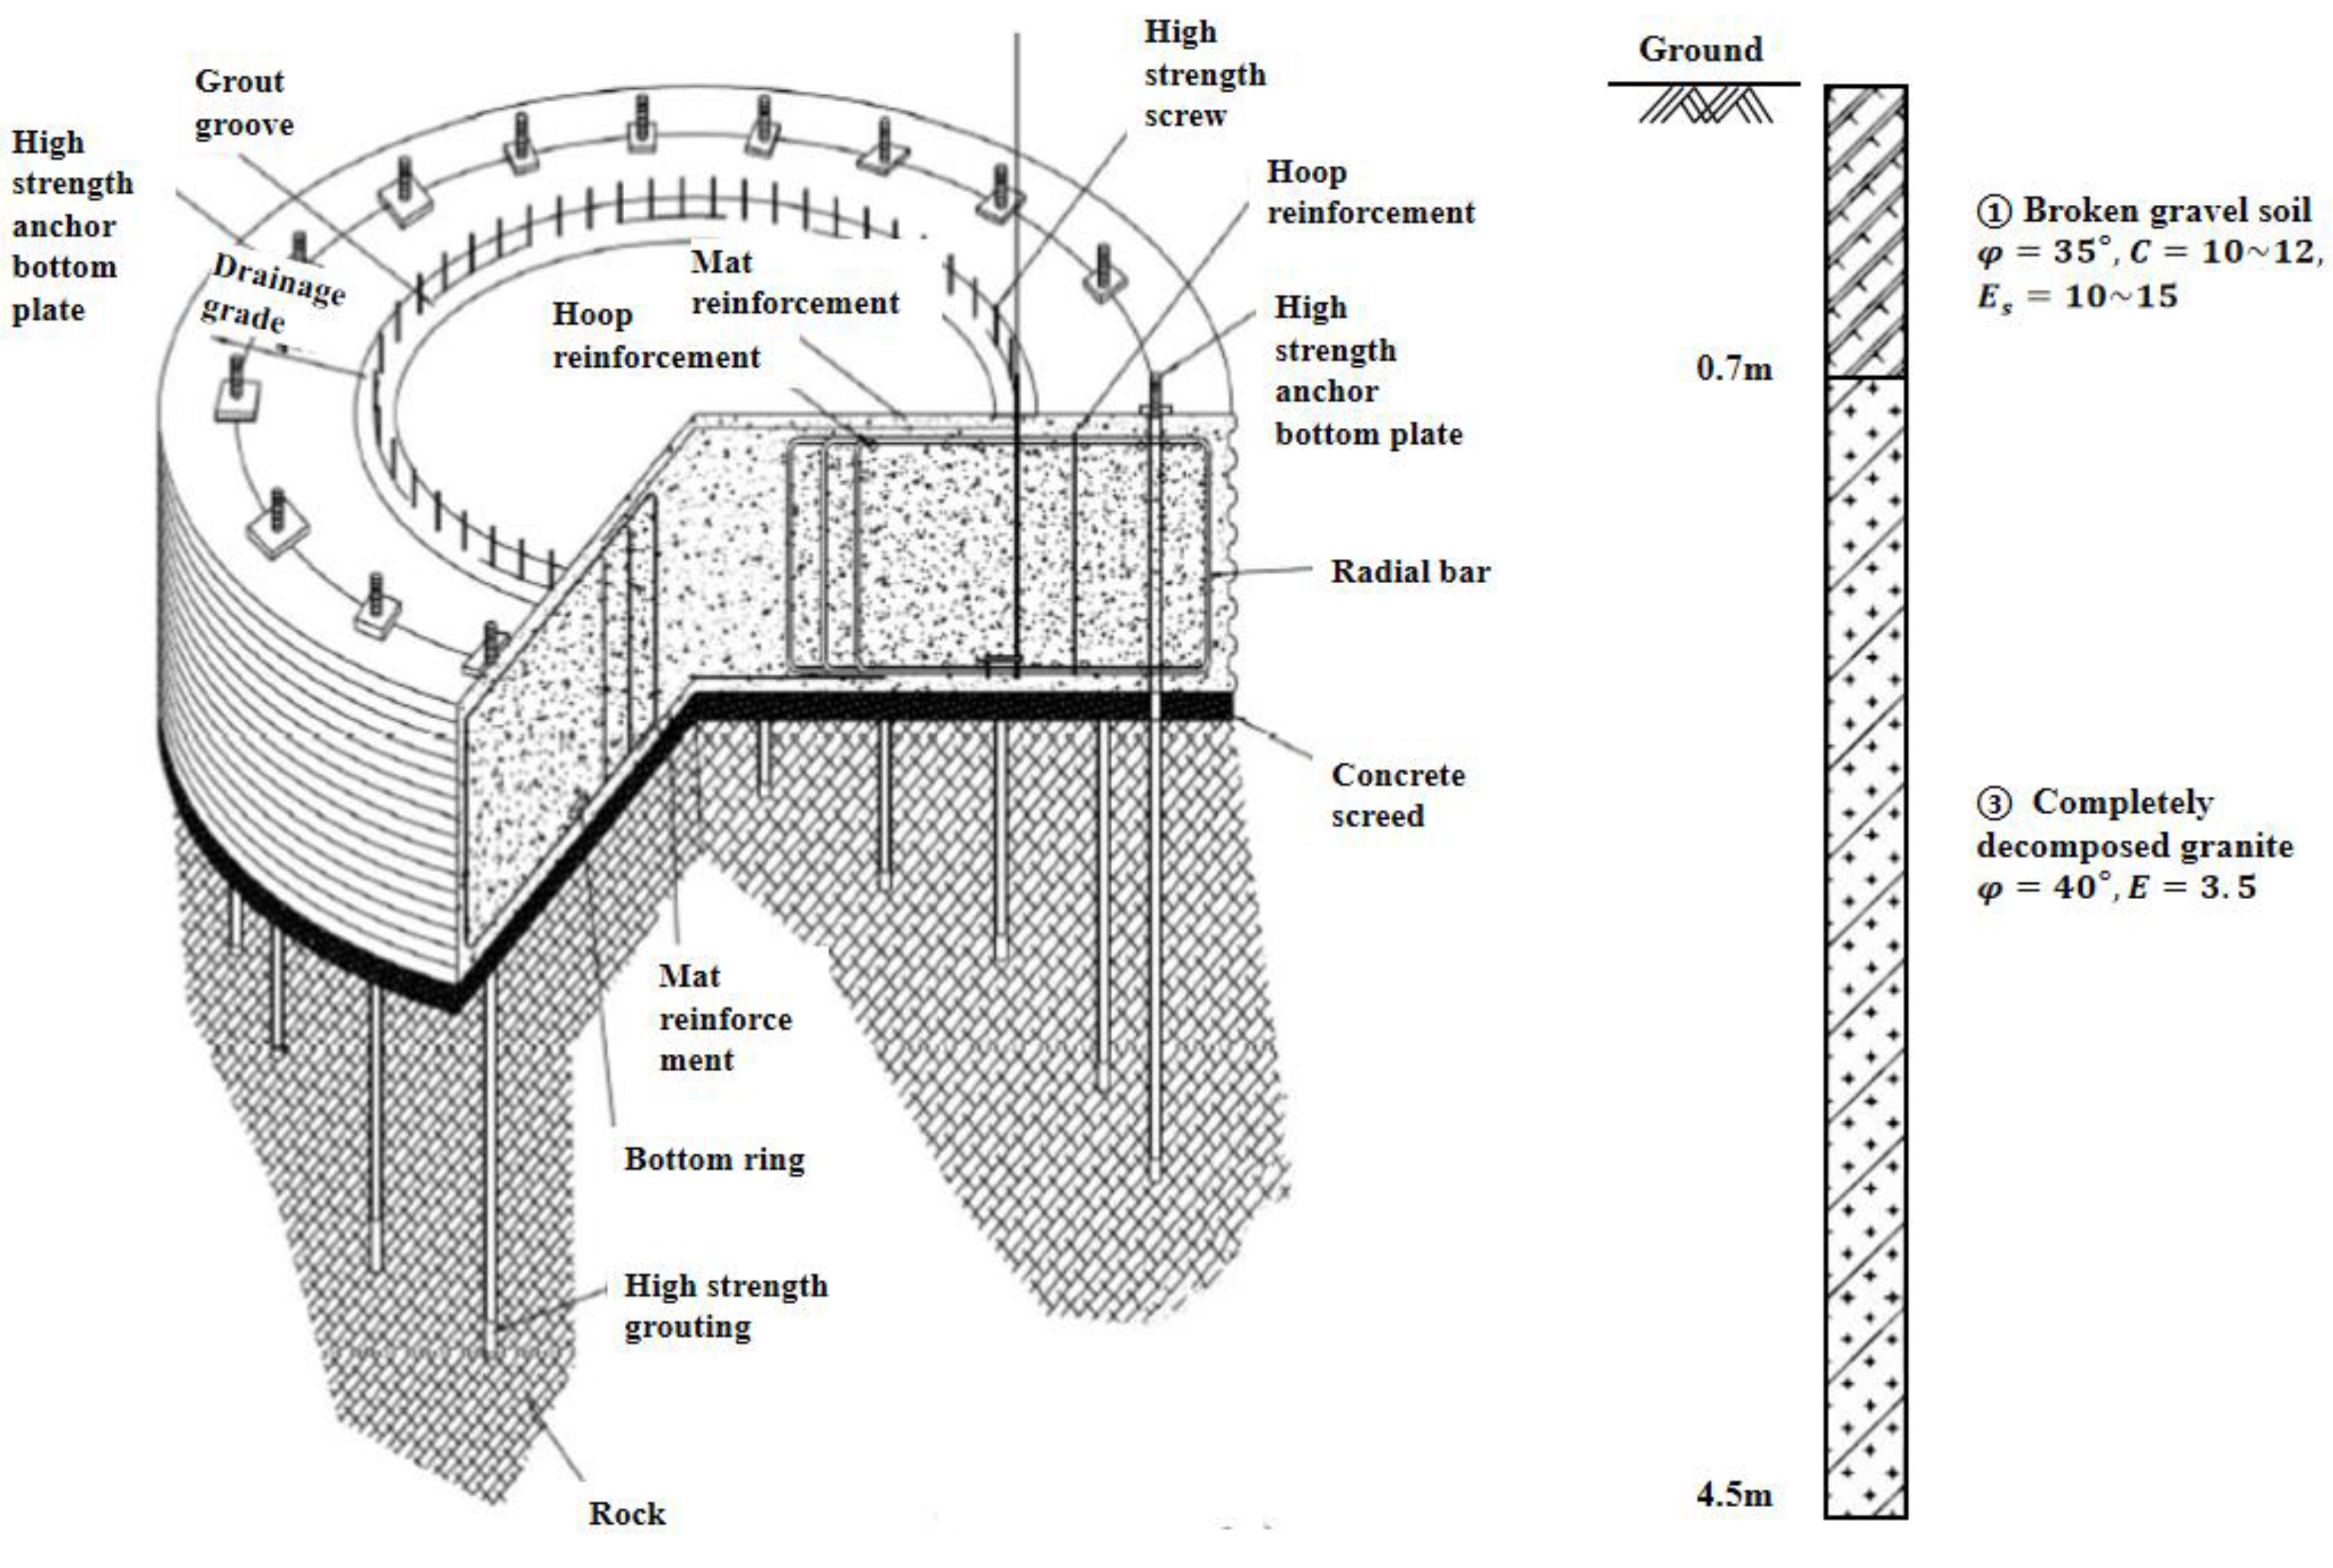
2.2. Rehabilitation Operations
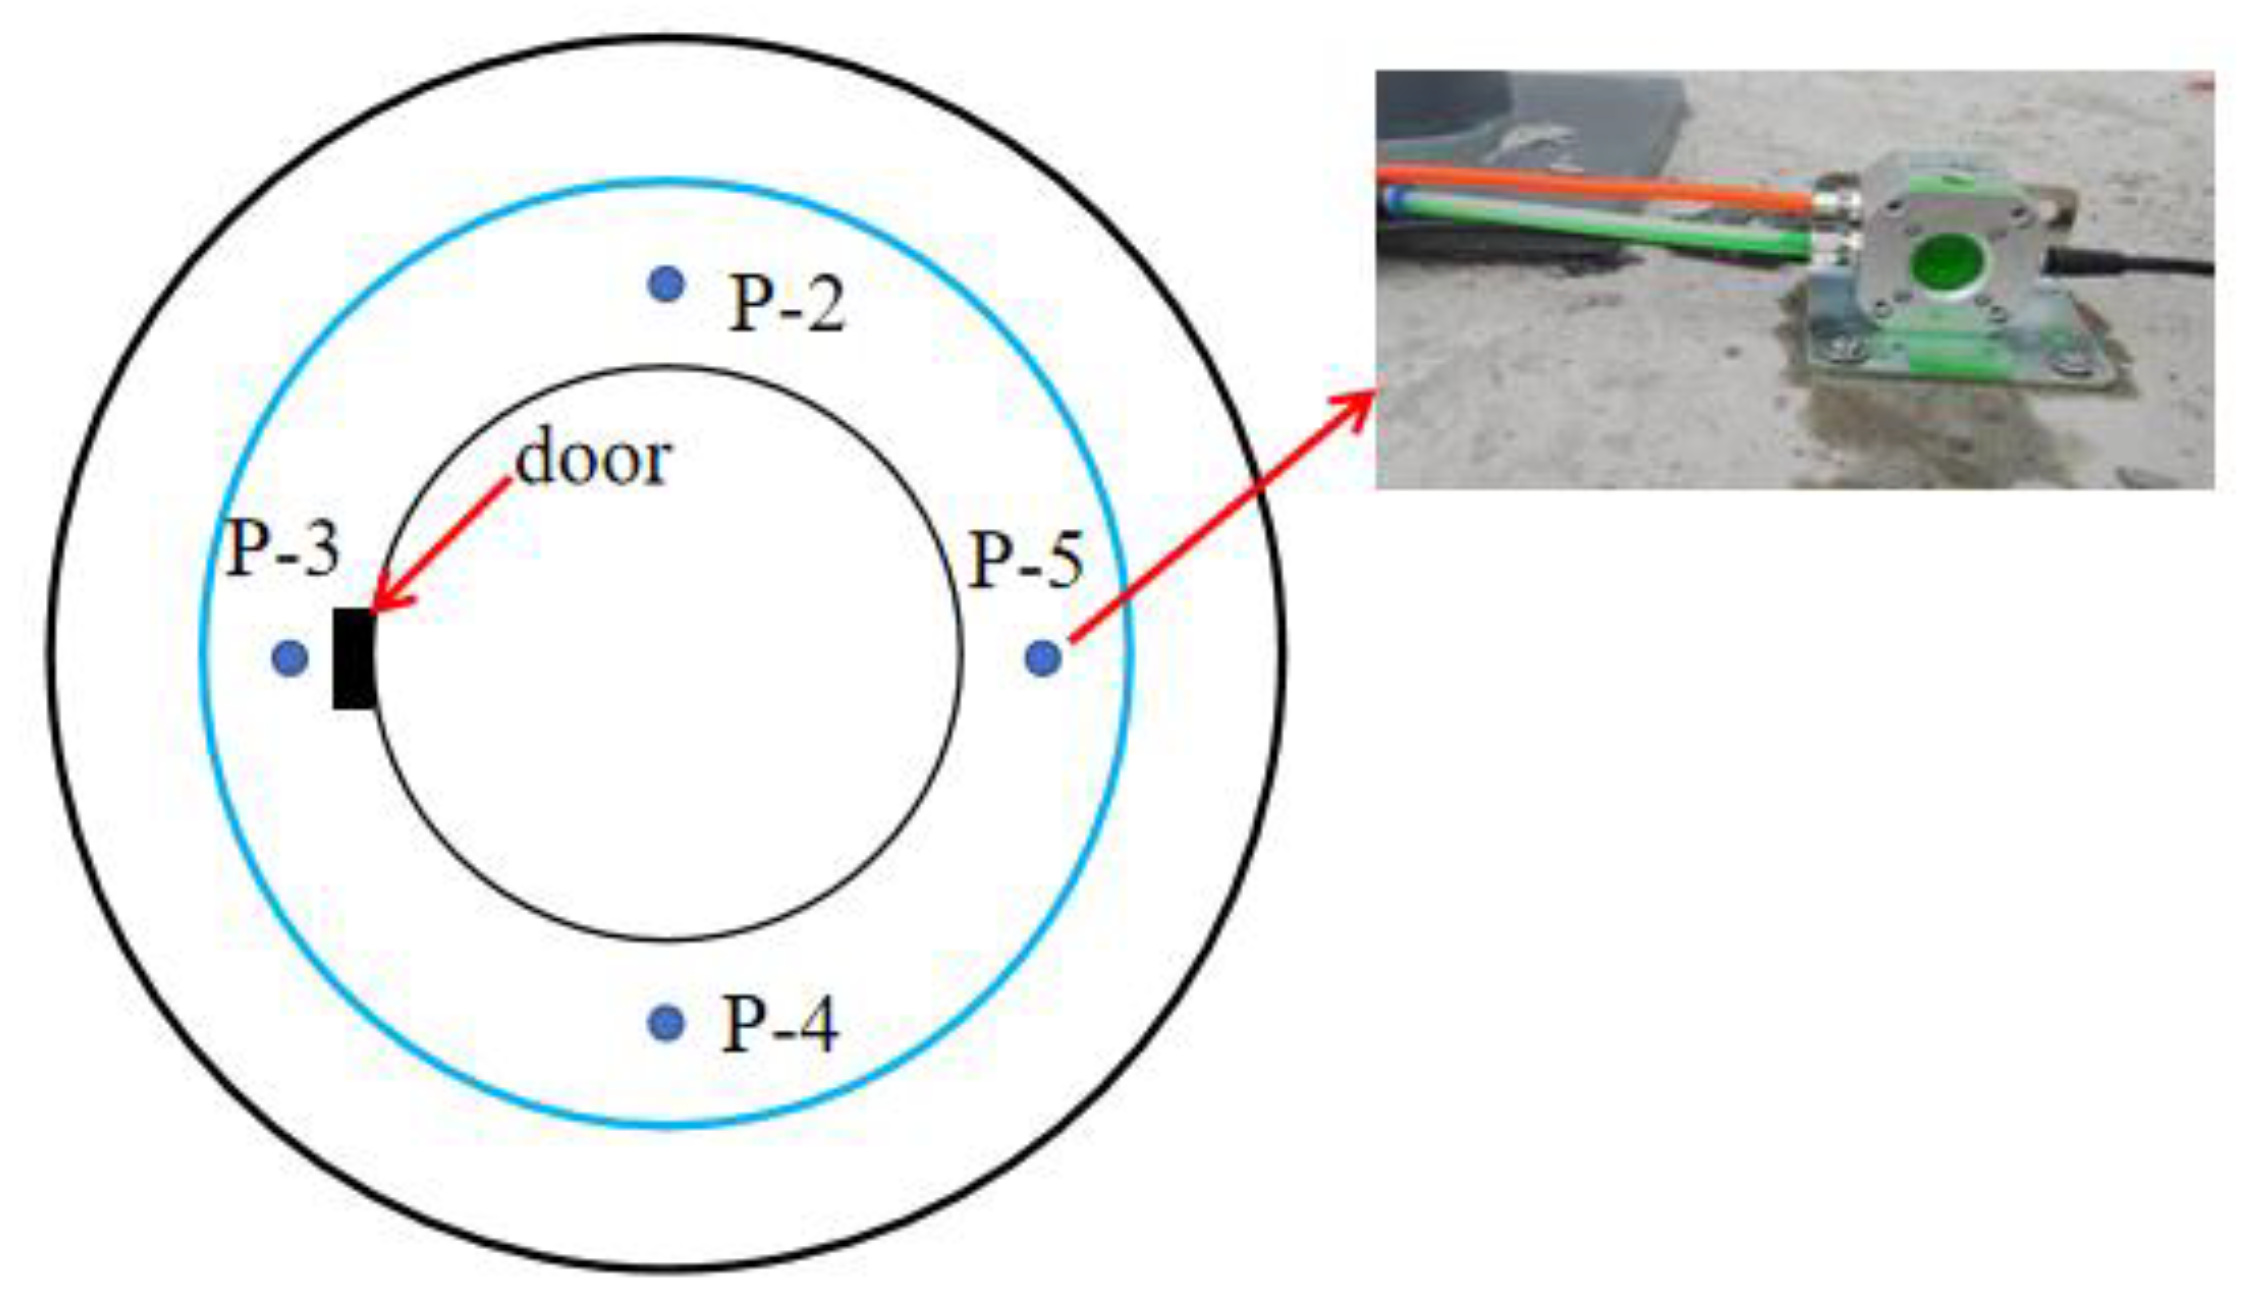
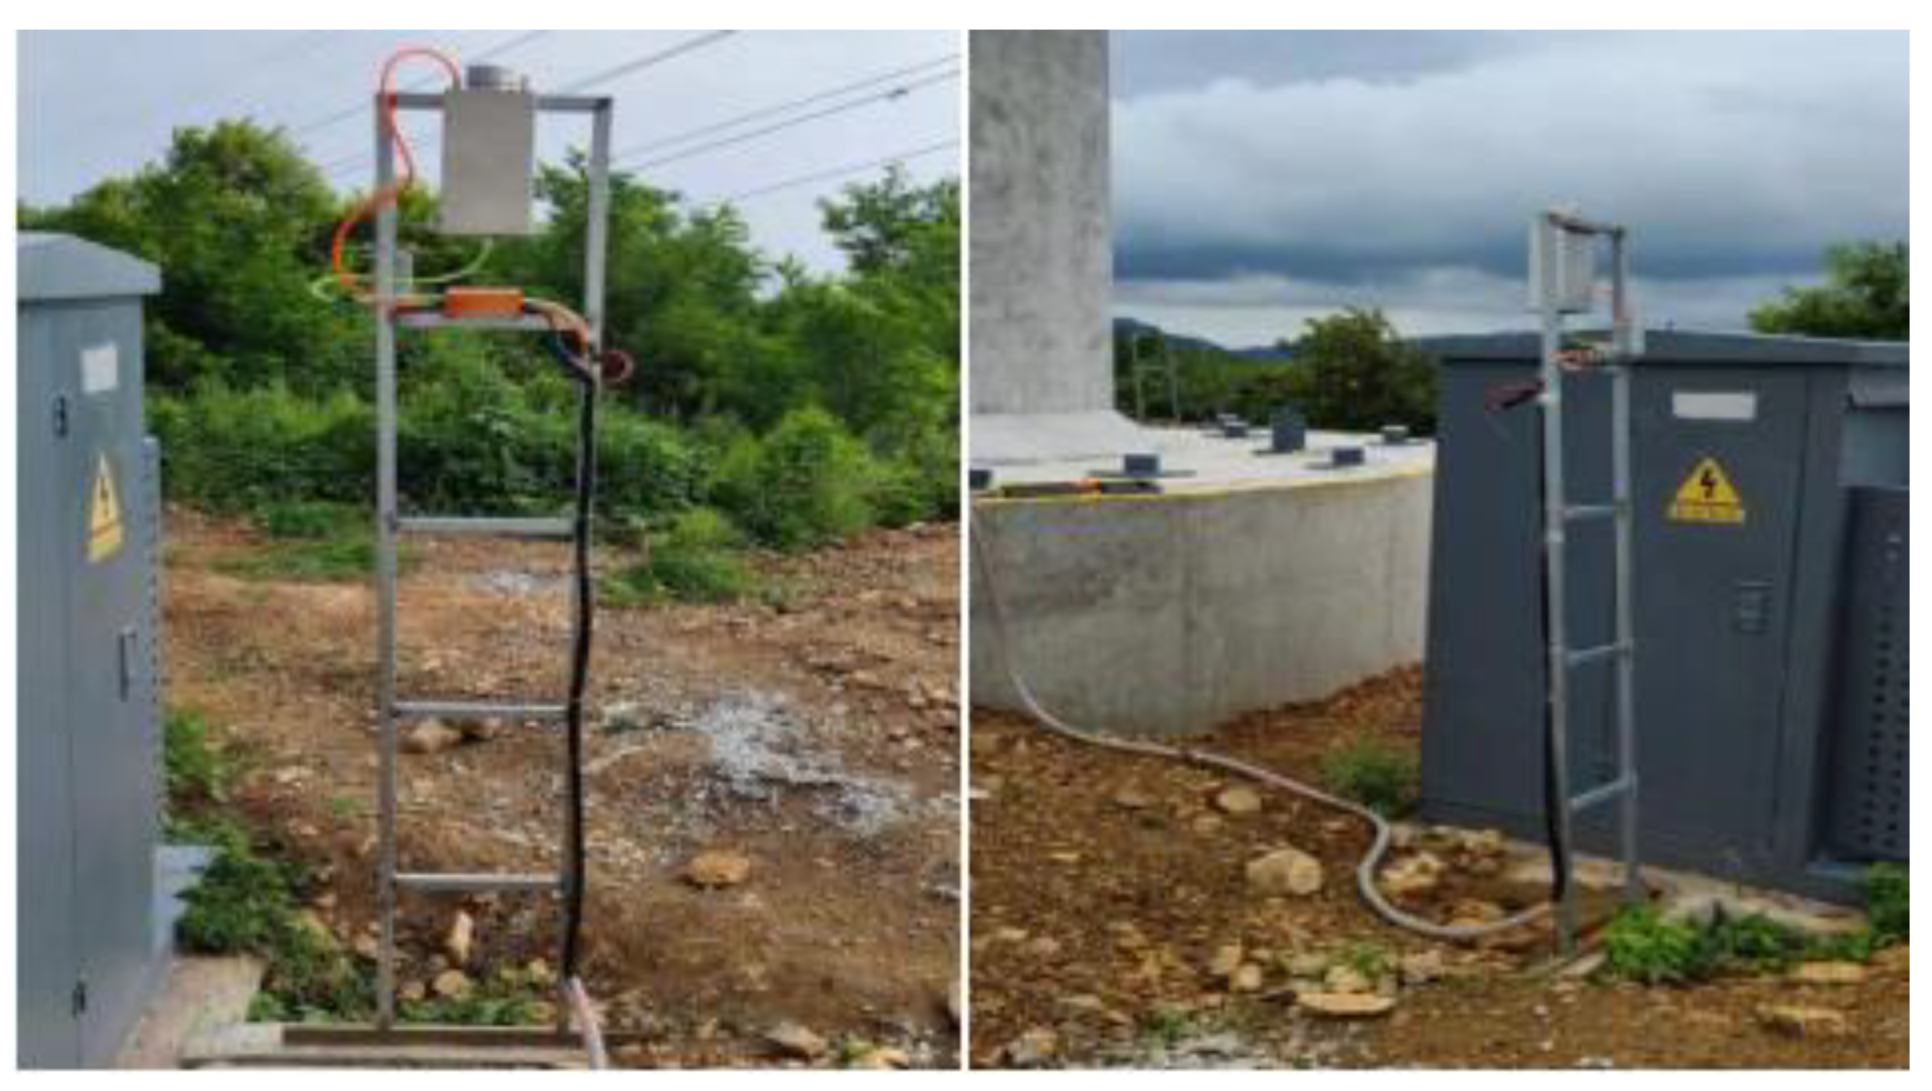
2.3. Measuring Point Position
2.4. Measured Data Analysis
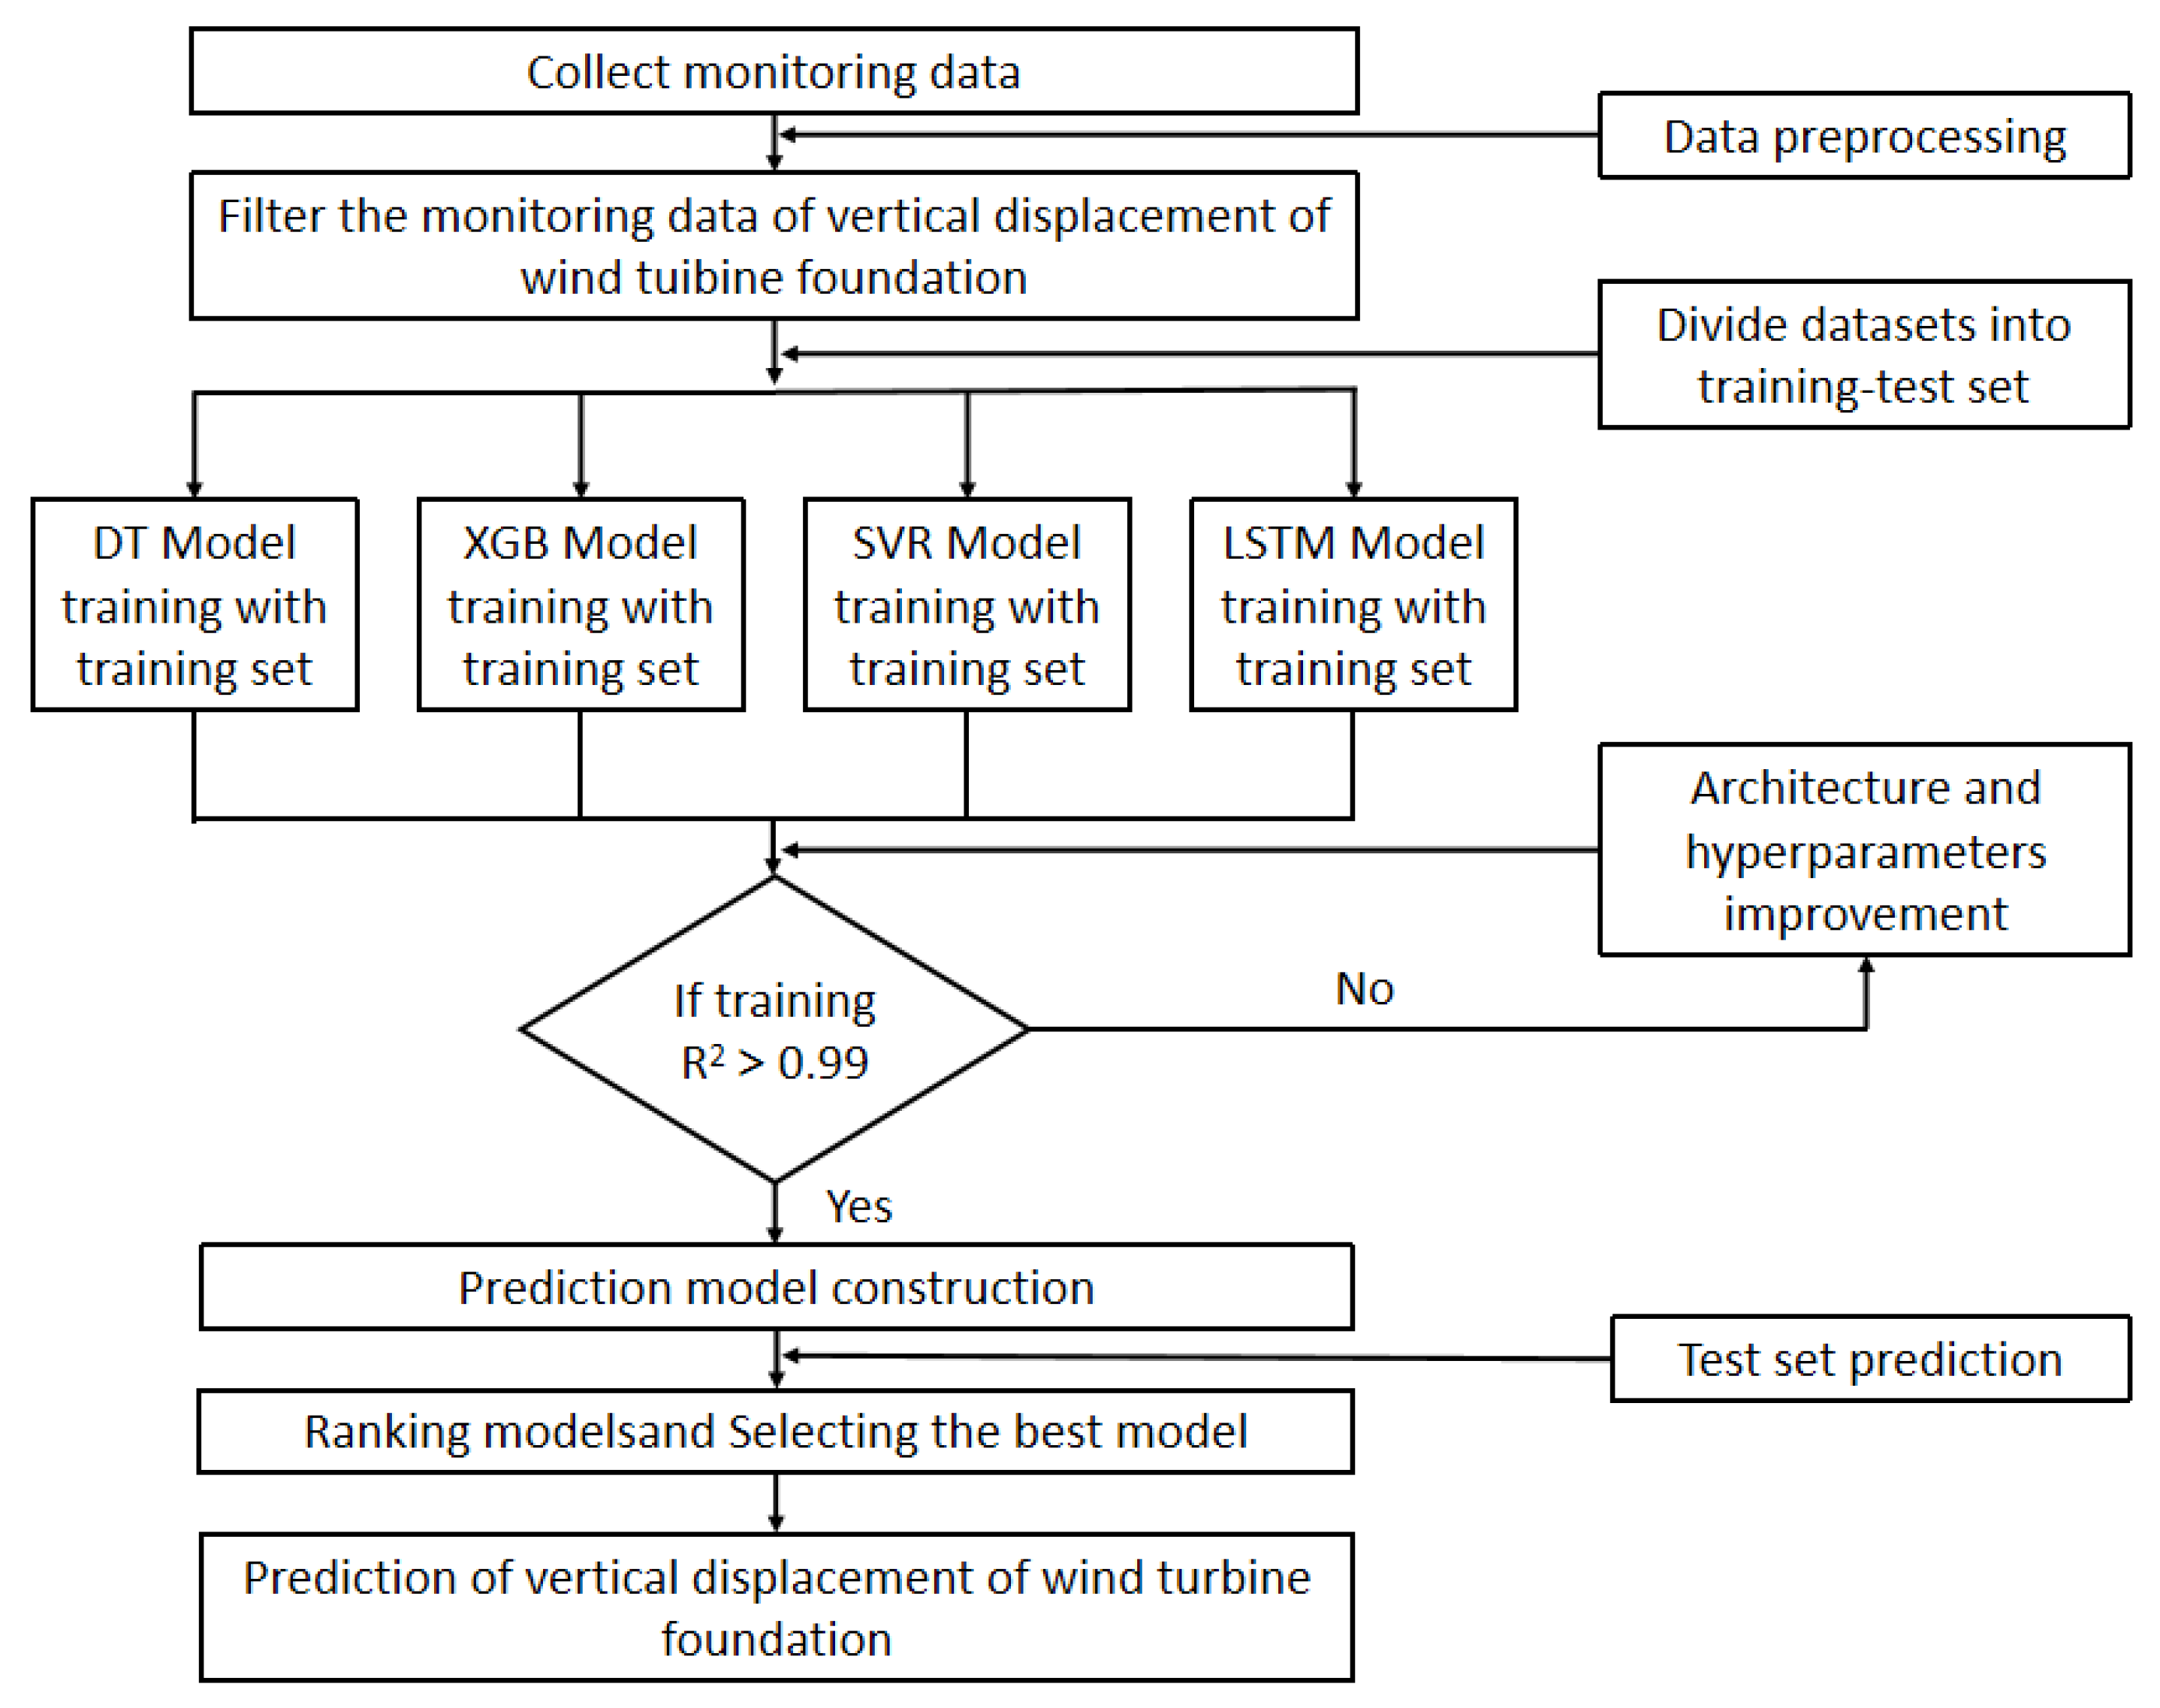
2.5. Modeling Process
3. Model Design
3.1. Model Theory
- (1)
- DT Model. The Decision Tree model consists of a root node, internal decision nodes, and terminal leaf nodes [23,24]. Figure 9 shows the tree structure with a depth of 3. The principle of the model is to learn the classification of the data in the training set and get a set of classification rules suitable for the dataset, and classify the data.
- (2)
- (3)
- SVR Model. The Support Vector Regression model is derived from the support vector machine classification model. The main principle is to map a low-dimensional nonlinear data set to a high-dimensional space using a nonlinear function and then perform linear regression in the high-dimensional space. It constructs an optimal hyperplane that minimizes the distance between the data samples and the hyperplane, thereby solving the problem of linear inseparability in the original space [27,28,29]. Suppose the sample data set is , is the input of the model and is the output of the model, . The sample data are mapped to a high-dimensional linear space with a nonlinear mapping as follows:where is the predicted value of the regression function, and and are the target parameters.
- (4)
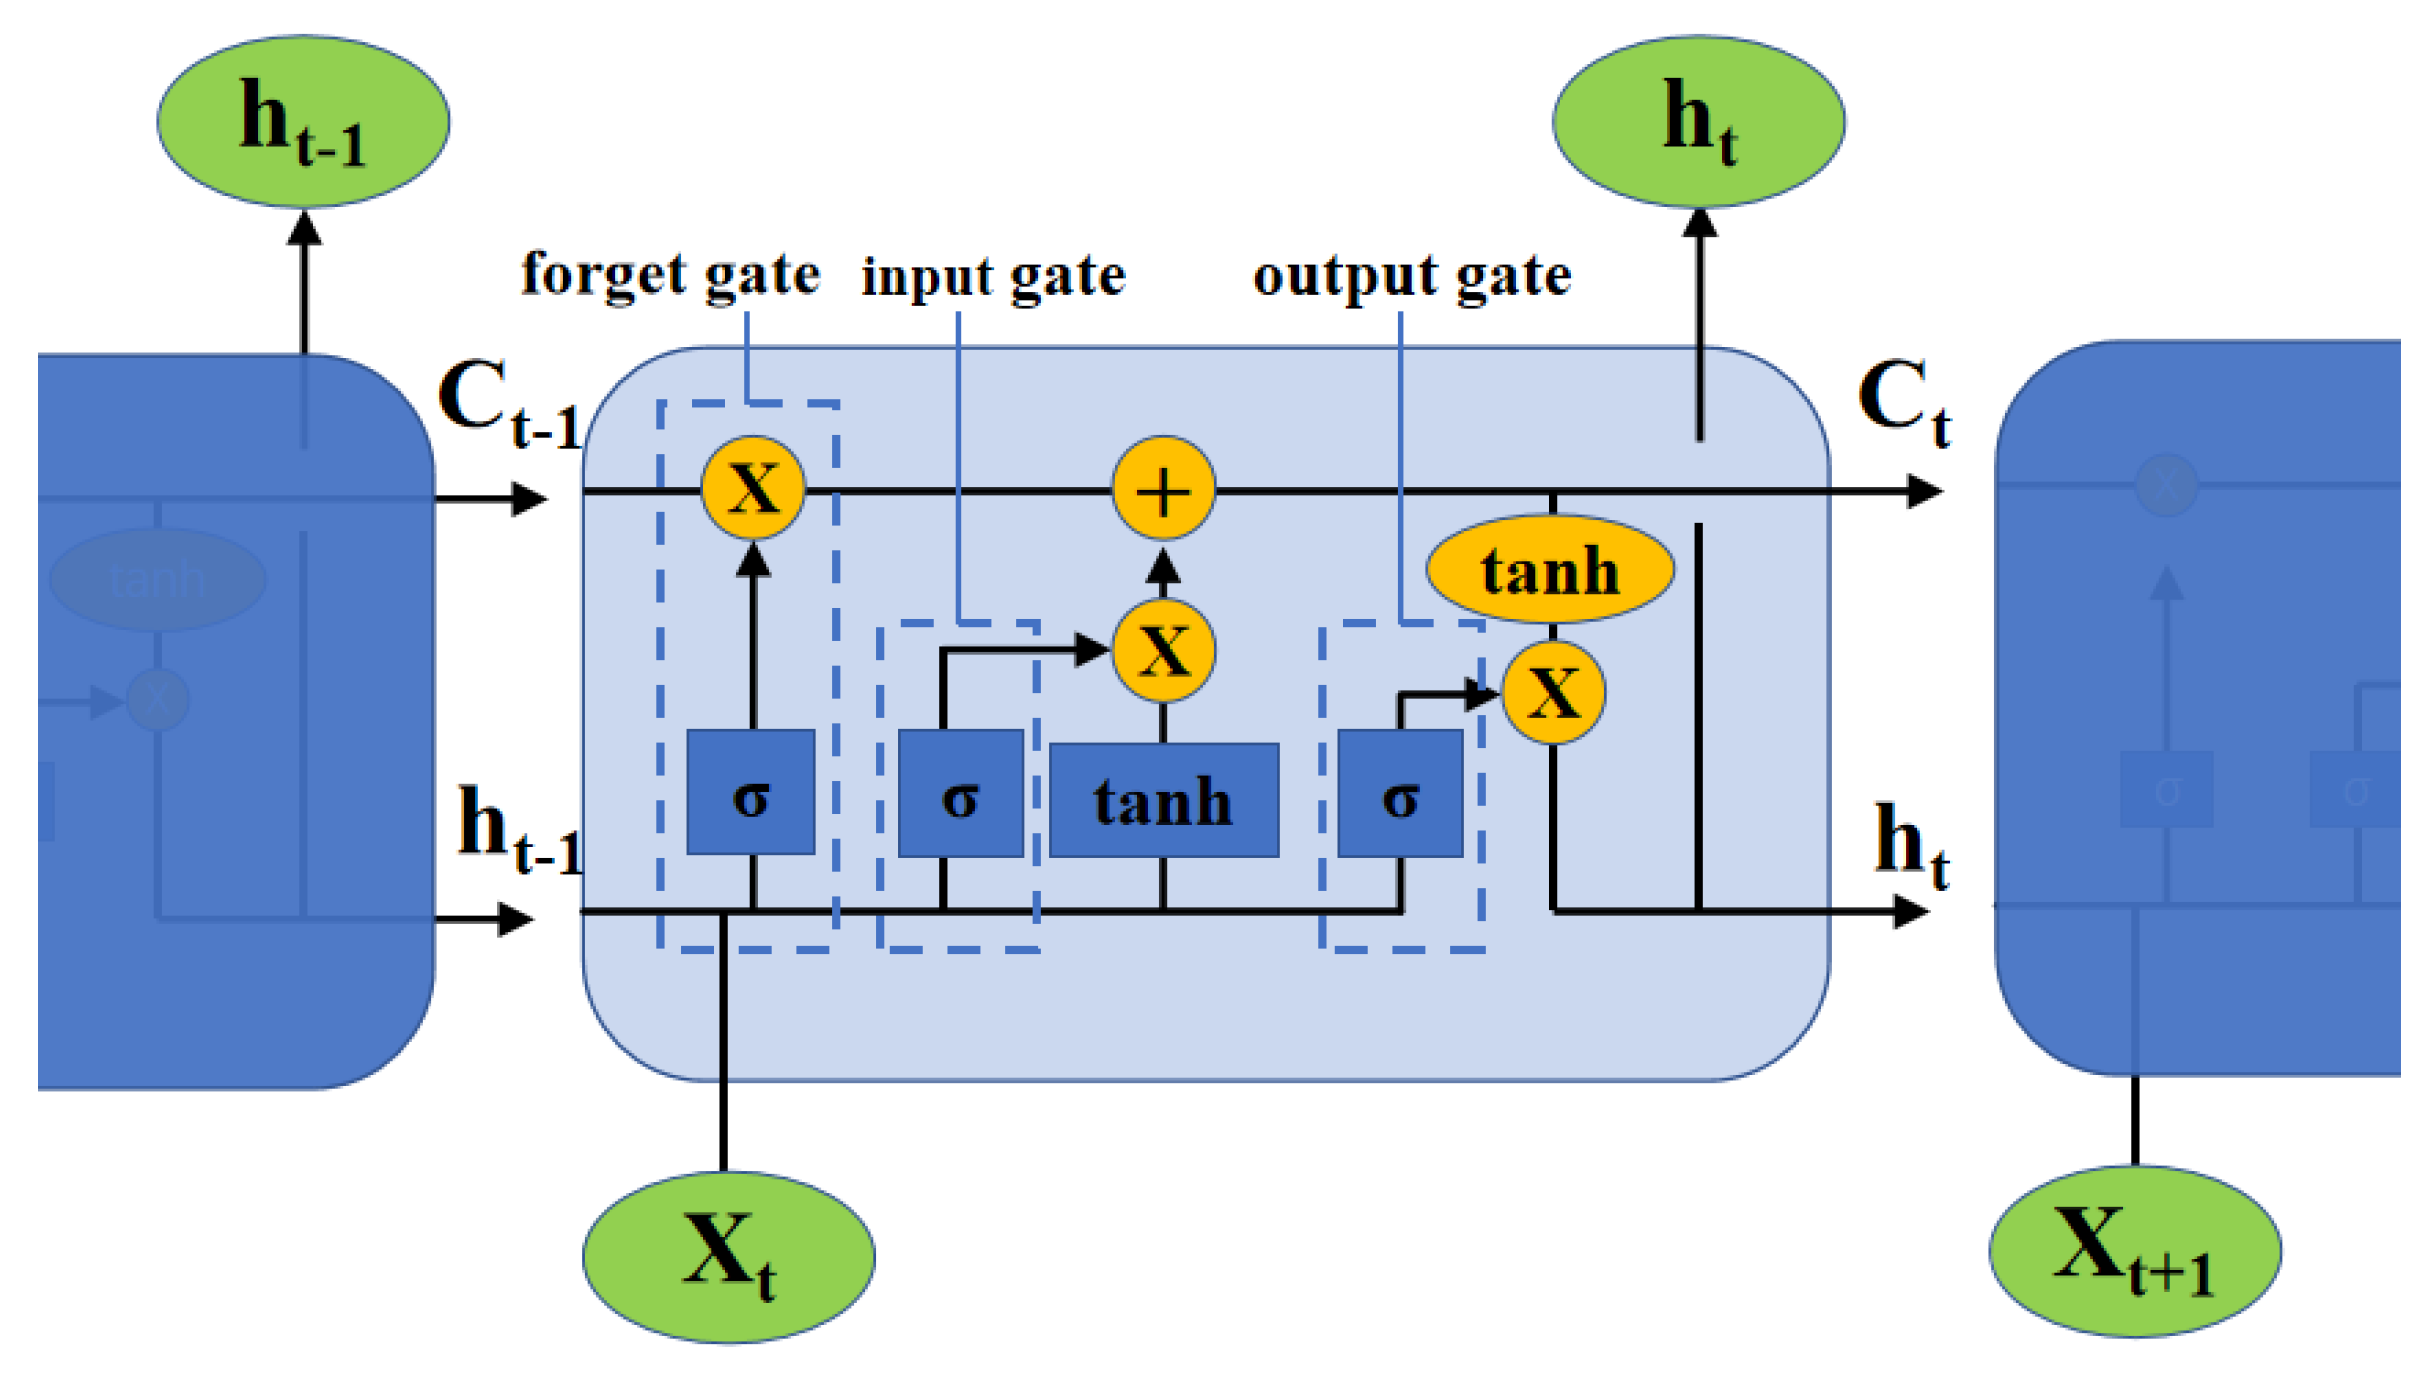
- LSTM Model. The Long Short-Term Memory Network model is established to solve the short-term memory problem in recursive neural network models. The cell unit mainly consists of a forget gate, an input gate, an output gate, and a cell state chain [30,31,32]. The “gate” regulates the flow of information through internal control, and the cell state acts as a conveyor belt for information transmission between cell units. Figure 11 shows a single cell of LSTM, where represents the input information at time , Tanh and represent the hyperbolic tangent function and Sigmoid function, and represent the cell state and hidden state at time . The principle of propagation in a single LSTM cell: first discards irrelevant information through the forget gate, then updates the required information through the input gate, and finally outputs the designated information through the output gate. The main computational process of the memory cell is as follows:
3.2. Model Evaluation
3.3. Data Preprocessing
3.4. Parameter Determination
4. Results and Discussion
5. Conclusions
- (1)
- Following the rehabilitation of the foundation, during a specific time frame, the foundation deformation demonstrates conspicuous fluctuations due to the impact of external cyclic loads. However, over time, the overall deformation gradually reaches a state of stabilization.
- (2)
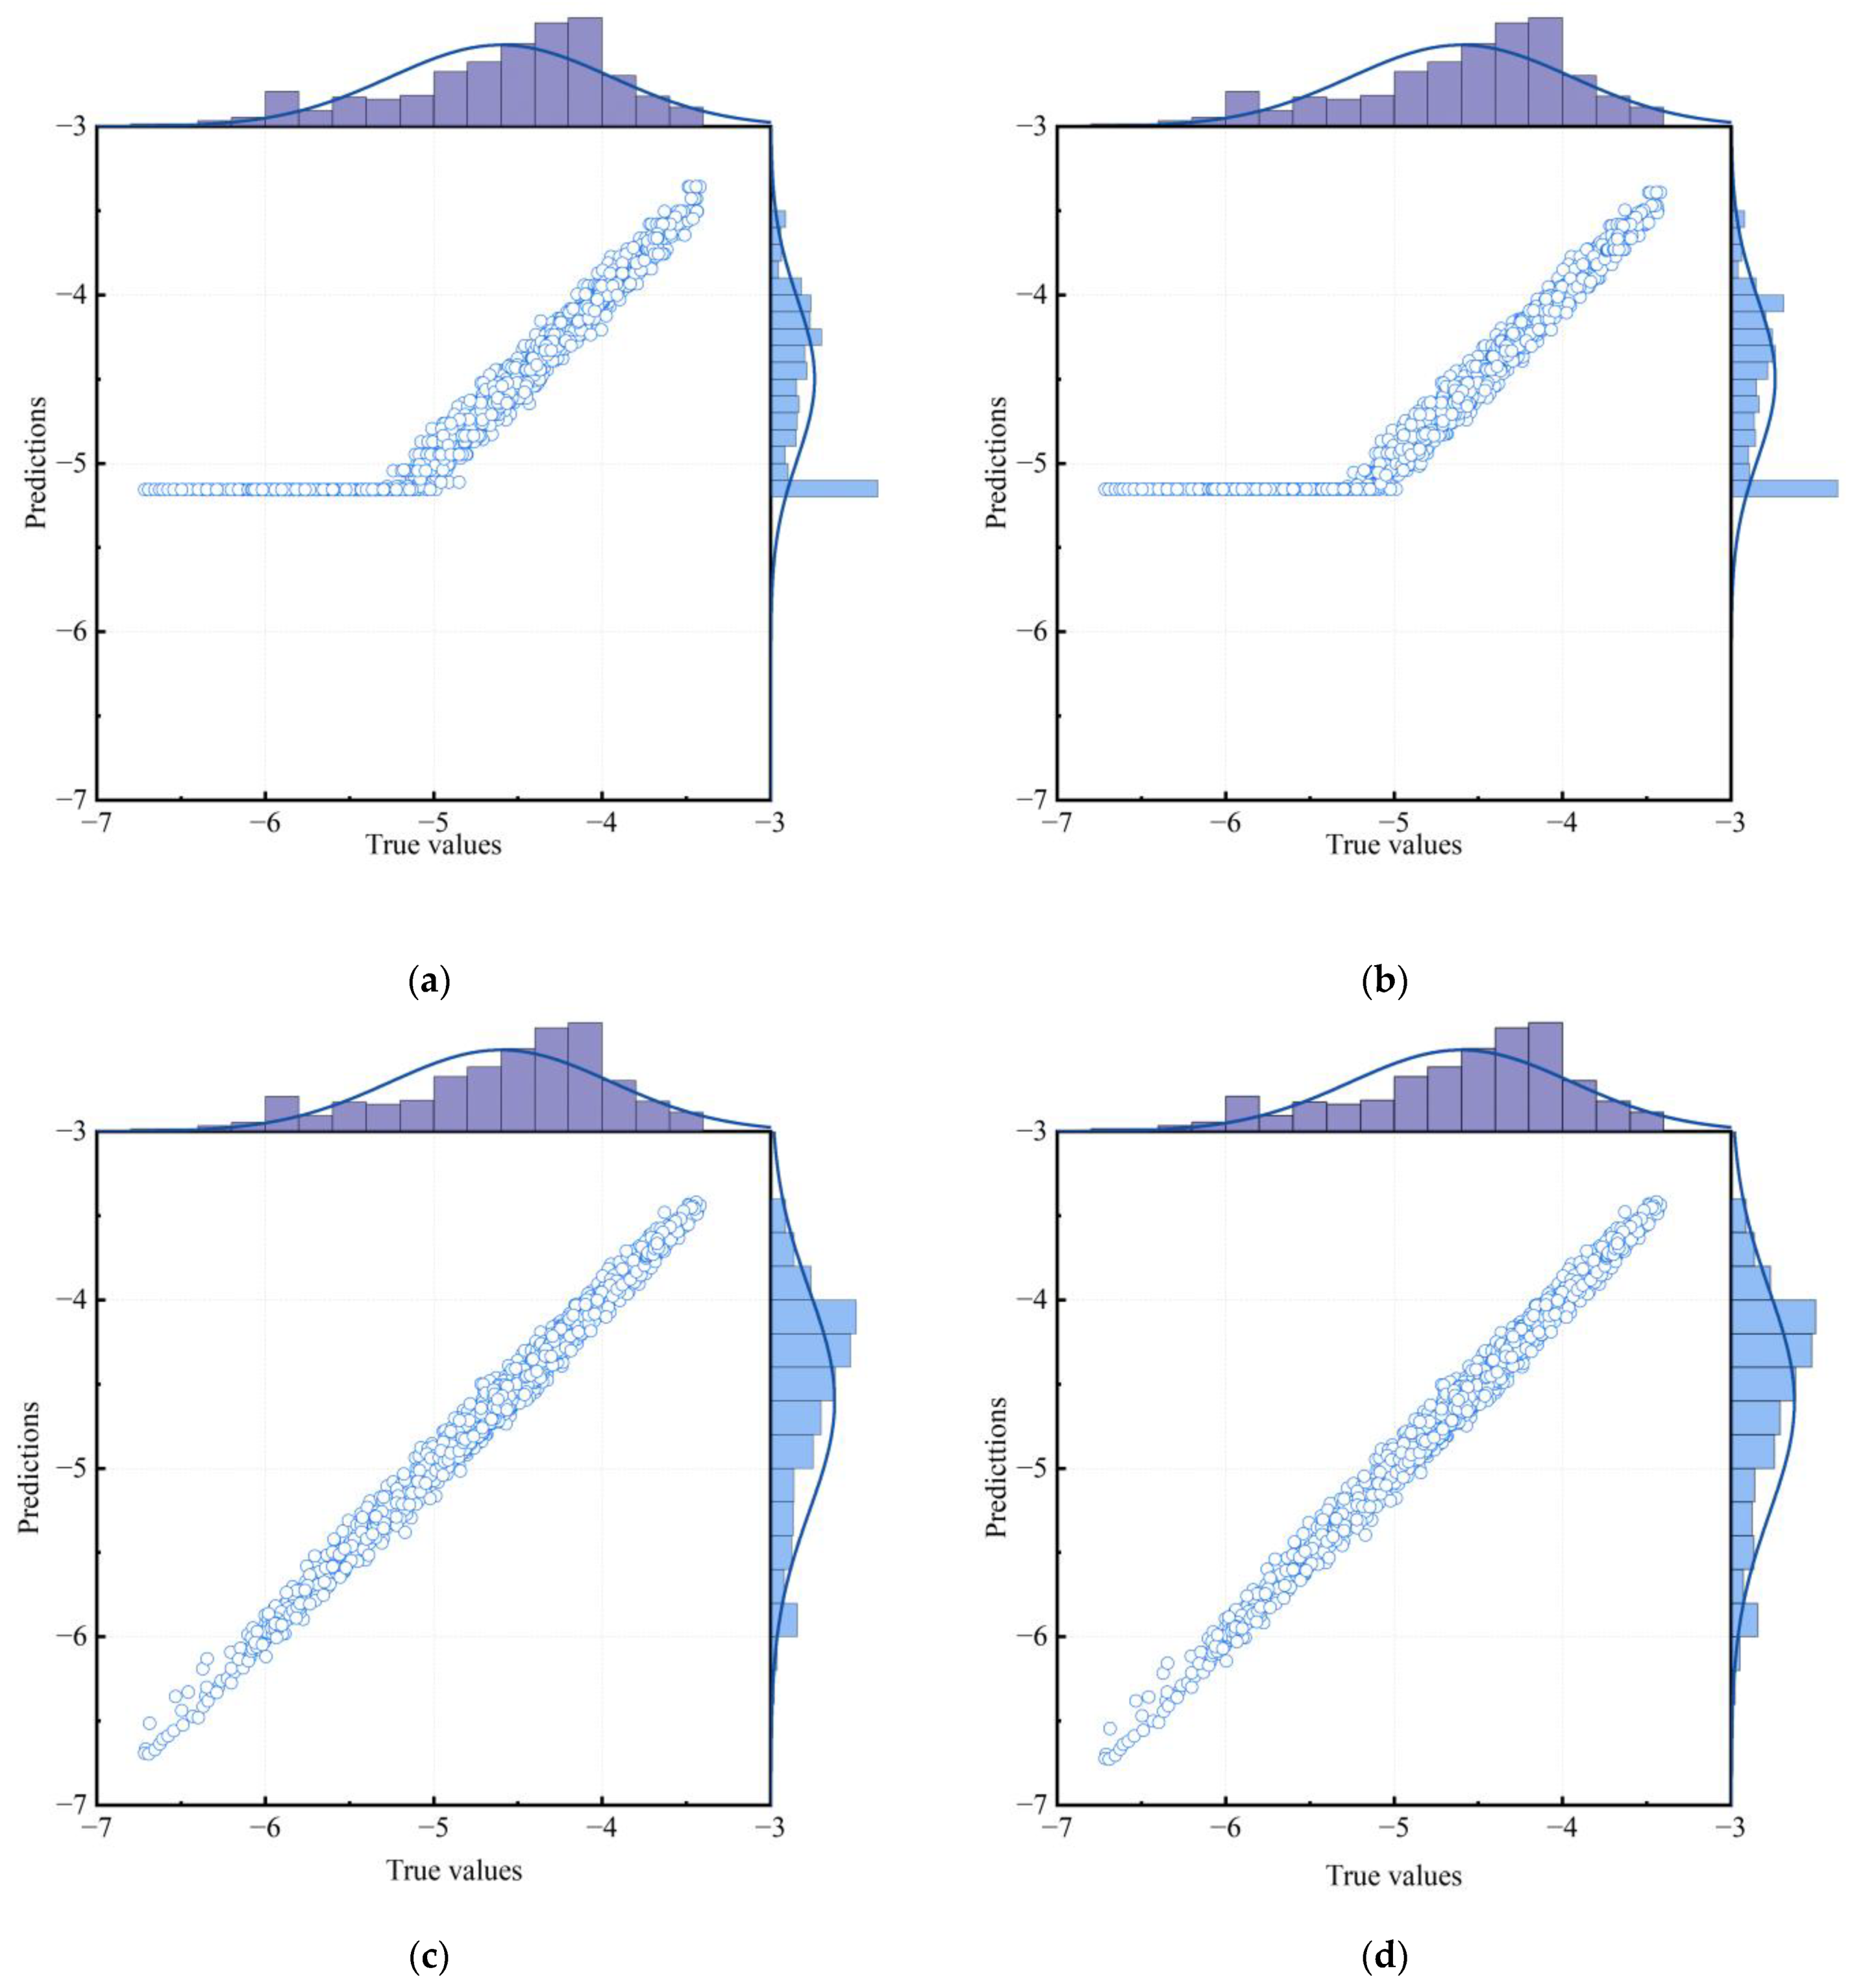
- Four machine learning models were developed to predict wind turbine foundation deformation. The SVR and LSTM models demonstrated the best performance among the developed models. The SVR model consistently achieved a coefficient of determination greater than 0.99 in the deformation prediction of the other three points and outperformed the LSTM model. This suggests that the overall applicability of the SVR model for predicting wind turbine foundation deformation is superior to that of the LSTM model.
- (3)
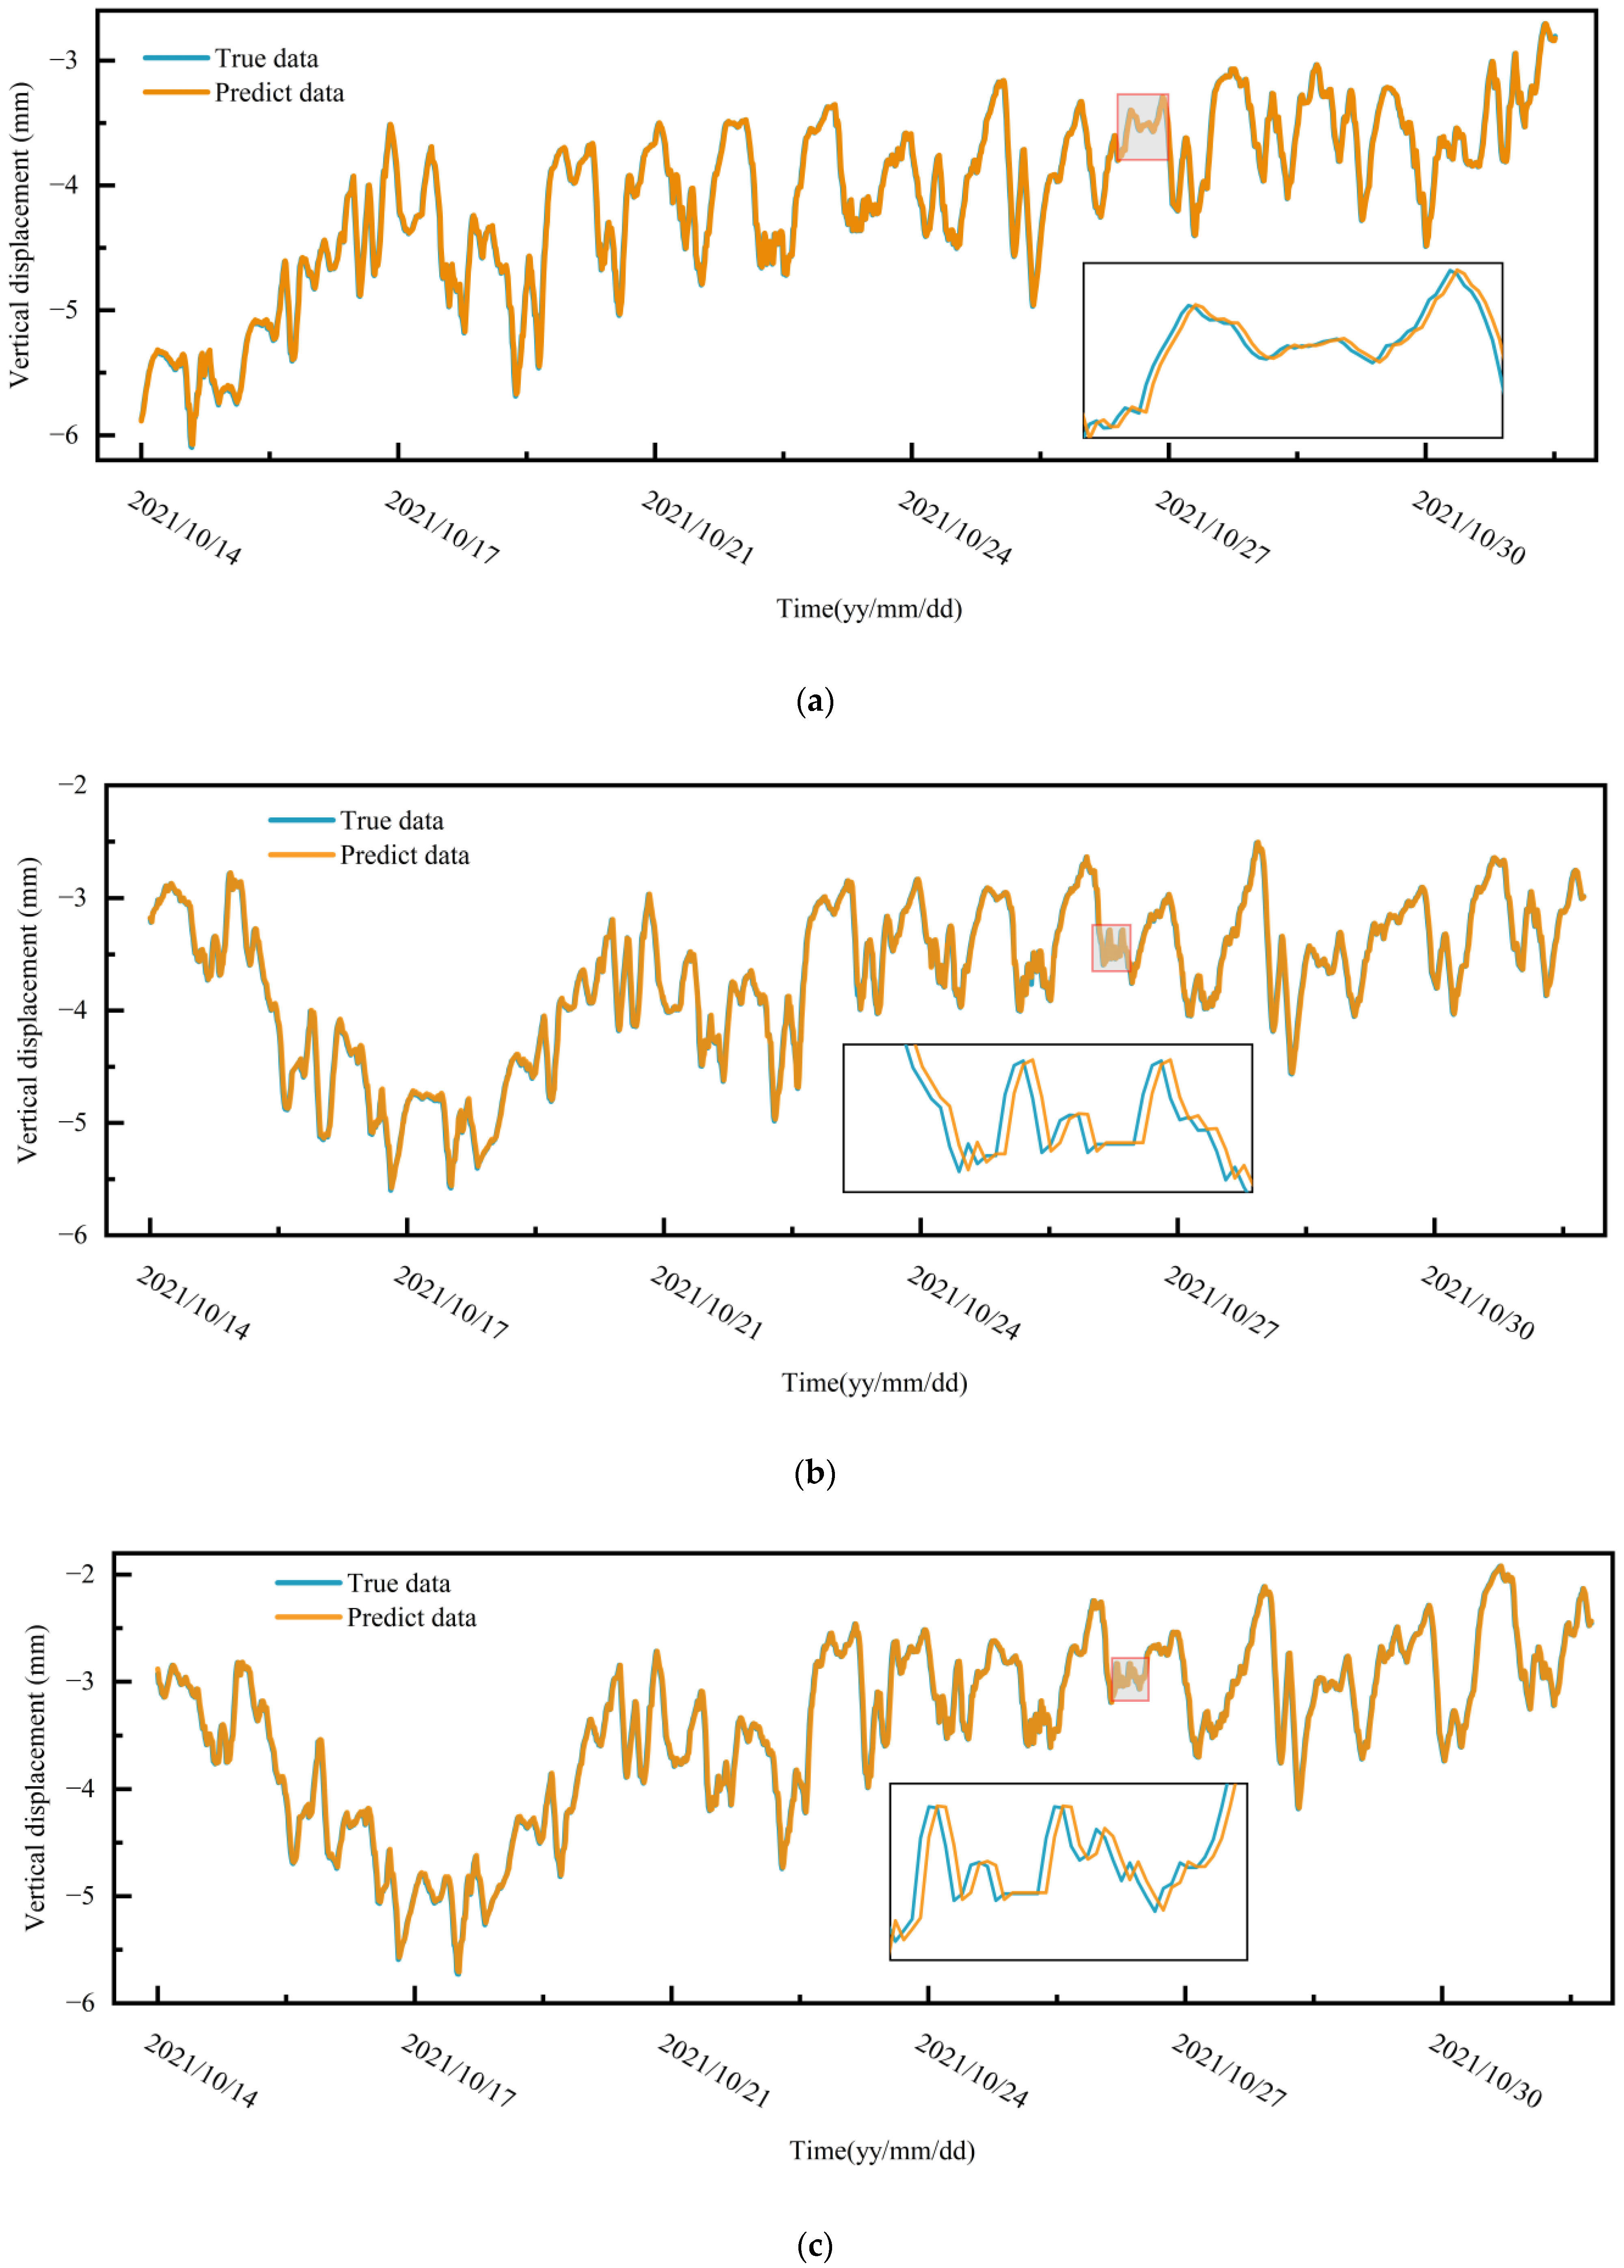
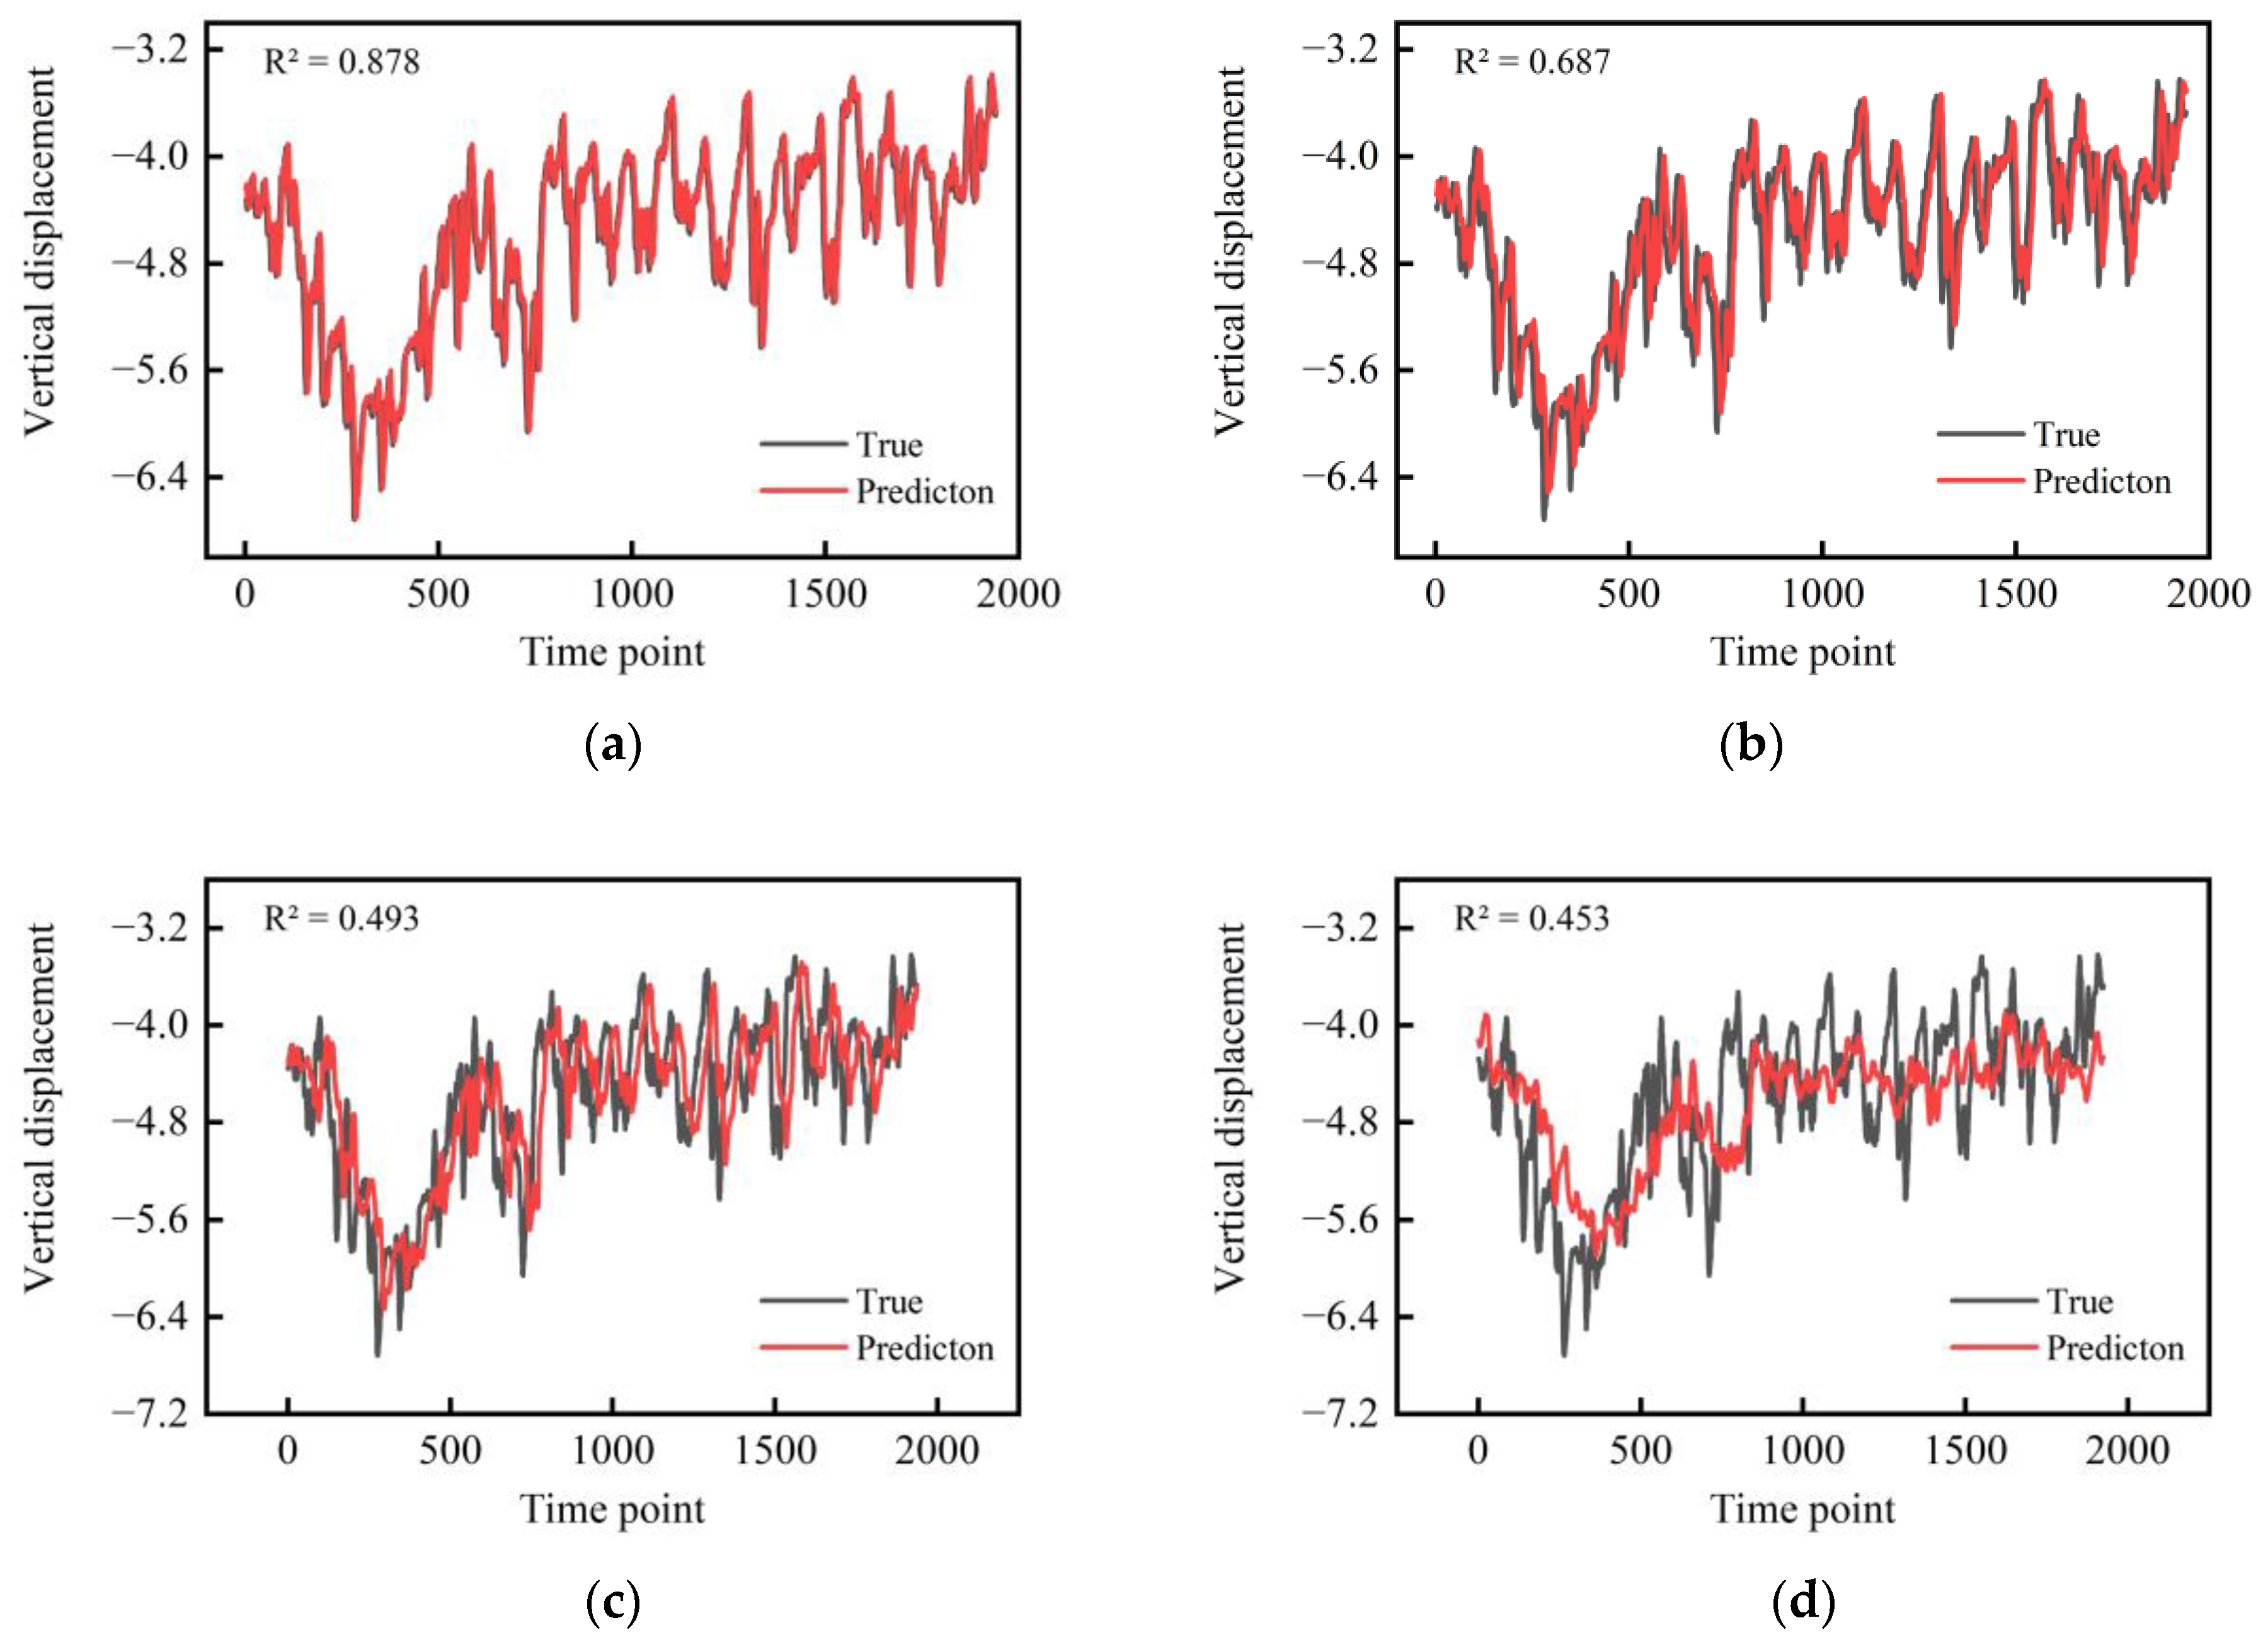
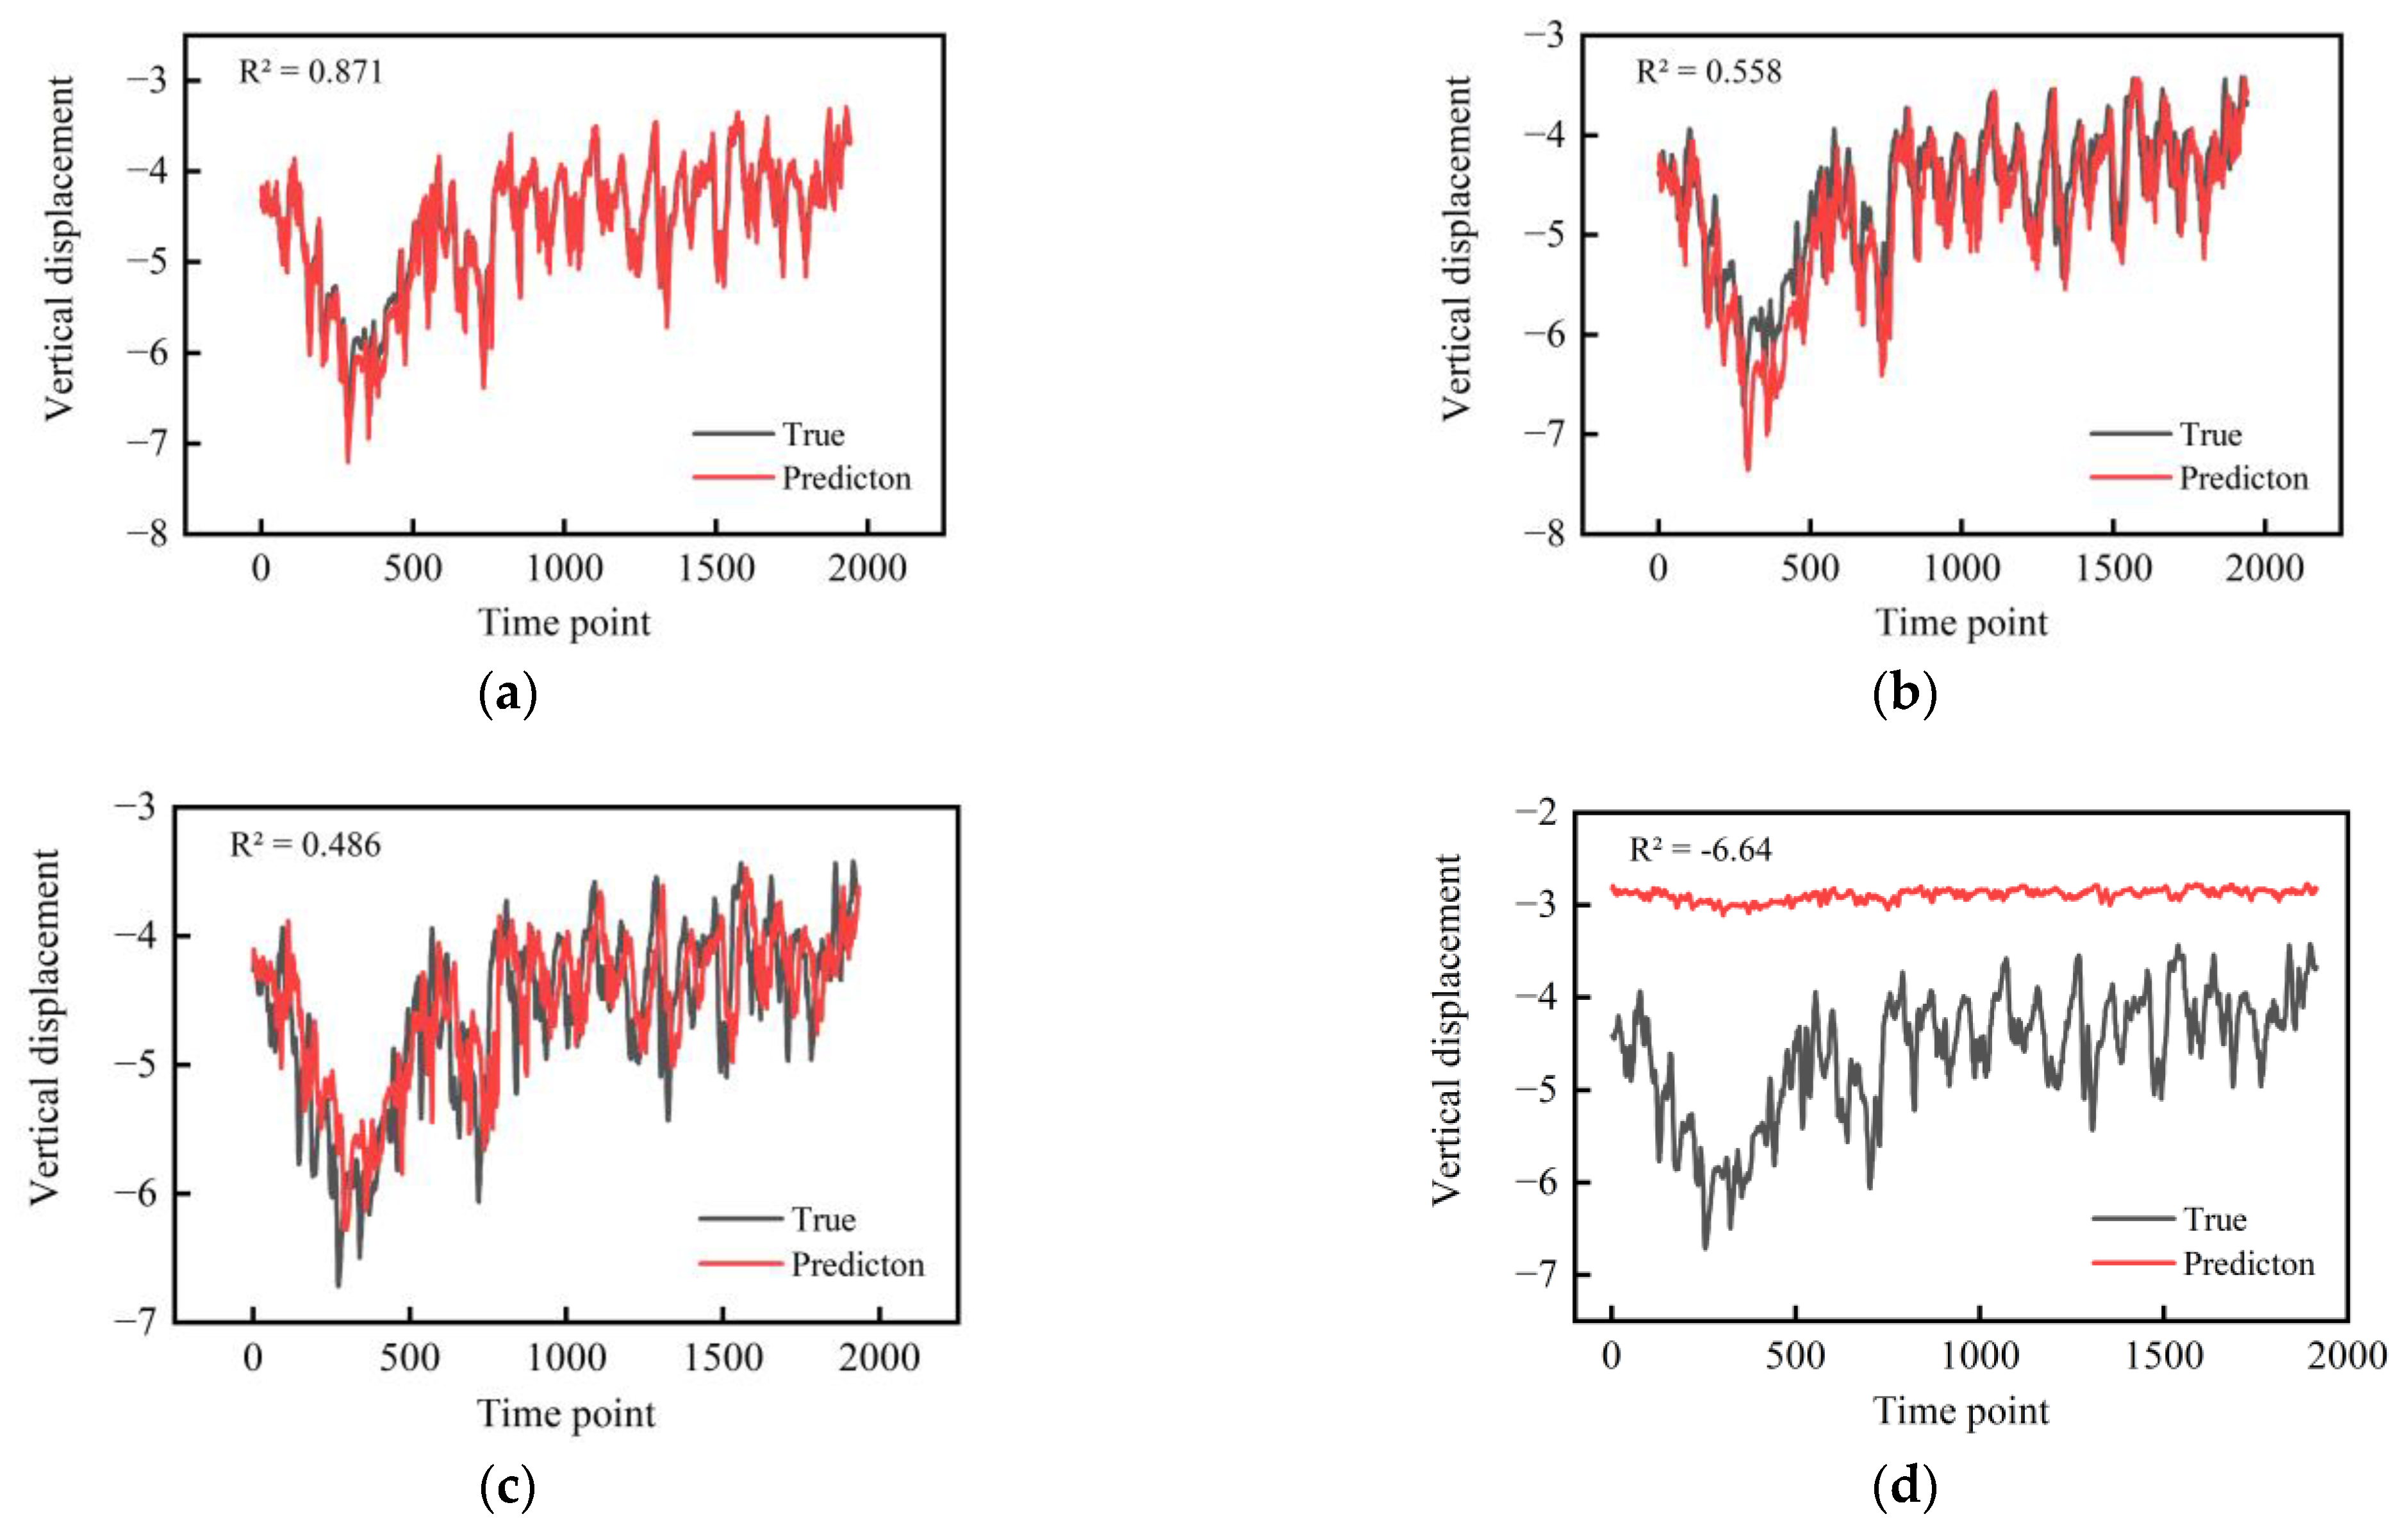
- In the comparison of the prediction multiple time steps, it can be clearly seen that the SVR model learns the wind turbine foundation displacement more accurately, and shows a better effect and higher accuracy in the prediction of short time steps. It can be seen that the SVR model is suitable for predicting the deformation of wind turbine foundations after repair, and can provide a reliable prediction of the subsequent wind turbine foundation deformation in order to assess the repair effect.
Author Contributions
Funding
Data Availability Statement
Acknowledgments
Conflicts of Interest
References
- Yao, G.; Yang, H.M.; Zhou, L.D.; Li, D.D.; Li, C.B.; Wang, J. Development status and key technologies of large-capacity offshore wind turbines. Autom. Electr. Power Syst. 2021, 45, 33–47. (In Chinese) [Google Scholar] [CrossRef]
- Lu, W.R.; He, X.K.; Lu, B.R.; Shi, W.H.; Zhang, J.Z.; Zhu, F.; Zhu, M.Q. Fatigue damage mechanism of wind turbine foundation with foundation pipe. Build. Struct. 2018, 39, 140–148. (In Chinese) [Google Scholar] [CrossRef]
- Janeliukstis, R. Continuous wavelet transform-based method for enhancing estimation of wind turbine blade natural frequencies and damping for machine learning purposes. Measurement 2020, 172, 108897. [Google Scholar] [CrossRef]
- Kang, M.H.; Xu, H.; Hang, X. Local damage analysis of near foundation ring in wind turbine foundation. Acta Energiae Solaris Sin. 2014, 35, 583–588. (In Chinese) [Google Scholar]
- Guo, Y.; Zhang, P.; Ding, H.; Le, C. Experimental Study on Torsion Resistance of Foundation Ring Land-Based Wind Power Expanded Foundation Scale Model. Appl. Sci. 2020, 10, 5612. [Google Scholar] [CrossRef]
- Velarde, J.; Kramhøft, C.; Sørensen, J.D. Global sensitivity analysis of offshore wind turbine foundation fatigue loads. Renew. Energy 2019, 140, 177–189. [Google Scholar] [CrossRef]
- Amponsah, E.; Wang, Z.; Mantey, S.K. Bending-bearing behaviour of embedded steel ring-foundation connection of onshore wind turbines. Structures 2021, 34, 180–197. [Google Scholar] [CrossRef]
- McAlorum, J.; Perry, M.; Fusiek, G.; Niewczas, P.; McKeeman, I.; Rubert, T. Deterioration of cracks in onshore wind turbine foundations. Eng. Struct. 2018, 167, 121–131. [Google Scholar] [CrossRef]
- Sun, L.Y.; Huang, H.; Zhen, L.; Xia, S.F. Optimization design of foundation reinforcement scheme for low strength wind turbine based on plastic damage model. Acta Energiae Solaris Sin. 2022, 43, 453–460. (In Chinese) [Google Scholar] [CrossRef]
- Chen, J.; Chen, Y.; Mao, B.; Wang, X.; Peng, L. Key mitigation regions and strategies for CO2 emission reduction in China based on STIRPAT and ARIMA models. Environ. Sci. Pollut. Res. 2022, 29, 51537–51553. [Google Scholar] [CrossRef]
- Mohamed, W.; Austrell, P.E. A comparative study of three onshore wind turbine foundation solutions. Comput. Geotech. 2017, 94, 46–57. [Google Scholar] [CrossRef]
- Tang, Q.; Dang, J.; Cui, Y.; Wang, X.; Jia, J. Machine learning-based fast seismic risk assessment of building structures. J. Earthq. Eng. 2022, 26, 8041–8062. [Google Scholar] [CrossRef]
- Wong, P.T.; Lai, W.W. Harmonising Cross-System GPR Wave Amplitude for Concrete Diagnosis with Machine Learning. J. Nondestruct. Eval. 2023, 42, 99. [Google Scholar] [CrossRef]
- Liu, M.; Liao, S.; Yang, Y.; Men, Y.; He, J.; Huang, Y. Tunnel boring machine vibration-based deep learning for the ground identification of working faces. J. Rock Mech. Geotech. Eng. 2021, 13, 1340–1357. [Google Scholar] [CrossRef]
- Wu, B.; Wan, Y.; Xu, S.; Zhao, C.; Liu, Y.; Zhang, K. A Multi-Source Intelligent Fusion Assessment Method for Dynamic Construction Risk of Subway Deep Foundation Pit: A Case Study. Sustainability 2023, 15, 10162. [Google Scholar] [CrossRef]
- Samui, P. Support vector machine applied to settlement of shallow foundations on cohesionless soils. Comput. Geotech. 2008, 35, 419–427. [Google Scholar] [CrossRef]
- Kirts, S.; Nam, B.H.; Panagopoulos, O.P.; Xanthopoulos, P. Settlement prediction using support vector machine (SVM)-based compressibility models: A case study. Int. J. Civ. Eng. 2019, 17, 1547–1557. [Google Scholar] [CrossRef]
- Raja, M.N.; Shukla, S.K. Multivariate adaptive regression splines model for reinforced soil foundations. Geosynth. Int. 2021, 28, 368–390. [Google Scholar] [CrossRef]
- Deng, J.; Zeng, T.; Yuan, S.; Fan, H.; Xiang, W. Interval Prediction of Building Foundation Settlement Using Kernel Extreme Learning Machine. Front. Earth Sci. 2022, 10, 939772. [Google Scholar] [CrossRef]
- Pourtaghi, A.; Lotfollahi-Yaghin, M.A. Wavenet ability assessment in comparison to ANN for predicting the maximum surface settlement caused by tunneling. Tunn. Undergr. Space Technol. 2012, 28, 257–271. [Google Scholar] [CrossRef]
- Vidal, Y.; Aquino, G.; Pozo, F.; Gutiérrez-Arias, J.E. Structural health monitoring for jacket-type offshore wind turbines: Experimental proof of concept. Sensors 2020, 20, 1835. [Google Scholar] [CrossRef] [PubMed]
- Leon-Medina, J.X.; Parés, N.; Anaya, M.; Tibaduiza, D.A.; Pozo, F. Ensemble of feature extraction methods to improve the structural damage classification in a wind turbine foundation. Bull. Pol. Acad. Sci. Tech. Sci. 2023, 71, 144606. [Google Scholar] [CrossRef]
- Jiang, S.; Mao, H.; Ding, Z.; Fu, Y. Deep Decision Tree Transfer Boosting. IEEE Trans. Neural Netw. Learn. Syst. 2019, 31, 383–395. [Google Scholar] [CrossRef] [PubMed]
- Shorabeh, S.N.; Samany, N.N.; Minaei, F.; Firozjaei, H.K.; Homaee, M.; Boloorani, A.D. A decision model based on decision tree and particle swarm optimization algorithms to identify optimal locations for solar power plants construction in Iran. Renew. Energy 2022, 187, 56–67. [Google Scholar] [CrossRef]
- Chen, T.; Guestrin, C. Xgboost: A scalable tree boosting system. In Proceedings of the 22nd ACM SIGKDD International Conference on Knowledge Discovery and Data Mining, San Francisco, CA, USA, 13–17 August 2016; pp. 785–794. [Google Scholar] [CrossRef]
- Purohit, S.; Ng, E.Y.K.; Kabir, I.F.S.A. Evaluation of three potential machine learning algorithms for predicting the velocity and turbulence intensity of a wind turbine wake. Renew. Energy 2022, 184, 405–420. [Google Scholar] [CrossRef]
- Jahangiri, B.; Barri, K.; Alavi, A.H.; Buttlar, W.G. A molecular sensing method integrated with support vector machines to characterize asphalt mixtures. Measurement 2021, 179, 109528. [Google Scholar] [CrossRef]
- Sun, Y.; Ding, S.; Zhang, Z.; Jia, W. An improved grid search algorithm to optimize SVR for prediction. Soft Comput. 2021, 25, 5633–5644. [Google Scholar] [CrossRef]
- Liu, H.; Mi, X.; Li, Y.; Duan, Z.; Xu, Y. Smart wind speed deep learning based multi-step forecasting model using singular spectrum analysis, convolutional Gated Recurrent Unit network and Support Vector Regression. Renew. Energy 2019, 143, 842–854. [Google Scholar] [CrossRef]
- Belagoune, S.; Bali, N.; Bakdi, A. Deep Learning through LSTM Classification and Regression for Transmission Line Fault Detection, Diagnosis and Location in Large-Scale Multi-Machine Power Systems. Measurement 2021, 177, 109330. [Google Scholar] [CrossRef]
- Ding, Y.; Zhu, Y.; Feng, J.; Zhang, P.; Cheng, Z. Interpretable spatio-temporal attention LSTM model for flood forecasting. Neurocomputing 2020, 403, 348–359. [Google Scholar] [CrossRef]
- López, G.; Arboleya, P. Short-term wind speed forecasting over complex terrain using linear regression models and multivariable LSTM and NARX networks in the Andes Mountains, Ecuador. Renew. Energy 2022, 183, 351–368. [Google Scholar] [CrossRef]
- Lee, D.H.; Cheon, E.; Lim, H.H.; Choi, S.K.; Kim, Y.T.; Lee, S.R. An artificial neural network model to predict debris-flow volumes caused by extreme rainfall in the central region of South Korea. Eng. Geol. 2021, 281, 105979. [Google Scholar] [CrossRef]
- Olu-Ajayi, R.; Alaka, H.; Sulaimon, I.; Sunmola, F.; Ajayi, S. Building energy consumption prediction for residential buildings using deep learning and other machine learning techniques. J. Build. Eng. 2022, 45, 103406. [Google Scholar] [CrossRef]
- El-Mir, A.; El-Zahab, S.; Sbartaï, Z.M.; Homsi, F.; Saliba, J.; El-Hassan, H. Machine learning prediction of concrete compressive strength using rebound hammer test. J. Build. Eng. 2023, 64, 105538. [Google Scholar] [CrossRef]
- Hwang, S.H.; Mangalathu, S.; Shin, J.; Jeon, J.S. Machine learning-based approaches for seismic demand and collapse of ductile reinforced concrete building frames. J. Build. Eng. 2021, 34, 101905. [Google Scholar] [CrossRef]
- Dong, X.C.; Gou, M.W.; Wang, S.L. Prediction of sinking rate of sinkhole foundation based on multivariate structural stress characteristics. J. Rock Mech. Eng. 2022, 41 (Suppl. S2), 3476–3487. (In Chinese) [Google Scholar] [CrossRef]
- Hasan, M.R.; Siraj, F.; Sainin, M.S. Improving ensemble decision tree performance using Adaboost and Bagging. In Proceedings of the 2nd Innovation and Analytics Conference and Exhibition, Kedah, Malaysia, 29 September–1 October 2015. [Google Scholar] [CrossRef]
- Taieb, S.B.; Bontempi, G.; Atiya, A.F.; Sorjamaa, A. A review and comparison of strategies for multi-step ahead time series forecasting based on the NN5 forecasting competition. Expert Syst. Appl. 2012, 39, 7067–7083. [Google Scholar] [CrossRef]


| XGB | max_depth | 1 | 3 | 5 |
| min_child_weight | 1 | 3 | 5 | |
| n_estimators | 50 | 100 | 200 | |
| DT | max_depth | 5 | 10 | 20 |
| min_samples_split | 10 | 20 | 30 | |
| min_sample_leaf | 1 | 3 | 5 | |
| SVR | C | 0.1 | 1 | 10 |
| epslion | 0.001 | 0.01 | 0.1 | |
| gamma | 0.01 | 0.1 | 1 | |
| LSTM | activation | relu | sigmoid | tanh |
| hidden_size | 128 | 256 | 512 | |
| epochs | 128 | 256 | 512 |
| Test | Train | |||||||
|---|---|---|---|---|---|---|---|---|
| Max_Depth | Min_Samples_Leaf | Min_Samples_Split | R2 | MAE × 10−2 | MSE × 10−1 | R2 | MAE × 10−2 | MSE × 10−1 |
| 10 | 1 | 10 | 0.810 | 8.231 | 1.441 | 0.999 | 0.291 | 0.393 |
| 10 | 3 | 10 | 0.810 | 8.224 | 1.439 | 0.999 | 0.298 | 0.400 |
| 10 | 5 | 10 | 0.810 | 8.216 | 1.432 | 0.999 | 0.304 | 0.405 |
| 20 | 3 | 10 | 0.810 | 8.234 | 1.448 | 0.999 | 0.256 | 0.376 |
| 20 | 5 | 10 | 0.810 | 8.219 | 1.434 | 0.999 | 0.281 | 0.392 |
| 20 | 1 | 10 | 0.809 | 8.253 | 1.459 | 0.999 | 0.227 | 0.347 |
| 10 | 1 | 20 | 0.800 | 8.654 | 1.469 | 0.999 | 0.302 | 0.401 |
| 10 | 3 | 20 | 0.800 | 8.644 | 1.465 | 0.999 | 0.306 | 0.406 |
| 10 | 5 | 20 | 0.800 | 8.638 | 1.460 | 0.999 | 0.311 | 0.409 |
| 20 | 1 | 20 | 0.800 | 8.654 | 1.469 | 0.999 | 0.269 | 0.380 |
| Test | Train | |||||||
|---|---|---|---|---|---|---|---|---|
| Max_Depth | Min_Child_Weight | N_Estimators | R2 | MAE × 10−2 | MSE × 10−1 | R2 | MAE × 10−2 | MSE × 10−1 |
| 5 | 3 | 200 | 0.810 | 8.242 | 1.416 | 0.999 | 0.323 | 0.407 |
| 5 | 5 | 200 | 0.809 | 8.270 | 1.418 | 0.999 | 0.325 | 0.409 |
| 5 | 3 | 100 | 0.807 | 8.370 | 1.426 | 0.999 | 0.325 | 0.409 |
| 5 | 5 | 100 | 0.807 | 8.375 | 1.426 | 0.999 | 0.328 | 0.411 |
| 5 | 1 | 100 | 0.805 | 8.443 | 1.433 | 0.999 | 0.322 | 0.408 |
| 5 | 1 | 200 | 0.805 | 8.456 | 1.435 | 0.999 | 0.318 | 0.405 |
| 5 | 1 | 200 | 0.804 | 8.494 | 1.442 | 0.999 | 0.347 | 0.426 |
| 3 | 1 | 100 | 0.804 | 8.494 | 1.442 | 0.999 | 0.337 | 0.420 |
| 3 | 1 | 200 | 0.804 | 8.494 | 1.442 | 0.999 | 0.347 | 0.426 |
| 3 | 3 | 200 | 0.804 | 8.494 | 1.442 | 0.999 | 0.337 | 0.420 |
| Test | Train | |||||||
|---|---|---|---|---|---|---|---|---|
| C | Epslion | Gamma | R2 | MAE × 10−3 | MSE × 10−2 | R2 | MAE × 10−3 | MSE × 10−2 |
| 1 | 0.001 | 0.01 | 0.992 | 3.500 | 4.484 | 0.999 | 3.680 | 4.344 |
| 10 | 0.001 | 0.01 | 0.992 | 3.500 | 4.488 | 0.999 | 3.690 | 4.350 |
| 10 | 0.01 | 0.01 | 0.992 | 3.530 | 4.491 | 0.999 | 3.700 | 4.363 |
| 1 | 0.001 | 0.1 | 0.991 | 4.080 | 4.887 | 0.999 | 3.710 | 4.376 |
| 10 | 0.001 | 0.1 | 0.991 | 3.770 | 4.684 | 0.999 | 3.690 | 4.355 |
| 10 | 0.001 | 1 | 0.991 | 3.860 | 4.748 | 0.999 | 3.680 | 4.343 |
| 0.1 | 0.001 | 1 | 0.990 | 4.320 | 4.992 | 0.999 | 3.730 | 4.398 |
| 1 | 0.001 | 1 | 0.990 | 4.190 | 4.952 | 0.999 | 3.680 | 4.341 |
| 1 | 0.01 | 0.01 | 0.990 | 4.450 | 5.039 | 0.999 | 3.910 | 4.577 |
| 1 | 0.01 | 0.1 | 0.990 | 4.520 | 5.123 | 0.999 | 3.750 | 4.439 |
| Test | Train | |||||||
|---|---|---|---|---|---|---|---|---|
| Activation | Hidden_Size | Epochs | R2 | MAE × 10−3 | MSE × 10−2 | R2 | MAE × 10−3 | MSE × 10−2 |
| tanh | 128 | 256 | 0.992 | 3.510 | 4.551 | 0.996 | 4.010 | 4.545 |
| tanh | 128 | 512 | 0.992 | 3.630 | 4.721 | 0.994 | 6.260 | 6.353 |
| tanh | 256 | 512 | 0.992 | 3.520 | 4.590 | 0.996 | 4.020 | 4.556 |
| tanh | 512 | 512 | 0.992 | 3.590 | 4.684 | 0.995 | 5.090 | 5.501 |
| sigmoid | 128 | 128 | 0.992 | 3.550 | 4.579 | 0.996 | 4.320 | 4.802 |
| tanh | 512 | 256 | 0.991 | 3.990 | 4.815 | 0.991 | 8.630 | 7.800 |
| sigmoid | 256 | 128 | 0.991 | 3.760 | 4.713 | 0.994 | 5.910 | 6.018 |
| tanh | 256 | 256 | 0.987 | 5.770 | 5.952 | 0.994 | 5.390 | 5.665 |
| sigmoid | 128 | 256 | 0.987 | 5.550 | 6.091 | 0.996 | 4.020 | 4.559 |
| tanh | 512 | 128 | 0.984 | 6.730 | 6.285 | 0.993 | 6.530 | 6.507 |
| R2 | MSE × 10−3 | MAE × 10−2 | ||
|---|---|---|---|---|
| P-3 | SVR | 0.993 | 3.580 | 4.468 |
| LSTM | 0.993 | 3.581 | 4.517 | |
| P-4 | SVR | 0.992 | 3.534 | 4.382 |
| LSTM | 0.990 | 3.720 | 4.608 | |
| P-5 | SVR | 0.994 | 3.530 | 4.470 |
| LSTM | 0.993 | 3.940 | 4.729 |
Disclaimer/Publisher’s Note: The statements, opinions and data contained in all publications are solely those of the individual author(s) and contributor(s) and not of MDPI and/or the editor(s). MDPI and/or the editor(s) disclaim responsibility for any injury to people or property resulting from any ideas, methods, instructions or products referred to in the content. |
© 2024 by the authors. Licensee MDPI, Basel, Switzerland. This article is an open access article distributed under the terms and conditions of the Creative Commons Attribution (CC BY) license (https://creativecommons.org/licenses/by/4.0/).
Share and Cite
Zheng, X.; Liu, Z.; Gao, X.; Song, Z.; Chen, C.; Wei, H. Predicting the Displacement Variation of Rehabilitated Foundation of Onshore Wind Turbines Using Machine Learning Models. Buildings 2024, 14, 759. https://doi.org/10.3390/buildings14030759
Zheng X, Liu Z, Gao X, Song Z, Chen C, Wei H. Predicting the Displacement Variation of Rehabilitated Foundation of Onshore Wind Turbines Using Machine Learning Models. Buildings. 2024; 14(3):759. https://doi.org/10.3390/buildings14030759
Chicago/Turabian StyleZheng, Xiao, Zhonghua Liu, Xiangrong Gao, Zhixin Song, Chaowei Chen, and Huanwei Wei. 2024. "Predicting the Displacement Variation of Rehabilitated Foundation of Onshore Wind Turbines Using Machine Learning Models" Buildings 14, no. 3: 759. https://doi.org/10.3390/buildings14030759
APA StyleZheng, X., Liu, Z., Gao, X., Song, Z., Chen, C., & Wei, H. (2024). Predicting the Displacement Variation of Rehabilitated Foundation of Onshore Wind Turbines Using Machine Learning Models. Buildings, 14(3), 759. https://doi.org/10.3390/buildings14030759