
Model Test Study on the Vertical Uplift Bearing Characteristics of Soil Continuous Solidified Pile Group Foundations

 ,
, 


Abstract
1. Introduction
2. Materials and Methods
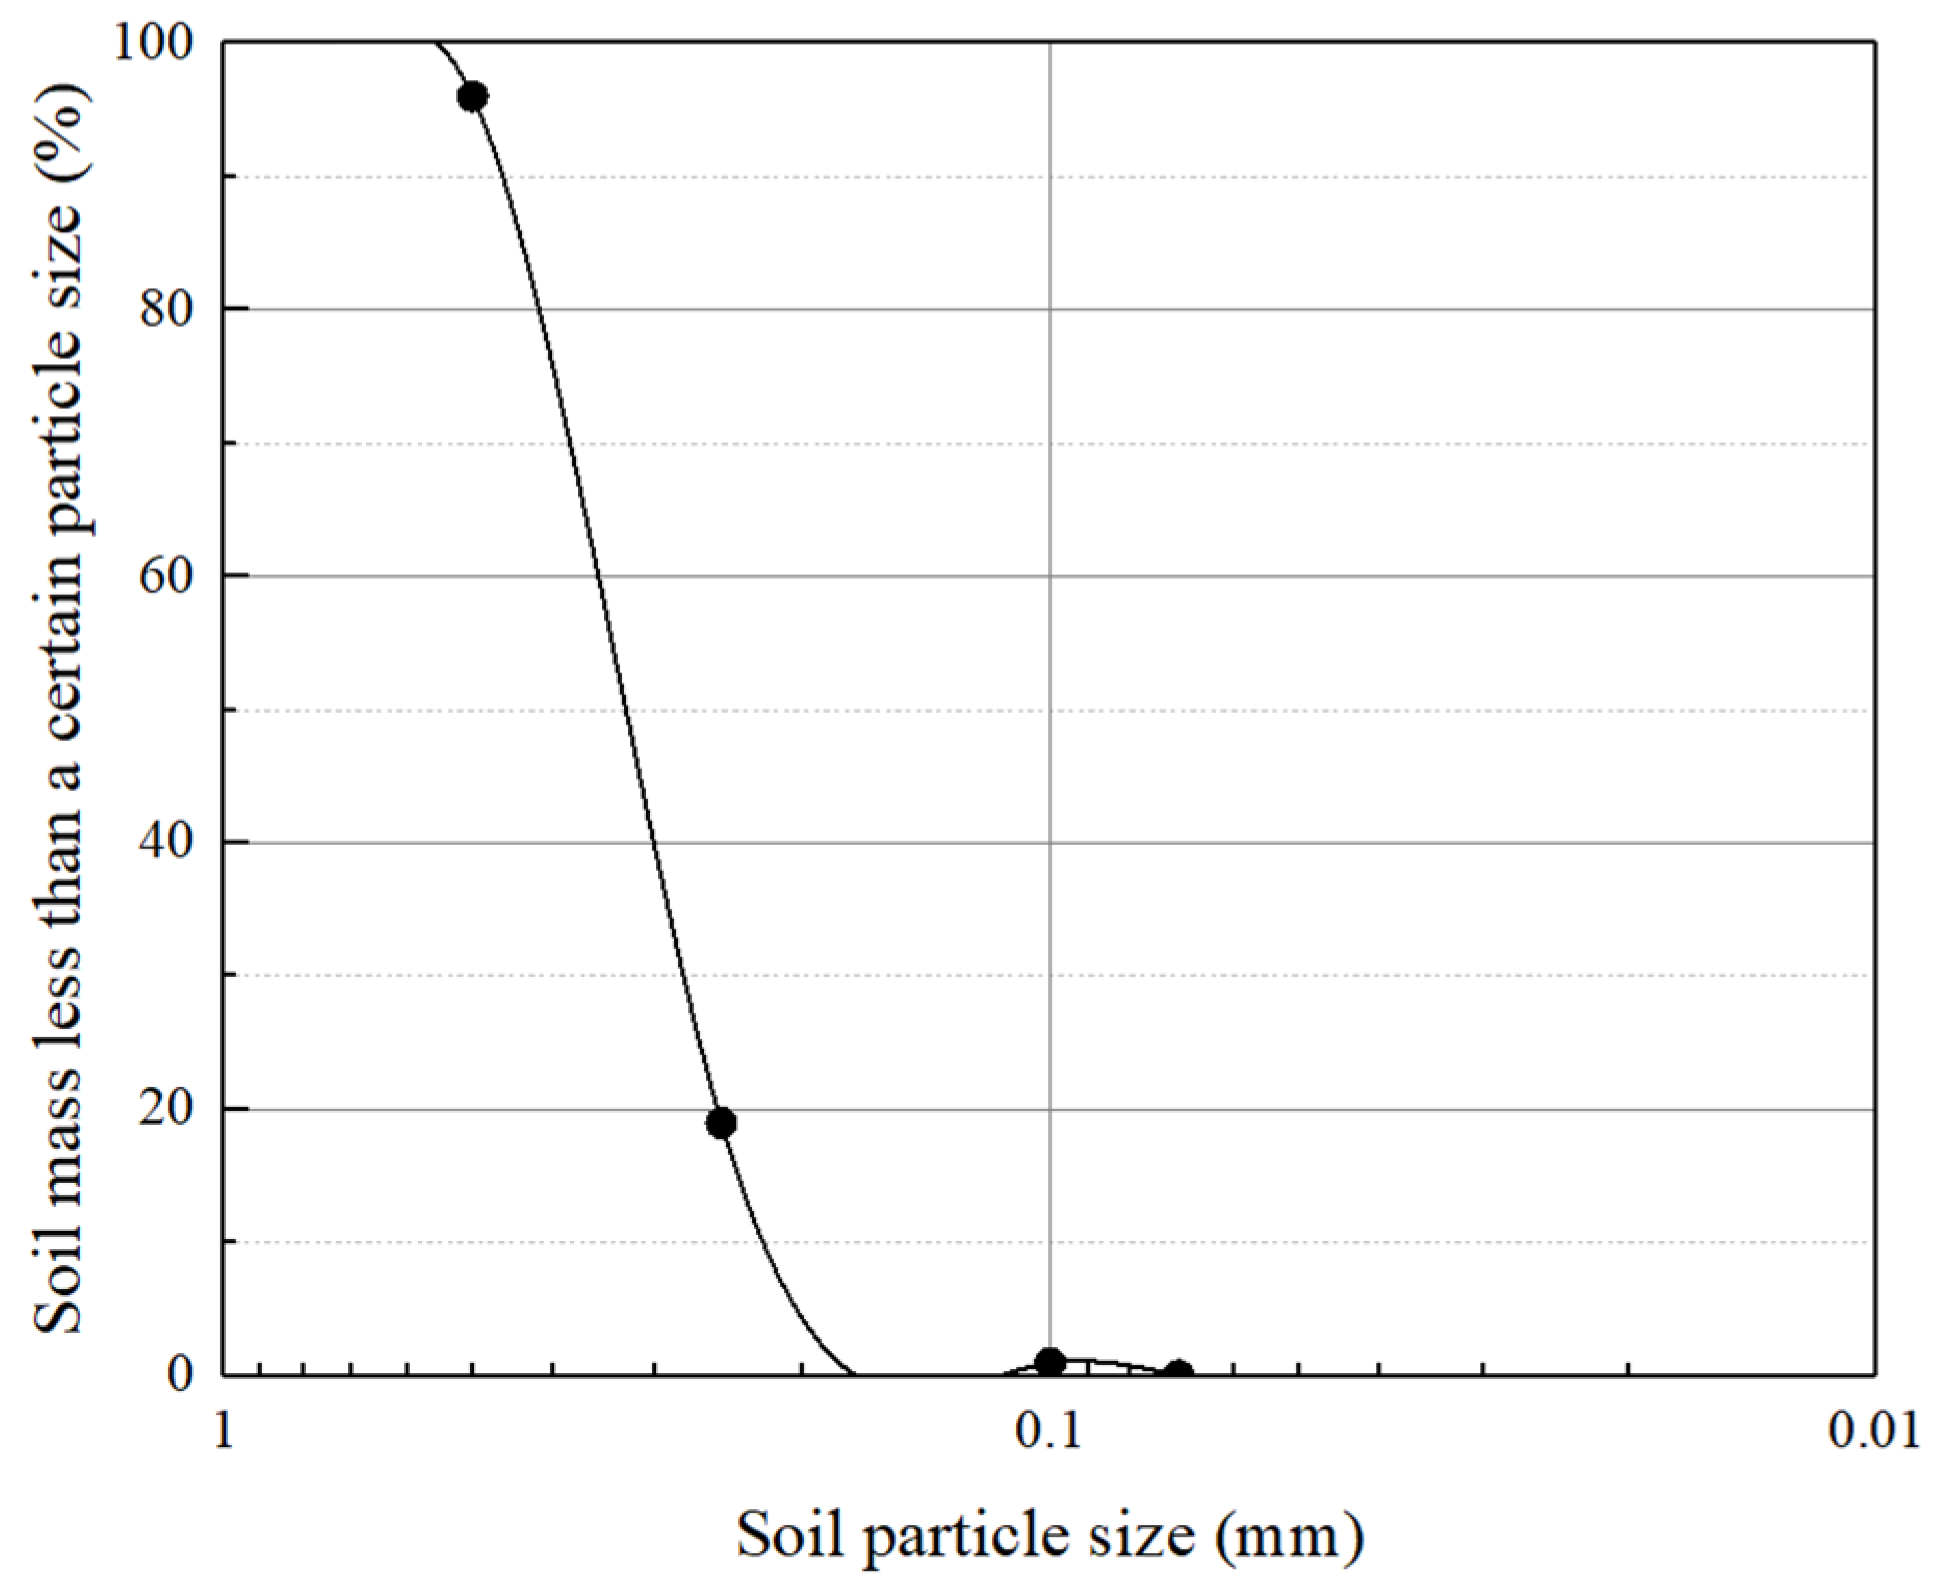
2.1. Test Material
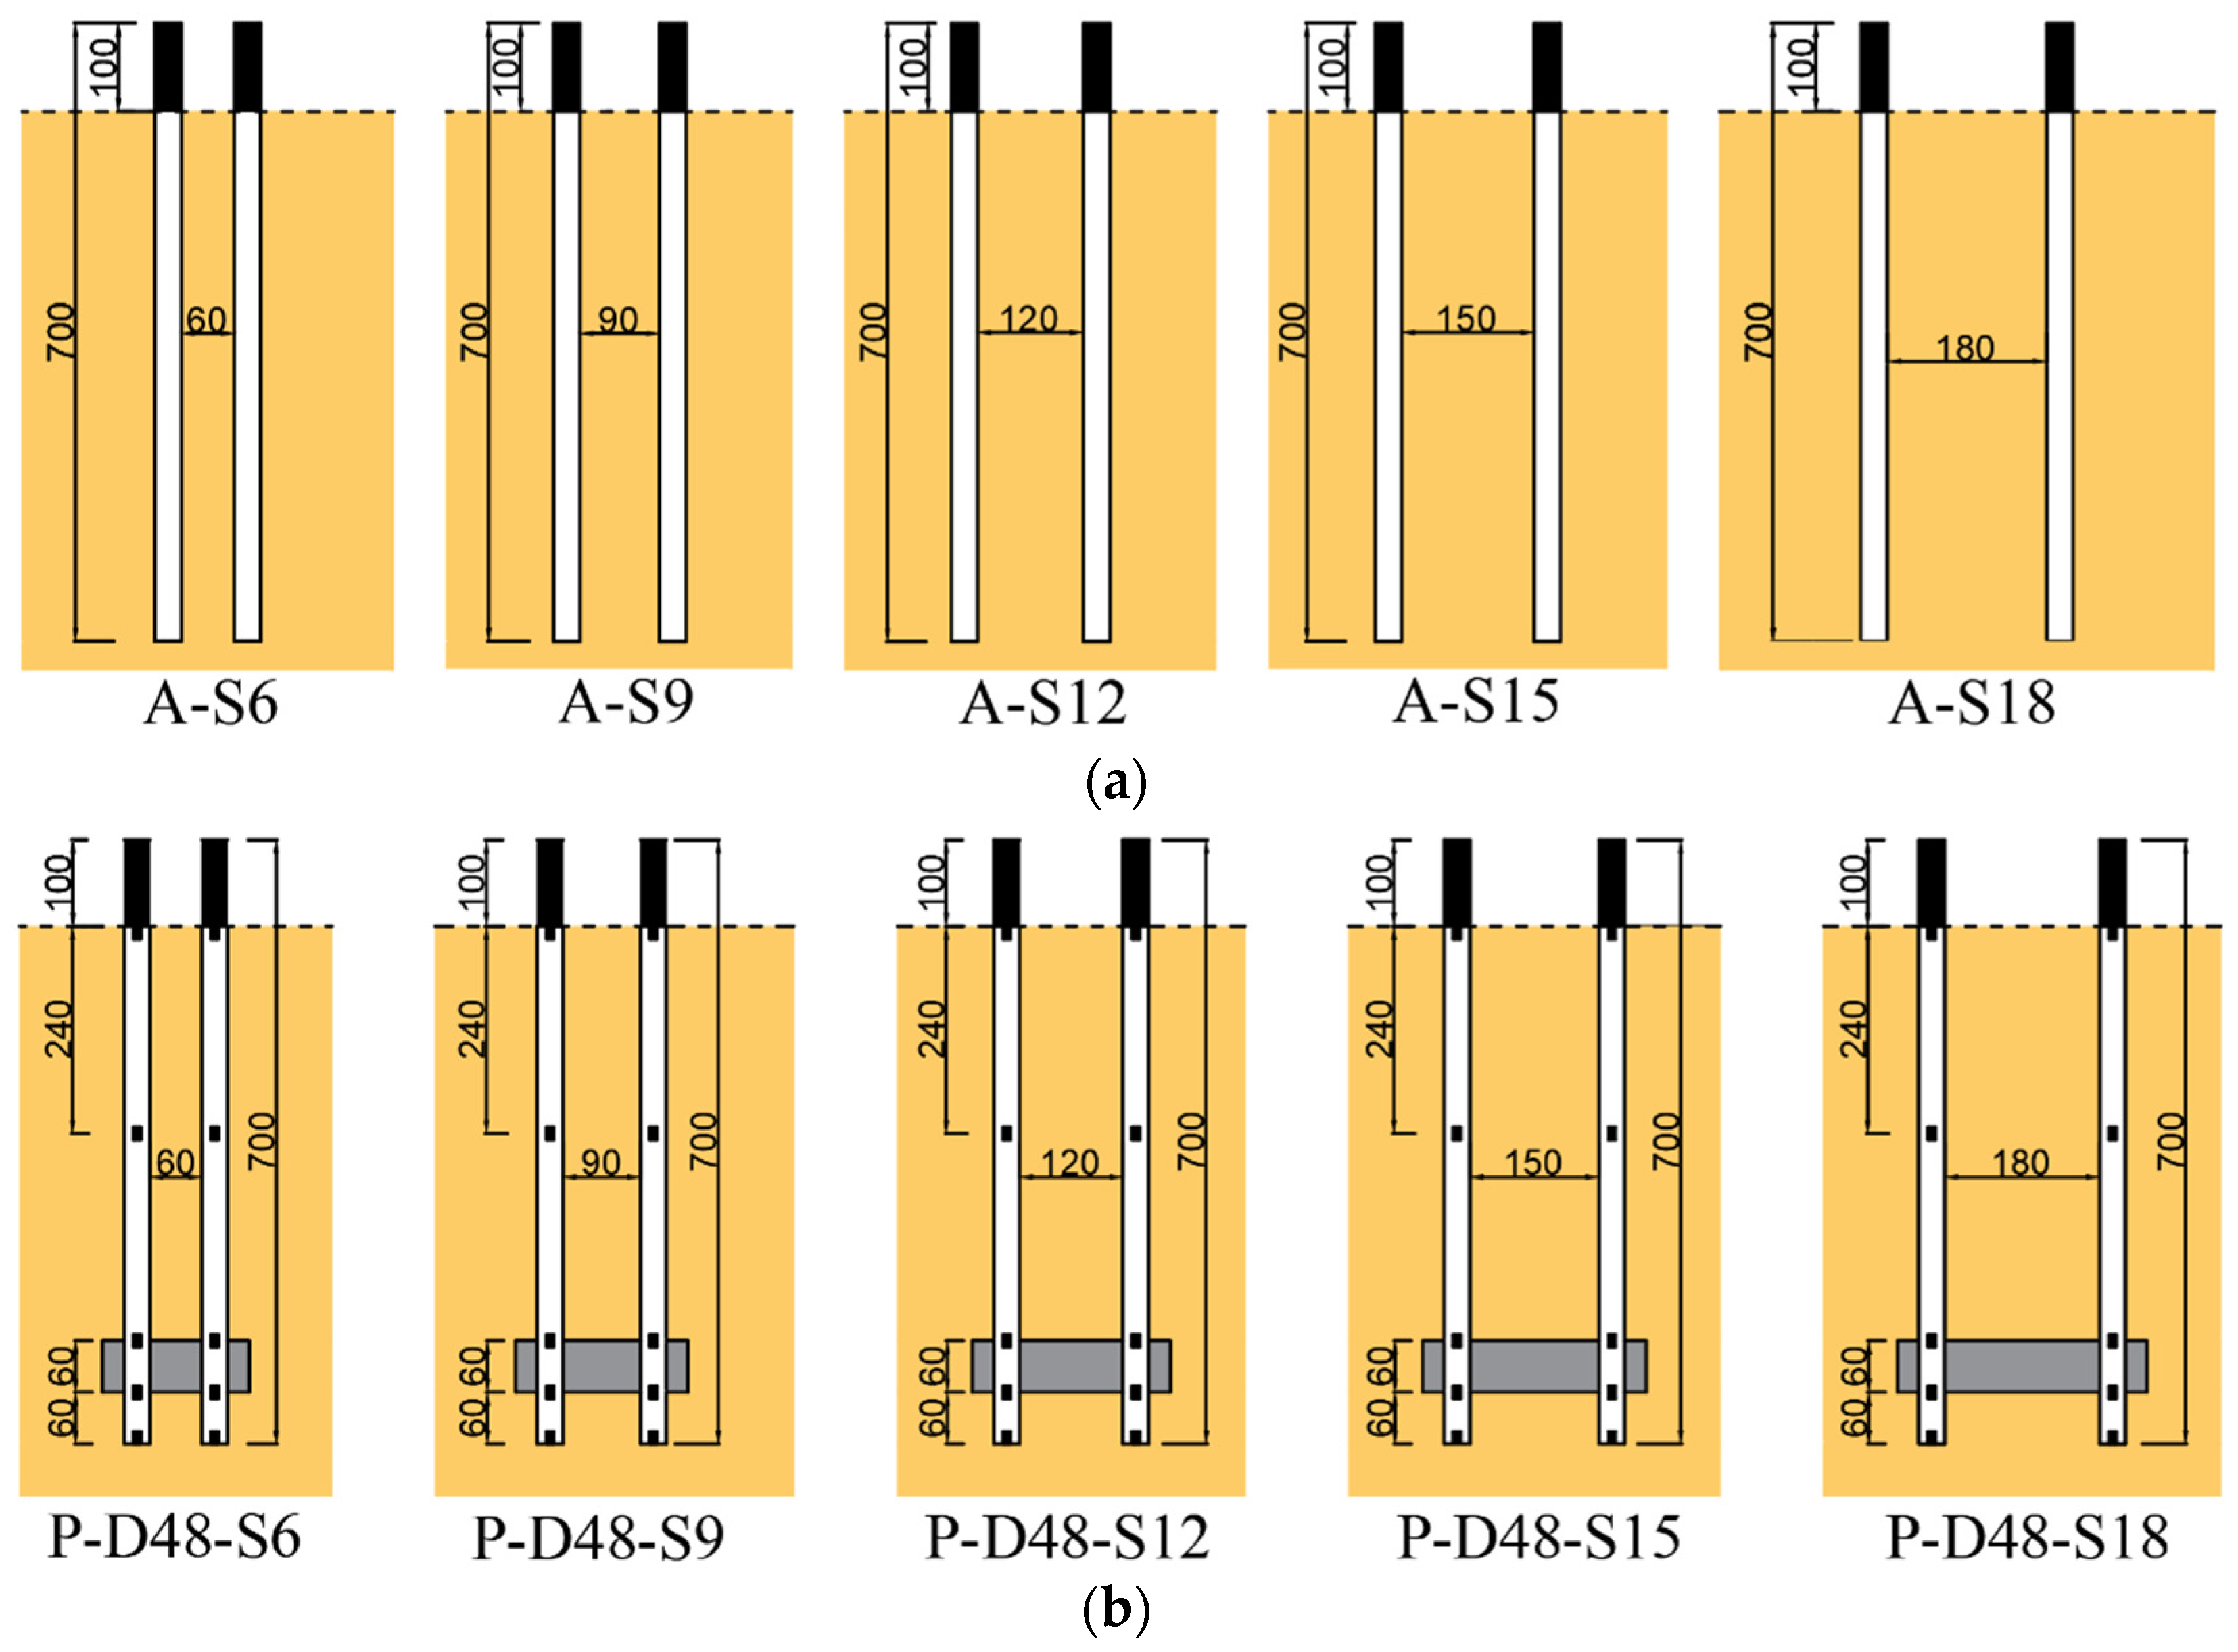
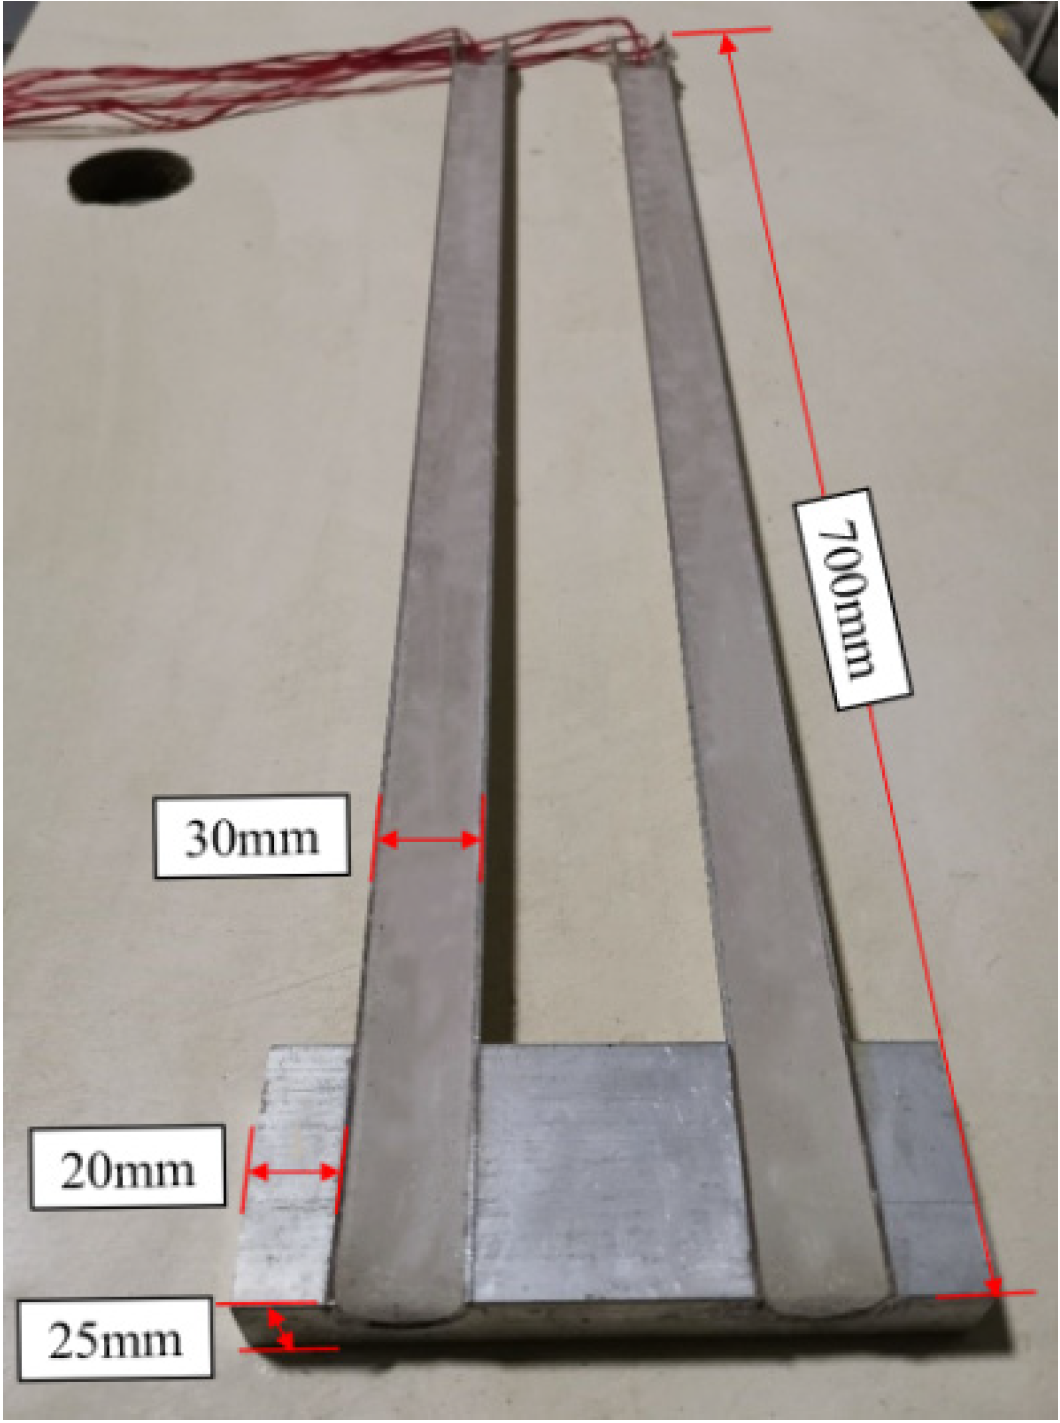
2.2. Test Design
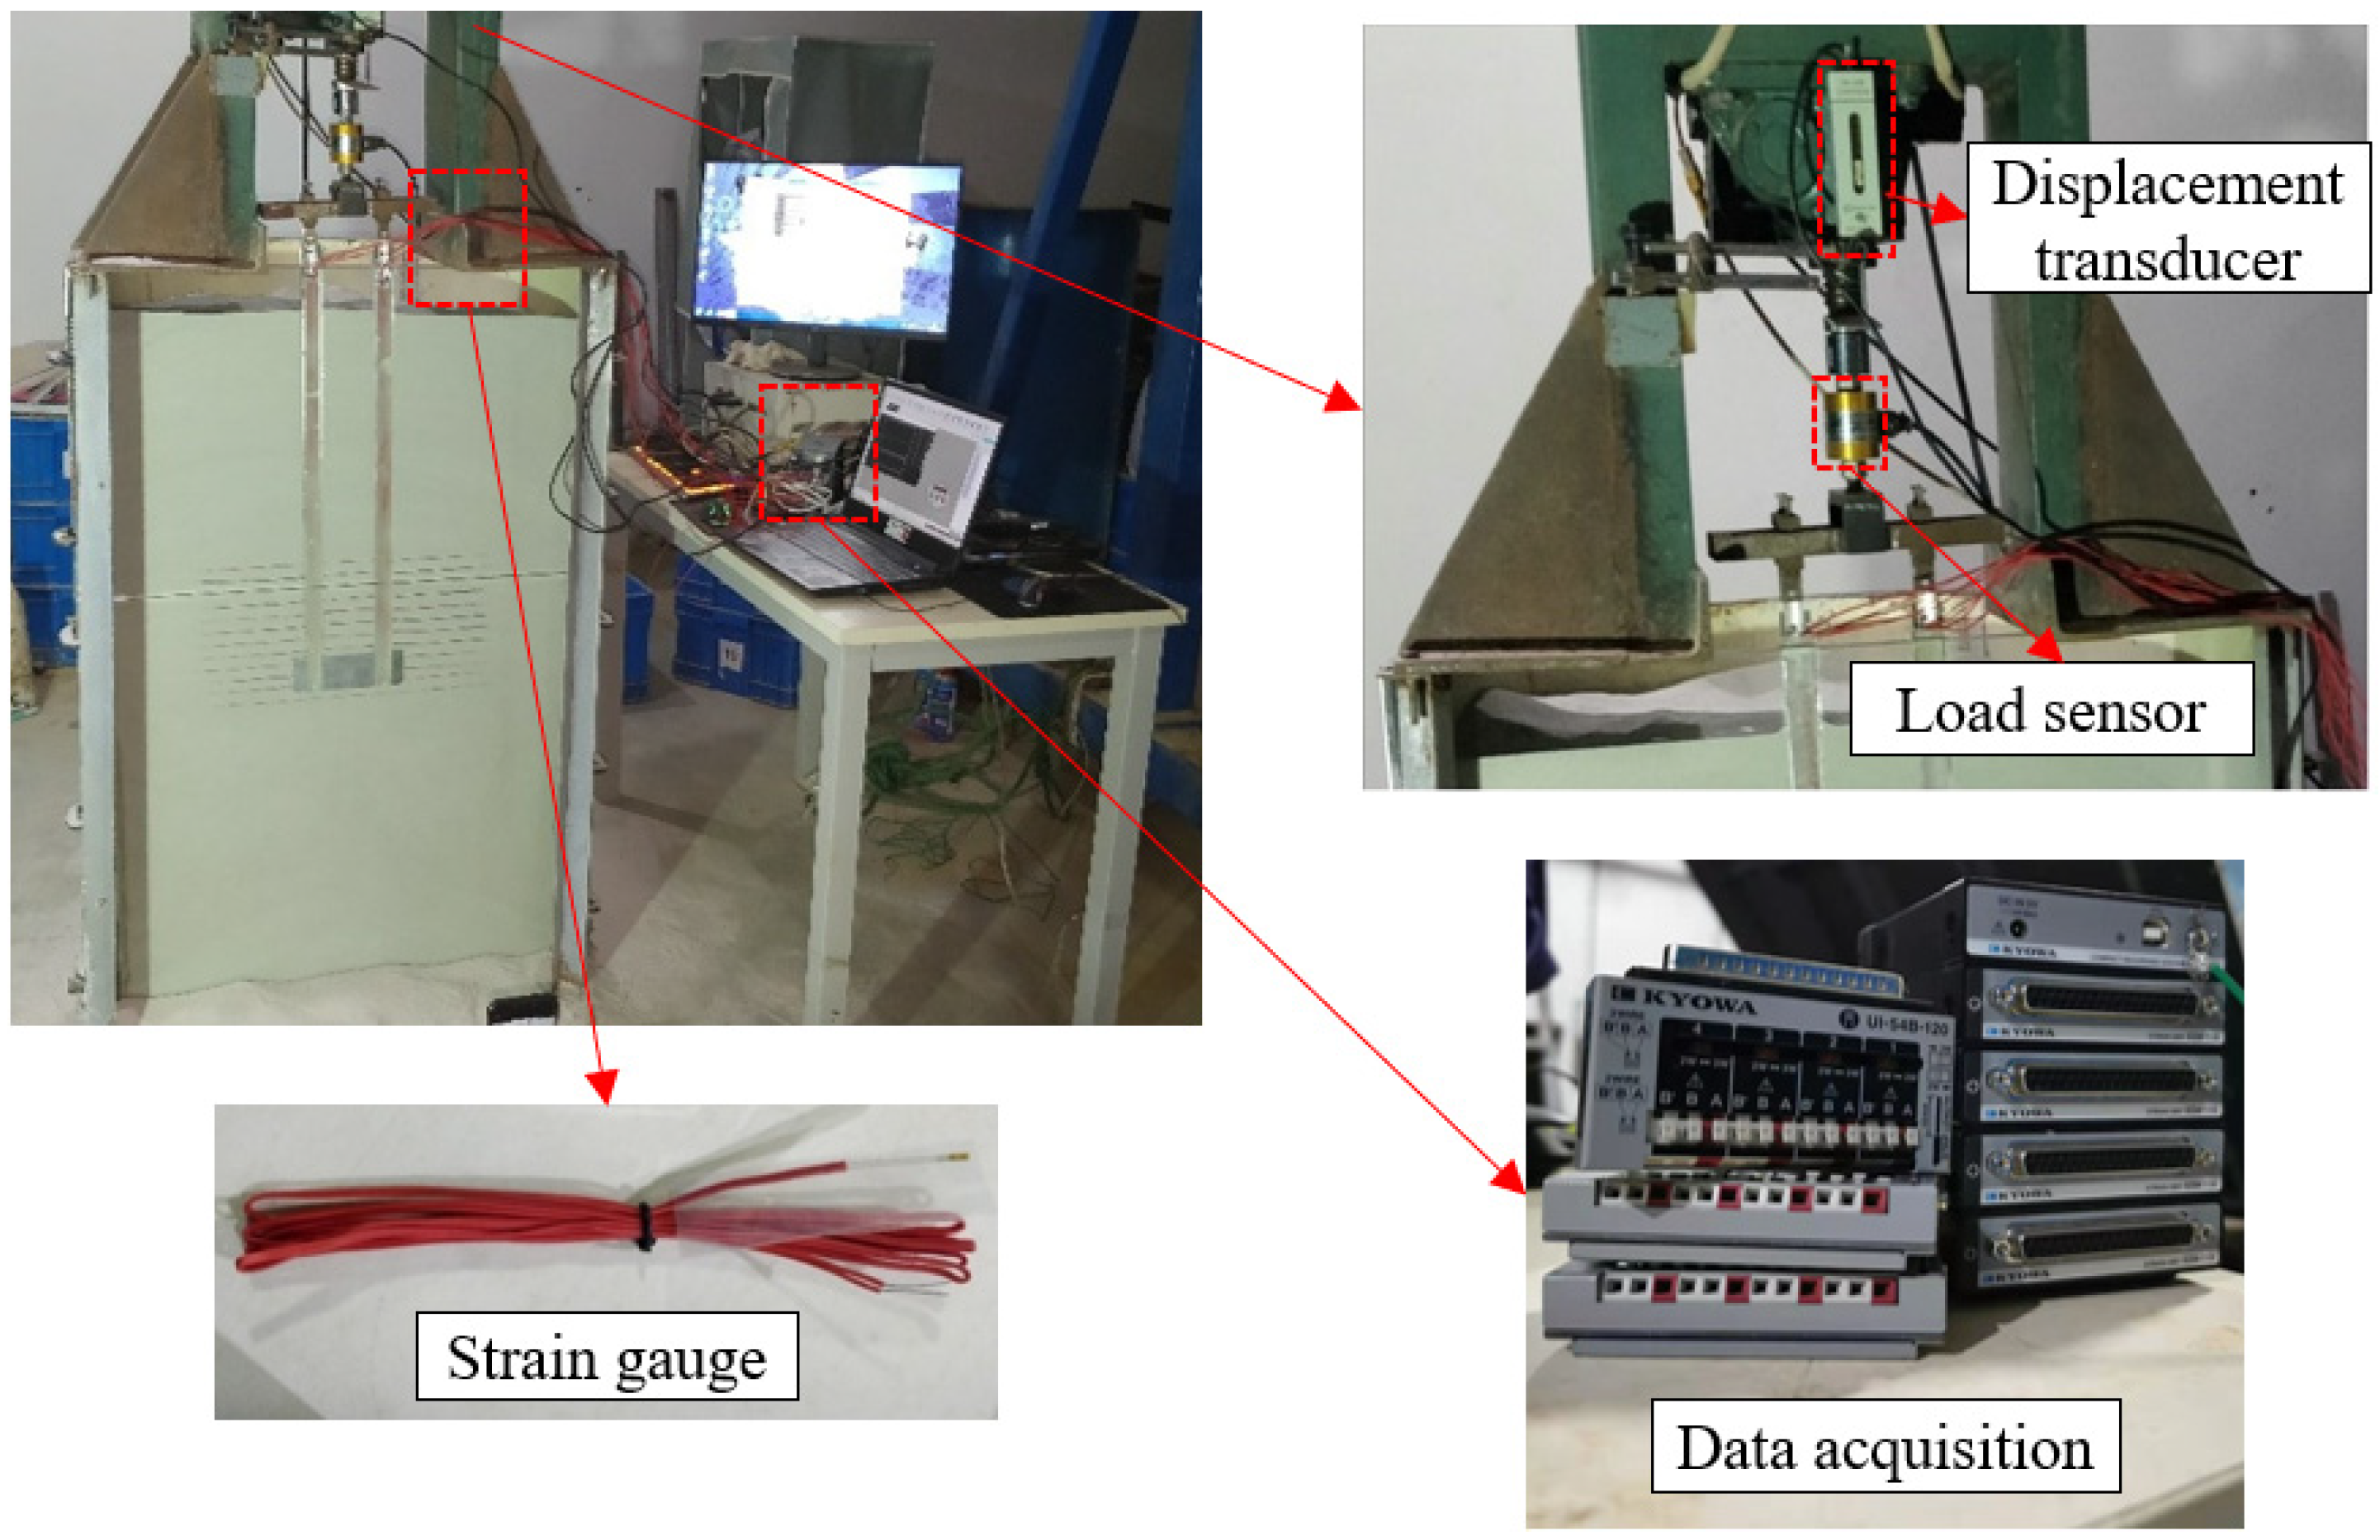
2.3. Test Implementation
3. Results
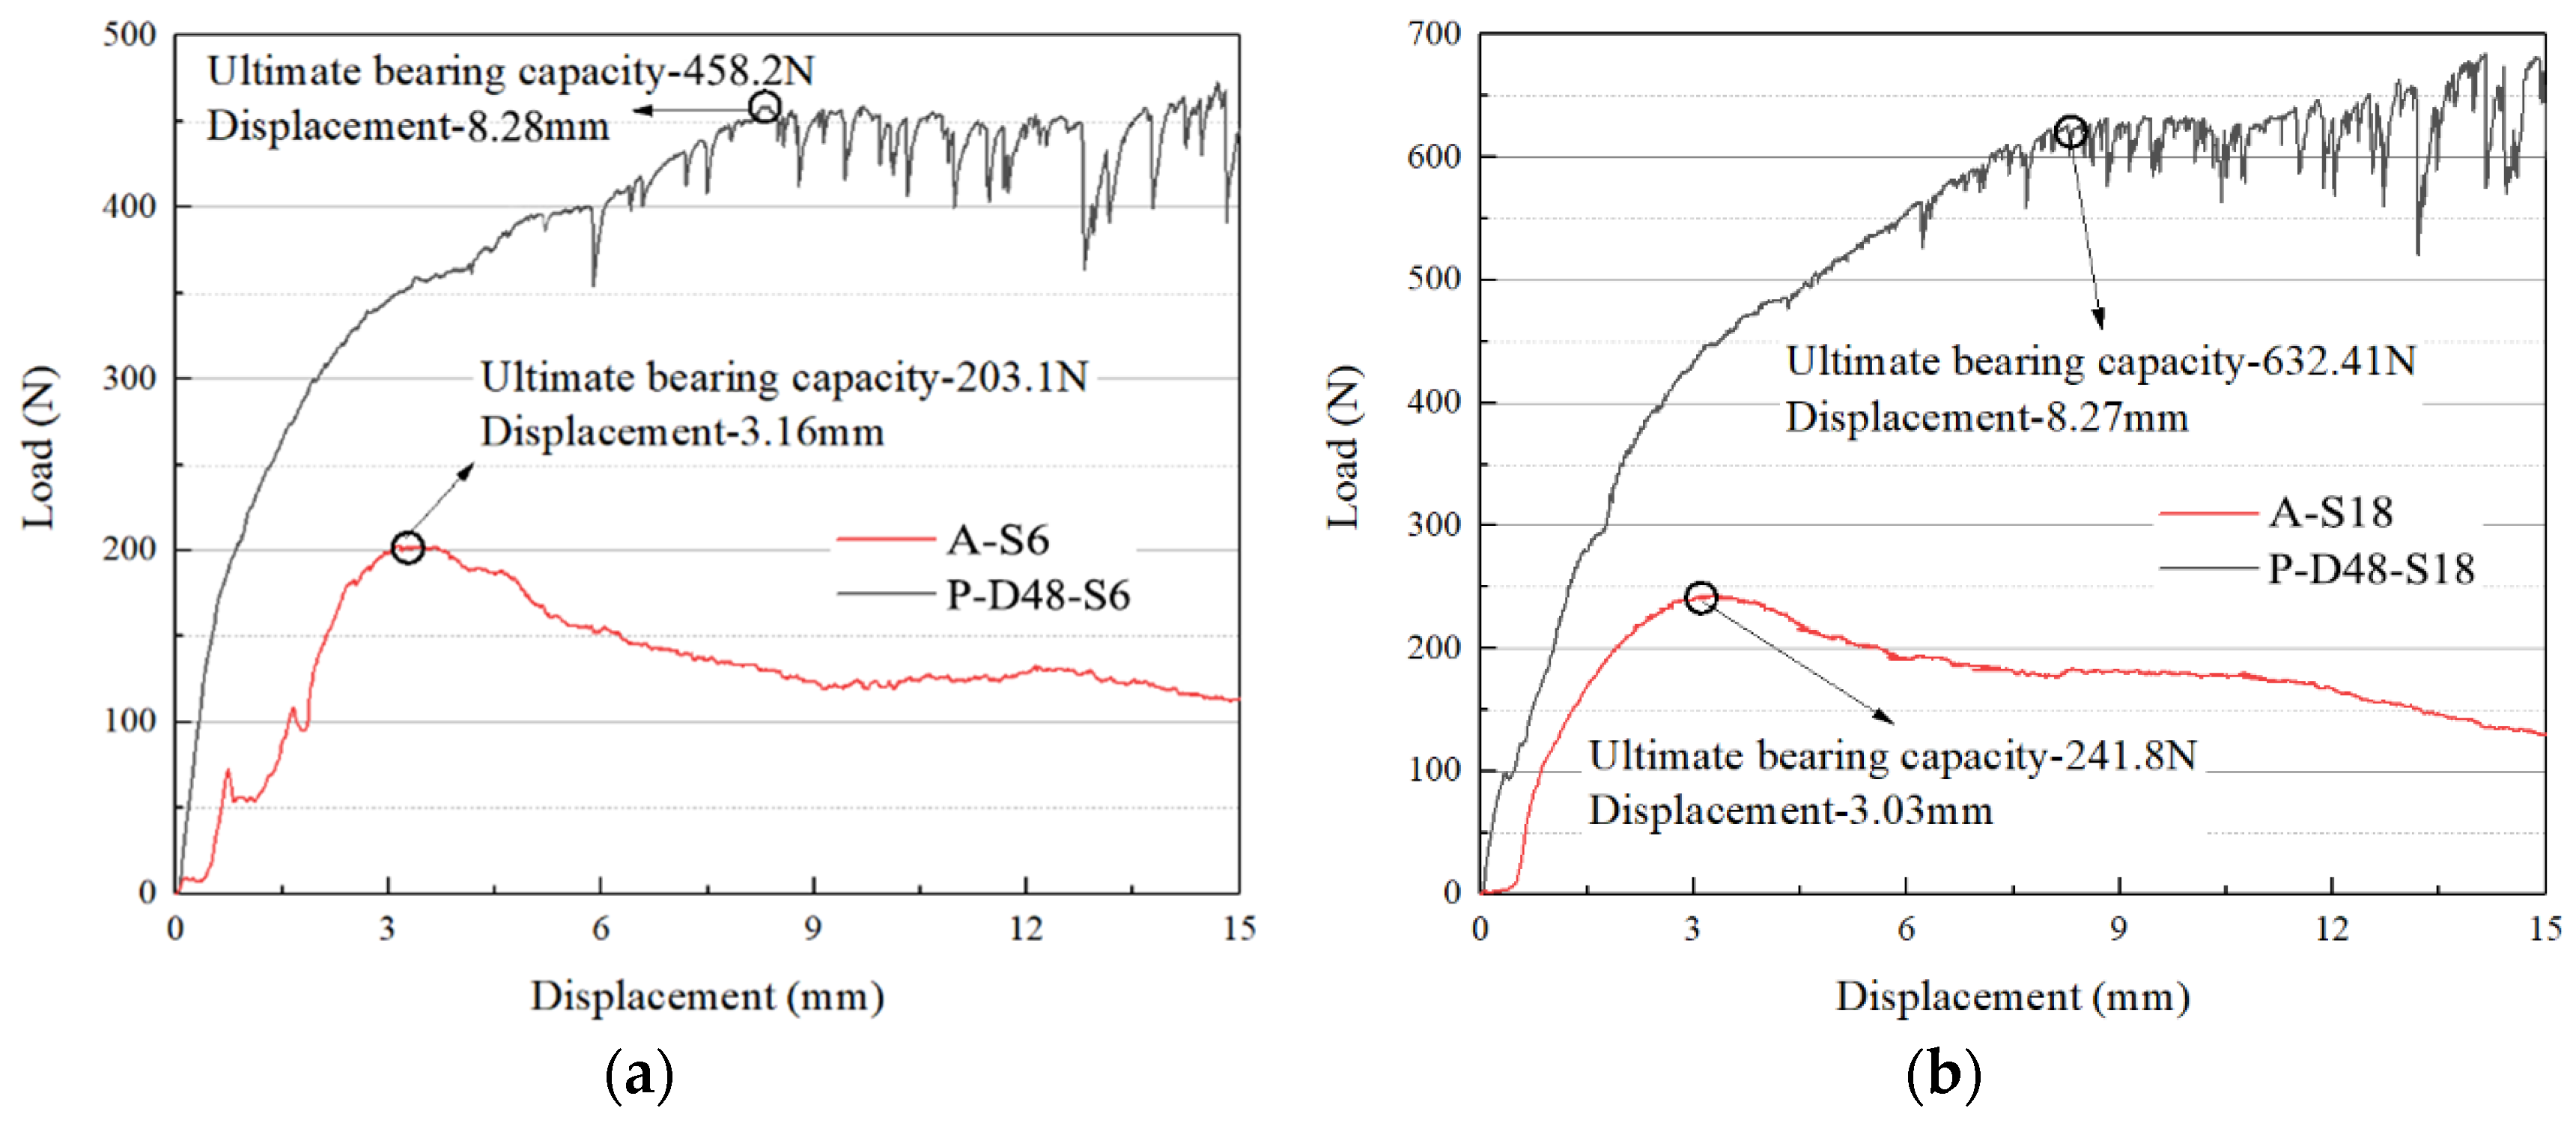
3.1. Comparative Analysis of the Load Bearing Performance with and without a CSM
3.2. Influence of the Pile Spacing on the Bearing Characteristics
3.2.1. Load–Displacement Curve
3.2.2. Axial Force Distribution of the Pile Body
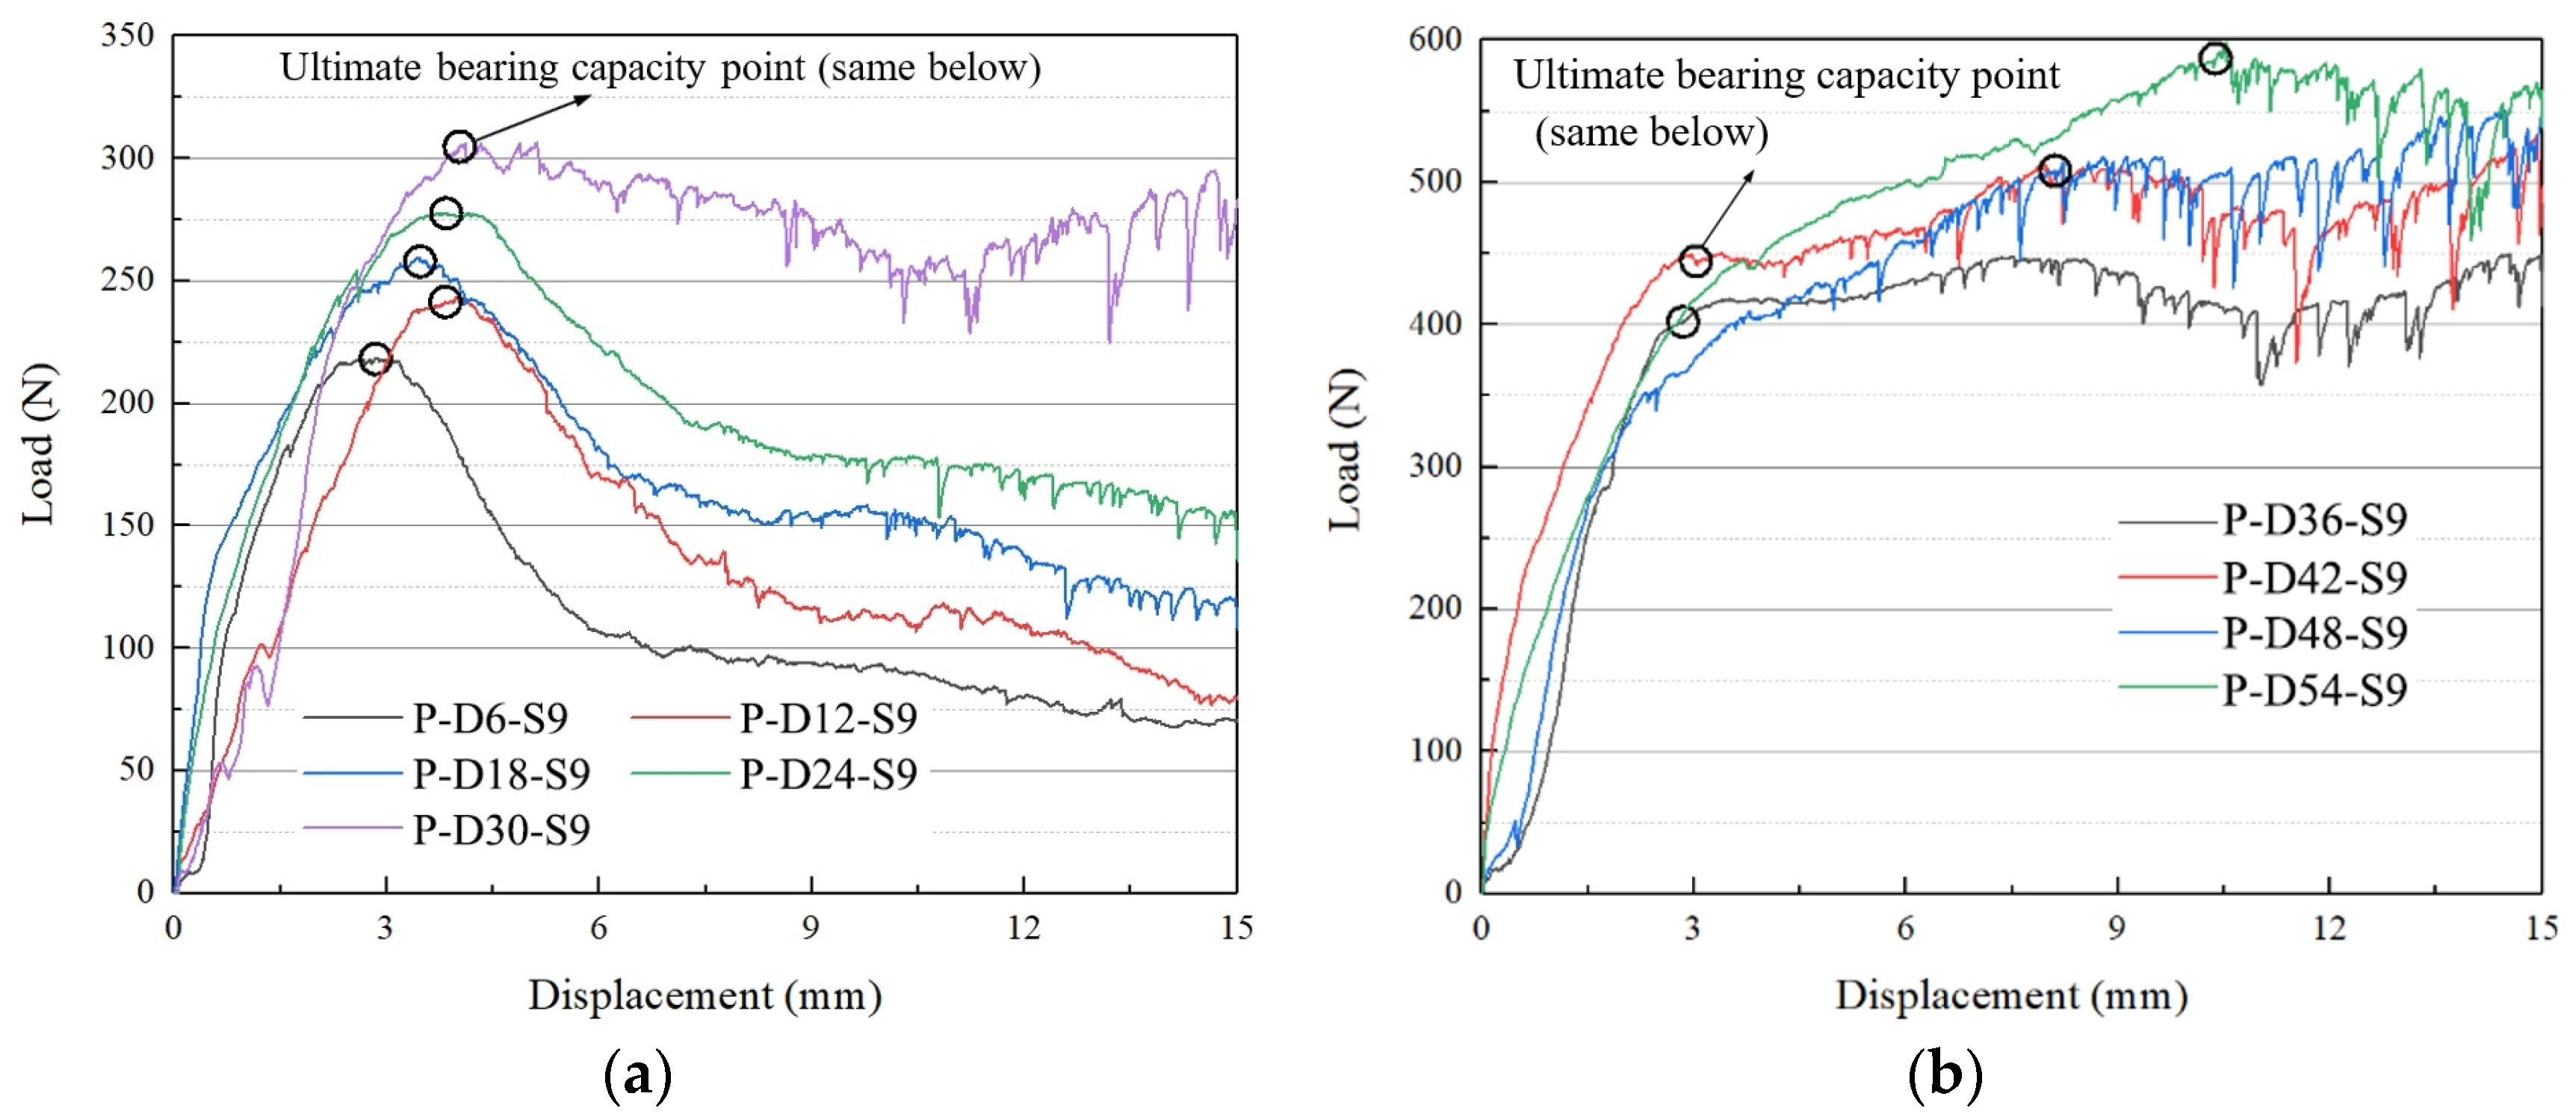
3.3. Influence of the CSM Depth on Bearing Characteristics
3.3.1. Load–Displacement Curve
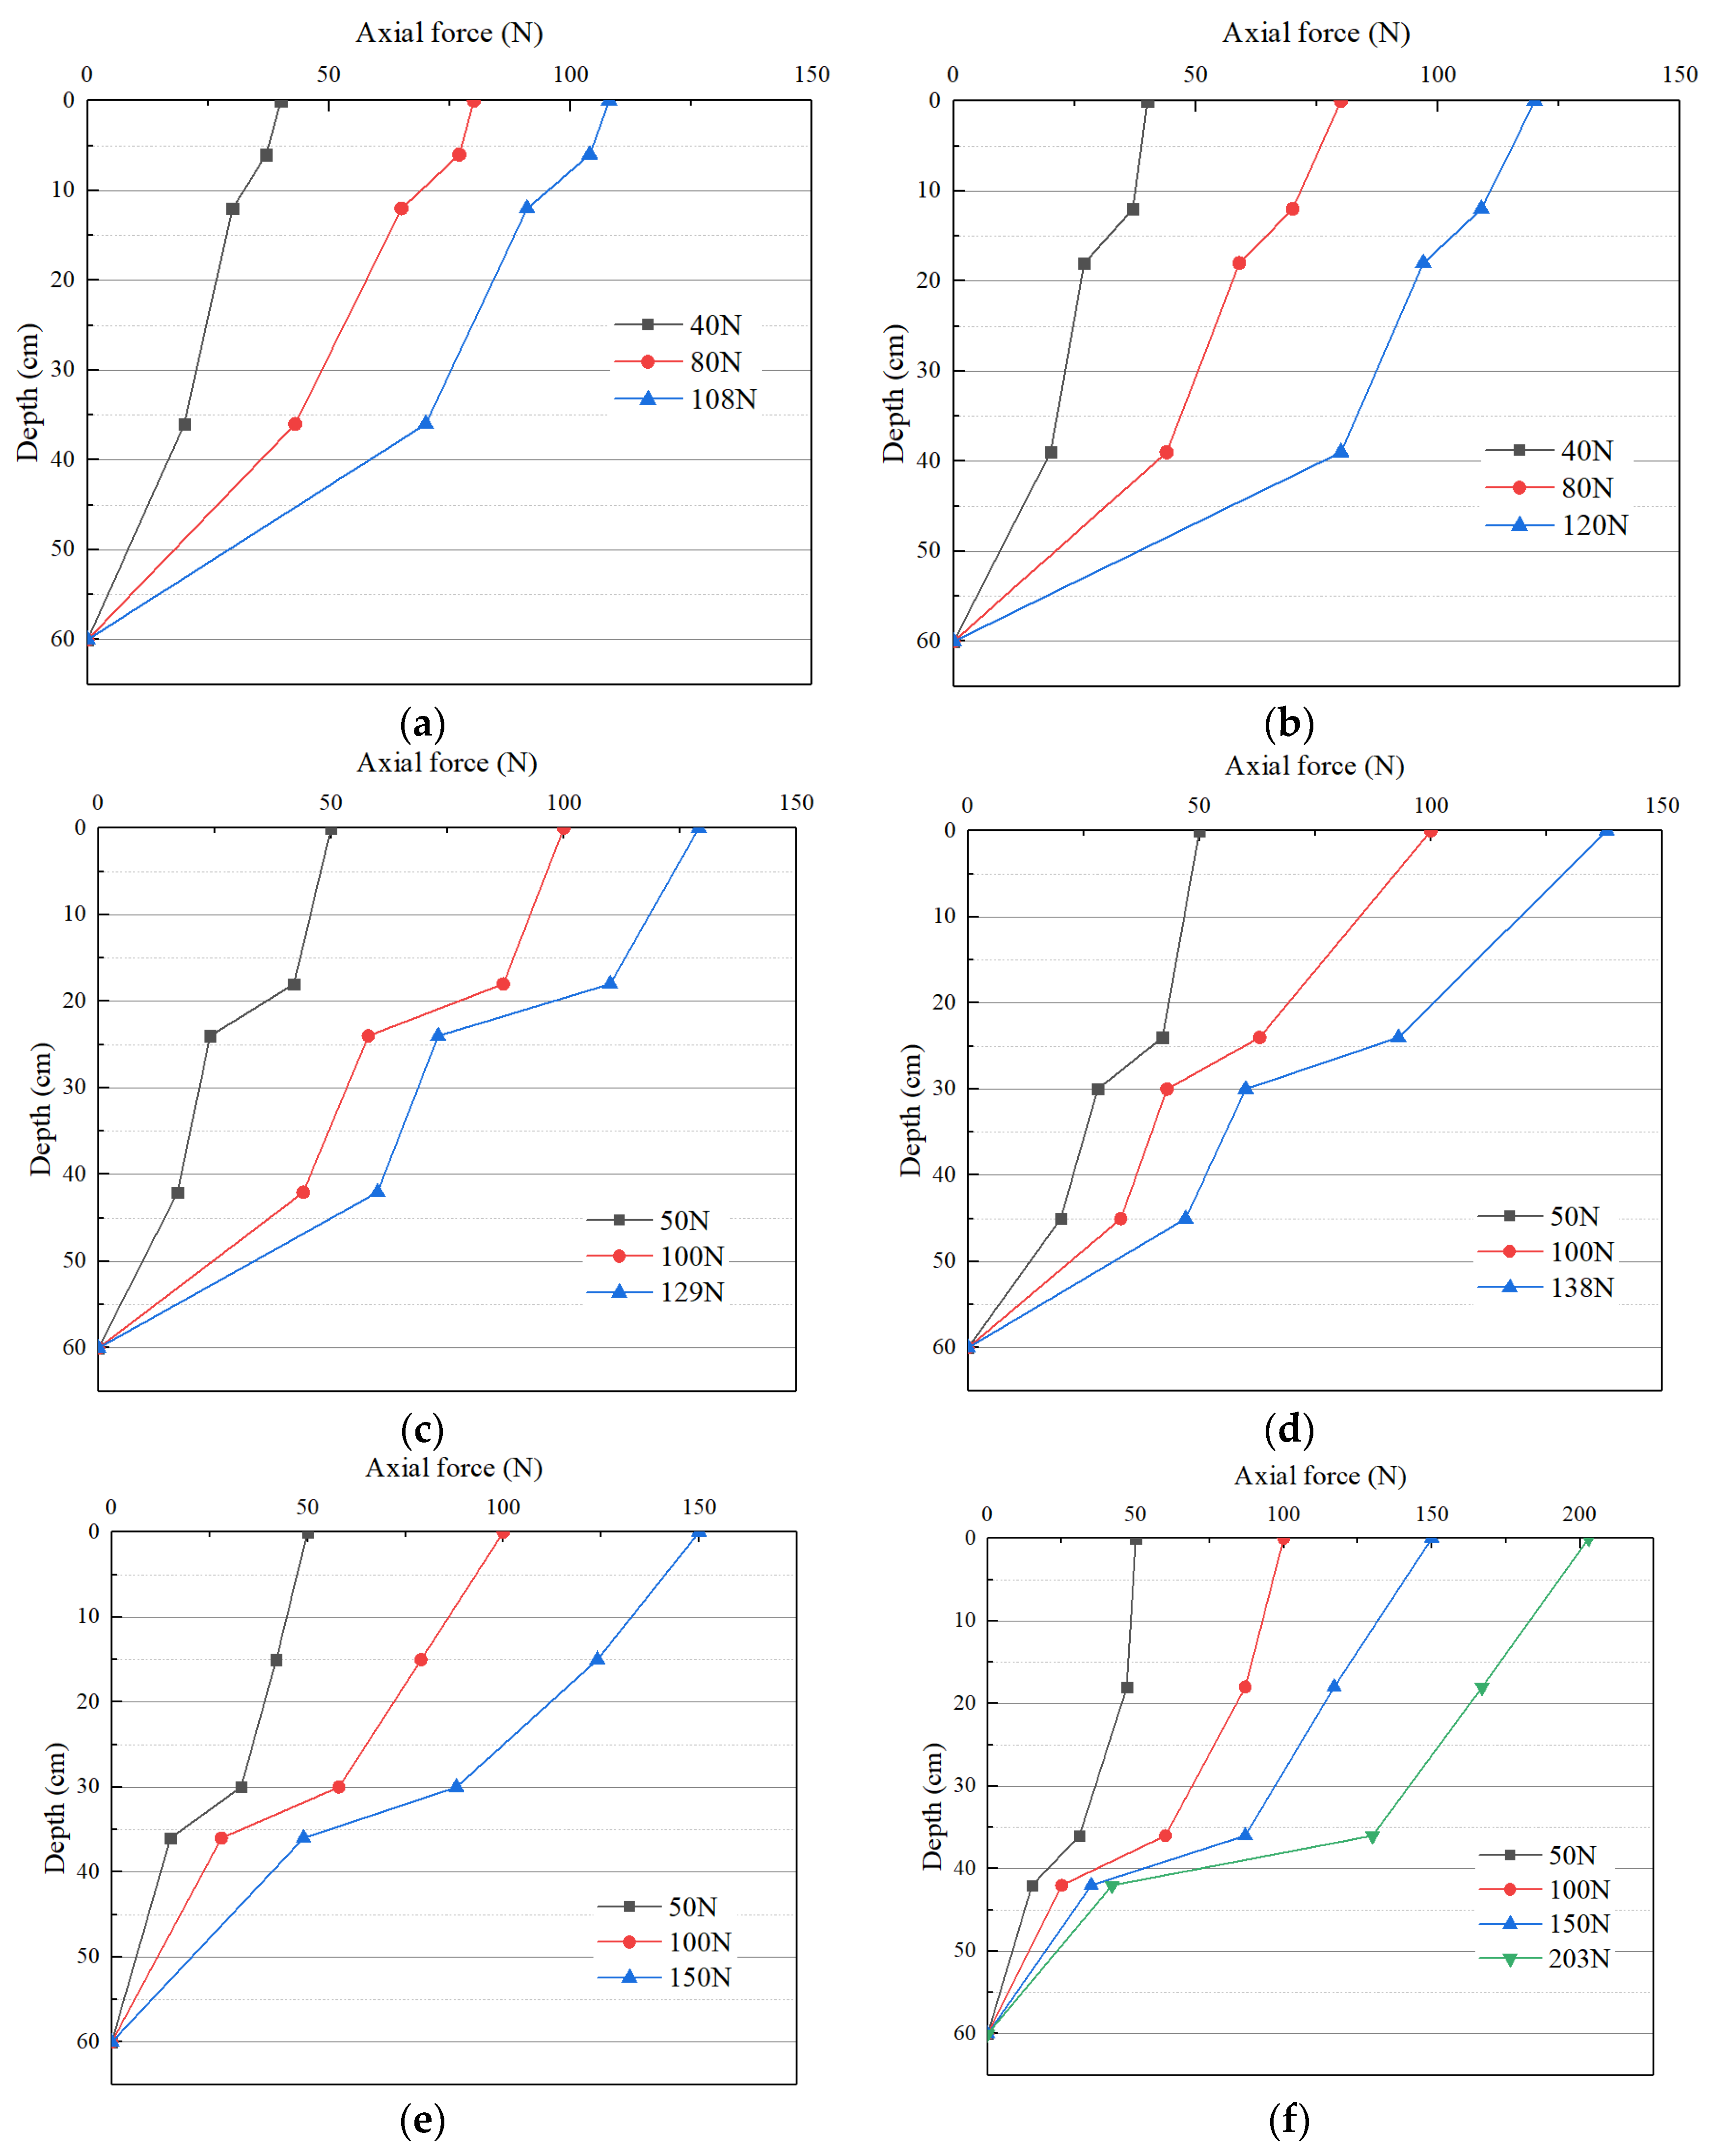
3.3.2. Axial Force of the Pile Body
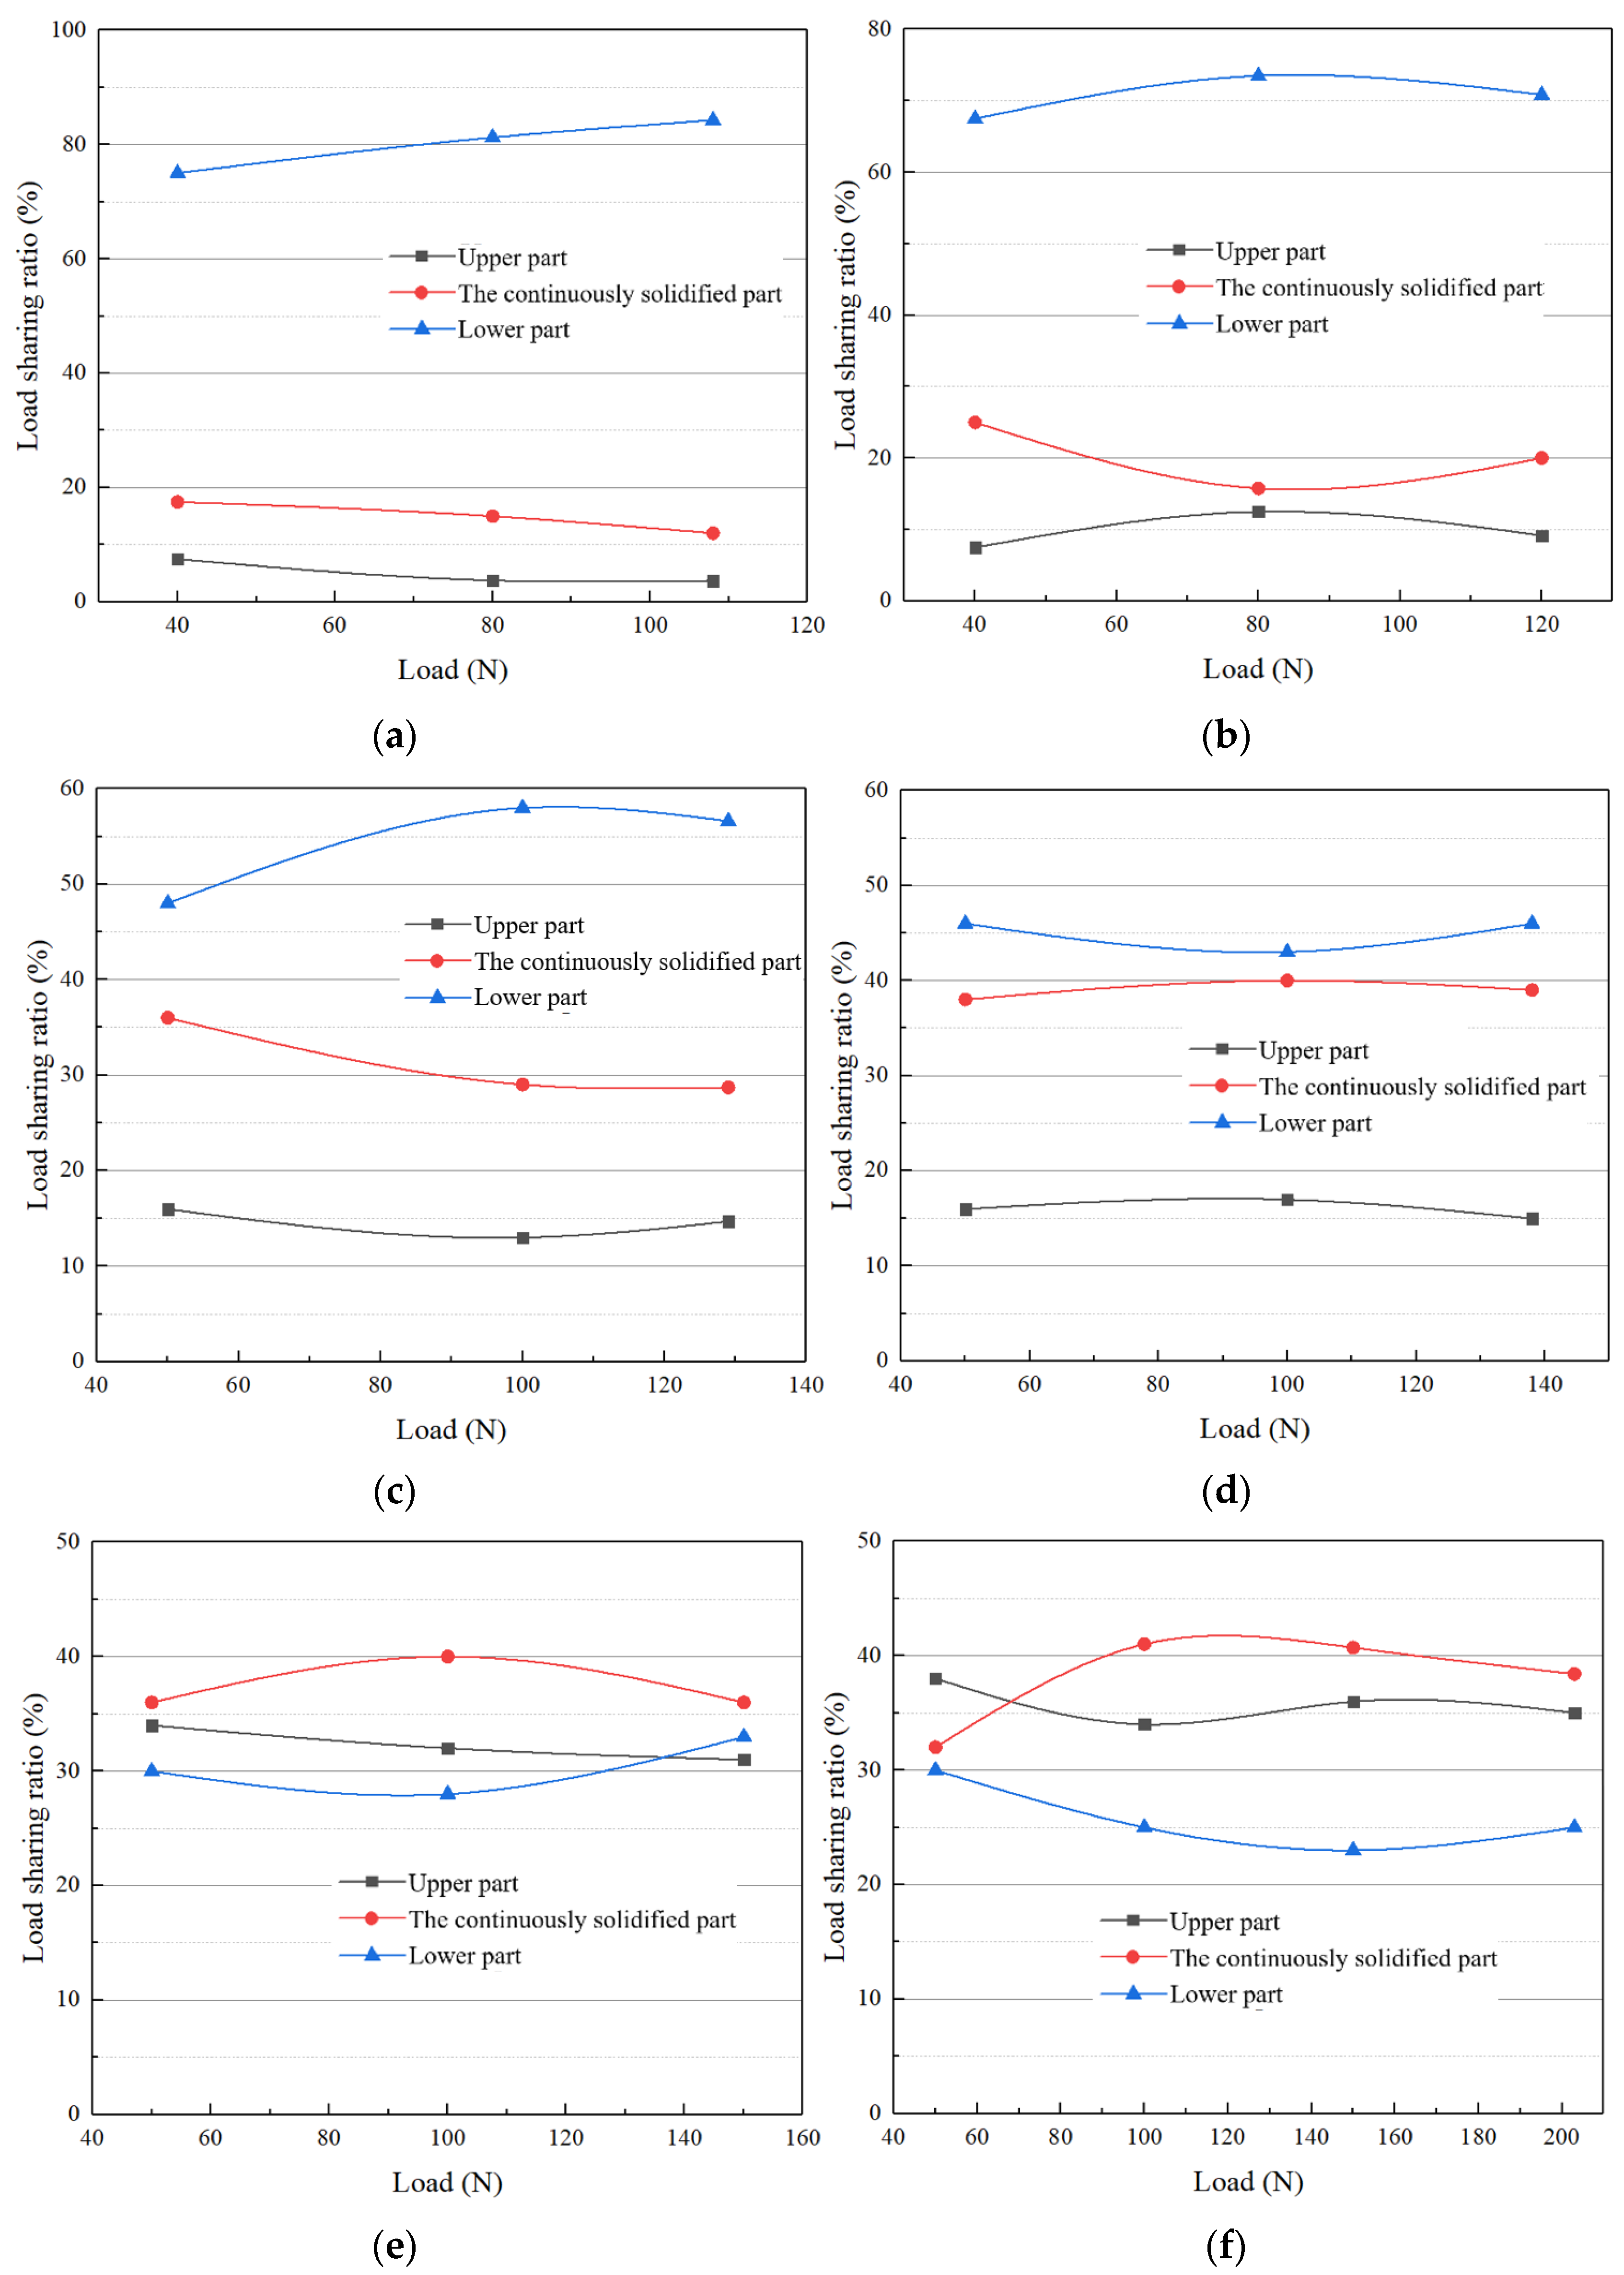
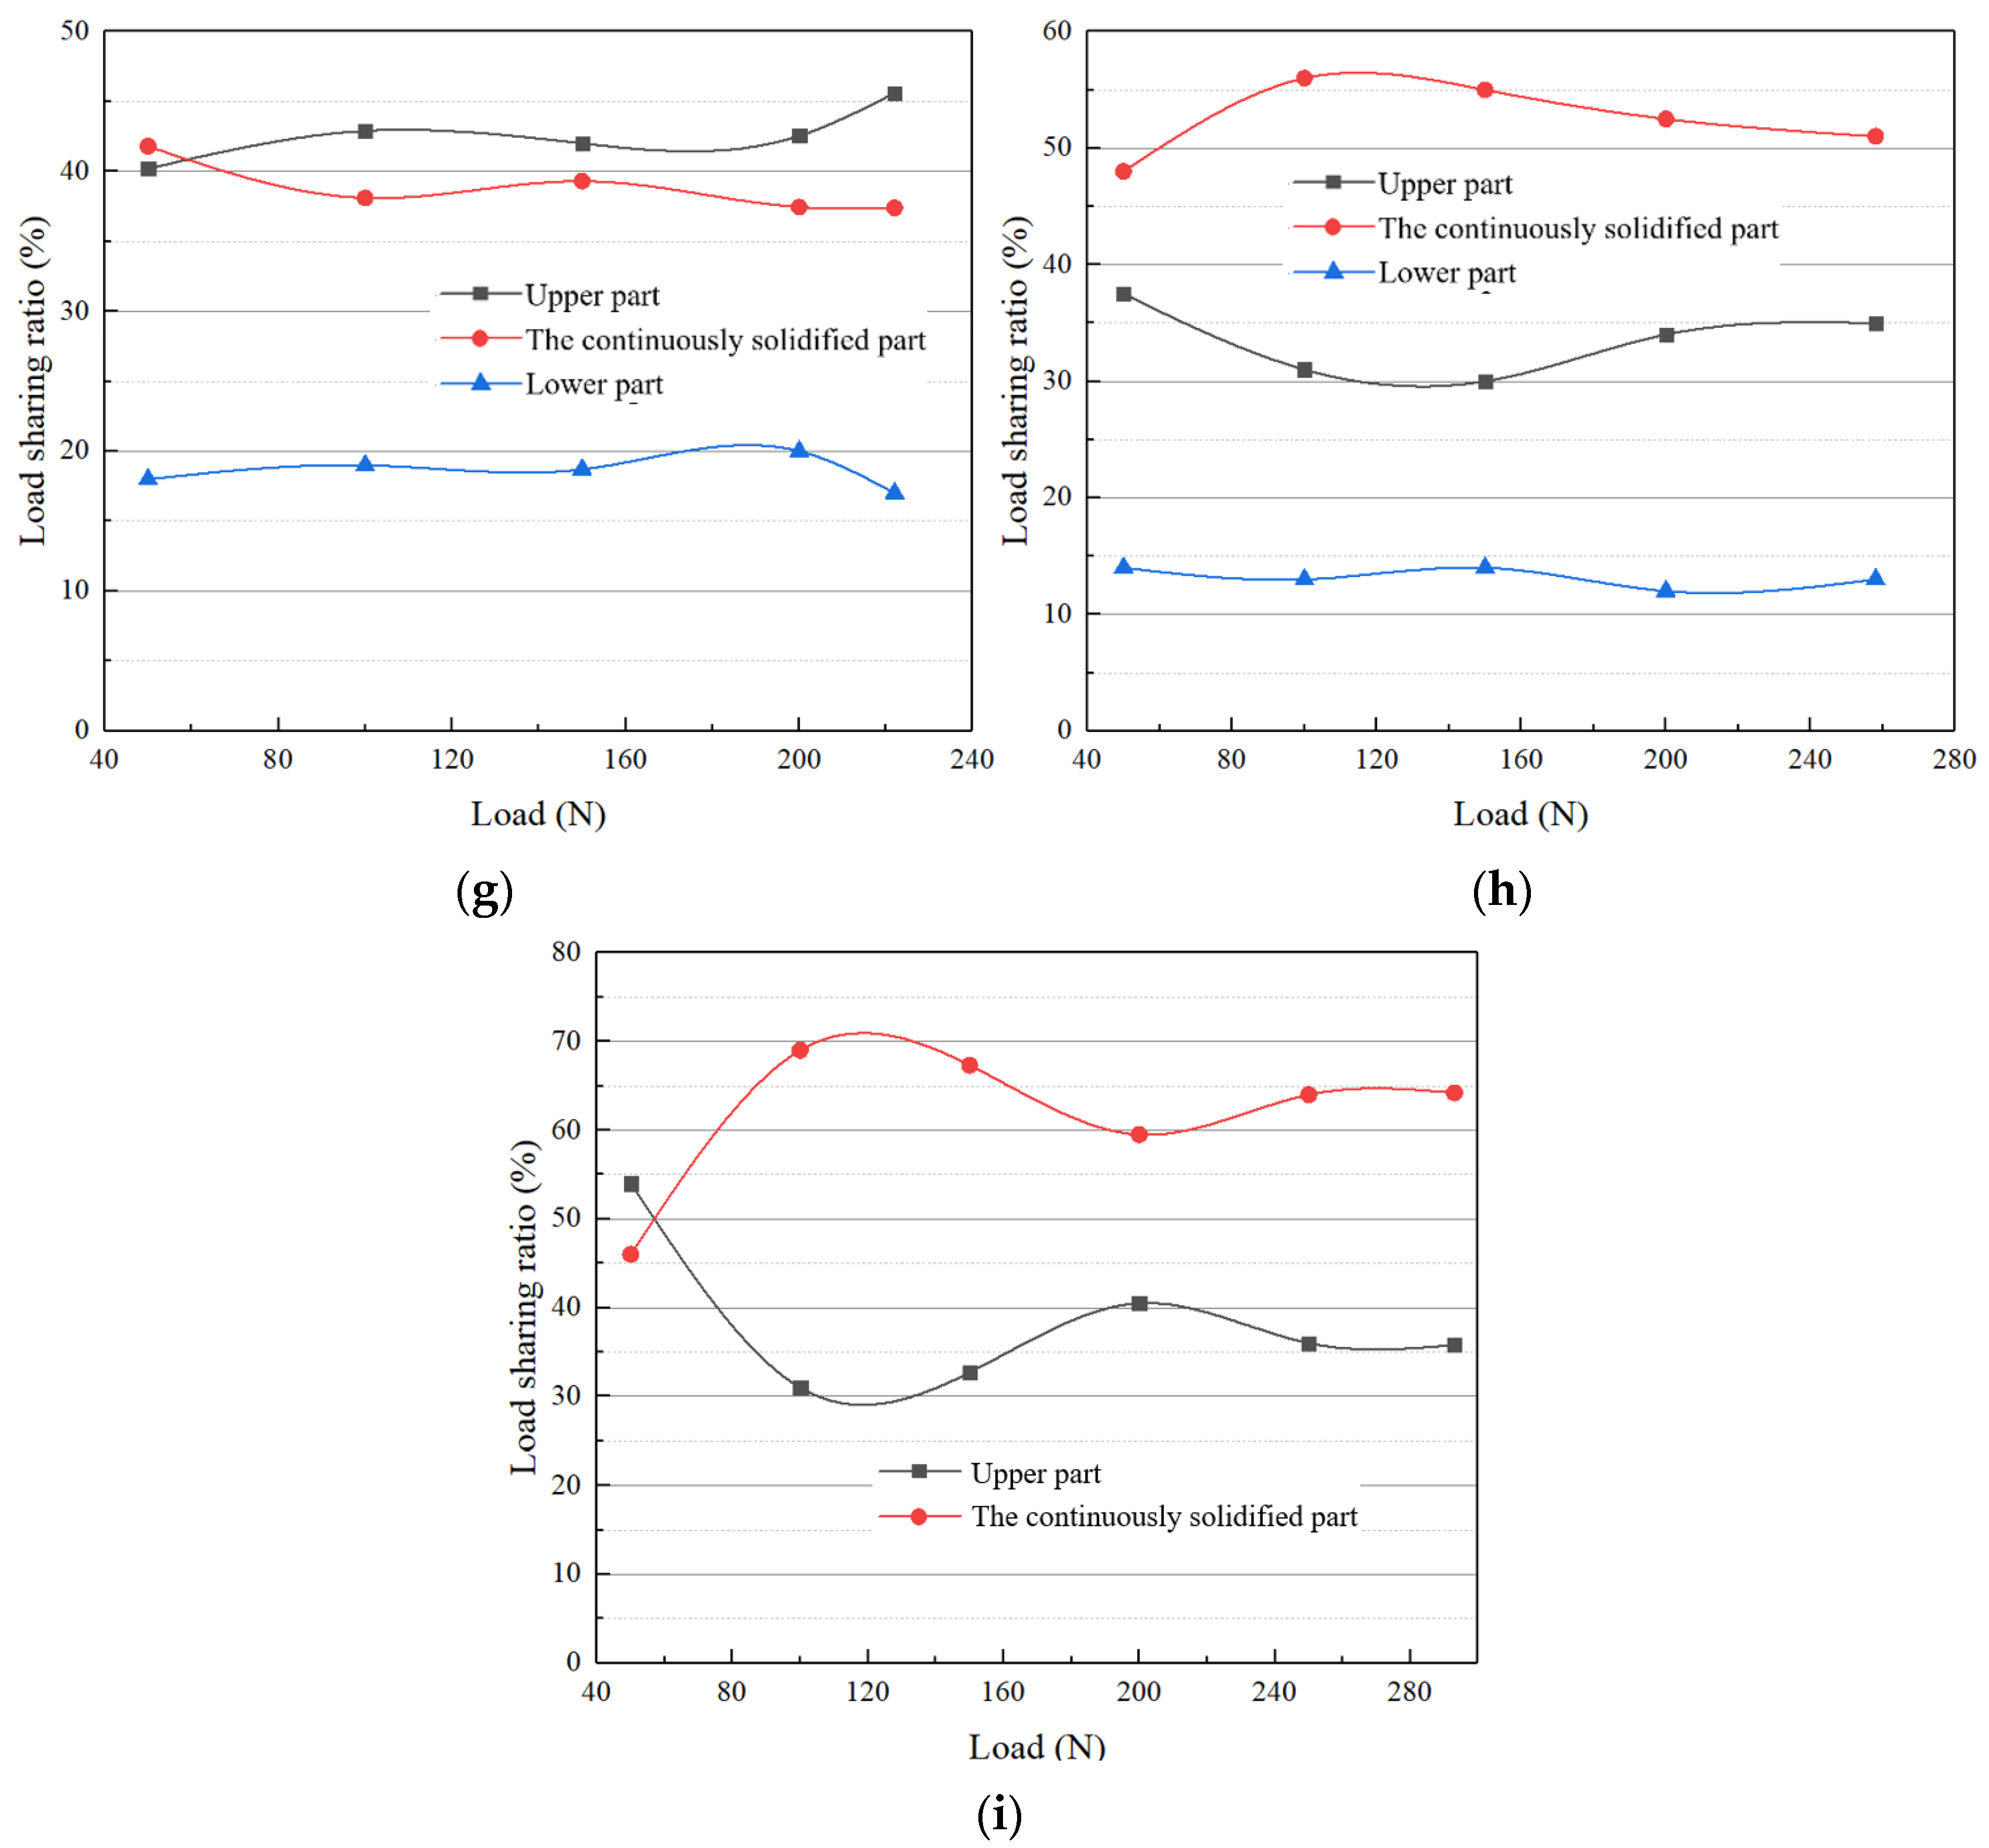
3.3.3. Load Sharing Ratio
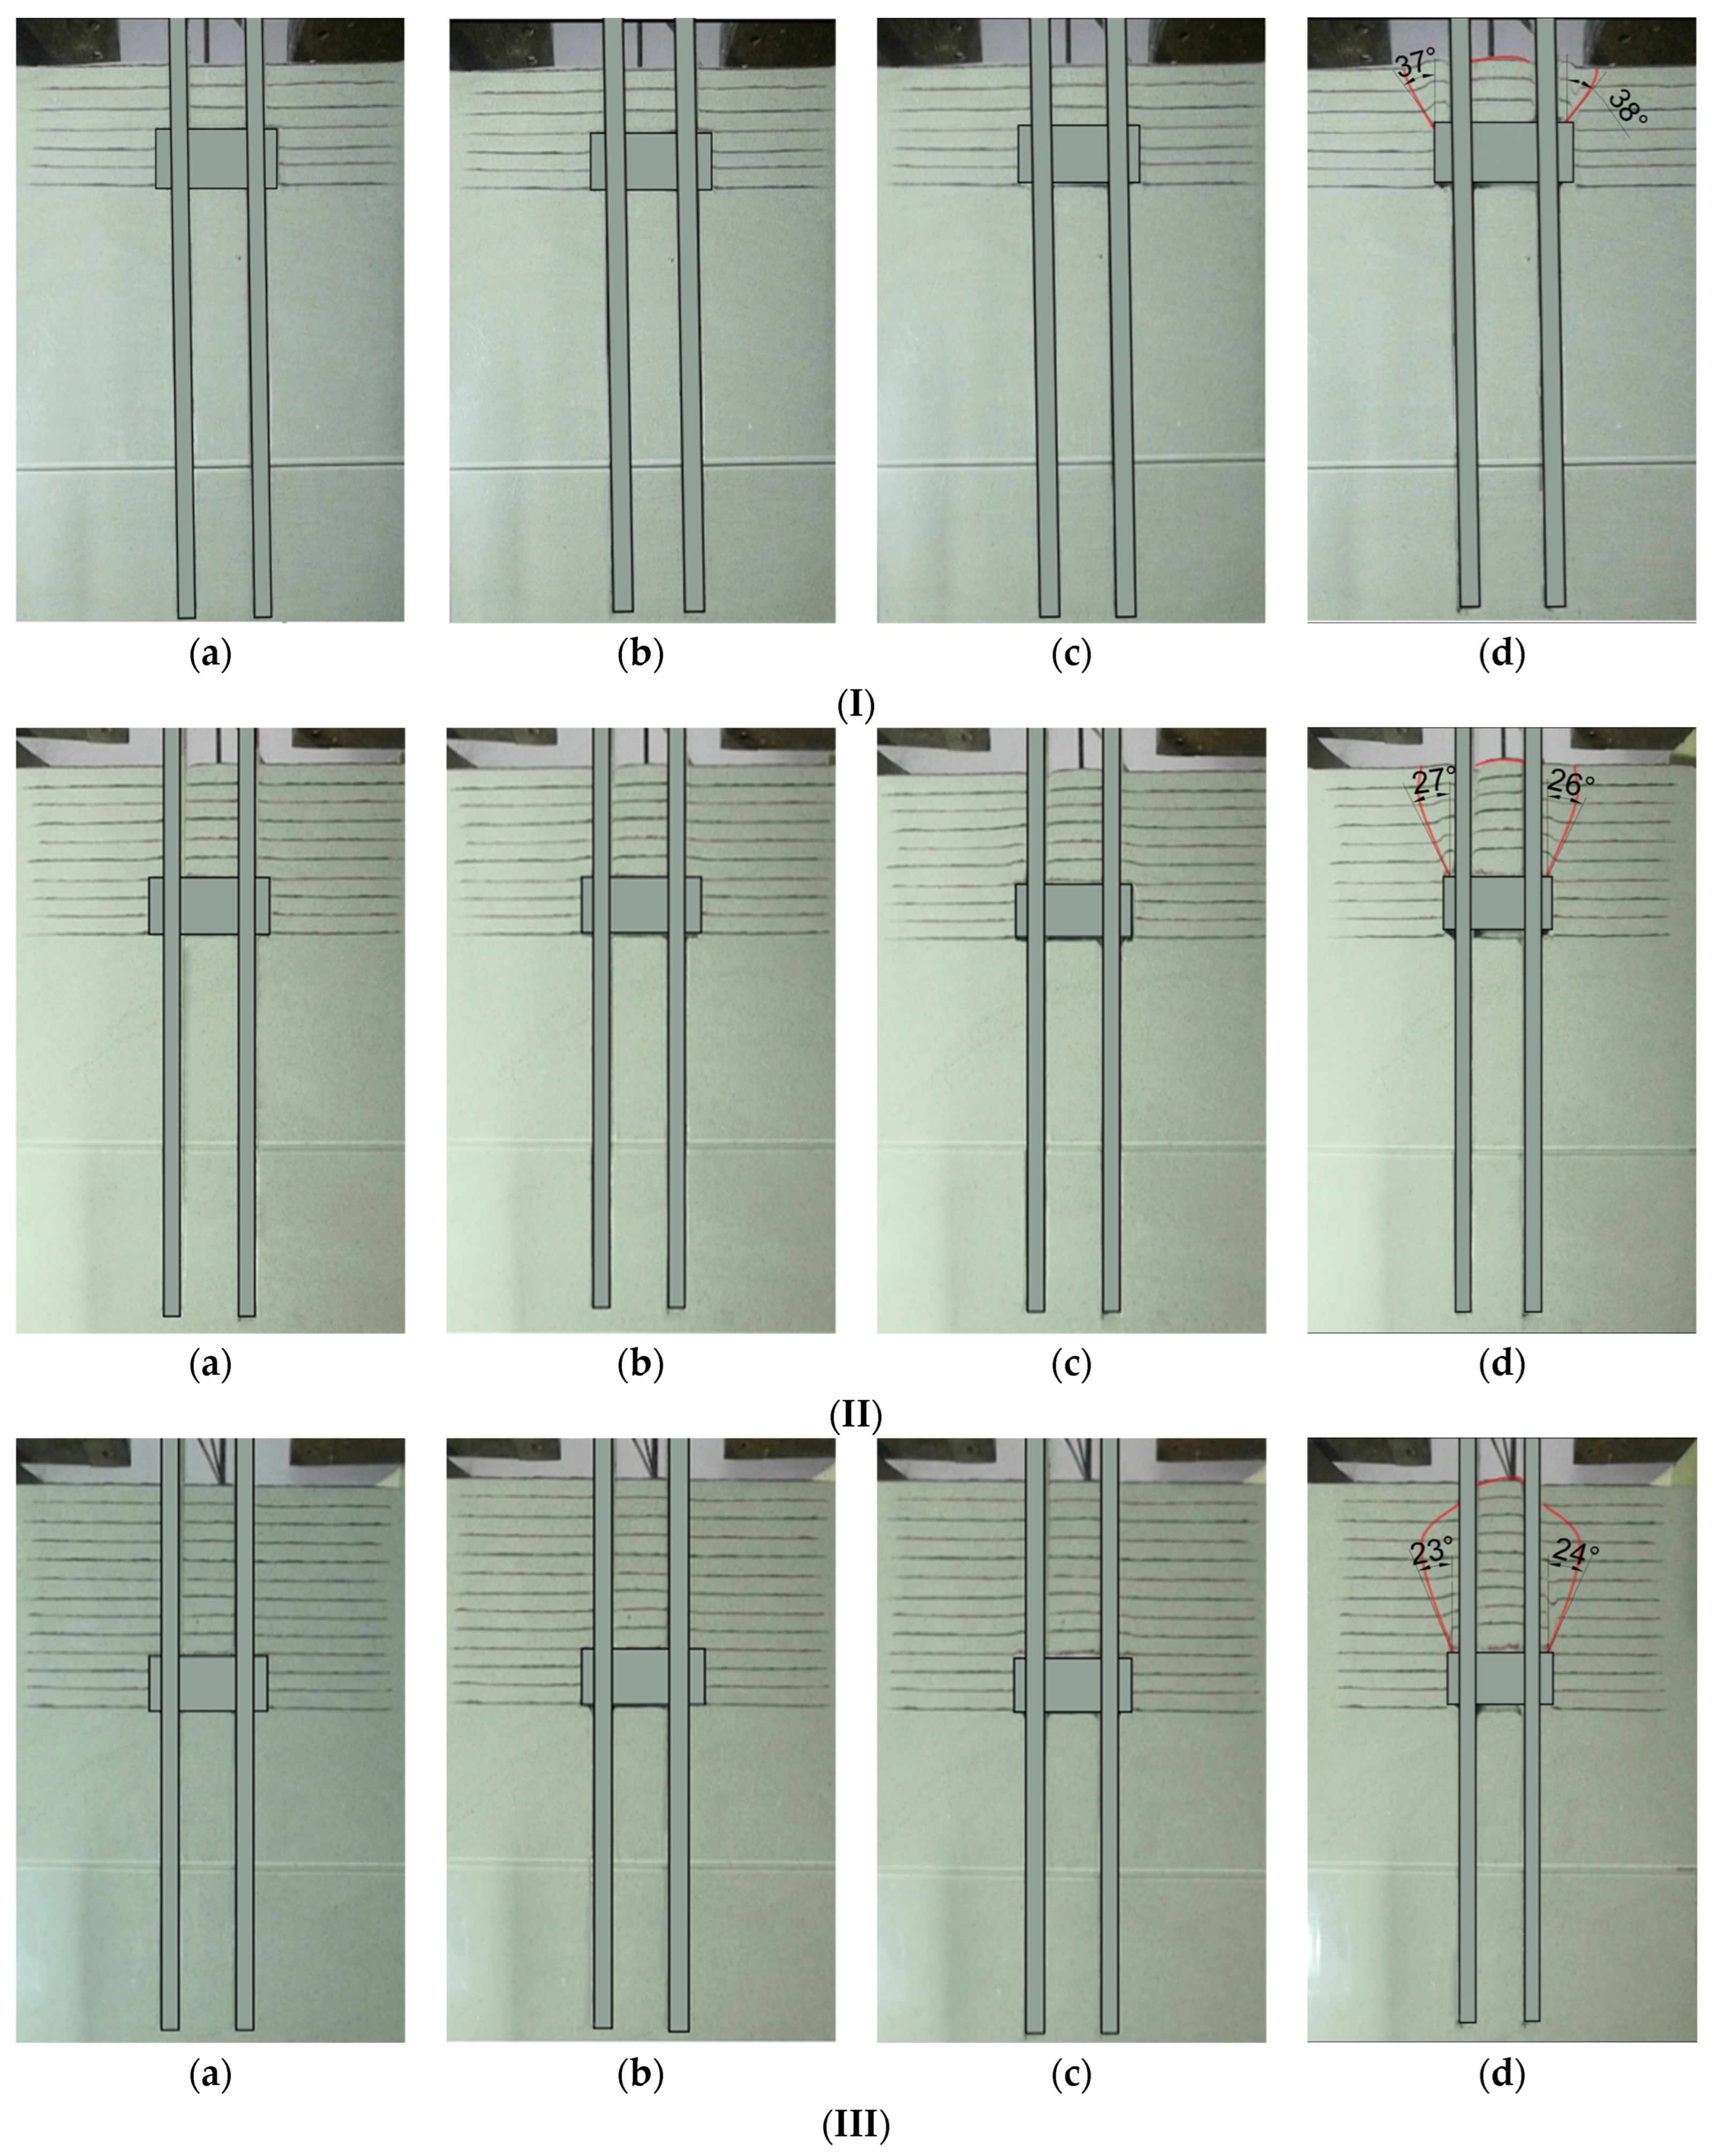
3.3.4. Damage Mode
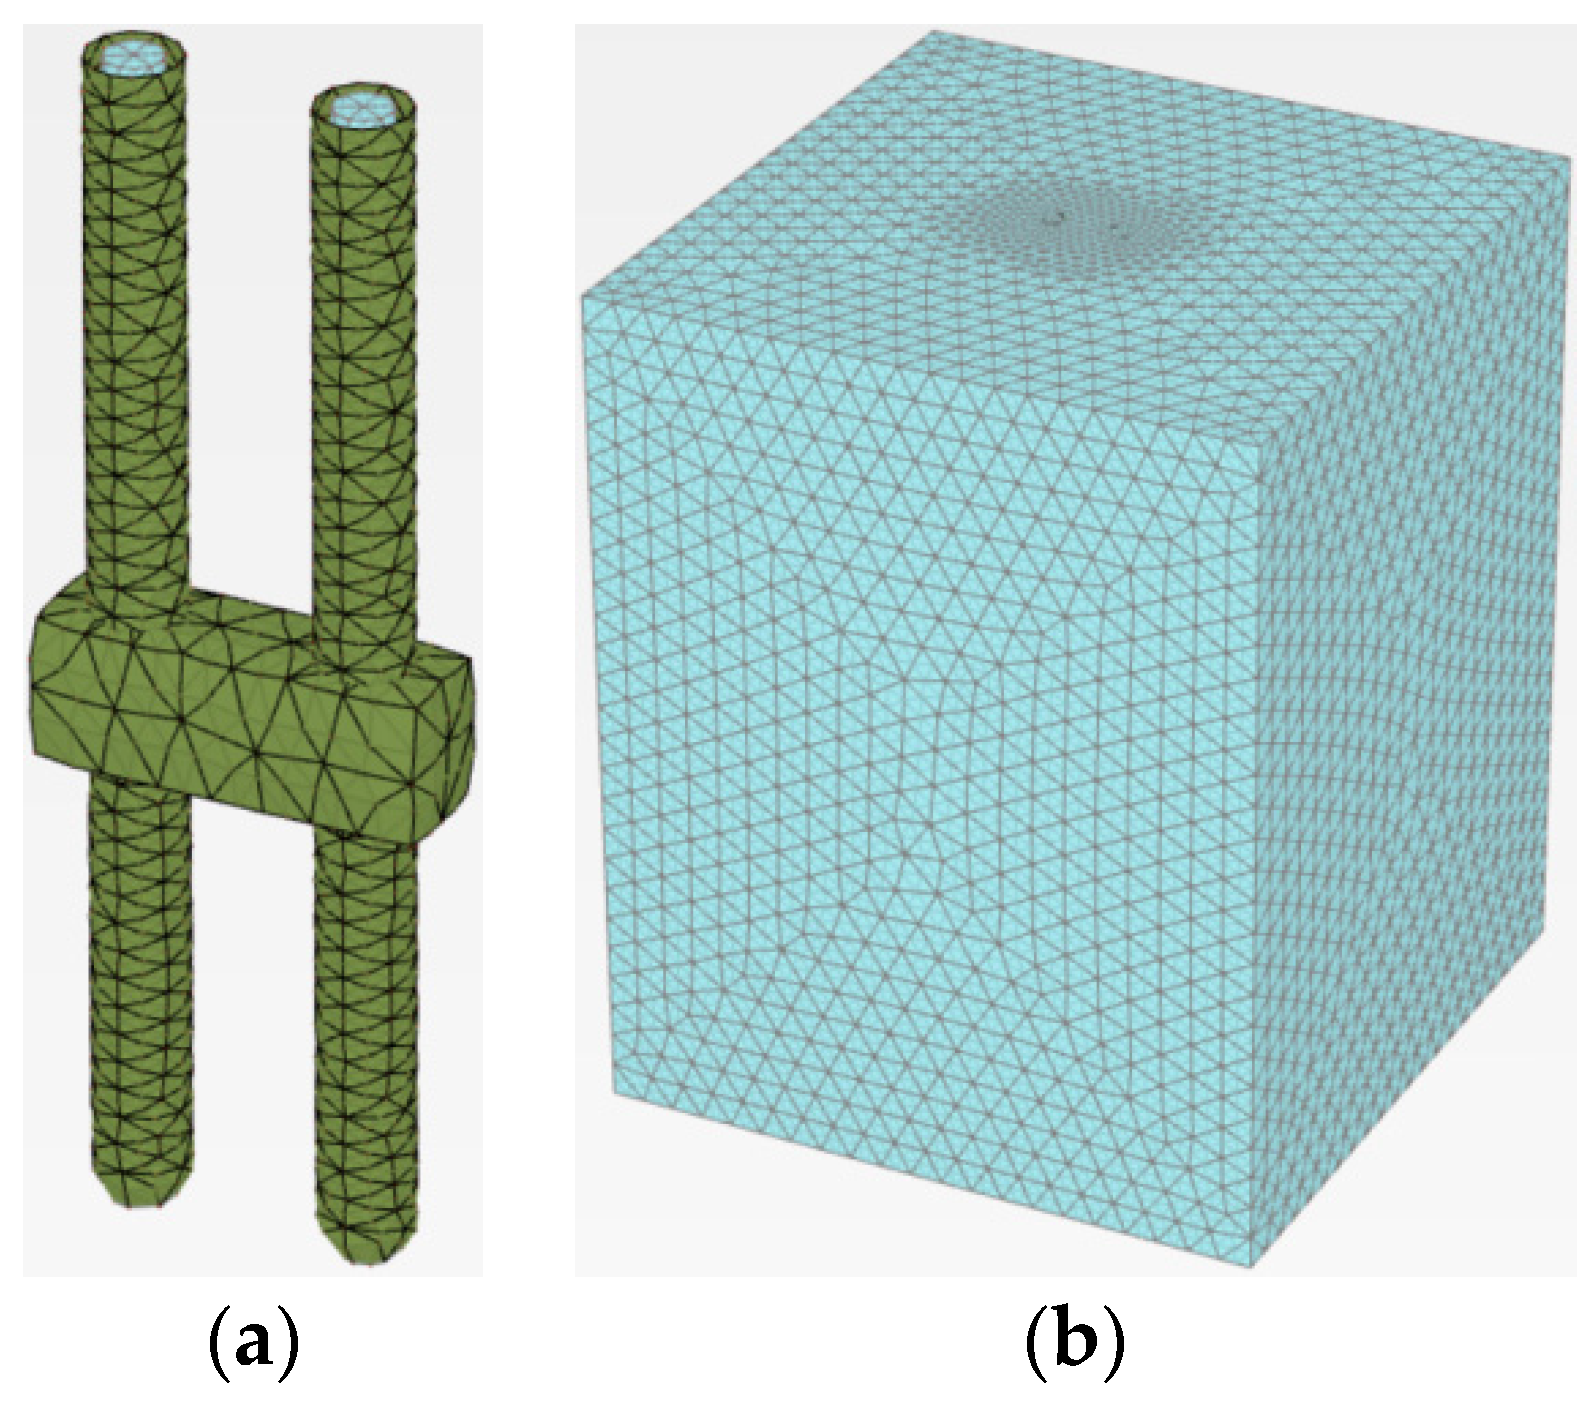
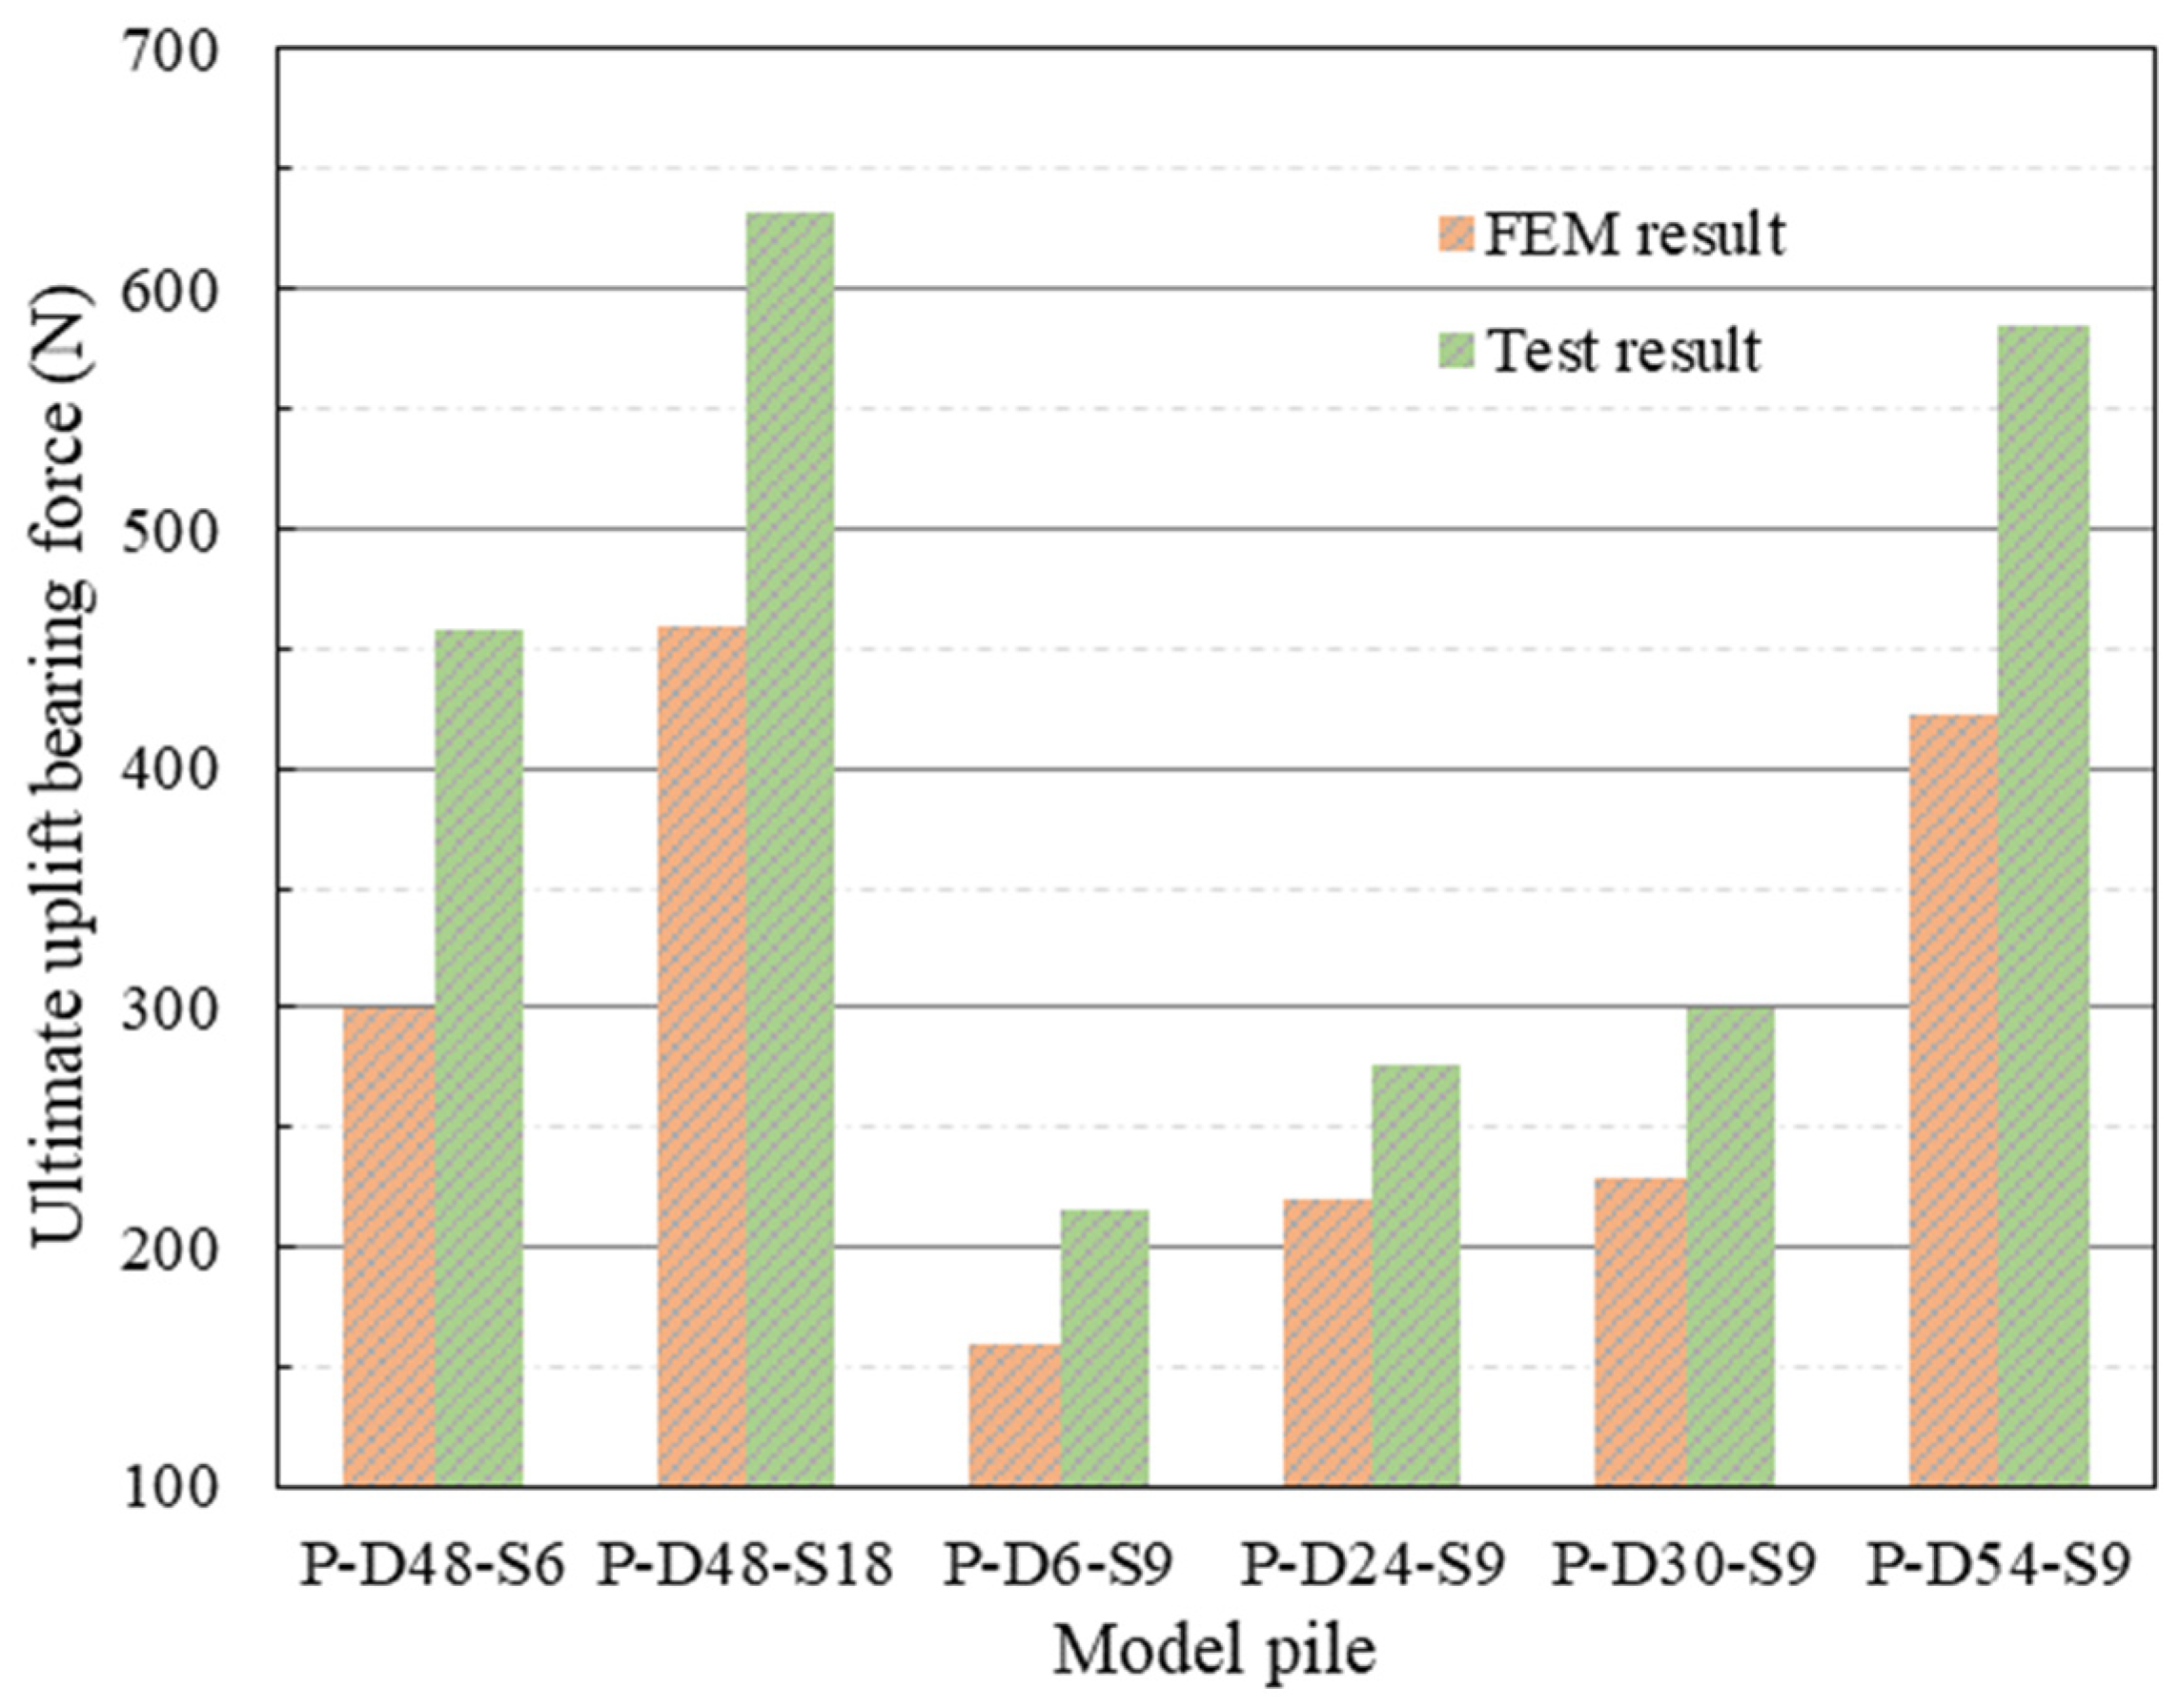
4. Numerical Simulation
5. Discussion
6. Conclusions
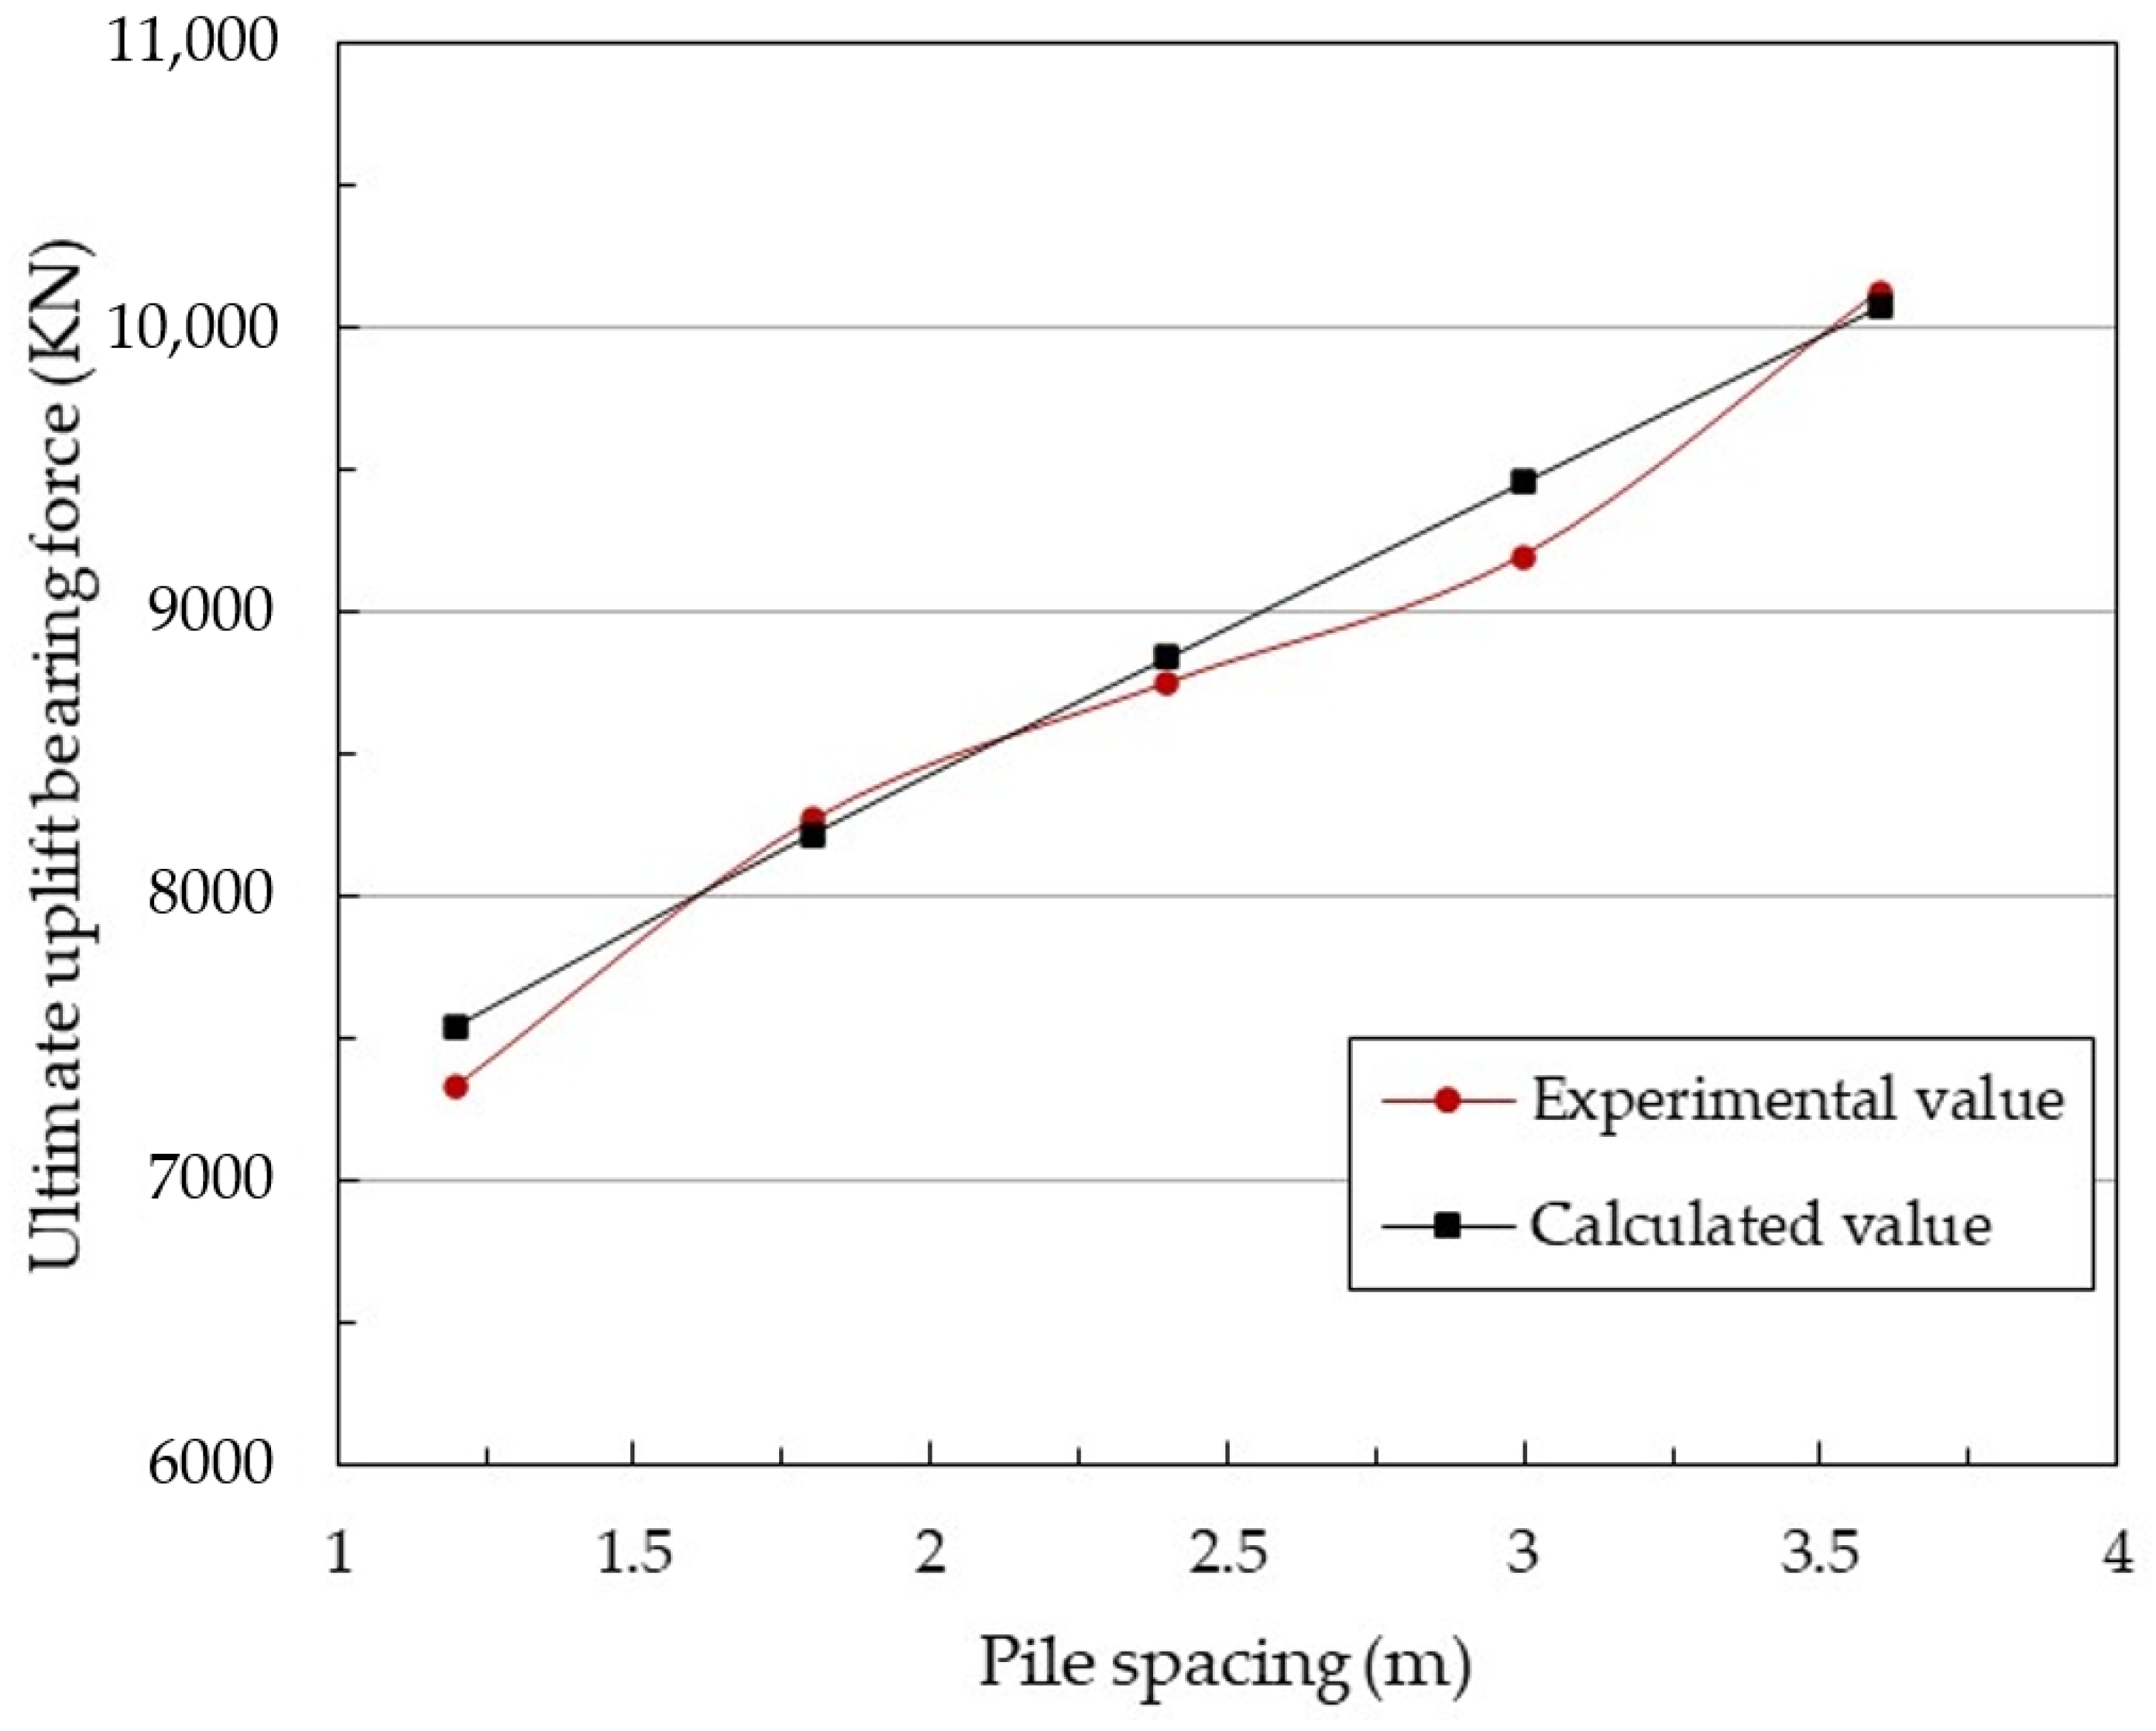
- When the stiffness of the CSM is large enough that its effect can be ignored and the depth of the CSM remains unchanged, the ultimate uplift capacity of the pile gradually increases with increasing pile spacing. At 2D–6D pile spacing, the SCS pile group foundation has about 2–3 times the ultimate uplift bearing capacity of the traditional pile group foundation. The loading and displacement curves of the SCS pile are relatively flat, while the axial force of the SCS group pile body changes suddenly at the upper and lower surfaces of the CSM;
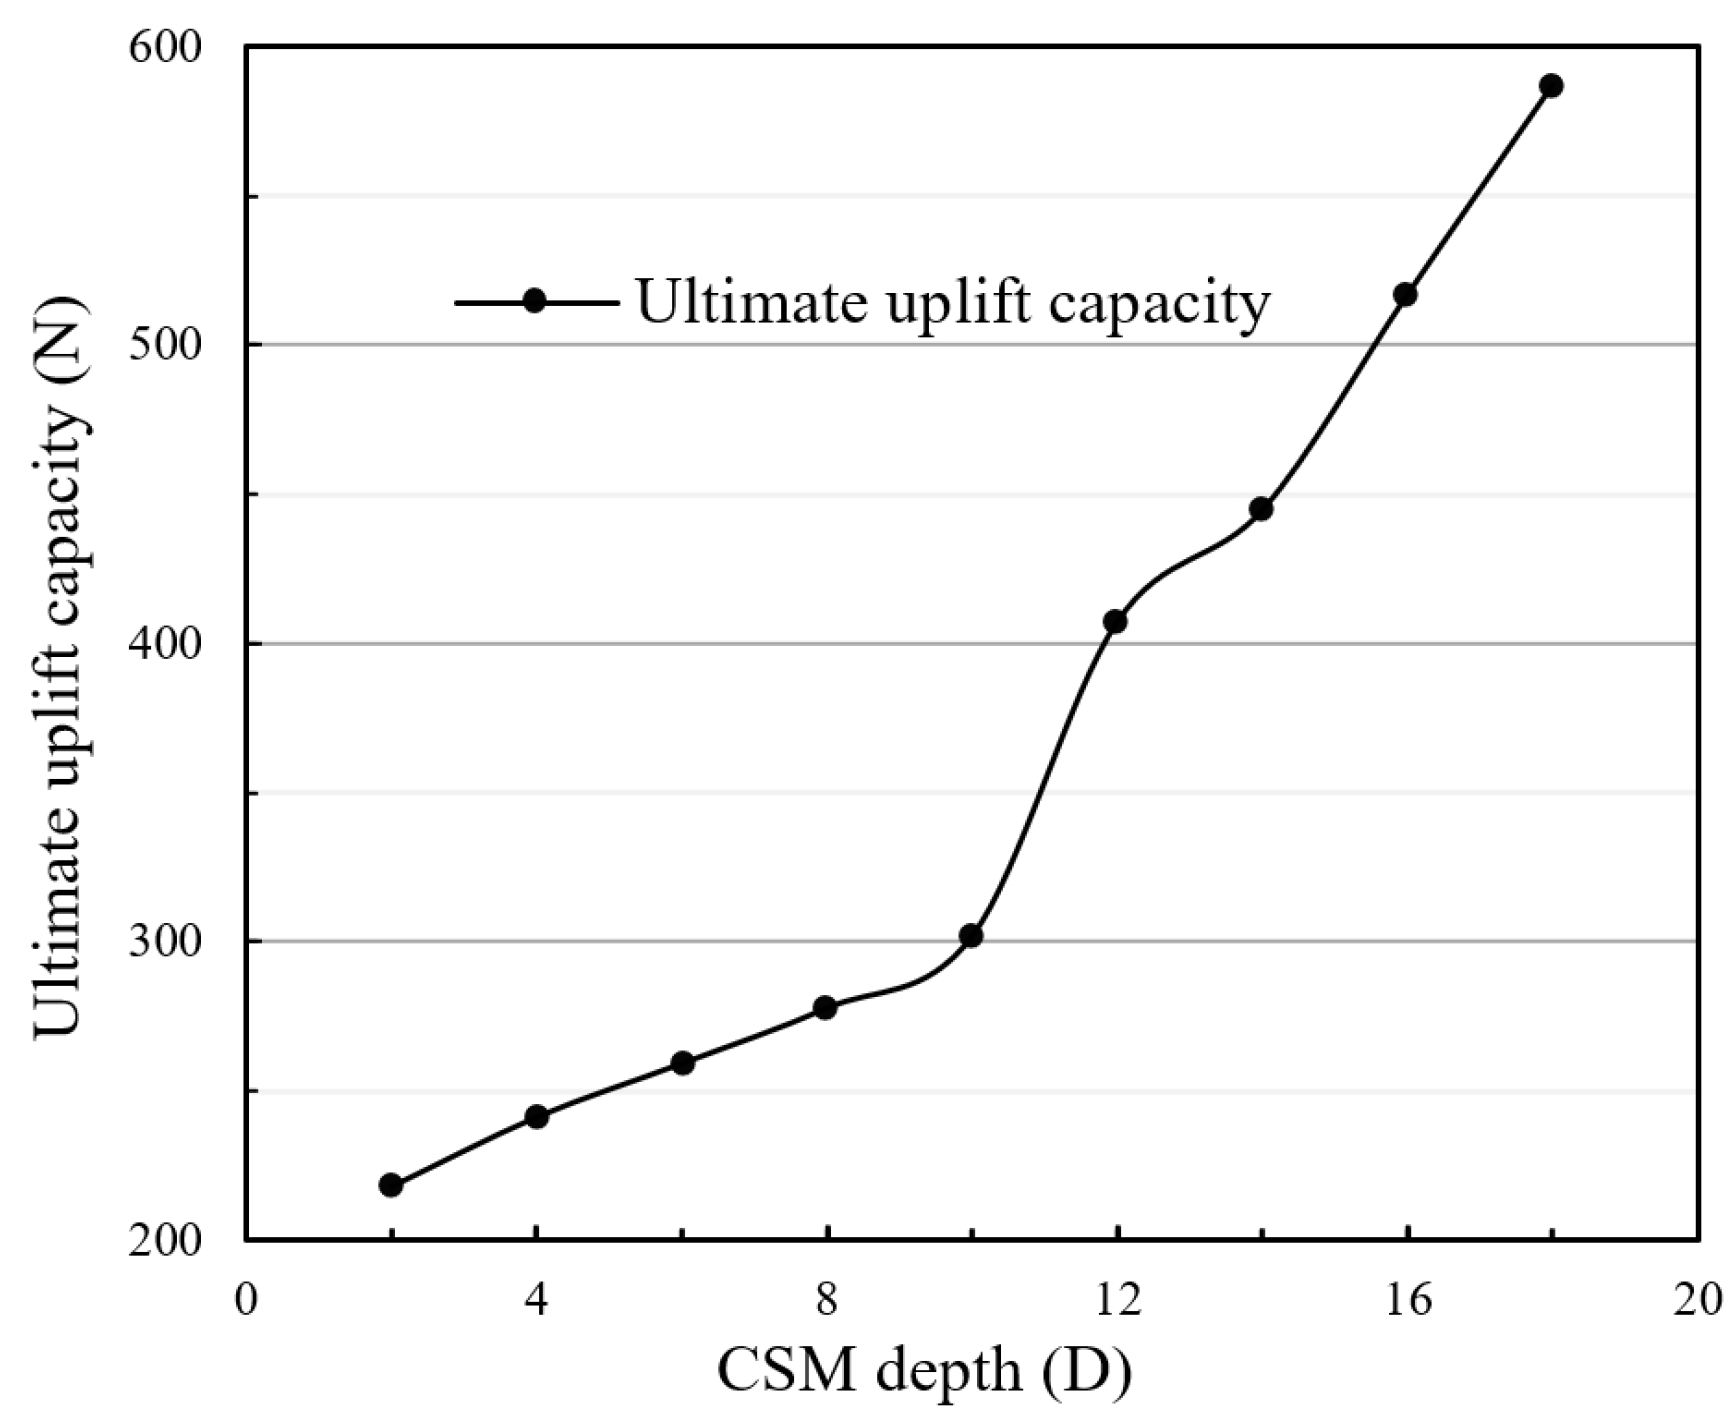
- With the same pile spacing, the ultimate uplift capacity of the pile increases gradually with CSM depth. When the burying depth of the CSM is less than or equal to 10D, the ultimate uplift capacity of the pile increases slowly with its burying depth and the top load is mainly borne by the side friction resistance of the pile. When the depth of the CSM is greater than 10D, the ultimate uplift capacity of the pile increases significantly with its burying depth and the CSM load sharing ratio exceeds 40 percent. Meanwhile, the pile top load is mainly borne by the CSM;
- When the load exceeds the ultimate uplift capacity and the CSM depth is less than or equal to 10D, the shear failure of the soil above the SCS pile group foundation results in a penetrating fracture surface. When the CSM depth is greater than 10D, the soil compression above the CSM was apparent. Local shear failure occurred on both sides of the pile but no penetrating cracks were formed in the soil above or on the side of the CSM;
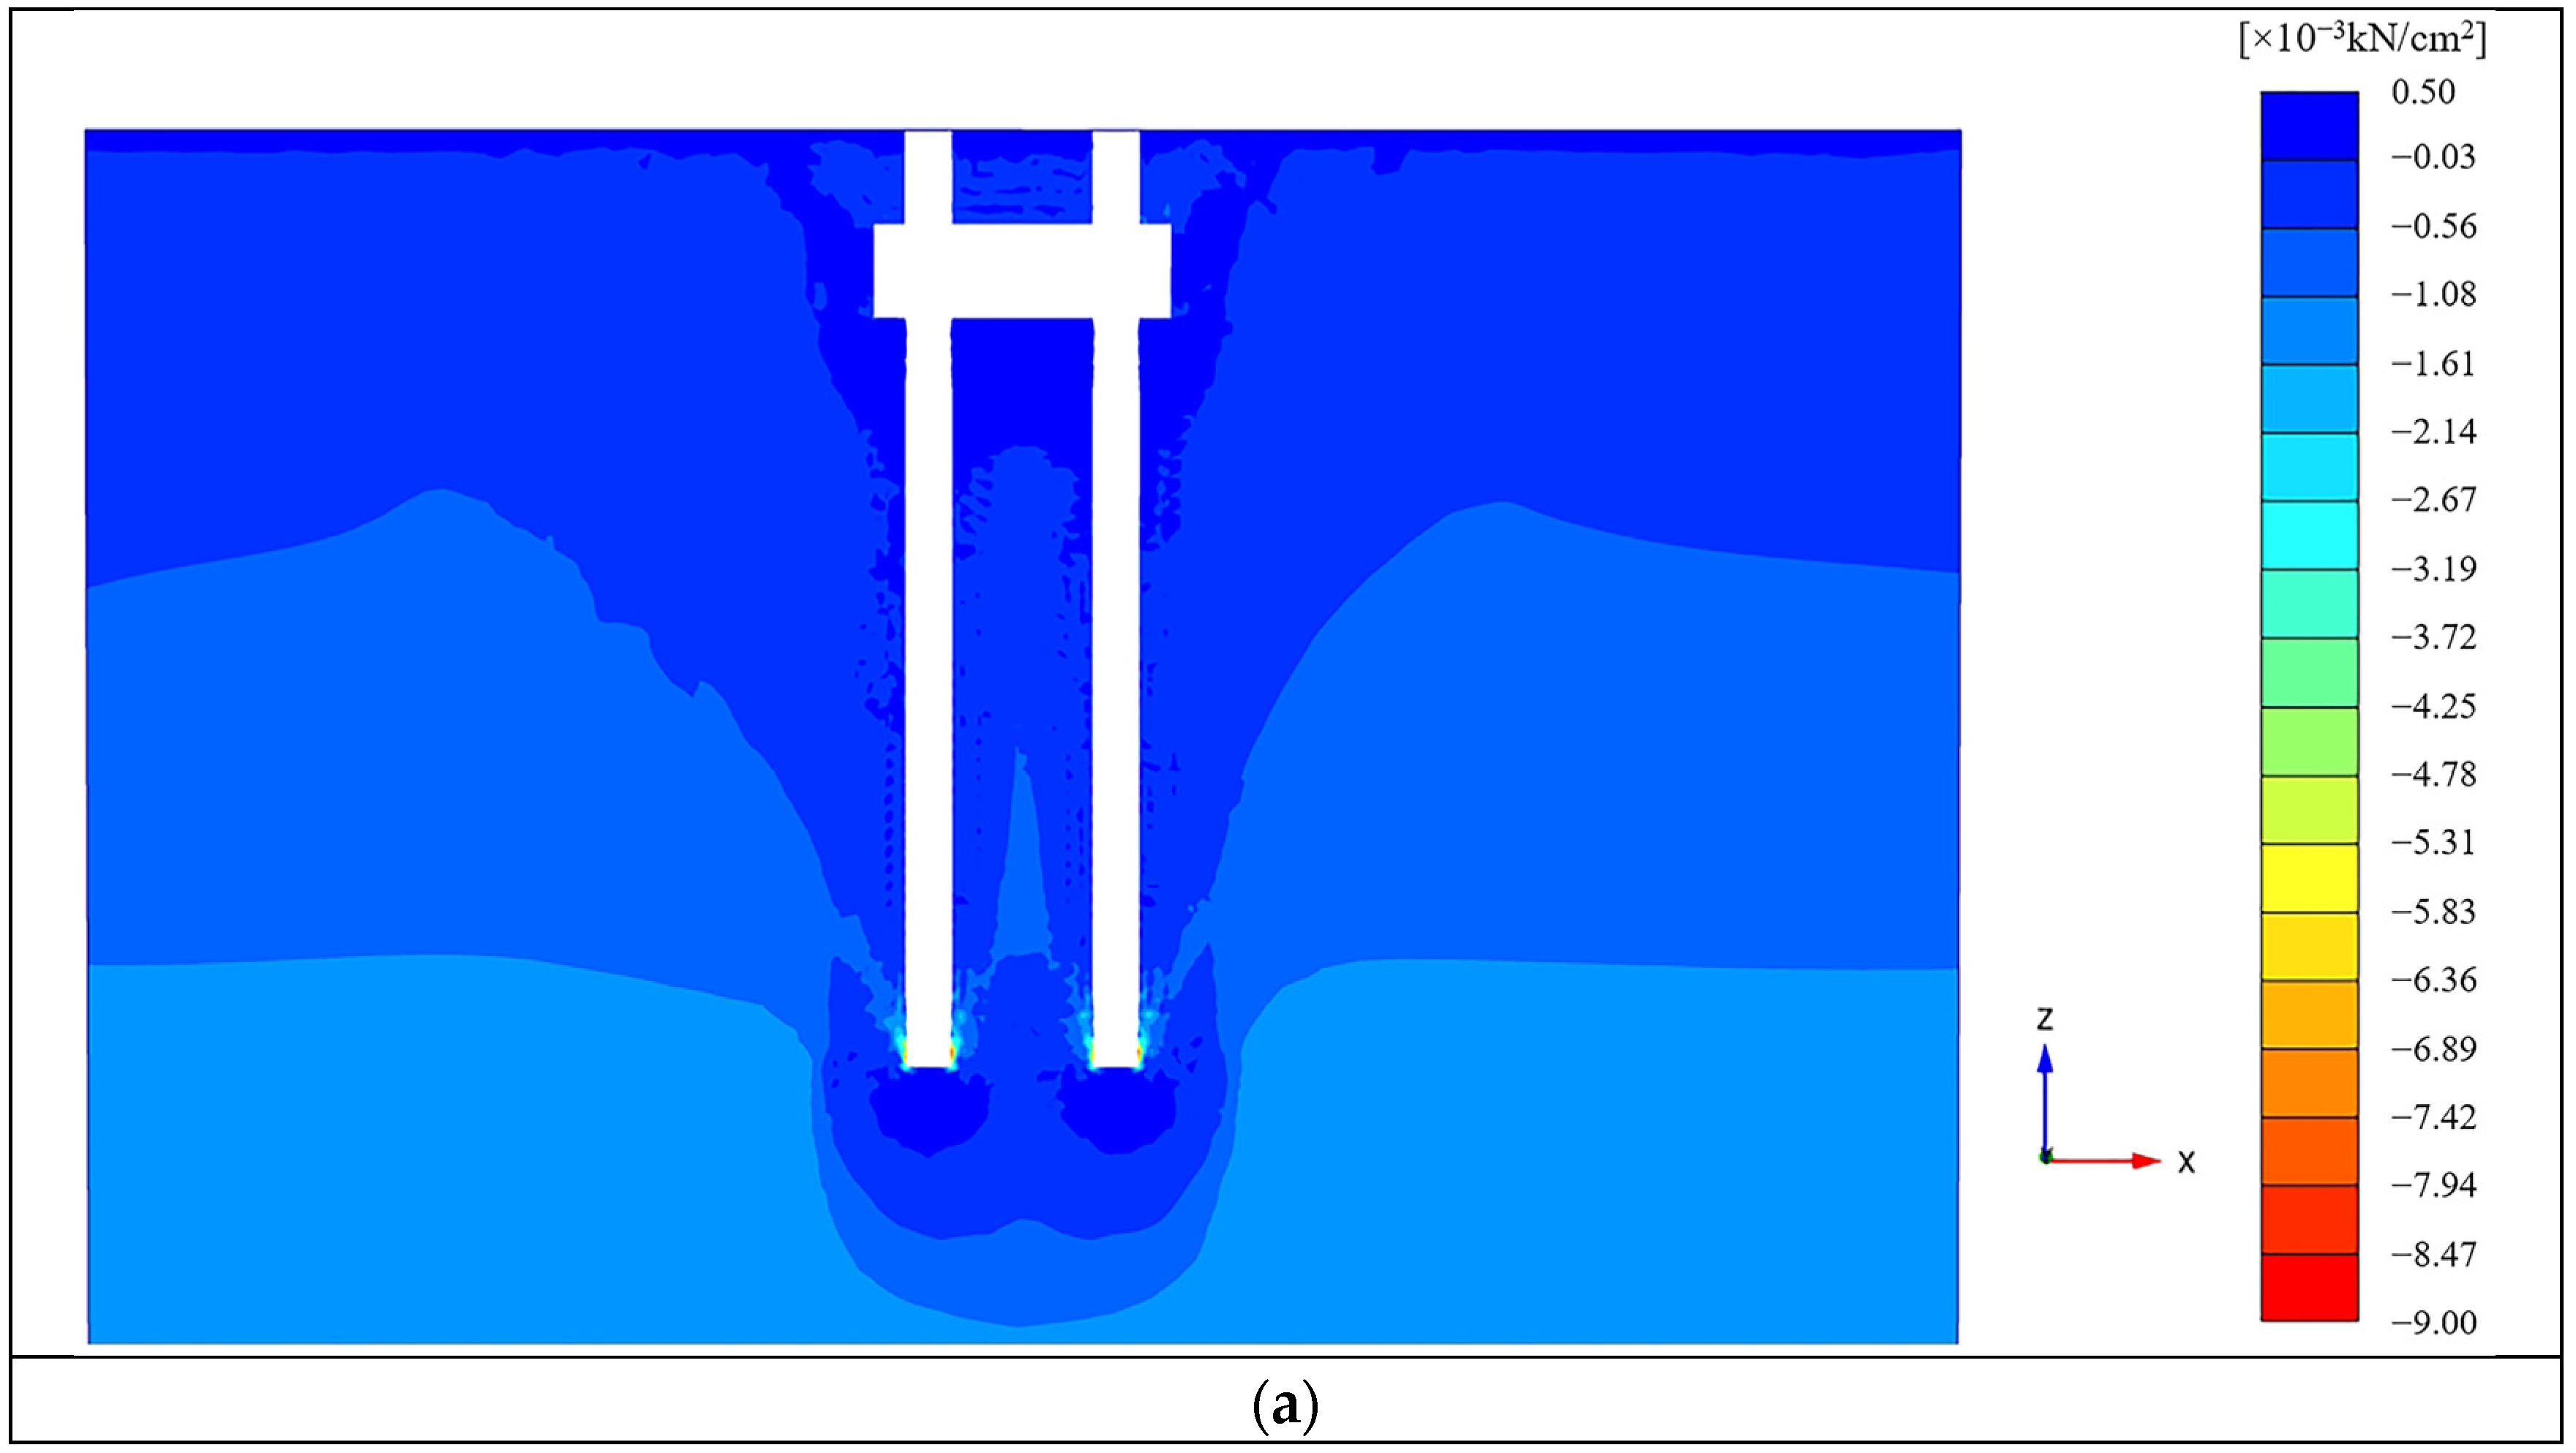
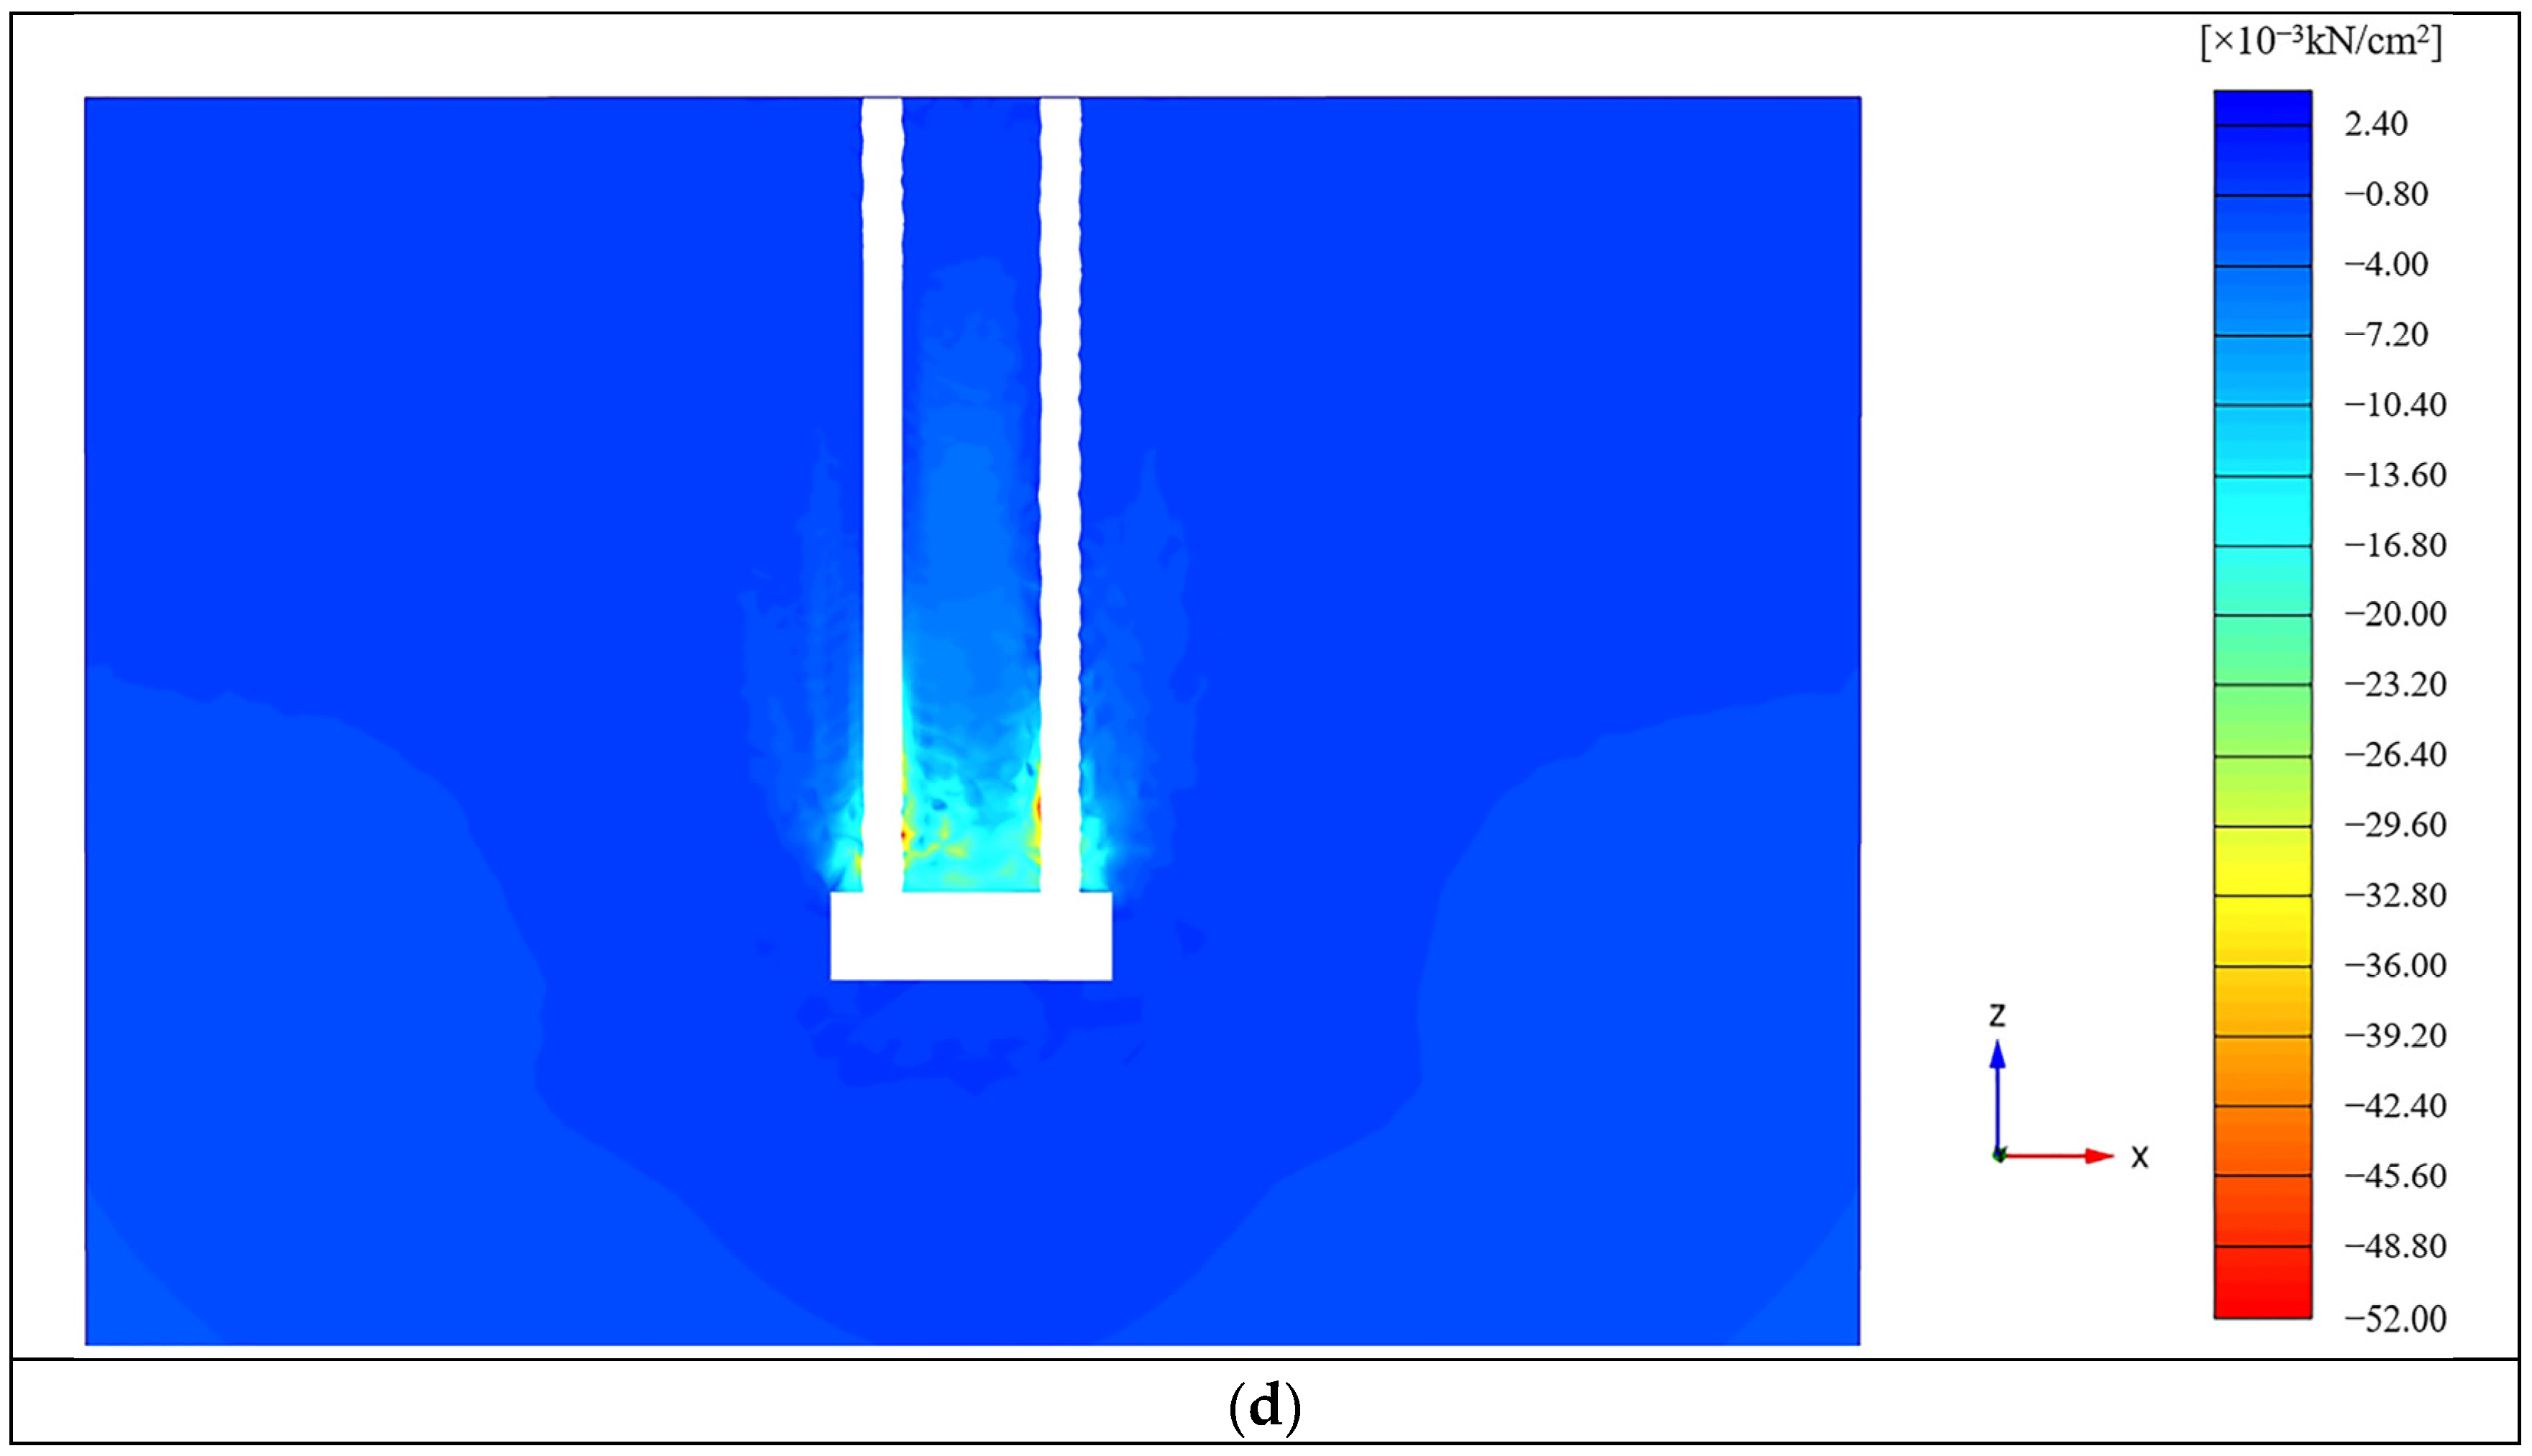
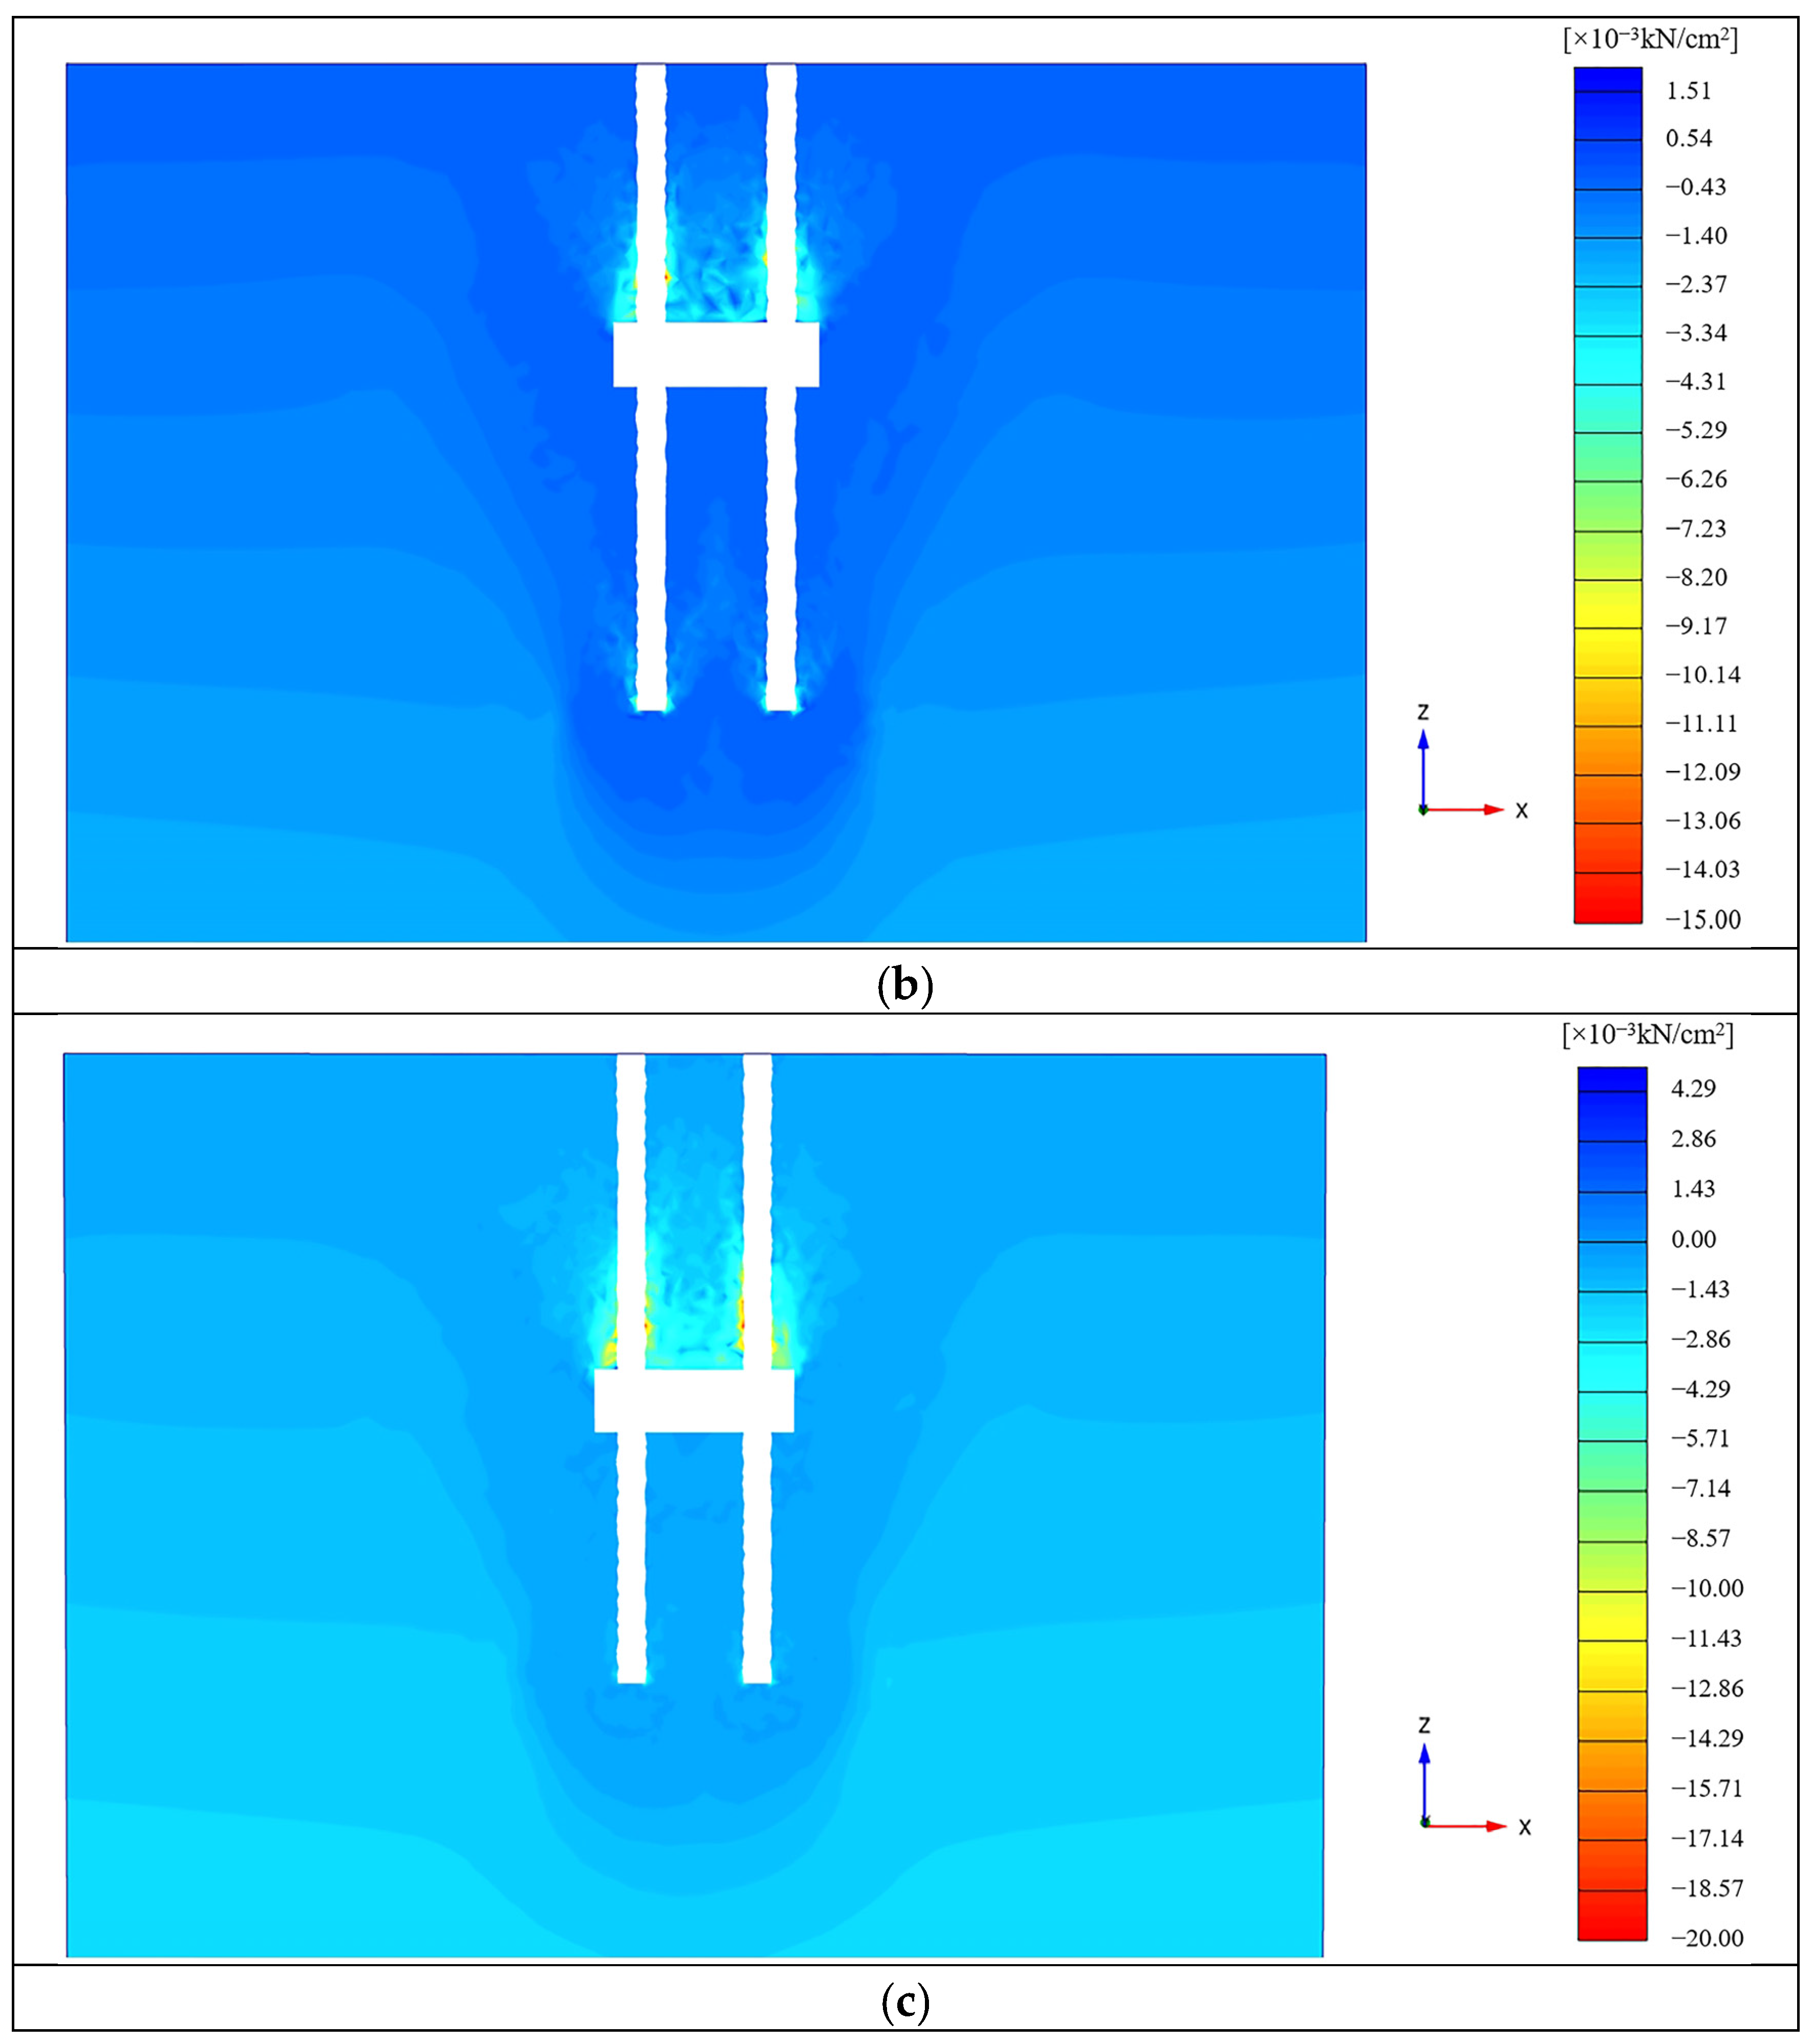
- Numerical simulation software was used to compare and analyze the characteristic groups, and the results show that the distribution characteristics of the soil stress around the pile obtained via numerical simulation and model testing are consistent. When designing an SCS pile group foundation, the pile spacing should be as large as possible. For the same pile spacing, the depth of the CSM should be greater than 10D. The design can maximize the support of CSM, obtaining a large ultimate bearing capacity for the group pile.
Author Contributions
Funding
Data Availability Statement
Conflicts of Interest
References
- Al-Mhaidib, A.I.; Edil, T.B. Model Tests for Uplift Resistance of Piles in Sand. Geotech. Test. J. 1998, 21, 213–221. [Google Scholar] [CrossRef]
- Wang, Z.; Wang, W.; Cheng, Y. Model Study of Tensile Bearing Capacity of a Single Pile under Frozen Condition. J. Glaciol. Geocryol. 2006, 28, 766–771. [Google Scholar]
- Maharaj, D.K.; Gayatri, J.; Jayanthi, D. Uplift capacity of pile by finite element method. Electron. J. Geotech. Eng. 2004, 9, 4–10. [Google Scholar]
- Dong, T.; Liang, L.; Huang, L.; Wang, M. Pullout test of screw pile foundation. Rock Soil Mech. 2009, 30, 186–190. [Google Scholar]
- Yalcin, A.S.; Meyerhof, G.G. Bearing capacity of flexible piles under eccentric and inclined loads in layered soil: Reply. Can. Geotech. J. 2011, 28, 909–917. [Google Scholar] [CrossRef]
- Qian, Y.; Sun, L.; Ai, L.; Zhou, Y.; Li, M. Theoretical Analysis of the Influence of Bearing Plate Position on the Bearing Performance of Soil around the CEP Antipull Force Double Pile. Buildings 2023, 13, 2613. [Google Scholar] [CrossRef]
- Wang, Q.; Xiao, Z.; Zhao, X.; Feng, D. The Effects and Vertical Bearing Capacity of Two Jacked Model Piles in Sand. Sustainability 2022, 14, 14493. [Google Scholar] [CrossRef]
- Yang, K.; Li, Q.; Wang, F.; Lu, C.; Wu, Y.; Ping, H. A study of failure mechanism and uplifting capacity of uplift pile foundation. Ocean. Eng. 1989, 2, 69–75. [Google Scholar]
- Gaaver, K.E. Uplift capacity of single piles and pile groups embedded in cohesionless soil. Alex. Eng. J. 2013, 52, 365–372. [Google Scholar] [CrossRef]
- Emirler, B.; Tolun, M.; Yildiz, A. Investigation on determining uplift capacity and failure mechanism of the pile groups in sand. Ocean. Eng. 2020, 218, 108145. [Google Scholar] [CrossRef]
- Madhav, M.R. Efficiency of pile groups in tension. Can. Geotech. J. 2011, 24, 149–153. [Google Scholar] [CrossRef]
- Sheil, B. Lateral limiting pressure on square pile groups in undrained soil. Geotechnique 2021, 2021, 71. [Google Scholar] [CrossRef]
- Meena, N.K.; Nimbalkar, S.; Fatahi, B.; Yang, G. Effects of soil arching on behavior of pile-supported railway embankment: 2D FEM approach. Comput. Geotech. 2020, 123, 103601. [Google Scholar] [CrossRef]
- Rose, A.; Taylor, R.; El Naggar, M. Numerical modelling of perimeter pile groups in clay. Can. Geotech. J. 2013, 50, 250–258. [Google Scholar] [CrossRef]
- Deshmukh, V.; Dewaikar, D.; Choudhury, D. Uplift Capacity of Pile Anchors in Cohesionless Soil. In Proceedings of the GeoShanghai 2010: Deep Foundations and Geotechnical In Situ Testing, Shanghai, China, 3–5 June 2010. [Google Scholar] [CrossRef]
- Khatri, V.; Kumar, J. Uplift Capacity of Axially Loaded Piles in Clays. Int. J. Geomech. 2011, 11, 23–28. [Google Scholar] [CrossRef]
- Yang, X.; Wang, C.; Cao, S.; Wang, F.; Wu, W. Lateral Dynamic Response of Helical Pile in Viscoelastic Foundation Considering Shear Deformation. Appl. Sci 2023, 13, 12220. [Google Scholar] [CrossRef]
- Patra, N.; Pise, P. Uplift Capacity of Pile Groups in Sand. Electron. J. Geotech. Eng. 2003, 8, 1. [Google Scholar]
- Liu, C.; Ji, F.; Song, Y.; Wang, H.; Li, J.; Xuan, Z.; Zhao, M. Upper Bound Analysis of Ultimate Pullout Capacity for a Single Pile Using Hoek–Brown Failure Criterion. Buildings 2023, 13, 2904. [Google Scholar] [CrossRef]
- Shanker, K.; Basudhar, P.; Patra, N. Uplift capacity of pile groups embedded in sands: Predictions and performance. Soil Found. 2011, 46, 605–612. [Google Scholar] [CrossRef]
- Shelke, A.; Mishra, S. Uplift Capacity of Single Bent Pile and Pile Group Considering Arching Effects in Sand. Geotech. Geol. Eng. 2010, 28, 337–347. [Google Scholar] [CrossRef]
- Li, H.; Fu, S.; Zhu, D.; Li, G.; Shen, S. Experimental study on the effects of triangular groove inclination angles on the mechanical behavior of sand–concrete interfaces. J. Mater. Res. Technol. 2023, 24, 159–172. [Google Scholar] [CrossRef]
- Ohtsuka, T.; Aramaki, G.; Koga, K. Soil improvement of soft ground around pile foundation in earthquake-resistant design. Lowl. Technol. Int. 2004, 6, 42–54. [Google Scholar]
- Santos Filho JM, D.; Tsuha CD, H. Uplift performance of helical piles with cement injection in residual soils. Can. Geotech. J. 2019, 57, 1335–1355. [Google Scholar] [CrossRef]
- Zhou, J.; Yu, J.; Gong, X.; Zhang, R.; Yan, T. Influence of soil reinforcement on the uplift bearing capacity of a pre-stressed high-strength concrete pile embedded in clayey soil. Soils Found. 2019, 59, 2367–2375. [Google Scholar] [CrossRef]
- Rollins, K.; Herbst, M.; Adsero, M.; Dan, B. Jet grouting and soil mixing for increased lateral pile group resistance. In Proceedings of the GeoFlorida 2010: Advances in Analysis, Modeling & Design, West Palm Beach, FL, USA, 20–24 February 2010; pp. 1563–1572. [Google Scholar]
- Stone KJ, L.; Newson, T.A.; El Marassi, M.; El Naggar, H.; Taylor, R.N.; Goodey, R.J. An Investigation of the Use of a Bearing Plate to Enhance the Lateral Capacity of Monopile Foundations. In Frontiers in Offshore Geotechnics II; CRC Press: Boca Raton, FL, USA, 2010; pp. 641–646. [Google Scholar]
- Lehane, B.; Pedram, B.; Doherty, J.; Powrie, W. Improved performance of monopiles when combined with footings for tower foundations in sand. J. Geotech. Geoenvironmental Eng. 2014, 140, 04014027. [Google Scholar] [CrossRef]
- Sun, T. The Utility Model Relates to a Pile Group System Continuously Reinforced by Soil between Piles and a Construction Method Thereof. Chinese Patent CN106759424A, 31 May 2017. [Google Scholar]
- Sun, T.; Wang, C.; Xu, D.; Lin, Z.; Yang, J.; Liu, S.; Yang, F. Effect of Solidified Depth on the Vertical Compressive Bearing Characteristics of the Soil Continuously Solidified Pile Group Foundation. Appl. Sci 2023, 13, 12850. [Google Scholar] [CrossRef]
- Song, Q.; Yang, J.; Sun, T.; Li, F.; Yang, N. Model Tests on Bearing Behavior of Dynamic Deformation Process of Uplift Piles with Enlarged Base. Period. Ocean Univ. China 2021, 51, 105–112. [Google Scholar]
- Sun, T.; Yang, J.; Zhao, H.; Sun, T.L. Study on Compressive Load-Bearing Characteristics of Section-Variable Reinforced Jet-Grouting & Mixing Cement-Soil Pile by Indoor Model Tests. Period. Ocean Univ. China 2012, 42, 8. [Google Scholar]
- Sun, T.; Cui, X.; Sun, Y.; Han, R.; Ma, R.; Yang, J.; Wang, Y.; Chang, Y. Model tests on uplift capacity of double-belled pile influenced by distance between bells. J. Cent. South Univ. 2022, 29, 1630–1640. [Google Scholar] [CrossRef]
- Cong, Y.; Ma, X.; Yuan, J.; Wu, P. Study on Sample Preparation with Sand Pourer in Centrifuge Test. Subgrade Eng. 2014, 77–80. Available online: https://kns.cnki.net/kcms2/article/abstract?v=Vof-4b7nxdDX8dZUB2czI5N64seDVgdhQOyonOiOsvWmmcG5aBlwCeFIYp0UpXA5etaGBT3i6sUEN-k1jyanze6gduHzGUjF8gMLtzGGdnZyM9a6QMZFaNX2aa2CnFqoyImcZITTpFQ=&uniplatform=NZKPT&language=CHS (accessed on 8 March 2024).
- Ma, X.; Kong, L.; Fang, W.; Gong, B.; Li, H.; Xu, G.; Zhao, W.; Zhang, X.; Chen, Y. Parallel tests on preparation of samples with sand pourer. Chin. J. Geotech. Eng. 2014, 36, 1791–1801. [Google Scholar]
- GB50021-2001; Code for Investigation of Geotechnical Engineering. Ministry of Construction of the People’s Republic of China: Beijing, China, 2002.
- Garnier, J.; Konig, D. Scale effects in piles and nails loading tests in sand. Centrifuge 1998, 98, 205–210. [Google Scholar]
- Balachowski, L. Différents Aspects de la Modélisation Physique du Comportement des Pieux: Chambre d’Ealonnage et Centrifugeuse. Ph.D. Thesis, Grenoble INPG, Grenoble, France, 1995. [Google Scholar]
- Xu, G.; Zhang, W. Research on Particle Size Effect and Boundary Effect in Centrifugal Model. Chin. J. Geotech. Eng. 1996, 18, 80–86. [Google Scholar]
- Mitsu, O.; Jiro, T.; Tsutomu, K. A study on bearing capacitys of shallow footings on sand. Jpn. Soc. Civ. Eng. 1993, 1993, 85–94. [Google Scholar]
- Yang, J.; Yasuo, T. Experimental study on bearing capacity of reinforced sand. Soil Mech. Found. Eng. 2003, 51, 47–49. [Google Scholar]
- JGJ 94-2008; Technical Code for Building Pile Foundation. Ministry of Construction of the People’s Republic of China: Beijing, China, 2008.
- Rui, R.; Xiao, F.; Cheng, Y.; Gao, F.; Hu, S.; Ding, R.; Sun, J. Experimental study on pull-out resistance of plate anchors at different buried depths. Chin. J. Geotech. Eng. 2023, 45, 2032–2041. [Google Scholar]


| Maximum Dry Density (ρdmax/g·cm−3) | Minimum Dry Density (ρdmin/g·cm−3) | Specific Gravity of Soil Particle (Gs) | Water Content (ω/%) | Angle of Internal Friction (φ/°) | Cu | Cc |
|---|---|---|---|---|---|---|
| 1.62 | 1.31 | 2.67 | 0.042 | 38.39 | 2.38 | 1.29 |
| Pile Spacing | Test Number | Ultimate Uplift Capacity (N) | Displacement (mm) | Ultimate Uplift Capacity Ratio (P-D48/A) |
|---|---|---|---|---|
| 2D | A-S6 | 203.1 | 3.16 | 2.26 |
| P-D48-S6 | 458.2 | 8.28 | ||
| 3D | A-S9 | 181.2 | 3.32 | 2.85 |
| P-D48-S9 | 516.5 | 8.04 | ||
| 4D | A-S12 | 215.4 | 3.38 | 2.54 |
| P-D48-S12 | 546.6 | 8.62 | ||
| 5D | A-S15 | 238.0 | 2.62 | 2.41 |
| P-D48-S15 | 574.5 | 8.20 | ||
| 6D | A-S18 | 241.8 | 3.03 | 2.62 |
| P-D48-S18 | 632.4 | 8.27 |
| Test Number | Pile Spacing (m) | Pile Number | Girth of Foundation Pile (m) | CSM Perimeter (m) | CSM Area (m2) | Experimental Value (KN) | Calculated Value (KN) |
|---|---|---|---|---|---|---|---|
| P-D48-S6 | 1.2 | 2 | 3.77 | 8.4 | 5.83 | 7331.20 | 7539.75 |
| P-D48-S9 | 1.8 | 2 | 3.77 | 9.6 | 7.03 | 8264.00 | 8214.71 |
| P-D48-S12 | 2.4 | 2 | 3.77 | 10.8 | 8.23 | 8745.60 | 8834.40 |
| P-D48-S15 | 3 | 2 | 3.77 | 12 | 9.43 | 9192.00 | 9451.94 |
| P-D48-S18 | 3.6 | 2 | 3.77 | 13.2 | 10.63 | 10,118.40 | 10,067.65 |
Disclaimer/Publisher’s Note: The statements, opinions and data contained in all publications are solely those of the individual author(s) and contributor(s) and not of MDPI and/or the editor(s). MDPI and/or the editor(s) disclaim responsibility for any injury to people or property resulting from any ideas, methods, instructions or products referred to in the content. |
© 2024 by the authors. Licensee MDPI, Basel, Switzerland. This article is an open access article distributed under the terms and conditions of the Creative Commons Attribution (CC BY) license (https://creativecommons.org/licenses/by/4.0/).
Share and Cite
Sun, T.; Yang, F.; Cui, X.; Huang, Z.; Lyu, X.; Ma, R.; Chang, Y.; Liu, S.; Wang, C.; Lin, Z.; et al. Model Test Study on the Vertical Uplift Bearing Characteristics of Soil Continuous Solidified Pile Group Foundations. Buildings 2024, 14, 849. https://doi.org/10.3390/buildings14030849
Sun T, Yang F, Cui X, Huang Z, Lyu X, Ma R, Chang Y, Liu S, Wang C, Lin Z, et al. Model Test Study on the Vertical Uplift Bearing Characteristics of Soil Continuous Solidified Pile Group Foundations. Buildings. 2024; 14(3):849. https://doi.org/10.3390/buildings14030849
Chicago/Turabian StyleSun, Tao, Fakai Yang, Xinzhuang Cui, Zhaochao Huang, Xianzhou Lyu, Ruijin Ma, Yujun Chang, Shengmei Liu, Chen Wang, Zhiyuan Lin, and et al. 2024. "Model Test Study on the Vertical Uplift Bearing Characteristics of Soil Continuous Solidified Pile Group Foundations" Buildings 14, no. 3: 849. https://doi.org/10.3390/buildings14030849
APA StyleSun, T., Yang, F., Cui, X., Huang, Z., Lyu, X., Ma, R., Chang, Y., Liu, S., Wang, C., Lin, Z., & Zhang, X. (2024). Model Test Study on the Vertical Uplift Bearing Characteristics of Soil Continuous Solidified Pile Group Foundations. Buildings, 14(3), 849. https://doi.org/10.3390/buildings14030849