Article

Comparing Differences in Jogging Support across Various Land Use Types in Urban Built-Up Areas Using User-Recommended Routes

Gold Mantis School of Architeture, Soochow University, Suzhou 215123, China
*
Author to whom correspondence should be addressed.
Buildings 2024, 14(3), 851; https://doi.org/10.3390/buildings14030851
Submission received: 10 February 2024 / Revised: 12 March 2024 / Accepted: 20 March 2024 / Published: 21 March 2024

Abstract

:
Land use types other than specialized athletic fields provide a variety of jogging environments, addressing the shortage of urban fitness facilities and promoting urban health as well as sustainability. Currently, there is limited research comparing the differences in jogging support among various land use types, which can assist decision-makers in setting priorities and targeted strategies for urban renewal, especially in urban built-up areas with limited land resources. Initially, spatial information, statistical data, and recommendation reason text were extracted from recommended routes in mobile fitness apps and categorized into six land use types. Subsequently, spatial potential was measured through descriptive statistics, buffer area analysis, spatial autocorrelation analysis, and line density analysis. Environmental preferences were gauged by text analysis using jieba word segmentation and grouped word frequency calculation. Finally, the measurement results of different land uses were compared, including scale differences, spatial differentiation, environmental perception, and environmental elements. The research found that streets, residential areas, campuses, parks, and greenways possess significant potential to support jogging, particularly streets. These types of land use exhibit varying spatial potentials and attractions in environmental preferences. Targeted recommendations have been proposed to support the renewal of urban built-up areas and research in related fields.

1. Introduction

Research indicates that the environment can influence individuals’ enthusiasm for participating in physical activities, thereby facilitating improvements in health [1,2,3]. Furthermore, the capacity of urban areas to support health is considered a crucial indicator for assessing urban sustainability [4,5] and urban resilience [6]. Jogging is widely recognized as a daily physical activity [7,8], offering well-documented positive effects on health improvement [9,10]. Although athletic fields and gymnasiums offer professional venues for jogging, ensuring comprehensive coverage proves challenging, especially in urban built-up areas. Such areas often lack sufficient available land to meet the growing population and demands, thus opting to refurbish existing land use. It is noteworthy that jogging is characterized by its versatility, as it does not require highly specialized venues, thus enabling its practice in diverse land use types, such as parks, streets, residential areas, campuses, etc. These locations are now increasingly recognized as more accessible and attractive compared to formal athletic venues [11]. By enhancing these lands to support jogging, it is possible to effectively bolster urban support for fitness activities. In some studies, it is referred to as Temporary Appropriation (TA) [12], or the utilization of informal sports activities [13], and is considered to enhance social resilience and urban sustainability.
Recent studies have explored the relationship between the built environment and jogging [14,15,16,17,18]. Some environmental factors related to jogging have already been studied, such as accessibility [19], temperature [20], air quality [21,22], greenery [23,24], and slope [25]. However, these studies often concentrate on a single type of land use environment, such as streets [15], parks [26], or greenways [27], with limited analyses comparing different land use types. Given that different lands are managed by various sectors, this study can significantly enhance collaboration among different sectors [28] to promote the efficient and integrated use of land. On one hand, the potential for developing jogging environments varies across different land uses, necessitating prioritized attention from policymakers towards lands with higher potential. The characteristic constraints of land in built-up areas make spatial potential particularly crucial. On the other hand, the impact of certain environmental factors on running has been demonstrated, such as greenery in streets [23] and parks [29,30], the importance of factors may vary across different land use types. This implies distinct orientations to guide urban renewal in an efficient, cost-effective manner. Therefore, discussing the distinctions among various land uses is crucial, including: (1) the spatial potential of different lands to support jogging, which aids decision-makers in identifying valuable lands and setting priorities for land renewal; (2) the environmental preference in supporting jogging, to offer targeted strategies for the enhancement of jogging environments in various land use types.
Traditional methods for estimating social behaviors in linear network spaces are generally more complex than those for point-shaped and polygon-shaped spaces [31], frequently necessitating extensive and intricate data collection efforts [32,33]. In recent years, crowd-sourcing data analysis has emerged to explore the relationship between urban environments and physical activities [28,34]. The use of crowd-sourcing data, facilitated by the widespread availability of mobile phones, enables the efficient delegation of tasks usually performed by professional teams to a broad user base [35,36]. Many fitness apps have introduced recommended route platforms, allowing users to compile and endorse their preferred fitness routes, which represent a form of crowd-sourced data with diverse information, offering a valuable resource for understanding users’ preferences.

2. Materials and Methods

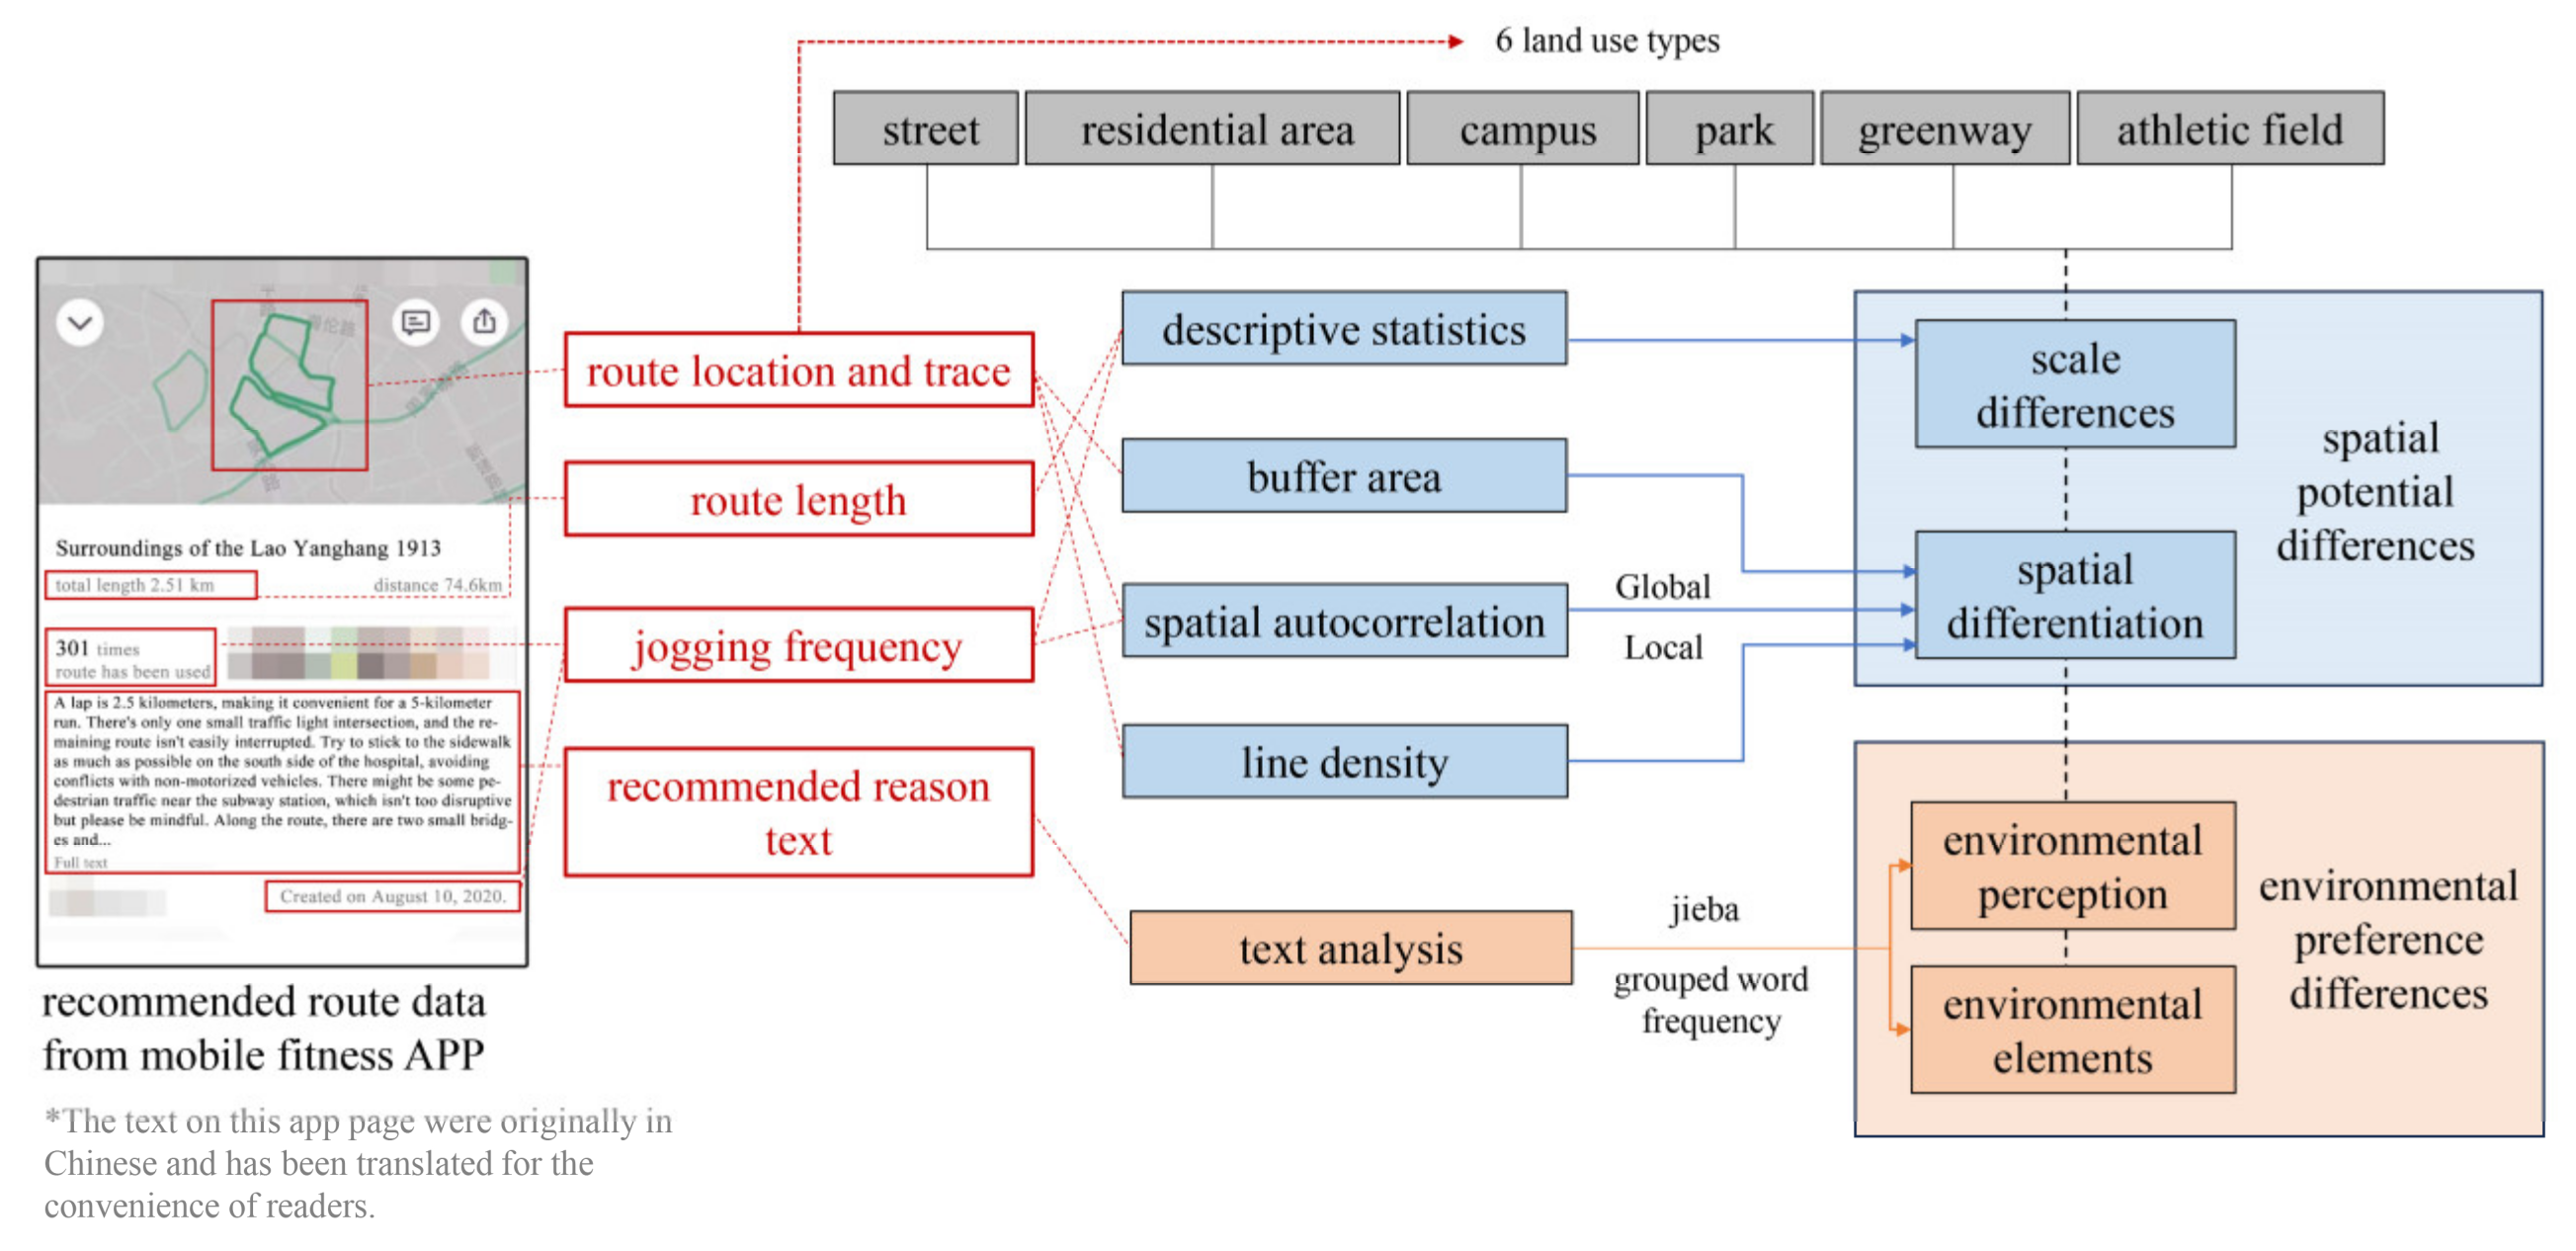
2.1. Research Framework

The research seeks to compare differences in jogging support across six land use types, categorized into two aspects: spatial potential and environmental preference. Differences in spatial potential comprise scale differences and spatial differentiation. Scale differences involve descriptive statistics including the number and jogging frequency of recommended routes across different land use types. Spatial differentiation concerns the spatial impact range of these routes and their geographic distribution differences within the city. Environmental preferences are illustrated by comparing the word frequency of different environmental factors from the recommended reason text, categorized into two categories: environmental perception and environmental elements (Figure 1).

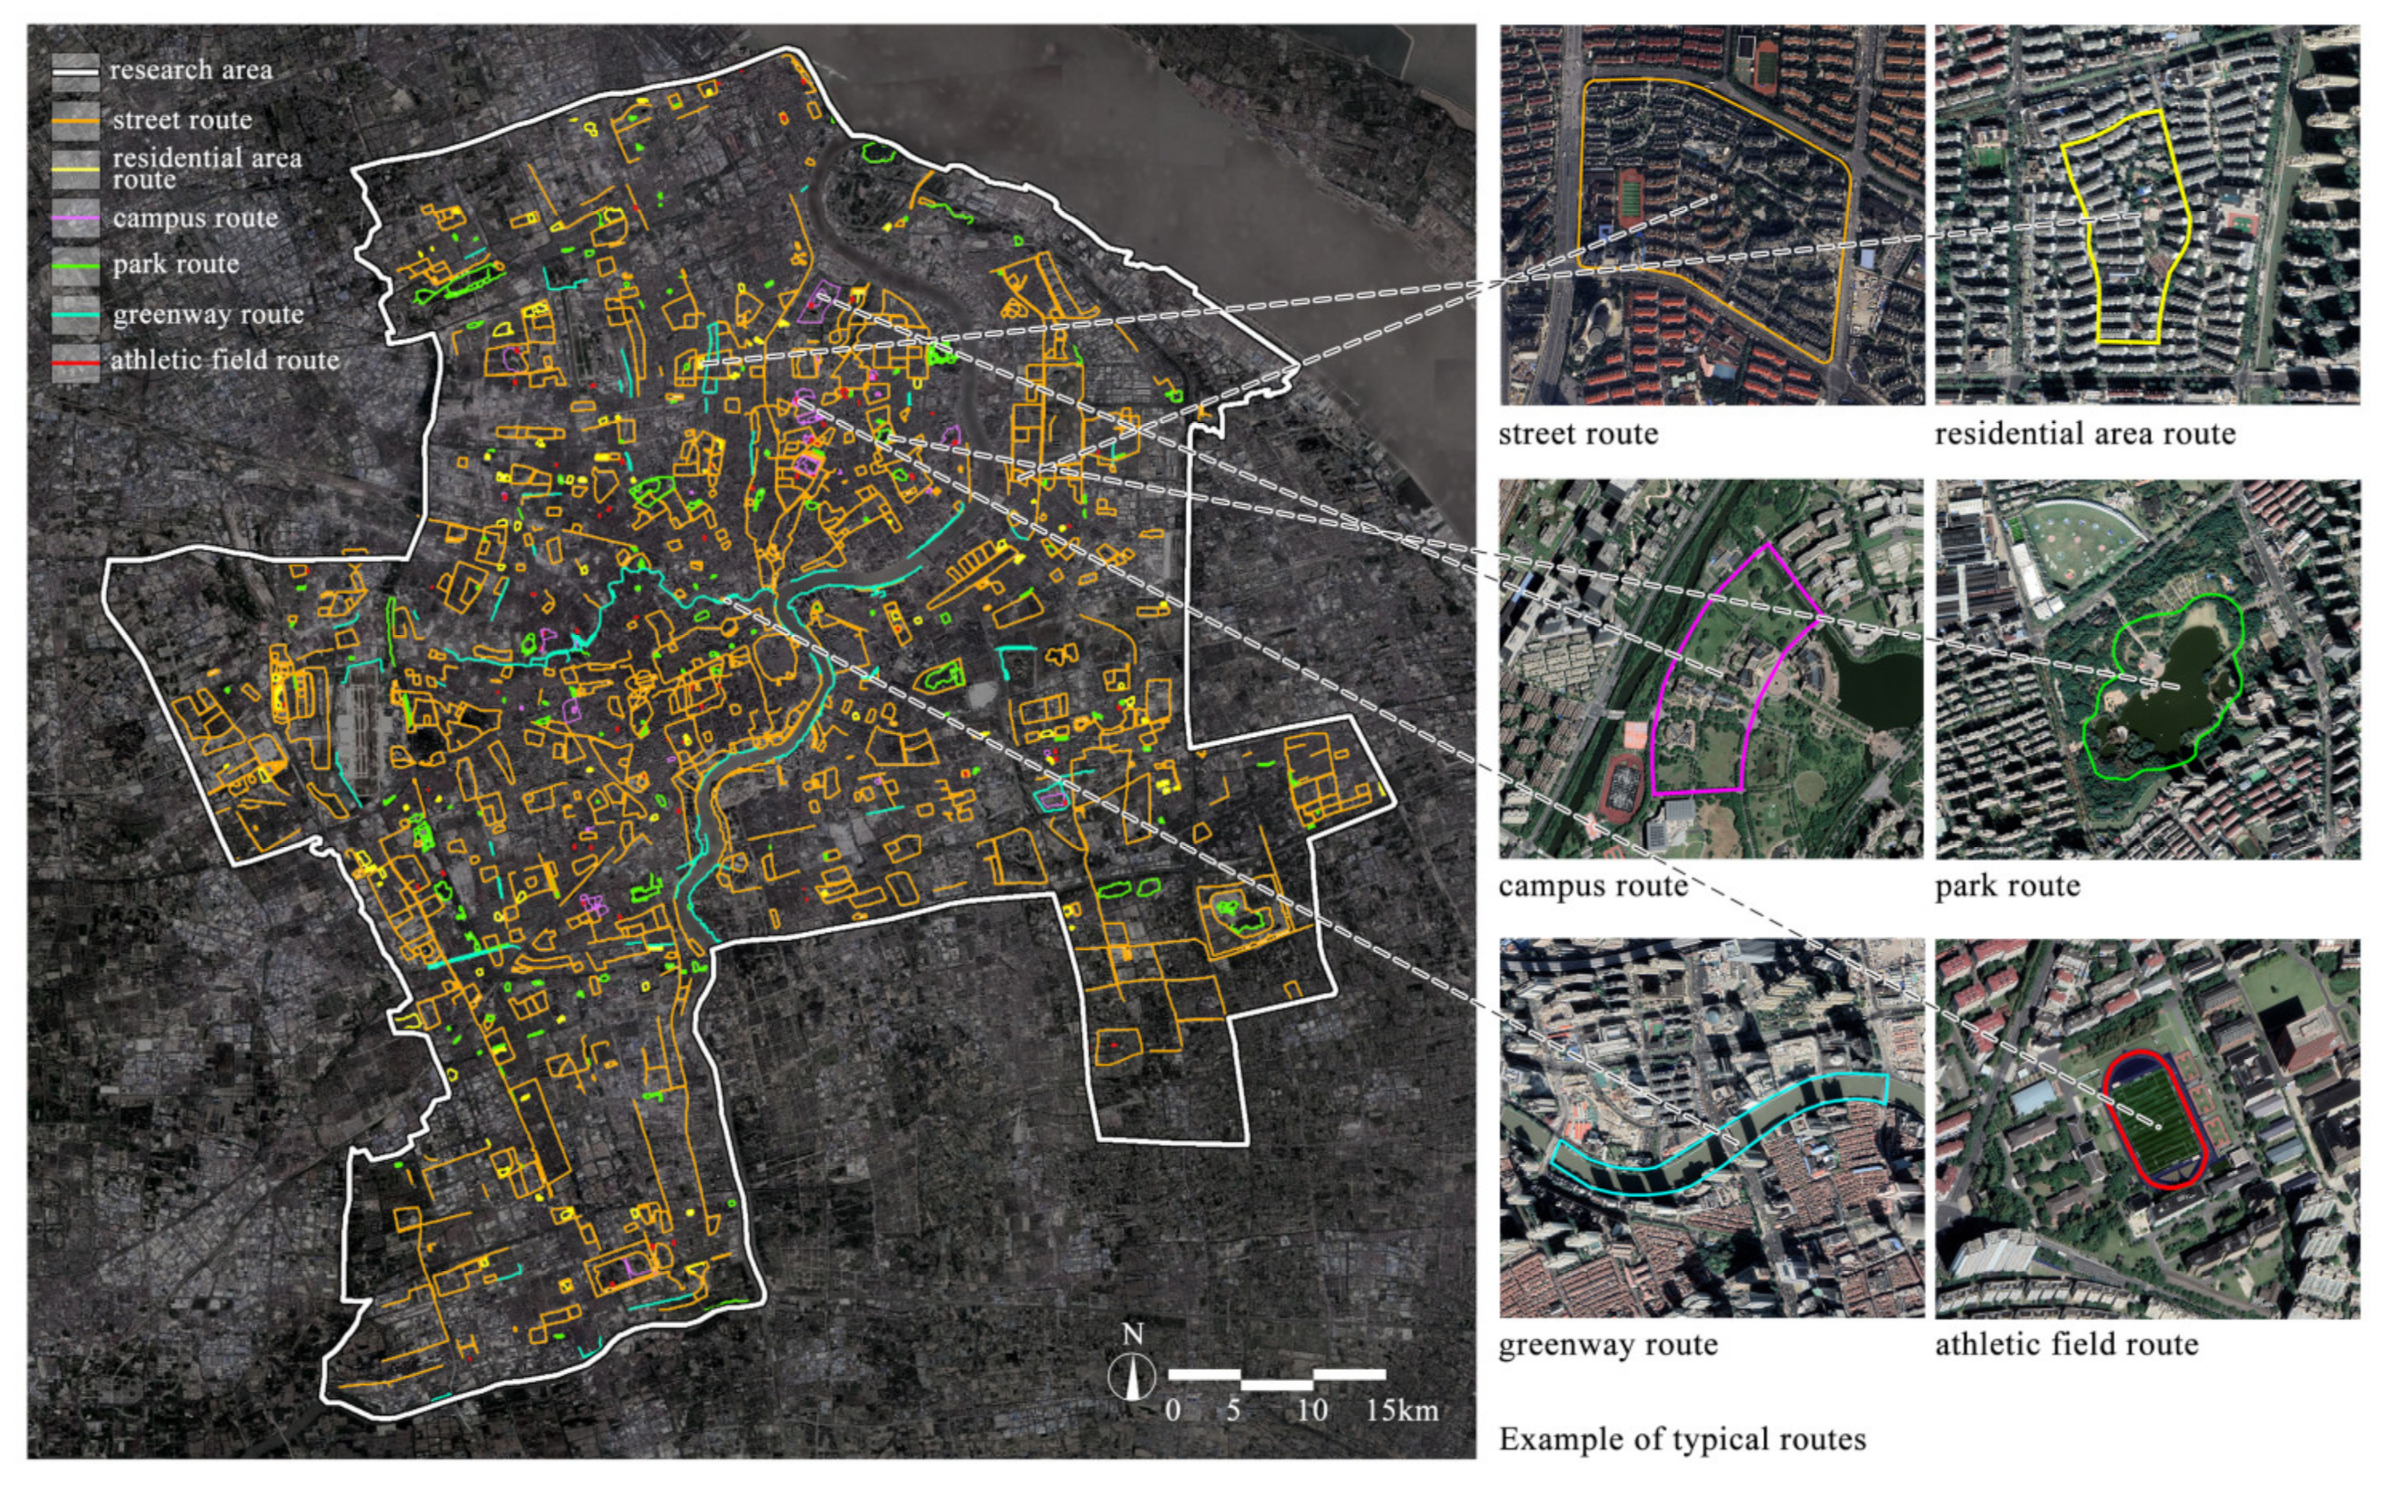
2.2. Data Sources and Land Use Types Classification

The research is centered on the central urban area of Shanghai, as defined by the Shanghai Urban Master Plan (2017–2035) [37]. This area is considered a typical urban built-up area. The primary dataset employed in this study comprises the recommended route data sourced from the mobile fitness application, KEEP 7.30.0. The recommended routes are entirely user-generated. Users typically need to use the app for a period of time and reach a certain user level to create routes. Once created, the usage of these routes is continuously monitored and recorded. This dataset features a range of attributes, including route paths and geographical locations, frequency of usage, route length, recommended reason text, and the date of creation. The collection of research data involved a manual process, wherein data collectors utilized georeferencing techniques to trace route trajectories using images sourced from the fitness app on the ArcGIS 10.8 platform. In total, 1067 recommended routes have been collected, as shown in Figure 2.
Land use types have been categorized into six classes: street, residential area, campus, park, greenway, and athletic field, based primarily on the classification description of recommended routes in recommended reason text, route names, and the geographic locations of the routes (Table 1). Data collectors manually determine the classification types during the data collection process. When encountering routes that meet multiple types, priority is assigned to the type that meets the most criteria. Among them, athletic fields are the most formal jogging venues with a clear functional orientation. Greenways are often designed with jogging support in mind [38], followed by parks [26]. Conversely, the design of streets, residential areas, and campus roads primarily focus on commuting, with jogging serving as an added value rather than their primary function. These six types account for 99.63% (1063 routes) of the recommended routes within the study area. While jogging routes may be found in spaces with different land use types, their limited presence in this sample required their exclusion from the study.

2.3. Spatial Analysis

Based on the statistical data provided by recommended routes, the Jogging Frequency (JF), which assesses the frequency of route usage, is determined using the route creation time (t0), data collection time (t1), and the total route usage count (s):
JF = s t 1 t 0
The number of routes, JF, and length are subjected to descriptive statistics to assess and compare the scale differences of recommended routes across different land use types. JF and length are evaluated from both the total and average perspectives.
Buffer area analysis, spatial autocorrelation analysis, and line density analysis are employed to compare the spatial differentiation of recommended routes across different land use types.
The average buffer area of single routes and the total buffer area were computed to compare the sizes of urban areas affected by the routes. The buffer area is defined by calculating the buffer zones around the recommended routes. Notably, the buffer zone radius, set at 800 m, adheres to the 15-min radius convention within the community life circle framework in Chinese community management [39].
Spatial autocorrelation analysis was employed to observe the geographic distribution differences of jogging routes across various land use types. Global Moran’s I index [40] and Local indicators of spatial association (LISA) [41] were used to detect the clustering of routes with JF, and the average nearest neighbor analysis [42] was utilized to examine the clustering of routes in ArcGIS 10.8. The Global Moran’s I index was initially applied to assess the distribution across the entire study area. LISA was calculated to further analyze clustering outcomes, with results visually expressed on maps to identify local clustering patterns.
Routes density and JF density were calculated and visualized to compare the geometric distribution. Routes density was depicted using line density analysis [43] in ArcGIS 10.8. JF density was also calculated by line density, incorporating JF as a weighting factor.

2.4. Text Analysis

The recommended reason is text related to the route illustrates the main reason for the user’s recommendation, and text analysis [44,45] can help identify the joggers’ preferences.
Before text analysis, irrelevant descriptions were manually omitted, such as descriptions of the campus route like “XXX University, a key university with a profound history and culture…”. A specialized dictionary was created specifically for this research.
This study utilized the jieba word segmentation [46] algorithm for Chinese word segmentation. The jieba algorithm employs dictionary and maximum matching methods for word segmentation. Effective segmentation of Chinese text is achieved by creating a dictionary and considering both forward and reverse maximum matching results. Additionally, it incorporates the Hidden Markov Model to refine segmentation position judgments, enhancing segmentation accuracy. The algorithm demonstrates strong performance in segmentation effectiveness, efficiency, and reliability, substantially supporting Chinese text analysis in this research.
After completing the word segmentation, word frequency was calculated on the overall text. Based on word frequency results and literature review, 25 key factors were identified and categorized into two groups: environmental perception and environmental elements (Table 2). Words were classified into these 25 factors, allowing for the grouped calculation of the frequency of different factors.
The classification of environmental perception and environmental elements was primarily based on the part of speech of the words, while the categorization of factors mainly stems from the study of literature related to jogging. Environmental perception factors involve abstract spatial sensations, predominantly represented by adjectives, including safety [47,48], vibrancy [28], cleanliness [49], slope [25], width [15,50], accessibility [14,19], connectivity [28], air quality [22,51], scenic beauty [14,18], greenery [23,24], lighting [52,53], soundscape [28], and temperature [20,54]. Environmental elements factors primarily include concrete spatial entities, represented mostly by nouns, including vehicles [51,53], pedestrians [14,32], traffic infrastructure [28,55], landscape [14], green space [24,50], waterfront space [26,32], service facilities [14,15], lighting facilities [52,53], pavement [48,56], culture [57], buildings [15,58], and vertical elements [25].
To control the number of factors, we selected the top 25 factors based on a comparison of all word frequencies. As a result, some factors that have been proposed in other studies may not be within the scope of our research. These terms, despite receiving significant attention from experts, are mentioned less frequently by users when describing their preferred routes, which may be related to cultural differences and the specificity of language. For example, animal-related terms were scarcely mentioned in all the texts, although some studies have shown a correlation between animals such as dogs and jogging [48,53,59]. This may be related to variations in the management and perception of pets in different countries. Therefore, this study did not include it as a factor.
Based on the 25 factors from Table 2, grouped calculations of the frequency of different factors were conducted across various land uses. The word frequency fi of a certain factor is determined by the ratio of the number of recommended routes ni containing words related to that factor to the total number of recommended routes n, with the formula as follows:
f i = n i n
Due to the involvement of multiple variables in the research, Sankey diagrams were utilized to visualize the results of word frequency comparisons, providing an intuitive display of the differences between various contents. It is noteworthy that the interpretation of word frequency analysis results requires caution: (1) Within the same land use types, it is possible to compare which factors are more of concern to people. For instance, some people may prefer crowded places while others prefer less crowded ones. The study cannot determine whether more or fewer pedestrians are better, but it can reveal that most people mention pedestrians more frequently than greenery when recommending street routes; (2) When comparing the performance of the same factor across different land use types, we can identify which land use has advantages. For example, if the greenery fi in parks is higher than that in streets, it indicates that greenery in parks is more likely to be used as a reason for recommending jogging routes, highlighting the characteristic features of parks.

3. Results

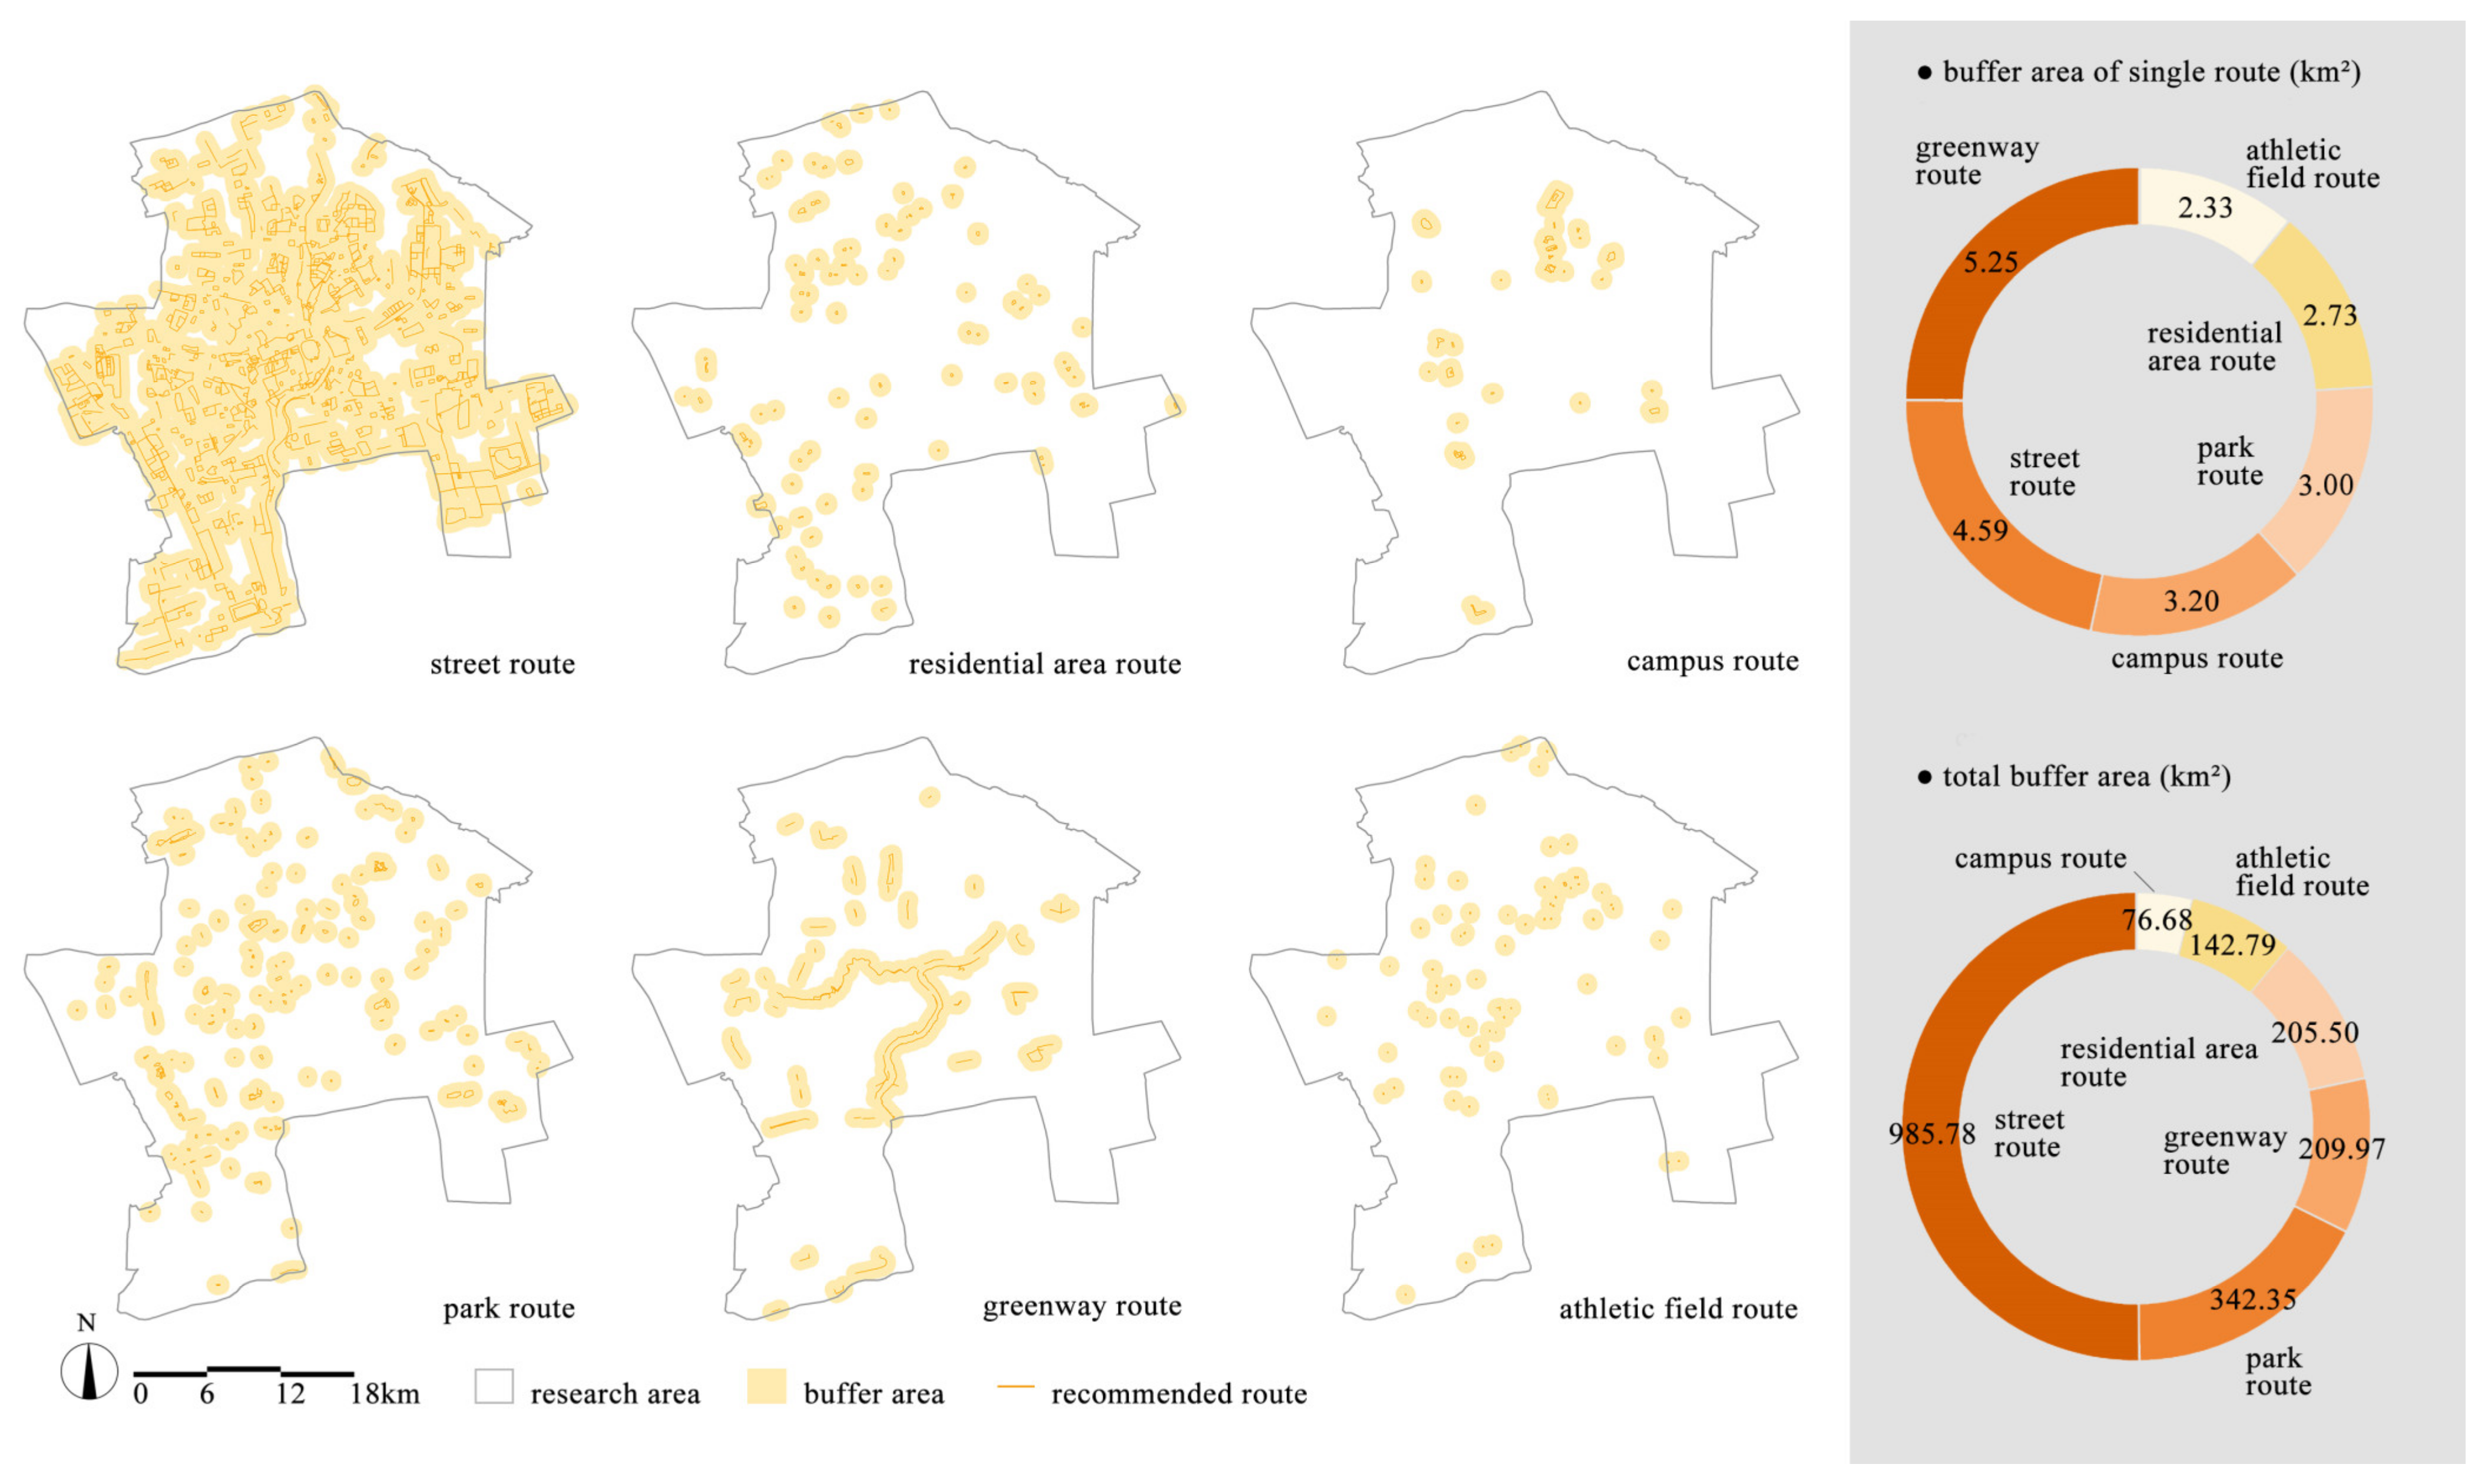
3.1. Scale Differences

Table 3 shows that, regarding the number of routes, street routes are the most prevalent, followed by park routes and residential area routes. Athletic field routes exhibit the highest average JF per route, followed by greenway routes and park routes. However, regarding total JF, street routes lead, with athletic field routes in second place, showing a narrow margin from the third-placed park routes. Furthermore, street routes are generally longer than other types of routes, both in total and in average length per route.

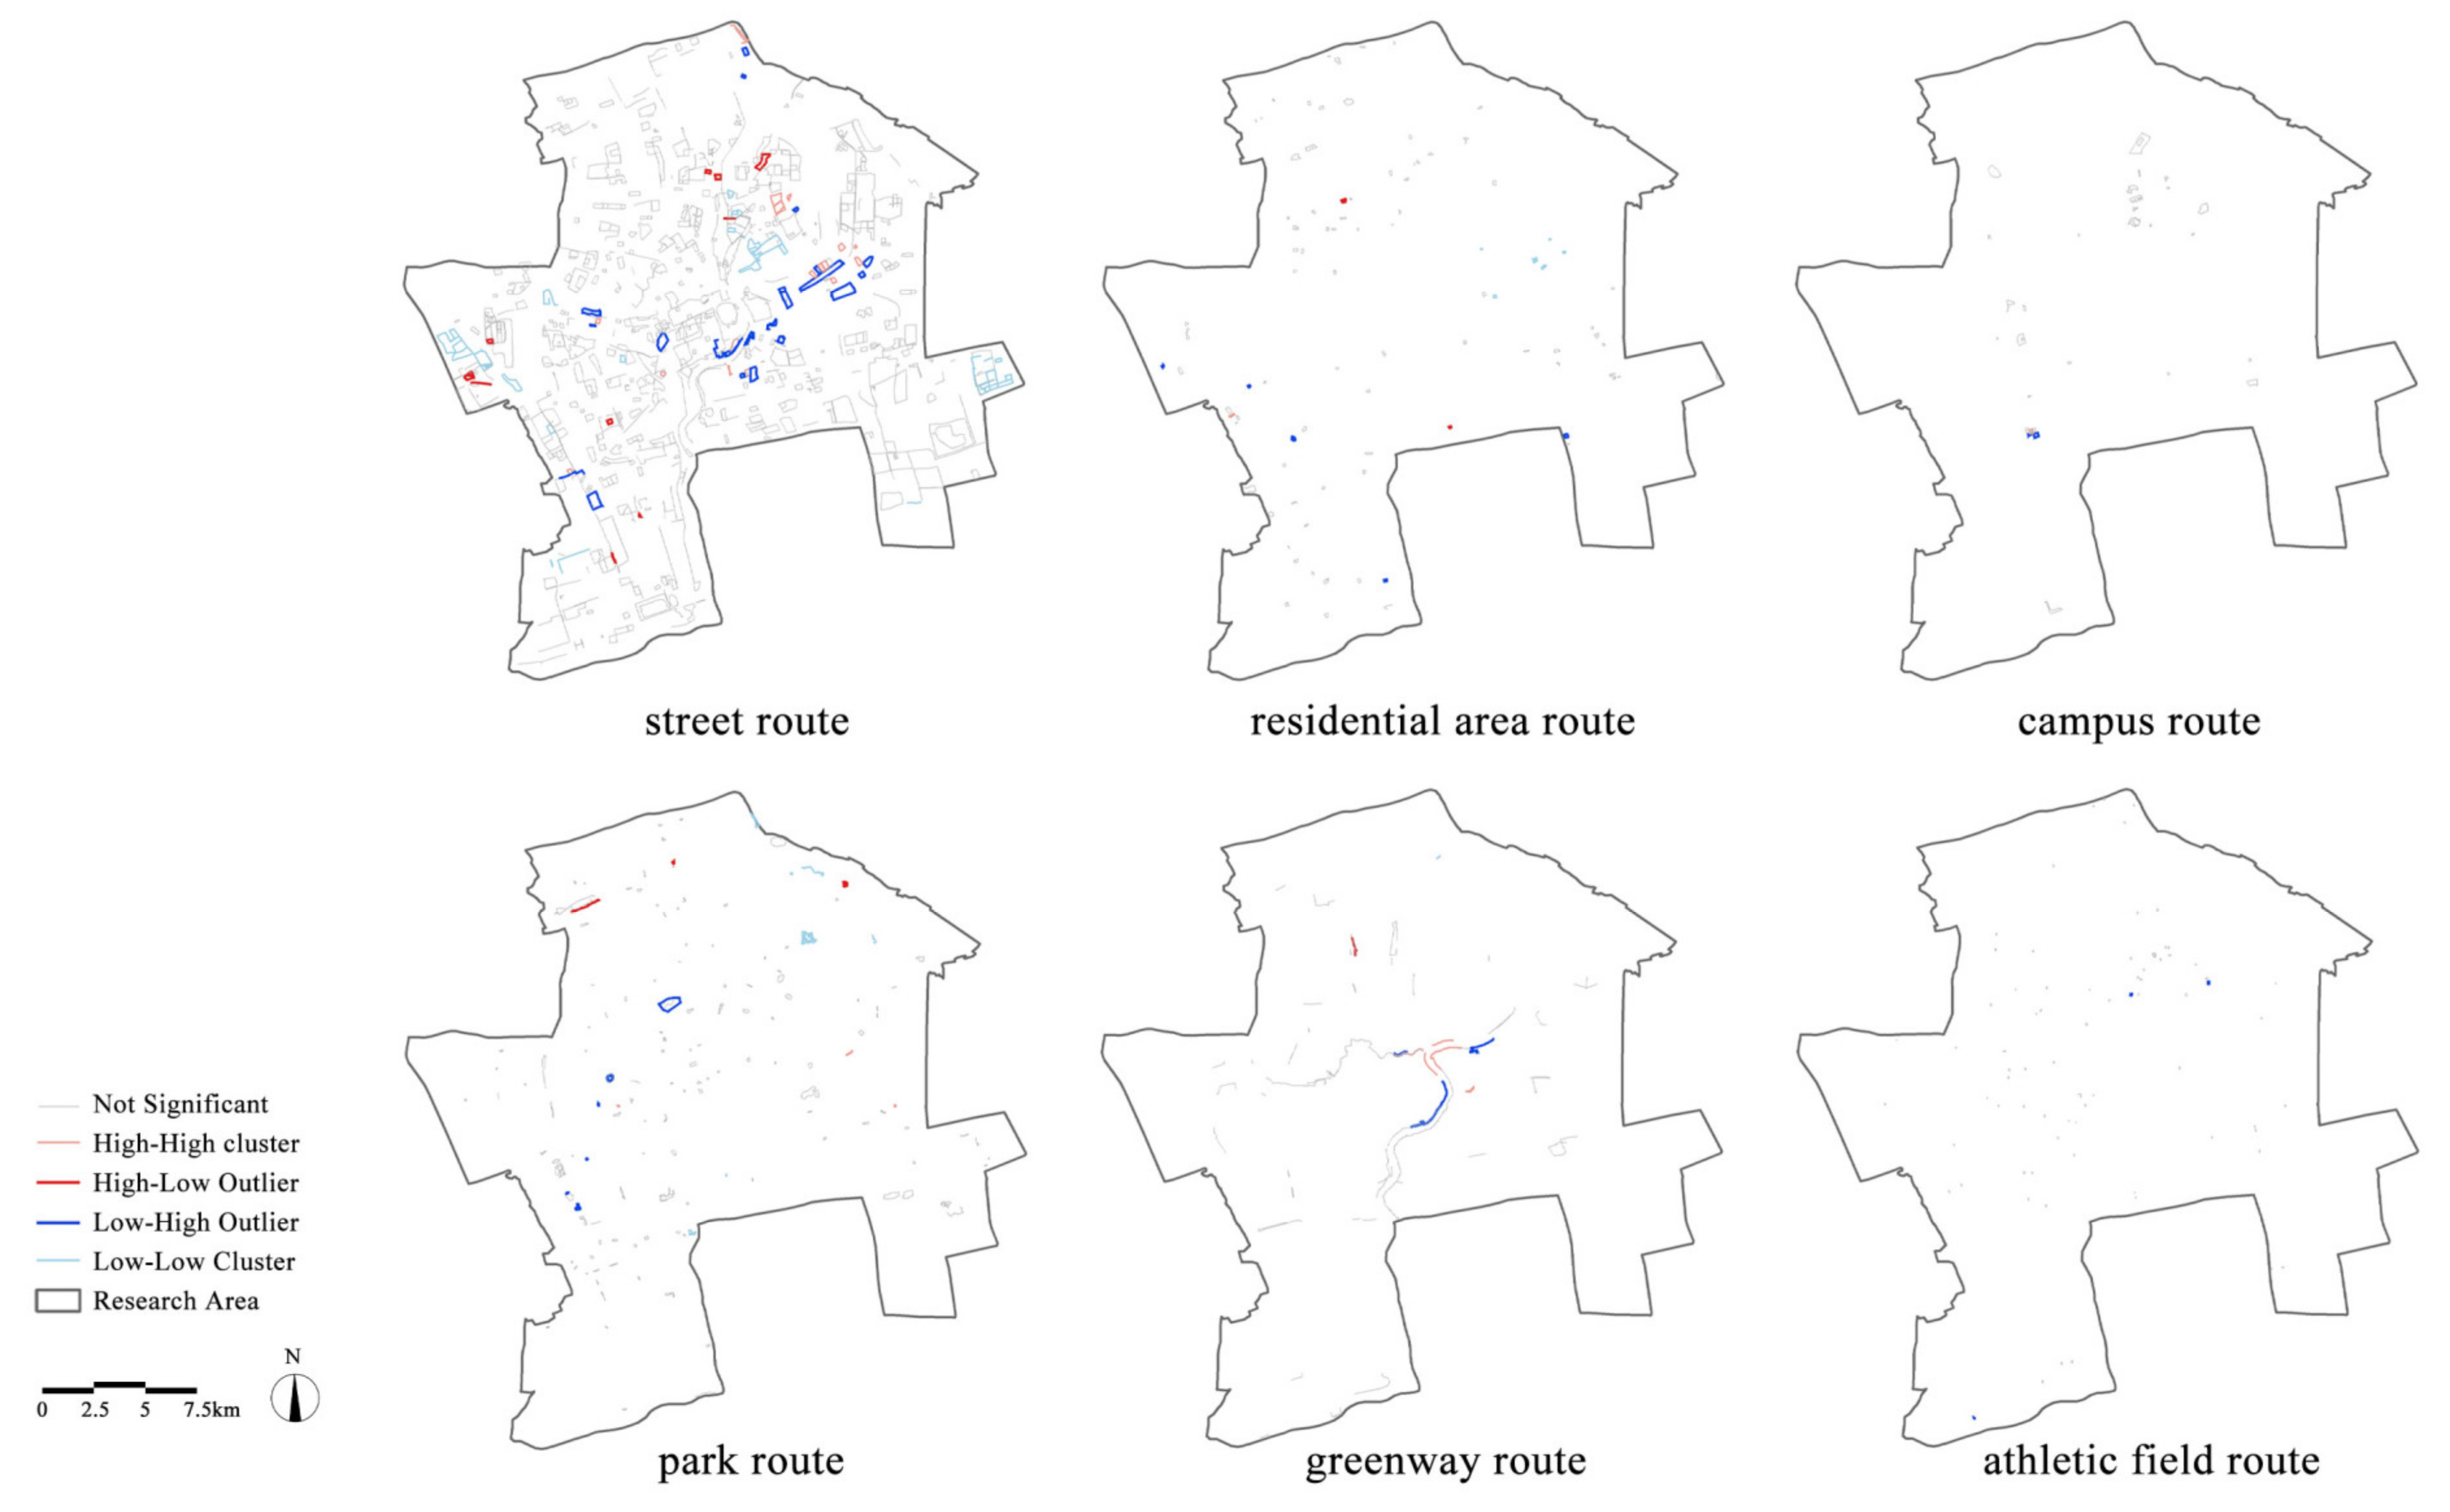
3.2. Spatial Differentiation

Figure 3 illustrates the buffer area of routes across different land use types. From the perspective of the buffer area of single routes, greenway routes have the largest area, followed by street routes and campus routes. Athletic field routes have the smallest buffer area of single routes. In terms of the total buffer area, street routes cover the largest area, followed by parks and greenways. Campus routes have the smallest total buffer area. From the map, street routes form a large area-shaped buffer zone, while greenway routes create a concentrated T-shaped strip in the center of the city. Routes within other types of land use form point-shaped buffer areas distributed throughout the urban area.
Table 4 presents the results of the spatial autocorrelation detection. Per the Global Moran’s I, significant spatial autocorrelation of JF is exhibited only by street routes. All land use types are shown to be clustered according to the average nearest neighbor analysis.
Figure 4 presents the results of the LISA index, revealing complex local clustering patterns of features within street routes. Most high–high and high–low clusters were located in the city center and slightly north of the center, whereas low–high clusters are primarily found in the city center. Low–low clusters are mainly on the eastern and western sides of the research area. Residential areas and park routes exhibit high–high and high–low clusters at the edges of the research area. High–high clusters of greenways are predominantly situated in the very center of the city, closely surrounded by some low–high clusters. Athletic fields and campuses do not show significant high–high and high–low clustering, only featuring sporadic low–high clusters.
The line density of various route types was further visualized as shown in Figure 5. Among these analyses, line density mapping of JF density specifically targeted street routes due to their significant global spatial autocorrelation. Line density mapping for route density was applied to all route types.

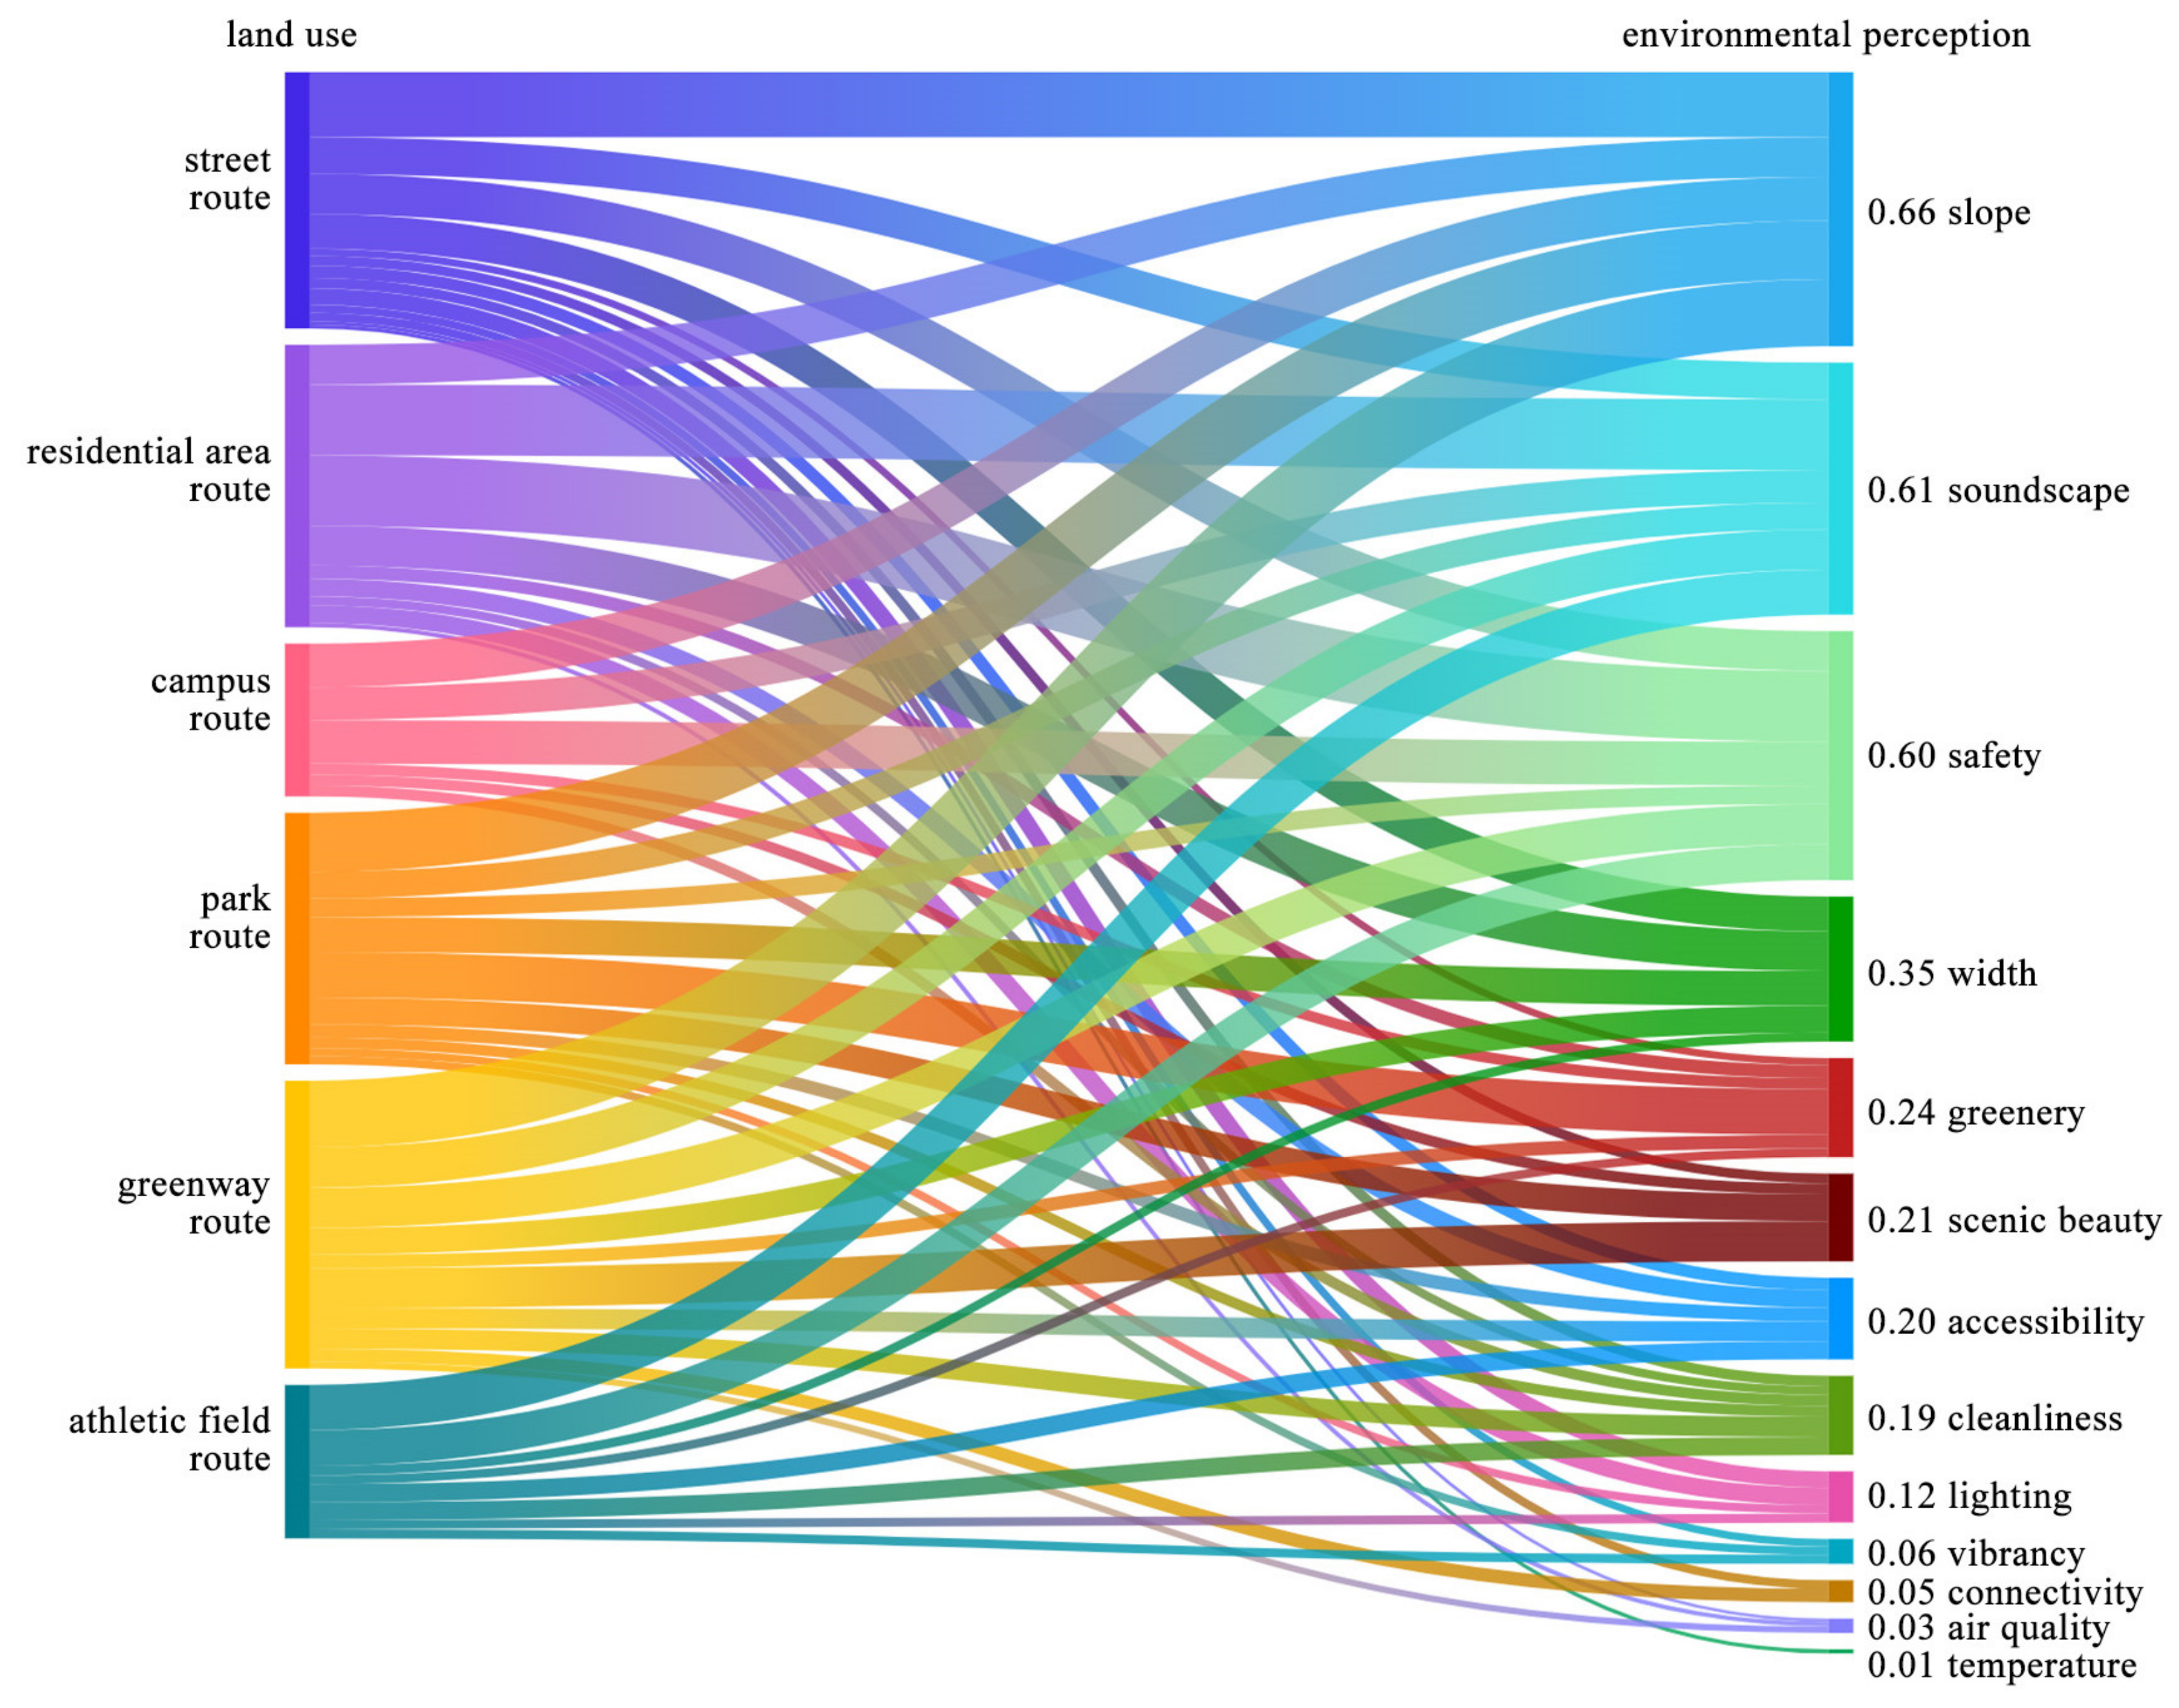
3.3. Environmental Perception

Figure 6 illustrates the variations in focal points between environmental perception and land use types. In this Sankey diagram, the total sum of the frequency (fi) of factors across all routes was also calculated, and this was used to rank the factors on the right side of the diagram, in order to observe which factors are more frequently considered on a general level. Overall, among the six land use types, slope, soundscape, safety, and width almost always received high levels of attention. Greenery, scenic beauty, accessibility, lighting, and cleanliness were given moderate attention but may exhibit differences in certain land uses compared to others. Vibrancy, connectivity, air quality, and temperature were mentioned only in specific land uses and generally received lower levels of concern.
The distinct differences observed across six land use types are as follows: in streets, most factors were mentioned, including some rarely discussed factors such as vibrancy, connectivity, air quality, and temperature. In residential areas, scenic beauty, which was mentioned in most land uses, was not mentioned. Air quality, less frequently mentioned across all land use types, was noted in residential areas. On campuses, many elements that were of concern in other land types were not mentioned, including width, lighting, and accessibility. In parks, greenery received particular attention. Vibrancy and air quality, less noted in other land uses, were also addressed. In greenways, scenic beauty and cleanliness were particularly noted. Connectivity, less mentioned in other land use types, was highlighted in greenways. Lighting was not mentioned in greenways. In athletic fields, slope, widely mentioned in general, was not mentioned at all. The scenic beauty was also not noted. Vibrancy, generally less concerned with other land use types, received attention. Moreover, cleanliness received relatively more attention in athletic fields compared to other land use types.

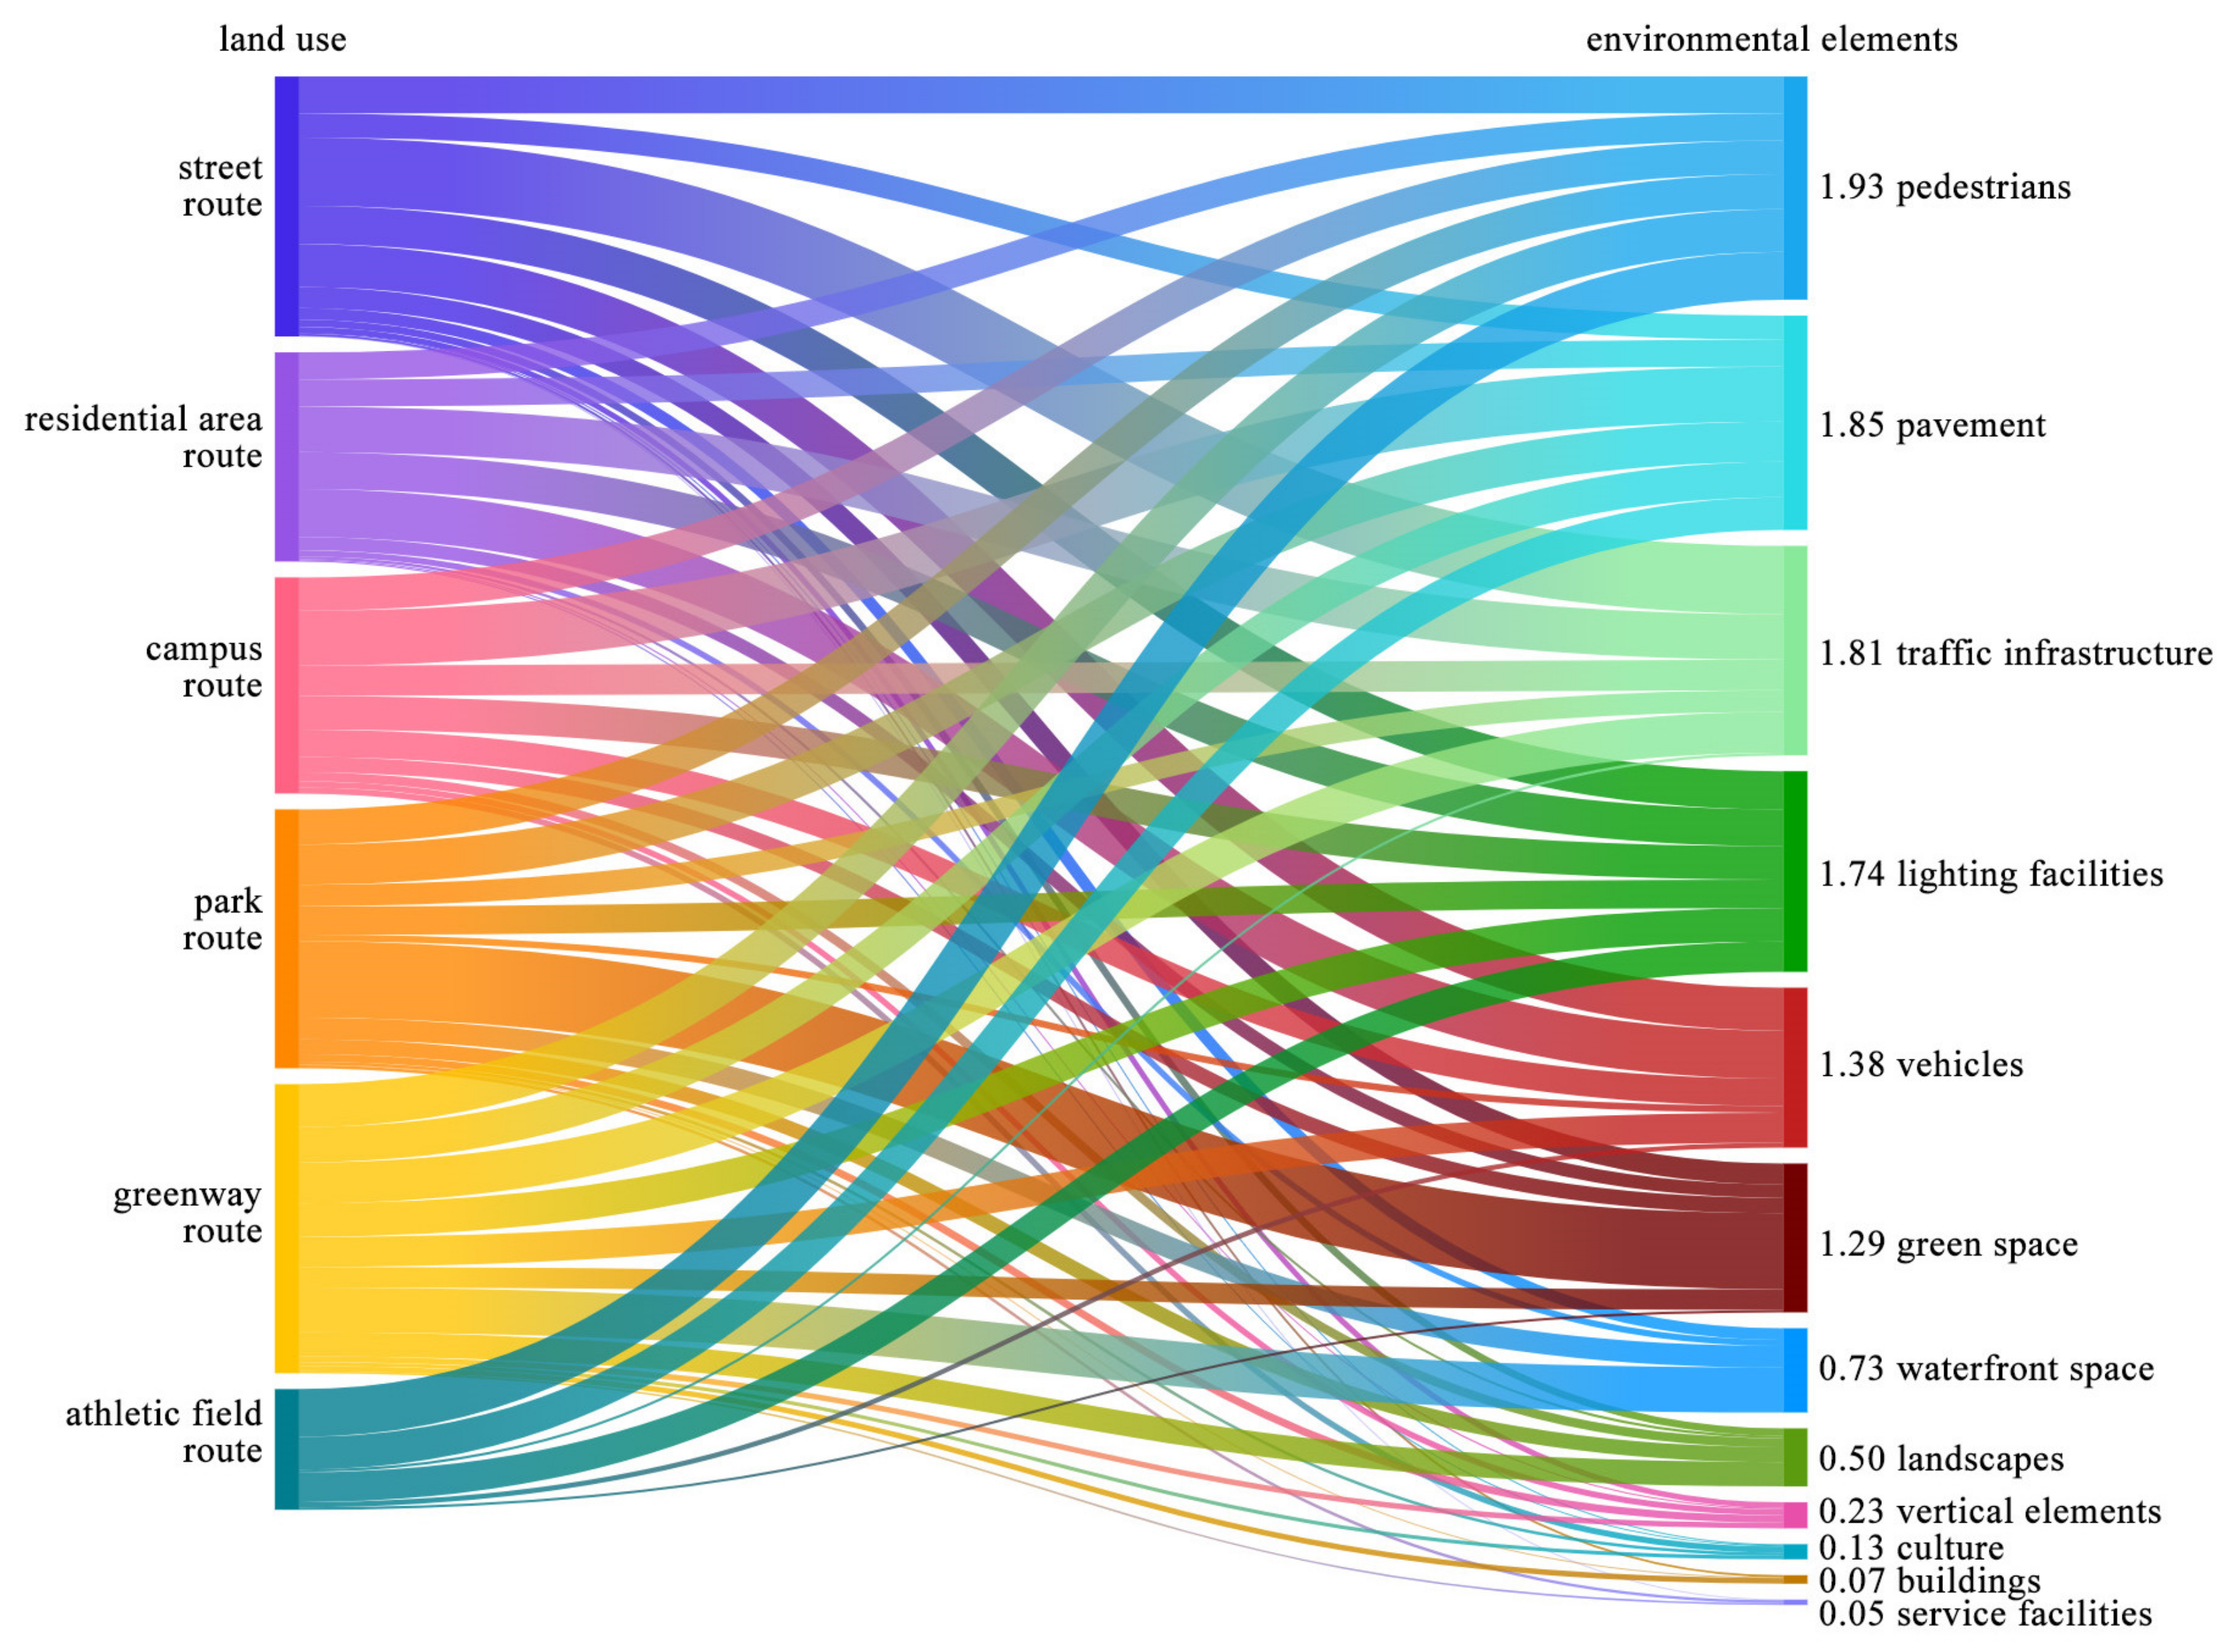
3.4. Environmental Elements

Figure 7 illustrates the variations in focal points between environmental elements and land use types. Overall, in the six types of land use, pedestrians, pavement, traffic infrastructure, and lighting facilities almost always received high levels of attention. Vehicles, green spaces, landscapes, and waterfront spaces were given moderate attention but may exhibit differences in certain land uses compared to others. Vertical elements, culture, buildings, and service facilities were mentioned only in specific land uses and generally received lower levels of concern.
The distinct differences observed across various land use types are as follows: in streets, all factors were considered, including vertical elements, culture, buildings, and service facilities, which generally attract less attention in other land use types. In residential areas, landscapes are mentioned less frequently compared to other land uses. Vertical elements and culture, which are less frequently mentioned across all types, have received attention. On campuses, vertical elements and culture were noted. In parks, vehicles attracted less interest compared to other land use types. Green spaces were highly focused on. Buildings and service facilities, which received less attention in other land types, were mentioned. In greenways, waterfront spaces were primarily the focus. Buildings and service facilities were also noted. In athletic fields, traffic infrastructure, widely noted in other land use types, was mentioned only minimally. Vehicles and green spaces attracted minimal attention, and landscapes were not mentioned.

4. Discussion

4.1. Spatial Potential

The results of the scale differences reveal that athletic fields have the highest jogging frequency among land use types, yet the total volume of jogging remains highest on streets, which also offer the most extensive coverage of jogging support services, demonstrating prominent potential. In contrast to the limited number of athletic fields, a significant number of people opt for the streets, parks, greenways, and residential areas as their jogging venues. The number and JF of campus routes are the smallest, possibly limited by the number of campuses in urban areas.
From the comparison of buffer areas, routes in different land use types have created distinct spatial distribution patterns. Street routes feature extensive coverage, making them the land-use type with the greatest potential to enhance jogging support coverage. Greenways form linear, long corridor spaces, with individual greenways having the highest impact range, facilitating the formation of continuous jogging environment support. However, at present, this corridor space is primarily composed of a T-shaped backbone. These large-scale greenways can further increase accessibility and connectivity with surrounding greenways [60], thereby forming a broader network structure. The buffer areas of routes in other land uses are scattered, mainly limited by the land’s own layout.
Significant global spatial autocorrelation in JF was observed in street routes, indicating a weaker correlation between JF and the geographical locations of other land use types on a city-wide scale. The results of LISA reveal that highly utilized routes are clustered in the city center, yet segments of the city center also exhibit clusters of low JF routes. The intermingling distribution of different cluster types suggests that streets in various districts of the city center provide markedly different levels of support for jogging, necessitating further refined assessments to identify more precise differences between neighborhoods. High JF routes in parks and residential areas are locally clustered at the edges of the study area, likely due to the lack of attractive parks and residential areas for jogging in the city center. High JF routes in greenways are concentrated in the city center. This is likely heavily reliant on the city’s two major rivers: the Huangpu River and the Suzhou River, along whose banks numerous greenway projects have been developed in recent years, forming large-scale greenways [61]. The construction of such projects has evidently had a positive impact on jogging support. High JF routes in athletic fields and campuses did not show significant local spatial autocorrelation, which may be due to the dispersed distribution of these two land use types.
In street routes, a higher JF density is concentrated in the city center, suggesting a higher occurrence of jogging activity, potentially due to the area’s appealing environment or substantial demand. However, the center of route density distribution differs from JF density distribution, indicating that the current supply level of street routes may deviate from people’s demand in these mismatched areas. Residential and park routes show distribution patterns distinct from other types, not centered on urban core areas. This could suggest a shortage of parks and residential areas conducive to jogging in city centers, as indicated by the LISA results. Campus routes and athletic field routes have a similar distribution, likely due to overlapping geographical locations of campuses and athletic fields, alongside a scarcity of athletic field venues beyond campuses. Street routes and athletic field routes also share a similar focus, indicating that numerous athletic fields do not deter the exploration of street routes; instead, areas with athletic fields may actually encourage the exploration of nearby street routes. Greenway routes are primarily found in central urban areas, where a distinct T-shaped center can be observed, consistent with the results of the buffer area study and LISA index.

4.2. Environmental Preference

Overall, across the six land use types, environmental perceptions of slope, soundscape, safety, and width, as well as environmental elements of pedestrians, pavement, traffic infrastructure, and lighting facilities, received widespread attention, in alignment with current research [21,25,32,47,48,50,52]. These factors are widely mentioned by users across various types of land use and are frequently focused on. They need to be prioritized in the process of environmental improvement for almost all types of land use. Greenery, scenic beauty, accessibility, lighting, cleanliness, vehicles, green space, landscapes, and waterfront spaces garner less attention. These environmental factors, while not as prominently regarded as the previous category, still hold significant influence, reflecting findings from existing studies [14,16,19,24,52,56,62]. Most of these factors exhibited variations in performance across different land use types and need to be considered separately in the process of environmental improvement for each land use type. Air quality, temperature, connectivity, vibrancy, vertical elements, culture, buildings, and service facilities are less emphasized and exhibit significant variation across different land uses. Specific factors such as air quality [20], temperature [63], connectivity [28], culture [57], architecture [64], and service facilities [15] have been the focus of detailed studies, yet their impact appears limited to a few land use types compared to other factors. Thus, these factors warrant careful consideration in the decision-making process for environmental improvement.
Building upon the overall trends, different land uses exhibit distinct differences from each other. We further discuss the potential reasons behind these differences:
In streets, a range of factors—such as air quality, temperature, connectivity, vibrancy, waterfront spaces, buildings, and service facilities, often overlooked in other land uses—are taken into account, likely due to a broader array of street routes. This diversity could also be attributed to the street environment’s complexity. It is worth mentioning that temperature is only mentioned in street routes, possibly because the climatic conditions on streets are poorer, being closer to large areas of hard surfaces and relatively lacking in greenery. Therefore, people are concerned about whether the recommended street routes offer a favorable temperature environment.
In residential areas, scenic beauty and landscapes in residential areas garner less attention, likely because there are fewer iconic landmarks set up within residential areas. In residential areas, air quality received attention, possibly because people consider a good air environment to be an advantage for this type of land use. The culture received attention, traced back to a comment stating, “Running at night allows one to see the lights of homes, experience the community culture, and find oneself”, which depends on the user’s personal feelings and might not be directly related to the residential land use itself. Vertical elements also received minimal attention, originating from a comment that mentioned, “There are steps at the entrance, which require caution”.
On campuses, accessibility is given notably low priority, likely due to the close proximity of users’ (primarily students) living spaces to available jogging environments, rendering convenience a non-issue. on campuses, the width was not a primary focus, likely due to the lower building density within campuses, where most spaces are relatively spacious. Lighting was not mentioned in the context of campuses, possibly because the illumination level of streetlights is not a concern for users, as campuses are generally considered safer and removed from traffic and potential criminal activity. Vertical elements received attention, likely because there are some significant slopes within campuses, as highlighted by a recommendation that mentioned, “There are a few corners with uphill and downhill paths, which are more strenuous to run on”. The culture was noted, as campuses often contain many elements related to culture, with a recommendation stating, “Located within the campus, it is quiet and safe, elegant and artistic”.
Parks particularly emphasize greenery and green space, which is evident. Air quality has garnered attention, likely due to the high-quality air environment in parks, especially with the presence of fragrant plants capturing interest, as evidenced by comments stating, “This season there’s a strong fragrance of osmanthus. It’s pretty suitable for night jogging…”. Vibrancy is emphasized because vibrant parks likely attract more joggers, as observed in comments, “When the weather is nice on weekends, many parents bring their kids over to play. It’s very lively…”. In parks, buildings and service facilities, which are typically of lower concern, received attention. This may be due to the presence of landscape architecture, seating, restrooms, and other amenities within the parks. Vehicles were overlooked, owing to the usual absence of vehicles.
In greenways, scenic beauty, cleanliness, and waterfront spaces are particularly emphasized. This likely stems from the fact that most greenways are constructed along rivers, offering excellent views. This also facilitates easy views of the city skyline and connections to landmark buildings, leading to an increased focus on buildings, “You can see the Central Building, it’s a very good route…”. The quality of the river water may be the reason cleanliness is mentioned, as seen in comments such as “The clean Suzhou River and the lush greenery on both sides create an ecological environment that’s perfect for jogging…”. Greenways frequently feature accompanying service facilities, exemplified by “There are benches and trash cans along the greenway…”. Connectivity receives attention in greenways, possibly because such environments are particularly susceptible to interruption by intersections and other traffic infrastructure. Lighting is not mentioned in greenways, and the reasoning may be similar to that of campuses.
In athletic fields, slope is not a concern because athletic fields provide standard tracks with fixed gradients. Athletic fields rarely offer high-quality scenery and green spaces and lack traffic infrastructure as well as vehicles, so these factors are seldom or not mentioned at all. People in athletic fields pay attention to vibrancy, likely because the abundance of joggers and other athletes contributes to a conducive fitness atmosphere. Cleanliness also receives relatively more attention compared to other types of land use, possibly because people are more concerned about whether the sports venues are managed and maintained in a clean condition.

4.3. Limitations and Future Perspectives

Due to space constraints, some deeper research needs to be continuously conducted. Firstly, this study focuses primarily on subjective evaluations by users, offering a bottom-up reference for decision-makers. This approach results in the identification of environmental elements and perceptions largely stemming from non-professional, everyday vocabulary, potentially overlooking some abstract, professional factors such as living units in the area, the relationship between the ground floor of buildings, and public spaces. Therefore, expert opinions should be incorporated into practical planning and design applications. Secondly, the study’s engagement with a broad range of factors and comparisons between land use types necessitated a generalized analysis of similar factors. For instance, traffic infrastructure encompasses the relationship between the sidewalk and the road, traffic lights, and street crossings. Future research needs to analyze these more specific factors under different land use types, particularly within streets to determine which transportation facilities have significant impacts. Thirdly, this study mainly focuses on whether people pay attention to environmental factors rather than analyzing the correlation between these factors and jogging behavior. This necessitates further research, especially on factors that receive high levels of public attention. Finally, the data utilized is derived from mobile applications, potentially overlooking certain populations such as the elderly who do not use smartphones. Targeted surveys could refine the related results.

5. Conclusions

In summary, the study revealed that land use types including streets, residential areas, campuses, parks, and greenways have the spatial potential to support jogging. Among them, streets can provide the largest total and widest-ranging jogging support services. A mismatch between supply and demand for jogging environments exists on streets in some areas, indicating significant potential for improvement in the environmental quality of jogging support provided by streets. Parks and residential areas in the city center have limited capacity for jogging environments. There is a potential shortage of athletic fields open to the public beyond campuses. The construction of greenways effectively supports jogging, necessitating further development of the existing greenway backbone structure. Regardless of scale or spatial distribution, different land use types possess their own characteristics, providing references for decision-makers to categorize and zone these lands for improvement.
From the perspective of environmental preferences, the study compared the overall variations in attention paid to different environmental factors and revealed the factors that significantly differ in specific land use types compared to others. Slope, soundscape, safety, width, pedestrians, pavement, traffic infrastructure, and lighting facilities were widely considered across all types of land use types. Greenery, scenic beauty, accessibility, lighting, cleanliness, vehicles, green spaces, landscapes, and waterfront spaces received moderate attention but exhibited differences across different land use types. In practice, determining the priority for the improvement of these environmental factors requires consideration of the differences among land use types. Air quality, temperature, connectivity, vibrancy, vertical elements, culture, buildings, and service facilities were less frequently mentioned and only concerned with specific land use types. The prioritization of these factors should be judiciously determined, based on the differences in land use. We have listed factors that significantly differ among each land use type compared to others, facilitating easy querying and reference. This has implications for planning decisions, especially in determining measure priorities in urban built-up areas, and aids researchers in identifying and investigating key environmental indicators relevant to jogging.

Author Contributions

Conceptualization, L.T. and Y.Z.; methodology, L.T. and M.G.; software, L.T.; validation, J.J.; formal analysis, J.J.; resources, L.T. and M.G.; data curation, L.T.; writing—original draft preparation, L.T.; writing—review and editing, Y.Z., M.G. and J.J.; visualization, L.T.; supervision, Y.Z.; project administration, Y.Z.; funding acquisition, L.T. All authors have read and agreed to the published version of the manuscript.

Funding

This research was funded by the National Natural Science Foundation of China, grant number 52208069. China Postdoctoral Science Foundation Funded Project, grant number 2021M702385.

Data Availability Statement

The original datasets in this article are not readily available because the data are part of an ongoing study. Requests to access the datasets should be directed to the corresponding author.

Acknowledgments

I would like to express my sincere gratitude to the National Natural Science Foundation of China (NSFC) and the China Postdoctoral Science Foundation for their generous support, which has been instrumental in the pursuit of my research endeavors. I would also like to extend my appreciation to Minghui Chen from Soochow University, for his invaluable assistance in collecting the recommended route data.

Conflicts of Interest

The authors declare no conflict of interest. The funders had no role in the design of the study; in the collection, analyses, or interpretation of data; in the writing of the manuscript; or in the decision to publish the results.

References

  1. Sun, P.; Zhao, H.; Lu, W. How urban environments affect public sentiment and physical activity using a cognitive computing framework. Front. Archit. Res. 2024, in press. [Google Scholar] [CrossRef]
  2. Feng, J.; Glass, T.A.; Curriero, F.C.; Stewart, W.F.; Schwartz, B.S. The built environment and obesity: A systematic review of the epidemiologic evidence. Health Place 2010, 16, 175–190. [Google Scholar] [CrossRef]
  3. Dorostkar, E.; Najarsadeghi, M. How to evaluate urban emotions using twitter social media? Cities 2022, 127, 103713. [Google Scholar] [CrossRef]
  4. Fisher, J.E.; Andersen, Z.J.; Loft, S.; Pedersen, M. Opportunities and challenges within urban health and sustainable development. Curr. Opin. Environ. Sustain. 2017, 25, 77–83. [Google Scholar] [CrossRef]
  5. Ahvenniemi, H.; Huovila, A.; Pinto-Seppä, I.; Airaksinen, M. What are the differences between sustainable and smart cities? Cities 2017, 60, 234–245. [Google Scholar] [CrossRef]
  6. Kim, J.; de Leeuw, E.; Harris-Roxas, B.; Sainsbury, P. Five urban health research traditions: A meta-narrative review. Soc. Sci. Med. 2023, 336, 116265. [Google Scholar] [CrossRef] [PubMed]
  7. Scheerder, J.; Breedveld, K.; Borgers, J. Running across Europe: The Rise and Size of One of the Largest Sport Markets; Palgrave Macmillan: London, UK, 2015. [Google Scholar]
  8. Latham, A. The history of a habit: Jogging as a palliative to sedentariness in 1960s America. Cult. Geogr. 2015, 22, 103–126. [Google Scholar] [CrossRef] [PubMed]
  9. Wolf, I.D.; Wohlfart, T. Walking, hiking and running in parks: A multidisciplinary assessment of health and well-being benefits. Landsc. Urban Plan. 2014, 130, 89–103. [Google Scholar] [CrossRef]
  10. Lee, D.C.; Brellenthin, A.G.; Thompson, P.D.; Sui, X.M.; Lee, I.M.; Lovie, C.J. Running as a Key Lifestyle Medicine for Longevity. Prog. Cardiovasc. Dis. 2017, 60, 45–55. [Google Scholar] [CrossRef] [PubMed]
  11. Bach, L. Sports without facilities: The use of urban spaces by informal sports. Int. Rev. Sociol. Sport 1993, 28, 281–296. [Google Scholar] [CrossRef]
  12. Lara-Hernandez, J.A.; Melis, A. Understanding the temporary appropriation in relationship to social sustainability. Sustain. Cities Soc. 2018, 39, 366–374. [Google Scholar] [CrossRef]
  13. Cornax-Martin, M.; de Salazar, N.N.G.; Rosa-Jimenez, C.; Luque-Gil, A. Healthy Cities, New Technologies and Sustainability: A Collaborative Mapping of Informal Sport Activity in the Public Space of Cities as an Innovative Tool for Understanding City Sport Phenomena. Sustainability 2020, 12, 20. [Google Scholar] [CrossRef]
  14. Liu, Y.; Li, Y.; Yang, W.; Hu, J. Exploring nonlinear effects of built environment on jogging behavior using random forest. Appl. Geogr. 2023, 156, 102990. [Google Scholar] [CrossRef]
  15. Dong, L.; Jiang, H.; Li, W.; Qiu, B.; Wang, H.; Qiu, W. Assessing impacts of objective features and subjective perceptions of street environment on running amount: A case study of Boston. Landsc. Urban Plan. 2023, 235, 104756. [Google Scholar] [CrossRef]
  16. Yang, W.; Hu, J.; Liu, Y.; Guo, W. Examining the influence of neighborhood and street-level built environment on fitness jogging in Chengdu, China: A massive GPS trajectory data analysis. J. Transp. Geogr. 2023, 108, 103575. [Google Scholar] [CrossRef]
  17. Tian, Z.; Yang, W.; Zhang, T.; Ai, T.; Wang, Y. Characterizing the activity patterns of outdoor jogging using massive multi-aspect trajectory data. Comput. Environ. Urban Syst. 2022, 95, 101804. [Google Scholar] [CrossRef]
  18. Yang, W.; Li, Y.; Liu, Y.; Fan, P.; Yue, W. Environmental factors for outdoor jogging in Beijing: Insights from using explainable spatial machine learning and massive trajectory data. Landsc. Urban Plan. 2024, 243, 104969. [Google Scholar] [CrossRef]
  19. Yang, W.; Fei, J.; Li, Y.; Chen, H.; Liu, Y. Unraveling nonlinear and interaction effects of multilevel built environment features on outdoor jogging with explainable machine learning. Cities 2024, 147, 104813. [Google Scholar] [CrossRef]
  20. Li, X.; Wang, G. Examining runner’s outdoor heat exposure using urban microclimate modeling and GPS trajectory mining. Comput. Environ. Urban Syst. 2021, 89, 101678. [Google Scholar] [CrossRef]
  21. Bunds, K.S.; Casper, J.M.; Hipp, J.A.; Koenigstorfer, J. Recreational walking decisions in urban away-from-home environments: The relevance of air quality, noise, traffic, and the natural environment. Transp. Res. Part F-Traffic Psychol. Behav. 2019, 65, 363–375. [Google Scholar] [CrossRef]
  22. Hodgson, A.; Hitchings, R. Urban air pollution perception through the experience of social practices: Talking about breathing with recreational runners in London. Health Place 2018, 53, 26–33. [Google Scholar] [CrossRef]
  23. Lu, Y. Using Google Street View to investigate the association between street greenery and physical activity. Landsc. Urban Plan. 2019, 191, 103435. [Google Scholar] [CrossRef]
  24. Huang, D.; Jiang, B.; Yuan, L. Analyzing the effects of nature exposure on perceived satisfaction with running routes: An activity path-based measure approach. Urban For. Urban Green. 2022, 68, 127480. [Google Scholar] [CrossRef]
  25. Campbell, M.J.; Dennison, P.E.; Butler, B.W.; Page, W.G. Using crowdsourced fitness tracker data to model the relationship between slope and travel rates. Appl. Geogr. 2019, 106, 93–107. [Google Scholar] [CrossRef]
  26. Liu, Y.; Hu, J.; Yang, W.; Luo, C. Effects of urban park environment on recreational jogging activity based on trajectory data: A case of Chongqing, China. Urban For. Urban Green. 2022, 67, 127443. [Google Scholar] [CrossRef]
  27. Liu, K.; Siu, K.W.M.; Gong, X.Y.; Gao, Y.; Lu, D. Where do networks really work? The effects of the Shenzhen greenway network on supporting physical activities. Landsc. Urban Plan. 2016, 152, 49–58. [Google Scholar] [CrossRef]
  28. Huang, D.; Tian, M.; Yuan, L. Sustainable design of running friendly streets: Environmental exposures predict runnability by Volunteered Geographic Information and multilevel model approaches. Sustain. Cities Soc. 2023, 89, 104336. [Google Scholar] [CrossRef]
  29. Zhang, R.; Wulff, H.; Duan, Y.; Wagner, P. Associations between the physical environment and park-based physical activity: A systematic review. J. Sport Health Sci. 2019, 8, 412–421. [Google Scholar] [CrossRef]
  30. Hunter, R.F.; Christian, H.; Veitch, J.; Astell-Burt, T.; Hipp, J.A.; Schipperijn, J. The impact of interventions to promote physical activity in urban green space: A systematic review and recommendations for future research. Soc. Sci. Med. 2015, 124, 246–256. [Google Scholar] [CrossRef]
  31. Cohen, D.A.; Han, B.; Nagel, C.J.; Harnik, P.; McKenzie, T.L.; Evenson, K.R.; Marsh, T.; Williamson, S.; Vaughan, C.; Katta, S. The First National Study of Neighborhood Parks Implications for Physical Activity. Am. J. Prev. Med. 2016, 51, 419–426. [Google Scholar] [CrossRef]
  32. Boakye, K.A.; Amram, O.; Schuna, J.M.; Duncan, G.E.; Hystad, P. GPS-based built environment measures associated with adult physical activity. Health Place 2021, 70, 102602. [Google Scholar] [CrossRef] [PubMed]
  33. Chen, L.; Zhang, Z.; Long, Y. Association between leisure-time physical activity and the built environment in China: Empirical evidence from an accelerometer and GPS-based fitness app. PLoS ONE 2021, 16, e0260570. [Google Scholar] [CrossRef] [PubMed]
  34. Wang, S.; Scheider, S.; Sporrel, K.; Deutekom, M.; Timmer, J.; Krose, B. What Are Good Situations for Running? A Machine Learning Study Using Mobile and Geographical Data. Front. Public Health 2021, 8, 536370. [Google Scholar] [CrossRef] [PubMed]
  35. Senaratne, H.; Mobasheri, A.; Ali, A.L.; Capineri, C.; Haklay, M. A review of volunteered geographic information quality assessment methods. Int. J. Geogr. Inf. Sci. 2017, 31, 139–167. [Google Scholar] [CrossRef]
  36. Tieskens, K.F.; Van Zanten, B.T.; Schulp, C.J.E.; Verburg, P.H. Aesthetic appreciation of the cultural landscape through social media: An analysis of revealed preference in the Dutch river landscape. Landsc. Urban Plan. 2018, 177, 128–137. [Google Scholar] [CrossRef]
  37. Shanghai Municipal Peoples Government. Shanghai Urban Master Plan (2017–2035). 2018. Available online: https://www.shanghai.gov.cn/nw42806 (accessed on 4 January 2018).
  38. Zhang, Y.; Ong, G.X.; Jin, Z.; Seah, C.M.; Chua, T.S. The effects of urban greenway environment on recreational activities in tropical high-density Singapore: A computer vision approach. Urban For. Urban Green. 2022, 75, 19. [Google Scholar] [CrossRef]
  39. Wu, H.; Wang, L.; Zhang, Z.; Gao, J. Analysis and optimization of 15-minute community life circle based on supply and demand matching: A case study of Shanghai. PLoS ONE 2021, 16, e0256904. [Google Scholar] [CrossRef]
  40. Getis, A.; Ord, J.K. The analysis of spatial association by use of distance statistics. Geogr. Anal. 1992, 24, 189–206. [Google Scholar] [CrossRef]
  41. Anselin, L. Local indicators of spatial association—LISA. Geogr. Anal. 1995, 27, 93–115. [Google Scholar] [CrossRef]
  42. Mitchel, A. Volume 2: Spartial Measurements and Statistics. In ESRI Guide to GIS Analysis; ESRI Press: Redlands, CA, USA, 2005; Volume 2. [Google Scholar]
  43. Silverman, B.W. Density Estimation for Statistics and Data Analysis; Routledge: London, UK, 2018. [Google Scholar]
  44. Li, J.; Gao, J.; Zhang, Z.; Fu, J.; Shao, G.; Zhao, Z.; Yang, P. Insights into citizens’ experiences of cultural ecosystem services in urban green spaces based on social media analytics. Landsc. Urban Plan. 2024, 244, 104999. [Google Scholar] [CrossRef]
  45. Mou, N.; Wang, J.; Zheng, Y.; Zhang, L.; Makkonen, T.; Yang, T.; Niu, J. Flowers as attractions in urban parks: Evidence from social media data. Urban For. Urban Green. 2023, 82, 127874. [Google Scholar] [CrossRef]
  46. Sun, J. Jieba Chinese Text Segmentation, Tech. Rep.+ Version 0.42.1. 2020. Available online: https://github.com (accessed on 15 February 2020).
  47. Roper, E.A. Concerns for personal safety among female recreational runners. Women Sport Phys. Act. J. 2016, 24, 91–98. [Google Scholar] [CrossRef]
  48. Deelen, I.; Janssen, M.; Vos, S.; Kamphuis, C.B.M.; Ettema, D. Attractive running environments for all? A cross-sectional study on physical environmental characteristics and runners’ motives and attitudes, in relation to the experience of the running environment. BMC Public Health 2019, 19, 366. [Google Scholar] [CrossRef] [PubMed]
  49. Amorim, T.C.; Azevedo, M.R.; Hallal, P.C. Physical Activity Levels According to Physical and Social Environmental Factors in a Sample of Adults Living in South Brazil. J. Phys. Act. Health 2010, 7, S204–S212. [Google Scholar] [CrossRef] [PubMed]
  50. Huang, Y.; Eom, S.; Suzuki, T. Selecting jogging routes considering joggers’ preference: Evidence from downtown tokyo. J. Transp. Health 2021, 22, 101161. [Google Scholar] [CrossRef]
  51. Han, K.-T. The effect of environmental factors and physical activity on emotions and attention while walking and jogging. J. Leis. Res. 2021, 52, 619–641. [Google Scholar] [CrossRef]
  52. Fylan, F.; King, M.; Brough, D.; Black, A.A.; King, N.; Bentley, L.A.; Wood, J.M. Increasing conspicuity on night-time roads: Perspectives from cyclists and runners. Transp. Res. Part F-Traffic Psychol. Behav. 2020, 68, 161–170. [Google Scholar] [CrossRef]
  53. Ettema, D. Runnable cities: How does the running environment influence perceived attractiveness, restorativeness, and running frequency? Environ. Behav. 2016, 48, 1127–1147. [Google Scholar] [CrossRef]
  54. Alawadhi, E.M. Thermal comfort analyses on jogging trails: The effect of trail direction and tree shading on trial surface and physiological equivalent temperatures. J. Therm. Biol. 2022, 110, 103358. [Google Scholar] [CrossRef]
  55. Shashank, A.; Schuurman, N.; Copley, R.; Lear, S. Creation of a rough runnability index using an affordance-based framework. Environ. Plan. B Urban Anal. City Sci. 2022, 49, 321–334. [Google Scholar] [CrossRef]
  56. Schuurman, N.; Rosenkrantz, L.; Lear, S.A. Environmental Preferences and Concerns of Recreational Road Runners. Int. J. Environ. Res. Public Health 2021, 18, 6268. [Google Scholar] [CrossRef]
  57. Wang, Y.; Wong, Y.D. Repositioning urban heritage for active mobility: Indications from news coverage in Singapore. Cities 2020, 98, 102525. [Google Scholar] [CrossRef]
  58. Bodin, M.; Hartig, T. Does the outdoor environment matter for psychological restoration gained through running? Psychol. Sport Exerc. 2003, 4, 141–153. [Google Scholar] [CrossRef]
  59. Normark, D. Recreational mobility on a busy street: Visual studies of alterity by doing jogging and doing dog-walking. Mobilities 2023, 18, 756–772. [Google Scholar] [CrossRef]
  60. He, D.; Lu, Y.; Xie, B.; Helbich, M. How greenway exposure reduces body weight: A natural experiment in China. Landsc. Urban Plan. 2022, 226, 104502. [Google Scholar] [CrossRef]
  61. Xie, B.; Lu, Y.; Zheng, Y. Casual evaluation of the effects of a large-scale greenway intervention on physical and mental health: A natural experimental study in China. Urban For. Urban Green. 2022, 67, 127419. [Google Scholar] [CrossRef]
  62. Gascon, M.; Zijlema, W.; Vert, C.; White, M.P.; Nieuwenhuijsen, M.J. Outdoor blue spaces, human health and well-being: A systematic review of quantitative studies. Int. J. Hyg. Environ. Health 2017, 220, 1207–1221. [Google Scholar] [CrossRef] [PubMed]
  63. Ma, X.; Chau, C.K.; Lai, J.H.K. Critical factors influencing the comfort evaluation for recreational walking in urban street environments. Cities 2021, 116, 103286. [Google Scholar] [CrossRef]
  64. Zhong, Q.; Li, B.; Chen, Y. How Do Different Urban Footpath Environments Affect the Jogging Preferences of Residents of Different Genders? Empirical Research Based on Trajectory Data. Int. J. Environ. Res. Public Health 2022, 19, 14372. [Google Scholar] [CrossRef] [PubMed]
Figure 1. Research framework.
Buildings 14 00851 g001
Figure 2. Overview of the research area and recommended route data.
Buildings 14 00851 g002
Figure 3. Buffer area in different land use types.
Buildings 14 00851 g003
Figure 4. Results of the LISA index.
Buildings 14 00851 g004
Figure 5. Line density analysis results.
Buildings 14 00851 g005
Figure 6. Sankey diagram between environmental perception and land use types.
Buildings 14 00851 g006
Figure 7. Sankey diagram between environmental elements and land use types.
Buildings 14 00851 g007
Table 1. Basis for land use classification.
Land Use TypesClassification Basis
Description in Recommended Reason TextRoute NameGeographic Location of the Route
streetstreetnamed after xxx roadoccupies no less than 50% on streets
residential areacommunity roadsnamed after xxx communityoccupies no less than 50% in residential areas
campuscampus roadsnamed after xxx university/high school/elementary schooloccupies no less than 50% on campuses
parkpark roadsnamed after xxx parkoccupies no less than 50% in parks
greenwaygreenways, waterfront paths, riverside walkwaysnamed after xxx greenwaylocated along rivers or green belts (not along carriageways) occupying no less than 50%
athletic fieldathletic fieldnamed after xxx athletic fieldoccupies no less than 50% on athletic field
Table 2. 25 factors and their corresponding words.
GroupFactorWords List Example 1
Environmental Perceptionsafetysafe, secure, dangerous, protected, stable, unsafe
vibrancybustling, deserted, lively, crowded, sparsely populated
cleanlinessclean, tidy, orderly, sanitary, immaculate, unblemished
slopeuneven, bumpy, gentle, flat, level, slope, ramp, gentle slope, etc.
widthnarrow, open, empty, wide, spacious, broad, expansive, wide, etc.
accessibilityconvenient, easy, handy, accessible, practical
connectivityimpassable, smooth, unimpeded, continuous, unhindered, etc.
air qualitystinky, fragrant, fresh, smelly, foul, malodorous
scenic beautypicturesque, scenic, beautiful, wonderful, pretty, elegant, etc.
greeneryluxuriant, tree-shaded, greenery, thriving, etc.
lightingdark, very bright, dim, bright, etc.
soundscapequiet, noisy, silent, tranquil, peaceful, secluded, serene, etc.
temperaturecool, shady, hot, warm, etc.
Environmental Elementsvehiclesvehicles, car, motor vehicle, non-motor vehicle, automobile, bicycle, electric vehicle, train, airplane, electric bike, etc.
pedestrianspedestrian, pedestrian flow, crowd, people, crowd, passerby, etc.
traffic infrastructuretraffic light, intersection, crossroad, street, road condition, parking lot, subway station, etc.
landscapelandscape, view, scenery, scenic spot, beautiful view, line of sight, view, etc.
green spacepark, green space, garden, forest, expo garden, garden, botanical garden, etc.
waterfront spaceriver, riverside, bay, water, river, beach, lake, hydrology, both banks, etc.
service facilitiestoilet, station, seat, street sign, etc.
lighting facilitieslight, streetlight, lighting, illumination, night view, lamp, etc.
pavementplastic, road surface, ground, asphalt, track, tar, cement, rubber, etc.
culturehistory, culture, local customs, art, heritage, etc.
buildingsbuilding, architecture, skyscraper, architecture, construction, etc.
vertical elementsstages, ramp, terrain, mountain road, steps, slope, etc.
1 These words were originally in Chinese and have been translated for the convenience of readers.
Table 3. The descriptive statistics results of scale differences.
Land UseStreet RouteResidential Area RouteCampus RoutePark RouteGreenway RouteAthletic Field Route
number of routes63494381566276
average JF per route (times/day)3.412.574.587.509.7816.97
total JF (times/day)2163.13241.97174.111170.61606.661289.50
average length of single route (km)2.410.871.371.172.370.39
total length (km)1524.7981.6451.96182.74147.0129.77
Table 4. Spatial autocorrelation detection results.
Land UseGlobal Moran’s IAverage Nearest Neighbor
Moran’s IzpResultzpResult
street0.1410966.121290Clustered−12.380Clustered
residential area0.0232020.5416730.588044Random−4.310.000017Clustered
campus−0.13178−0.927550.35364Random−2.590.009548Clustered
park−0.013416−0.02110.983167Random−4.910.000001Clustered
greenway−0.019852−0.018990.98485Random−4.690.000003Clustered
athletic field−0.157119−0.288650.772846Random−4.220.000025Clustered
Disclaimer/Publisher’s Note: The statements, opinions and data contained in all publications are solely those of the individual author(s) and contributor(s) and not of MDPI and/or the editor(s). MDPI and/or the editor(s) disclaim responsibility for any injury to people or property resulting from any ideas, methods, instructions or products referred to in the content.

