Article

Indoor Air Quality Measurements in Enclosed Spaces Combining Activities with Different Intensity and Environmental Conditions

by
Oskar Urbina-Garcia
1,
Unai Fernandez-Gamiz
1,*,
Ekaitz Zulueta
2,
Ainara Ugarte-Anero
1 and
Koldo Portal-Porras
1
1
Nuclear Engineering and Fluid Mechanics Department, University of the Basque Country, UPV/EHU, Nieves Cano 12, 01006 Vitoria-Gasteiz, Araba, Spain
2
System Engineering and Automation Control Department, University of the Basque Country, UPV/EHU, Nieves Cano 12, 01006 Vitoria-Gasteiz, Araba, Spain
*
Author to whom correspondence should be addressed.
Buildings 2024, 14(4), 1007; https://doi.org/10.3390/buildings14041007
Submission received: 4 February 2024 / Revised: 9 March 2024 / Accepted: 29 March 2024 / Published: 5 April 2024
(This article belongs to the Section Building Energy, Physics, Environment, and Systems)

Abstract

:
The impact of the COVID-19 pandemic has caused an increase in knowledge in certain fields such as human breathing and respiratory diseases. In the current study, enclosed-space characteristics were assessed due to the great debate generated because of the pandemic. Temperature, relative humidity, carbon dioxide (CO2) concentration, particulate matter (PM) concentration and cumulative particle concentration percentage per size fraction were measured in three buildings under the occurrence of activities with different intensity levels. For the measurements, Arduino UNO, Sensiron SCD30 and APS-3321 devices were used. Natural ventilation was controlled via windows and/or doors, and the influence of air conditioning was studied in one of these rooms, in which medium- to high-intensity activities were conducted. All experiments revealed a decrease in temperature associated with an increase in the relative humidity when CO2 decreased. As a consequence, drastic decreases occurred a few minutes after windows and doors were opened. In no-ventilation intervals, the observed linear increase changed into an asymptotic trend below the 1000 ppm limit recommended by Sinphonie guidelines. Additionally, the opposite behavior was observed between particles above and below a certain size. This experiment is of interest to further investigate critical ventilation rate versus volume of air per individual.

1. Introduction

Three years of uncertainty due to the COVID-19 pandemic resulted in problems ranging from global economic issues to severe damage to the health of individuals [1]. To combat this virus, several vaccines were produced by pharmaceutical companies. In studies on the development of an effective and safe vaccine against the virus, protein S was considered the best antigen to be included [2]. The virus mutated as expected after variant B.1.1.7 was detected in England and variant B.1.617.2 identified in India exhibited a different behavior to vaccines [3]. Once variant B1.1.529 emerged, concerns regarding the effectiveness of available vaccines and antibody-based therapeutics were raised [4,5,6]. At the same time, quarantine measures, restrictions on transport of individuals, interpersonal distancing and mask use were proven to be the most effective measures to prevent SARS-CoV-2 transmission [7]. In addition, other measures must be monitored while allowing interaction in enclosed spaces under restrictive conditions, i.e., carbon dioxide (CO2) measurement and ventilation [7,8]. The reduction in the transmission risk in indoor classrooms at schools due to effective CO2 concentration monitoring and taking ventilation actions was explained [8]. To this must be added, as the results of the research of Shao et al. [9], that a reliable design of the ventilation system reduces the risk of particle accumulation; conversely, an unfortunate design creates an environment where the concentration of infection is high. Taking the design of the ventilation system as an important parameter, William et al. [10] concludes that between Conventional Overhead Distribution (COHD) and Underfloor Air Distribution (UFAD), the latter catches better aerosols, thus reducing the risk of transmission. Looking to the future, Song et al. [11] works on a study on the development of custom ventilation in each space and the control of CO2 concentration. Additionally, the analysis of the risk of infection by transmission of the virus in the air has been studied [12,13,14,15]. SARS-CoV-2 transmission can occur via airborne transmission, respiratory aerosol droplets and direct–indirect contact processes between two individuals [16]. However, the main source of transmission involves aerosols or airborne transmission, as demonstrated by Zhang et al. [17]. Regarding the risk of SARS-CoV-2 transmission, enclosed spaces or environments suppose a higher risk, for example, crowded residential buildings, public transport vehicles, entertainment venues and shopping malls [18]. To avoid a high transmission risk in an enclosed environment, it is crucial to implement an efficient ventilation system [19]. This is even more important in environments where many people gather for long periods, i.e., working in an office. An excessively high concentration of particulate matter (PM) is usually considered to indicate poor-quality air. Nevertheless, regarding to the quality of indoor air, another critical component that must be reduced via ventilation is CO2. Enclosed spaces such as classrooms, which are typically full of people, poorly ventilated and overheated, tend to intensify this effect. This could lead to a scenario where the carbon dioxide concentration could adversely affect the health of individuals, e.g., a concentration exceeding 1500 ppm or a level lower than 1000 ppm, according to Schools Indoor Pollution and Health Observatory Network in Europe (Sinphonie) guidelines [20]. Indoor concentrations of carbon dioxide play an important role when examining indoor air quality (IAQ) and ventilation [21]. The relevance of the measures of CO2 concentration reduction, ventilation control and IAQ standards resides in their association with bio-effluents and odors in enclosed spaces and the ventilation-per-individual ratio level. Indoor and outdoor correlations between CO2 and PM2.5 ratios were further assessed, thereby correlating measured data with classroom occupancy and ventilation rates [22]. In addition to that, the Energy performance of buildings—Ventilation for buildings EN16798-1 [23] is recognized as a well-known standard for PM2.5 and PM10 concentration limits regarding indoor air quality, e.g., considering 25 μg/m3 as a limit for both particle matter diameters for acceptable IAQ that should be taken into account when assessing and designing indoor spaces.
In order to maintain proper indoor air quality levels in a classroom under certain parameters, simple actions such as preventing overcrowding, employing suitable ventilation rates and installing ventilation systems including air cleaners were highly recommended [24]. The authors recommended prioritizing the use of air purifiers and air conditioners according to filter systems. Whenever possible, annual monitoring of indoor PM and random concentrations could be a good strategy [25]. In addition, more feasible measurements were proposed to gain better IAQ conditions. For instance, equipment producing volatile organic compounds (VOCs) or particles should be located outside, and the classroom temperature should be maintained within the target range with the aid of thermostats. Dinh et al. [26] observed the relevance of CO2 as an indicator to be measured with the intention of controlling the indoor air quality and measuring the ventilation efficiency. By controlling ventilation in enclosed environments and monitoring CO2 levels, individuals could prevent becoming ill, particularly considering respiratory viral transmission. CO2 dioxide concentration is a key parameter because the content in exhaled air can be correlated with the risk of infection and the probability of transmission through the Wells–Riley equation [27]. Particles in general, and carbon dioxide molecules in particular, are denser than air. However, in terms of transport via air flow, they exhibit the same capability as that of virus particles. Therefore, CO2 concentrations above a certain level suggest inadequate ventilation, and actions must be taken. The displacement ventilation strategy was proposed by Bhagat et al. [28] as the most efficient approach to reduce the risk of exposure to infection. Once displacement ventilation is well designed, this could aid vertical stratification and mitigate the accumulation of heated and polluted air close to the ceiling. In addition, the use of masks is another action that can produce a drastic decrease in the amount of ejected or exhaled droplets and, therefore, also the number of bioaerosols in air. Furthermore, they suggested preventing mixed ventilation since this could provoke air distribution throughout the enclosed space and diminish clean areas. The feasibility of this ventilation strategy in classrooms with a heat recovery pump was examined by Wang et al. [29]. As a result, the indoor air quality was improved, and a reduction in the energy consumption of the school was noted. Simulation was performed via a computational fluid dynamics software to technically prove the feasibility of this strategy. Li et al. [30] used an innovative ventilator that replaced part of a window frame with a ventilator containing a crossflow fan at the core. Many other issues causing poor ventilation were considered by Dominguez-Amarillo et al. [31]. Buildings with low radiant temperatures as a consequence of their thermal envelopes provide a limited performance. This could adversely impact individuals, which could result in forced ventilation reduction, creating even riskier conditions under confinement during the pandemic, in cold climates and during longer periods of time. Satish et al. [32] observed that ventilation limitation sometimes aimed to only reduce the consumption of energy, leading to low and ineffective ventilation rates. Rumchev et al. [33] studied locations with a high rate of poverty and concluded that a higher risk of respiratory diseases could mainly be attributed to the lack of minimum ventilation equipment, even chimneys and occasionally windows.
The aim of this study is to investigate indoor air quality in enclosed spaces. Three scenarios are presented: First, a classroom with and without students involved in low-intensity activities was considered, denoted as measurements 1 and 2. Secondly, a library with a children’s area, meeting room and conference room were used for data acquisition, considering this a medium-intensity scenario, denoted as measurements 3, 4 and 5. Finally, the third scenario included sports facilities with high-intensity activities, denoted as measurements 6 and 7. In each experiment or measurement, the concentration of CO2, relative humidity, temperature, particle size, particle matter (PM2.5, PM10 and PM20) and the percentage of accumulated particle mass concentration were monitored and captured to achieve a comprehensive study. In addition, the analysis of the risk of infection from airborne virus transmission was also included as an empirical study. Lastly, recommendations for building design and conclusions are given in order to lower the risk of infection and maintain an adequate IAQ for enclosed spaces.

2. Materials and Methods

The experimental measurements presented in this article encompassed a total of seven events monitored at three locations in Vitoria-Gasteiz city between 15 December 2021 and 28 December 2021. The first two measurements occurred at the University of the Basque. Three measurements were realized at the Ignacio Aldecoa public library. Data for the last two measurements were acquired in the Mendizorroza sports facilities. Regarding the measurements inside enclosed spaces, data acquisition was performed with an aerodynamic particle sizer spectrometer (APS-3321) and two Arduino boards connected to two Sensiron SCD30 sensors, all of which were connected via USB to a laptop for data collection. Outside weather conditions were extracted from the public and freely accessible webpage of EUSKALMET considering the closest station to the measurement locations, and the same station was used for three of the measurements located on the university campus of the Faculty of Pharmacy.

2.1. Measurement Definition

The duration of the experiments depended on the duration of the ongoing activities, extra time was added before the experiments and once equipment setup was finalized, and a “back to calm” interval was considered after the experiments. The duration of all experiments ranged from 1 h 57 min to 2 h 22 min. The ventilation method in all the experiments was natural ventilation by opening doors and/or windows. The last two experiments were performed in the Mendizorroza sports facilities with air conditioning. Regarding people, all the experiments were conducted in the same way. The enclosed spaces were empty at the starting point, and people entered the spaces for a certain activity and left after they were finished. The activity intensity levels were low in measurements 1, 2, 4 and 5 since all people attended a lecture or meeting in a sitting and relaxed position. Measurement 3 involved the low- to medium-intensity activity of singing toward the end. Medium-intensity gym activities occurred in the sixth experiment as people engaged in exercise, and high-intensity aerobic activities combined with exercise were observed in the seventh experiment. The experiments were all conducted with participants wearing surgical or clinical masks the entire time, except for the third experiment, in which several children did not wear masks at all. Table 1 presents a summary of the measurement conditions, and Table 2 lists the physical and natural ventilation characteristics of the enclosed spaces; in both tables, Vent. denotes ventilation. Measurements 1 and 2 were performed with the same individuals, students in a 20–22 age range. For measurement 3, there were 14 children in a 6–10 years range and 26 adults in a 30–45 range. Measurements 4 and 5 involved individuals of more than 65 years old, and measurements 6 and 7 involved individuals in a broader age range, from 18 to 55.
The list of measurements in chronological order of performance is as follows:
  • University Classroom A206–Scenario 1: During class with students.
  • University Classroom A206–Scenario 2: Quasi-empty class.
  • Ignacio Aldecoa Library—Children’s area.
  • Ignacio Aldecoa Library—Assembly Hall
  • Ignacio Aldecoa Library—Conference Room.
  • Mendizorroza sports facilities—Training Room
  • Mendizorroza sports facilities—Spinning Room
For a more detailed view of the enclosed spaces, please refer to the 2D drawings included in the Supplementary Material of the current article. Table 3 presents the outside weather conditions during the experiments collected by the Basque meteorology service, EUSKALMET, from the nearest weather station located on the university campus of the Faculty of Pharmacy. Extended data including outdoor environment conditions can also be found in the Supplementary Material.

2.2. Instrumentation and Methodology

Two Sensiron SCD30 sensors (Sensirion AG, Stäfa, Switzerland) were used for data collection of the CO2 concentration in the air using NDIR technology, relative humidity and temperature. Each of these sensors, hereafter referred to as Sensor 1 (S1) and Sensor 2 (S2), provides the same measurement ability. The CO2 sensor mounted on these devices exhibits an error of ± (30 ppm + %3 MV), and the measurement value ranges from 400 ppm to 10,000 ppm. Between 0 °C and +50 °C, the installed temperature sensor exhibits an error of ± (0.4 °C + 0.023 × (T [°C] − 25 °C)), and the measurement value ranges from −40 °C to +70 °C. The associated humidity sensor exhibits an error of ±3% RH at 25 °C, and the measurement value ranges from 0% to 100%. Regarding the environmental conditions, the carbon dioxide sensor exhibits a limited operating range, varying between 0 °C and +50 °C for the temperature and below +95% for the humidity. The SCD30 sensors were calibrated using the SparkFun SCD30 library with default parameters and following the instructions found in the datasheet provided by the fabricant. Each SCD30 sensor was connected to an Arduino UNO R3 board. Data were transferred from the sensor to the Arduino board following the I2C protocol, as shown in Figure 1, where the purple cable is the Vin cable, orange is the GND cable, green is the SCL cable, and blue is the SDA cable. The Arduino program was used with the SparkFun library, specifically conceived for the SCD30 sensor.
Each Arduino board was connected via USB to the laptop. Data were transferred from the Arduino board to the computer every 6 s via the serial port. The transferred data was processed on a laptop in the MATLAB 9.13 R2022b environment.
An aerodynamic particle sizer (APS) spectrometer was used to measure the aerosol microparticle size distribution inside the classroom. The device (model APS-3321; TSI, Shoreview, MN, USA) uses the technique whereby time-of-flight values of individual particles are measured in an accelerating flow field with a single, high-speed timing processor. Coincidence detection was achieved using a patented, double-crest optical system, and particle size binning was based on an internally stored calibration curve. The particle size ranged from 0.5 to 20 µm regarding the aerodynamic size and 0.37 to 20 µm in regard to optical detection.
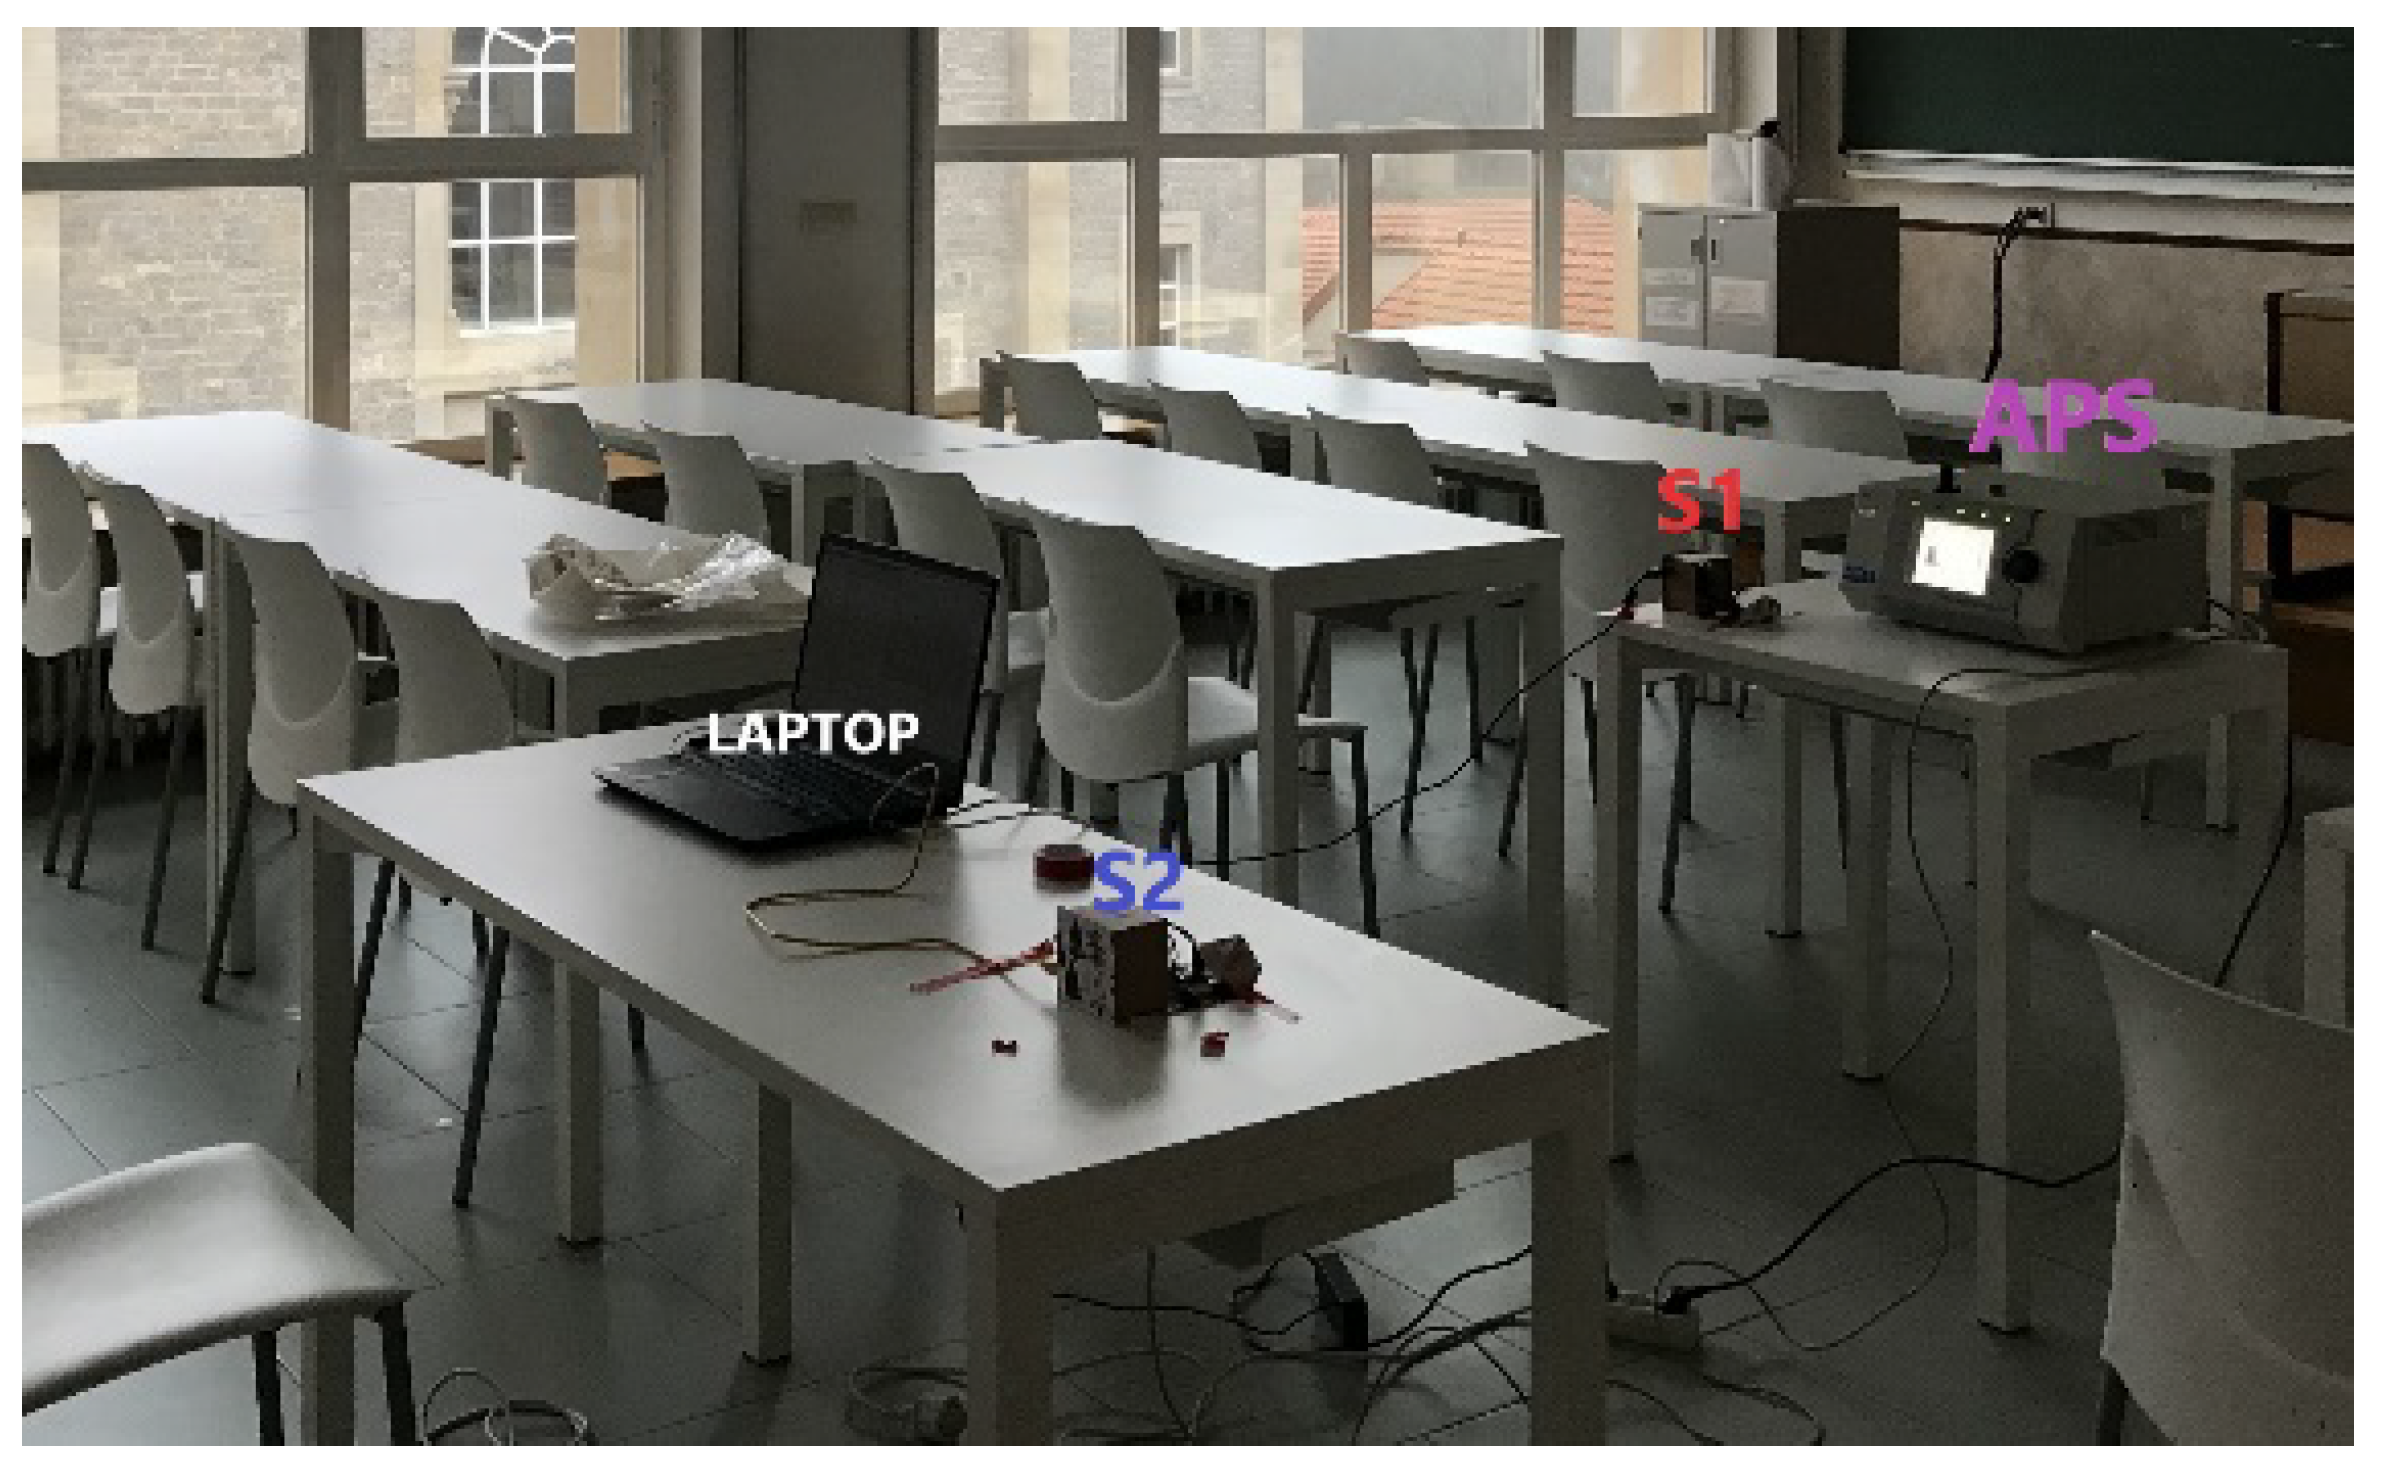
The APS was successfully used by Aramendia et al. [34] for measuring nebulized particle size distributions, providing high-resolution measurements for droplets between 0.5 and 20 µm. Pfeifer et al. [35] noted that the sizing error rarely exceeded 10%. Chen et al. [36] described the mathematical models used in AIM 12.1 software (TSI Incorporated) to calculate the quantity of suctioned particles and their size. The spectrometer was also connected via USB to the laptop, and collected data were acquired, analyzed and stored on the laptop along with data measured by the SCD30 sensors. A typical layout of the setup is shown in Figure 2. AIM software was also adjusted to collect data every 6 s. Data were assessed for PM2.5, referred to as fine particles, i.e., particles with a diameter smaller than 2.5 µm, which are related to health issues. Nevertheless, PM10 and PM20, which are more notably associated with contaminants suspended in the atmosphere, were studied.

2.3. Measurement Repeateability Limitations

In order to repeat the measurements performed, it should be taken into account the information presented in this article and in the Supplementary Information files, where there is graphic description of the spaces, volume, areas, dimensions and location of windows, doors and instruments on them. It must be mentioned that outside air and weather conditions repeatability could be important for the results, but it has been kept out of the current study as they are highly difficult to obtain. However, due to a major impact of the indoor conditions, it is considered to be enough for a starting point of repeatability and comparison from future researchers.

3. Results

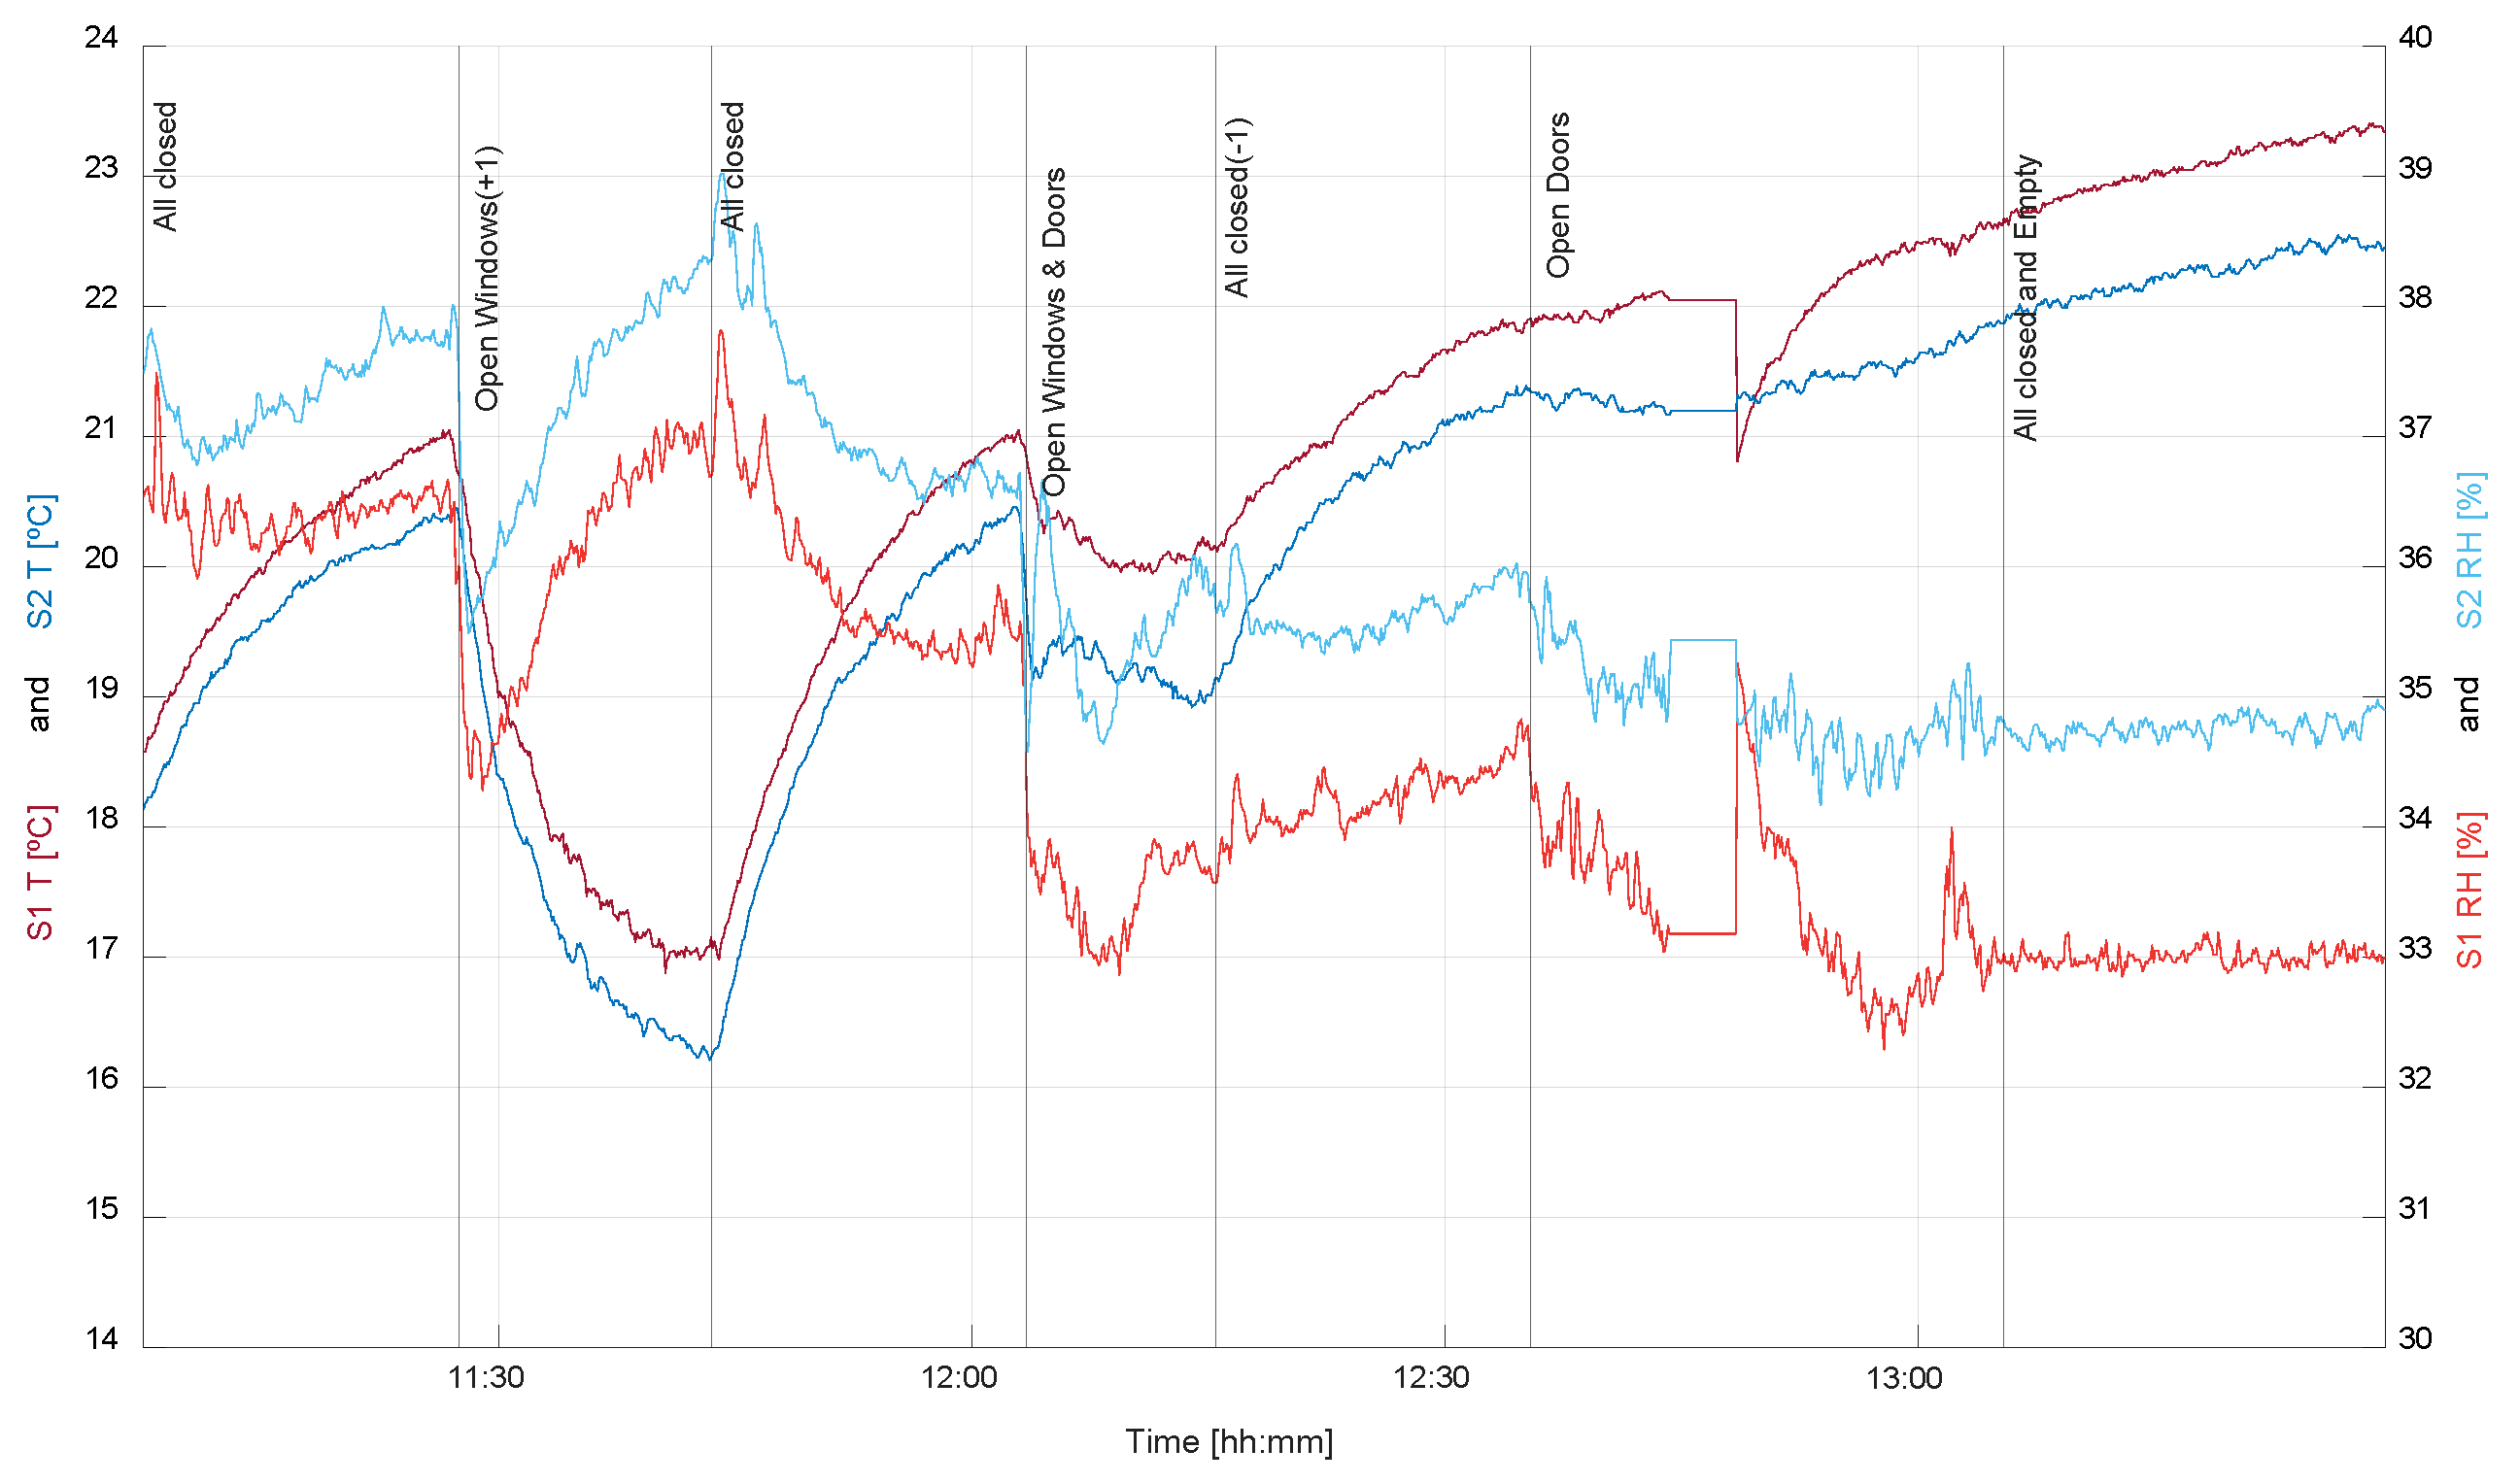
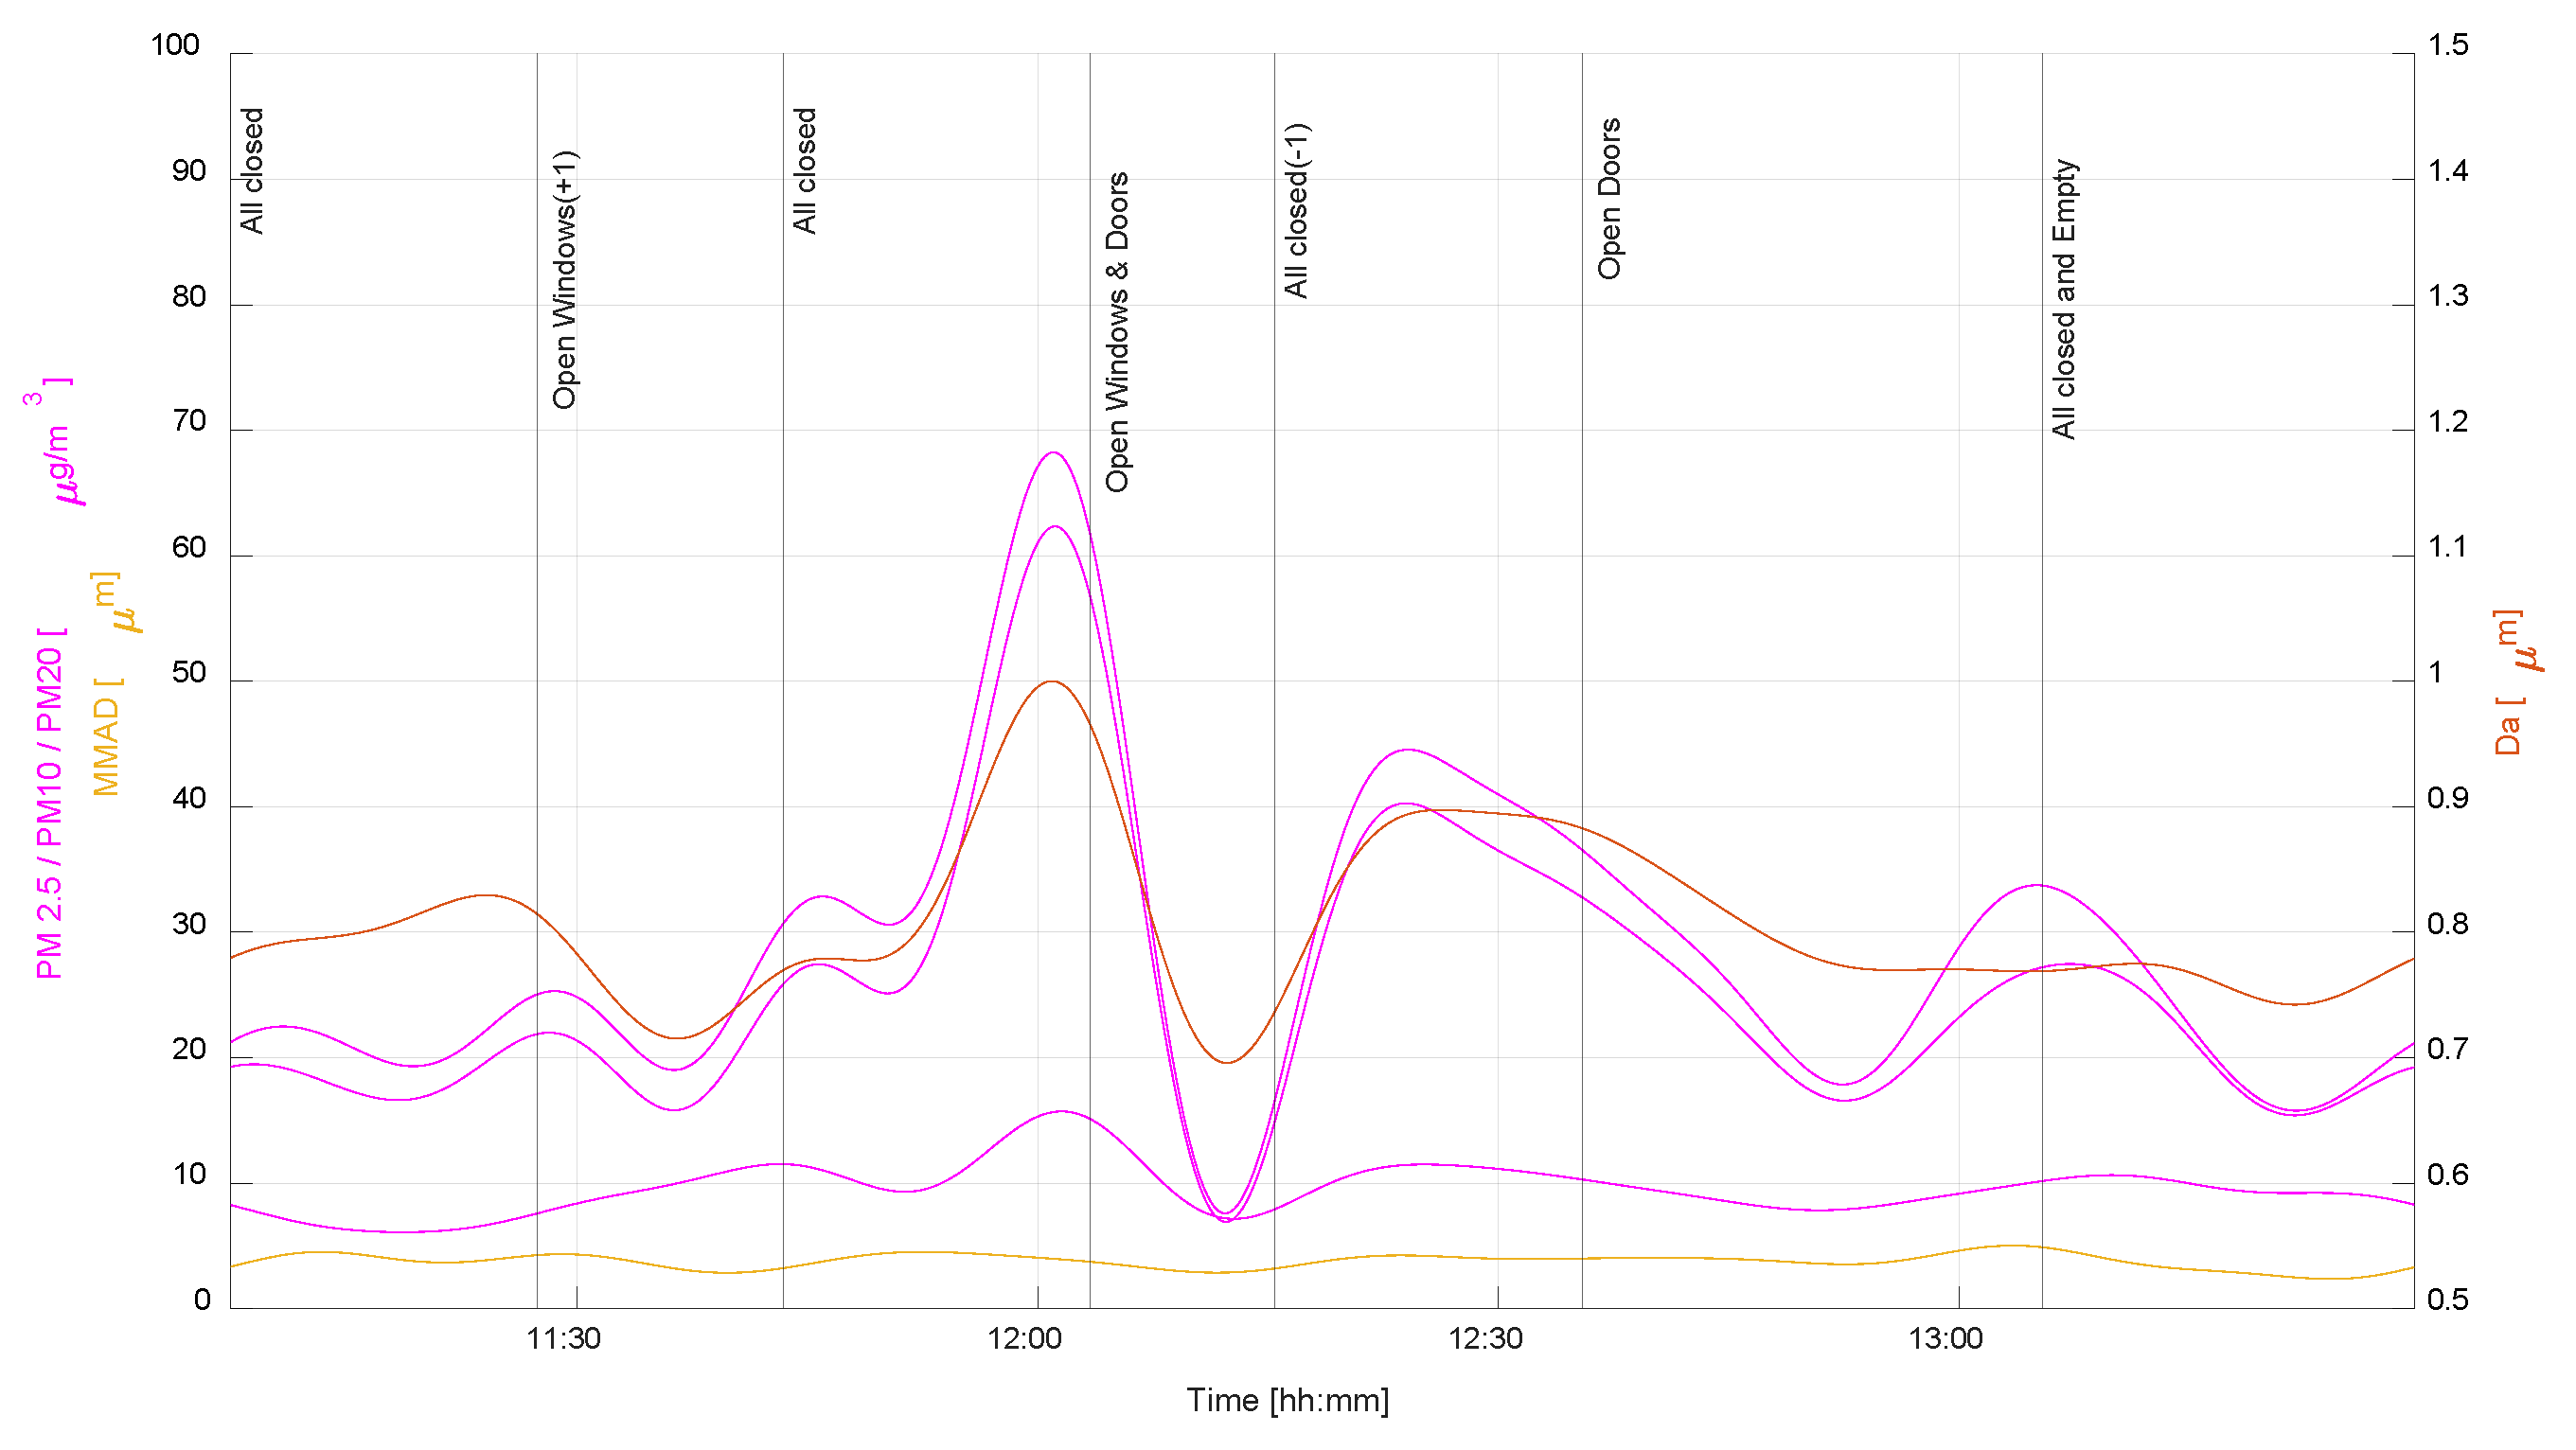
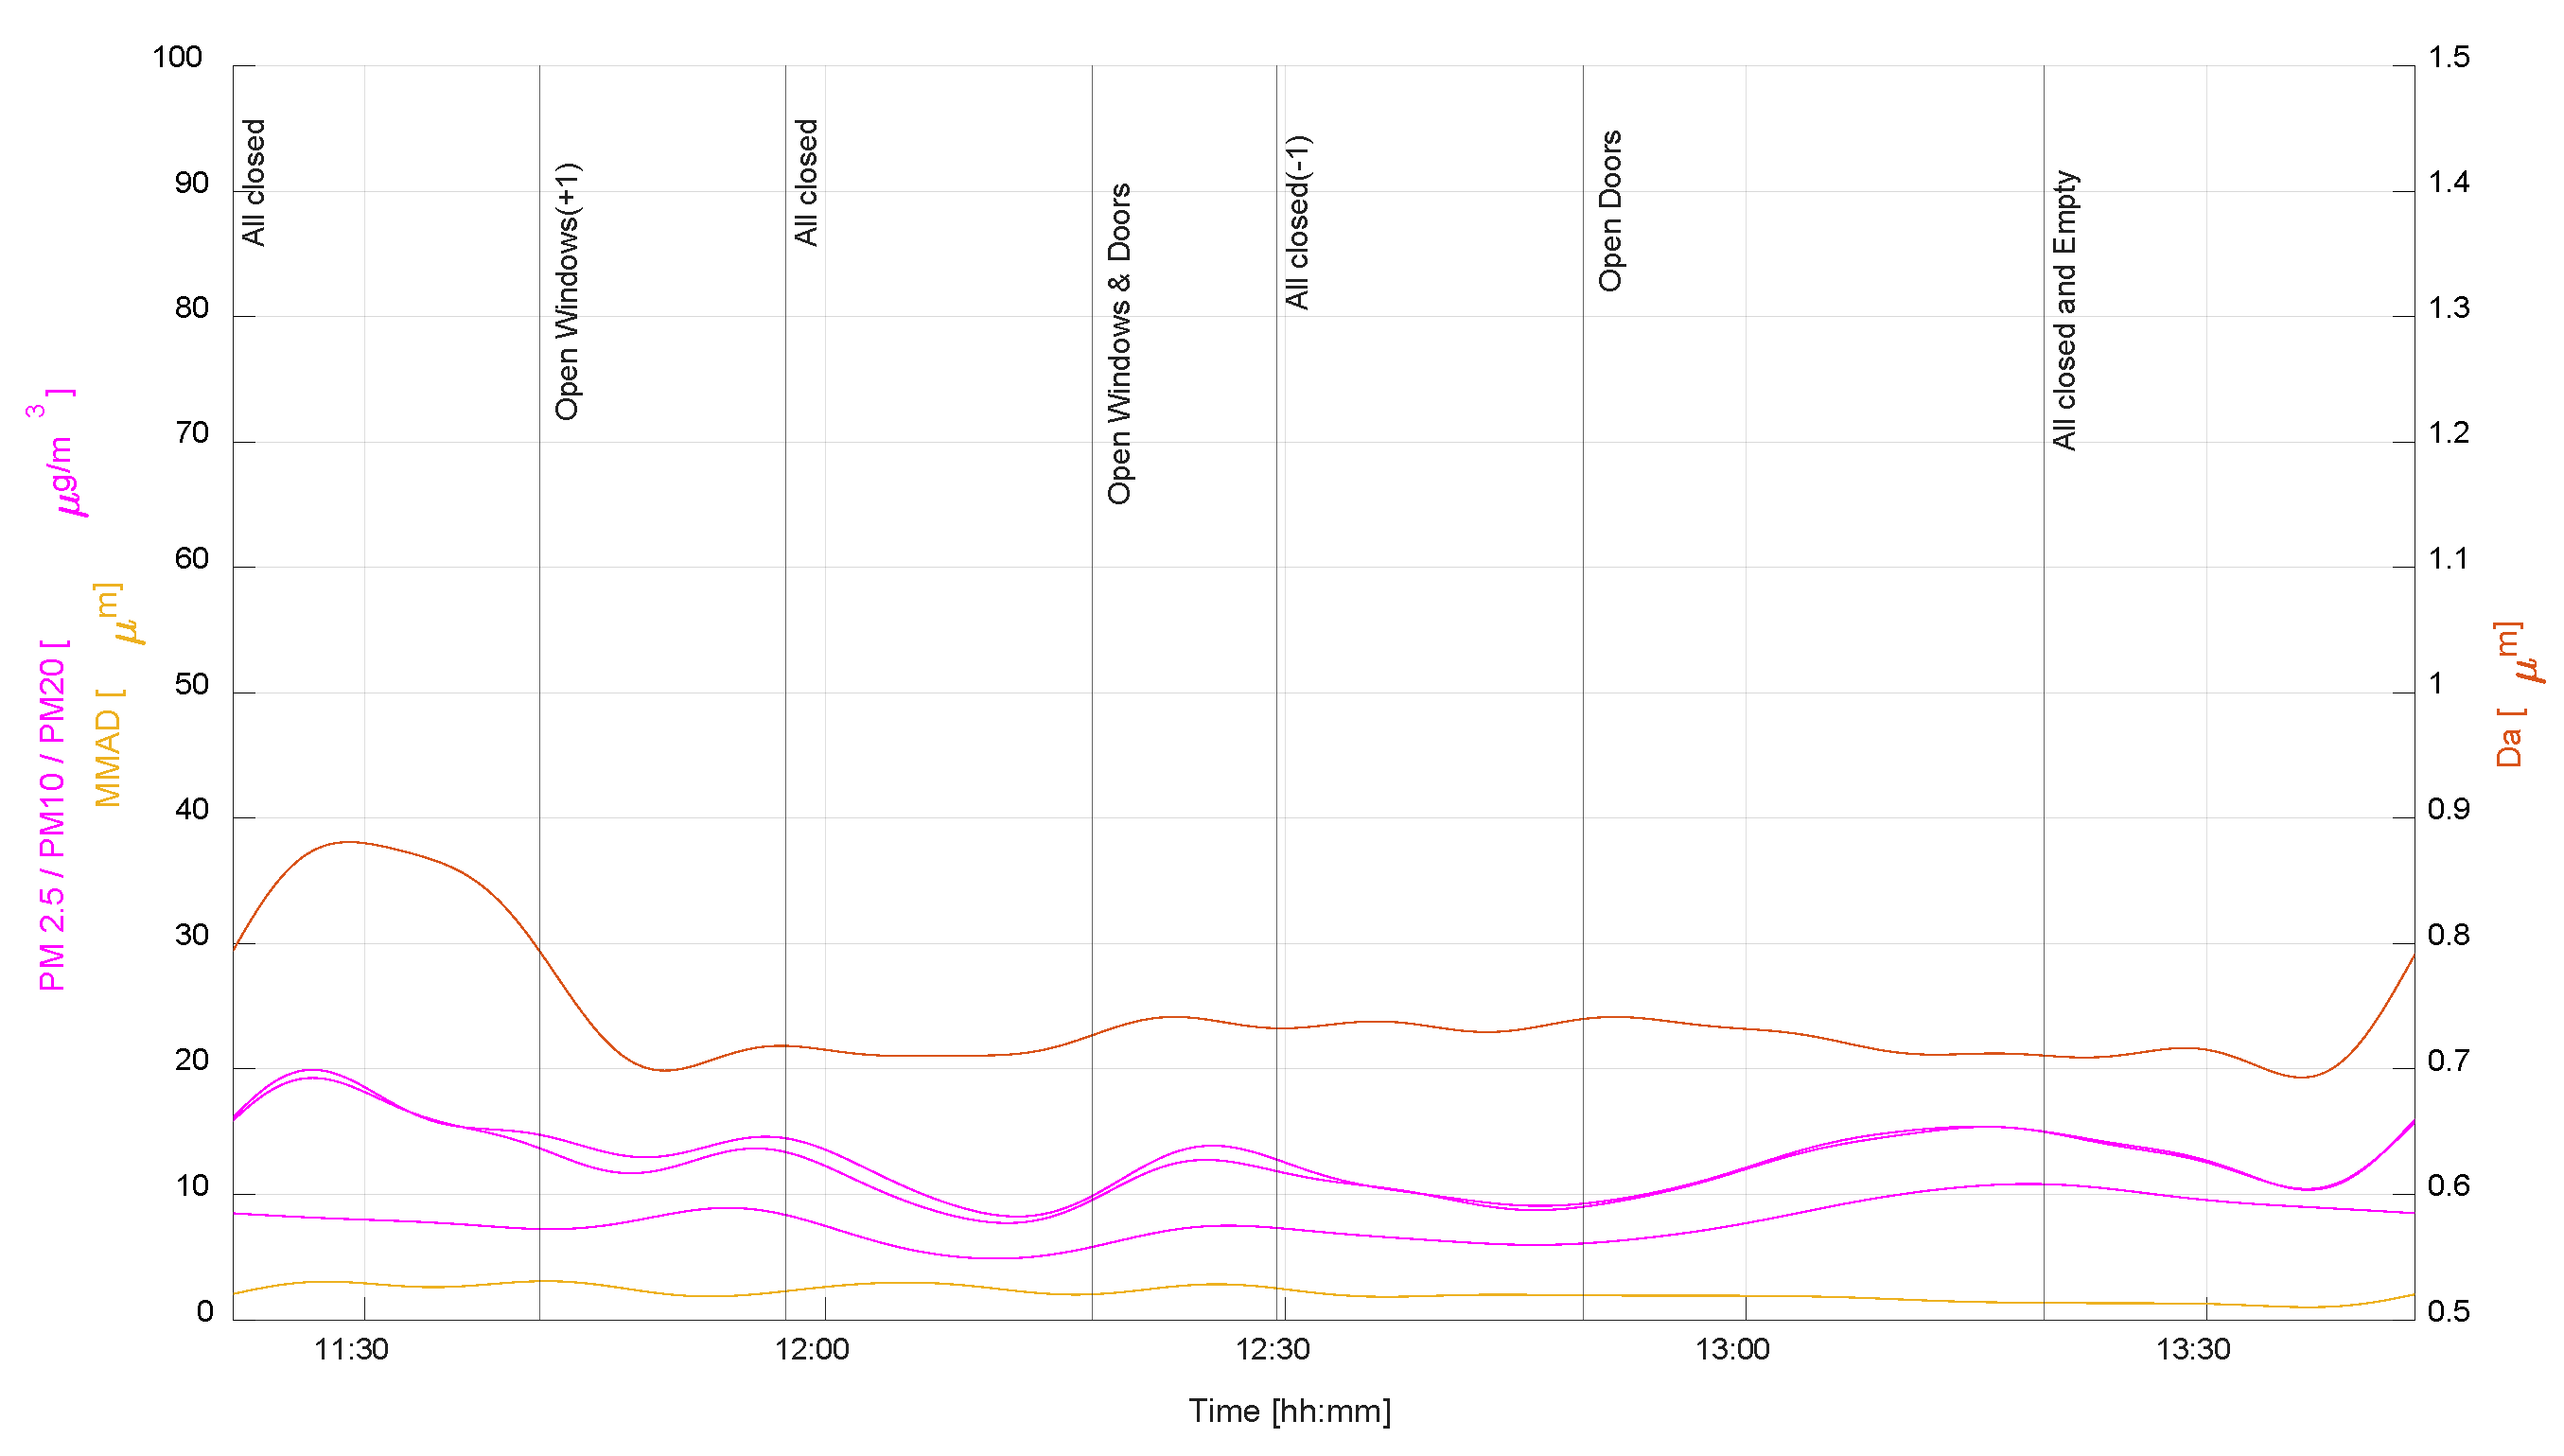
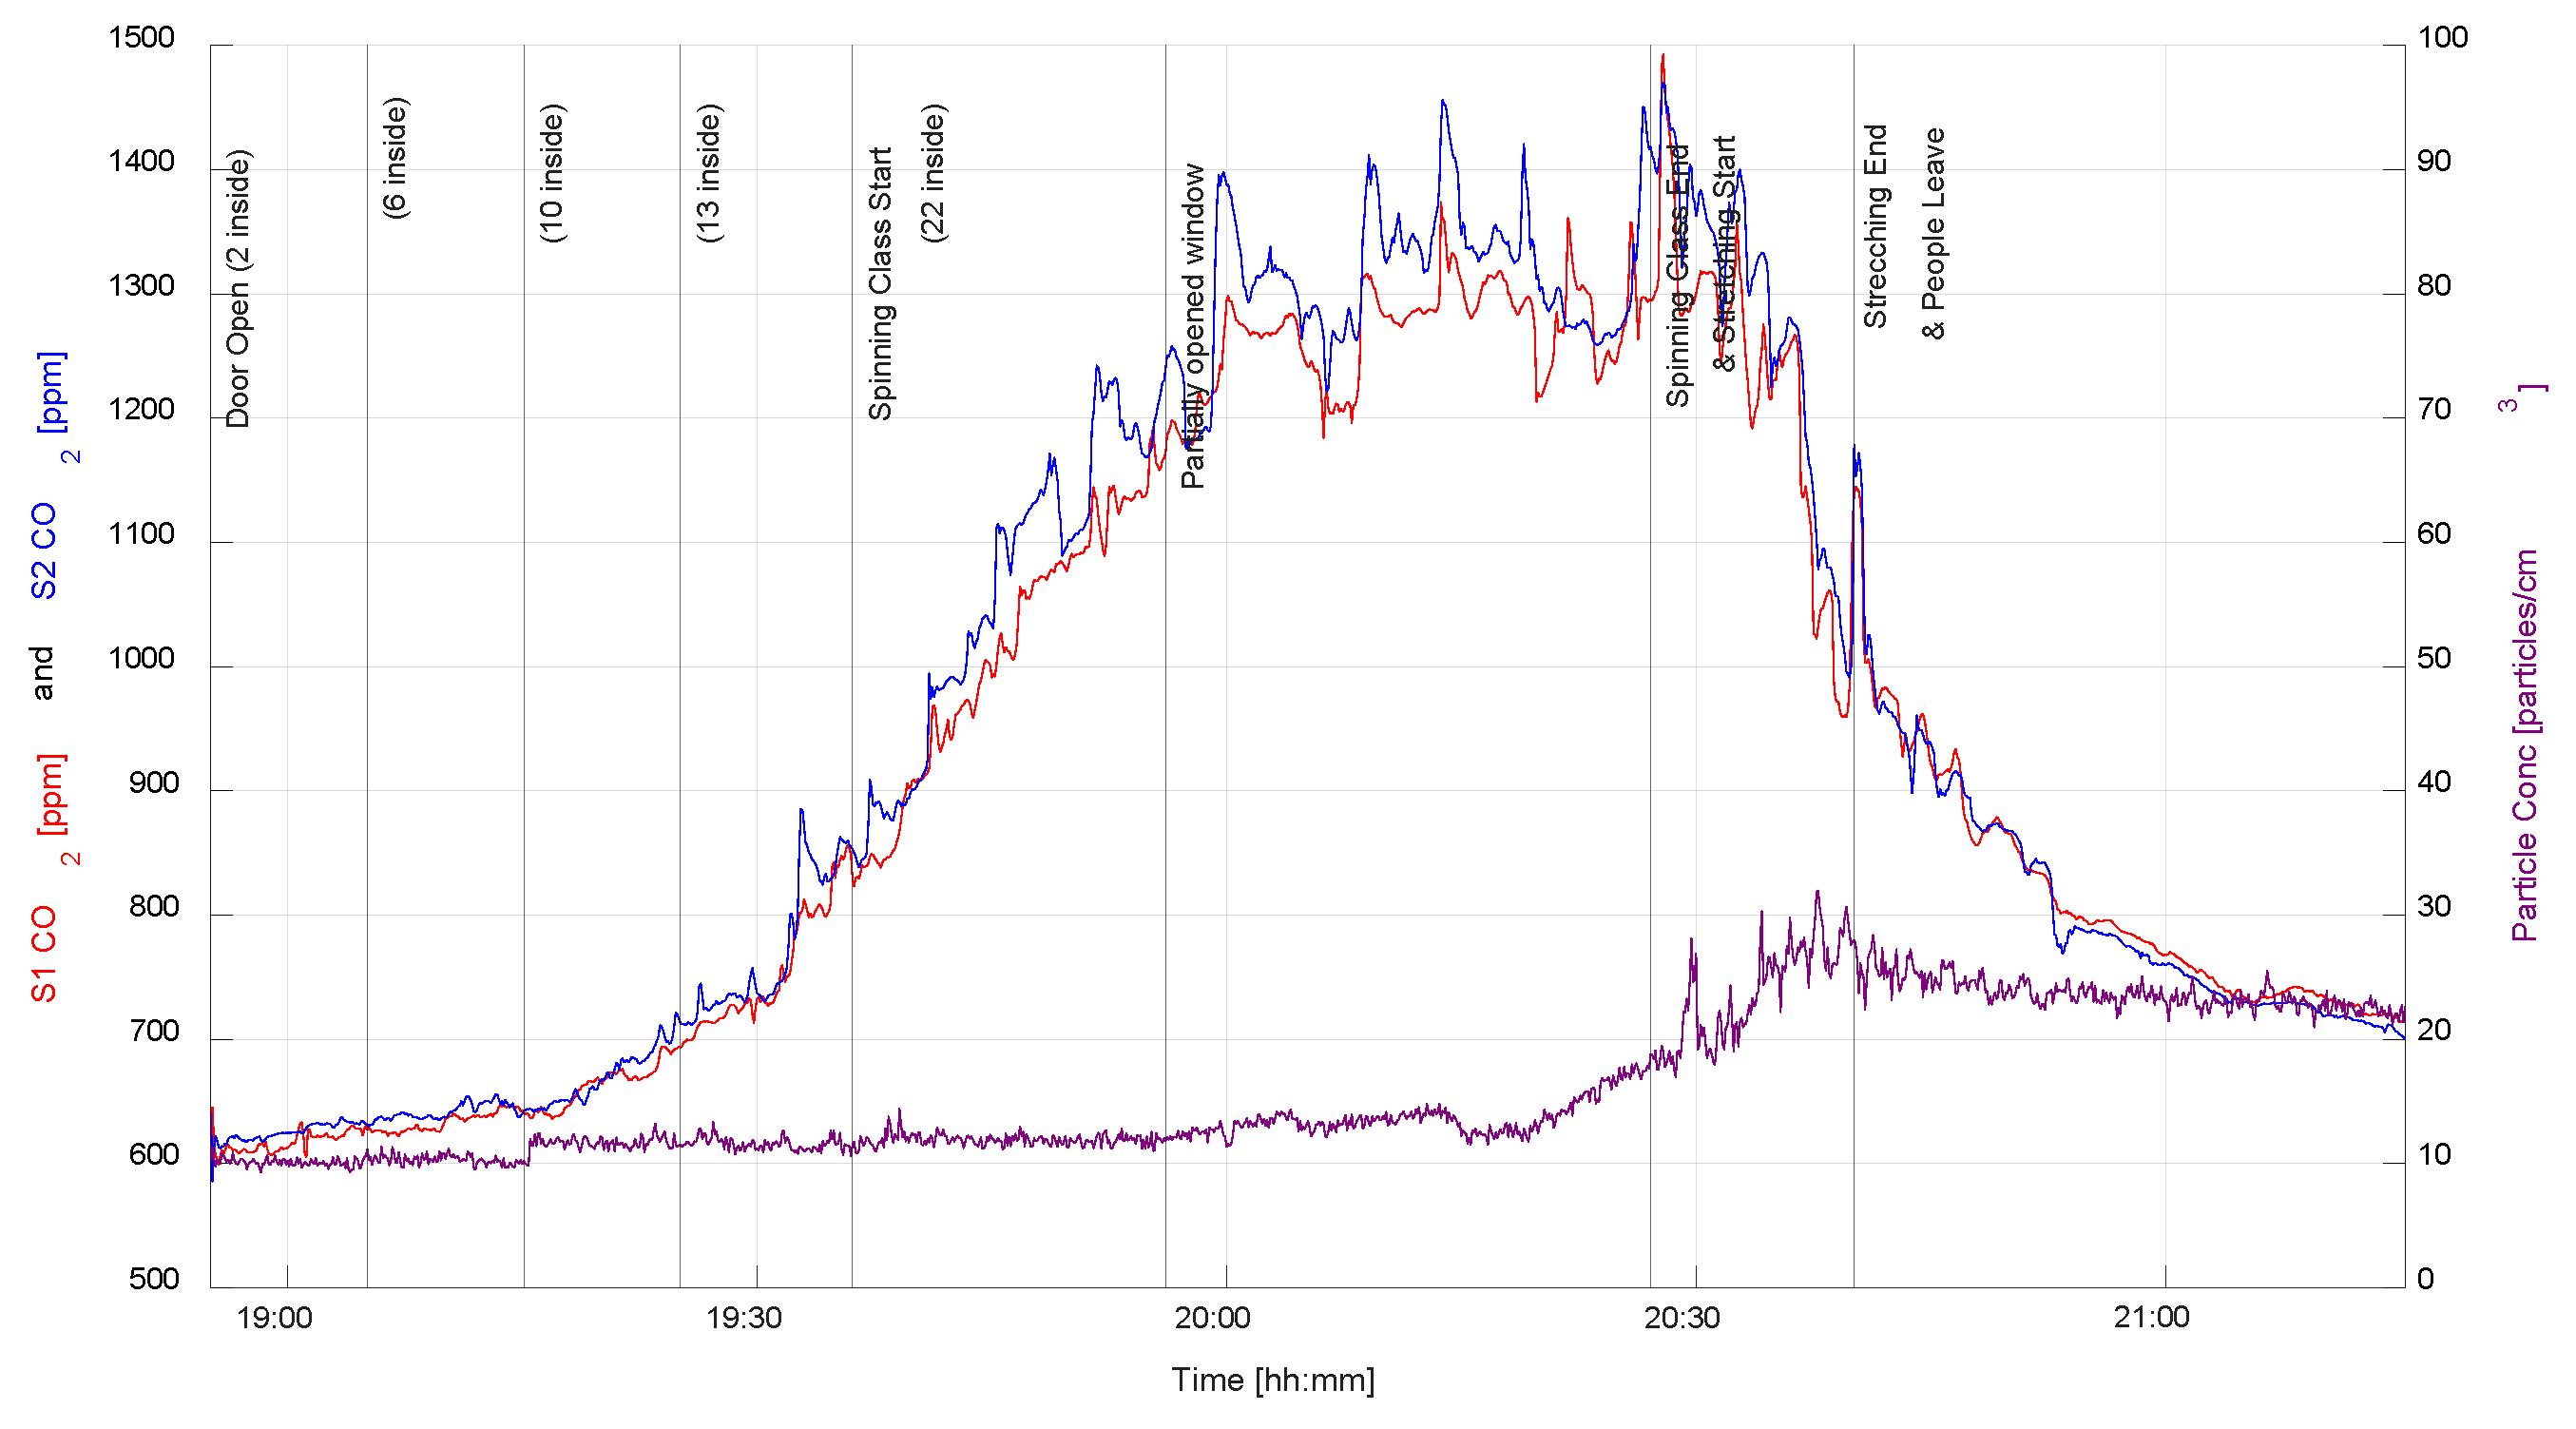
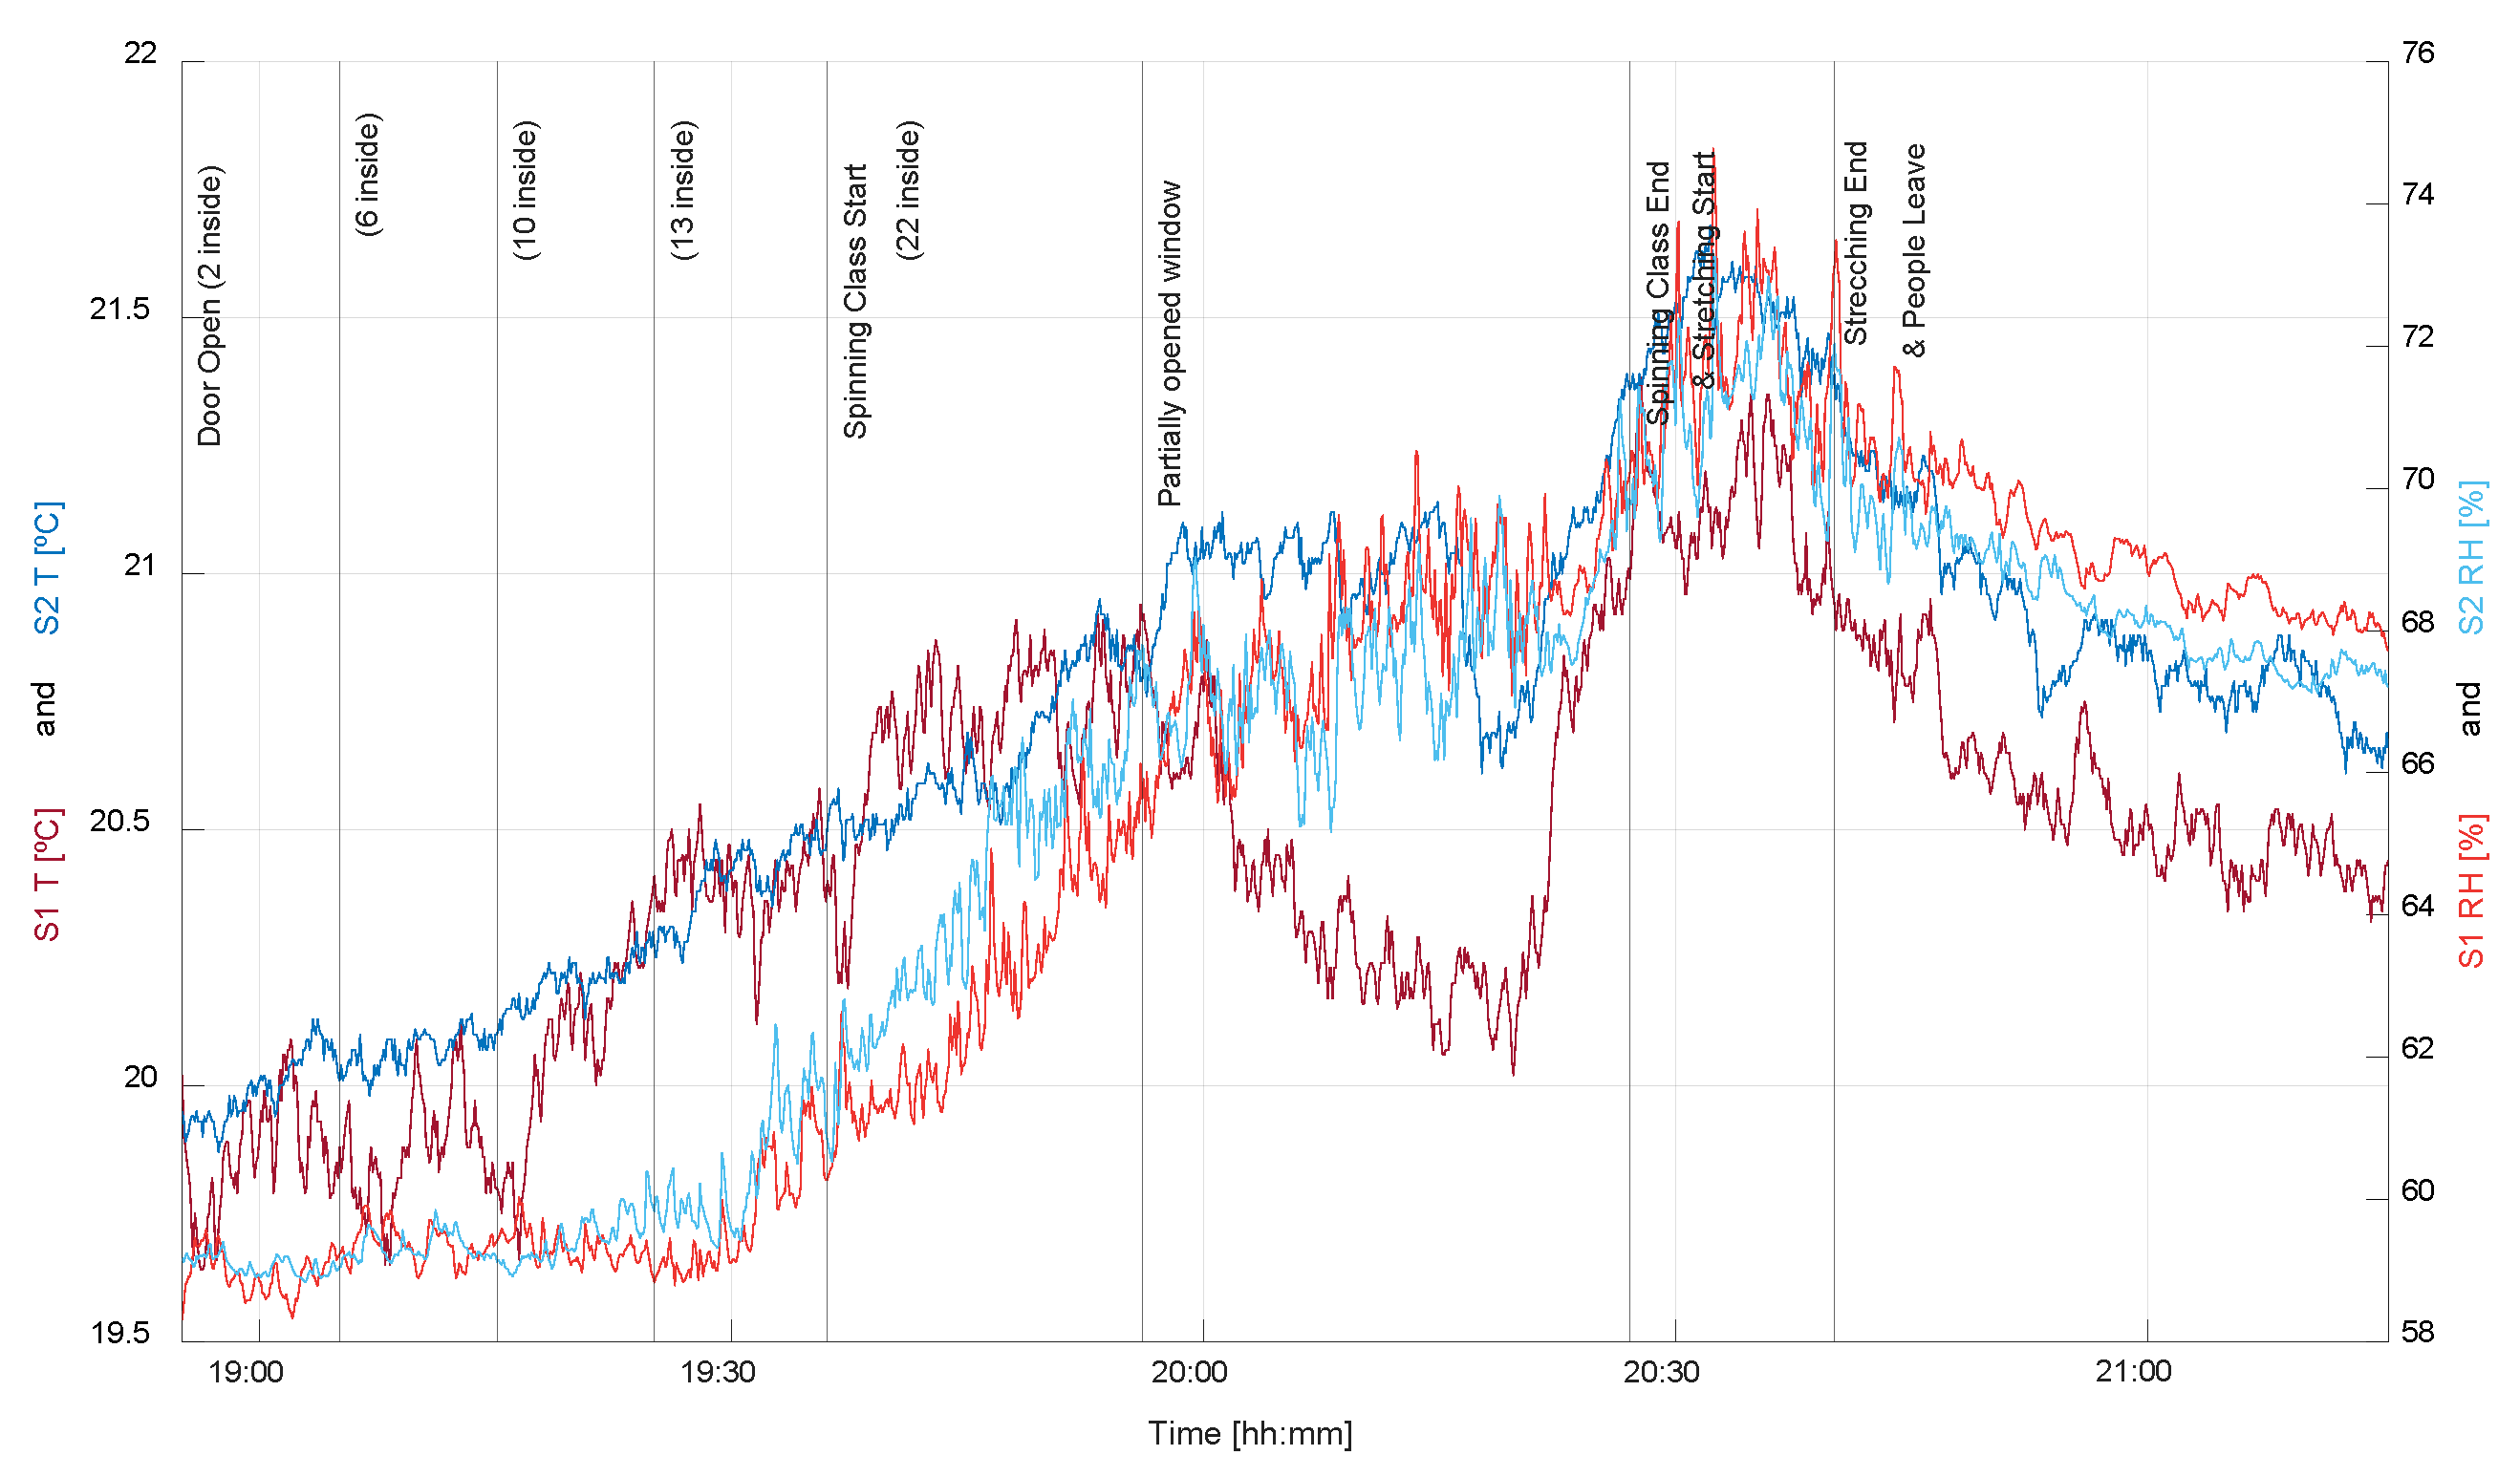
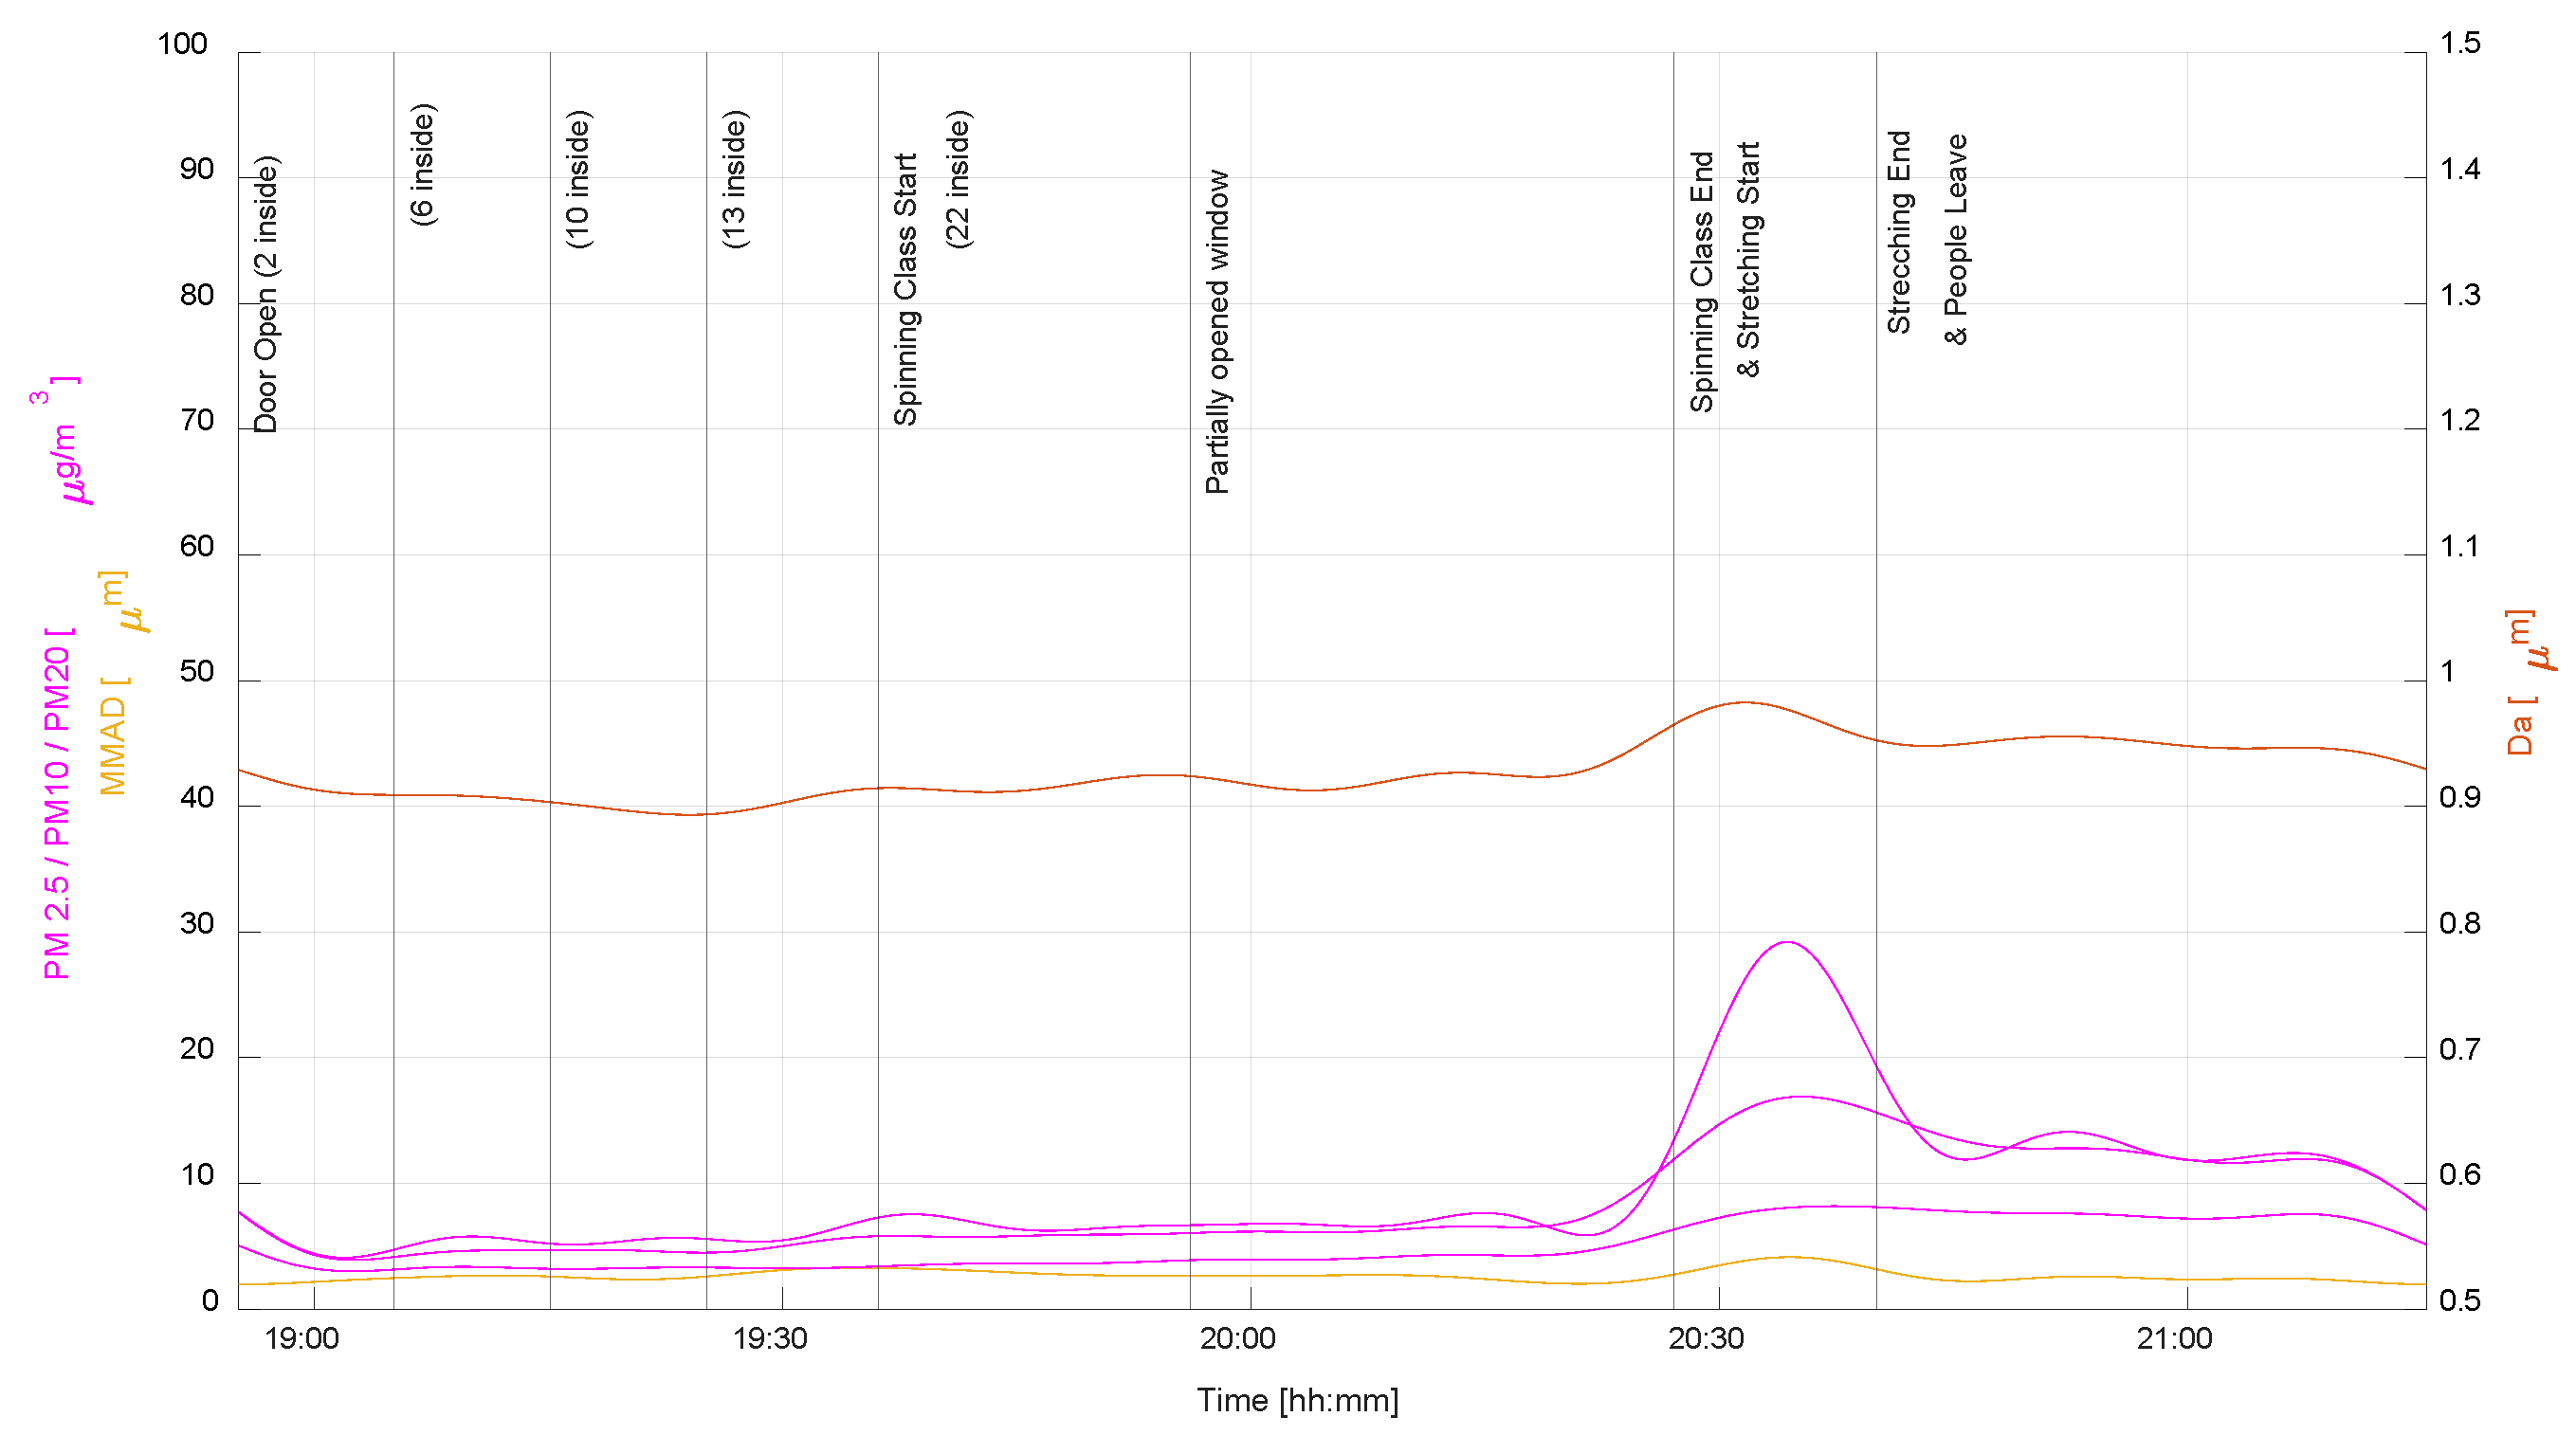
For each measurement described in Section 2, three figures are presented in the following subsections of the current section. First, Figure 3, Figure 6, Figure 9, Figure 12, Figure 15, Figure 18 and Figure 21 show the CO2 concentration (CO2C) in particles per million (ppm) and particle number concentration (PNC) in the number of particles per cubic centimeter (particles/cm3). Second, Figure 4, Figure 7, Figure 10, Figure 13, Figure 16, Figure 19 and Figure 22 show the temperature (T) in degrees Celsius (°C) and relative humidity (RH) as a percentage (%). Then, Figure 5, Figure 8, Figure 11, Figure 14, Figure 17, Figure 20 and Figure 23 show the particle mass concentration or particulate matter (PM) concentration under three particle sizes in micrometers, including PM2.5 (smaller than 2.5 µm), PM10 (smaller than 10 µm) and PM20 (smaller than 20 µm; the maximum size detected by the APS), all in micrograms per cubic meter (µg/m3). The same table presents the aerodynamic diameter (Da), which is the mean value of the aerodynamic diameter (µm) of the particles measured in the sample. Additionally, the mass median aerodynamic diameter (MMAD) is presented, which is the aerodynamic diameter size (µm) that divides the sample distribution mass in half. Note that Parseval’s theorem was considered to avoid losing effects of interest from the captured data. Fourier transform was performed to eliminate high-frequency signal noise. Note that, where not specified, the presented T, RH and CO2 data are related to the S1 sensor closest to the APS.

3.1. University Classroom—Scenario 1: During Class with Students

Figure 3 shows the carbon dioxide and particle number concentrations inside the classroom. Before starting the measurement, a 15 min ventilation process was performed with people inside the classroom. As soon as the measurement was started, all windows and doors were closed, and the carbon dioxide concentration increased from 700 ppm to above 1000 ppm within 20 min, which is the maximum level recommended by Sinphonie guidelines, and it could reach up to 1027 ppm. In addition, the PNC value decreased from 44 particles/cm3 to 34 particles/cm3. Then, one more alumnus entered the room, and windows were opened during the following 16 min, raising the PNC value to 88 particles/cm3 while air was renewed, and CO2C decreased to 625 ppm. Once again, all windows and doors were closed for 20 min, and the carbon dioxide level increased to 969 ppm, while PNC decreased to 47 particles/cm3. At this time, all windows and doors were opened. Approximately 5 min after this, the PNC value reached its maximum of 81 particles/cm3, then decreased to 60 particles/cm3 after 7 min. Moreover, CO2C reached its minimum value of 683 ppm 5 min after all windows and doors were opened, and then it remained stable until all windows and doors were again closed after 7 min. Just before closing, the already mentioned alumni left the room. Again, during the subsequent 20 min intervals at the all-closed stage, CO2C increased to 1000 ppm, while PNC decreased to 50 particles/cm3. After this interval, only the doors were opened until the end of the class. During this 30 min interval, the carbon dioxide level gradually decreased to 847 ppm and then increased to a 961 ppm peak, finally declining to the 910 ppm level, which might be due to people passing through the hall. Note that there was a 5 min lack of captured data due to disconnection of the sensors, after which they were reinitiated. However, PNC only increased at this stage, finally reaching 80 particles/cm3. To finish the measurement, a back-to-calm stage was performed, and for 25 min after the class had ended, the measurement continued at the all-closed stage with the room empty. In this interval, both PNC and CO2C slightly and slowly decreased. The first parameter peaked at 868 ppm, while the second parameter reached a peak of 68 particles/cm3.
Figure 4 shows the T and RH inside the classroom. As soon as the measurement started, all windows and doors were closed, and T increased within 20 min from 18.5 °C to 21 °C. Moreover, RH remained almost stable at approximately 36%. Then, one more alumnus entered the room, and the windows were opened during the following 16 min. At first, RH decreased to 34.5% and then increased to 37%. Moreover, T decreased to 17 °C. Thereafter, and once again, all windows and doors were closed for 20 min, and T increased to 21 °C, while RH decreased to 35.5%. At this time, all windows and doors were opened. Approximately 5 min afterwards, RH reached its minimum of 33%, then increased to 34% after 7 min. In addition, T reached its minimum value of 20 °C approximately 5 min after all windows and doors were opened, and then it remained stable until all windows and doors were again closed after 7 min. This effect is due to the heating of the building, specifically of the hall area. Just before closing, the already mentioned alumni left the room. Again, within another 20 min interval at the all-closed stage, T increased to 22 °C, while RH slightly increased to almost 35%. After this interval, only the doors were opened until the end of the class. During this 30 min interval, RH gradually decreased to 33% at the end of the stage, with a peak of 35.3% after 15 min. In contrast, T increased to 22.5 °C at the end of the stage, with a valley of 20.8 °C after 15 min. This alteration in values was not considered in the analysis since this might be due to the 5 min disconnection period of the sensors and reinitiation stabilization time. Nevertheless, to finish the measurement, the back-to-calm stage was implemented, and for 25 min after the class ended, the measurement continued at the all-closed stage with the room empty. In this interval, T continued to increase to 23.4 °C, and RH remained completely stable at 33%.
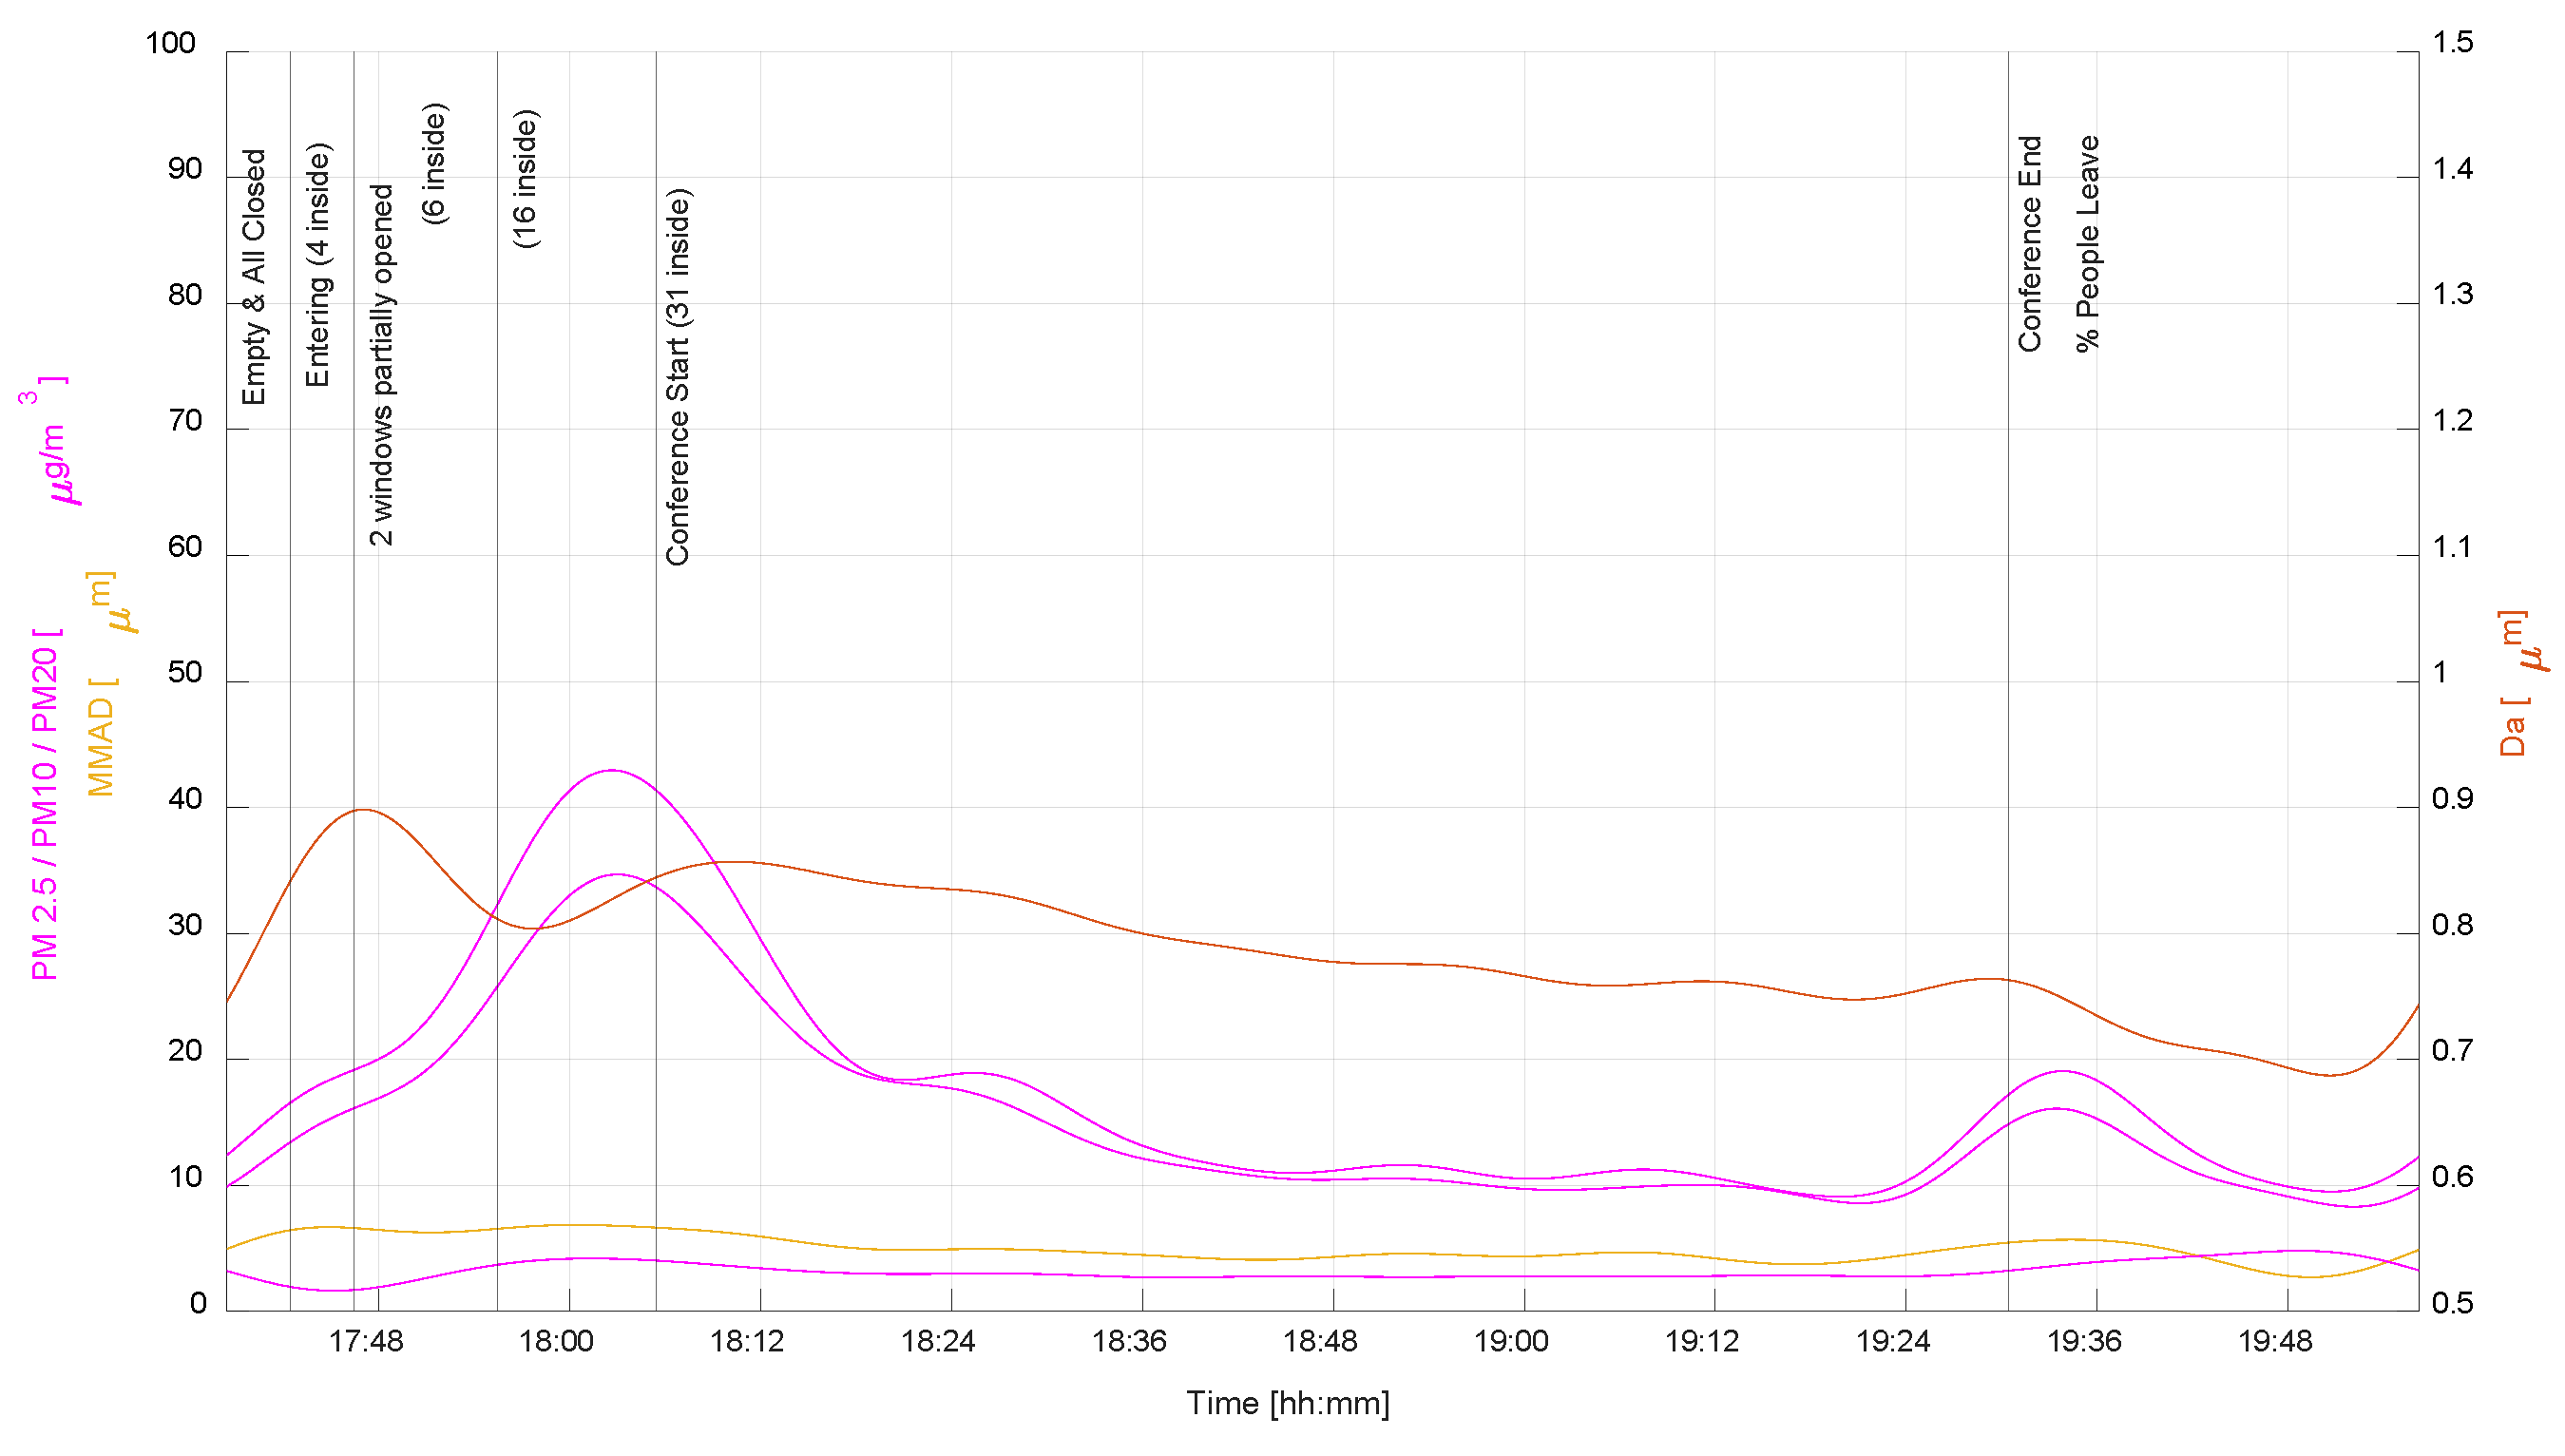
Figure 5 shows the PM2.5, PM10, PM20, Da and MMAD inside the classroom. As soon as the measurement started, all the windows and doors were closed, and within 20 min, PM20 fluctuated between 20 µg/m3 and 25 µg/m3, even reaching 19 µg/m3. Moreover, Da increased from 0.78 µm to 0.83 µm and then decreased to 0.81 µm. Then, one more alumnus entered the room, and the windows were opened during the following 16 min. PM20 first varied between 19 µg/m3 and 33 µg/m3 before increasing to 68 µg/m3. Moreover, Da decreased to 0.71 µm and then increased to 0.77 µm. Thereafter, all windows were again closed during 20 min, and PM20 again decreased to 19 µg/m3 and then increased to 31 µg/m3. In addition, Da slowly increased to 0.78 µm during the first 10 min and then rapidly increased to 1.00 µm. At this time, all windows and doors were opened, and PM20 again decreased to 7 µg/m3 and then increased to 16 µg/m3, while Da decreased to 0.70 µm and then increased to 0.74 µm. It was remarkable how particles with sizes larger than 10 µm almost disappeared at the valley points of PM20 = 7 µg/m3 and Da = 0.70 µm. Just before closing, the already mentioned alumni left the room. During the subsequent 20 min interval at the all-closed stage, PM20 again increased to 45 µg/m3 and then decreased to 37 µg/m3, while Da increased to 0.90 µm during the first 10 min and then slowly decreased to 0.88 µm. After this interval, only the doors were opened until the end of the class. During this 30 min interval, Da decreased to 0.77 µm after 15 min and remained stable until the end of the stage. In contrast, PM20 again decreased to an 18 µg/m3 value after 15 min, after which it increased to 34 µg/m3 at the end of the stage. At the back-to-calm stage, and for 25 min after the class ended, the measurement continued at the all-closed stage with the room empty. In this interval, PM20 again decreased to 13 µg/m3 during the first 20 min and then increased to 21 µg/m3, while Da slightly decreased to 0.74 µm during the first 20 min and then increased to 0.78 µm.

3.2. University Classroom A206–Scenario 2: Quasi-Empty Class

Figure 6 shows the carbon dioxide and particle number concentrations inside the classroom. Before starting the measurement, a 5 min ventilation process was performed with the classroom empty. As soon as the measurement was started, all the windows and doors were closed, and the carbon dioxide concentration increased from 800 ppm to 873 ppm within 1 min. Moreover, PNC slightly decreased from 39 particles/cm3 to 34 particles/cm3. Then, one alumnus entered the room, and the windows were opened during the following 16 min, raising PNC to 80 particles/cm3 while air was renewed, and CO2C decreased to 515 ppm. Once again, all the windows were closed for 20 min, and the carbon dioxide level increased to 602 ppm, while PNC decreased to 40 particles/cm3. At this time, all the windows and doors were opened. After approximately 5 min, PNC reached its maximum of 63 particles/cm3, decreasing to 51 particles/cm3 after 7 min. Moreover, CO2C reached its maximum value of 688 ppm 5 min after all windows and doors were opened, and then it slightly decreased to 662 ppm 7 min after all the windows and doors were again closed. Just before closing, the single alumnus left the room. Again, during another 20 min interval at the all-closed stage, CO2C increased within 1 min to 698 ppm and then slightly decreased to 686 ppm, while PNC decreased to 43 particles/cm3, reaching a peak of 57 particles/cm3 after 4 min. After this interval, only the doors were opened until the end of the class. During this 30 min interval, the carbon dioxide level smoothly increased to 718 ppm and then decreased to 680 ppm. However, PNC only increased at this stage, reaching 100 particles/cm3 at the end of it. To finish the measurement, a back-to-calm stage was performed, and for 25 min after the class was ended, the measurement continued at the all-closed stage. In this interval, PNC asymptotically decreased to 80 particles/cm3, while CO2C slightly increased to 694 ppm and then decreased to reach a final value of 681 ppm. Note that the carbon dioxide maximum level recommended by the Sinphonie guidelines was not reached.
Figure 7 shows the T and RH inside the classroom. As soon as the measurement started, all the windows and doors were closed, and T increased within 20 min from 18.9 °C to 20.6 °C. Moreover, RH decreased from 37% to 34%. Then, one alumnus entered the room, and the windows were opened during the following 16 min. At first, RH decreased to 32.4%, and it then increased to 37.2%. In addition, T decreased to 15.3 °C. Thereafter, all the windows were again closed for 20 min, and T increased to 20 °C, while RH decreased to 33%. At this time, all the windows and doors were open. RH reached its minimum of 33% after 8 min, then increased to 34% 4 min. Moreover, T only decreased to 19 °C after this 12 min interval when all the windows and doors were closed again. Just before closing, the single alumnus left the room. Again, during another 20 min interval at all-closed stage, T increased to 20.6 °C, while RH decreased to 32.7%. After this interval, only the doors were open until the end of the class. During this 30 min interval, RH gradually decreased to 32% at the end of the stage, with a peak of 33% after 9 min. In contrast, T increased to 21 °C at the end of the stage, with a subpeak of 20.8 °C after 12 min. To finish the measurement, at the back-to-calm stage, and for 25 min after the class ended, the measurement continued at the all-closed stage with the room empty. In this interval, T continued to increase to 21.7 °C, and RH remained completely stable at 32%.
Figure 8 shows the PM2.5, PM10, PM20, Da and MMAD inside the classroom. As soon as the measurement started, all the windows and doors were closed, and within 20 min, PM20 ranged from 15 µg/m to 19 µg/m3. Moreover, Da increased from 0.79 µm to 0.88 µm and decreased to 0.80 µm. Then, one alumnus entered the room, and the windows were opened during the following 16 min. PM20 oscillated, decreasing to 13 µg/m3 before increasing to 15 µg/m3. Moreover, Da decreased to 0.70 µm and then increased to 0.72 µm. Then, all the windows were again closed during 20 min, and PM20 again decreased to 8.3 µg/m3 and then increased to 10 µg/m3. Moreover, Da slowly decreased to 0.71 µm and then slightly increased. At this time, all the windows and doors were opened, and PM20 again decreased to 8.2 µg/m3 and then increased to 9.7 µg/m3, while Da continued to increase to 0.74 µm and then decreased to 0.73 µm. It should be mentioned that particles with sizes greater than 10 µm were rarely present during the measurement. Just before closing, the single alumnus left the room. During the subsequent 20 min interval at the all-closed stage, PM20 decreased slowly to 9.1 µg/m3 and then slightly increased at the end of the stage to 9.3 µg/m3, while Da increased to 0.74 µm with fluctuations within the range between the previous and last values. After this interval, only the doors were open until the end of the class. During this 30 min interval, Da decreased slowly to 0.71 µm. In contrast, PM20 again increased to 15.4 µg/m3 and then slightly decreased to 14.9 µg/m3 at the end of the stage. At the back-to-calm stage, and for 25 min after the class ended, the measurement continued at the all-closed stage with the room empty. In this interval, PM20 again decreased to 10.4 µg/m3 during the first 17 min and then increased to 15.5 µg/m3, while Da slightly decreased to 0.70 µm during the first 17 min and then increased to 0.78 µm.

3.3. Ignacio Aldecoa Library—Children’s Area

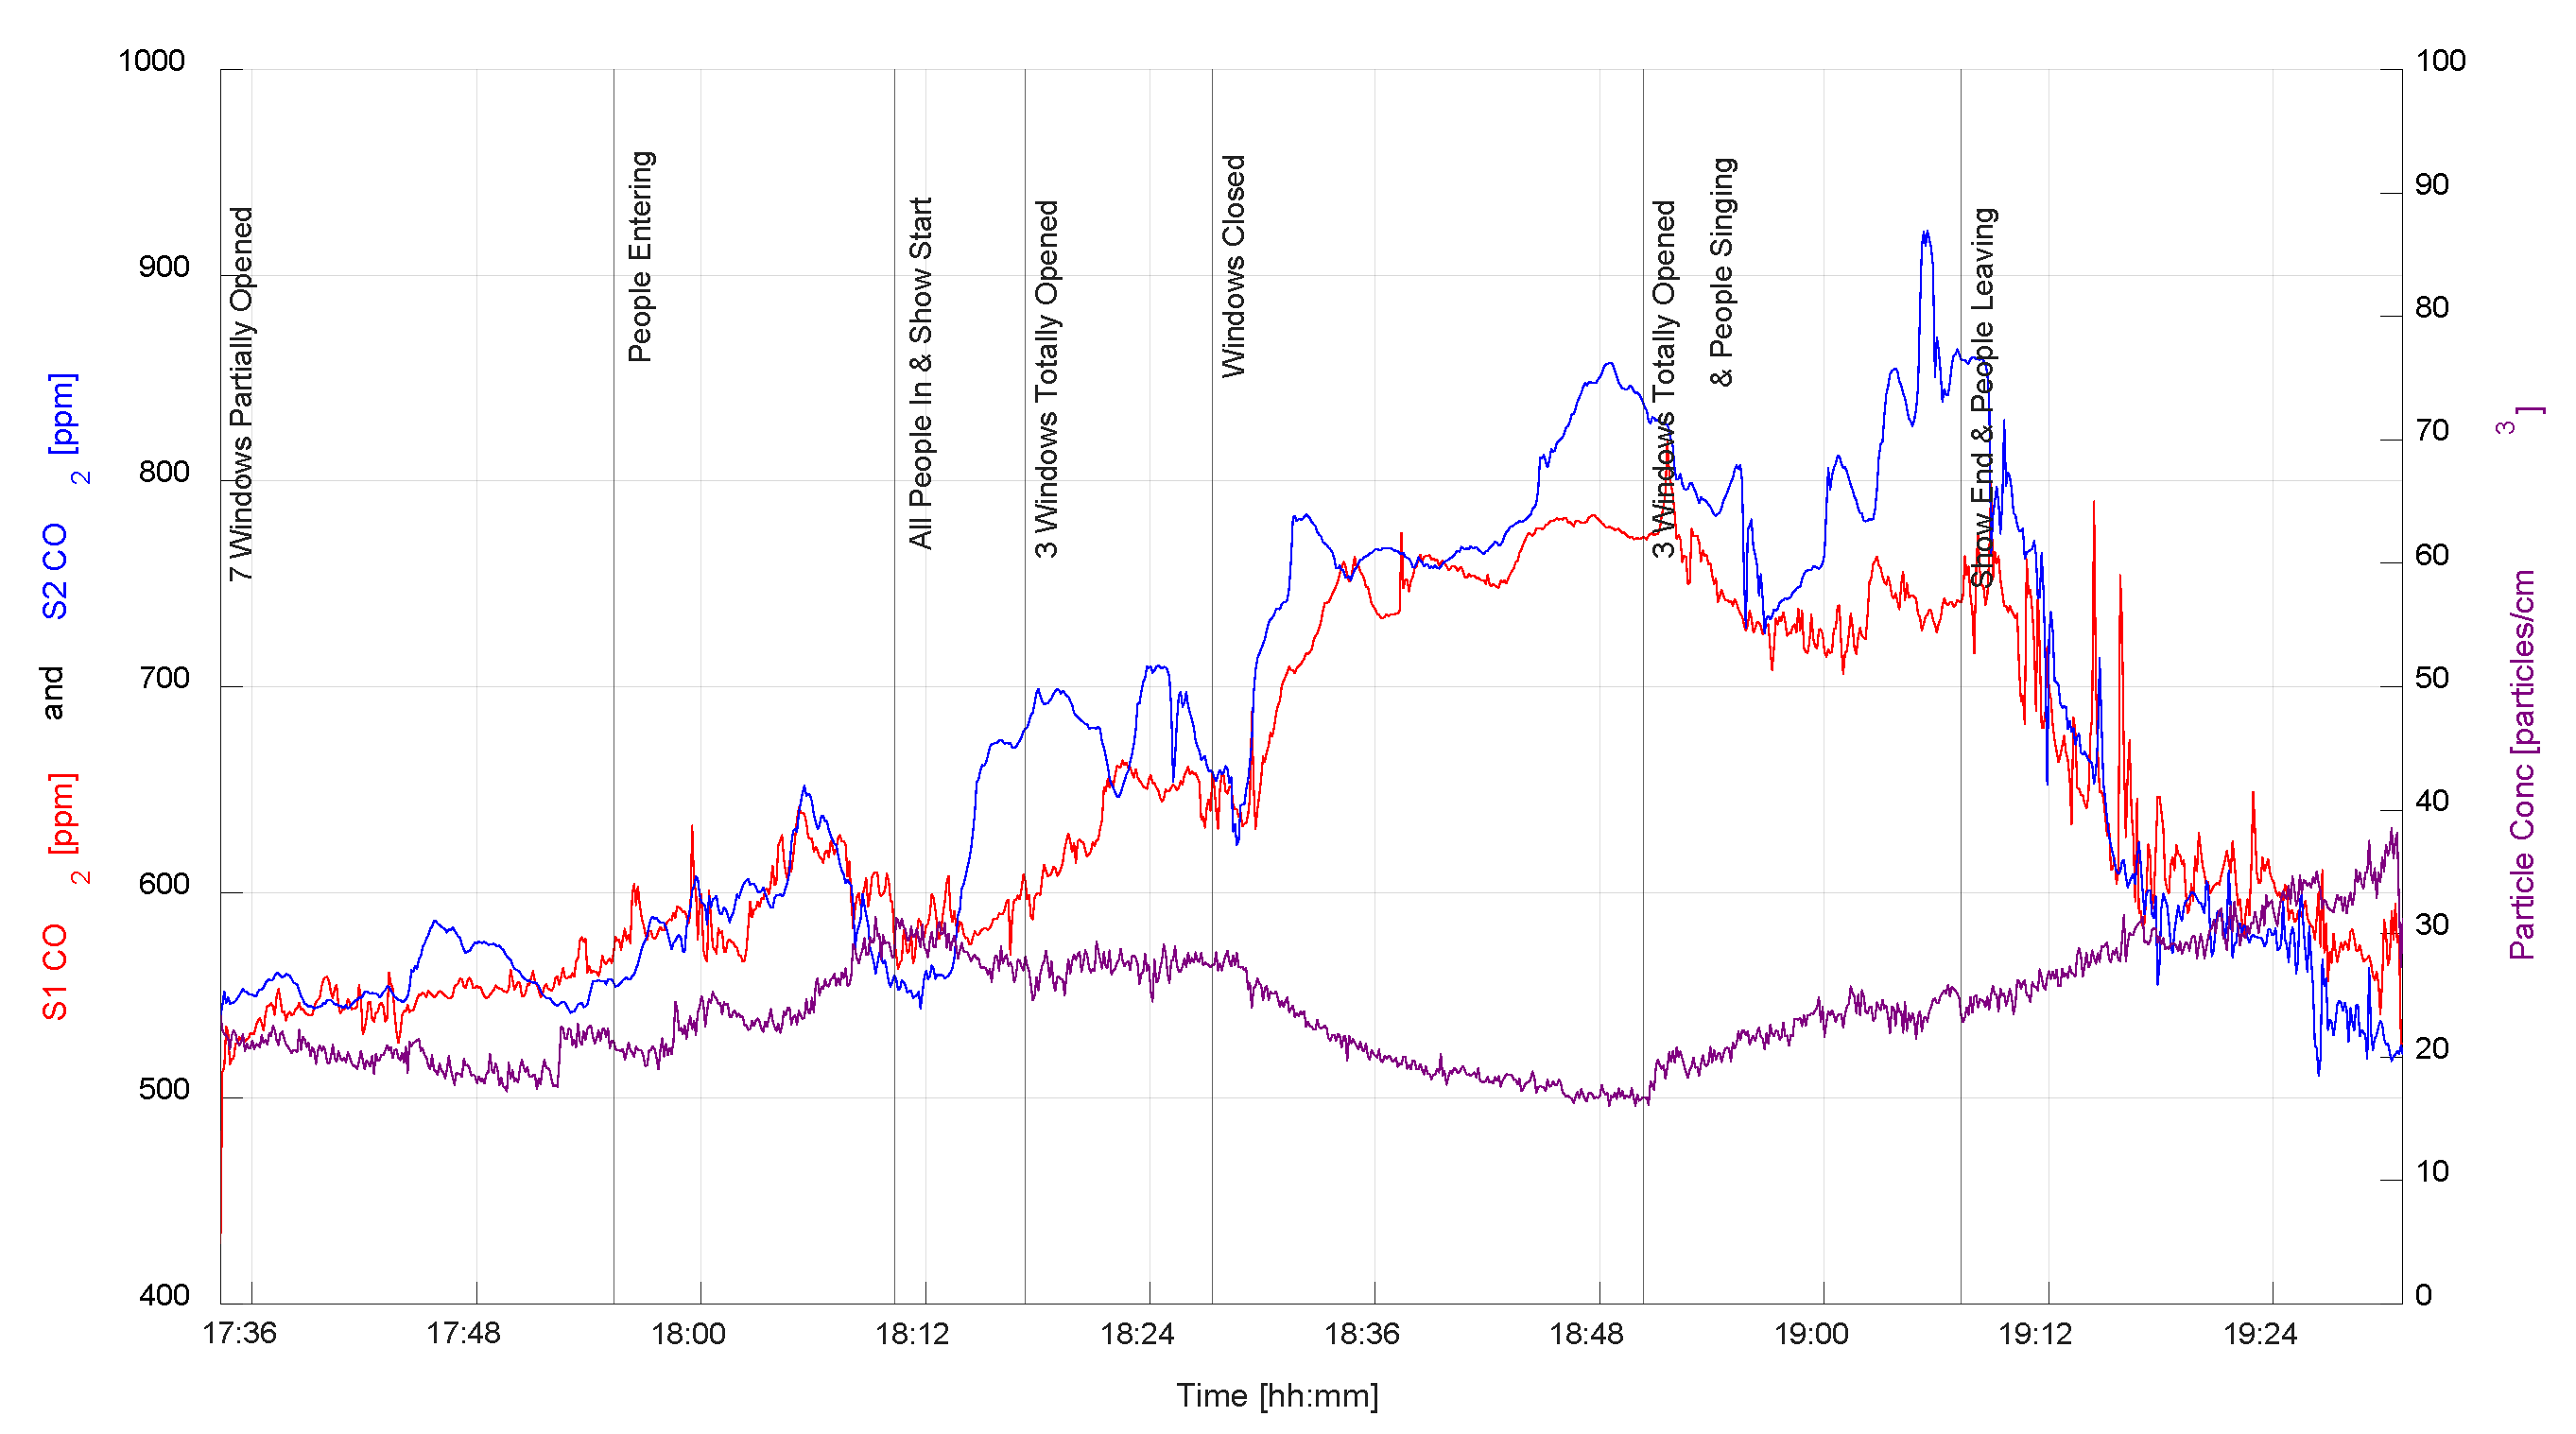
Figure 9 shows the carbon dioxide and particle number concentrations inside the children’s area. During the period before starting the measurement, four people were inside the area arranging chairs for the show as well as the required instrumentation for the measurement. Additionally, seven windows were partially opened during this period, and the door was kept fully open. Once the measurement started, only one of the doors was kept open, keeping the other one closed for the rest of the time until the end of the measurement. At this time, with seven windows partially opened, the carbon dioxide concentration increased from 515 ppm to 565 ppm within 21 min. In addition, PNC remained stable at approximately 21 particles/cm3. At this time, parents and children started entering the room and sitting on the floor for 14 min, raising PNC to 31 particles/cm3, while CO2C first increased to 639 ppm and then decreased to 563 ppm. Then, the show started, and within 5 min, the dioxide carbon level at sensor 2 (S2) exceeded and mainly stayed above the sensor 1 (S1) level. Therefore, the S1 level increased to 680 ppm during this 7 min interval, whereas the S2 level increased to 608 ppm. Moreover, PNC decreased to 27 particles/cm3. At this time, three of the partially opened windows were fully opened. PNC remained stable at approximately 28 particles/cm3. S1 reached its maximum value of 662 ppm 5 min after opening, and then it decreased to 655 ppm after 5 min. Moreover, S2 reached its maximum value of 710 ppm 7 min after opening, and then it decreased to 659 ppm after 3 min. Again, at this moment, these three windows were closed during the 23 min interval. S1 increased to 772 ppm, and S2 increased to 842 ppm, with some oscillations. However, PNC decreased in an asymptotic way to 16 particles/cm3. After this interval, these three windows were again open until the end of the show. During this 17 min interval, the carbon dioxide level at S1 decreased to 714 ppm after 11 min, and that at S2 decreased to 760 ppm. During the last 6 min of this interval, people started singing, and S1 increased to 740 ppm, while S2 increased to 864 ppm. Moreover, PNC only increased at this stage, reaching 24 particles/cm3 at the end. To finish the measurement, a back-to-calm stage was performed, and for 23 min after the show had ended, the measurement continued under ventilation. In this interval, while people left, PNC increased to 38 particles/cm3, while CO2C slightly and smoothly increased to 694 ppm and then decreased to a final value of 527 ppm. Note that at this final stage, the S1 and S2 levels became more similar to those observed before the start of the show. Note that the carbon dioxide maximum level recommended by the Sinphonie guidelines was not reached.
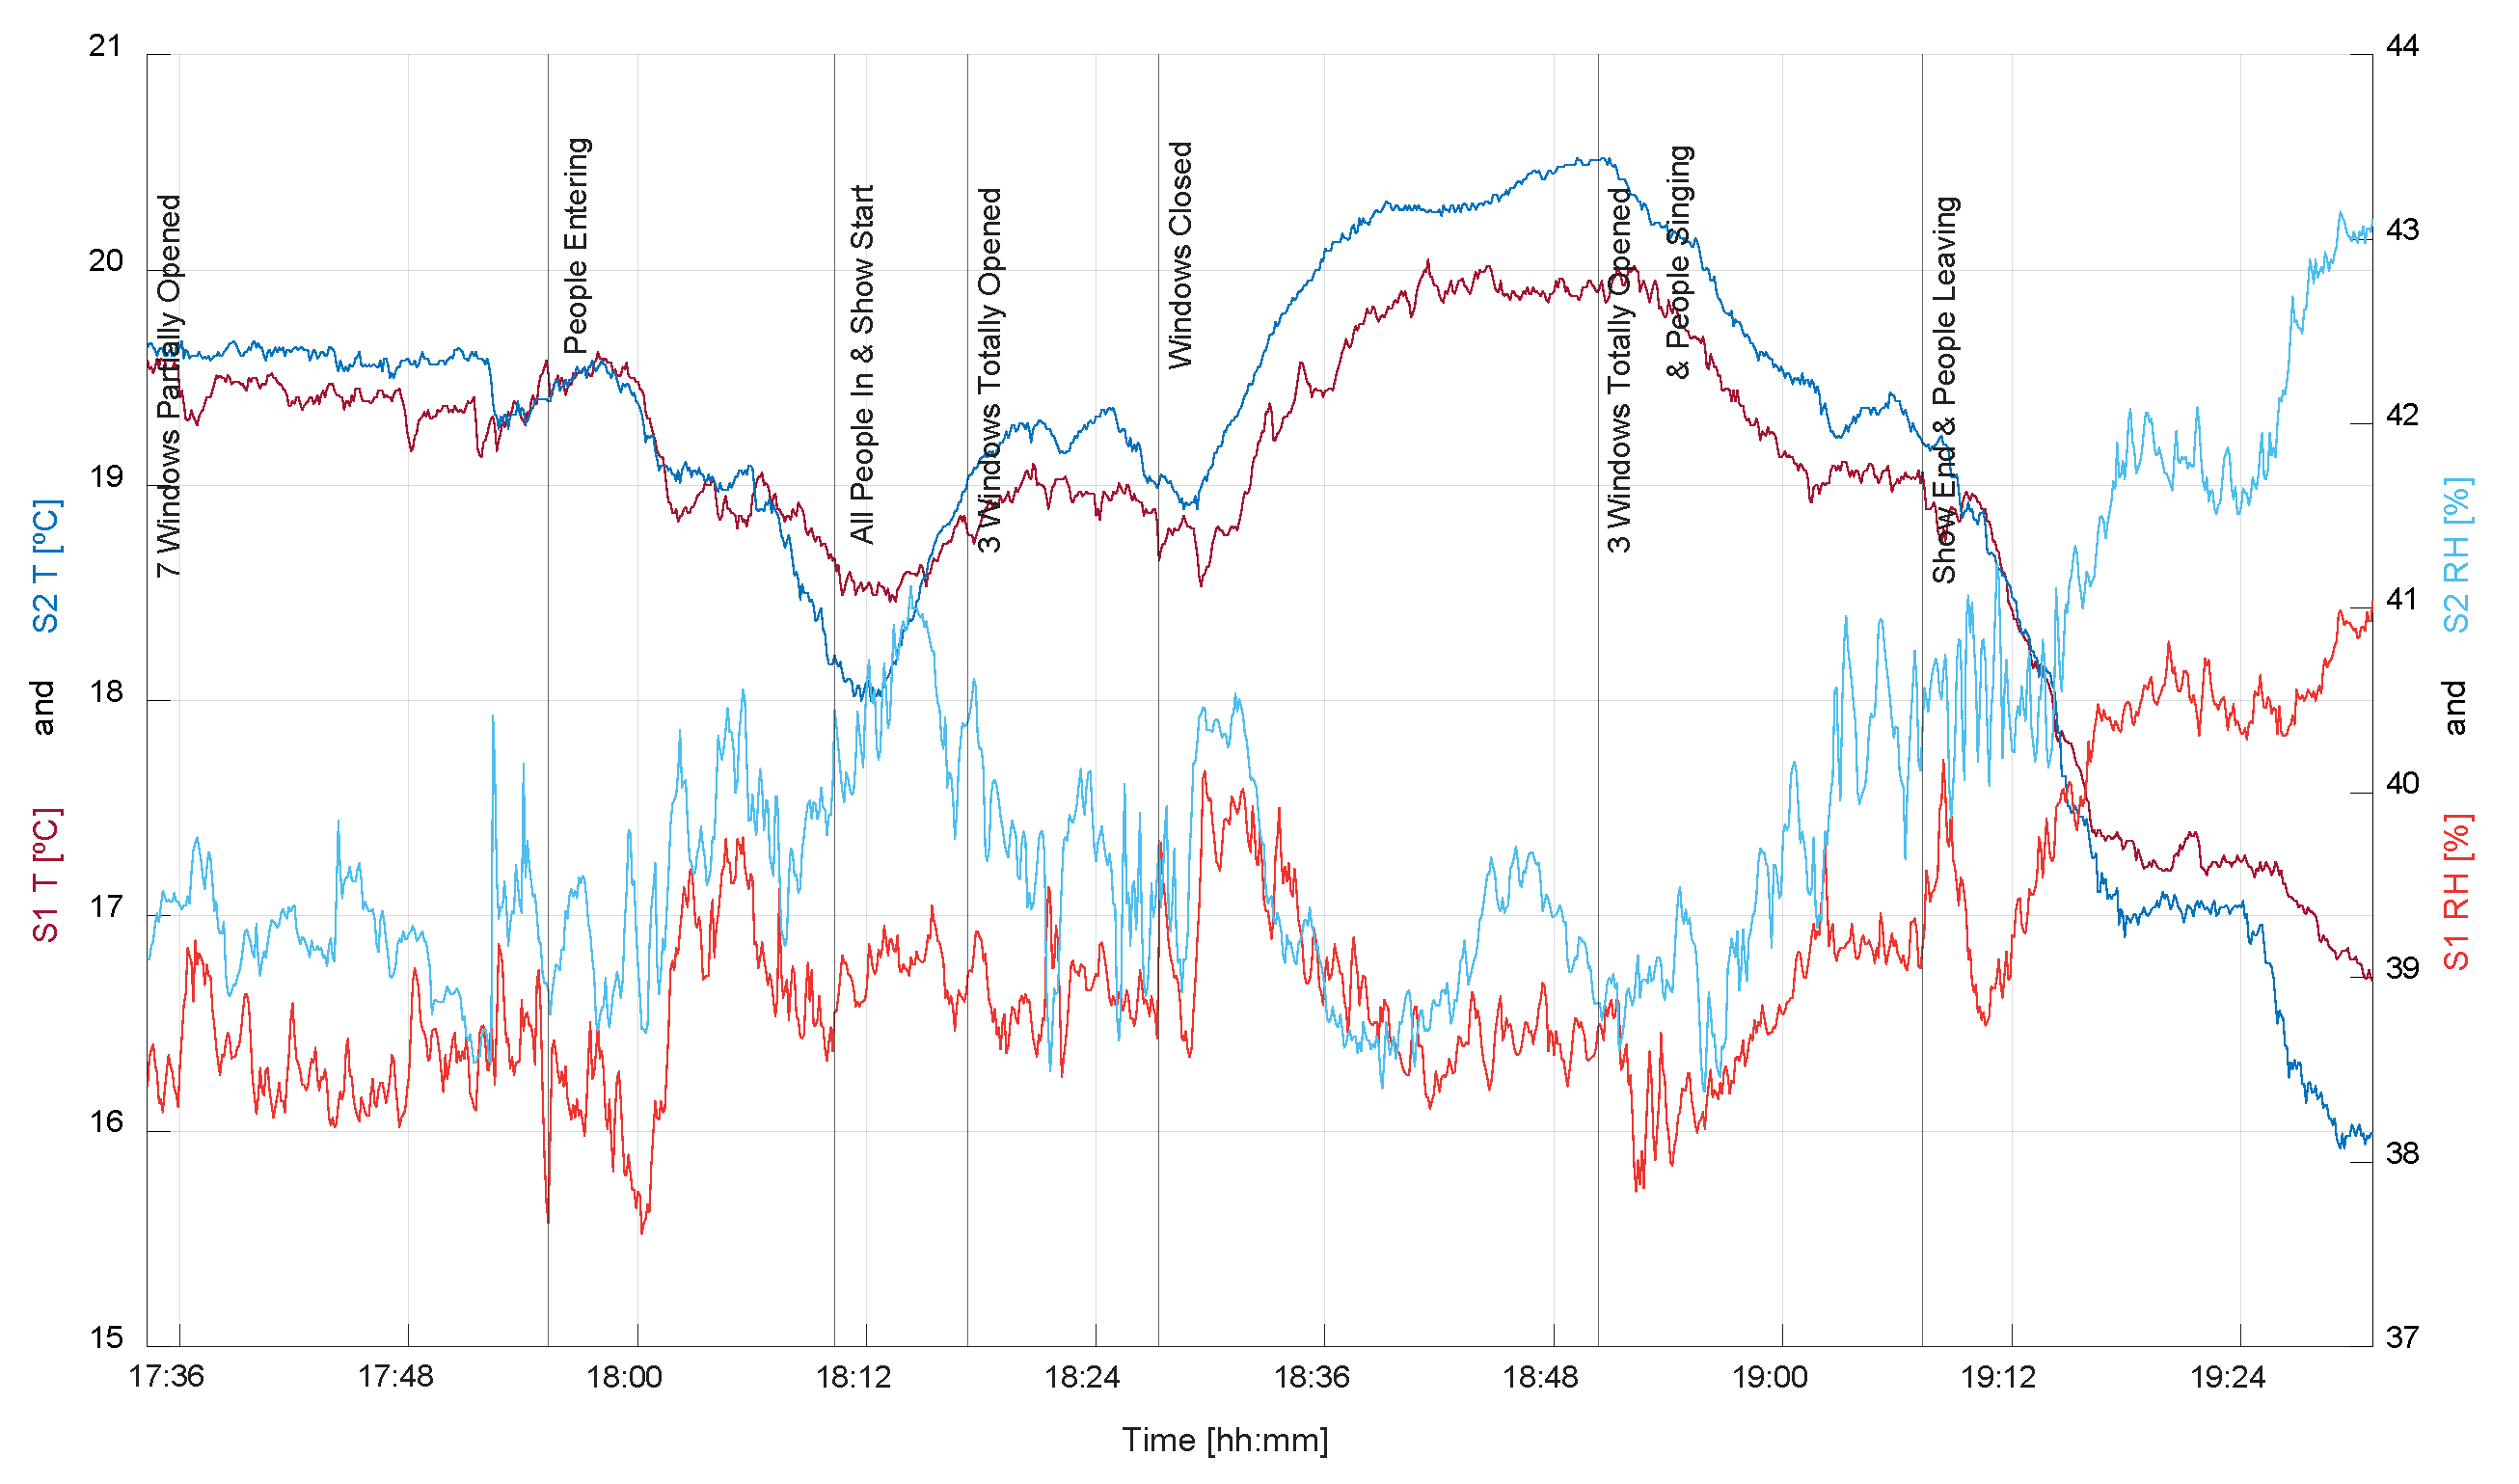
Figure 10 shows the T and RH inside the children’s area. Once the measurement started, only one of the doors was kept open, keeping the other one closed for the rest of the time until the end of the measurement. At this time, with seven windows partially opened, T remained stable for 21 min, ranging from 19.6 °C to 19.4 °C. Moreover, RH was maintained at approximately 38.5%. At this time, parents and children started entering the room and sitting on the floor for 14 min, and RH first decreased, then increased and finally decreased to 39%, both sensor readings ran parallel, and T decreased by 18.6 °C. However, it must be noted that the temperature run was also parallel, but at S2, a more notable change was observed involving peaks and valleys, with an approximately 0.5 °C to 1 °C difference captured. Then, the show started, and within 2 min, T at sensor 2 (T2) became lower than the sensor 1 (T1) level. Therefore, T1 decreased to 18.5 °C, and T2 decreased to 18 °C. Then, both increased, namely, T1 increased to 18.8 °C and T2 increased to 19.1 °C. Moreover, RH at S2 (RH2) increased to 41% after 7 min and then decreased to 40.4%, while RH at S1 (RH1) remained almost stable at approximately 39%. At this time, three of the partially opened windows were fully opened. T1 first increased to 19.1 °C and then decreased to 18.9 °C, while T2 first increased to 19.4 °C and then decreased to 19 °C. Both RH1 and RH2 decreased, namely, RH1 decreased to 38.8% and RH2 decreased to 39.3%. Again, at this moment, these three windows were closed during the 23 min interval. T1 increased to 20.5 °C, and T2 increased to 19.9 °C. During the first 10 min, both RH1 and RH2 first increased to 40% and then decreased to 38.5%; then, RH1 first increased to 39.7% and then decreased to 38.8%, while RH2 remained almost constant at 38.8%. After this interval, these three windows were opened again until the end of the show. During this 17 min interval, T1 decreased to 19 °C after 11 min, and T2 decreased to 19.3 °C. During the last 6 min of this interval, people started singing, and T1 and T2 remained stable at the above values. Moreover, RH1 and RH2 reached 39.3% after 11 min, after which RH1 first increased to 41% and then decreased to 40%, while RH2 remained almost stable at approximately 39.2%. To finish the measurement, a back-to-calm stage was performed, and for 23 min after the show had ended, the measurement continued under ventilation. In this interval, and while people left, T1 and T2 ran parallel for the first 7 min and decreased to 17.8 °C, after which they kept decreasing, namely, T1 decreased to 16.7 °C and T2 decreased to 16 °C. Different effects occurred at the same time regarding RH; RH2 remained stable at approximately 40.5% for the first 7 min, while RH1 first decreased to 38.7% and then increased to 40%. Then, they exhibited parallel trends until the end of the measurement, when RH2 increased to 43%, while RH1 increased to only 41%.
Figure 11 shows the PM2.5, PM10, PM20, Da and MMAD inside the children’s area. It should be mentioned that PM2.5 was maintained without notable variation between 3 µg/m3 and 5 µg/m3 during all measurements. Once the measurement started, only one of the doors was kept open, keeping the other one closed for the rest of the time until the end of the measurement. At this time, with seven windows partially opened, PM20 fluctuated between 10 µg/m3 and 11 µg/m within 21 min, reaching a 26 µg/m3 peak value. Moreover, Da increased from 0.77 µm to 0.86 µm and then decreased to 0.79 µm. It was remarkable how particles with sizes greater than 10 µm almost disappeared at the valley point close to the end of this stage. At this time, parents and children started entering the room and sitting on the floor for 14 min, and PM20 oscillated, reaching 25 µg/m3 before decreasing to 20 µg/m3. Moreover, Da first increased to 0.82 µm and then decreased to 0.80 µm. Then, PM20 oscillated, reaching 18 µg/m3 before increasing to 20 µg/m3 after 7 min. Moreover, Da slightly increased to 0.81 µm. At this time, three of the partially opened windows were fully opened. PM20 continued to increase to 25 µg/m3, while Da first increased to 0.82 µm and then decreased to 0.81 µm. Again, at this moment, these three windows were closed during the next 23-min interval. T1 increased to 20.5 °C, and T2 increased to 19.9 °C. PM20 oscillated, increasing to 25 µg/m3, then decreasing to 20 µg/m3 after 10 min and then first increasing to 32 µg/m3 and then decreasing to 25 µg/m3 at the end of this interval. Da increased to 0.92 µm after 20 min and then decreased to 0.89 µm. After this interval, these three windows were opened again until the end of the show. During this 17-min interval, Da decreased to 0.82 µm after 5 min, increased to 0.92 µm after 9 min and then decreased to 0.90 µm at the end of the stage. PM20 oscillated, first decreasing to 20 µg/m3, then increasing to 46 µg/m3 after 15 min and finally decreasing to 44 µg/m3 at the end of this stage. To finish the measurement, a back-to-calm stage was performed, and for 23 min after the show had ended, the measurement continued under ventilation. In this interval, and while people left, Da gradually decreased to 0.77 µm, while PM20 oscillated, first decreasing to 22 µg/m3, then increasing to 32 µg/m3 after 18 min and finally decreasing to 12 µg/m3 at the end of the measurement.

3.4. Ignacio Aldecoa Library—Assembly Hall

Figure 12 shows the carbon dioxide and particle number concentrations inside the assembly hall. Half an hour before starting the measurement, two people were inside the area setting up the instrumentation for the measurement. The door was fully opened, and no windows or other doors were used. Five minutes before the measurement, 35 persons gradually entered the hall, sitting randomly in the chairs. Once the measurement started, the carbon dioxide concentration at S1 increased within 9 min from 650 ppm to 750 ppm, and that at S2 remained stable at approximately 600 ppm. During all the measurements, the carbon dioxide level at S1 clearly stayed above the S2 level. Moreover, PNC decreased from 33 particles/cm3 to 29 particles/cm3. At this time, 11 more persons had entered the area. The conference started, and the door was closed at the same time. During the following 23 min, PNC decreased to 22 particles/cm3, while CO2C increased to 818 ppm at S1 and 700 ppm at S2. Then, 5 more persons entered, and during the following 1 h and 5 min conference period, ventilation remained stable, and people remained inside the area: PNC decreased to 14 particles/cm3, while during 45 min, CO2C increased to 952 ppm at S1 and 815 ppm at S2. At the end of this interval, CO2C decreased to 940 ppm at S1 and increased to 819 ppm at S2. At this time, 5 persons left, and after 15 min, PNC increased to 17 particles/cm3, while CO2C at S1 decreased to 932 ppm and that at S2 decreased to 811 ppm. Again, at this moment, 4 more persons left, and after 8 min, PNC decreased to 15 particles/cm3. During this interval, S1 was above 1000 ppm, the maximum level recommended by the Sinphonie guidelines, and it reached up to 1027 ppm. Moreover, almost at the end, S2 first increased to 839 ppm and then decreased to 816 ppm. To finish the measurement, a back-to-calm stage was performed, and for 20 min after the conference had ended, the measurement continued as before under ventilation. In this interval, during which people left within a few minutes, PNC slightly decreased to 16 particles/cm3. S1 dramatically decreased to 775 ppm and then increased to 800 ppm at the end of the measurement, while S2 exhibited the same trend. However, it first decreased to 704 ppm and then increased to a final value of 739 ppm.
Figure 13 shows the T and RH inside the assembly hall. Once the measurement started, for 9 min, T1 increased from 19 °C to 19.5 °C, while T2 increased from 17 °C to 17.5 °C. RH1 decreased from 42% to 41%, and RH2 remained stable at approximately 44%. It must be noted that T1 and RH2 remained above T2 and RH1, respectively, during the whole measurement. At this time, 11 more persons had entered the area. The conference started, and the door was closed at the same time. During the following 23 min, T1 increased to 21 °C, while T2 increased to 18.5 °C. RH1 decreased to 39%, and RH2 decreased to 42.4%. Then, 5 more persons entered, and during the following 1 h and 5 min conference period, stable ventilation continued, and people remained inside the area: T1 increased to 21.8 °C, while T2 increased to 19.4 °C. RH1 decreased to 38%, and RH2 was maintained at approximately 42.3%. At this time, 5 persons left, and after 15 min, T1 and T2 maintained approximately the same values. RH1 increased to 38.9%, and RH2 increased slightly to 42.6%. Again, at this moment, 4 more persons left, and after 8 min, all levels remained approximately stable. To finish the measurement, a back-to-calm stage was performed, and for 20 min after the conference had ended, the measurement continued as before under ventilation. In this interval, in which people left within a few minutes, T1 decreased to 21.6 °C, while T2 increased to 19.8 °C. RH1 decreased to 38.5%, and RH2 was maintained at approximately 41.5%.
Figure 14 shows the PM2.5, PM10, PM20, Da and MMAD inside the assembly hall. It should be mentioned that PM2.5 was maintained without notable variation between 2.5 µg/m3 and 5 µg/m3 during all the measurements. Once the measurement started, for 9 min, PM20 ranged from 28 µg/m3 to 29 µg/m3, even reaching a 33 µg/m3 peak value. Moreover, Da decreased from 0.86 µm to 0.80 µm. At this time, 11 more persons entered the area. The conference started, and the door was closed at the same time. During the following 23 min, PM20 decreased to 12 µg/m3. Da first increased to 0.81 µm and then decreased to 0.79 µm. It was remarkable how particles with sizes greater than 10 µm almost disappeared at the end of this stage. Then, 5 more persons entered, and during the following 1 h and 5 min conference period, ventilation remained stable, and people remained inside the area; PM20 decreased to 7.3 µg/m3 after 5 min and then remained stable until the end of the interval. In contrast, Da remained stable at 0.80 µm during the whole period. At this time, 5 persons left, and after 15 min, both PM20 and Da slightly increased and then returned to their previous values. Again, at this moment, 4 more persons left, and after 8 min, PM20 increased to 13 µg/m3, while Da increased to 0.87 µm. To finish the measurement, a back-to-calm stage was performed, and for 20 min after the conference had ended, the measurement continued as before under the same ventilation conditions. In this interval, in which people left within a few minutes, PM20 first increased to 21 µg/m3, then decreased to 14 µg/m3 and finally increased to 27 µg/m3 at the end of the measurement. Da first increased to 0.94 µm and then decreased to 0.86 µm at the end. It should be noted that particles with sizes greater than 10 µm returned to their initial state at this final stage, similar to the starting point of the measurement.

3.5. Ignacio Aldecoa Library—Conference Room

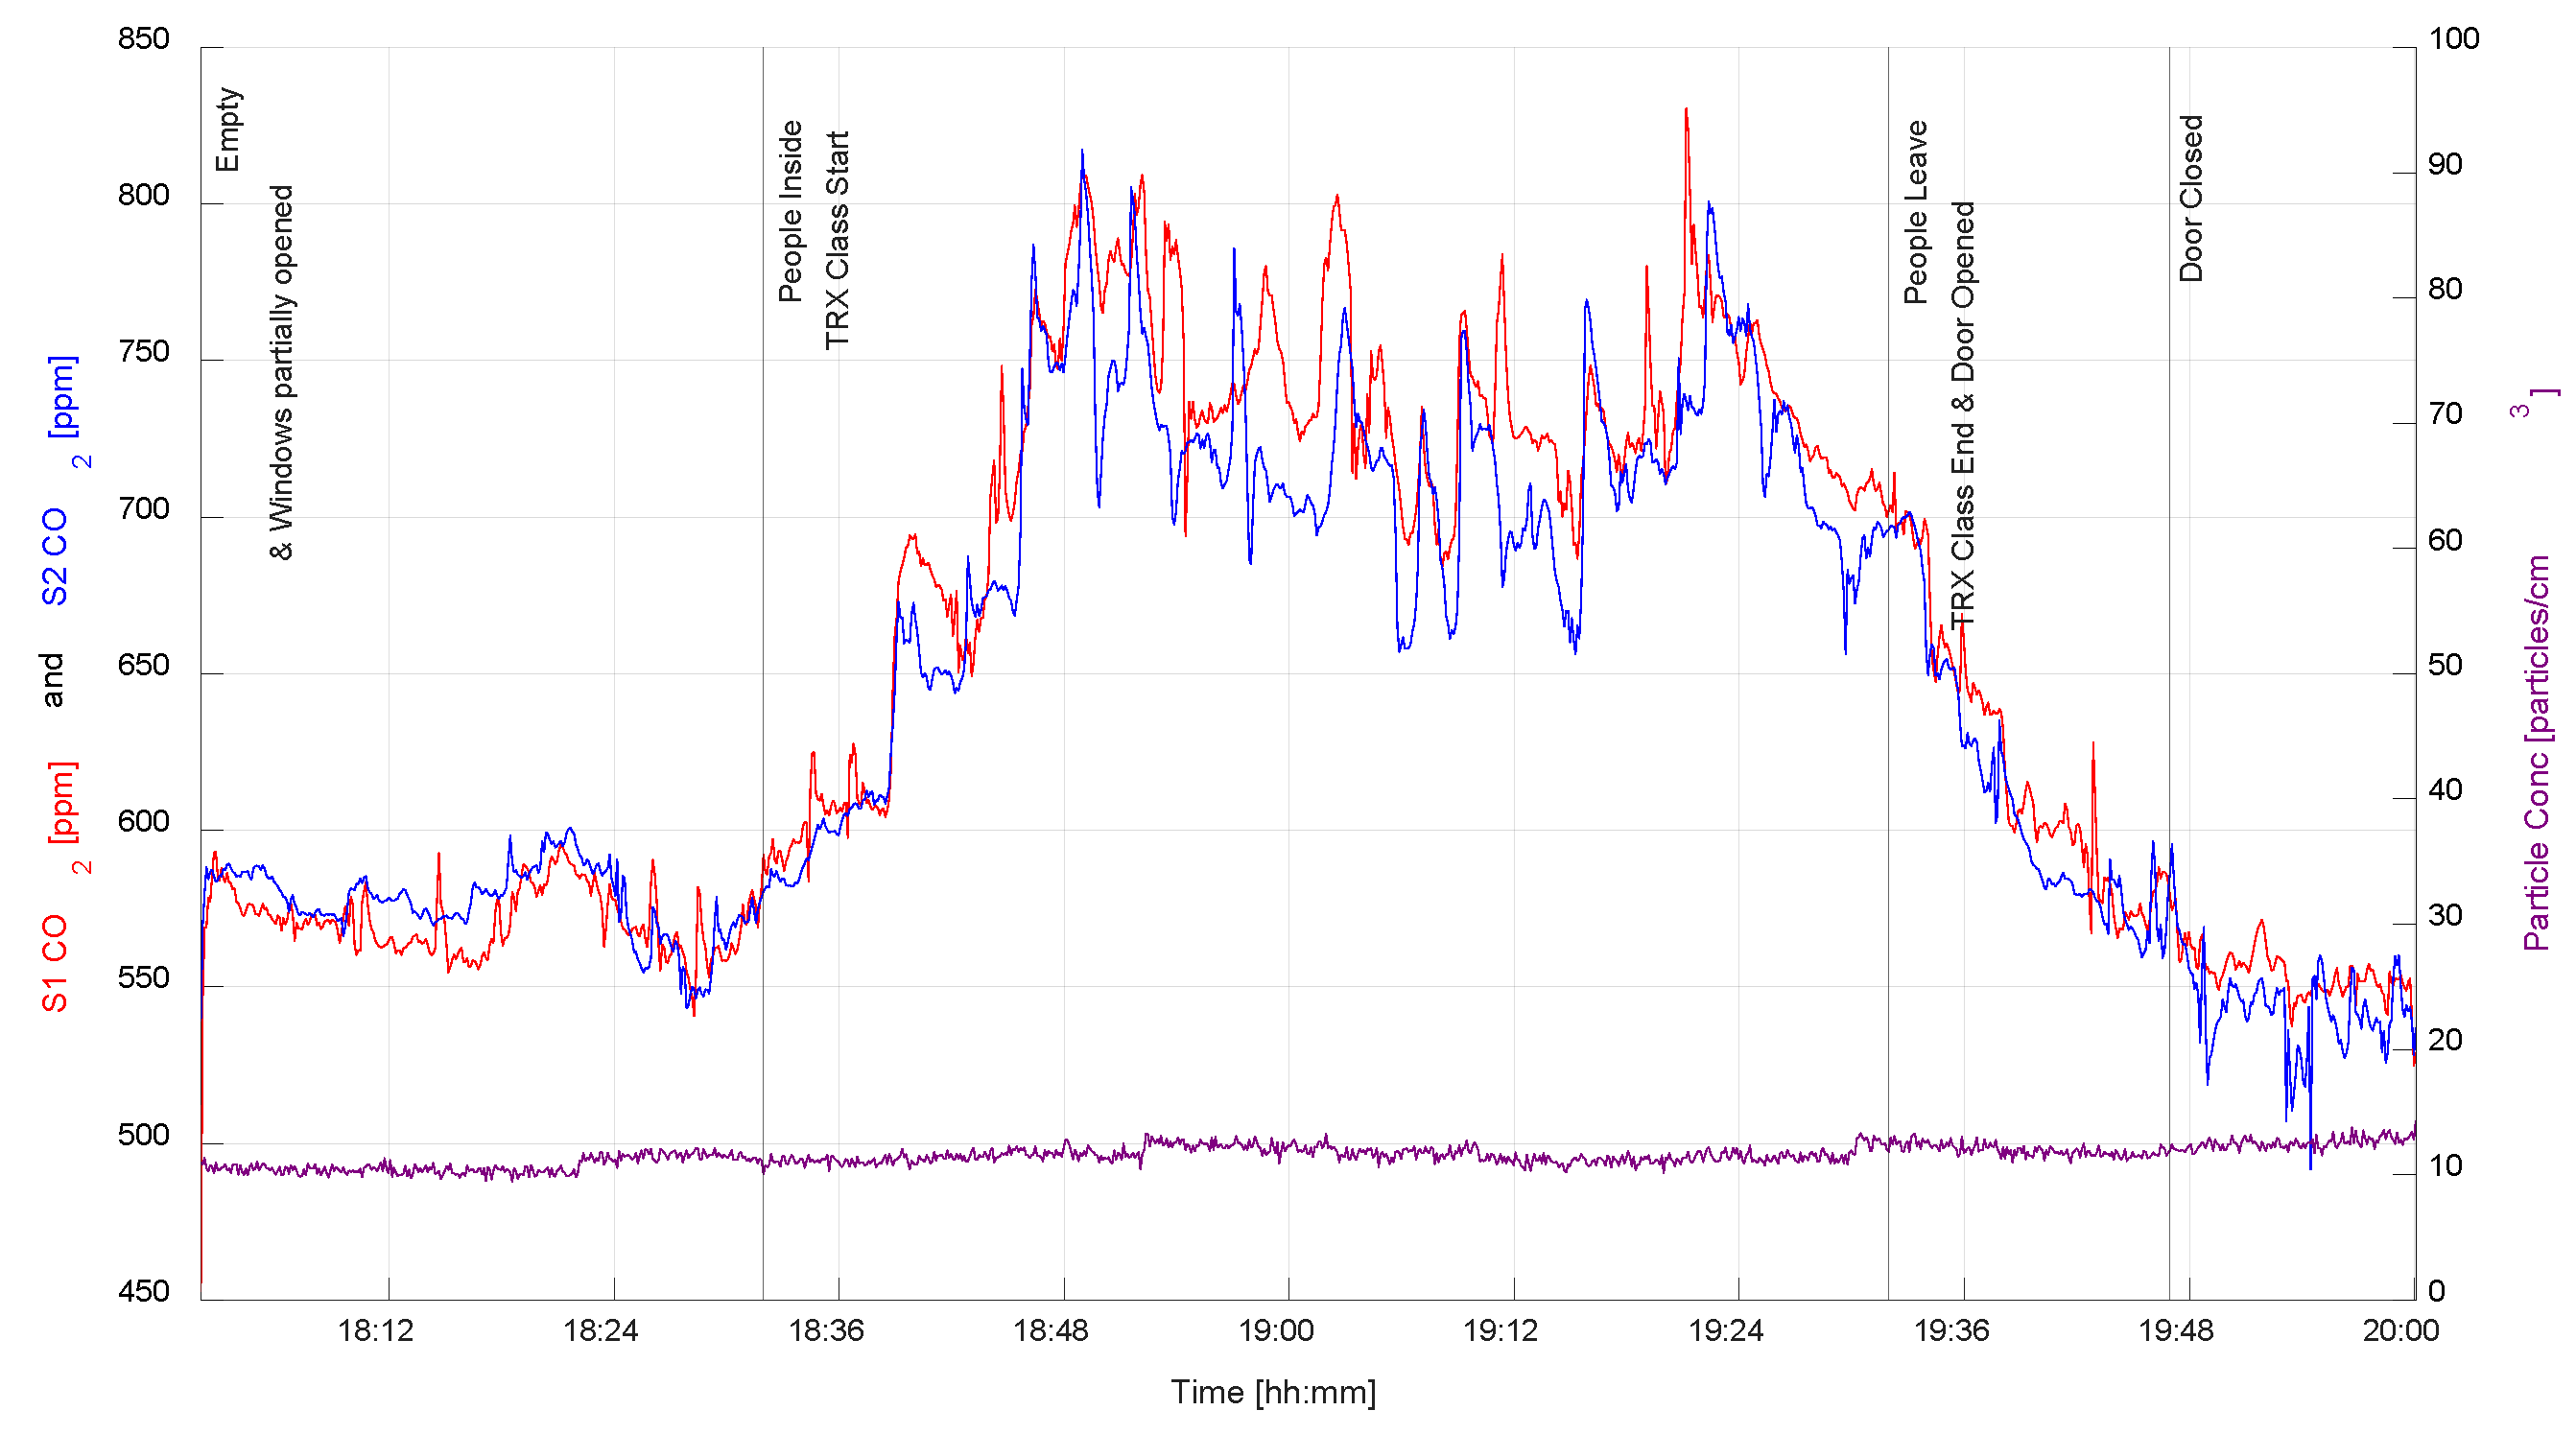
Figure 15 shows the carbon dioxide and particle number concentrations inside the conference room. Half an hour before starting the measurement, one person was inside the area setting up the instrumentation for the measurement. The door was fully opened, and the windows were closed. Once the measurement started, the door was closed, the carbon dioxide concentration at S1 increased in 4 min from 553 ppm to 572 ppm, and that at S2 remained stable at approximately 570 ppm. During the measurement, the carbon dioxide level at S1 clearly stayed above the S2 level. Moreover, PNC decreased from 14 particles/cm3 to 13 particles/cm3. At this time, 4 more persons entered the area; during the following 4 min, S1 increased to 595 ppm, and S2 increased to 581 ppm. PNC remained at the same value of 13 particles/cm3. Then, 2 more persons entered, and 4 min after two windows were partially opened, PNC was maintained at 13 particles/cm3, while CO2C increased to 733 ppm at S1 and 680 ppm at S2. At the end of this interval, 5 min later, it decreased to 660 ppm at S1 and to 620 ppm at S2, while PNC increased to 27 particles/cm3. At this moment, 10 more people entered the area, and during the next 10 min, the carbon dioxide level at S1 increased to 880 ppm, while that at S2 increased to 820 ppm. PNC reached a peak of 33 particles/cm3 before it decreased to 27 particles/cm3. Then, 15 more people entered, and the conference started. During the following 1 h and 25 min, the conference continued to remain stable in terms of ventilation and people inside the area. PNC decreased to 20 particles/cm3 in 15 min and was maintained at that level. During this 15 min interval, both S1 and S2 had already exceeded 1000 ppm, the maximum level recommended by the Sinphonie guidelines. At the end of the conference, S1 increased to 2002 ppm, and S2 increased to 1965 ppm. To finish the measurement, a return-to-calm stage was performed, and for 26 min after the conference had ended, the measurement continued as before regarding to ventilation. In this interval, in which people left within a few minutes, PNC increased to 48 particles/cm3, and at the end, it decreased to 45 particles/cm3. S1 constantly decreased to 813 ppm, while S2 did the same but decreased to 744 ppm.
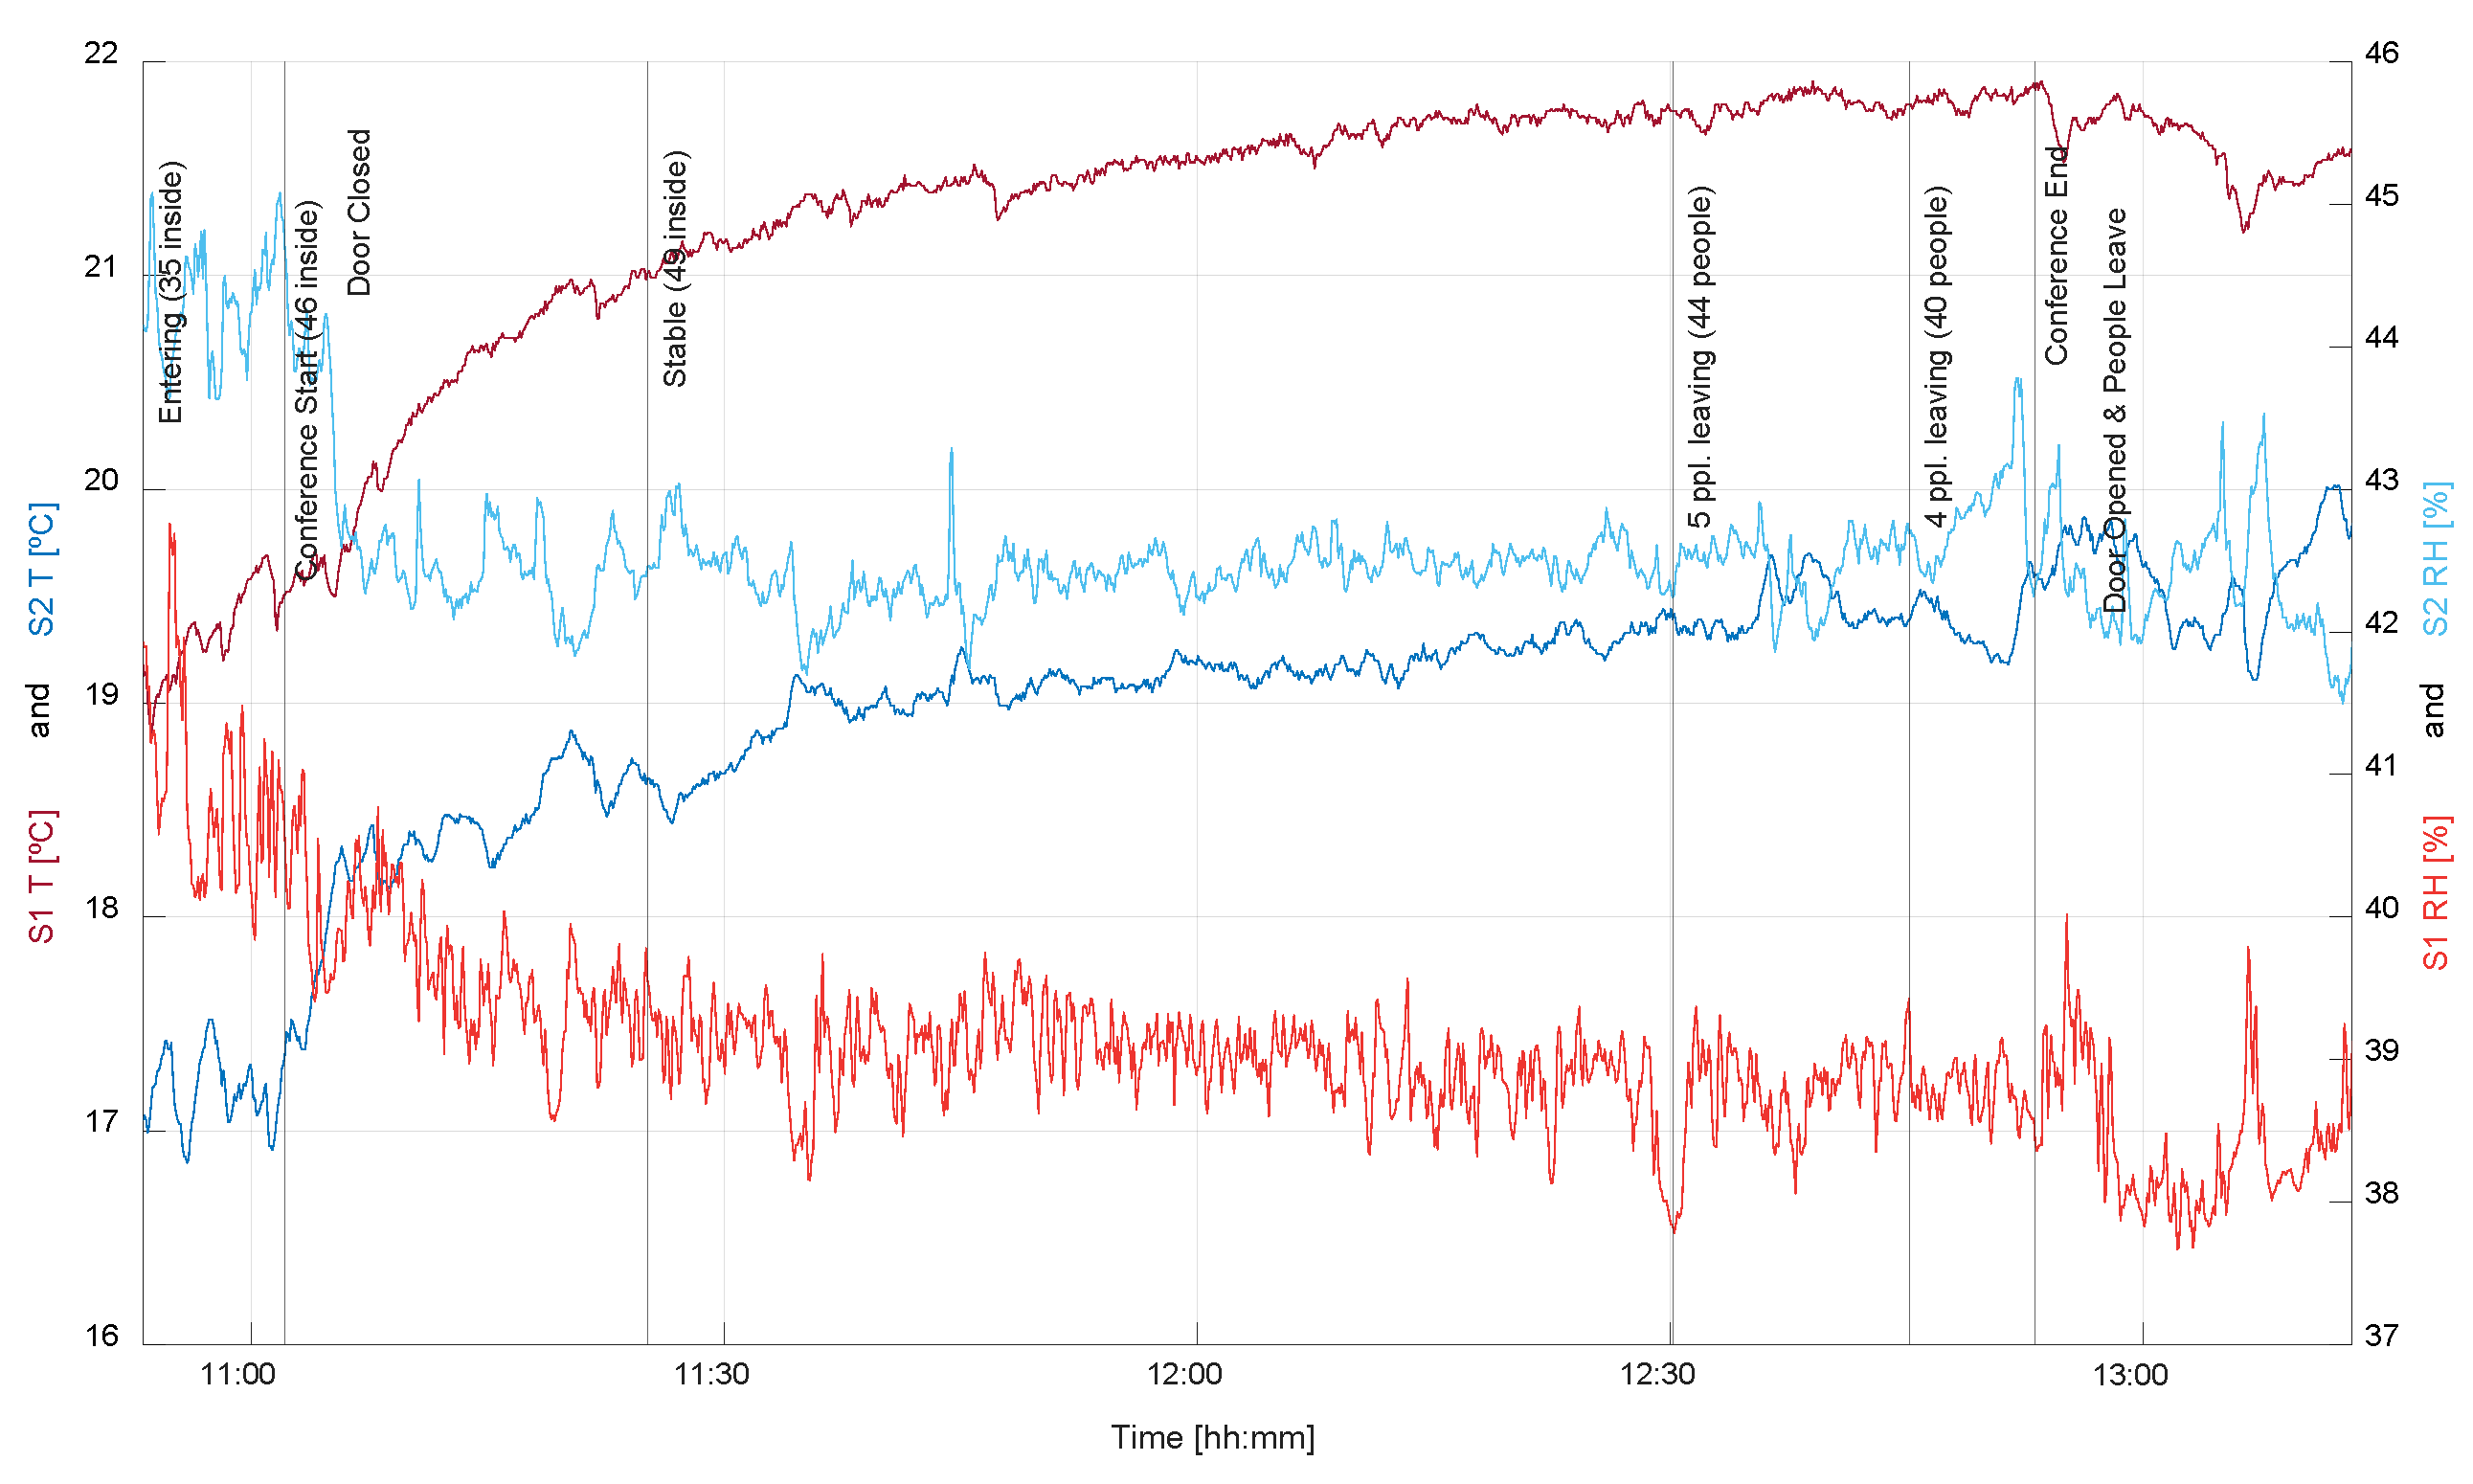
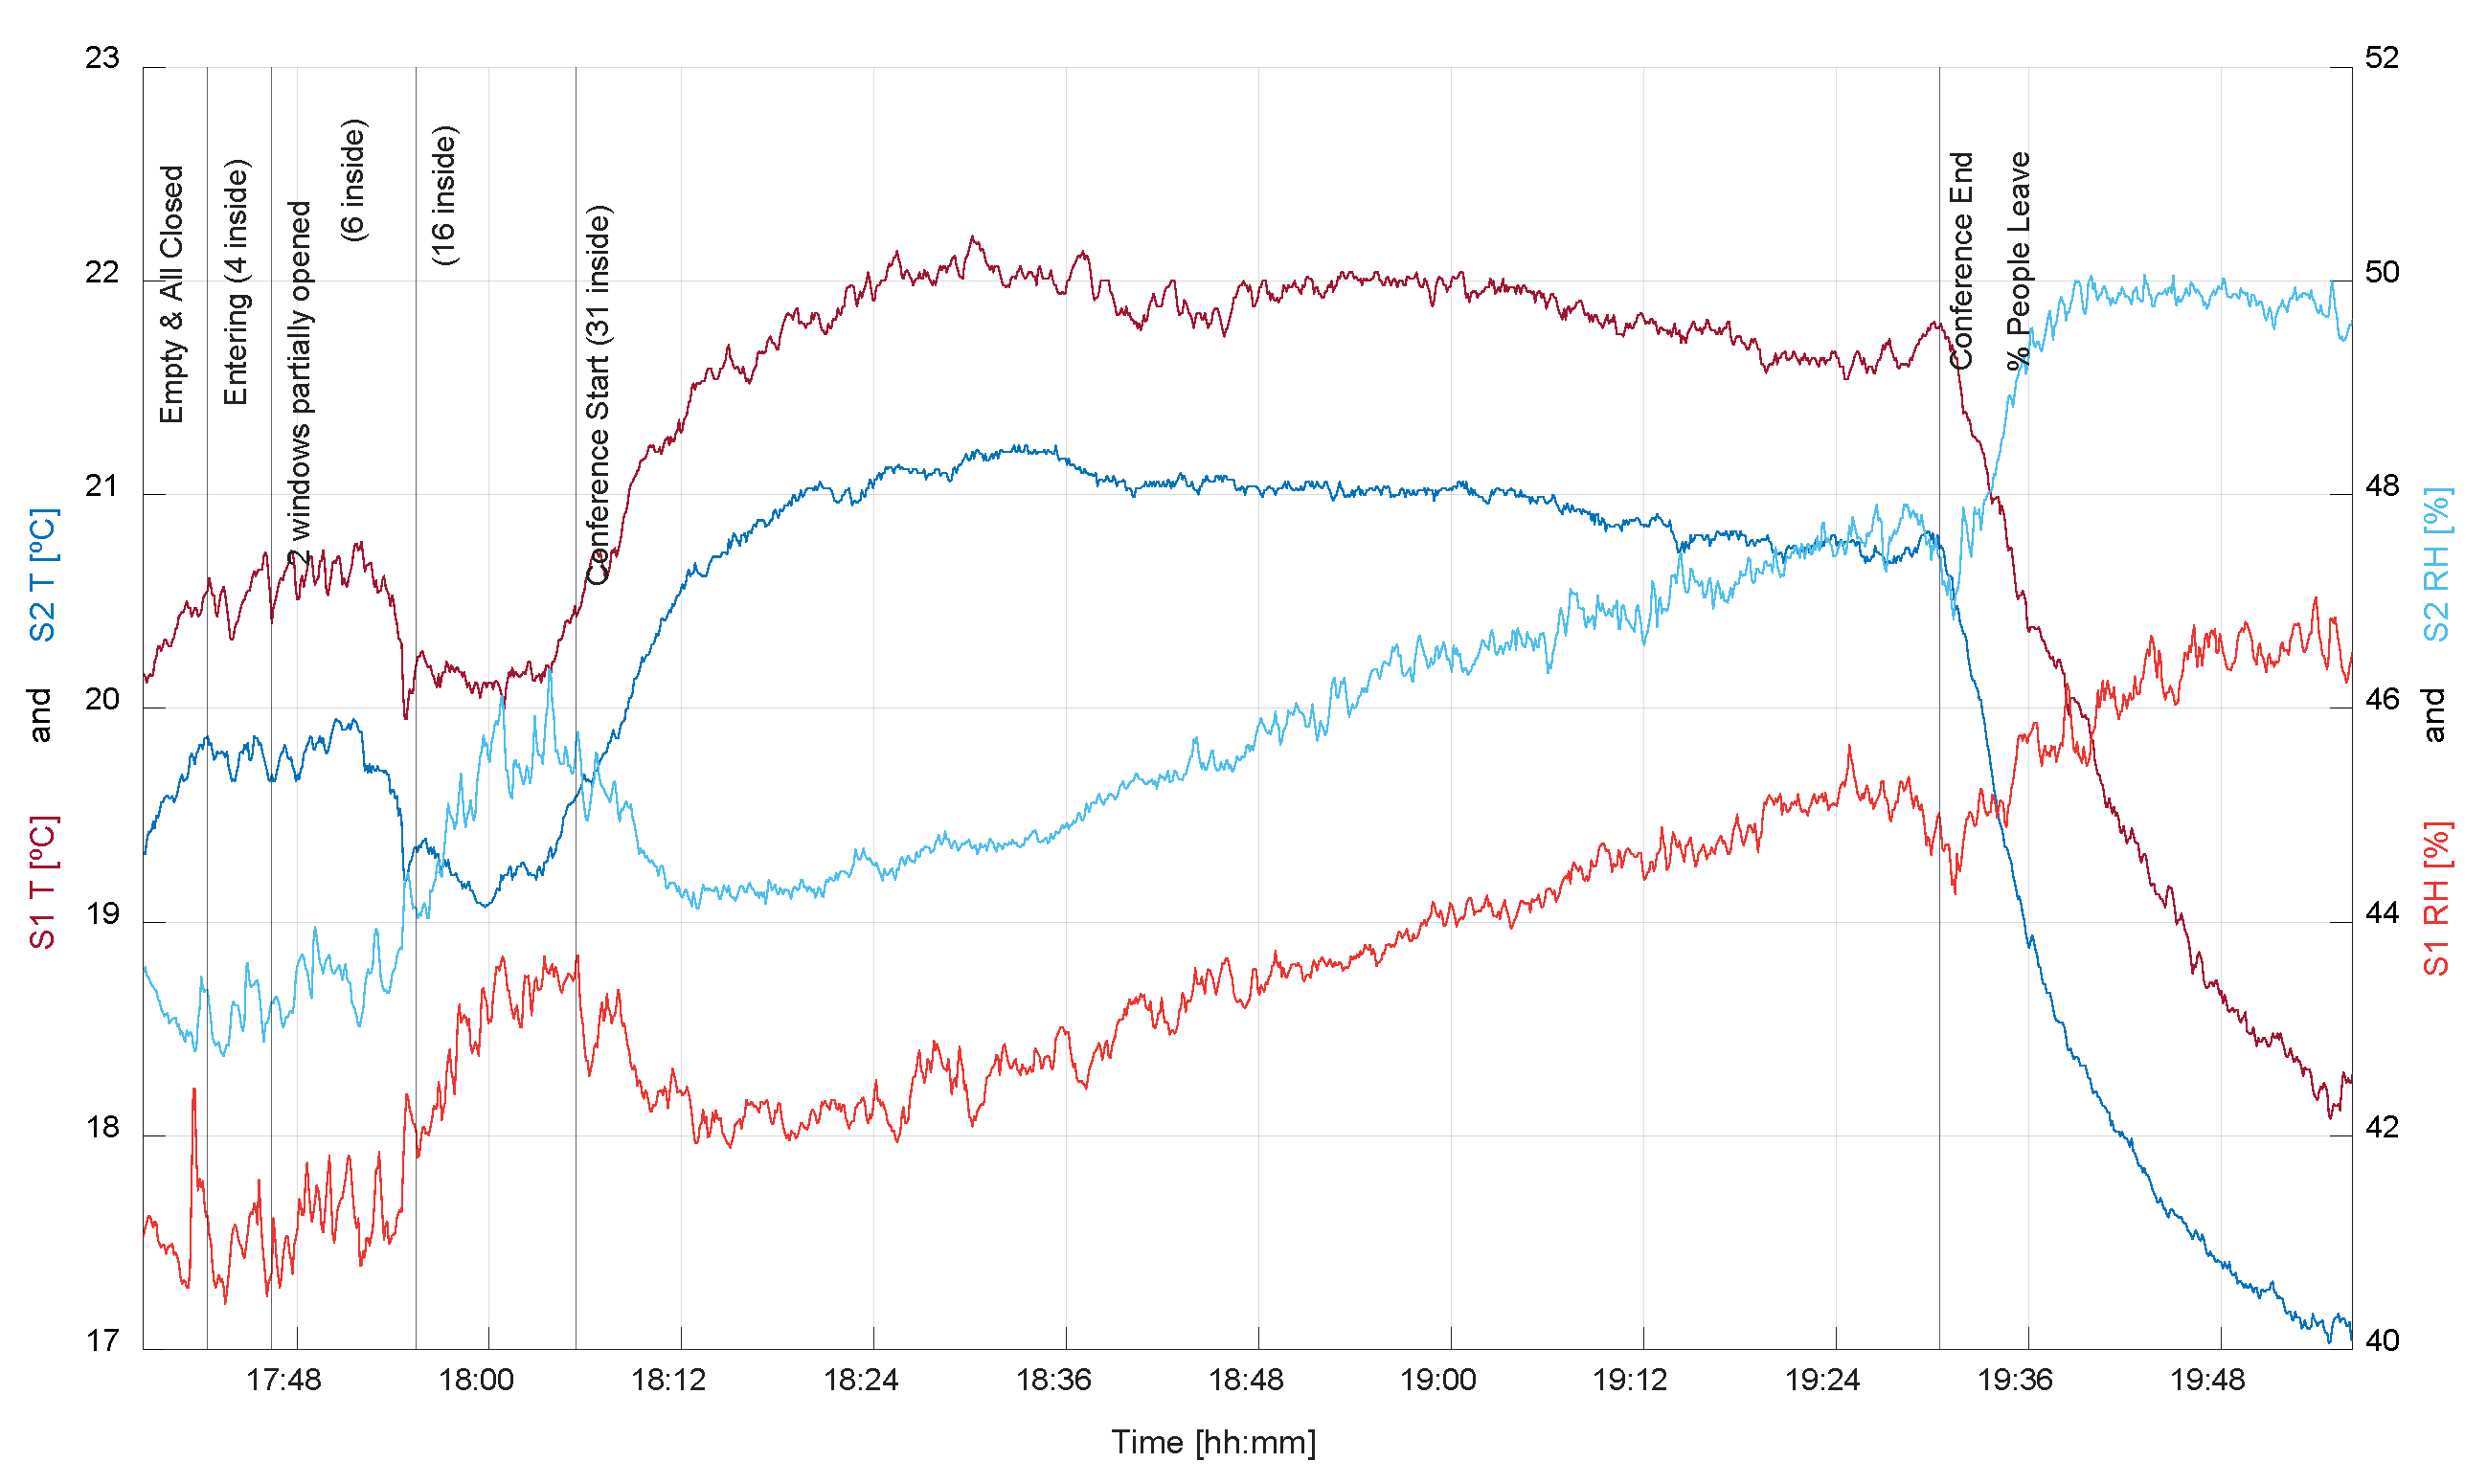
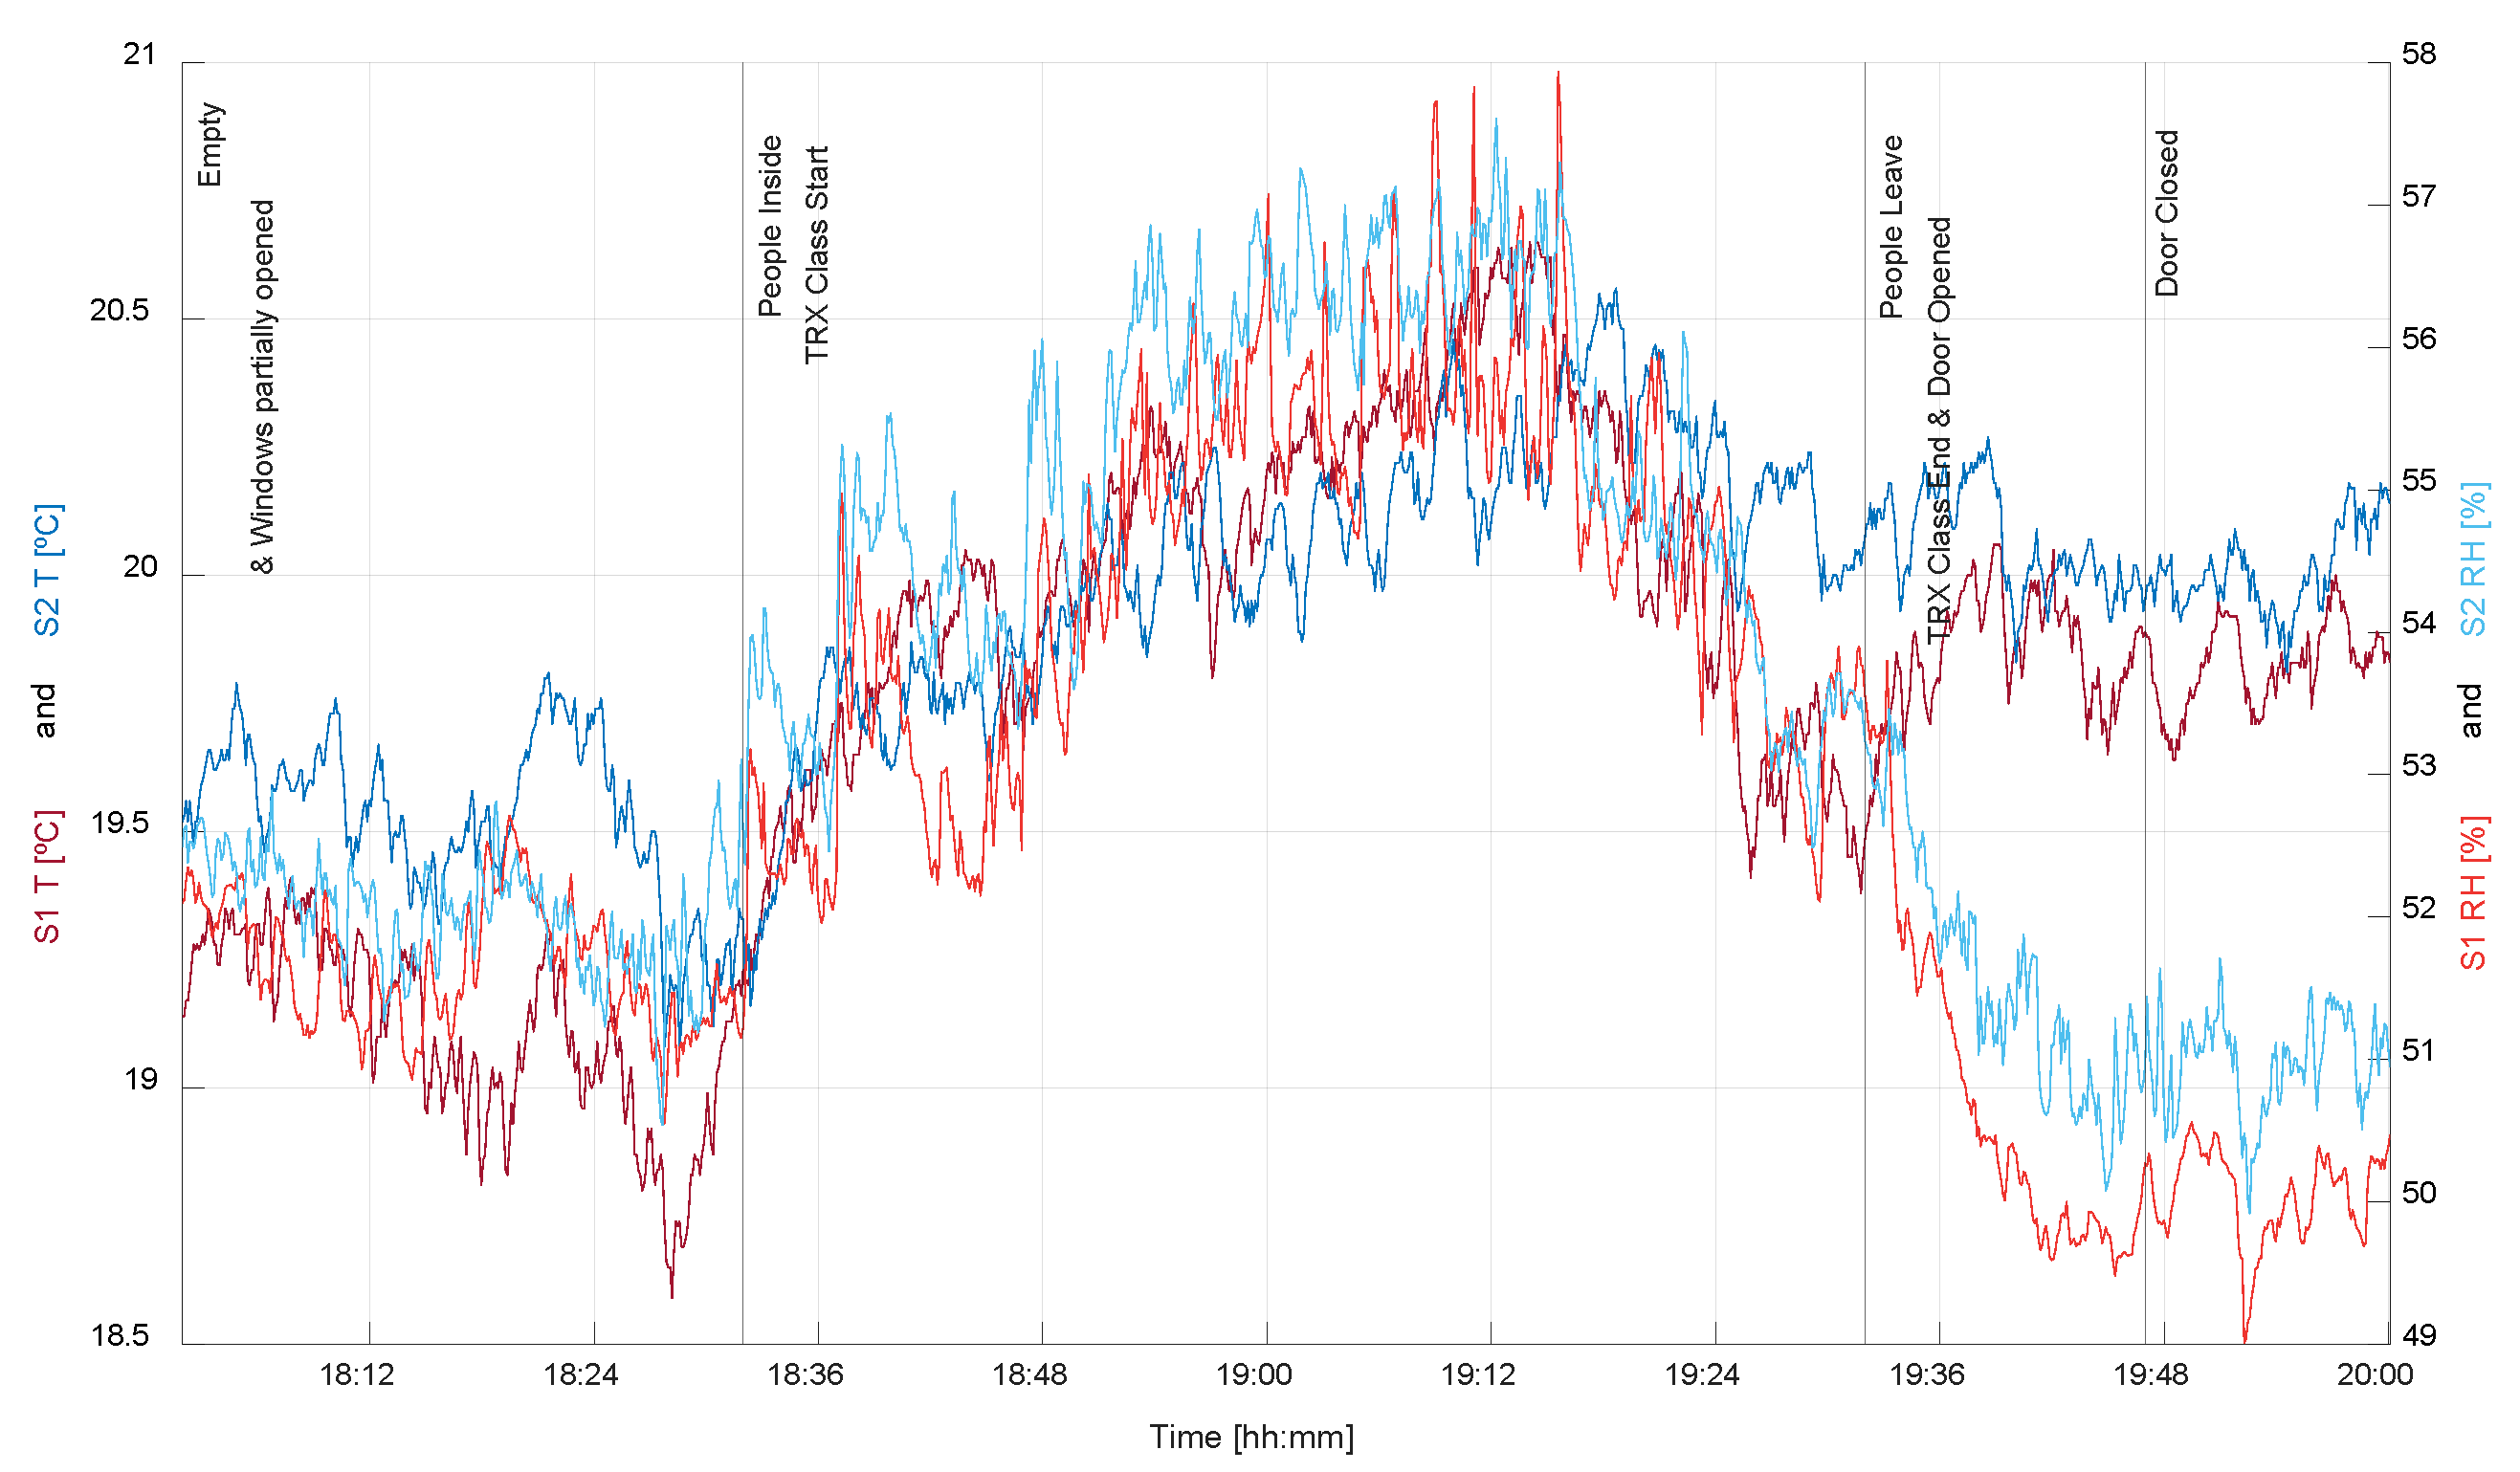
Figure 16 shows the T and RH inside the conference room. Once the measurement started, the door was closed, and for 4 min, T1 increased from 20.1 °C to 20.6 °C, while T2 increased from 19.4 °C to 19.9 °C. RH1 slightly decreased from 43.6% to 43%, and RH2 remained stable at approximately 41%. It must be noted that T1 and RH2 remained above T2 and RH1, respectively, during the whole measurement. At this time, 4 more persons entered the area in 4 min. Then, 2 more persons entered, and 4 min after the two windows were partially opened, the temperature and relative humidity values were maintained. At the end of this interval, 5 min later, T1 decreased to 20 °C, while T2 decreased to 19.2 °C. RH1 increased to 42.4%, and RH2 increased to 44.4%. At this moment, 10 more persons entered the area, and in the next 10 min, T1 increased to 20.4 °C, while T2 increased to 19.6 °C. RH1 increased to 43.5%, and RH2 increased to 45.5%. Then, 15 more persons entered, and the conference started. During the following 1 h and 25 min, the conference continued to remain stable in terms of ventilation and people inside the area. After the first 15 min, T1 increased to 22.2 °C, while T2 increased to 21.2 °C. RH1 decreased to 42.3%, and RH2 decreased to 44.2%. However, by the end of this period, T1 decreased to 22.2 °C, while T2 decreased to 21.2 °C. RH1 increased to 45.4%, and RH2 increased to 47.9%. To finish the measurement, a return-to-calm stage was performed, and for 26 min after the conference had ended, the measurement continued as before regarding ventilation. In this interval, in which people quickly left, T1 decreased to 18.3 °C, while T2 decreased to 17.1 °C. RH1 increased to 46.3%, and RH2 increased to 49.6%.
Figure 17 shows the PM2.5, PM10, PM20, Da and MMAD inside the conference room. It should be mentioned that PM2.5 was maintained without notable variation between 1.6 μg/m3 and 5 μg/m3 during all the measurements. Once the measurement started, the door was closed for 4 min. At this time, 4 more persons entered the area in 4 min. Then, 2 more persons entered, and 4 min after the two windows were partially opened, PM20 increased from 12 μg/m3 to 21 μg/m3. Moreover, Da decreased from 0.75 μm to 0.90 μm. At the end of this interval, 5 min later, PM20 increased to 32.5 μg/m3. Moreover, Da decreased to 0.81 μm. At this moment, 10 more persons entered the area, and in the next 10 min, PM20 first increased to 43 μg/m3 and then decreased to 41 μg/m3. Moreover, Da increased to 0.85 μm. Then, 15 more persons entered, and the conference started. During the following 1 h and 25 min, the conference remained stable in terms of ventilation and people inside the area. PM20 decreased to 18.5 μg/m3 in 15 min, and Da first increased to 0.86 μm and then decreased to 0.84 μm. It was noted that particles with sizes greater than 10 μm almost disappeared at this moment. During the rest of the interval, Da continued to slowly decrease to 0.76 μm. In contrast, PM20 stabilized at approximately 11 μg/m3 before it increased to 17 μg/m3 at the end of the stage. To finish the measurement, a return to the calm stage was performed, and for 26 min after the conference had ended, the measurement continued as before regarding ventilation. In this interval, in which people quickly left, PM20 first in-creased to 19 μg/m3 and then decreased to 10 μg/m3 before finally reaching a 12 μg/m3 reading value. Da only once decreased to 0.69 μm and then increased to 0.74 μm at the end.

3.6. Mendizorroza Sports Facilities—Training Room

Figure 18 shows the carbon dioxide and particle number concentrations inside the training room. Half an hour before starting the measurement, the door was closed, and the windows were partially opened while one person was inside the area setting up the instrumentation for the measurement. During the measurement, the carbon dioxide lev-el at S1 generally stayed above the S2 level before the activity. However, during the activity and until the end of the measurement, this tendency switched with the S2 level remaining above the S1 level. During the whole measurement, PNC varied between a 10 particles/cm3 and 13 particles/cm3 without notable variation. The air-conditioning system was switched on during the measurement. Once the measurement started, the door kept opening and closing each time people entered the room, and the carbon dioxide concentration at S1 oscillated in this 30 min interval from 592 ppm to 556 ppm; it first increased to 595 ppm, then decreased to 541 ppm and finally reached 582 ppm. Moreover, S2 remained stable at approximately 580 ppm for the first half of this period, after which it first increased to 600 ppm, then decreased to 543 ppm and finally reached 581 ppm. At this time, the training class started, and for the following 60 min, the room remained stable in terms of ventilation and the number of people inside the area. The dioxide carbon levels at S1 and S2 increased to 608 ppm for the first 6 min of warm-up, the S1 and S2 levels then increased to 675 ppm 6 min later, and the S1 level oscillated between 686 ppm and 830 ppm over the next 36 min and during the medium-intensity exercises and pauses before stretching. At the final 12 min stage, it decreased to 700 ppm. Moreover, the S2 level oscillated between 656 ppm and 817 ppm before returning to 700 ppm at the end of this interval. At this moment, the class ended, the door was opened, and people left. During the following 15 min, S1 and S2 decreased to 575 ppm. To finish the measurement, a back-to-calm stage was performed, and for 15 min, the door was closed, and S1 again decreased to 550 ppm, while S2 decreased to 540 ppm. Note that the carbon dioxide maximum level recommended by the Sinphonie guidelines was not reached.
Figure 19 shows the T and RH inside the training room. During the measurement, the T2 level generally stayed above the T1 level before starting the activity. However, during the medium-intensity activity part of the class, this tendency switched, with the T1 level staying above the T2 level. At the stretching stage and until the end of the measurement, the T2 level remained above the T1 level. Regarding the relative humidity, RH2 remained above or at least matched RH1 during the whole measurement. Therefore, only T1 and RH2 values are detailed. Once the measurement started, the door kept opening and closing each time people entered the room, and T1 decreased from 19.7 °C to 18.6 °C and finally increased to 19.2 °C. RH2 decreased from 52.4% to 50.6% to 52.3%. At this time, the training class started, and for the following 60 min, the room remained stable in terms of ventilation and the number of people inside the area. T1 increased to 20.6 °C and then decreased to 19.4 °C. RH2 increased to 57.6% and then decreased to 53.2%. At this moment, the class ended, the door was opened, and people left; during the following 15 min, T1 increased to 19.9 °C. RH2 first increased to 57.6% and then decreased to 50.1%. To finish the measurement, a back-to-calm stage was performed, and for 15 min, the door was closed, and T1 and RH2 returned to the previous values of 19.9 °C and 50.1%, respectively, at the end of the measurement.
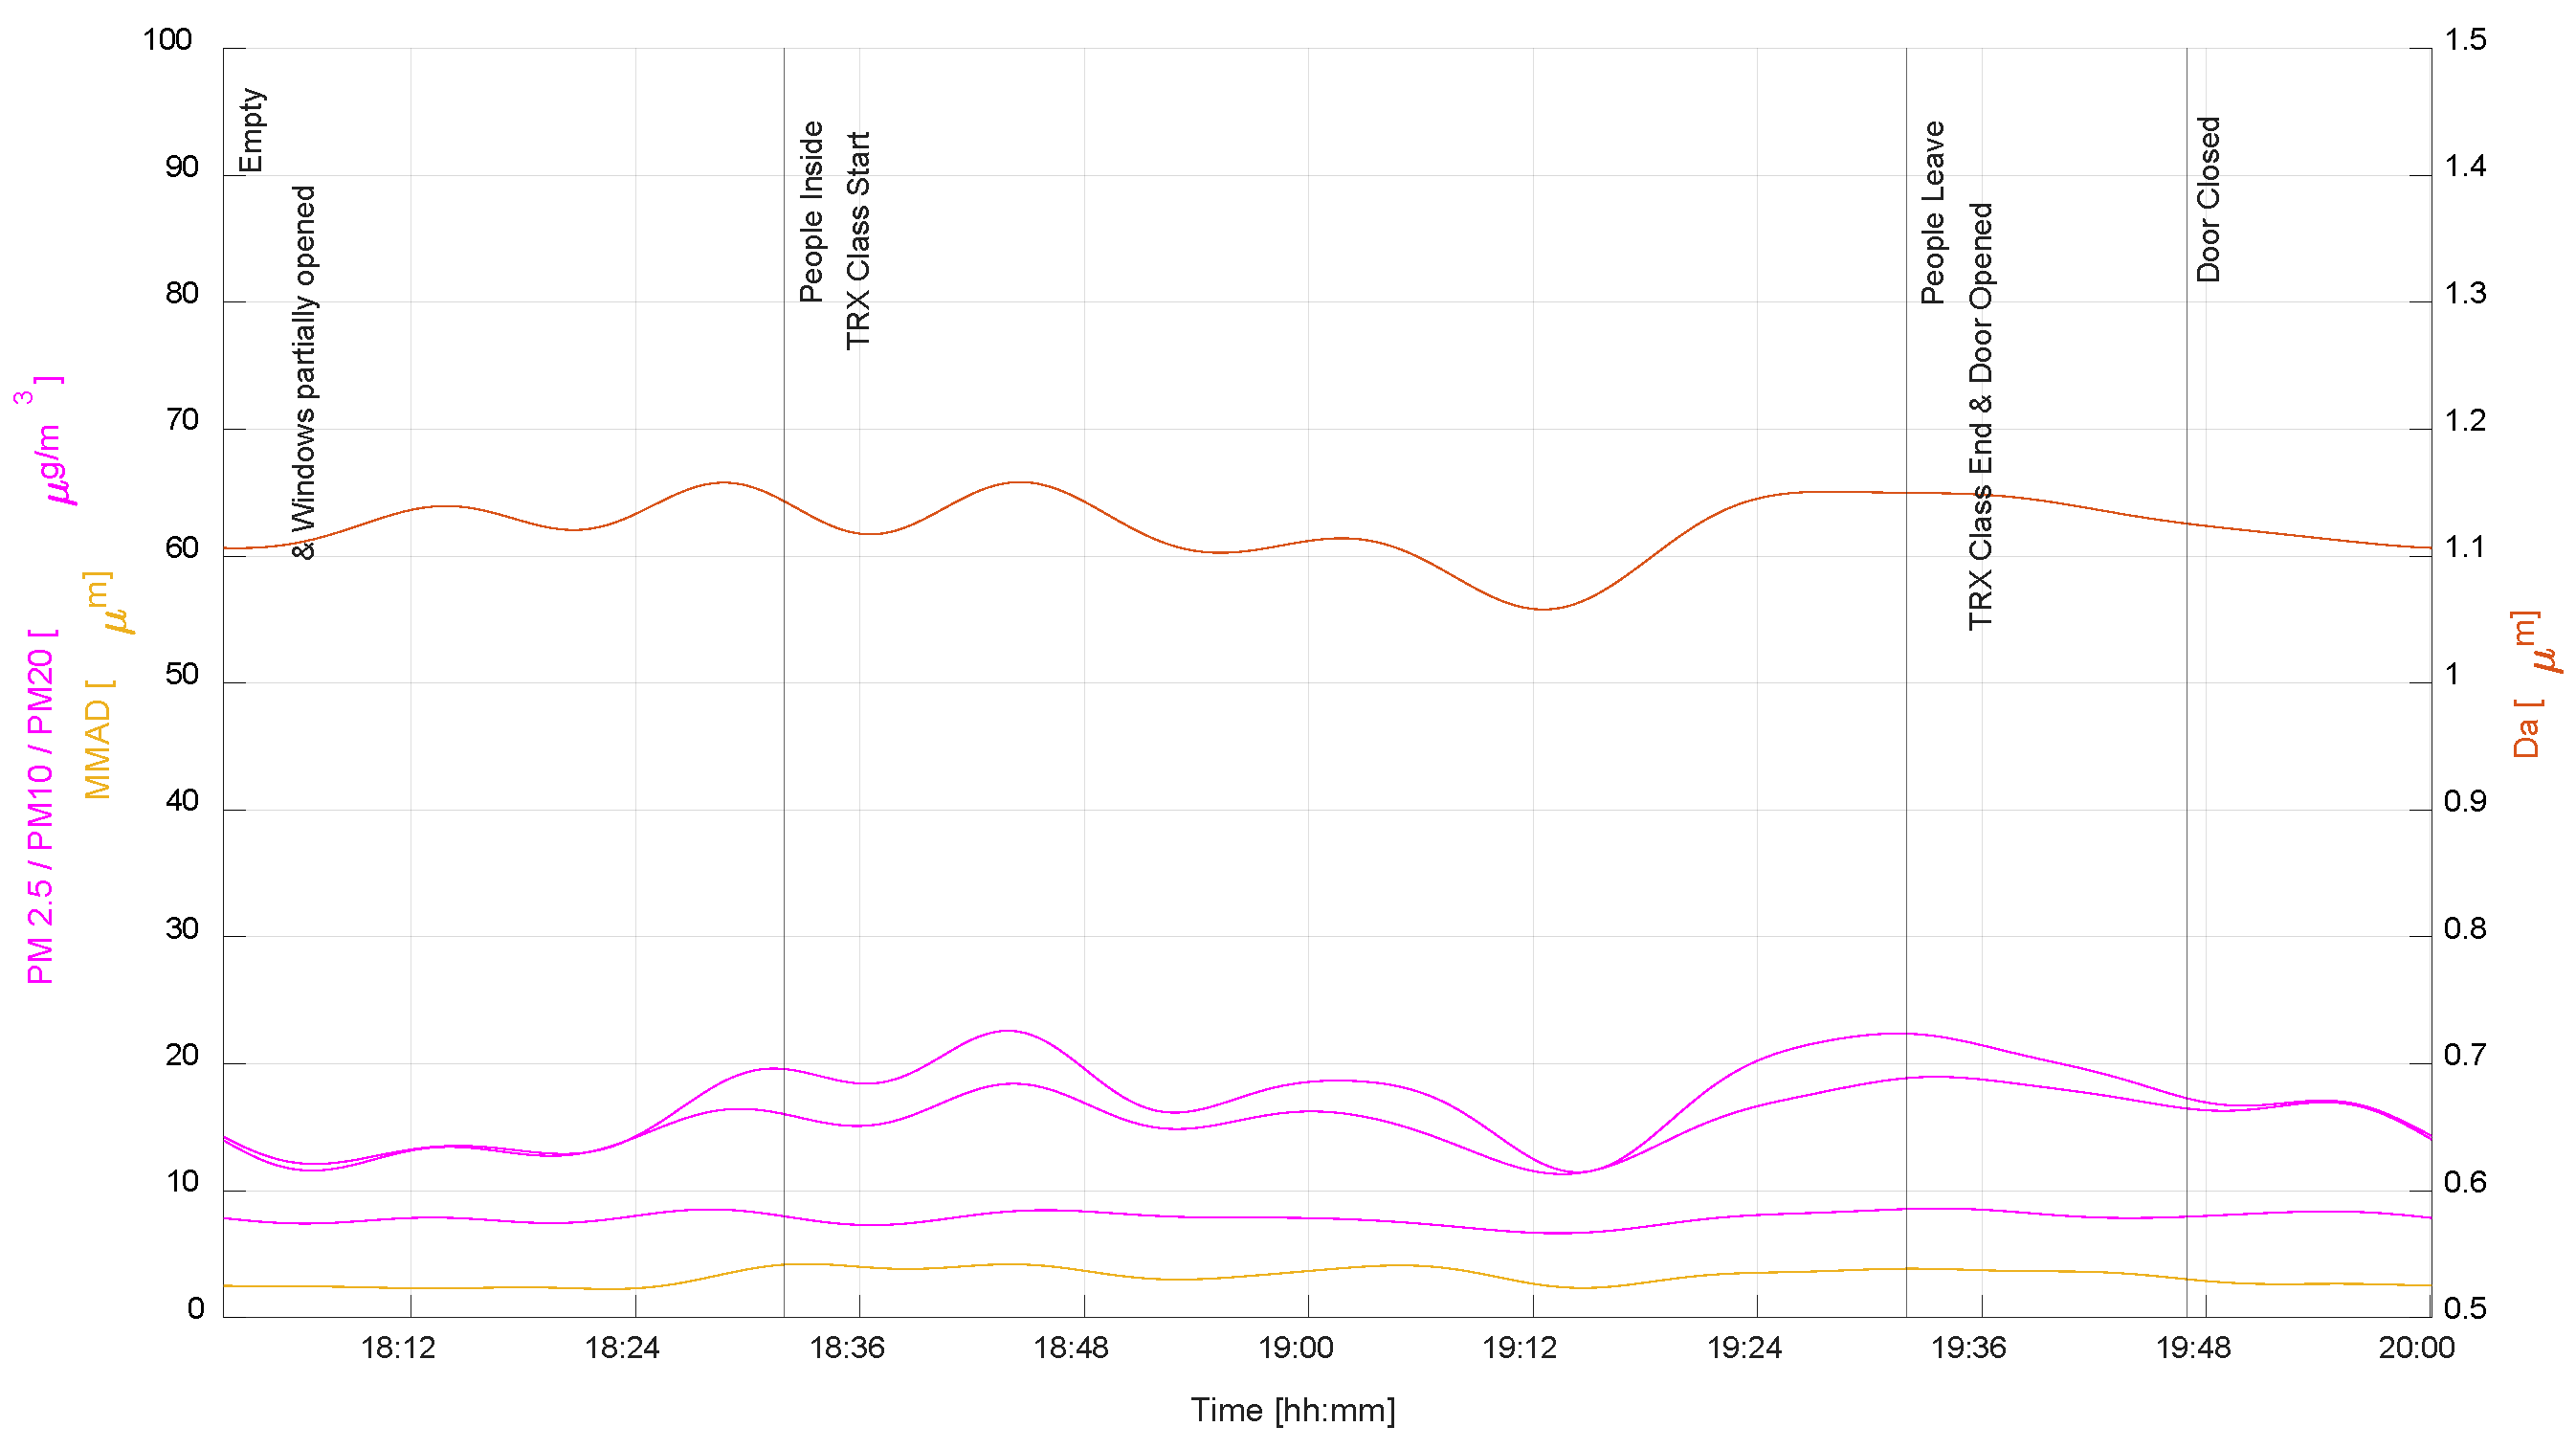
Figure 20 shows the PM2.5, PM10, PM20, Da and MMAD inside the training room. It should be mentioned that PM2.5 was maintained between 6.6 μg/m3 and 8.6 μg/m3 without notable variation during the entire measurement period. Once the measurement started, the door kept opening and closing each time people entered the room, and PM20 increased from 14 μg/m3 to 20 μg/m3. Da increased from 1.10 μm to 1.15 μm. Six minutes before the end of the interval, almost no particles with sizes greater than 10 μm were present. At this time, the training class started, and for the following 60 min, the room remained stable in terms of ventilation and the number of people inside the area. PM20 first increased to 22.6 μg/m3 and then decreased to 11.5 μg/m3 20 min before the end of the stage, and then it again increased to 22.4 μg/m3. Da decreased to 1.06 μm 20 min before the end of the stage and then increased to 1.15 μm at the end of the stage. It must also be mentioned that at 20 min before the end of the stage, the valley points of both PM20 and Da coincided with an absence of particles with sizes greater than 10 μm. At this moment, the class ended, the door was opened, and people left. During the following 15 min, PM20 decreased to 17.4 μg/m3, and Da decreased to 1.13 μm. To finish the measurement, a return-to-calm stage was performed, and for 15 min, as the door remained closed, PM20 decreased to 14.5 μg/m3, and Da decreased to 1.10 μm.

3.7. Mendizorroza Sports Facilities—Spinning Room

Figure 21 shows the carbon dioxide and particle number concentrations inside the spinning room. Half an hour before starting the measurement, the door was opened and the windows were closed while one person was inside the area setting up the instrumentation for the measurement. During the measurement, the carbon dioxide level at S2 generally stayed above that at S1, but this tendency switched, with that at S1 staying above the S2 level when people left at the last stage of the measurement. Moreover, PNC varied between 10 particles/cm3 and 13 particles/cm3 without notable variation before a window was partially opened. Then, PNC gradually increased to 27 particles/cm3 until the end of the class, and then it smoothly decreased to 22 particles/cm3. Air conditioning was applied during the measurement, and the door was kept open. Once the measurement started, people gradually entered the room until the class started, and the carbon dioxide concentration at S1 increased in this 41 min interval from 309 ppm to 1161 ppm. Moreover, the S2 level increased from 618 ppm to 1229 ppm in this 41 min interval. Both S1 and S2 were above 1000 ppm, the maximum level recommended by the Sinphonie guidelines before the class started. At this time, the training class started, and during the following 41 min, the room remained stable in terms of ventilation and the number of people inside the area. However, during the 18-min period after the window was partially opened, the carbon dioxide level at S1 varied between 1176 ppm and 1493 ppm during the high-intensity exercise period. Moreover, S2 also oscillated but varied between 1176 ppm and 1468 ppm. At this moment, the class ended, and stretching occurred during the following 13 min. S1 and S2 decreased to 959 ppm and 995 ppm, respectively. To finish the measurement, a back-to-calm stage was performed, and within 35 min, S1 decreased to 714 ppm, while S2 decreased to 704 ppm.
Figure 22 shows the T and RH inside the spinning room. Before starting the activity, the T2 level generally stayed slightly above the T1 level. However, during the high-intensity activity part of the class, this tendency switched, with that at T1 staying above the T2 level. This effect was more notable just after the window was opened and until the end of the measurement. Regarding the relative humidity, RH2 was above or at least matched RH1 before the window was opened. Once the measurement started, people gradually entered the room until the class started. T1 and T2 increased from 19.9 °C to 20.8 °C. RH1 increased from 59% to 59.2%, and RH2 increased from 59% to 59.5%. At this time, the training class started, and during the following 41 min, the room remained stable in terms of ventilation and the number of people inside the area. However, during the 18-min period after the window was partially opened, T1 increased to 20.9 °C when the window was opened and then decreased to 20 °C to finally reach 21 °C, while T2 also increased to 20.9 °C when the window was opened and then decreased to 20.6 °C to finally reach 21.4 °C. RH1 and RH2 increased to 65% when the window was opened and then again to 70%. At this moment, the class ended, and stretching occurred over the next 13 min. T1 increased to 21.4 °C, ending at 20.9 °C, and T2 increased to 21.7 °C, ending at 21.4 °C. Moreover, RH1 increased to 74.5%, ending at 73.2%, and RH2 increased to 73.3%, ending at 73%. To finish the measurement, a back-to-calm stage was performed, and within 35 min, T1 decreased to 20.5 °C and T2 increased to 20.7 °C. During this period, RH1 decreased to 68%, and RH2 decreased to 67.4%.
Figure 23 shows the PM2.5, PM10, PM20, Da and MMAD inside the spinning room. It should be mentioned that both PM2.5 and Da did not notably vary until the class ended. At the end of the class, stretching occurred for the following 13 min, and PM20 increased from 13 µg/m3 to 29 µg/m3 and then decreased to 18 µg/m3. Da first increased from 0.96 µm to 0.98 µm and then decreased to 0.93 µm. To finish the measurement, a return-to-calm stage occurred, and within 35 min, PM20 decreased to 8 µg/m3. Moreover, Da decreased to 1.15 µm.

4. Discussion and Measurement Comparison

In this section, the current study is compared to that performed by Chillon et al. [37]. Similar instrumentation was used, and the obtained results are compared to those obtained in their measurement study in which a classroom with natural ventilation was investigated during a class with students. In both studies, the layout of the classroom was similar in terms of dimensions, system and areas of ventilation, location of windows and doors, number of persons in the classroom, mask-wearing pattern and presence of university students of the same age range. A similar method of ventilation was followed in both studies. The steps included all windows and doors closed, only windows opened, all windows and doors closed, windows and doors opened, and all windows and doors closed at the end of the measurement. Note that in the current study, an extra cycle, consisting of only opened doors followed by all windows and doors closed until the end, was performed. While Chillon et al. [37] used a classroom with a surface area of 91.8 m2, a height of 2.64 m and a volume equal to 242 m3, the current study occurred in a classroom with a surface area of 57.2 m2, a height of 4 m and an inside volume of 229 m3. Their ventilation area on the window side was 4.83 m2, and the value was 3.12 m2 for the doors, with a total ventilation area of 7.95 m2. In the current study, the window ventilation area was 4.2 m2, the door ventilation area was 3.4 m2, and the total ventilation area was therefore 7.5 m2. The current study occurred in a classroom with a 62% smaller surface area but only a 6% smaller volume. At the same time, the total ventilation area was 5% smaller, 14% smaller for the windows and 8% larger for the doors. In contrast, the same number of 15 people wearing masks in the classroom during both measurements suggests a similar volume level of human inhalation and exhalation. This also indicates very similar source levels of CO2 during the measurements. Regarding the outside conditions, their measurement occurred at 6 °C with a 79% relative humidity, while the current measurement was performed in a 2 °C to 5 °C temperature range and a 97% to 90% relative humidity range.
In terms of the PM2.5 and particle concentrations, significant differences are observed between both studies. In Chillon et al. [37], PM2.5 ranged from 2.5 to 3.7 µg/m3, and the particle concentration ranged from 6 to 11.5 particles/cm3. However, in the current study, PM2.5 ranged from 8 to 12 µg/m3, and the particle concentration ranged from 34 to 88 particles/cm3. Notably, the current study measured three times more PM2.5 and approximately seven times more particles in the classroom air. Both studies revealed similar effects regarding the closed and ventilation stages. At the all-closed stage, there was an increase in both the PM2.5 and particle concentrations, while there was a decrease at the ventilation stages and under the scenarios with only the windows opened or with both the windows and doors opened. Regarding the CO2 levels, the opposed behavior to that of the PM2.5 and particle concentrations during the all-closed and ventilation events was observed in both studies. Eventually, a similar level of increase in the carbon dioxide concentration per minute was observed in both studies and at the all-closed stage. However, in their study, a maximum level of 1140 ppm was reached, while a maximum of 1027 ppm was reached in the current study. Thus, the same linear trend of the increment in the carbon dioxide level at the all-closed stage could be determined.
The current study revealed a linear increment of 16.4 ppm/min at the first all-closed stage and a 17.2 ppm/min increment at the second stage (Figure 3). These values are similar to those obtained by Chillon et al. [37], at 18.1 ppm/min and 16.2 ppm/min, respectively. Note that the carbon dioxide level also exhibited a very similar asymptotic behavior at both the only windows opened and windows plus door opened stages in both studies. However, the asymptotic value of the carbon dioxide level differed between the studies. This depends not only on the initial level of carbon dioxide at the start of the measurements, which is 700 ppm in the current study and 904 ppm in their study, but also depends on the duration of each of the ventilation stages. Note that the duration of each stage is different. In the work of Chillon et al. [37], the first all-closed stage lasted 13 min, the second stage with only the windows opened lasted 27 min, the third stage with all the windows and doors closed lasted 33 min, and the fourth stage with the windows and doors opened lasted 17 min, for a total of 90 min. In the current study, the durations of the same four stages were 20 min, 16 min, 20 min and 12 min, respectively, for a total time of 68 min.
This study is based on experimentally measured environments monitoring what is produced in different activities of different intensity levels, with different volume ratios per person and with different ventilations to obtain a sample and appreciate the effectiveness of the ventilations carried out. The monitoring time was established based on the duration of the activities and the epicenter of these measurements to monitor what we have tried to define here as the period of return to calm after the end of the activity with the space empty of people. In these measurements, the duration of the activities was greater than 45 min and less than 2 h. Typically, due to the pandemic, air renewal with the outside is carried out through natural ventilation prior to and after the activities. In addition, it is expected that these good practices will continue in the future. Therefore, it is useful to make them part of the study, measuring as they are produced, without altering their state or their initial and final conditions. At the same time, it has been observed when opening windows that the transient states regarding the carbon dioxide measurements last less than 45 min or 30 min, and in some cases even less time. We have also observed that the transient state in all-closed scenarios can take longer to become stationary, i.e., measurement 3.4, where the stationary state was established after approximately 60 min.
An overall effect regarding the height of the carbon dioxide sensors is observed. It indicates that measured values of CO2 concentrations are almost equal when the sensors are at the same height, namely, for measurements l and 2. For the rest of the measurements, the difference in height of the location of the used couple of sensors is a constant value for each measurement, since they are fixed during the measurements, and its value stays between 0.45 m and 0.75 m. However, typically the difference in their measures is not constant. The only notorious cases when it is constant is for the low-intensity scenario captured during measurements 4 and 5, when the sensor located at 1.1 m height measures higher concentrations of CO2 compared to the sensor located at 0.6 m height. These measurements were performed with people sitting on chairs; therefore, the 1.1 m height sensor presented 100–150 ppm higher dioxide carbon concentration level than the one located at 0.6 m height. These particular cases are low-intensity activities and individuals did not move during the measurements, resulting in a higher mouth height around 1.1 m. The rest of the measurements with different height locations of the sensors were measurements 3, 6 and 7. For measurement 3, with low-medium intensity, due mainly to the movement of the children, some parents standing up and sitting down in order to get them back, there is no constant pattern for the difference in the captures of both sensors. However, the sensor at 1.3 m presented around 100 ppm higher level than the one located at 0.7 m, which could be due to the movement of the children, who were rarely taller than 1.4 m. For measurement 6, with medium-intensity, due to the activity requiring movements below 1 m height, such as lying down and squatted positions for some exercises, there is no constant pattern in the difference, but the sensor at 1 m height from the floor captured values around 50 ppm higher than the other sensor. For measurement 7, with high-intensity and people sitting on bikes and with their mouths typically above 1.75 m, a higher concentration level of around 100 ppm was presented by the sensor located at 1.75 m height in comparison with the one located at 1.25 m.
As a consequence of the type of ventilation investigated, measurements 3, 6 and 7 were excluded from the comparison for different reasons. In addition, it should be mentioned that various ventilation methods differ in energy consumption. HRV and ERV systems save energy by preconditioning air, while DCV adjusts based on needs. PV integration can further reduce reliance on traditional energy sources, as studied by Kalmár et al. [38]. Table 4 presents the data with the differences from this work highlighted. During measurements 6 and 7, air conditioning was applied, and they involved activities not of the low-intensity type. In measurement 3, no all-closed stage occurred, and it did not involve low-intensity activities. Measurement 2 occurred in an almost empty room (one person inside) and contained one all-closed stage.
Measurements 4 and 5 revealed nonlinear behavior at the all-closed stage, as presented in Table 4. This should be further investigated in regard to enclosed spaces without ventilation to maintain the CO2 concentration below the recommended level to prevent the risk of transmission.
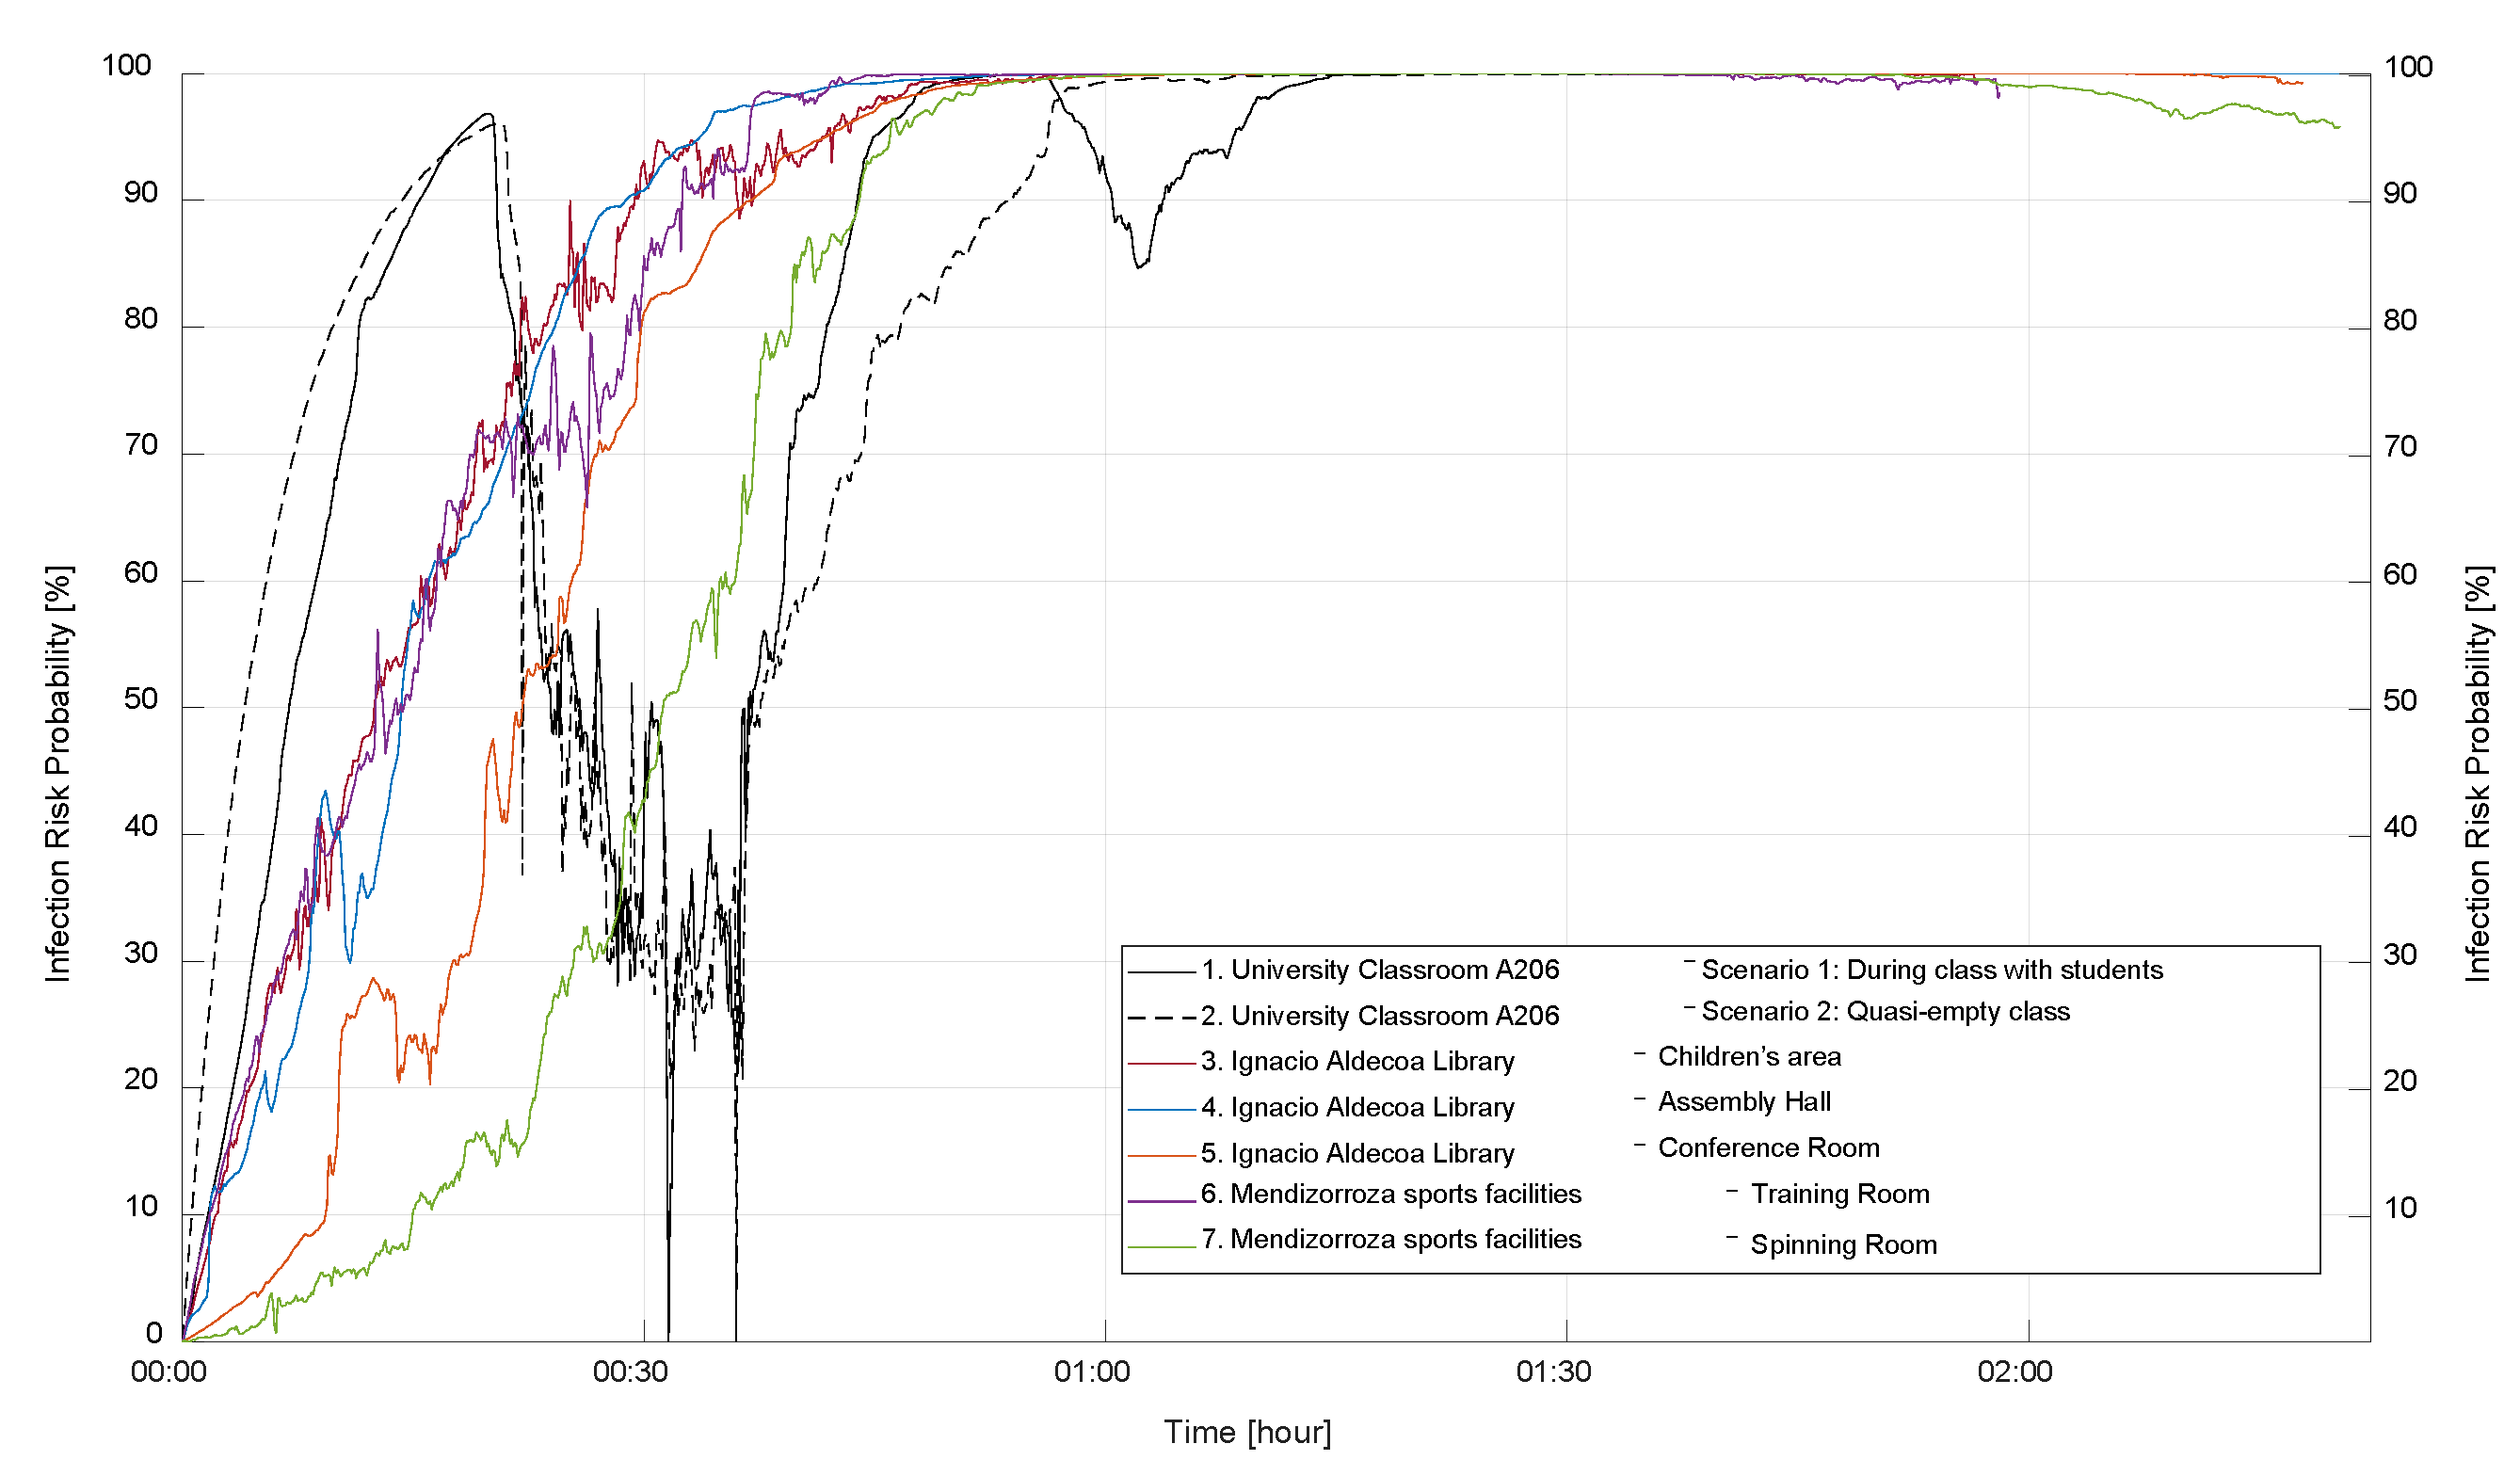
According to extensive literature on the issue of airborne virus transmission, the probability of infection risk is investigated and usually represented by the well-known Wells–Riley model [39,40,41]. Figure 24 shows the corresponding probability of infection risk for all the measurements obtained in this work. The expression used to represent probability of infection risk (P) is the following Equation (1):
P = 1 e ( q · Y · t )
where q is the quanta generation rate (1/h) and in this case is 10, a value fixed by the referenced works [39,40,41]. Y is the passive scalar, maximum and minimum levels of CO2, and t is the exposure time (h).
Figure 24 shows a direct relationship between high levels of carbon dioxide and the probability of infection risk. There is a difference in how quickly this increase occurs, as a consequence of the relationship between the situations when the level of CO2 increases and how quickly this occurs for each measurement. From measurements 1 and 2, there is a reduction in the probability of infection risk when ventilation scenario occurs. However, this effect did not take place for the rest of the measurements. This means that the probability of infection risk after a long period of no ventilation or once it reaches the maximum value barely presents any reduction.

5. Conclusions

In the current study, the temperature, relative humidity, carbon dioxide concentration and particle size cumulative concentration and their relationships were investigated in several enclosed spaces used for activities with low to high intensities under natural ventilation conditions, with air conditioning employed during medium- and high-intensity activities, and with people wearing surgical masks. After assessing the acquired data during these experiments, several conclusions could be obtained, as follows:
  • Drastic decreases in the CO2 concentration are observed within a few minutes of ventilation after no-ventilation intervals. This leads to a drop in temperature that is always associated with an increase in relative humidity.
  • The no-ventilation scenario with people inside the enclosed space forces the carbon dioxide concentration to linearly increase for the first 20 min.
  • In the case of the interior building environment containing a lower particulate matter concentration than that in the outside environment, the natural ventilation strategy simultaneously combining windows and doors more quickly increases the particulate matter concentration in the enclosed space over the strategy involving only windows.
  • When the sensors are at the same height, the measured carbon dioxide values are almost equal. The only notorious case is when the sensor located at 0.6 m measures higher concentrations of CO2 in low intensity scenarios compared to the sensor located at 1.1 m height. The rest of the measurements present higher level of concentration for the sensor being at the height of the mouth of the individuals. Therefore, sensors must be properly situated and approximately at the height where the mouths of the individuals are expected to be. Including sensors at different heights has shown to be efficient in corroborating this effect.
  • Medium- and high-intensity activities do not show a notable difference due to the excessive movement of air produced by air conditioning and movement of people, as reported by Bhagat et al. [28]. Further measurements should be made in order to clarify the effects of high-intensity activities with the help of more sensors and repeating the activity, e.g., with air conditioning on and off. Moreover, other ventilation systems could be studied to compare them, even filtering, but cost of these systems cannot be afforded for typical buildings as schools, libraries or gyms.
  • The less the pollutants, the shorter the time required to get rid of them. Therefore, designing a building in advance with proper location of the windows, doors and other overtures on the enclosed spaces preventing the entrance of pollutants from the outside is shown as the most effective way of reducing such pollutants.
  • Measurement 6, located in the training room, indicated a difference from the rest of the enclosed-space measurements in this study. Notably, another room was present on the other side of the windows, whereas the outside environment applied among the rest of the measurement spaces. This particularity, which isolated the indoor ambient and outdoor environments, prevented particulate matter from entering the enclosed space where the activity occurred, maintaining a stable and low level even with the windows or both the windows and doors opened.
  • Designing buildings with an air chamber between windows and the outdoors would be an efficient strategy to reduce PM concentrations, e.g., having an external crystal envelope around it, as presented in in results of measurement 6 and in the 2D drawing included in the Supplementary Material of the current article. It must be clarified that in this case, there is a crystal curtain in front of the windows, which is only connected to the building by structural beams at each floor and to the top roof by a hermetic metallic-crystal coverture that prevents from wind, rain and snow effects. Thus, this strategy is recommended to maintain adequate IAQ conditions.
  • Natural ventilation from window to window crossing the area of the enclosed space is presented as a very efficient way of reducing CO2 concentrations in a short period of time. Therefore, it is advisable to design a building providing enclosed spaces this capability in order to also maintain adequate IAQ conditions.
  • There is a relationship between high levels of carbon dioxide and the probability of infection risk. Moreover, the probability of infection risk after a long period of no ventilation or once it reaches the maximum value of 100% barely presents any reduction.

Supplementary Materials

The following supporting information can be downloaded at: https://www.mdpi.com/article/10.3390/buildings14041007/s1.

Author Contributions

Conceptualization, O.U.-G. and U.F.-G.; methodology, E.Z.; software, K.P.-P.; validation, O.U.-G., U.F.-G. and A.U.-A.; formal analysis, E.Z.; investigation, O.U.-G.; resources, U.F.-G.; data curation, A.U.-A.; writing—original draft preparation, O.U.-G.; writing—review and editing, O.U.-G.; supervision, U.F.-G.; project administration, U.F.-G.; funding acquisition, E.Z. All authors have read and agreed to the published version of the manuscript.

Funding

The authors are thankful to the government of the Basque Country for the financial support of the ELKARTEK21/10 KK-2021/00014 and ELKARTEK20/78 KK-2020/00114 research programs. U.F.-G. was supported by the Mobility Lab Foundation, a governmental organization of the Provincial Council of Araba and the local council of Vitoria-Gasteiz.

Data Availability Statement

All data generated or analyzed in this study are included in the published article and its Supplementary Information files.

Acknowledgments

The authors are grateful for the support provided by SGIker of UPV/EHU.

Conflicts of Interest

The authors declare no conflicts of interests.

References

  1. Hafner, C.M. The Spread of the COVID-19 Pandemic in Time and Space. Int. J. Environ. Res. Public Health 2020, 17, 3827. [Google Scholar] [CrossRef] [PubMed]
  2. Su, S.; Du, L.; Jiang, S. Learning from the past: Development of safe and effective COVID-19 vaccines. Nat. Rev. Microbiol. 2021, 19, 211–219. [Google Scholar] [CrossRef] [PubMed]
  3. Lopez Bernal, J.; Andrews, N.; Gower, C.; Gallagher, E.; Simmons, R.; Thelwall, S.; Stowe, J.; Tessier, E.; Groves, N.; Dabrera, G.; et al. Effectiveness of COVID-19 Vaccines against the B.1.617.2 (Delta) Variant. N. Engl. J. Med. 2021, 385, 585–594. [Google Scholar] [CrossRef] [PubMed]
  4. Kupferschmidt, K. Where did “weird” Omicron come from? Science 2021, 374, 1179. [Google Scholar] [CrossRef] [PubMed]
  5. Lyke, K.E.; Atmar, R.L.; Islas, C.D.; Posavad, C.M.; Szydlo, D.; PaulChourdhury, R.; Deming, M.E.; Eaton, A.; Jackson, L.A.; Branche, A.R.; et al. SARS-CoV-2 Omicron Neutralization after Heterologous Vaccine Boosting. medRxiv 2022. [Google Scholar] [CrossRef]
  6. Cameroni, E.; Bowen, J.E.; Rosen, L.E.; Saliba, C.; Zepeda, S.K.; Culap, K.; Pinto, D.; VanBlargan, L.A.; De Marco, A.; di Iulio, J.; et al. Broadly neutralizing antibodies overcome SARS-CoV-2 Omicron antigenic shift. Nature 2022, 602, 664–670. [Google Scholar] [CrossRef] [PubMed]
  7. Hasnain, M.; Pasha, M.F.; Ghani, I. Combined measures to control the COVID-19 pandemic in Wuhan, Hubei, China: A narrative review. J. Biosaf. Biosecurity 2020, 2, 51–57. [Google Scholar] [CrossRef] [PubMed]
  8. Schibuola, L.; Tambani, C. High energy efficiency ventilation to limit COVID-19 contagion in school environments. Energy Build. 2021, 240, 110882. [Google Scholar] [CrossRef] [PubMed]
  9. Shao, S.; Zhou, D.; He, R.; Li, J.; Zou, S.; Mallery, K.; Kumar, S.; Yang, S.; Hong, J. Risk assessment of airborne transmission of COVID-19 by asymptomatic individuals under different practical settings. J. Aerosol Sci. 2021, 151, 105661. [Google Scholar] [CrossRef]
  10. William, M.A.; Suárez-López, M.J.; Soutullo, S.; Fouad, M.; Hanafy, A.A.; El-Maghlany, W.M. Multi-objective integrated BES-CFD co-simulation approach towards pandemic proof buildings. Energy Rep. 2022, 8, 137–152. [Google Scholar] [CrossRef]
  11. Song, G.; Ai, Z.; Liu, Z.; Zhang, G. A systematic literature review on smart and personalized ventilation using CO2 concentration monitoring and control. Energy Rep. 2022, 8, 7523–7536. [Google Scholar] [CrossRef]
  12. Buonanno, G.; Stabile, L.; Morawska, L. Estimation of airborne viral emission: Quanta emission rate of SARS-CoV-2 for infection risk assessment. Environ. Int. 2020, 141, 105794. [Google Scholar] [CrossRef]
  13. Burgmann, S.; Janoske, U. Transmission and reduction of aerosols in classrooms using air purifier systems. Phys. Fluids 2021, 33, 033321. [Google Scholar] [CrossRef] [PubMed]
  14. Foster, A.; Kinzel, M. Estimating COVID-19 exposure in a classroom setting: A comparison between mathematical and numerical models. Phys. Fluids 2021, 33, 021904. [Google Scholar] [CrossRef] [PubMed]
  15. Wang, Z.; Galea, E.R.; Grandison, A.; Ewer, J.; Jia, F. A coupled Computational Fluid Dynamics and Wells-Riley model to predict COVID-19 infection probability for passengers on long-distance trains. Saf. Sci. 2022, 147, 105572. [Google Scholar] [CrossRef] [PubMed]
  16. Alcamí, A.; Val, M.D.; Hernán, M.; Latassa, P.; Jiménez, J.L.; Querol, X.; Robustillo, A.; Sánchez Moragas, G.; Valencia, A. Informe Científico Sobre vías de Transmisión SARS-CoV-2; Consejo Superior de Investigaciones Científicas (España): Madrid, Spain, 2020; p. 25. [Google Scholar]
  17. Zhang, R.; Li, Y.; Zhang, A.L.; Wang, Y.; Molina, M.J. Identifying airborne transmission as the dominant route for the spread of COVID-19. Proc. Natl. Acad. Sci. USA 2020, 117, 14857–14863. [Google Scholar] [CrossRef] [PubMed]
  18. Qian, H.; Miao, T.; Liu, L.; Zheng, X.; Luo, D.; Li, Y. Indoor transmission of SARS-CoV-2. Indoor Air 2021, 31, 639–645. [Google Scholar] [CrossRef]
  19. Bartyzel, J.; Zięba, D.; Nęcki, J.; Zimnoch, M. Assessment of Ventilation Efficiency in School Classrooms Based on Indoor–Outdoor Particulate Matter and Carbon Dioxide Measurements. Sustainability 2020, 12, 5600. [Google Scholar] [CrossRef]
  20. European Commission. SINPHONIE: Schools Indoor Pollution & Health Observatory Network in Europe: Final Report; Publications Office: Luxemburg, 2014. [Google Scholar] [CrossRef]
  21. Persily, A. Indoor Carbon Dioxide Concentrations in Ventilation and Indoor Air Quality Standards. In Proceedings of the 36th Air Infiltration and Ventilation Centre Conference, Madrid, Spain, 23–24 September 2015; Available online: https://tsapps.nist.gov/publication/get_pdf.cfm?pub_id=919027 (accessed on 22 December 2021).
  22. Hou, Y.; Liu, J.; Li, J. Investigation of Indoor Air Quality in Primary School Classrooms. Procedia Eng. 2015, 121, 830–837. [Google Scholar] [CrossRef]
  23. UNE-EN 16798-1:2020; Energy Performance of Buildings—Ventilation for Buildings—Part 1: Indoor Environmental Input Parameters for Design and Assessment of Energy Performance of Buildings Addressing Indoor Air Quality, Thermal Environment, Lighting and Acoustics. Asociación Española de Normalización y Certificación: Madrid, Spain, 2020.
  24. Morawska, L.; Tang, J.W.; Bahnfleth, W.; Bluyssen, P.M.; Boerstra, A.; Buonanno, G.; Cao, J.; Dancer, S.; Floto, A.; Franchimon, F.; et al. How can airborne transmission of COVID-19 indoors be minimised? Environ. Int. 2020, 142, 105832. [Google Scholar] [CrossRef]
  25. Pulimeno, M.; Piscitelli, P.; Colazzo, S.; Colao, A.; Miani, A. Indoor air quality at school and students’ performance: Recommendations of the UNESCO Chair on Health Education and Sustainable Development & the Italian Society of Environmental Medicine (SIMA). Health Promot. Perspect. 2020, 10, 169–174. [Google Scholar] [CrossRef] [PubMed]
  26. Dinh, T.-V.; Lee, J.-Y.; Ahn, J.-W.; Kim, J.-C. Development of a Wide-Range Non-Dispersive Infrared Analyzer for the Continuous Measurement of CO2 in Indoor Environments. Atmosphere 2020, 11, 1024. [Google Scholar] [CrossRef]
  27. To, G.N.S.; Chao, C.Y.H. Review and comparison between the Wells–Riley and dose-response approaches to risk assessment of infectious respiratory diseases. Indoor Air 2010, 20, 2–16. [Google Scholar] [CrossRef]
  28. Bhagat, R.K.; Wykes, M.S.D.; Dalziel, S.B.; Linden, P.F. Effects of ventilation on the indoor spread of COVID-19. J. Fluid Mech. 2020, 903, F1. [Google Scholar] [CrossRef] [PubMed]
  29. Wang, R.; Xiong, Y.; Xing, X.; Yang, R.; Li, J.; Wang, Y.; Cao, J.; Balkanski, Y.; Peñuelas, J.; Ciais, P.; et al. Daily CO2 Emission Reduction Indicates the Control of Activities to Contain COVID-19 in China. Innovation 2020, 1, 100062. [Google Scholar] [CrossRef] [PubMed]
  30. Li, J.; Hou, Y.; Liu, J.; Wang, Z.; Li, F. Window purifying ventilator using a cross-flow fan: Simulation and optimization. Build. Simul. 2016, 9, 481–488. [Google Scholar] [CrossRef]
  31. Domínguez-Amarillo, S.; Fernández-Agüera, J.; Cesteros-García, S.; González-Lezcano, R.A. Bad Air Can Also Kill: Residential Indoor Air Quality and Pollutant Exposure Risk during the COVID-19 Crisis. Int. J. Environ. Res. Public Health 2020, 17, 7183. [Google Scholar] [CrossRef] [PubMed]
  32. Satish, U.; Mendell, M.J.; Shekhar, K.; Hotchi, T.; Sullivan, D.; Streufert, S.; Fisk, W.J. Is CO2 an Indoor Pollutant? Direct Effects of Low-to-Moderate CO2 Concentrations on Human Decision-Making Performance. Environ. Health Perspect. 2012, 120, 1671–1677. [Google Scholar] [CrossRef] [PubMed]
  33. Rumchev, K.; Zhao, Y.; Spickett, J. Health Risk Assessment of Indoor Air Quality, Socioeconomic and House Characteristics on Respiratory Health among Women and Children of Tirupur, South India. Int. J. Environ. Res. Public Health 2017, 14, 429. [Google Scholar] [CrossRef]
  34. Aramendia, I.; Fernandez-Gamiz, U.; Lopez-Arraiza, A.; Rey-Santano, C.; Mielgo, V.; Basterretxea, F.J.; Sancho, J.; Gomez-Solaetxe, M.A. Experimental and Numerical Modeling of Aerosol Delivery for Preterm Infants. Int. J. Environ. Res. Public Health 2018, 15, 423. [Google Scholar] [CrossRef]
  35. Pfeifer, S.; Müller, T.; Weinhold, K.; Zikova, N.; dos Santos, S.M.; Marinoni, A.; Bischof, O.F.; Kykal, C.; Ries, L.; Meinhardt, F.; et al. Intercomparison of 15 aerodynamic particle size spectrometers (APS 3321): Uncertainties in particle sizing and number size distribution. Atmos. Meas. Tech. 2016, 9, 1545–1551. [Google Scholar] [CrossRef]
  36. Chen, L.; Mao, J.; Zhao, H.; Zhou, C.; Gong, X. Size distribution and concentration of aerosol particles in Yinchuan area, China. Phys. Geogr. 2019, 40, 538–553. [Google Scholar] [CrossRef]
  37. Chillon, S.A.; Millan, M.; Aramendia, I.; Fernandez-Gamiz, U.; Zulueta, E.; Mendaza-Sagastizabal, X. Natural Ventilation Characterization in a Classroom under Different Scenarios. Int. J. Environ. Res. Public Health 2021, 18, 5425. [Google Scholar] [CrossRef] [PubMed]
  38. Kalmár, T.; Szodrai, F.; Kalmár, F. Local ventilation effectiveness dependence on the airflow pattern and temperature in the case of isothermal balanced ventilation. J. Build. Eng. 2022, 61, 105309. [Google Scholar] [CrossRef]
  39. Azimi, P.; Stephens, B. HVAC filtration for controlling infectious airborne disease transmission in indoor environments: Predicting risk reductions and operational costs. Build. Environ. 2013, 70, 150–160. [Google Scholar] [CrossRef] [PubMed]
  40. Qian, H.; Li, Y.; Nielsen, P.V.; Huang, X. Spatial distribution of infection risk of SARS transmission in a hospital ward. Build. Environ. 2009, 44, 1651–1658. [Google Scholar] [CrossRef]
  41. Liao, C.; Chang, C.; Liang, H. A Probabilistic Transmission Dynamic Model to Assess Indoor Airborne Infection Risks. Risk Anal. 2005, 25, 1097–1107. [Google Scholar] [CrossRef]
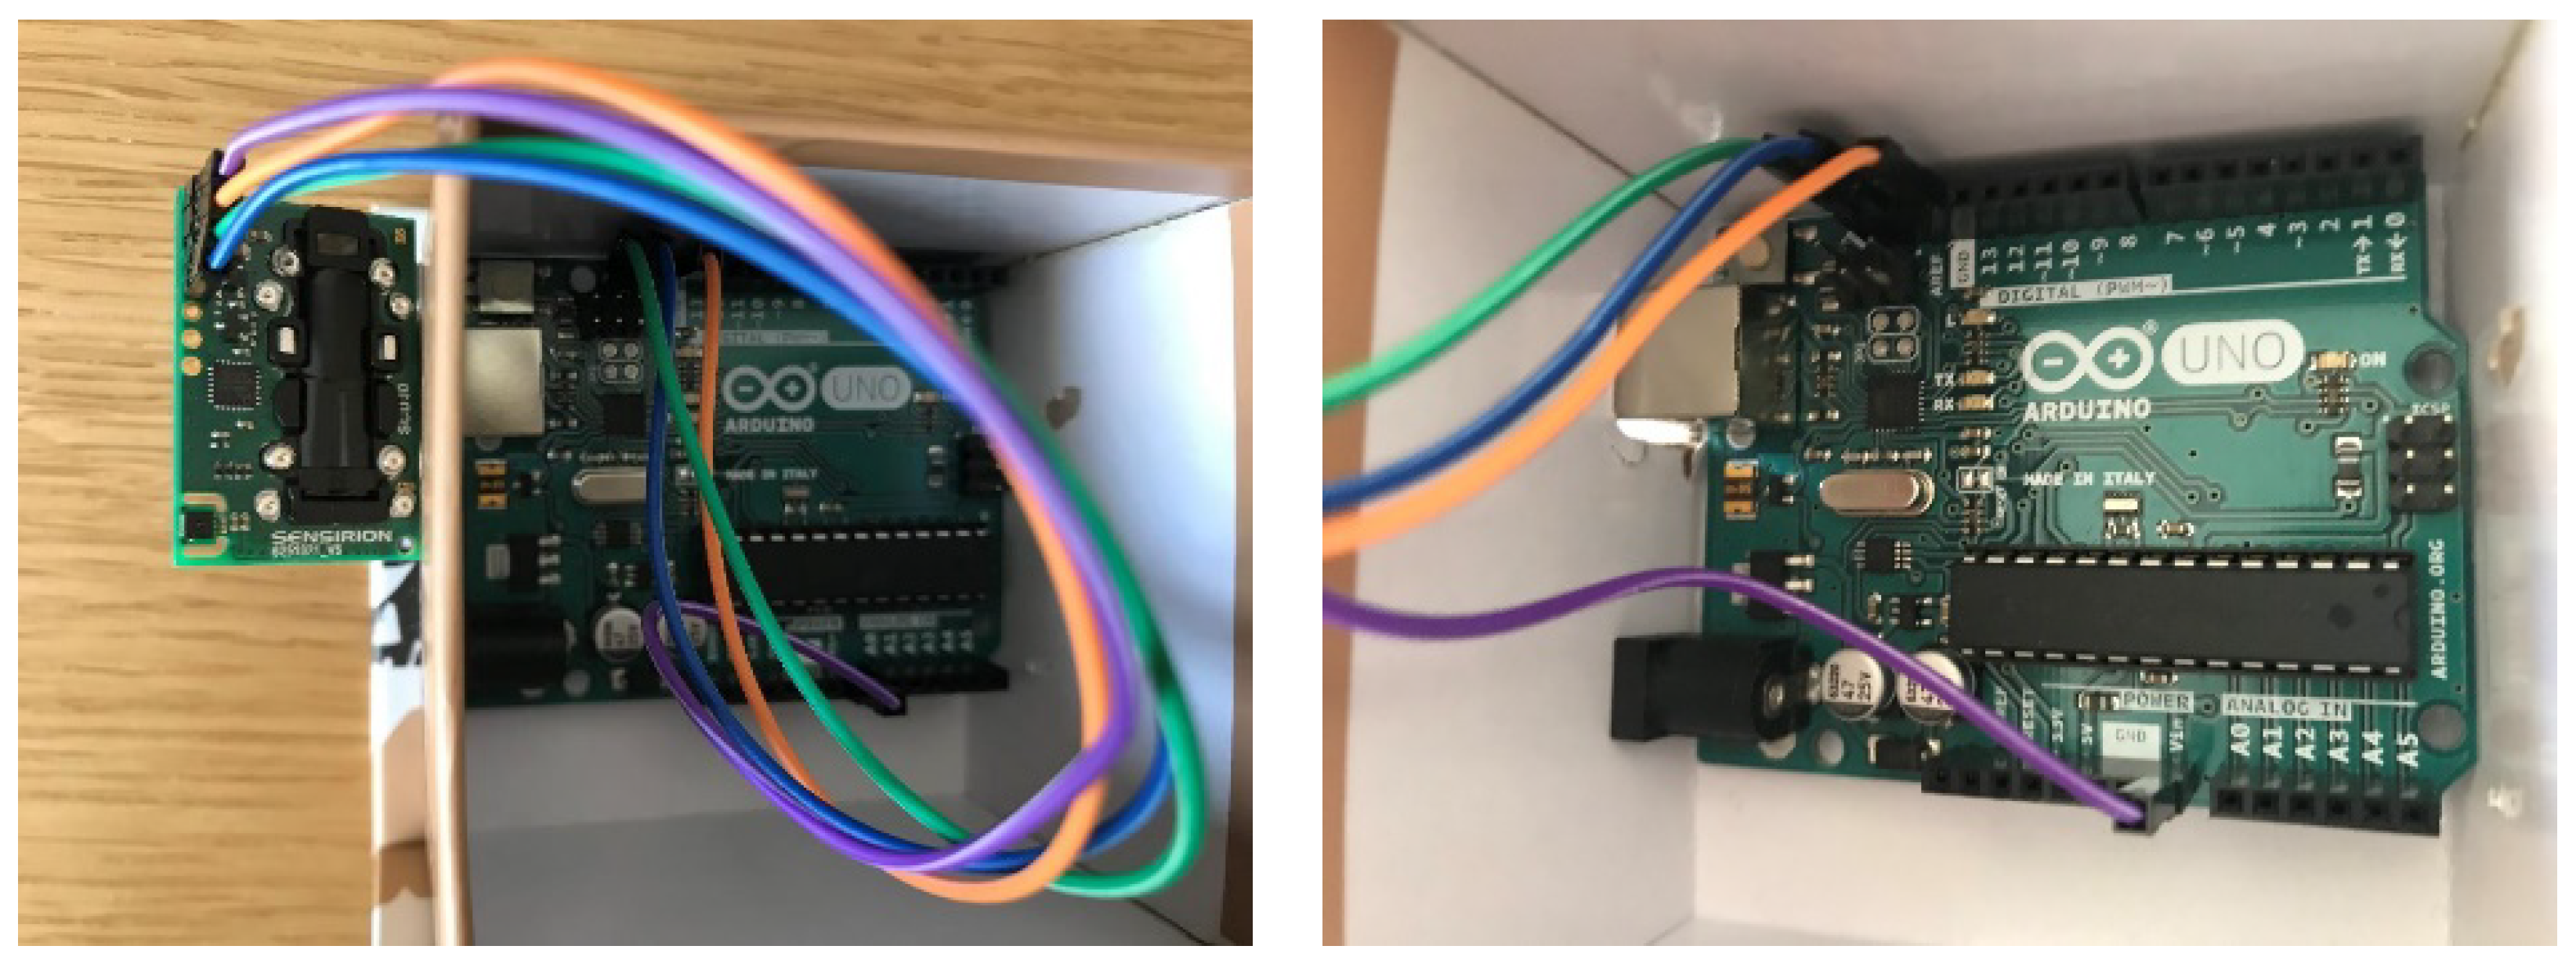
Figure 1. Connection between Arduino Uno and SCD30.
Buildings 14 01007 g001
Figure 2. Example instrument layout in University Classroom A206. S1 and S2 are the SCD30 sensors; APS is the aerodynamic particle sizer and laptop (hardware for instrument data storage).
Buildings 14 01007 g002
Figure 3. CO2 concentration [ppm] for S1 and S2 and particle concentration [particles/cm3].
Buildings 14 01007 g003
Figure 4. Temperature [°C] and relative humidity [%] for S1 and S2.
Buildings 14 01007 g004
Figure 5. PM2.5, PM10 and PM20 [µg/m3] with Da [µm] and MMAD (median) [µm].
Buildings 14 01007 g005
Figure 6. CO2 concentration [ppm] for S1 and S2 and particle concentration [particles/cm3].
Buildings 14 01007 g006
Figure 7. Temperature [°C] and relative humidity [%] for S1 and S2.
Buildings 14 01007 g007
Figure 8. PM2.5, PM10 and PM20 [µg/m3] with Da [µm] and MMAD (median) [µm].
Buildings 14 01007 g008
Figure 9. PM2.5, PM10 and PM20 [µg/m3] with Da [µm] and MMAD (Median) [µm].
Buildings 14 01007 g009
Figure 10. Temperature [°C] and relative humidity [%] for S1 and S2.
Buildings 14 01007 g010
Figure 11. PM2.5, PM10 and PM20 [µg/m3] with Da [µm] and MMAD (median) [µm].
Buildings 14 01007 g011
Figure 12. CO2 Concentration [ppm] for S1 and S2 and particle concentration [particles/cm3].
Buildings 14 01007 g012
Figure 13. CO2 Concentration [ppm] for S1 and S2 and particle concentration [particles/cm3].
Buildings 14 01007 g013
Figure 14. PM2.5, PM10 and PM20 [µg/m3] with Da [µm] and MMAD (median) [µm].
Buildings 14 01007 g014
Figure 15. CO2 concentration [ppm] for S1 and S2 and particle concentration [particles/cm3].
Buildings 14 01007 g015
Figure 16. Temperature [°C] and relative humidity [%] for S1 and S2.
Buildings 14 01007 g016
Figure 17. PM2.5, PM10 and PM20 [μg/m3] with Da [μm]) and MMAD (median) [μm].
Buildings 14 01007 g017
Figure 18. CO2 concentration [ppm] for S1 and S2 and particle concentration [particles/cm3].
Buildings 14 01007 g018
Figure 19. Temperature [°C] and relative humidity [%] for S1 and S2.
Buildings 14 01007 g019
Figure 20. Temperature [°C] and relative humidity [%] for S1 and S2.
Buildings 14 01007 g020
Figure 21. CO2 concentration [ppm] for S1 and S2 and particle concentration [particles/cm3].
Buildings 14 01007 g021
Figure 22. Temperature [°C] and relative humidity [%] for S1 and S2.
Buildings 14 01007 g022
Figure 23. PM2.5, PM10 and PM20 [µg/m3] with Da [µm] and MMAD (median) [µm].
Buildings 14 01007 g023
Figure 24. Probability of infection risk of the measurements in percentage.
Buildings 14 01007 g024
Table 1. Measurement condition summary.
M.
No.
LocationDayPeriodVent.
System
Occupancy
* (Xi-Xm-Xe)
Activity
Intensity
Level
Mask
1UPV/EHU
A206 classroom
15 Dec 202111:07–13:29natural0-15-0LowYES
2UPV/EHU
A206 classroom
16 December 202111:21–13:43natural0-1-0LowYES
3Library
children’s area
22 December 202117:34–19:31natural0-40-0Low/medium14 Children NO
4Library
assembly hall
23 December 202110:53–13:13natural0-49-0LowYES
5Library
conference room
23 December 202117:38–19:56natural0-31-0LowYES
6Gym
training room
27 December 202118:01–20:00natural
(A/C ON)
0-14-0MediumYES
7Gym
spinning room
28 December 202118:55–21:15natural
(A/C ON)
0-22-0Medium/highYES
* For Occupancy column in Table 1: Xi-Xm-Xe stands for number of individuals X. “Xi” at the initiation of the measurements, “Xm” maximum during the measurement and “Xe” at the end of the measurement. Typically, nobody at the start and at the end of measurements.
Table 2. Enclosed space specifications.
M.
No.
Ceiling
Height
[m]
Floor
Area
[m2]
Enclosed
Space
Volume
[m3]
Window
Type
Vent.
Area
Min.
[m2]
Vent.
Area Windows
[m2]
Vent.
Area
Doors
[m2]
Vent.
Area
Max.
[m2]
Floor
Area per
Person
[m2]
14.057.2229Turn0.04.23.47.53.8
24.057.2229Turn0.04.23.47.557.2
35.0315.81579Centre
Tilt
0.52.4-2.47.9
43.3305.51008Centre
Tilt
0.0-1.81.86.2
53.479.7271Centre
Tilt
0.20.2-0.22.6
63.3149.0492Bottom
Tilt
2.42.42.04.310.6
73.0116.8350Bottom
Tilt
2.40.42.42.85.3
Table 3. Outside weather conditions.
M.
No.
Closest
Weather
Station
Station
Distance
[m]
Temperature
[°C]
Relative Humidity
[%]
Patm
[mbar]
Wind Speed
[km/h]
Wind Main
Component
1Pharmacy2502–597–909611–2N
2Pharmacy2502–494–879621–3NE
3Pharmacy5005–488–949522–3NW
4Pharmacy5007–982–799543–2W
5Pharmacy5007.590–929511–2NW
6Pharmacy12501366–6394525–28SW
7Pharmacy125014–1370–7295412–9SW
Table 4. Difference summary of the linear increment trend of the carbon dioxide level at the all-closed stage during measurements 1, 2, 4 and 5.
M. No.MeasurementMin
CO2
[ppm]
Max
CO2
[ppm]
Closed
Time
[min]
CO2
Function
f(t) Type
No. of
Persons
Inside
Volume
[m3]
Inside
Volume/Person
[m3]
ΔCO2/Time
[ppm/min]
(Inside Volume/Person)
/(ΔCO2/Time)
[m3·min/ppm]
11700102720Linear1522915.316.40.9
2252260520Linear12292294.255.1
4470082023Linear49100820.65.23.9
55700120025Linear312718.720.00.4
Disclaimer/Publisher’s Note: The statements, opinions and data contained in all publications are solely those of the individual author(s) and contributor(s) and not of MDPI and/or the editor(s). MDPI and/or the editor(s) disclaim responsibility for any injury to people or property resulting from any ideas, methods, instructions or products referred to in the content.