
Numerical Study of Air Distribution and Thermal Environment in Attached Ventilation Mode in the Generator Layer of a Hydropower Station

Abstract
1. Introduction
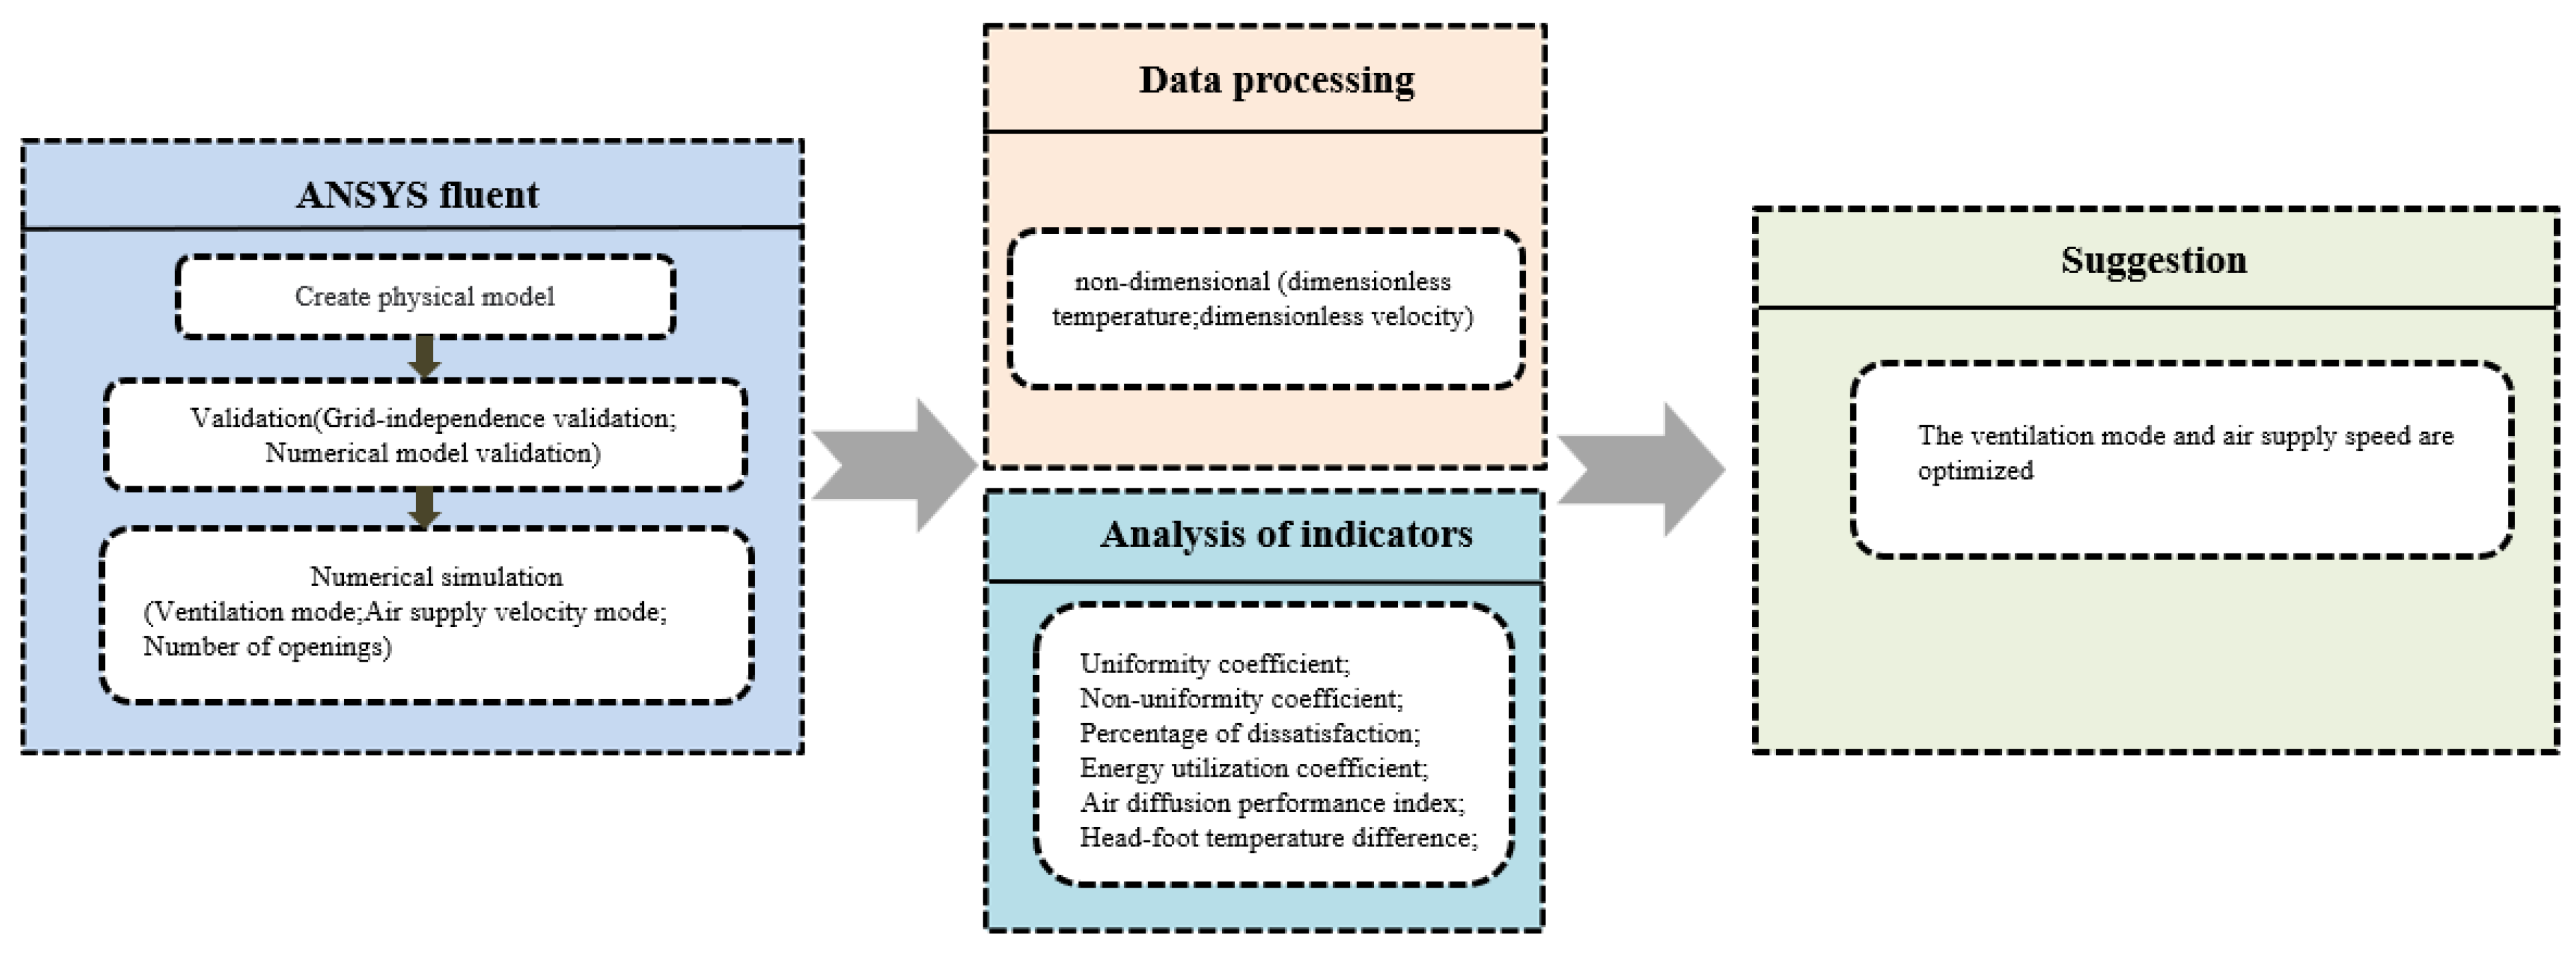
2. Research Methods
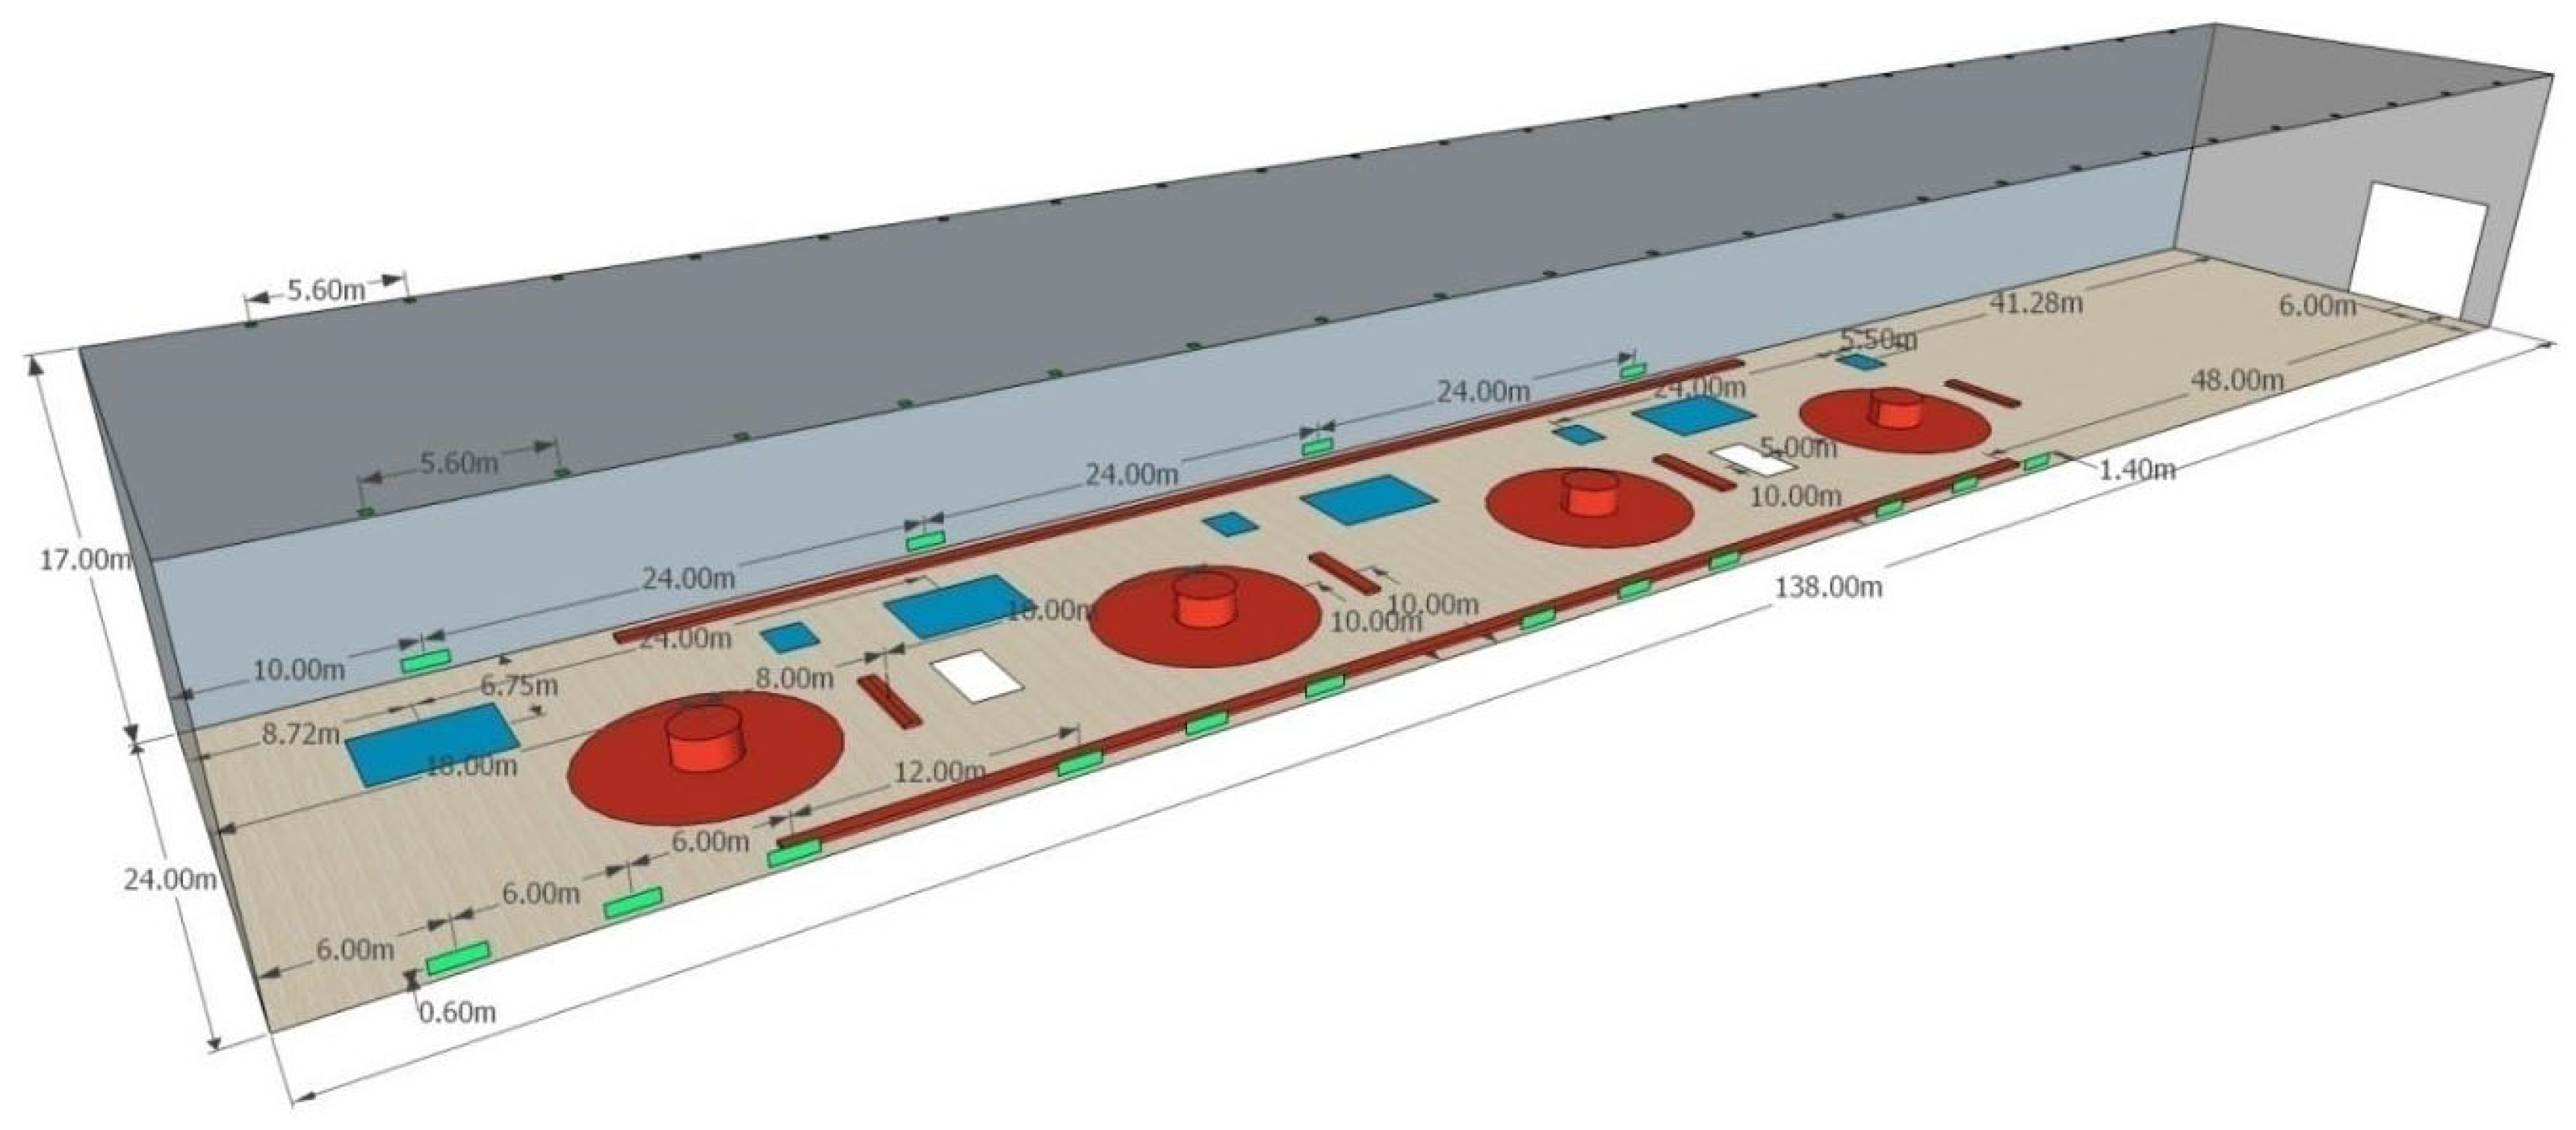
2.1. Geometric Settings and Assumptions
- (1)
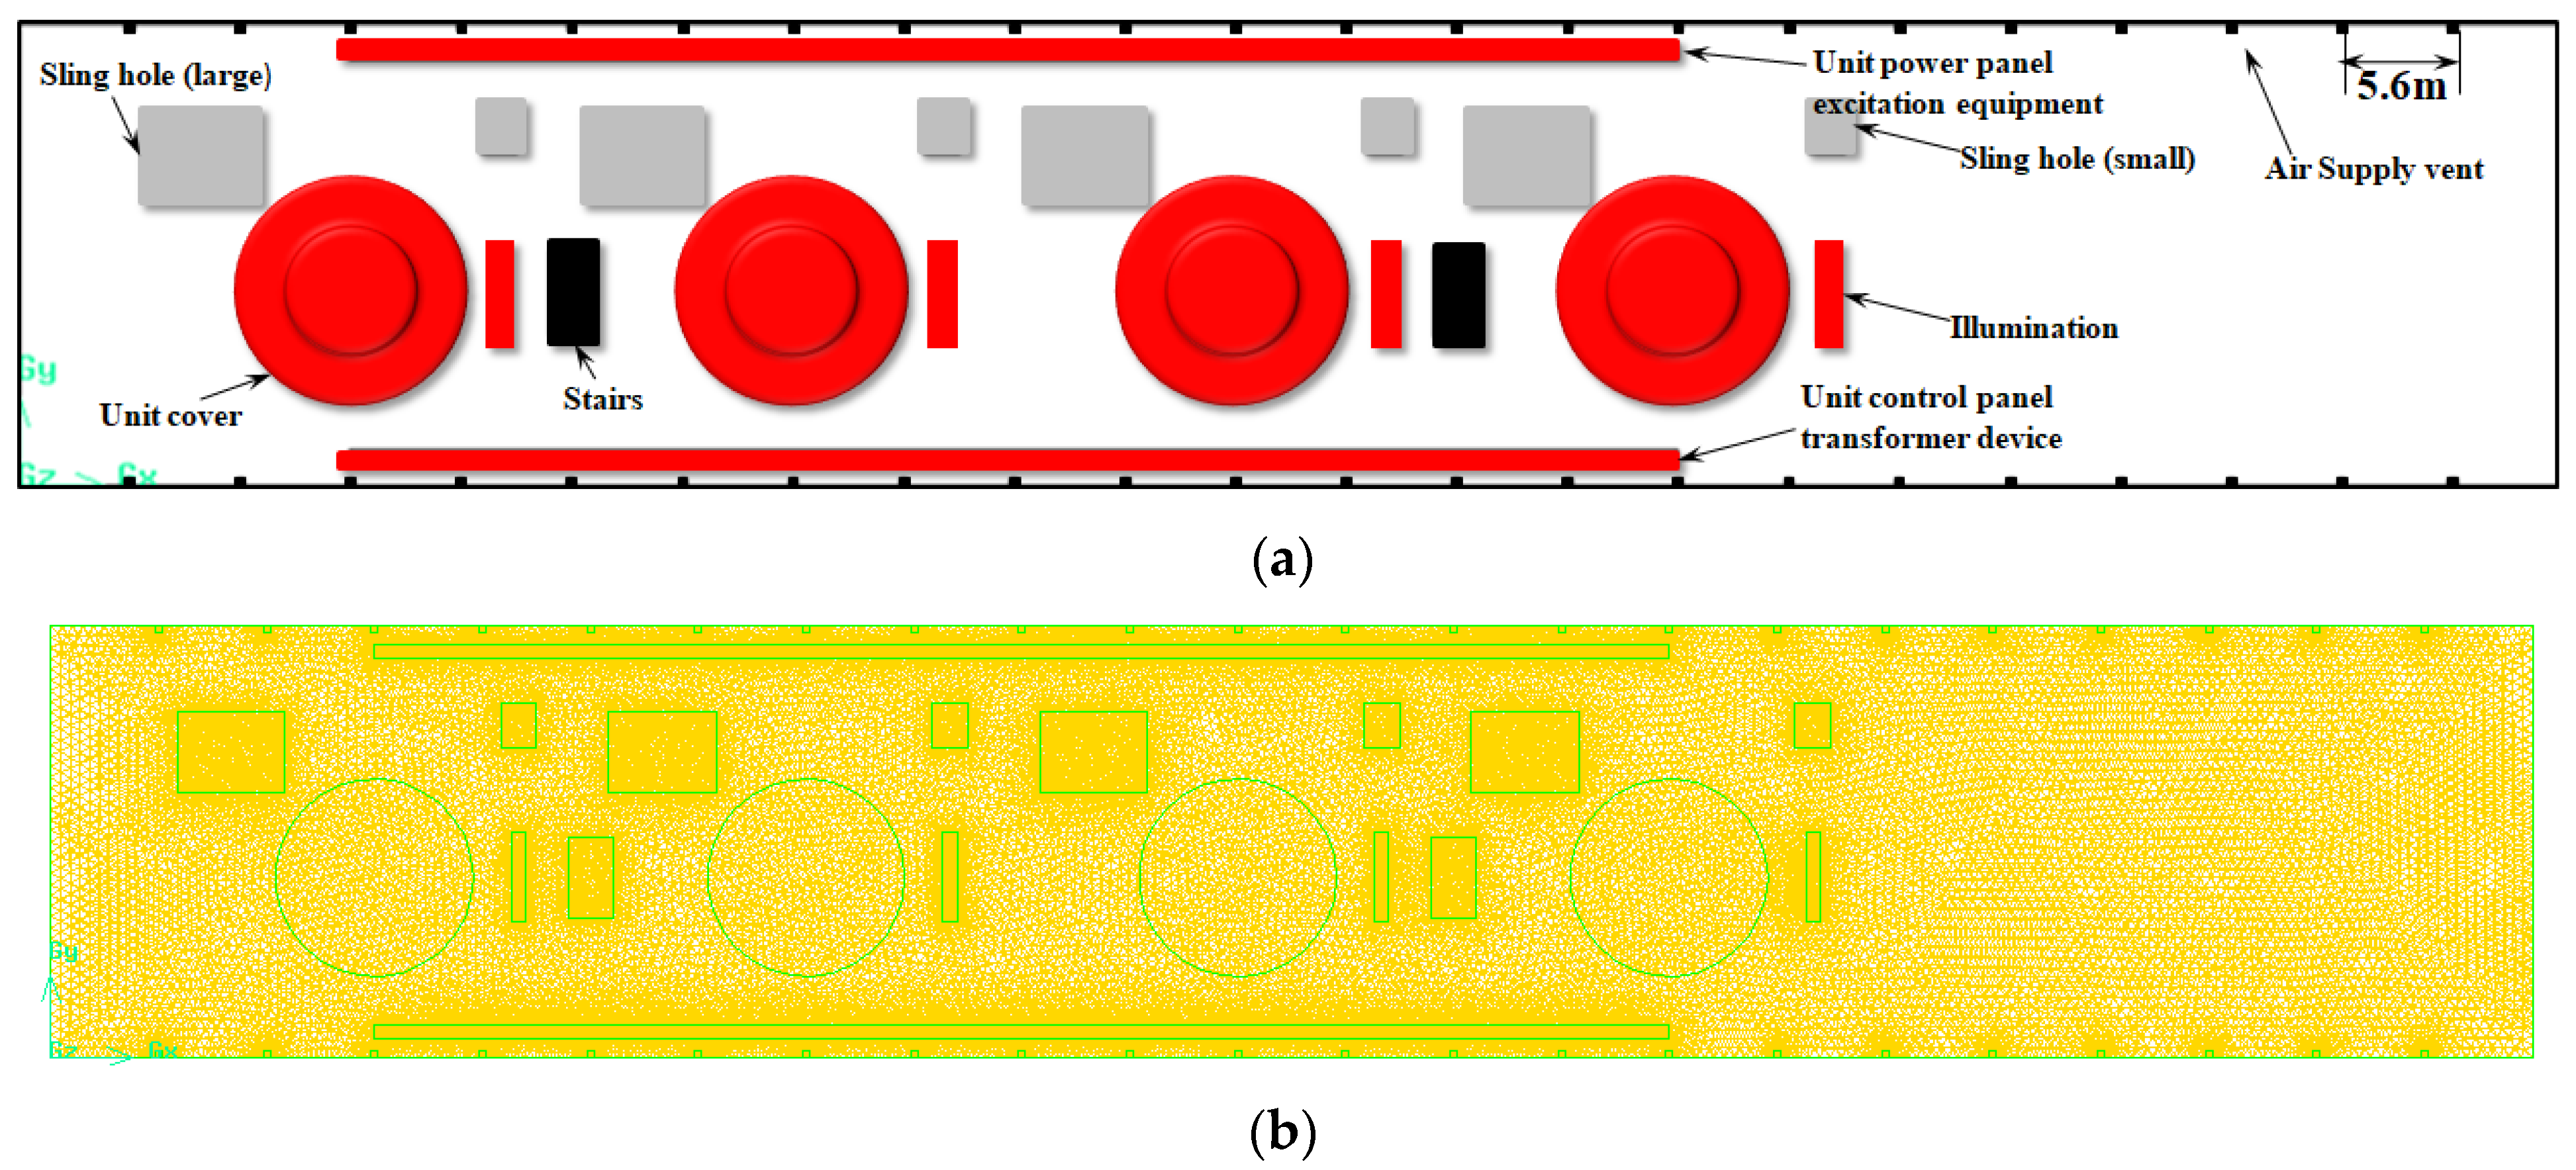
- Scheme 1: Double-sided air supply. The air supply vents were positioned on the ceiling of the generator layer close to the wall surface, and 2 rows were evenly arranged, with 22 air supply outlets each row. See Figure 4a.
- (2)
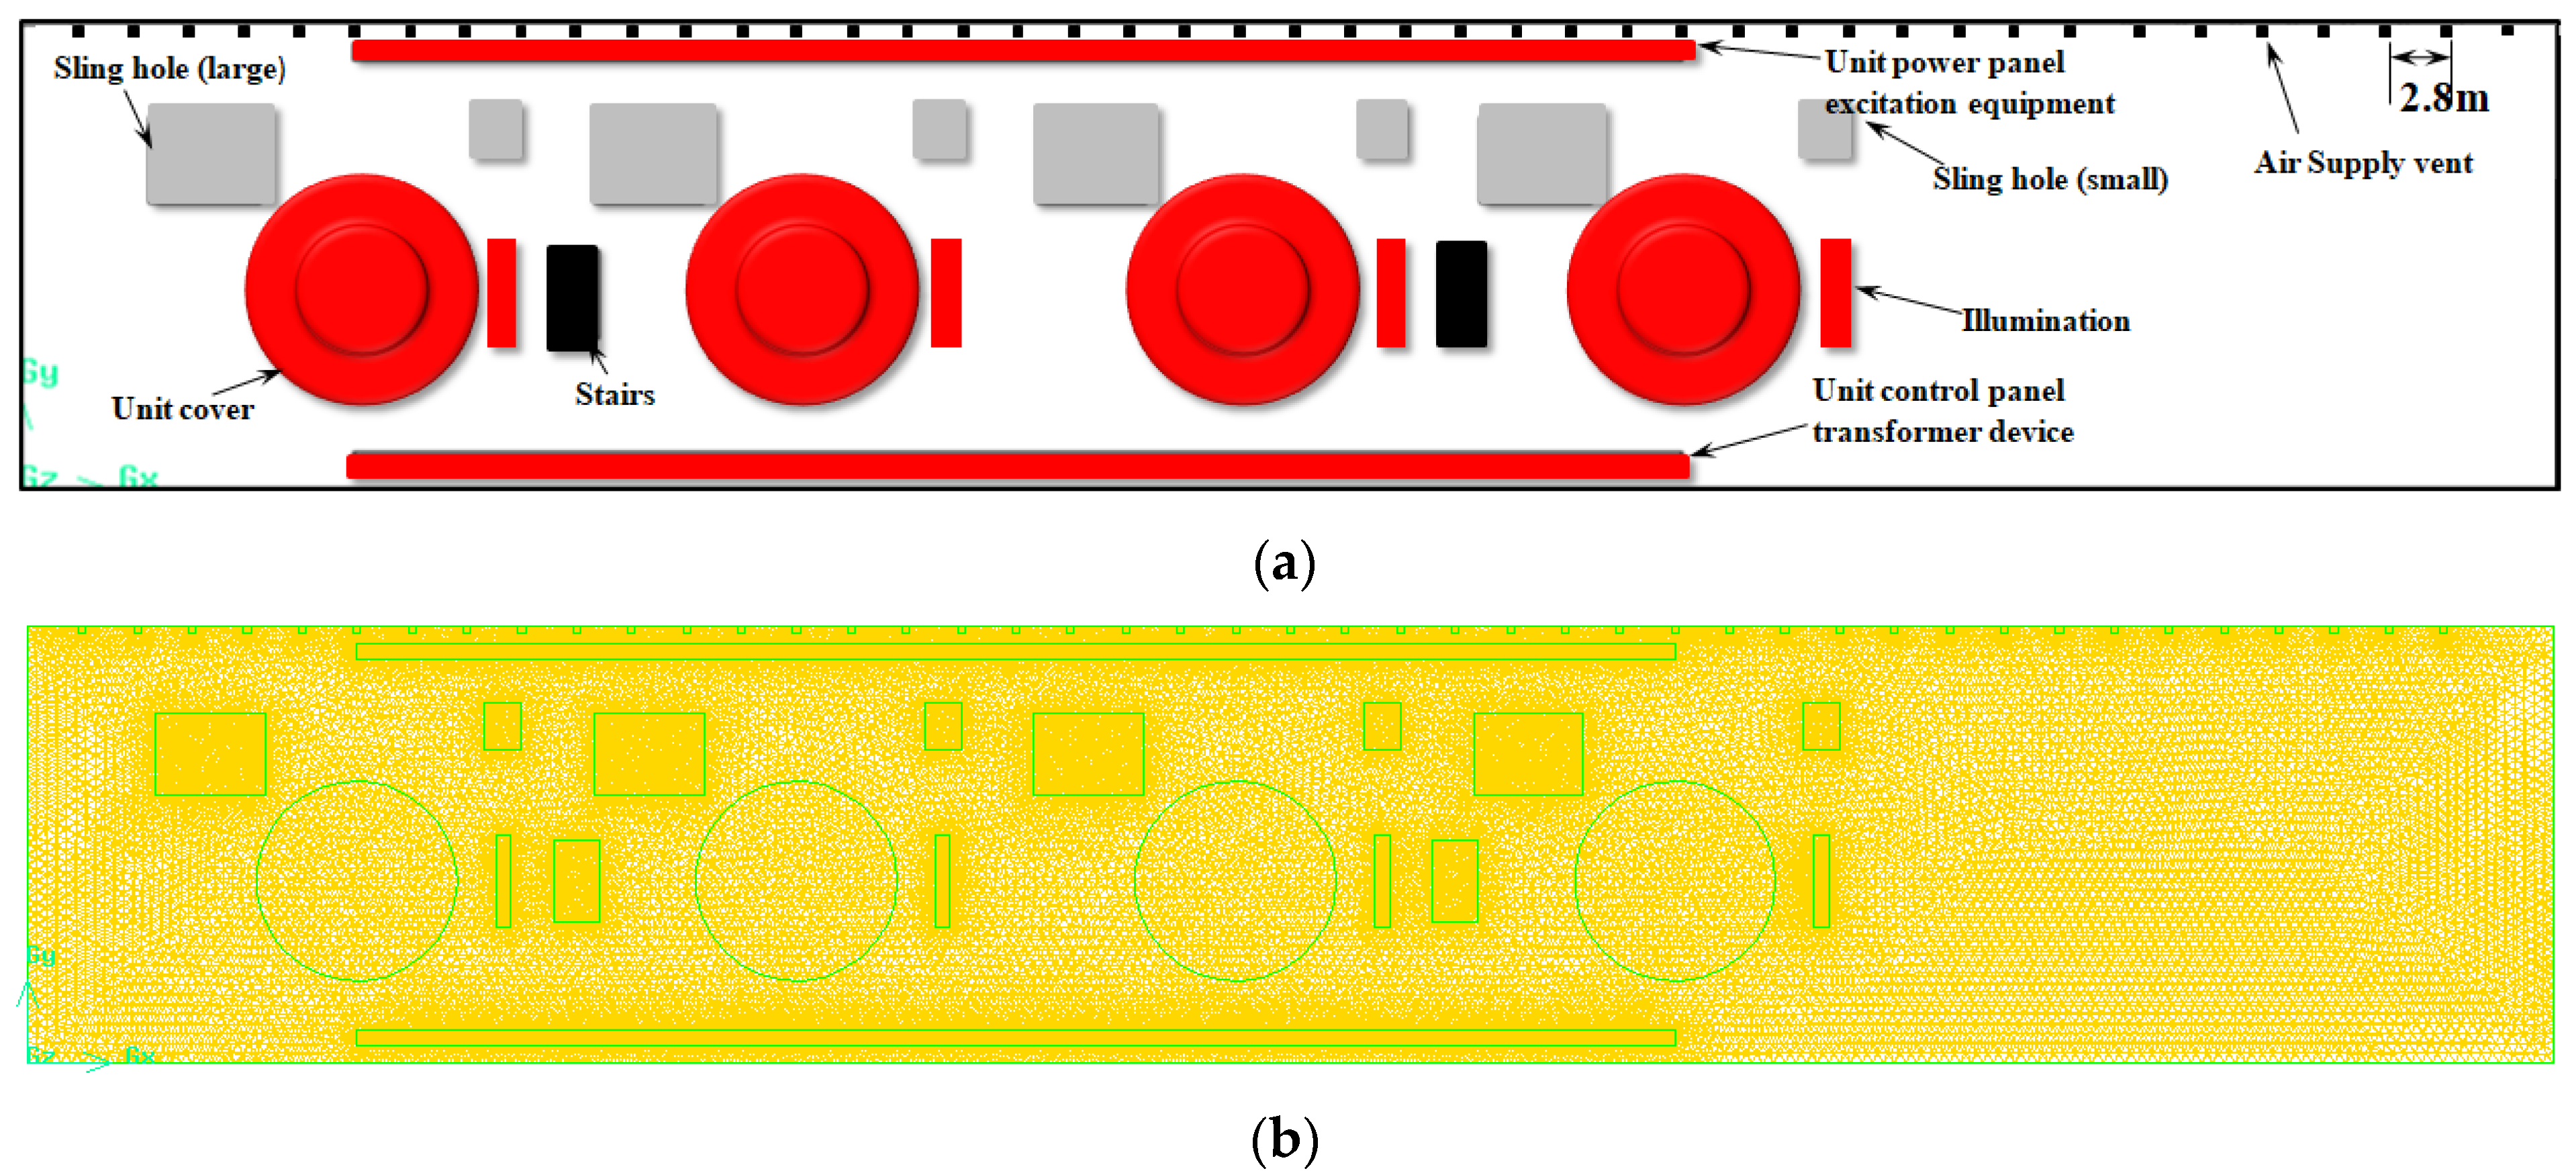
- Scheme 2: One-sided air supply. The air supply vents were arranged on the ceiling of the left side of the generator layer close to the wall surface, and a row was evenly arranged, with 44 air supply outlets. See Figure 5a.
2.2. Setting Working Conditions
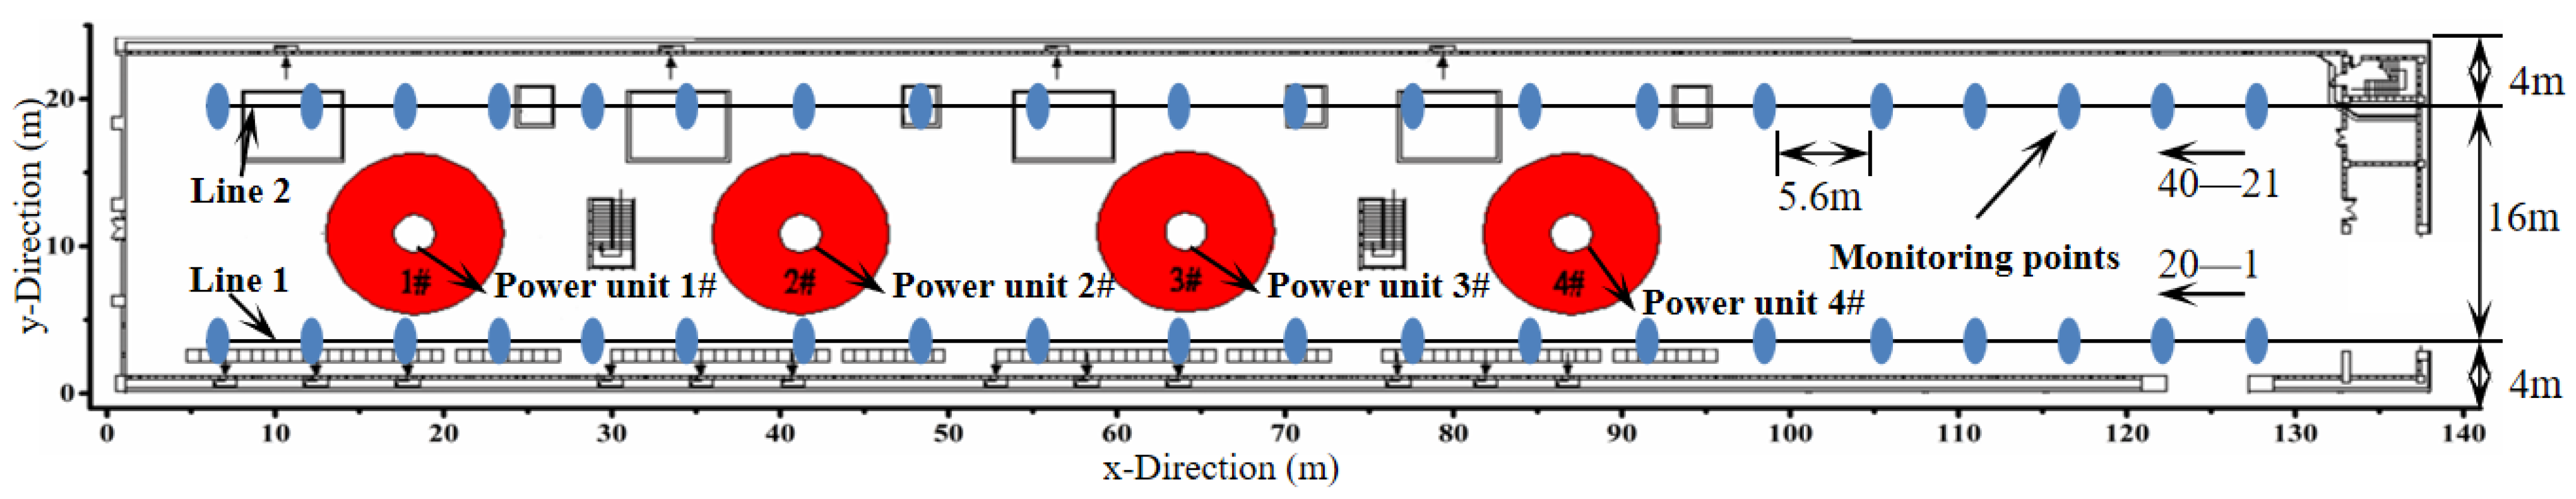
2.3. Selection of Monitoring Points
2.4. Boundary Conditions
- (1)
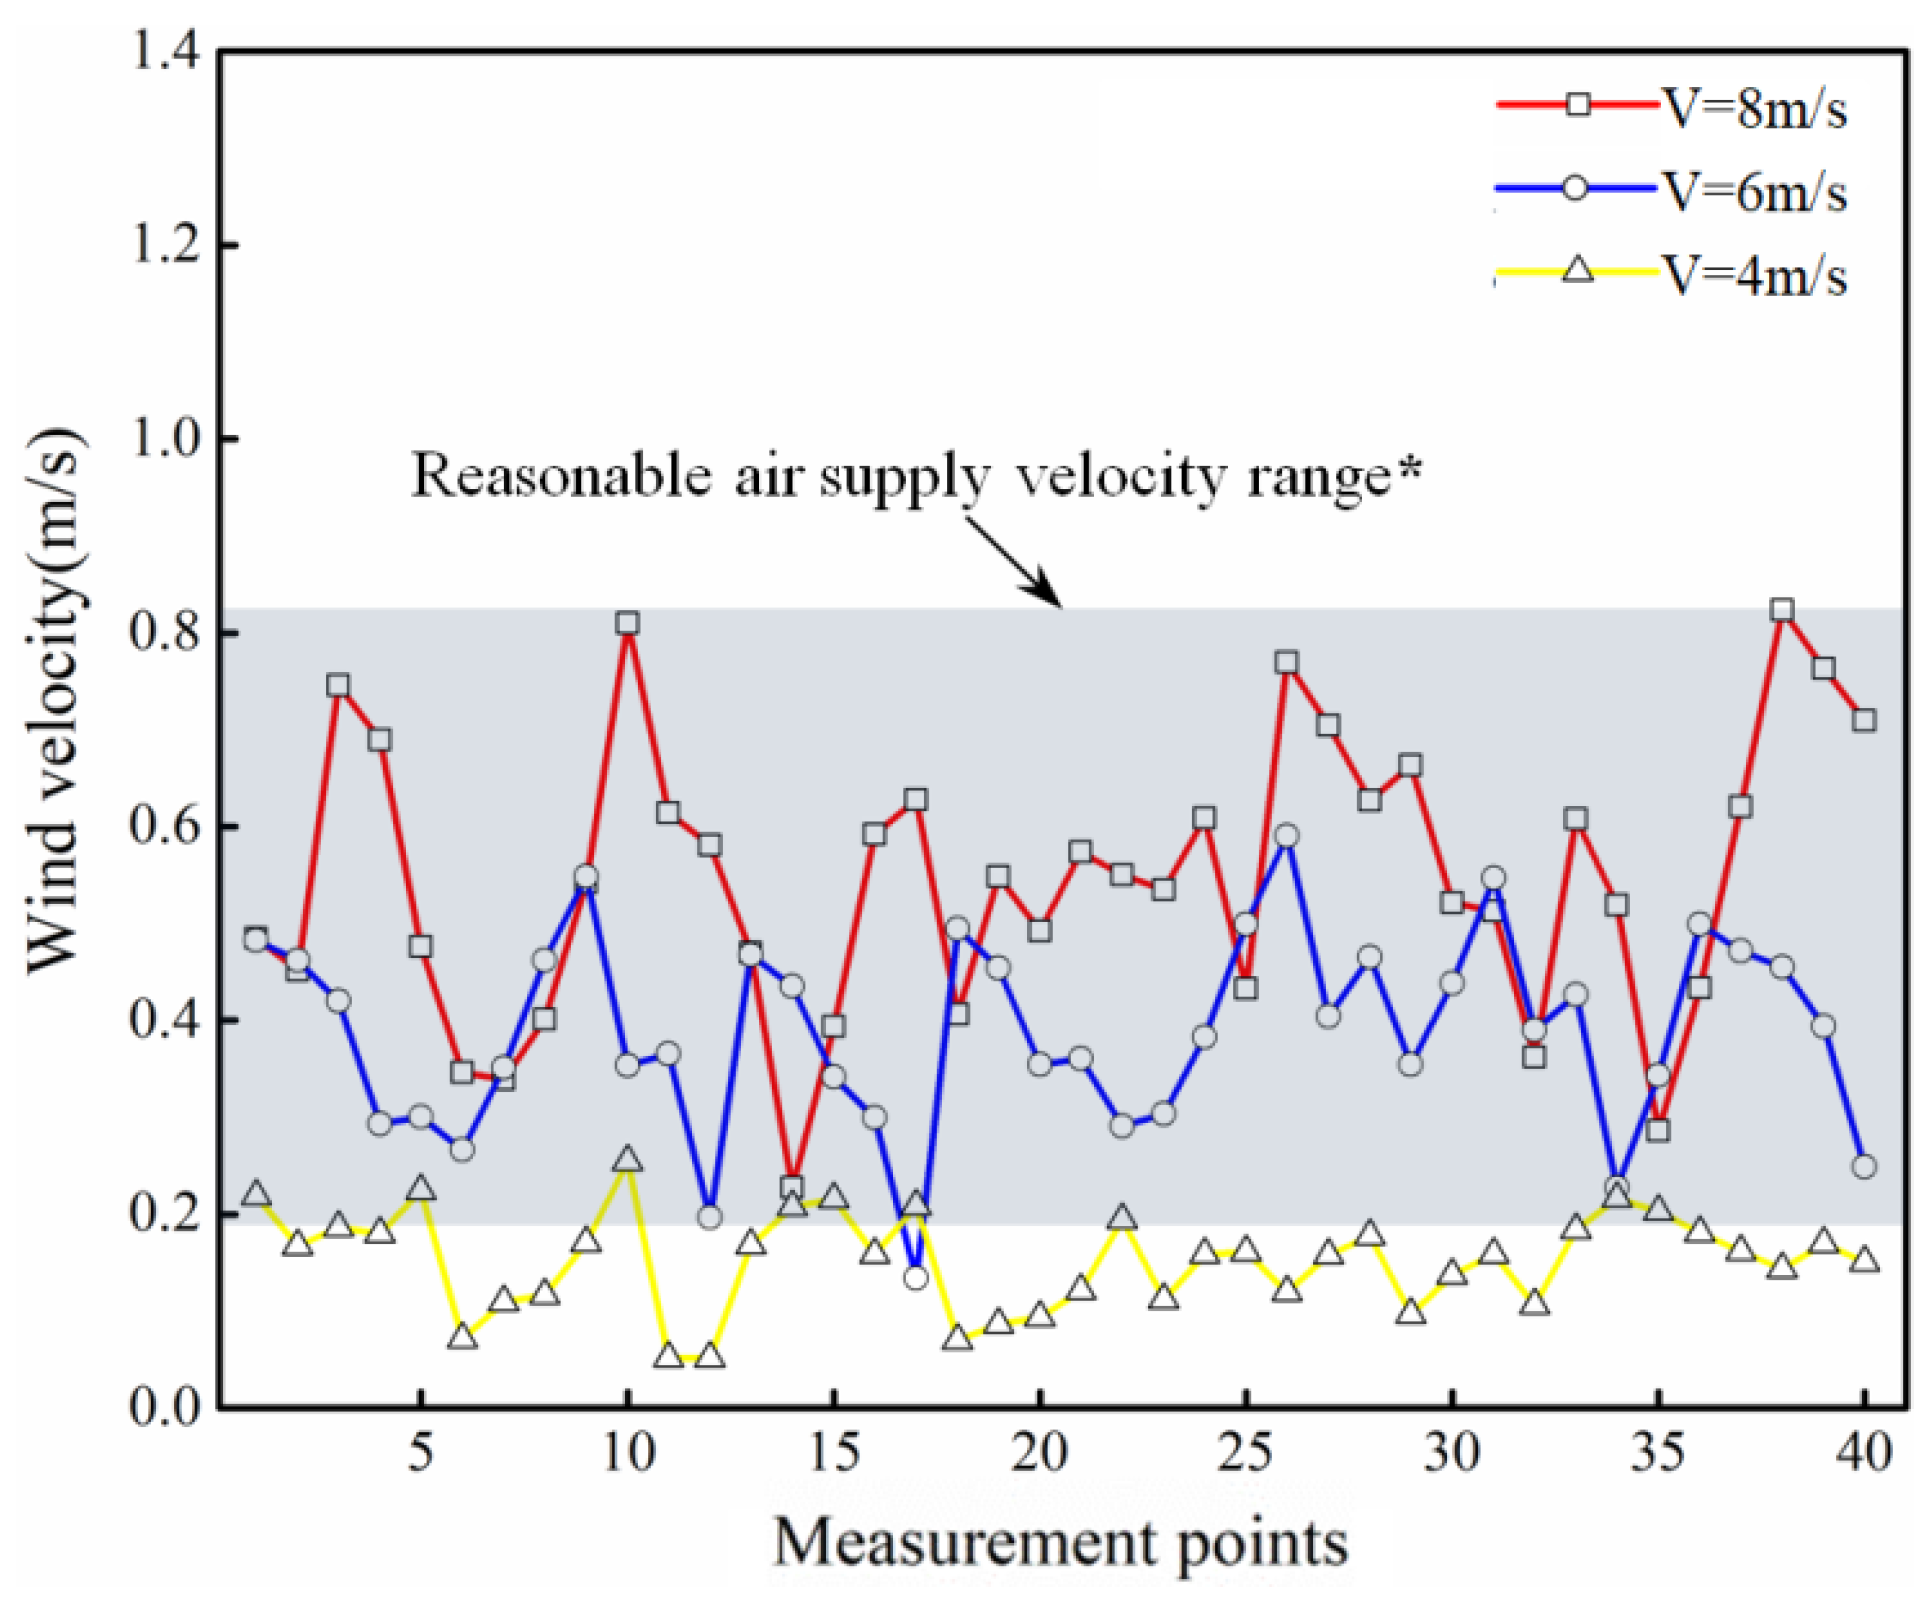
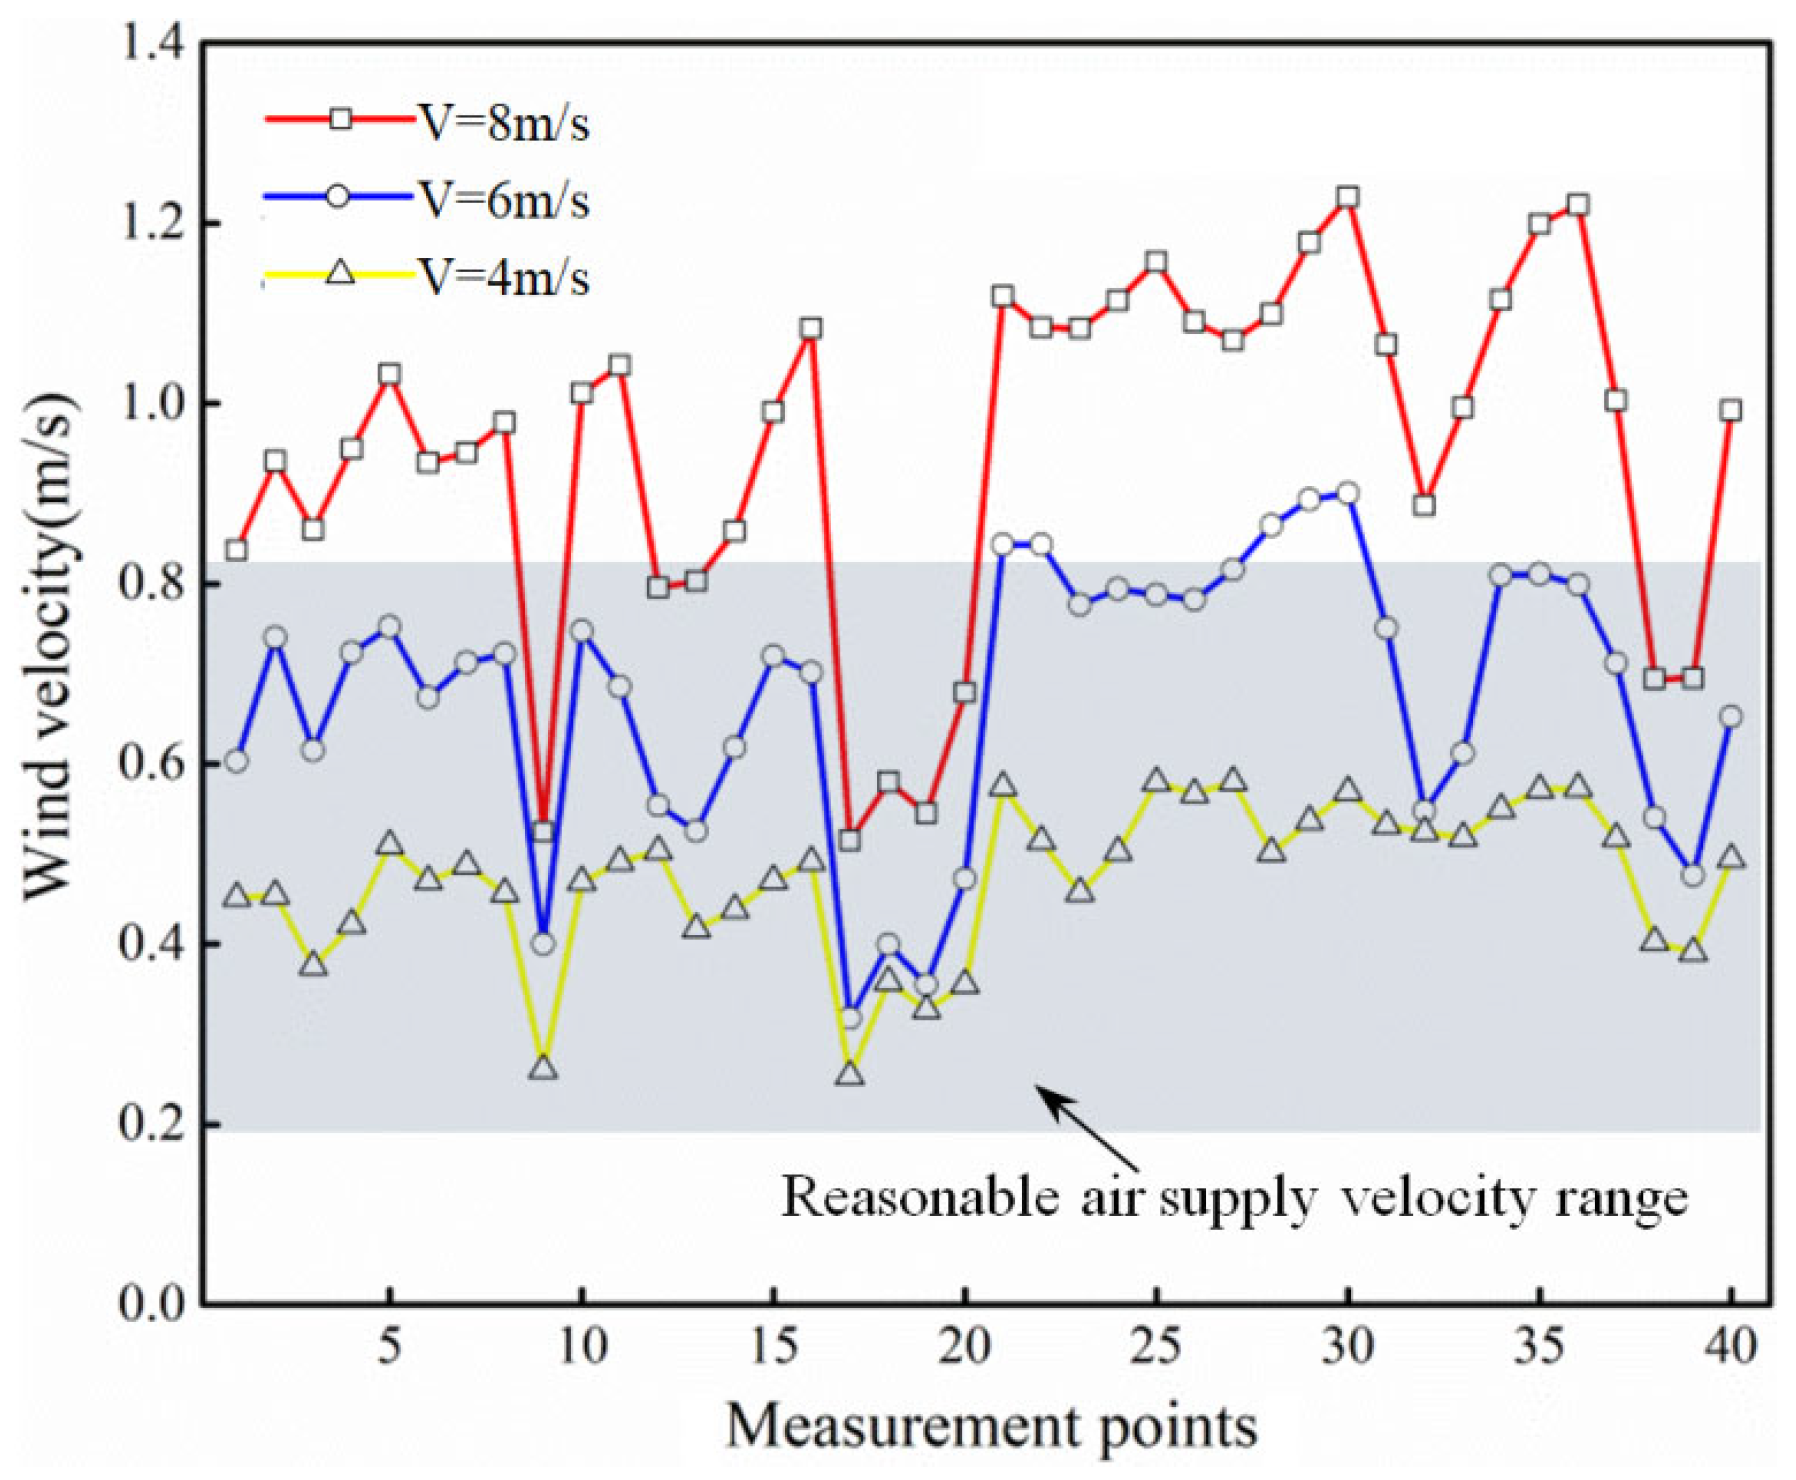
- Inlet boundary condition: velocity inlet boundary condition, the simulated air supply speeds are, respectively, 8 m/s, 6 m/s, and 4 m/s.
- (2)
- Boundary condition of the return air outlet: pressure outlet.
- (3)
- Wall boundary conditions: static walls were adopted without sliding for the generator layer walls.
- (4)
- Boundary conditions of the heat source: The heat source of the unit cover was regarded as constant heat flux, and the heat flux density was 240 W/m2. The excitation equipment of the power panel and the transformer device of the control panel were regarded as constant heat flux, and the heat flux was 944 W/m2. The heat flux density data were converted based on measured equivalence [39].
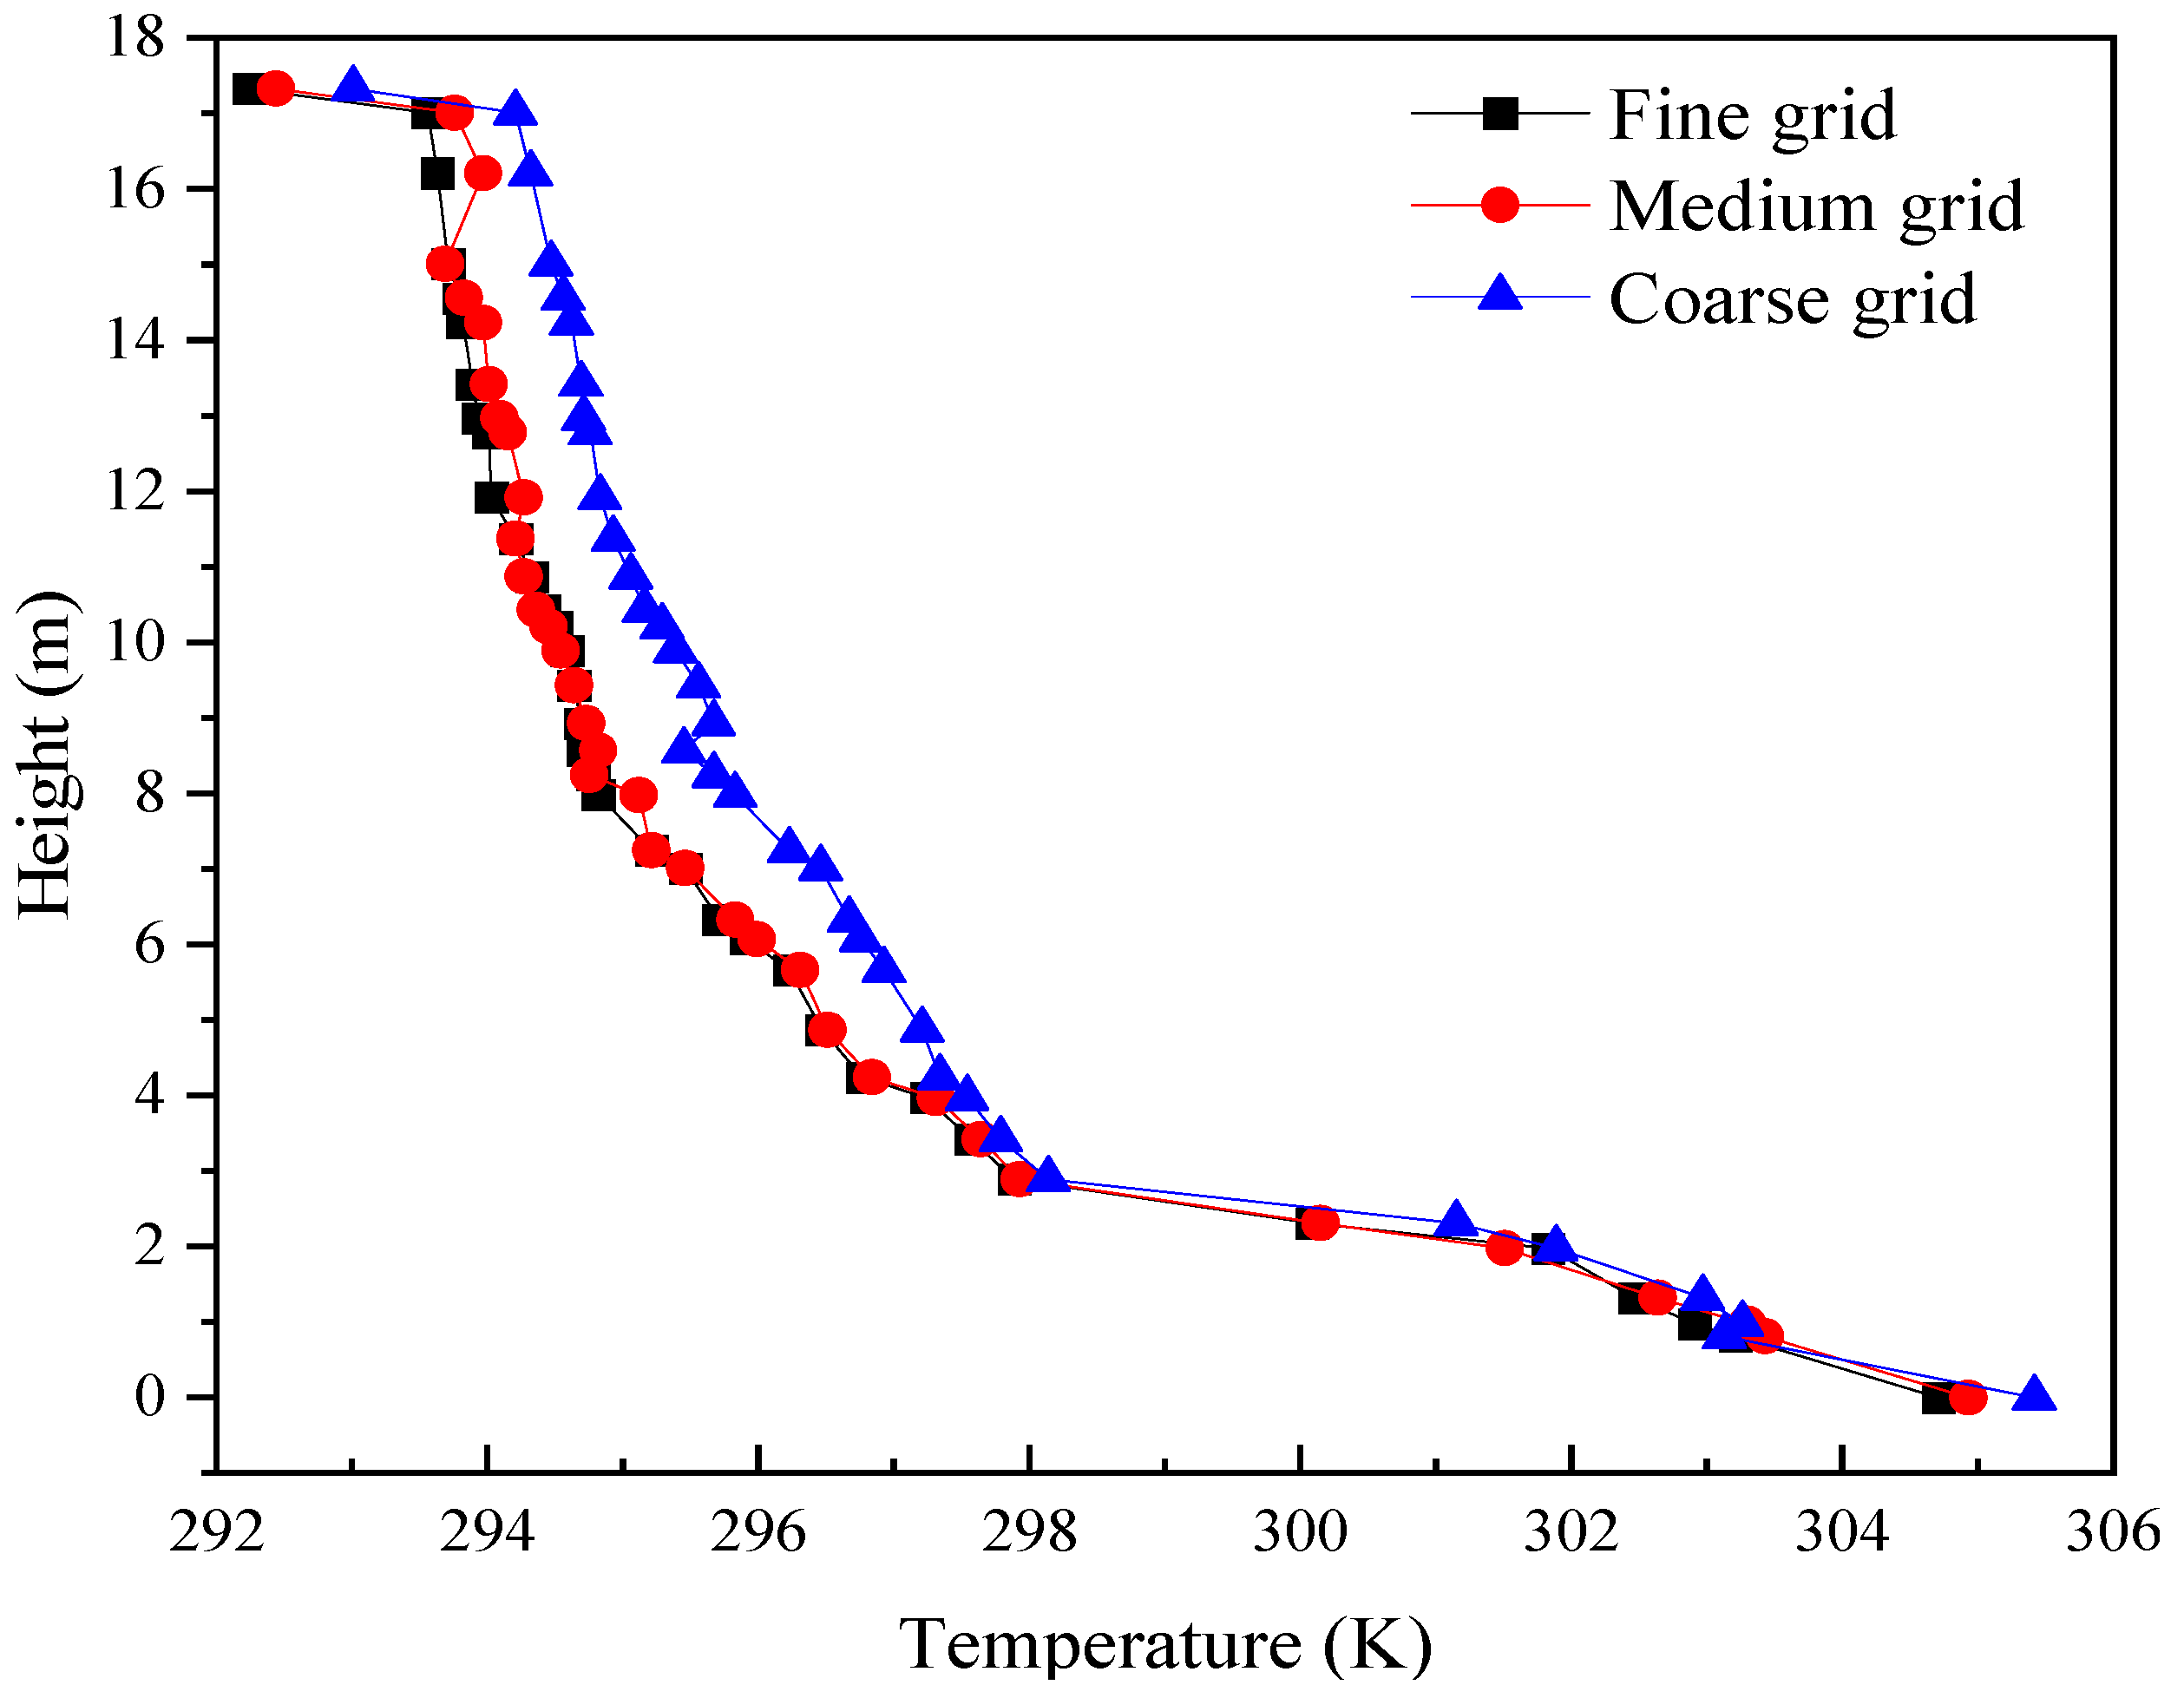
2.5. Grid-Independence Validation
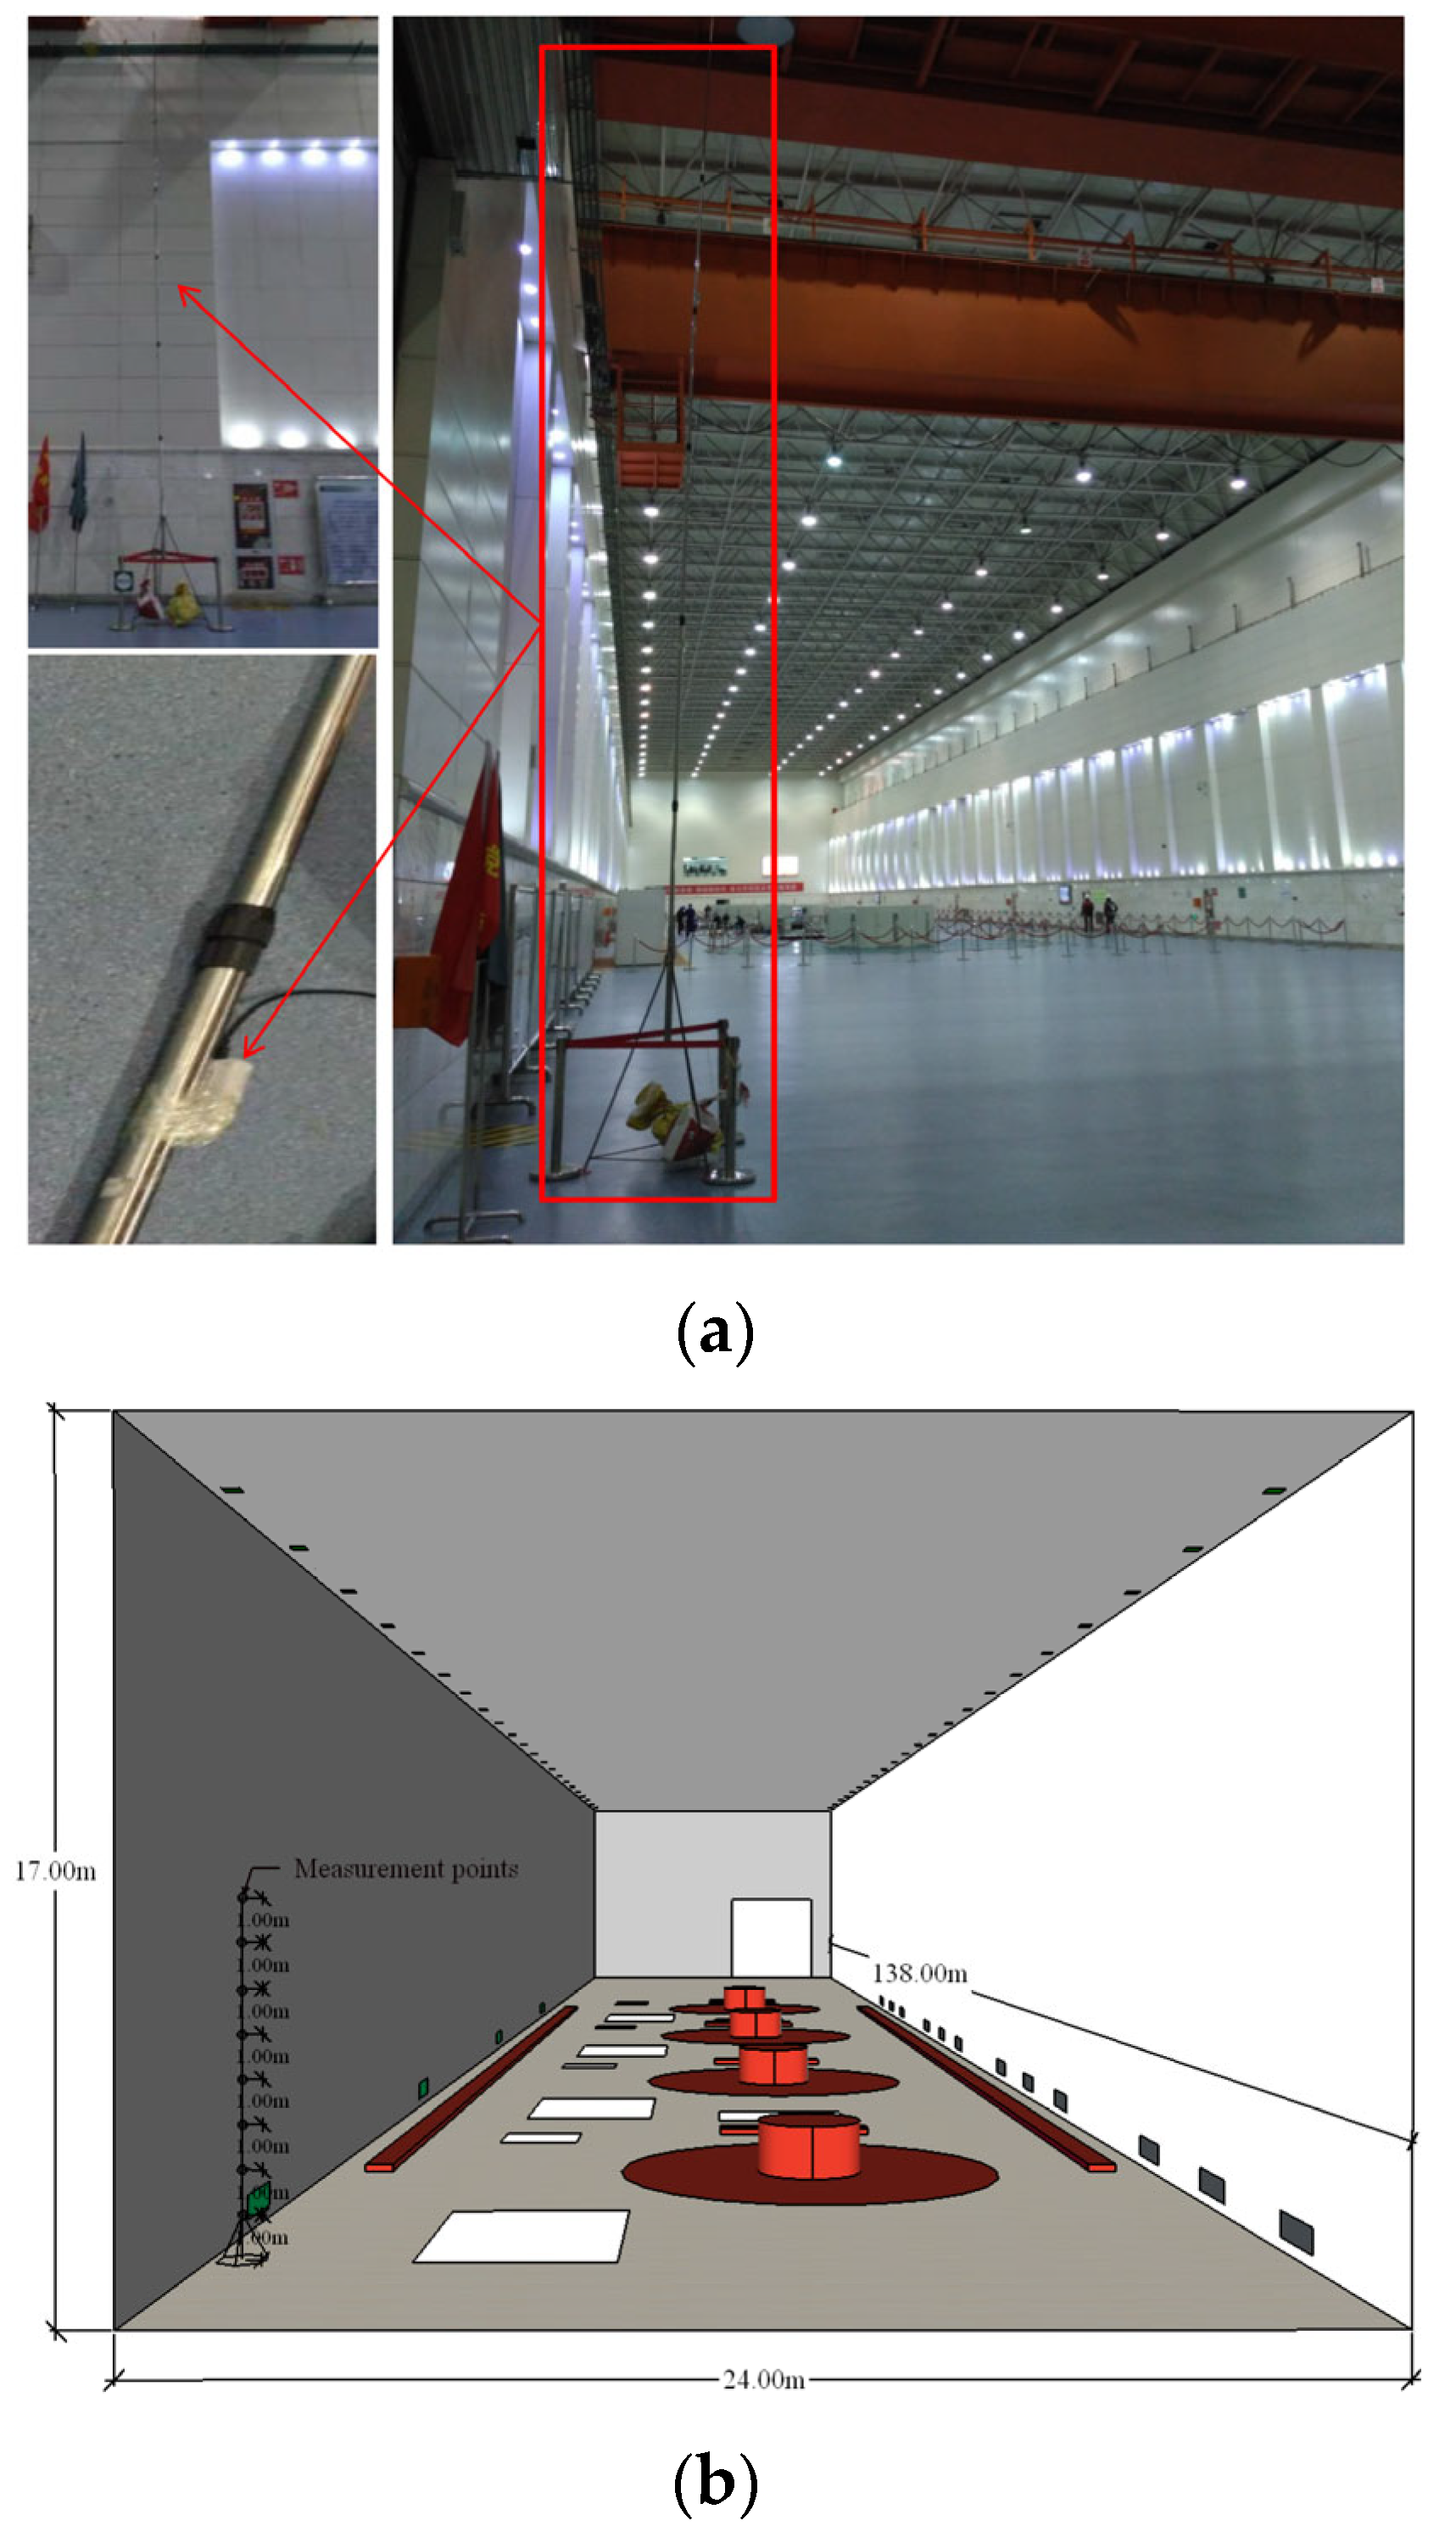
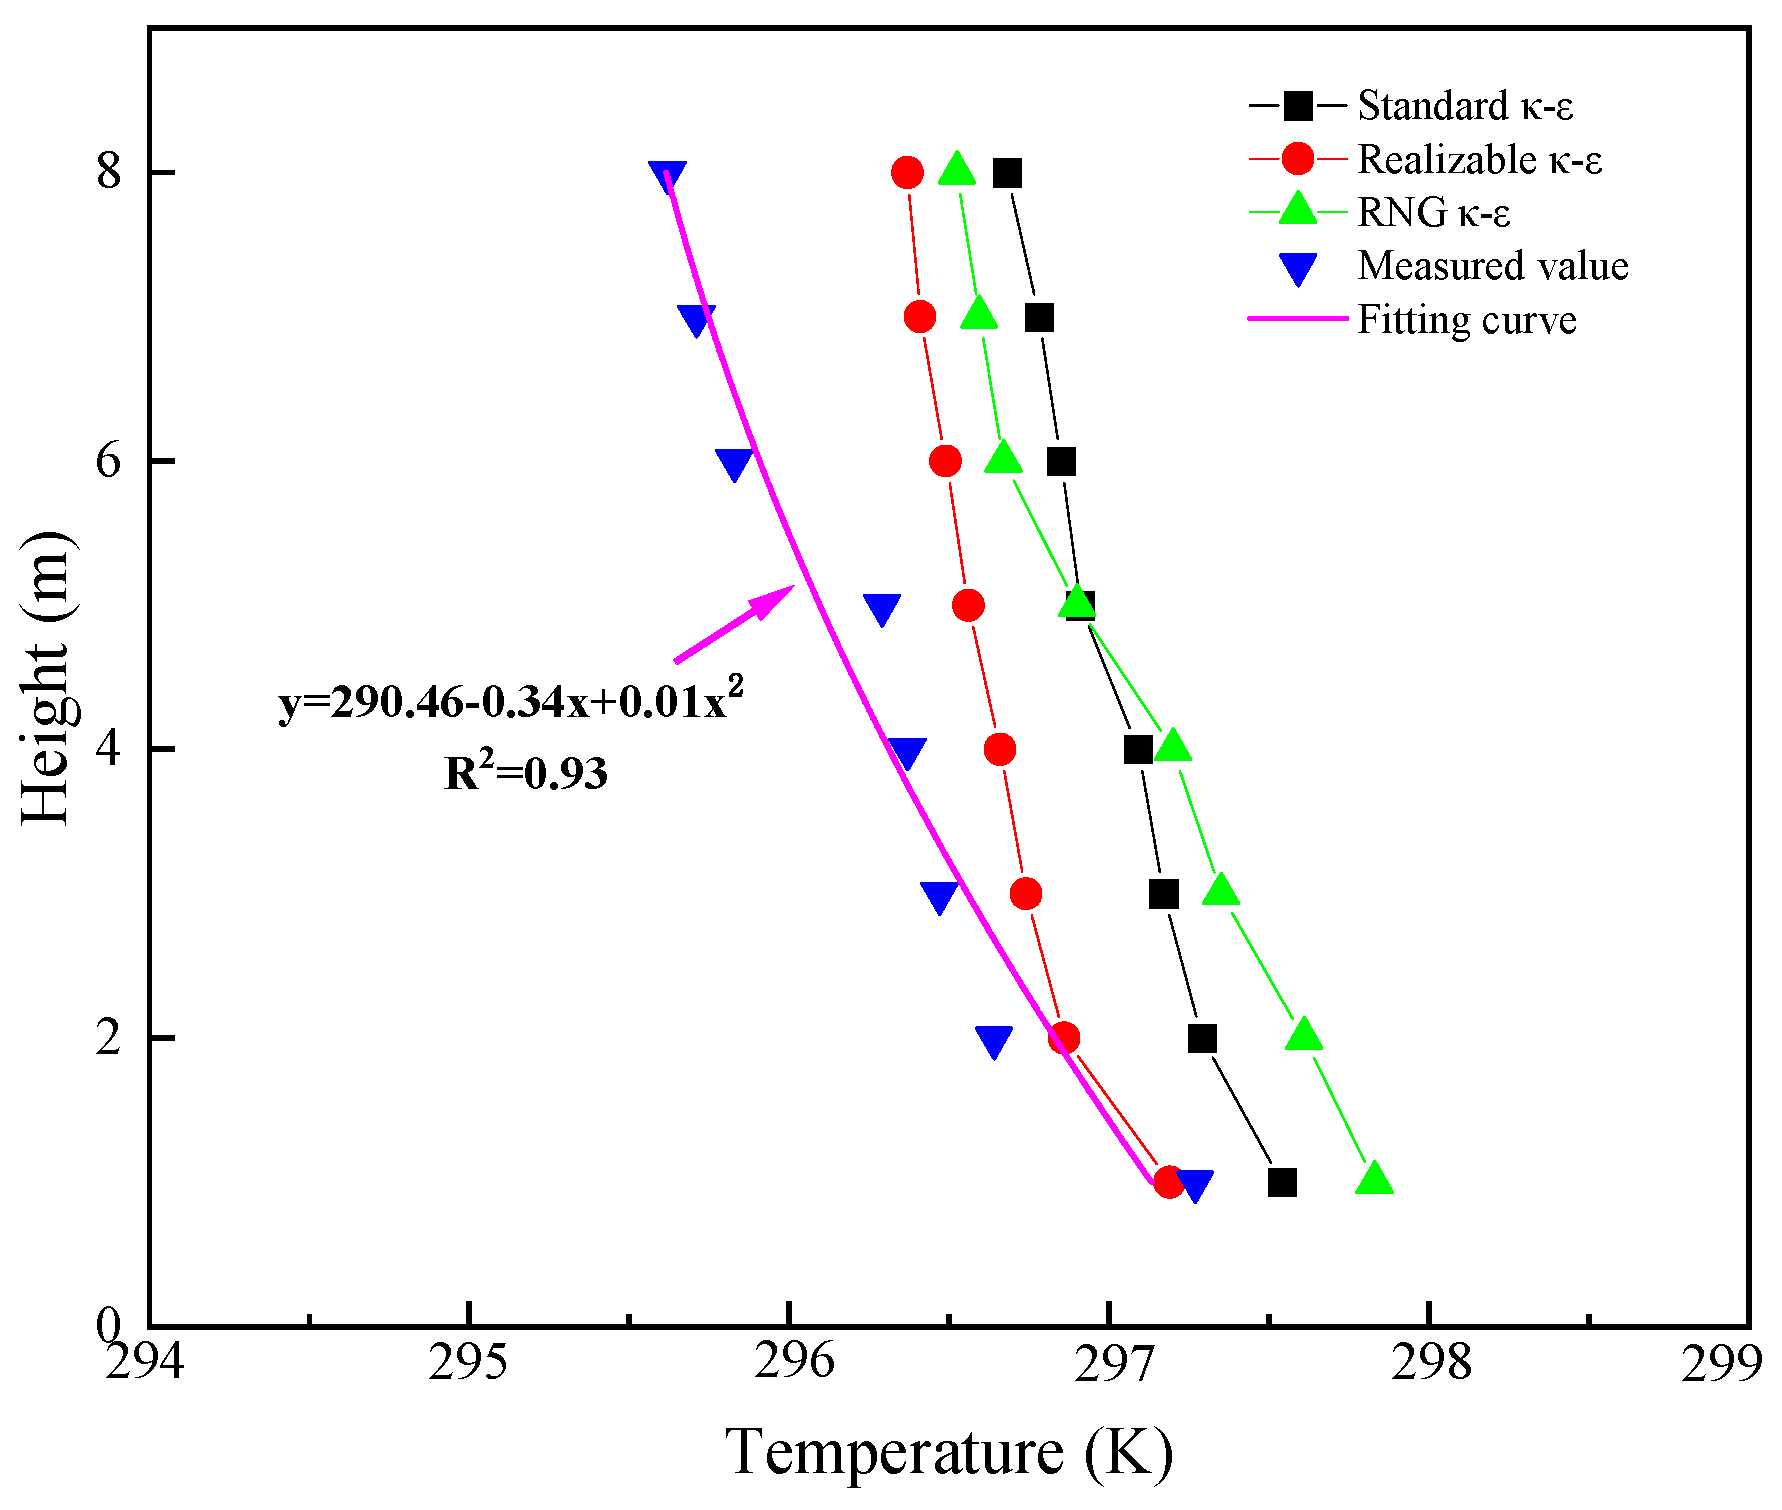
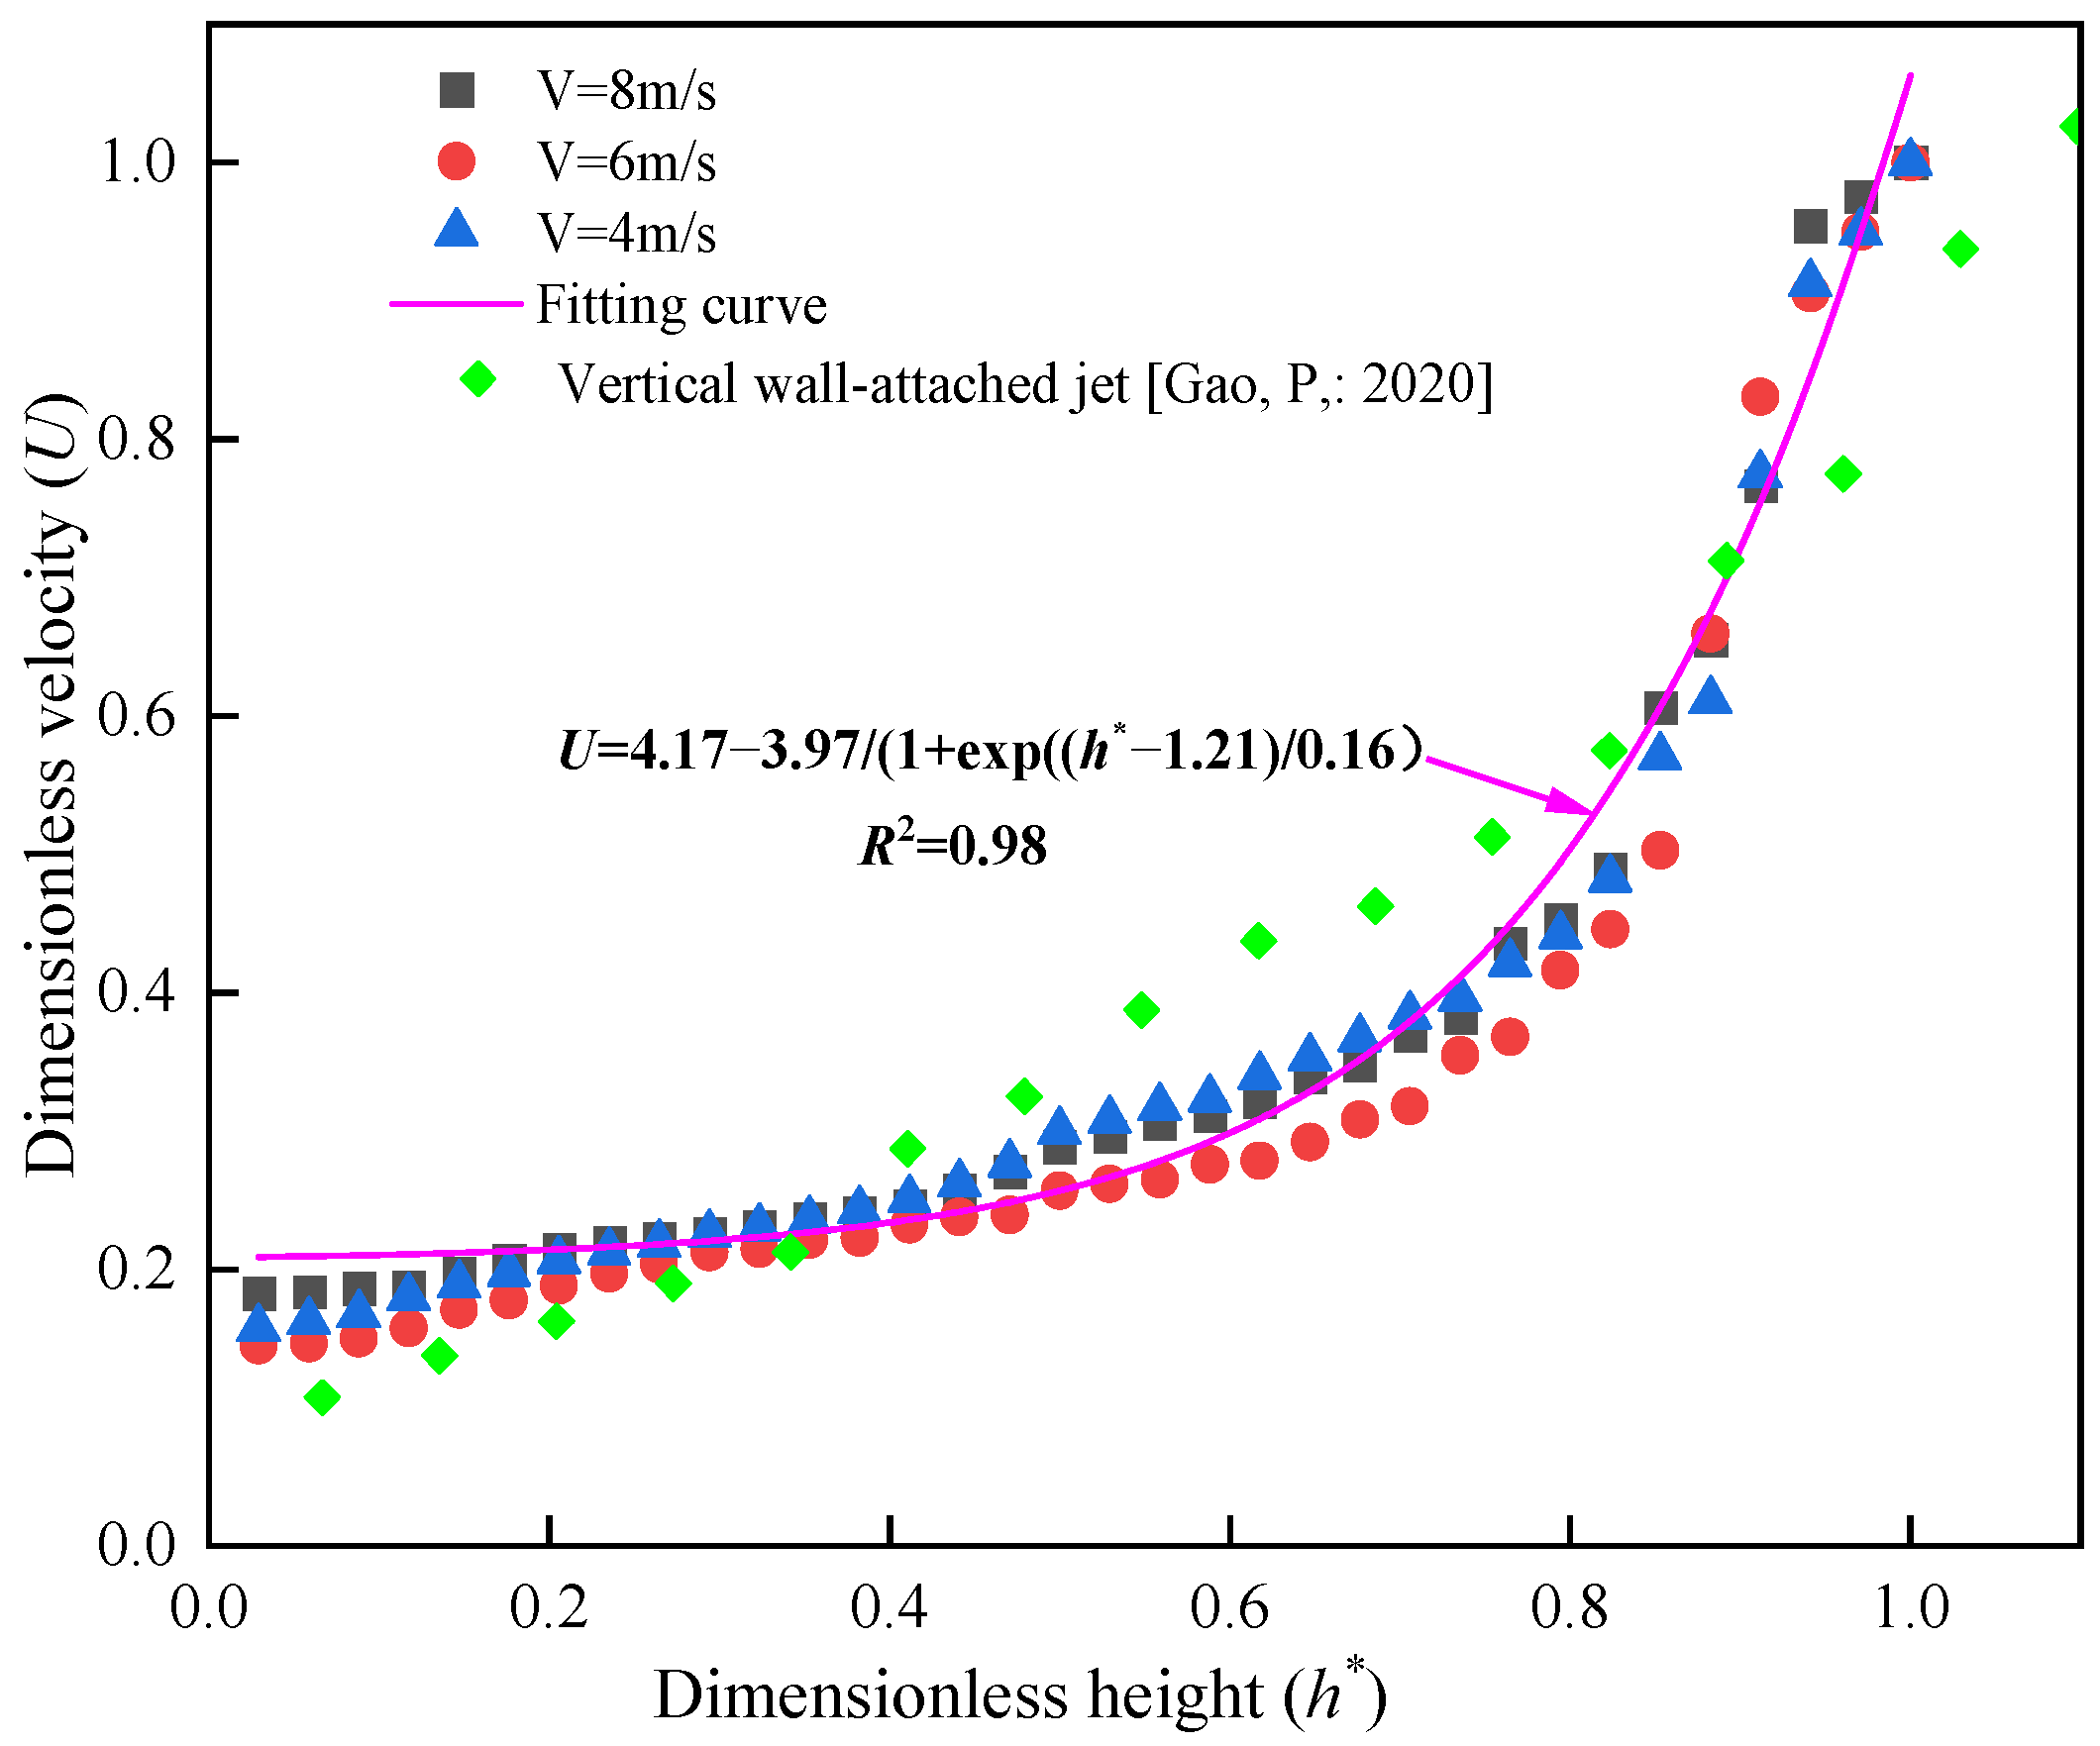
2.6. Numerical Model Validation
3. Processing Method of Testing Data and Evaluation Indexes
3.1. Dimensionless Temperature
3.2. Dimensionless Velocity
3.3. Head-Foot Temperature Difference
3.4. Percentage of Dissatisfaction (PD)
3.5. Non-Uniformity Coefficient
3.6. Energy Utilization Coefficient
3.7. Air Diffusion Performance Index (ADPI)
4. Results and Discussion
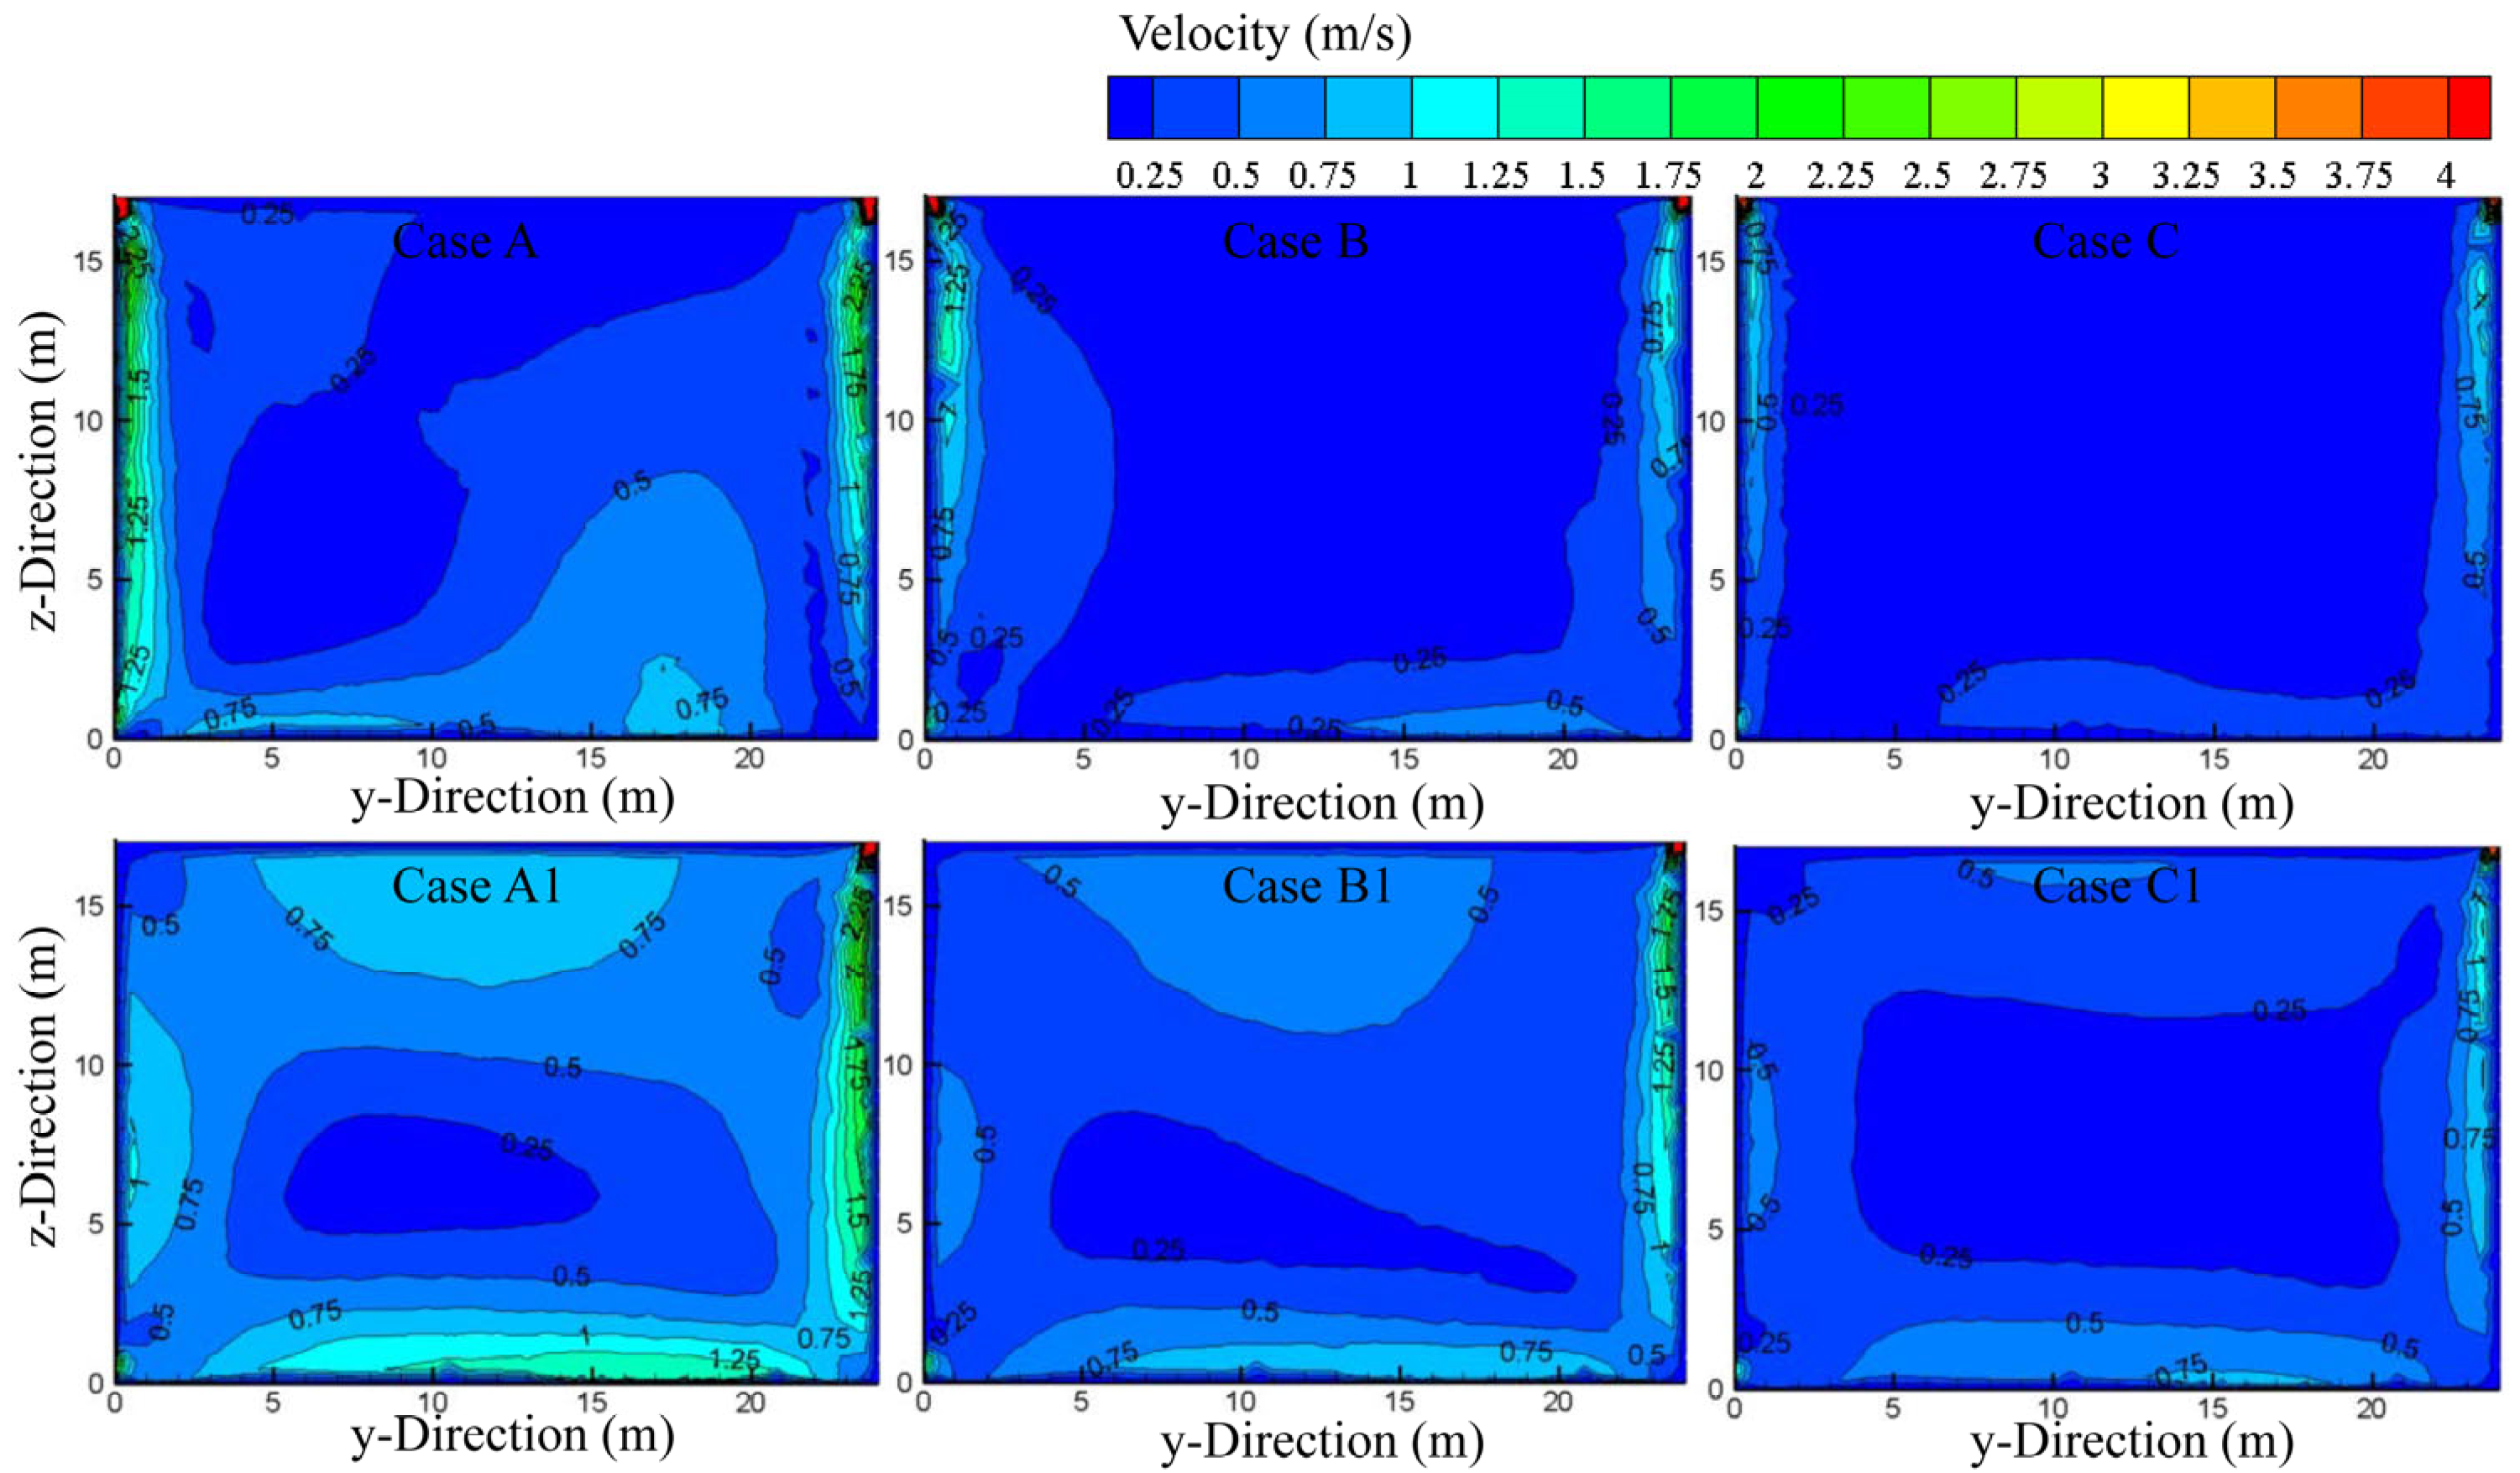
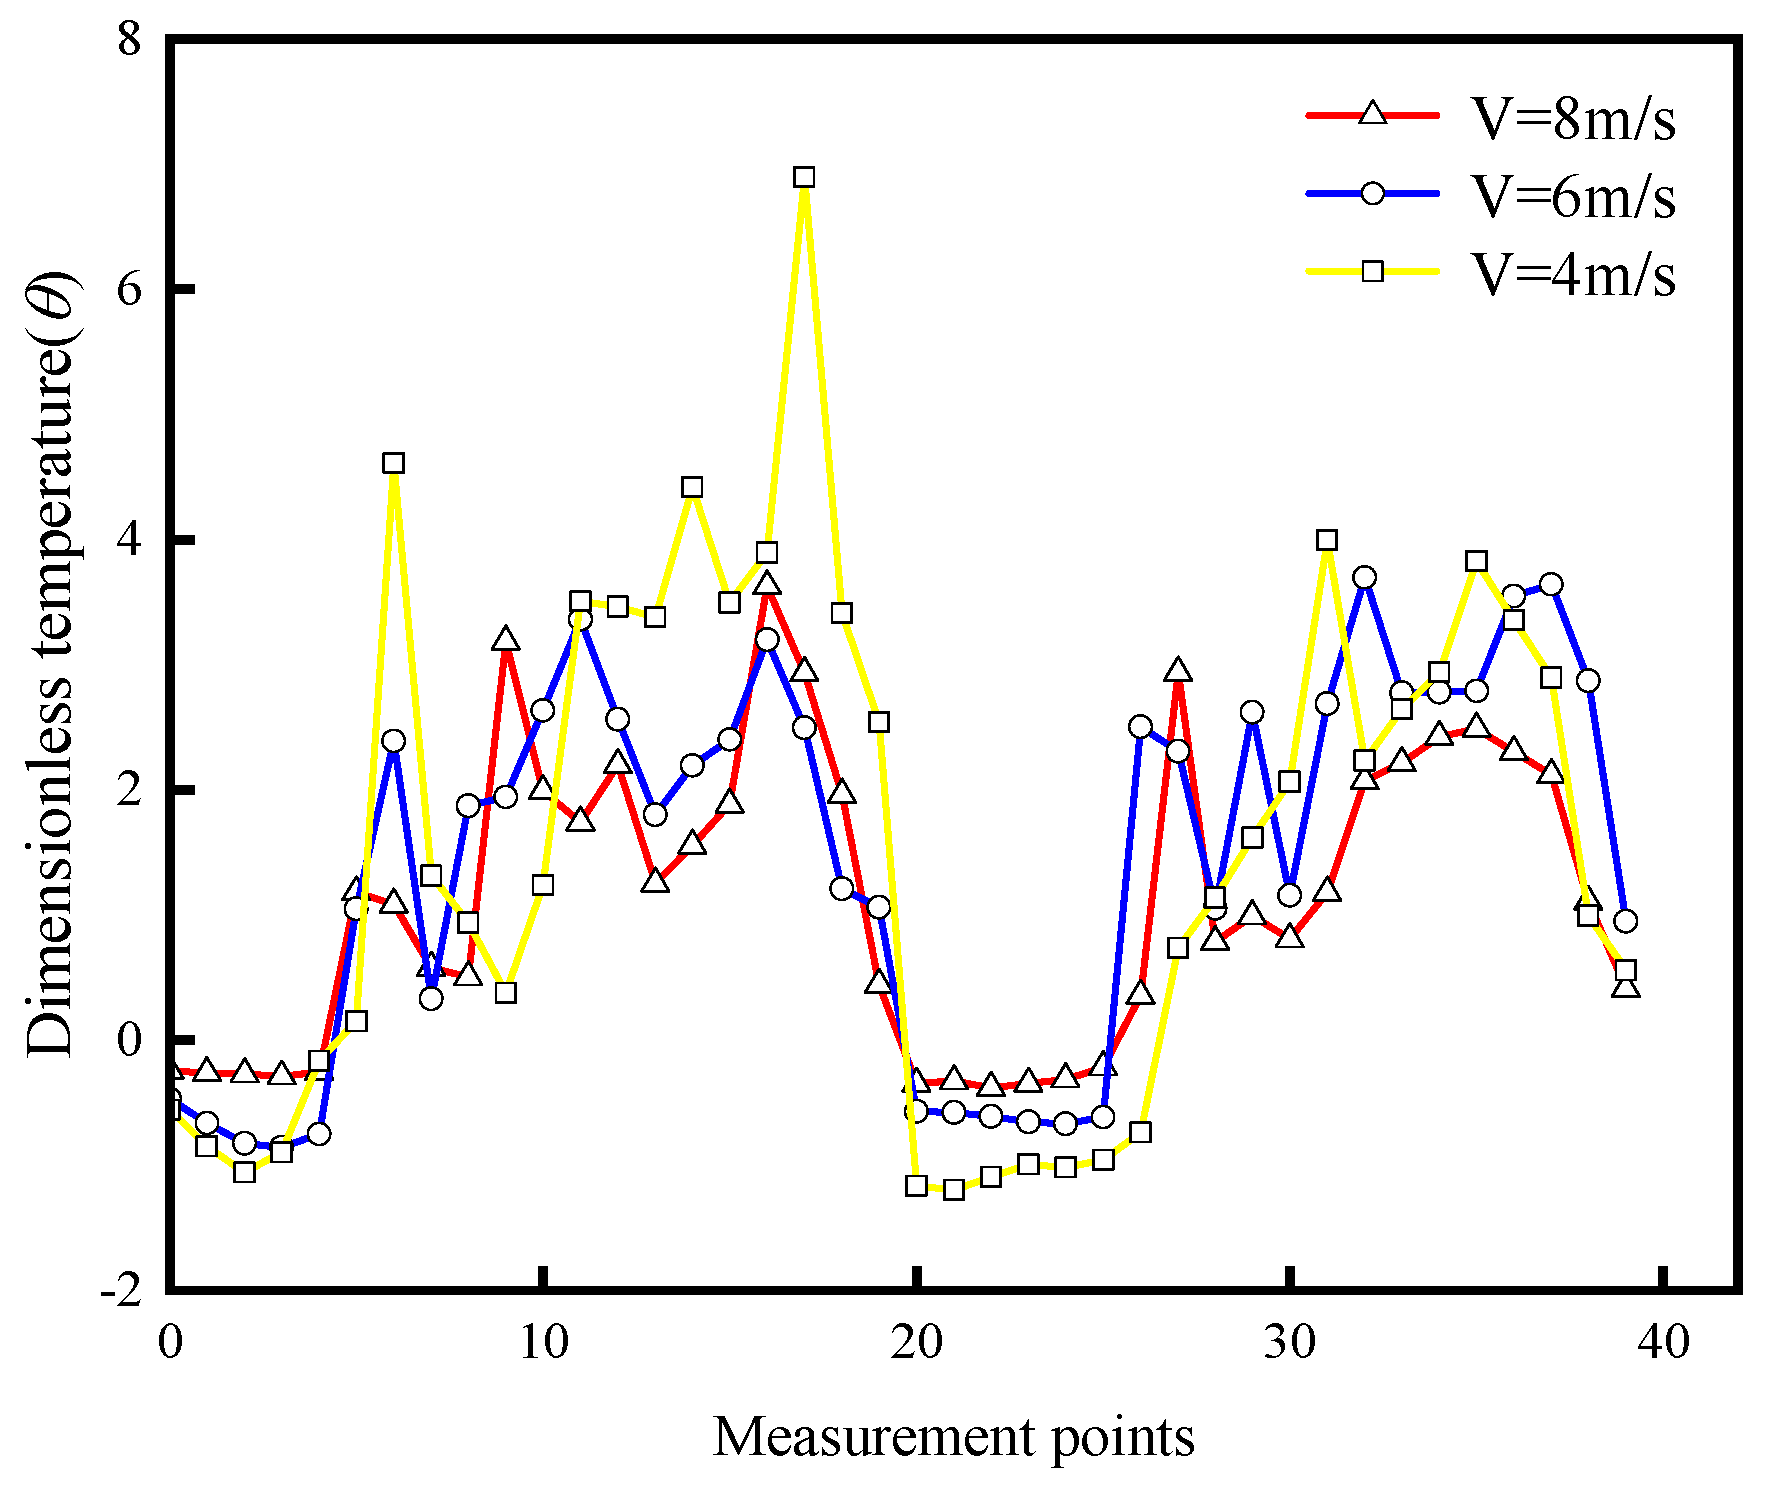
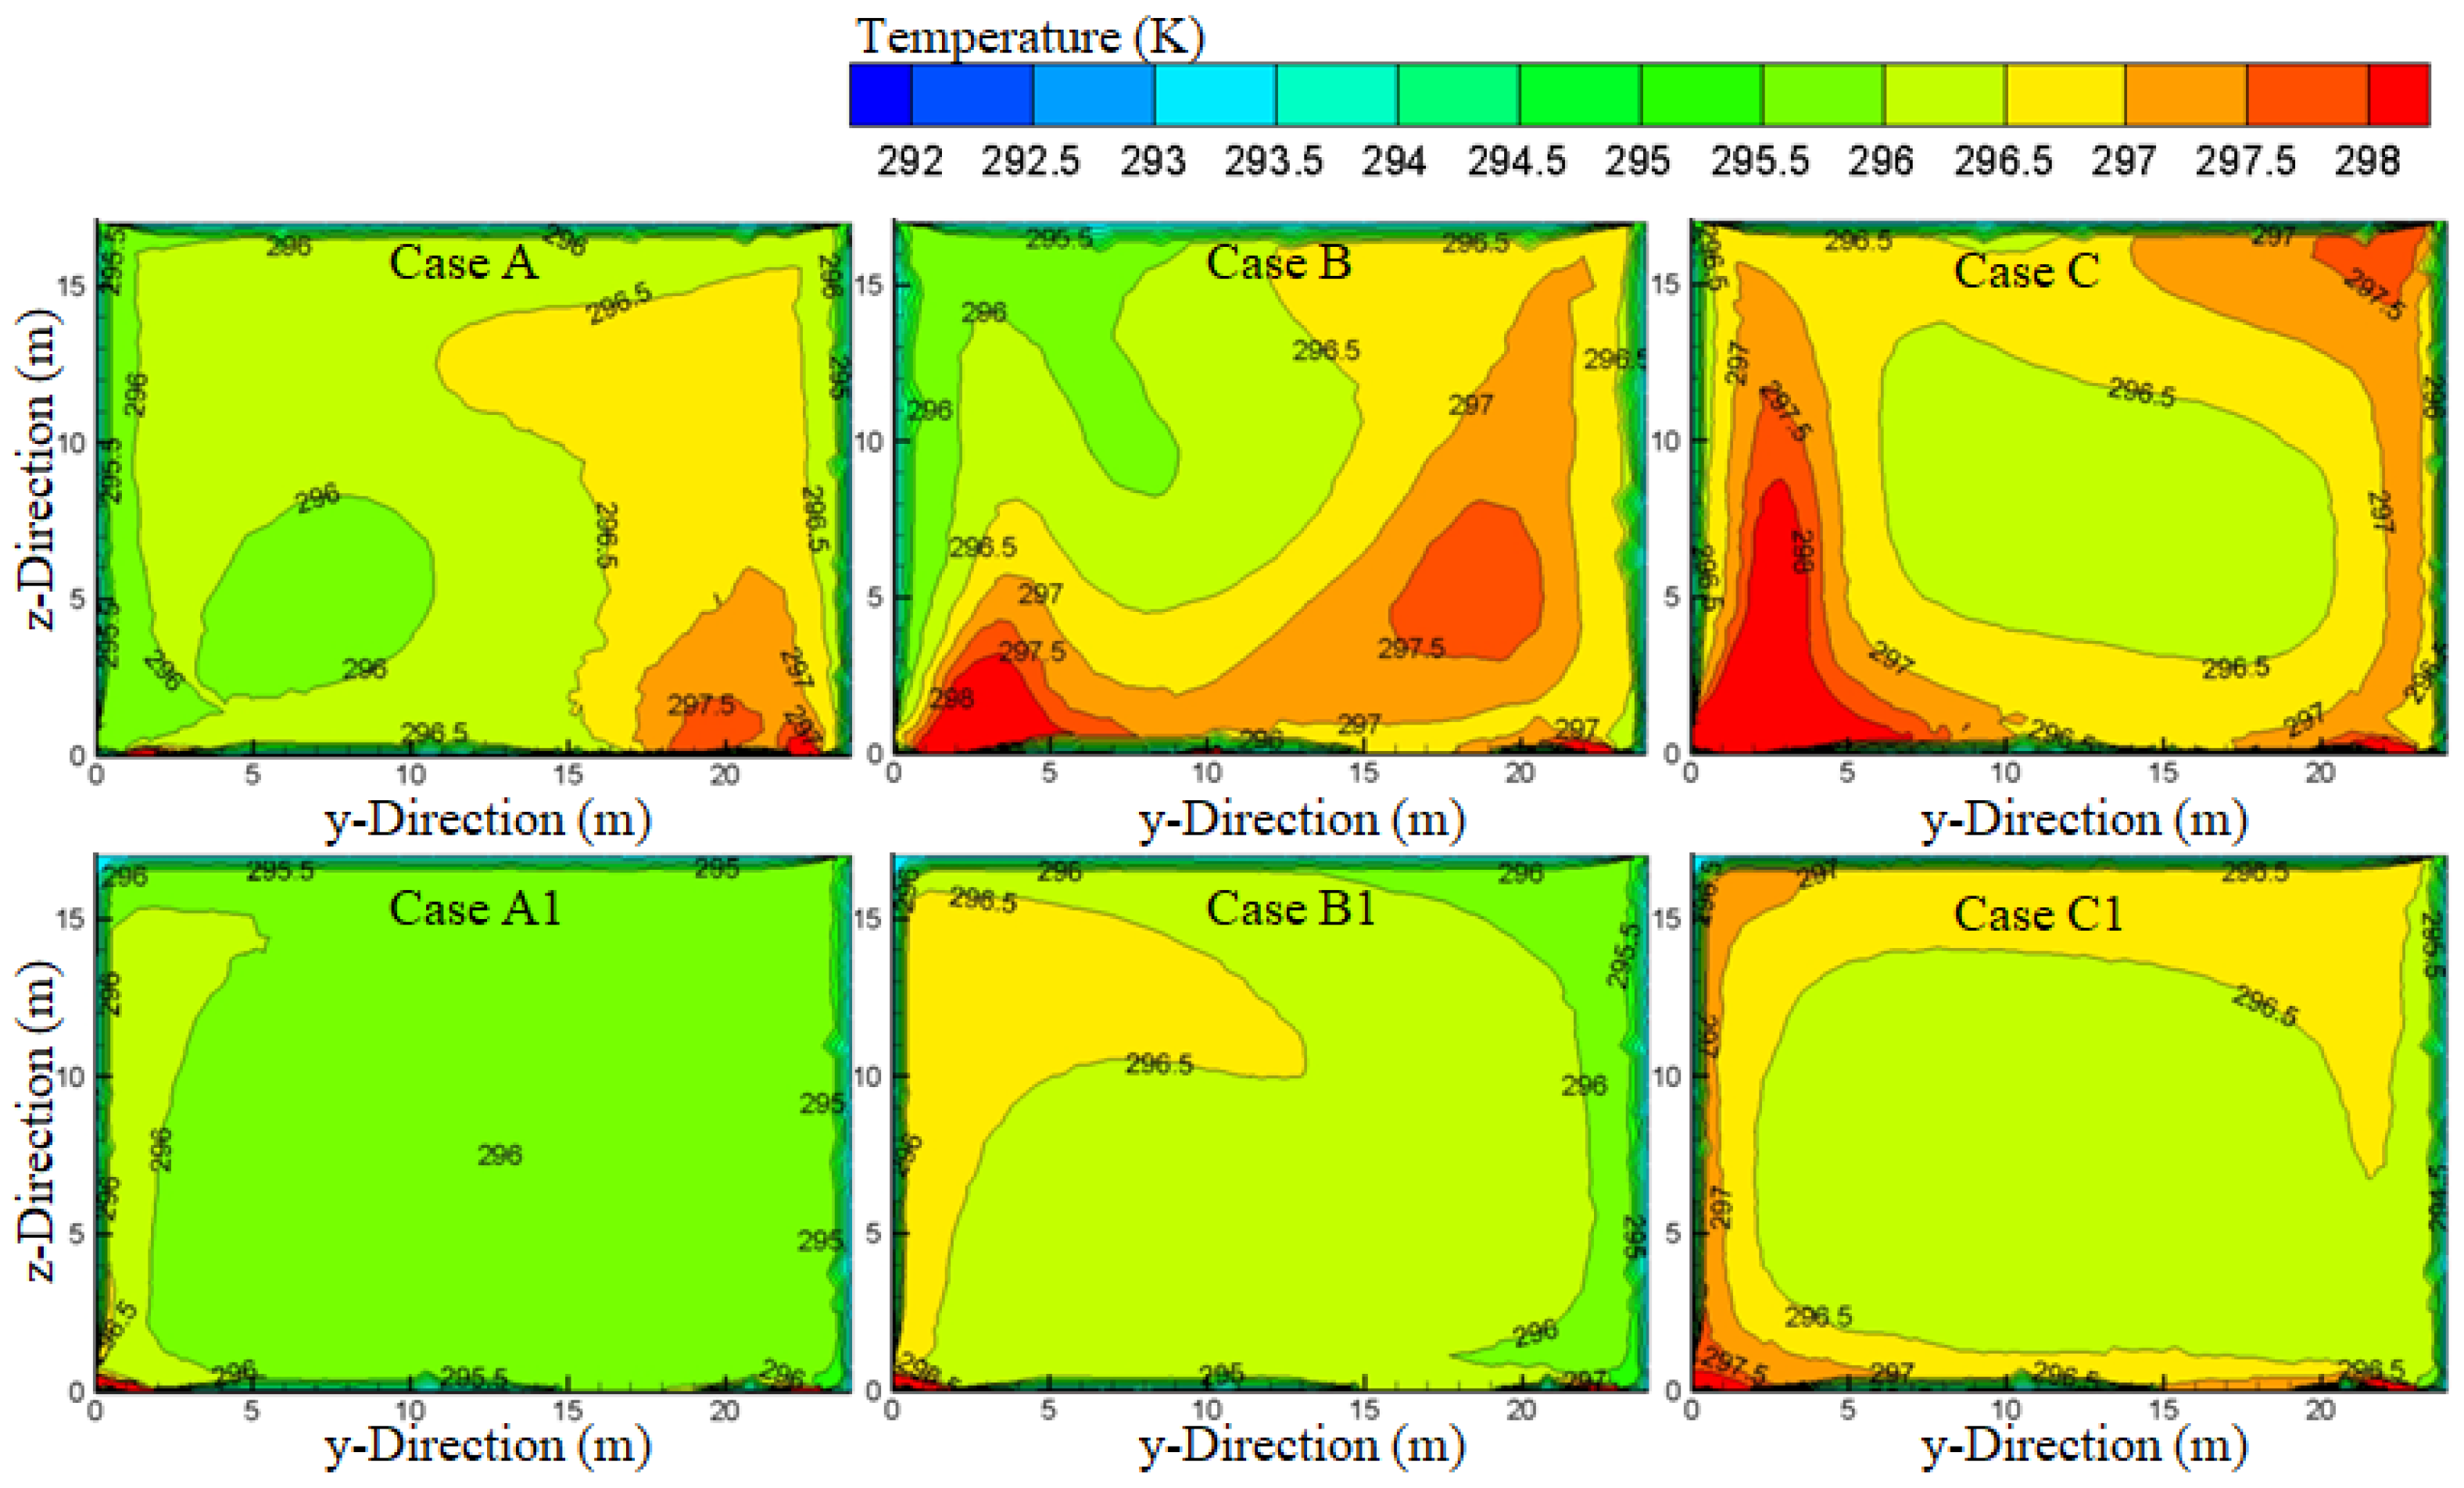
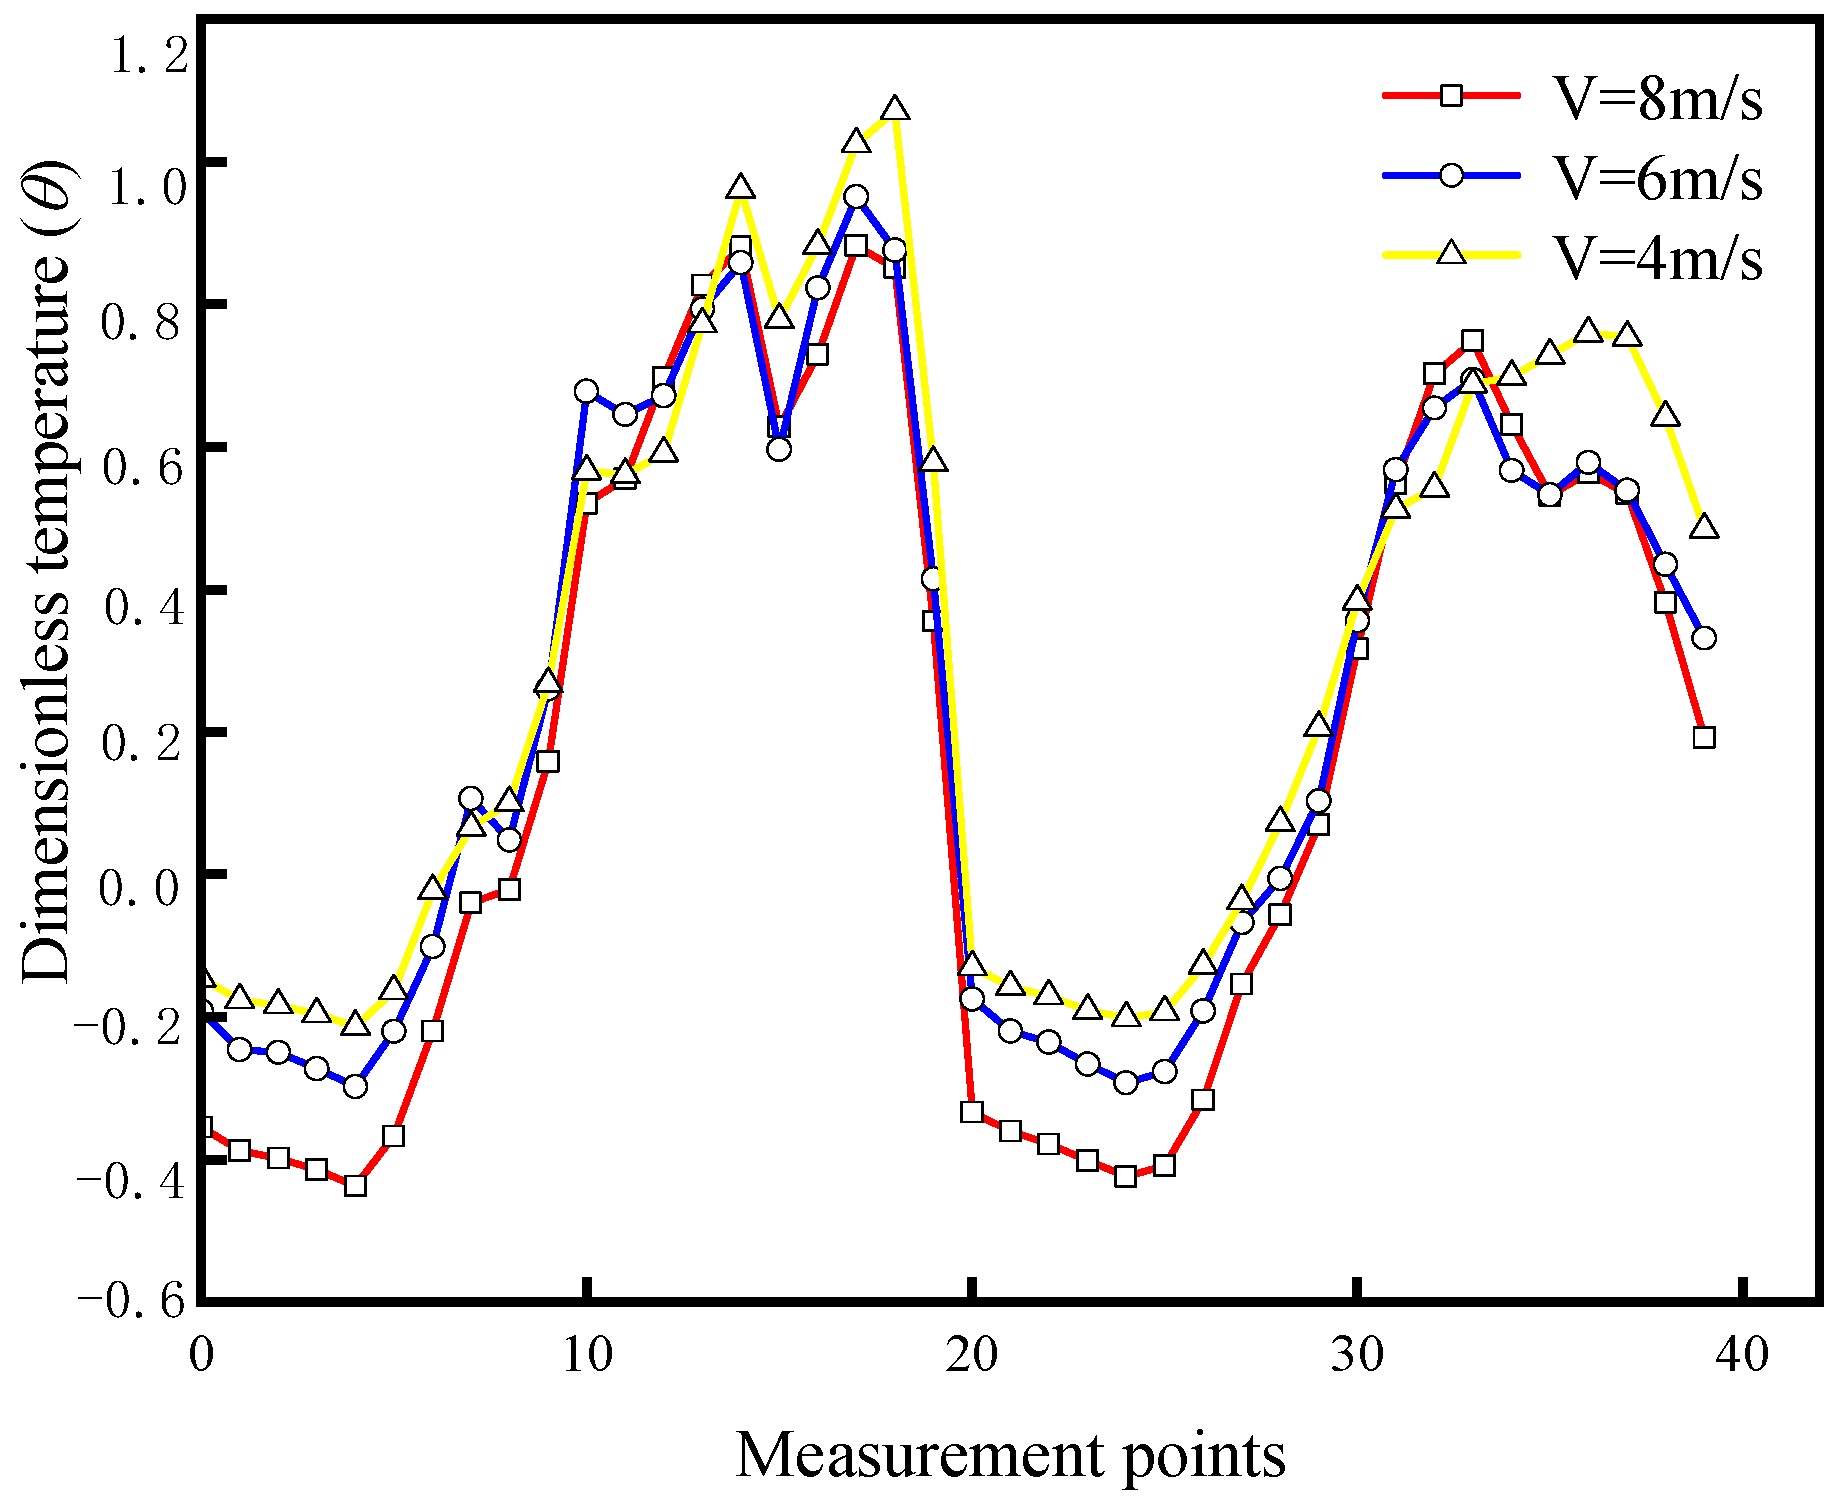
4.1. The Effect of Air Supply Velocity
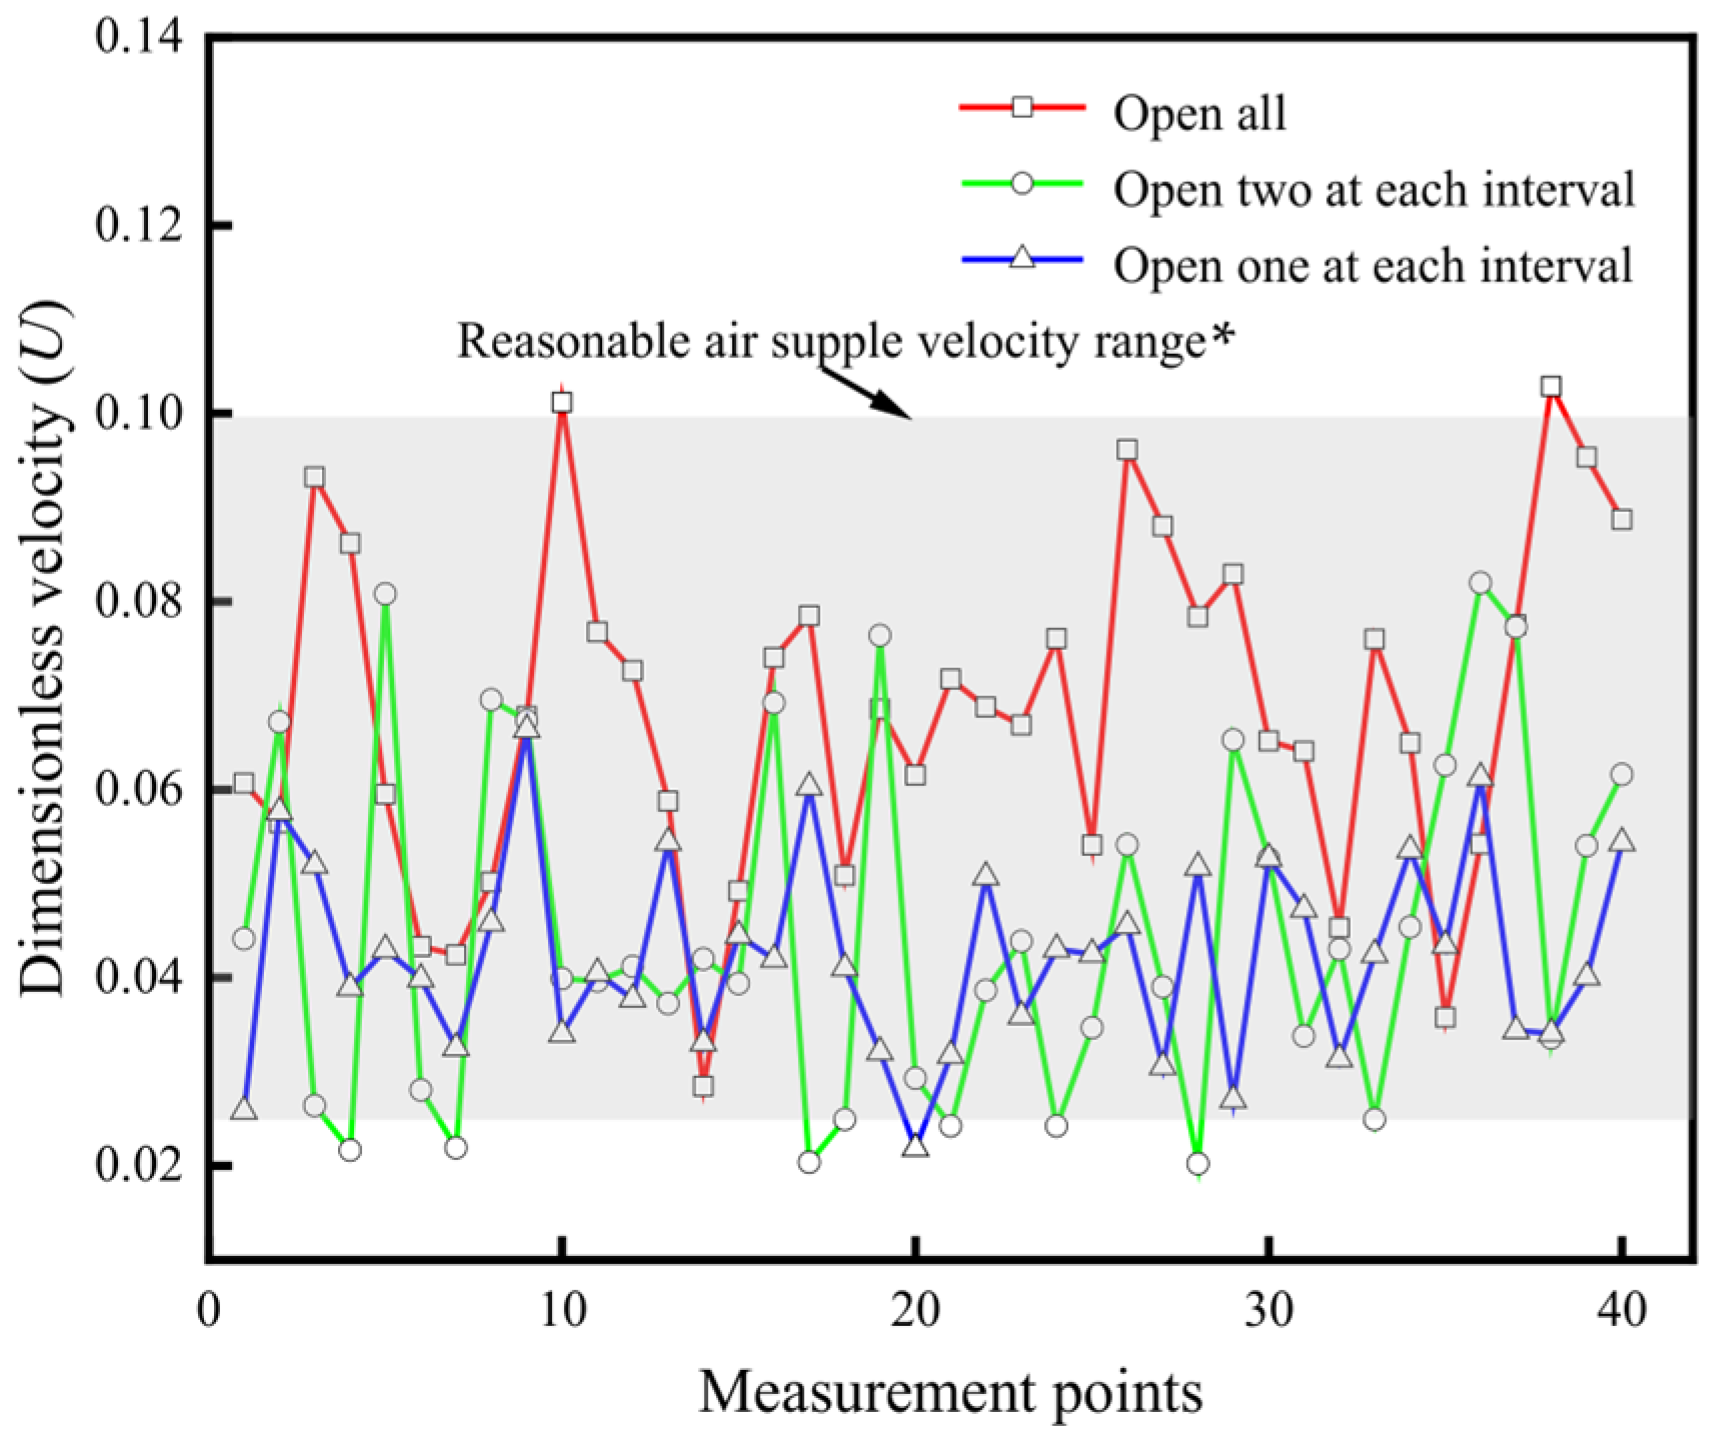
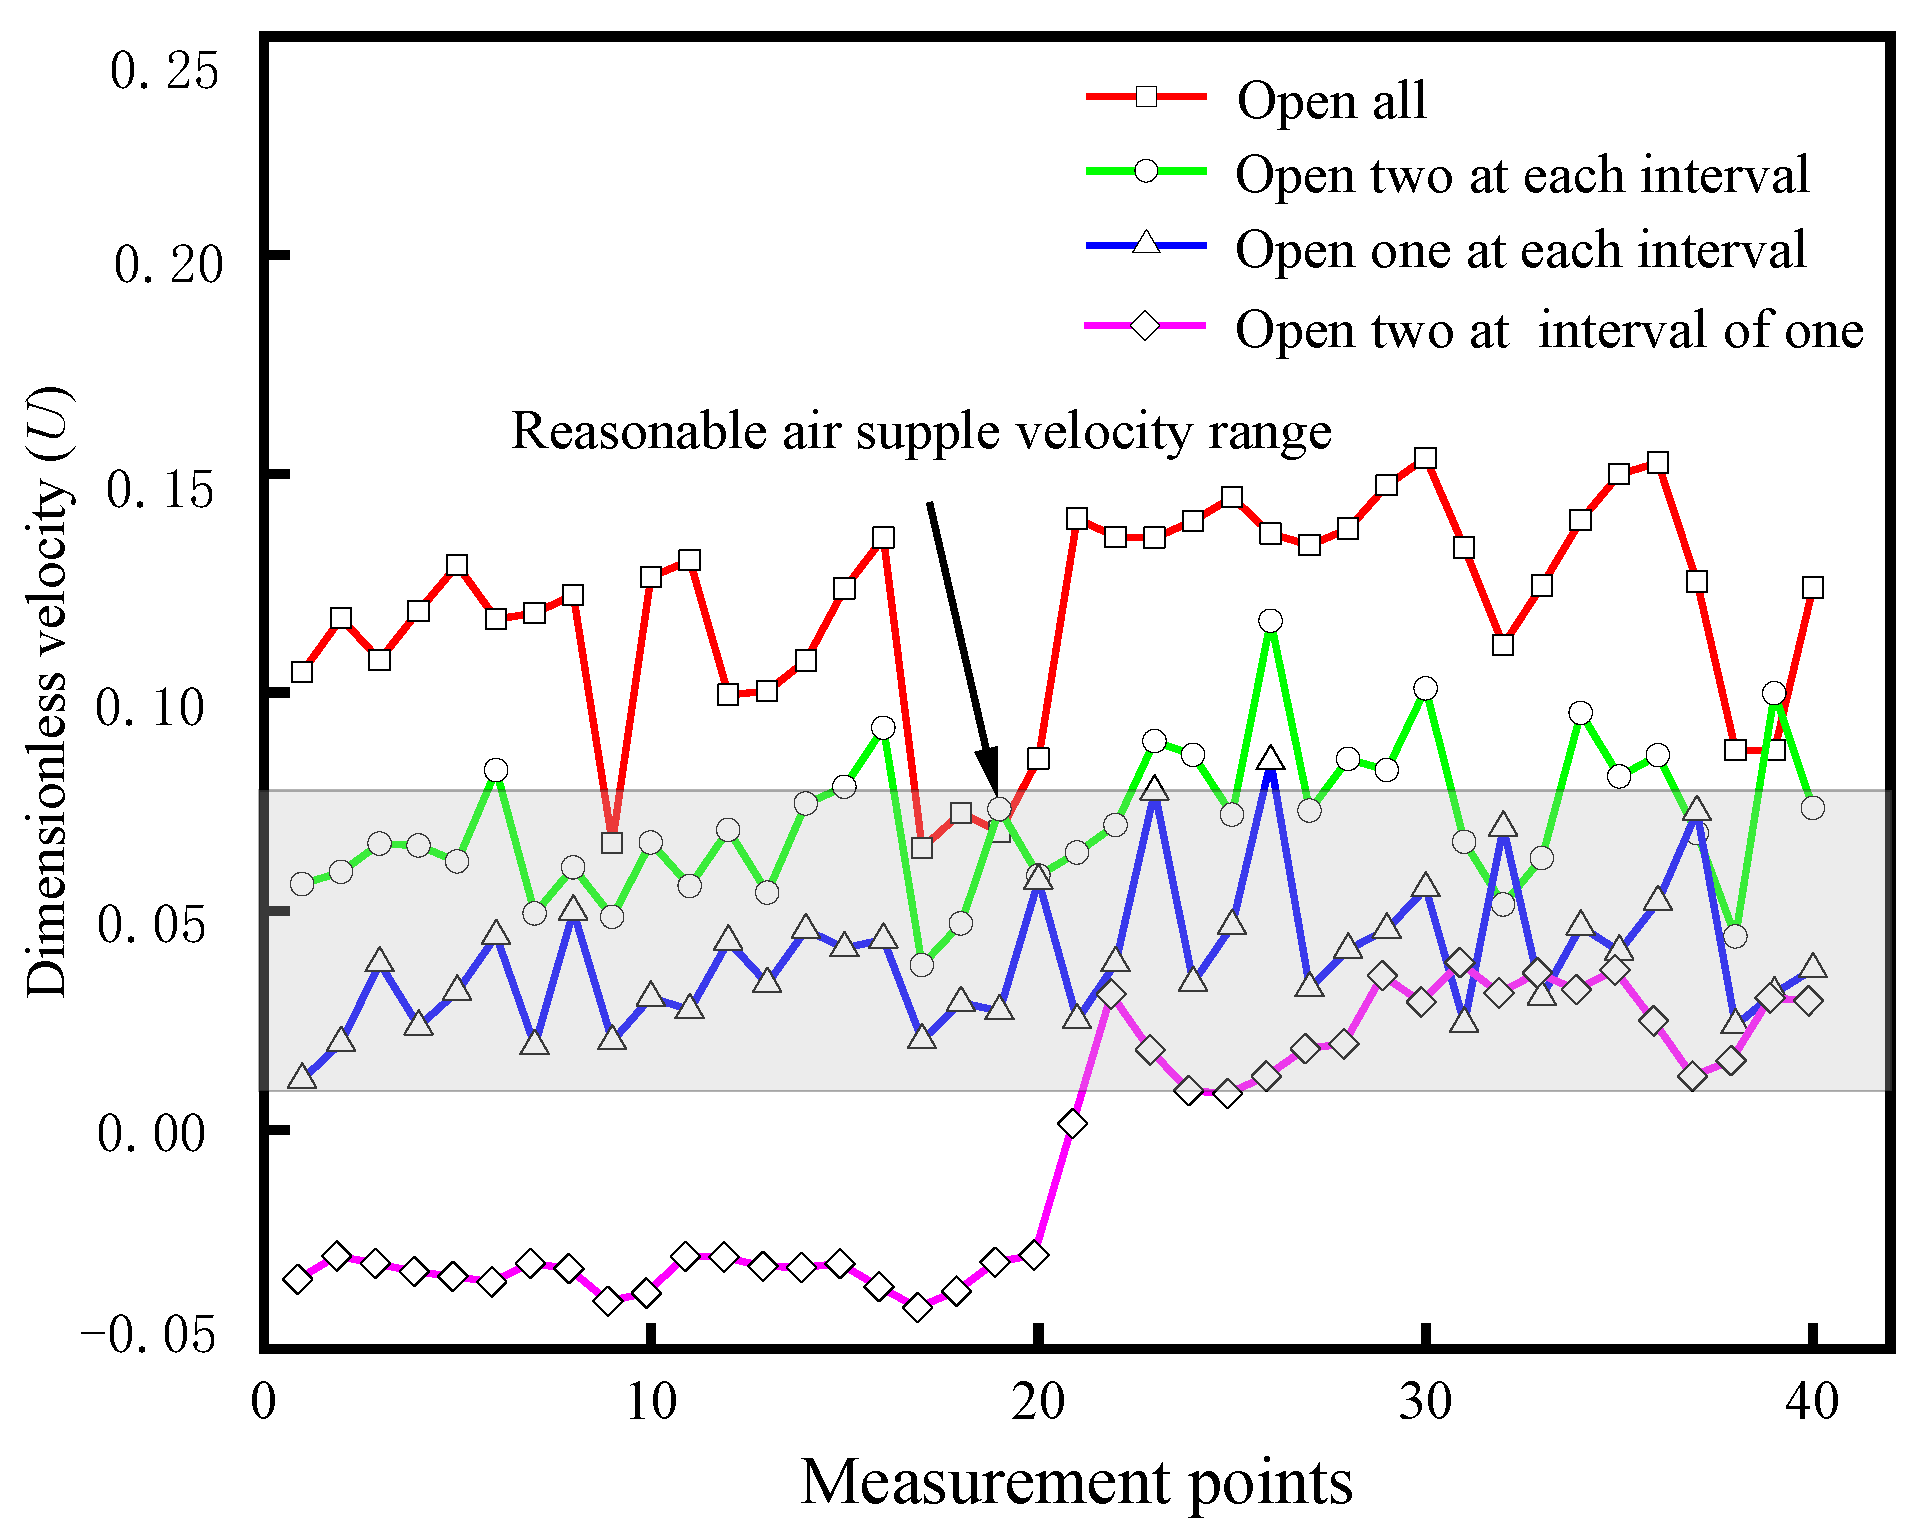
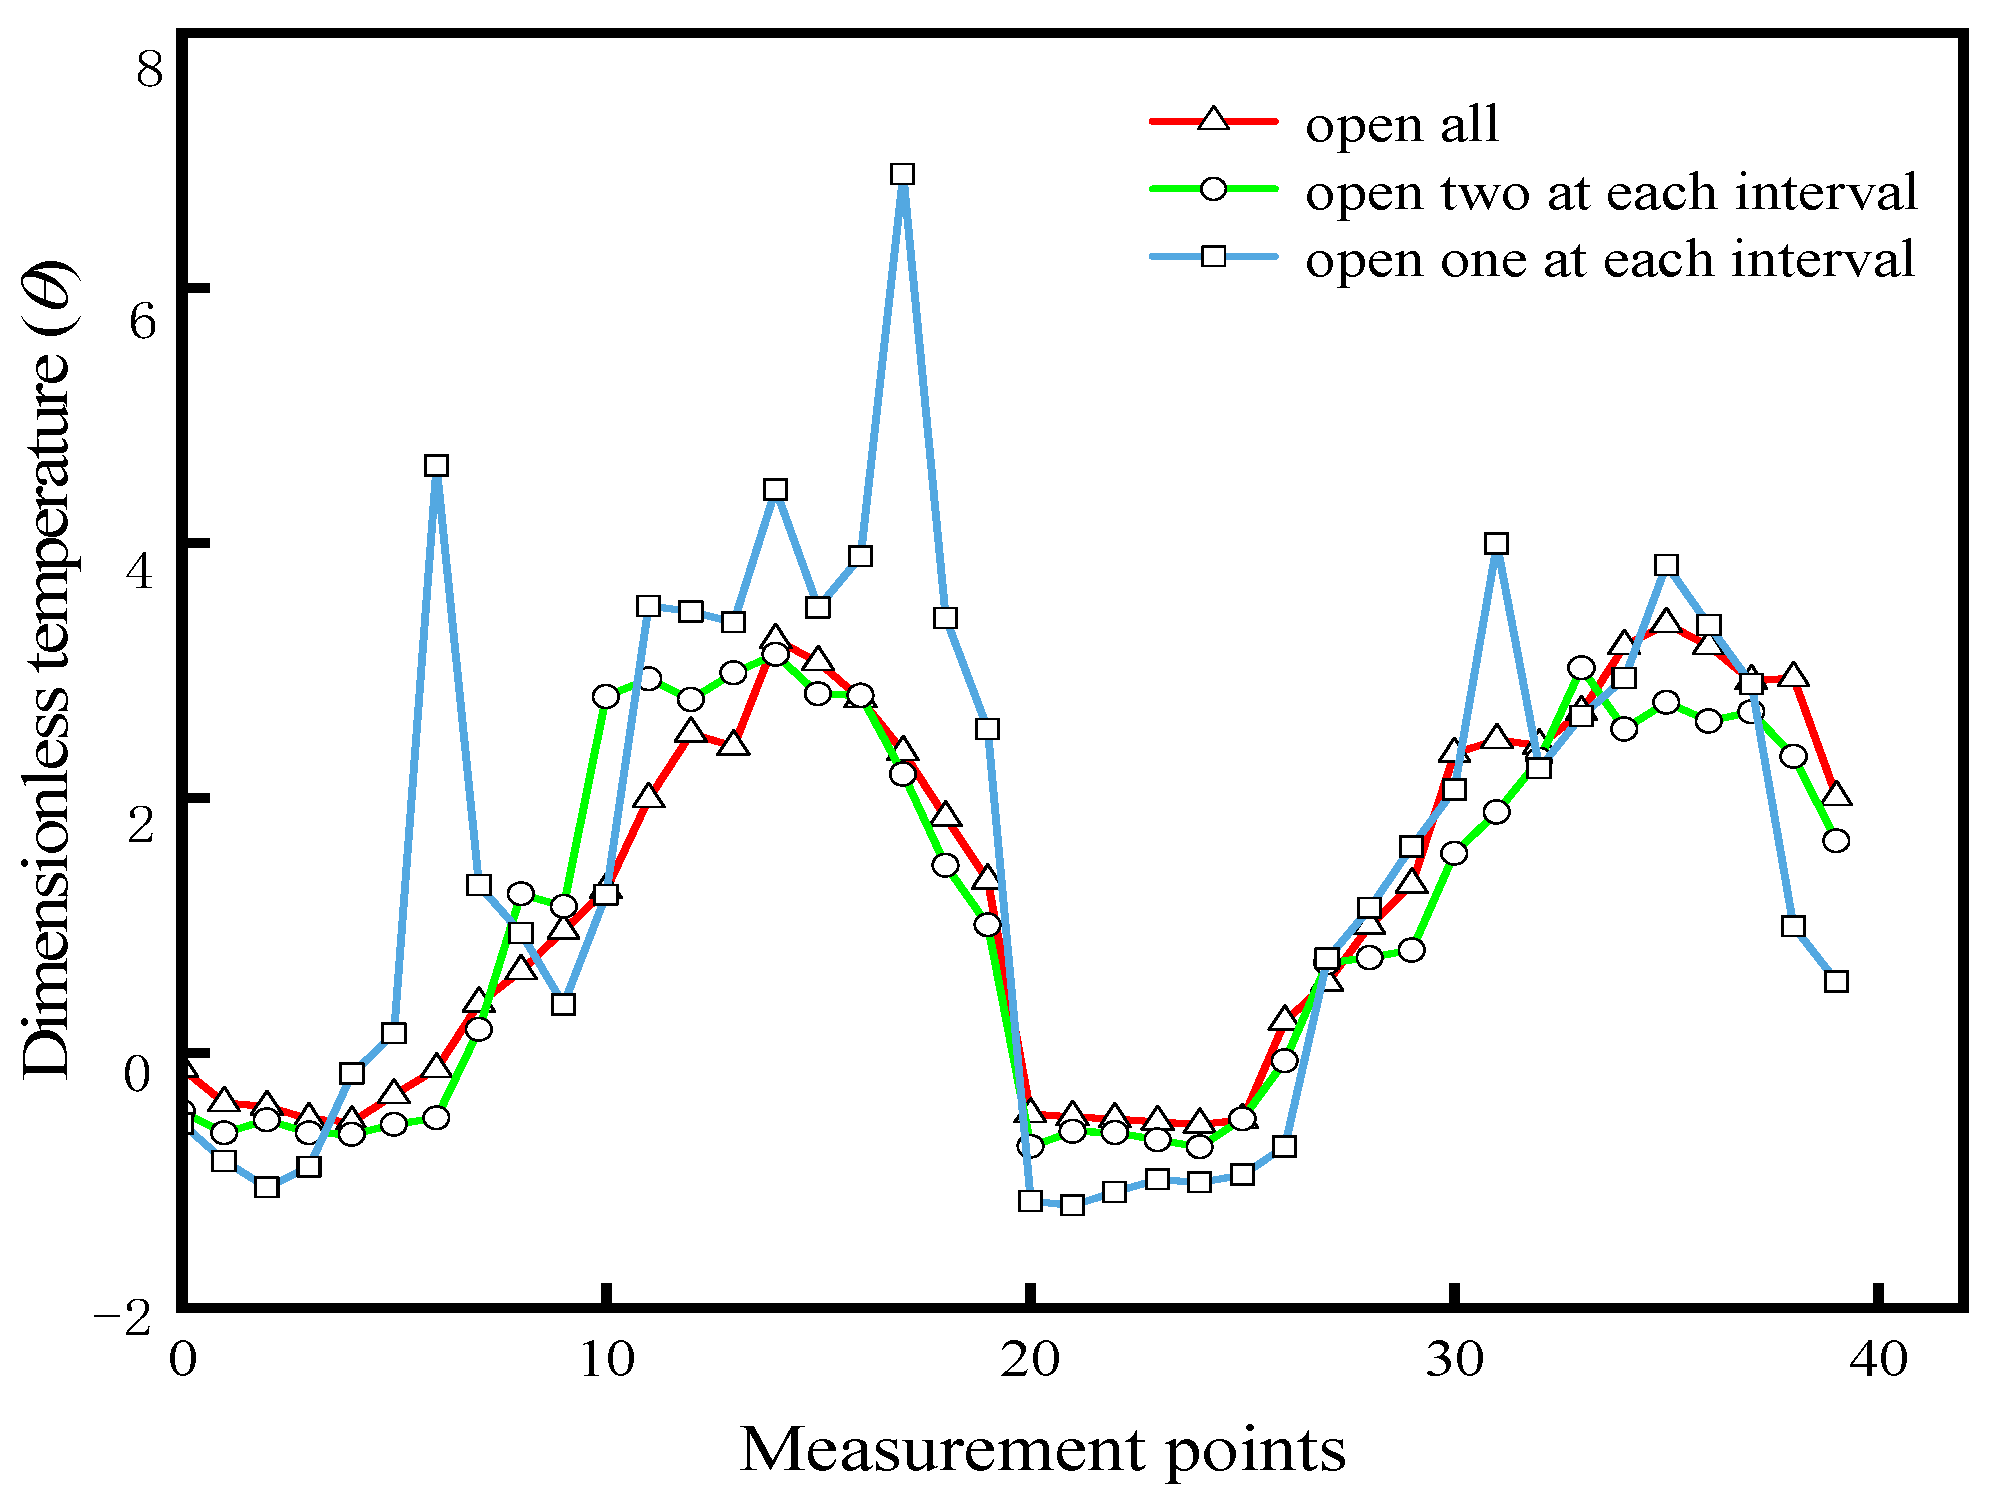
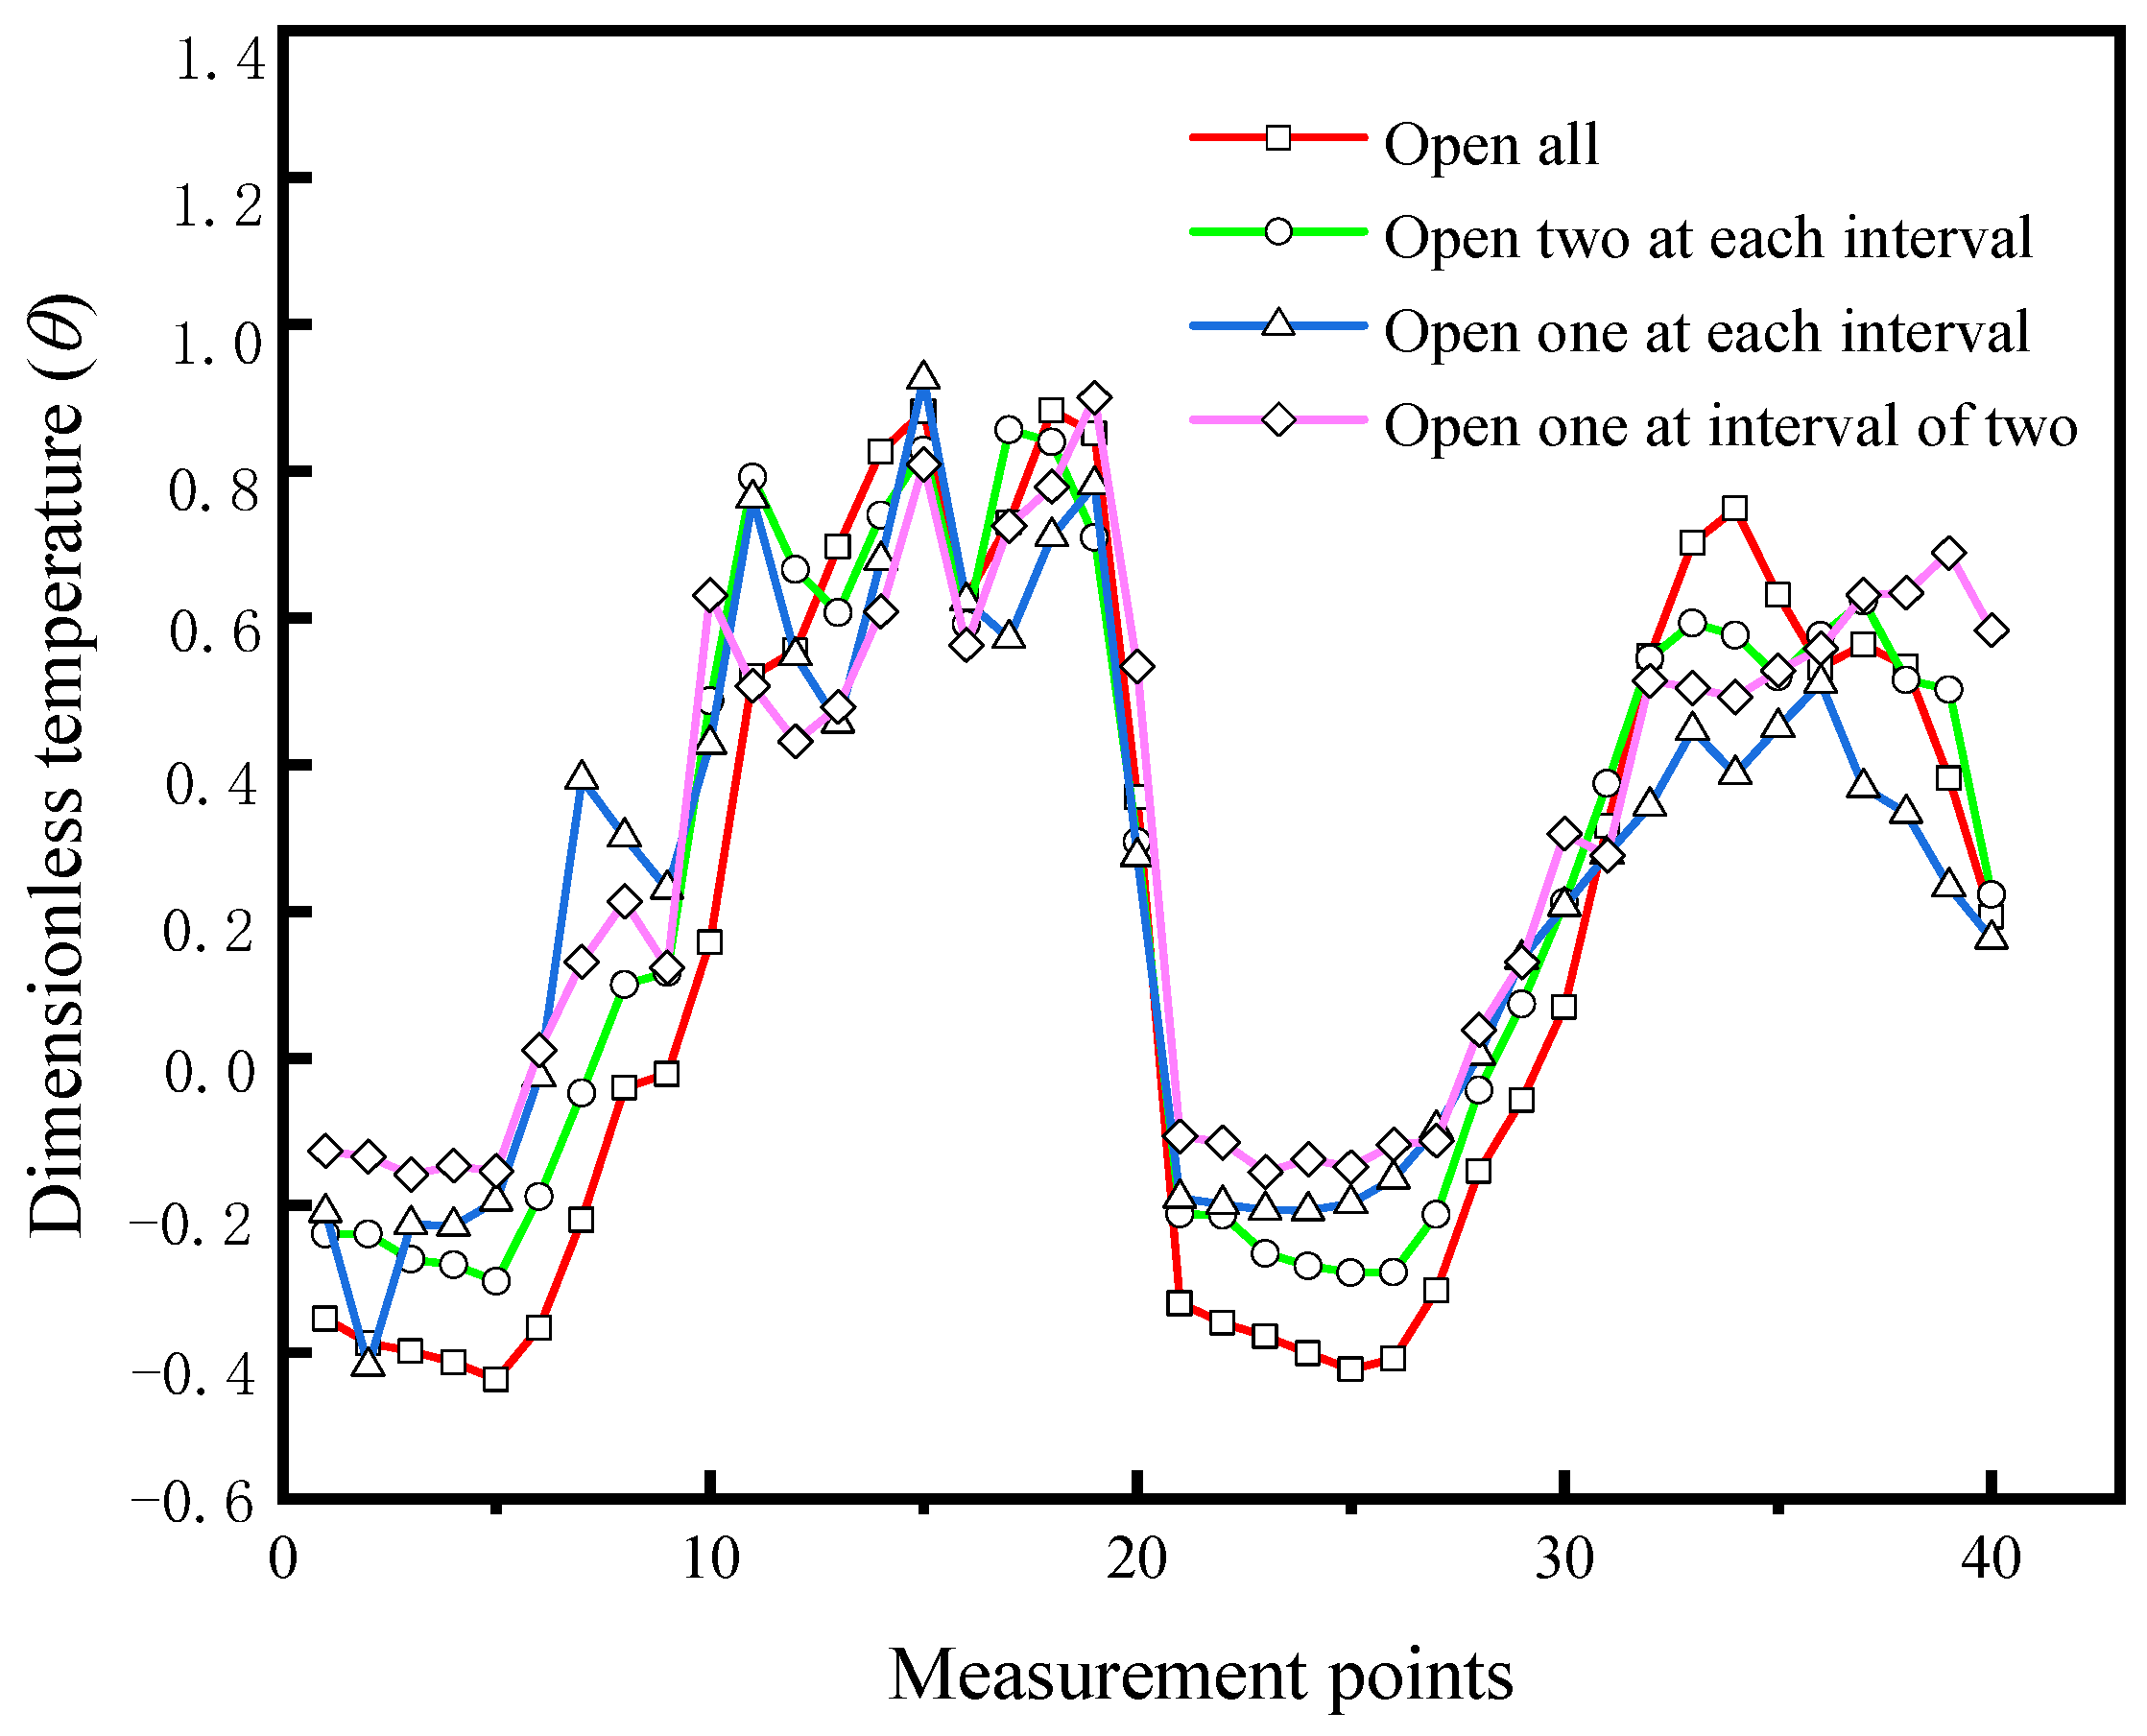
4.2. Opening Mode of Air Supply Outlet
4.3. The Positioning of Air Supply Outlet
5. Conclusions
- (1)
- In the single-sided vertical wall-attached ventilation mode, the head-foot temperature difference and PD could all meet the requirements of the relevant specifications. When the velocity was increased from 4 m/s to 8 m/s, the maximum increment in was 41%, the maximum reduction in Kv was 9.5%, the maximum reduction in Kt was 34%, and the ADPI value reached 70%. With an increase in the number of outlet openings, the maximum increment of was 43%, the maximum reduction in Kv was 47%, the maximum reduction in Kt was 21%, and the ADPI reached its maximum value of 72.5%.
- (2)
- In the double-sided vertical wall-attached air supply mode, the head-foot temperature difference and PD and ADPI value became smaller than that in the single-sided mode, changing the air supply velocity and air supply opening has little effect on , and the variation trend of Kv and Kt was consistent with the single-sided mode.
- (3)
- Compared with the double-sided vertical wall-attached air supply, the single-sided mode energy utilization coefficient was higher, which could make the heat exchange in the generator layer working area more efficient. The working area’s mean airflow velocity was higher than in the double-sided mode. However, when the number of outlet openings changed, the overall temperature change in the working area was not obvious in the single-sided mode.
Author Contributions
Funding
Data Availability Statement
Conflicts of Interest
References
- China Building Energy Efficiency Association Building Energy Consumption and Carbon Emission Data Special Committee. Research Report of China Building Energy Consumption and Carbon Emissions; China Building Energy Efficiency Association Building Energy Consumption and Carbon Emission Data Special Committee: Chongqing, China, 2022. [Google Scholar]
- Asim, N.; Badiei, M.; Mohammad, M.; Razali, H.; Rajabi, A.; Haw, L.C.; Ghazali, M.J. Sustainability of heating, ventilation and air-conditioning (HVAC) systems in buildings—An overview. Int. J. Environ. Res. Public Health 2020, 19, 1016. [Google Scholar] [CrossRef] [PubMed]
- Dong, J.K.; Gao, Y.; Sun, D.N.; Jiang, Y.Q.; Huang, S. Overview of implications, targets and technical paths of carbon neutrality in building sector. Heat. Vent. Air Cond. (HVAC) 2023, 10, 69–78. [Google Scholar]
- Xu, G.Y. Problems in HVAC design under concept of carbon neutrality. Energy Energy Conserv. 2022, 12, 29–131+135. [Google Scholar]
- Wang, Y.; Mauree, D.; Sun, Q.; Lin, H.; Scartezzini, J.L.; Wennersten, R. A review of approves to low carbon transition of high-rise residual builds in China. Renew. Sustain. Energy Rev. 2020, 131, 109990. [Google Scholar] [CrossRef]
- Ahn, H.; Rim, D.; Lo, L.J. Ventilation and energy performance of partitioned indoor spaces under mixing and displacement ventilation. Build Simul. 2018, 11, 561–574. [Google Scholar] [CrossRef]
- Cho, H.; Cabrera, D.; Sardy, S.; Kilchherr, R.; Yilmaz, S.; Martin, K.P. Evaluation of performance of energy efficient hybrid ventilation system and analysis of failants’ behavior to control windows. Build. Environ. 2021, 188, 107434. [Google Scholar] [CrossRef]
- Zha, X.S.; Chen, Y.; Xie, F.X. Design and optimization of ventilation system for dam gallery of a hydropower station. Refrig. Air Cond. 2023, 1, 64–67. [Google Scholar]
- He, Q.Y.; Li, B.; Ang, J. Research on intelligent ventilation control of underground building of hydropower station based on deep learning. Heat. Vent. Air Cond. (HVAC) 2023, 53 (Suppl. S1), 254–257. [Google Scholar]
- Wang, J. Study on Intelligent Control of Ventilation System for Underground Powerhouse of Hydropower Station. Master’s Thesis, Huazhong University of Science & Technology, Wuhan, China, 2021. [Google Scholar]
- Liu, Y.N.; Xiao, Y.M.; Chen, J.L.; Augenbroe, G.; Zhou, T.C. A network model for natural ventilation simulation in deep buried underground structures. Build. Environ. 2019, 153, 288–301. [Google Scholar] [CrossRef]
- Wu, H.; Liu, J.; Wang, X.G.; Liu, L.H.; Tian, Z.H. In Situ Monitoring and Numerical Experiments on Vertical Deformation Profiles of Large-Scale Underground Caverns in Giant Hydropower Stations. Geofluids 2021, 2021, 6673825. [Google Scholar] [CrossRef]
- Xia, Y.M.; Xiao, X.M.; Zhang, Y.Z.; Wang, S.Y.; Lin, L.K. Numerical Simulation of Ventilation Performance for Large-scale Underground Cavern Group Considering Effect of Ventilation Shaft Structure. Arab. J. Sci. Eng. 2022, 47, 4093–4104. [Google Scholar] [CrossRef]
- Wang, Z.F.; Liu, Y.; Lei, T.; Gong, S.Q.; Ding, Y.; Wang, J.M.; Mo, W.J.; Xing, J.L. Study on ventilation and air conditioning strategy model test in underground hydropower station under part generator operation condition. Heat. Vent. Air Cond. (HVAC) 2018, 4, 71–75+124. [Google Scholar]
- Fu, X.Z.; Ding, Y.R. Discussion on air quality and thermal and humidity environment control design of residential buildings in hot summer and cold winter zone. Heat. Vent. Air Cond. (HVAC) 2021, 10, 58–63. [Google Scholar]
- Cheng, Z.; Li, L.L.; Qi, X.L.; Zhang, P.F. Research on the influence of ventilation opening shape on the wind pressure ventilation effect of gymnasium. Build. Sci. 2020, 36, 106–111+146. [Google Scholar] [CrossRef]
- Wang, H.D.; Hu, H.; Zhu, J.K.; Yang, X.Q.; Wang, R.K. Study on inter-zonal heat transfer for large space buildings with floor-level side wall air-supply system. J. Refrig. 2022, 2, 89–96. [Google Scholar]
- Huang, C.; Fan, Q.H.; Li, J.L.; Yue, J.; Wang, F.; Zou, Z.J.; Zhu, J.Y.; Miao, Y.F. B-G model of total heat in winter for large space buildings with low-side wall air supply systems. Heat. Vent. Air Cond. (HVAC) 2022, 10, 135–143. [Google Scholar]
- Sun, Y.X.; Yin, H.G.; Chen, T.; Wu, R.; Li, A.G. Ventilation effectiveness and human thermal comfort of displacement ventilation mode based on square column attachment. Heat. Vent. Air Cond. (HVAC) 2018, 7, 105–110. [Google Scholar]
- Dong, Z.W.; Zhang, L.T.; Yang, Y.W.; Li, Q.F.; Huang, H. Numerical study on coupled operation of stratified air distribution system and natural ventilation under multi-variable factors in large space buildings. Energies 2021, 14, 8130. [Google Scholar] [CrossRef]
- Ye, X.; Qi, H.C.; Kang, Y.M.; Zhong, K. Optimization study of heating performance for an impinging jet ventilation system based on data-driven model coupled with TOPSIS method. Build. Environ. 2022, 22, 109465. [Google Scholar] [CrossRef]
- Yamasawa, H.; Kobayashi, T.; Yamanaka, T.; Choi, N.; Cehlin, M.; Ameen, A. Prediction of thermal and contaminant environment in a room with impinging jet ventilation system by zonal model. Build. Environ. 2022, 221, 109298. [Google Scholar] [CrossRef]
- Thysen, J.-H.; Hooff, T.V.; Blocken, B.; Heijst, G.V. PIV measurements of opposing-jet ventilation flow in a reduced-scale simplified empty airplane cabin. Eur. J. Mech. B/Fluids 2022, 94, 212–227. [Google Scholar] [CrossRef]
- Ameen, G.V.; Cehlin, M.; Larsson, U.; Yamasawa, H.; Kobayashi, T. Numerical investigation of the flow behavior of an isothermal corner impinging jet for building ventilation. Build. Environ. 2022, 223, 109486. [Google Scholar] [CrossRef]
- Gu, J.Y.; Xie, D.Y.; Wang, L.Y.; Fan, J.W. CFD numerical simulation of ship engine room with jet ventilation system. Ship Sci. Technol. 2023, 45, 46–50. [Google Scholar]
- Andersson, H.; Kabanshi, A.; Cehlin, M.; Moshfegh, B. On the ventilation performance of low momentum confluent jets supply device in a classroom. Energies 2020, 13, 5415. [Google Scholar] [CrossRef]
- Wang, X.D.; Li, H.; Dong, J.L.; Wu, J.Q.; Tu, J.Y. Numerical study on mixing flow behavior in gas-liquid ejector. Exp. Comput. Multiph. Flow 2021, 3, 108–112. [Google Scholar] [CrossRef]
- Tan, D.Y.; Li, B.Z.; Cheng, Y.; Liu, H.; Chen, J.H. Airflow pattern and performance of wall confluent jets ventilation for heating in a typical office space. Indoor Built Environ. 2019, 29, 67–83. [Google Scholar] [CrossRef]
- Yin, H.G.; Wu, R.; Li, L.N.; Wang, Y.Y.; Li, A.G. Study on air flow structure characteristics of cylindrical attached ventilation under different column layout modes. Heat. Vent. Air Cond. (HVAC) 2020, 50, 120–124+132. [Google Scholar]
- Yin, H.G.; Li, L.N.; Wu, R.; Wang, Y.Y.; Li, A.G. A numerical study on the effect of column layout on air distribution and performance of column attachment ventilation. Build. Simul. 2021, 14, 1095–1108. [Google Scholar] [CrossRef]
- Han, O.; Li, A.G.; Yin, H.G. Comparative studies on isothermal attachment ventilation based on vertical walls, square and circular columns. Energy Build. 2021, 231, 110634. [Google Scholar]
- Karimipanah, T.; Awbi, H.B. Theoretical and experiential investigation of impinging jet ventilation and comparison with wall placement ventilation. Build. Environ. 2022, 37, 1329–1342. [Google Scholar] [CrossRef]
- He, X.J. Comparison of Airflow Organization Performance of Vertical Wall Attached Ventilation, Displacement Ventilation and Mixed Ventilation. Master’s Thesis, Xi’an University of Architecture and Technology, Xi’an, China, 2020. [Google Scholar]
- Ye, M.; Chen, T.; Zhong, K. Numerical study of thermal environment characteristics with impinging jet ventilation system in office buildings. Vent. Air Cond. 2021, 40, 30–34. [Google Scholar]
- Han, T.; Deng, H.N.; Li, A.G.; Liu, H.; Du, H. Measurement and comparison of thermal environment and ventilation performance under different heating air supply modes of wall attached ventilation and mixed ventilation. Heat. Vent. Air Cond. (HVAC) 2021, 10, 138–144. [Google Scholar]
- Han, T.; Xiong, J.G.; Deng, H.N.; Li, A.G. CFD simulation of horizontal attachment distance and thermal environment characteristics of rooms with vertical wall attached ventilation in heating mode. Heat. Vent. Air Cond. (HVAC) 2021, 8, 130–136+113. [Google Scholar]
- Cao, G.Y.; Ruponen, M.; Kurnitski, J. Experiential investigation of the velocity distribution of the attached plane jet after impingement with the corner in a high room. Energy Build. 2010, 42, 935–944. [Google Scholar] [CrossRef]
- Yin, H.G.; Chen, T.; Sun, Y.X.; Li, A.G. Analysis on air distribution characteristics of vertical wall attached air supply pattern and its influence factors. Build. Sci. 2016, 8, 33–39. [Google Scholar]
- Li, A.G.; Ren, T.; Yang, C.Q.; Xiong, J.; Tao, P. Numerical simulation, PIV measurements and analysis of air movement influenced by nozzle jets and heat sources in underground generator hall. Build. Environ. 2018, 131, 16–31. [Google Scholar] [CrossRef]
- Yin, H.G.; Li, A.G. Study of attached air curtain ventilation within a full-scale enclosure: Comparison of four turbulence models. Indoor Built Environ. 2016, 25, 962–975. [Google Scholar] [CrossRef]
- Ren, T. Study on the Variation Characteristic and Distribution Law of Thermal and Humidity Environment for Underground Corridor/Cavern Based on Hydropower Engineering. Doctoral Thesis, Xi’an University of Architecture and Technology, Xi’an, China, 2016. [Google Scholar]
- Wu, Y.; Gao, N.P.; Niu, J.L.; Zang, J.B.; Cao, Q. Numerical study on natural ventilation of the wind tower: Effects of combining with different window configurations in a low-rise house. Build. Environ. 2021, 188, 107450. [Google Scholar] [CrossRef]
- Zhang, C.; Li, A.G.; Li, J.X.; Li, H.M.; Li, Y.; Xiong, J.; Lv, W.C.; Che, J.G.; Guo, J.N.; Zhang, X.Y. Optimization and analysis of the acoustic and resistance performance of the plenum chamber via sample entropy and large eddy simulation. Build. Environ. 2022, 207, 108545. [Google Scholar] [CrossRef]
- Guo, J.N.; Li, A.G.; Ma, Y.Q.; Che, J.G.; Li, J.X.; Niu, S.F.; Deng, L.H.; Wang, D.; Che, L.F. A theoretical and applied convective heat transfer model for deep-buried underground tunnels with non-constant wall temperature. Energy Build. 2023, 294, 113210. [Google Scholar] [CrossRef]
- Li, Y.J. Study on Cooling Characteristics of Non-Isothermal Wall-Mounted Attached Night Ventilation. Master’s Thesis, Southwest Jiaotong University, Chendu, China, 2021. [Google Scholar]
- Gao, P. Research on Air Distribution of Hot Air Jet Units in Tall Factory Building. Master’s Thesis, Xi’an University of Architecture and Technology, Xi’an, China, 2020. [Google Scholar]
- Li, A.G.; Yang, C.Q.; Ren, T. Modeling and parametric studies for convective heat transfer in large, long and rough circular cross-sectional underground tunnels. Energy Build. 2016, 127, 259–267. [Google Scholar] [CrossRef]
- Wang, J.L.; Yin, H.G.; Huo, Y.K.; Zhang, J.Y.; Liang, L.F.; Ji, D.N.; Chang, Z.; Ma, Z.J.; Li, A.G. Numerical investigation on air distribution characteristics and effect of the outlet opening mode on cross-shaped column attachment ventilation. Build. Environ. 2023, 233, 110086. [Google Scholar] [CrossRef]


| Project | Size L × W × H (m3) | Number | Velocity (m/s) | Temperature (K) |
|---|---|---|---|---|
| Generator layer size | 138 × 24 × 17 | - | - | - |
| Air supply vent | 0.4 × 0.4 | 44 | 8 | 295 |
| Upstream vents | 2 × 0.6 | 4 | - | - |
| Downstream vents | 2 × 0.6 | 4 | - | - |
| Downstream vents | 2 × 0.6 | 4 | - | - |
| Downstream vents | 2 × 0.6 | 4 | - | - |
| Hanging hole (large) | 6 × 4.5 | 4 | - | - |
| Hanging hole (small) | 2 × 2.5 | 4 | - | - |
| Stairs | 2.5 × 4.5 | 2 | - | - |
| Traffic hole | 8 × 8 | 1 | 0.2 | 295 |
| Wall | - | 6 | - | 293 |
| Project. | Heat Release (kW) | Size L × W (m2) | Heat Flux Density (W/m2) | Number | Simplified Shape |
|---|---|---|---|---|---|
| Unit cover | 56.0 | r = 5.5 | 240 | 4 | Circular heat source |
| Air leakage of generator set | 35.2 | ||||
| Unit power panel excitation equipment | 54.4 | 72 × 0.8 | 944 | 1 | Upstream heat source |
| Unit control panel transformer device | 54.3 | 72 × 0.8 | 944 | 1 | Downstream heat source |
| Illumination | 15.1 | 0.8 × 5 | 944 | 4 | Midstream heat source |
| Case | Model | Air Supply Velocity (m/s) | Supply Air Temperature (K) | Traffic Hole Inlet Air Velocity (m/s) | Traffic Hole Inlet Air Temperature (K) | Wall Temperature (K) | Opening Mode of Air Supply Outlet |
|---|---|---|---|---|---|---|---|
| A | 1 | 8 | 295 | 0.2 | 295 | 293 | Open all |
| B | 1 | 6 | 295 | 0.2 | 295 | 293 | Open all |
| C | 1 | 4 | 295 | 0.2 | 295 | 293 | Open all |
| D | 1 | 8 | 295 | 0.2 | 295 | 293 | Open two at each interval |
| E | 1 | 8 | 295 | 0.2 | 295 | 293 | Open one at each interval |
| A1 | 2 | 8 | 295 | 0.2 | 295 | 293 | Open all |
| B1 | 2 | 6 | 295 | 0.2 | 295 | 293 | Open all |
| C1 | 2 | 4 | 295 | 0.2 | 295 | 293 | Open all |
| D1 | 2 | 8 | 295 | 0.2 | 295 | 293 | Open two at each interval |
| E1 | 2 | 8 | 295 | 0.2 | 295 | 293 | Open one at each interval |
| F | 2 | 8 | 295 | 0.2 | 295 | 293 | Open one at intervals of two |
| Case | Head-Foot Temperature Difference (∆t) | Percentage of Dissatisfaction | Energy Utilization Coefficient | Velocity Non-Uniformity Coefficient (Kv) | Temperature Non-Uniformity Coefficient (Kt) | Air Diffusion Performance Index (ADPI) (%) | Percentage of Dissatisfaction (%) | Air Diffusion Performance Index (ADPI) (%) |
|---|---|---|---|---|---|---|---|---|
| A | 0.55 | 0.5020 | 1.02 | 0.2583 | 0.0035 | 62.5 | 0.5020 | 62.5 |
| B | 0.93 | 0.6937 | 1.01 | 0.2740 | 0.0040 | 50 | 0.6937 | 50 |
| C | 1.16 | 0.6933 | 1.07 | 0.4529 | 0.0086 | 30 | 0.6933 | 30 |
| A1 | 0.57 | 0.5106 | 3.38 | 0.2090 | 0.0024 | 70 | 0.5106 | 70 |
| B1 | 0.79 | 0.6158 | 4.77 | 0.2275 | 0.0029 | 57.5 | 0.6158 | 57.5 |
| C1 | 1.23 | 0.8949 | 4.11 | 0.2492 | 0.0039 | 35 | 0.8949 | 35 |
| Case | Head-Foot Temperature Difference (∆t) | Percentage of Dissatisfaction (%) | Energy Utilization Coefficient | Velocity Non-Uniformity Coefficient (Kv) | Temperature Non-Uniformity Coefficient (Kt) | Air Diffusion Performance Index (ADPI) (%) | Percentage of Dissatisfaction (%) | Air Diffusion Performance Index (ADPI) (%) |
|---|---|---|---|---|---|---|---|---|
| A | 0.55 | 0.5020 | 1.02 | 0.2583 | 0.0035 | 62.5 | 0.5020 | 62.5 |
| D | 0.42 | 0.4494 | 0.92 | 0.4216 | 0.0044 | 45 | 0.4494 | 45 |
| E | 0.33 | 0.4162 | 1.05 | 0.4390 | 0.0055 | 50 | 0.4162 | 50 |
| A1 | 0.57 | 0.5106 | 3.38 | 0.2090 | 0.0024 | 70 | 0.5106 | 70 |
| D1 | 0.71 | 0.5753 | 4.84 | 0.2686 | 0.0029 | 72.5 | 0.5753 | 72.5 |
| E1 | 0.65 | 0.5166 | 3.26 | 0.3957 | 0.0035 | 55 | 0.5166 | 55 |
| F | 1.22 | 0.8874 | 3.54 | 0.3997 | 0.0036 | 42.5 | 0.8874 | 42.5 |
Disclaimer/Publisher’s Note: The statements, opinions and data contained in all publications are solely those of the individual author(s) and contributor(s) and not of MDPI and/or the editor(s). MDPI and/or the editor(s) disclaim responsibility for any injury to people or property resulting from any ideas, methods, instructions or products referred to in the content. |
© 2024 by the authors. Licensee MDPI, Basel, Switzerland. This article is an open access article distributed under the terms and conditions of the Creative Commons Attribution (CC BY) license (https://creativecommons.org/licenses/by/4.0/).
Share and Cite
Ren, T.; Li, M.; He, L.; Sun, P. Numerical Study of Air Distribution and Thermal Environment in Attached Ventilation Mode in the Generator Layer of a Hydropower Station. Buildings 2024, 14, 1030. https://doi.org/10.3390/buildings14041030
Ren T, Li M, He L, Sun P. Numerical Study of Air Distribution and Thermal Environment in Attached Ventilation Mode in the Generator Layer of a Hydropower Station. Buildings. 2024; 14(4):1030. https://doi.org/10.3390/buildings14041030
Chicago/Turabian StyleRen, Tong, Mengzhuo Li, Long He, and Panpan Sun. 2024. "Numerical Study of Air Distribution and Thermal Environment in Attached Ventilation Mode in the Generator Layer of a Hydropower Station" Buildings 14, no. 4: 1030. https://doi.org/10.3390/buildings14041030
APA StyleRen, T., Li, M., He, L., & Sun, P. (2024). Numerical Study of Air Distribution and Thermal Environment in Attached Ventilation Mode in the Generator Layer of a Hydropower Station. Buildings, 14(4), 1030. https://doi.org/10.3390/buildings14041030