Article

Research on the Effect of Aerodynamic Imbalance on Fatigue Performance of a Wind Turbine Foundation with Embedded Steel Ring

1
School of Civil Engineering, Changsha University of Science and Technology, Changsha 410114, China
2
Huadian New Energy Group Corporation Limited Hunan Branch, Changsha 410014, China
*
Author to whom correspondence should be addressed.
Buildings 2024, 14(4), 1141; https://doi.org/10.3390/buildings14041141
Submission received: 20 March 2024 / Revised: 7 April 2024 / Accepted: 10 April 2024 / Published: 18 April 2024

Abstract

:
Wind turbine (WT) foundations with an embedded steel ring (ESR) are widely used in onshore WTs due to construction convenience. The research group found that WT foundations with damage were often accompanied by blade issues. To investigate the potential correlation between aerodynamic imbalance and fatigue damage of the WT foundation with an ESR, this study focuses on a 2 MW WT with an ESR. It investigates the influence of an error in pitch angle (PAE) on the WT’s foundation load and stress, utilizing one year of SCADA data to analyze the fatigue damage caused by PAE. The main conclusions are as follows: Firstly, the effect of PAE on the amplitude value of load and stress is significantly greater than on the average value of load and stress. Secondly, when the PAE is within the range of −3° to 3°, the foundation fatigue damage incurred over one year is minimal, but once this limit is exceeded, the foundation fatigue damage increases dramatically. Thirdly, the peak value of fatigue damage to the foundation caused by PAE does not necessarily occur in the main wind direction, but in the direction with the highest probability of the occurrence of high wind speeds, and the larger the PAE, the more significant the trend.

1. Introduction

Due to its advantages of being easy to design, simple to install, and having no environmental constraints, an ESR is frequently utilized in onshore WT foundations. In recent years, issues such as the surface cracking of concrete in WT foundation structures and the development of gaps and loosening between the ESR and concrete have become increasingly common. Many researchers have studied the damage mechanism of the WT concrete foundations with an ESR. The ESR, serving as a connecting component between the WT tower and its foundation, plays a crucial role in transmitting the upper loads to the foundation. Wang et al. [1] used ANSYS software to investigate the non-linear contact between the ESR and concrete on the basis of concrete elastoplastic constitutive. They also researched the internal mechanical characteristics and laws of the foundation, which are under the influence of wind in an unfixed direction. During their operational lifespan, WT foundations are subjected to 107 cycles of fatigue loading, which often leads to the formation of cracks on their surfaces. McAlorum et al. [2] monitored cracks on the surface of the WT foundation with FBG-based long-gauge strain sensors, and in this paper, the cracks on the surface of the WT’s foundation are divided into three types: reactive, permanent, and behavioral, and are described in detail. At the same time, large tensile and compressive forces are transferred to the foundation by the ESR, and the concrete in the anchorage zone of the ESR is subjected to high-cycle fatigue loading, causing concrete in foundations to operate at higher stress [3,4,5,6]. If things continue this way, the concrete in the compressive zone of the WT foundation may experience high cycling, resulting in fatigue accumulation. Long-term cyclic loading causes the crushing of concrete in the anchorage zone of the ESR, resulting in reduced stiffness and bearing capacity of the WT foundation [7]. Furthermore, during the construction of WT foundations, inadequate compaction results in substandard concrete quality, and the rapid change in wind speed and direction during the operation of the WT will also lead to fatigue damage to the foundation [8]. He and Bai et al. [9,10] found that the WT foundation concrete began to have local deformation from the bottom flange of the ESR when monitoring the condition of the WT foundation using strain sensors, and the change in concrete crack width is related to the change in wind speed and rotor position during WT operation. To analyze the fatigue reliability of structures [11], Zhao et al. [12] studied the fatigue reliability of a WT under wind loads using the probability density evolution method. Mankar et al. [13] presented a probabilistic framework for a reliability assessment of onshore WT foundations with the aim of optimizing the design. Zhu et al. [14] proposed a method using the Markov model and a subset simulation to assess the fatigue reliability of WTs for long-term operation.
In the inspection of wind farms, the research group found that the WTs with a loose ESR were often accompanied by abnormal blades: The 15# WT in a wind farm in Chenzhou, Hunan Province, once suffered a significant amount of concrete cracking around the ESR, necessitating reinforcement. However, approximately one year later, the concrete fracture phenomenon reappeared, as shown in Figure 1a. Upon inspection, it was discovered that one of the WT’s blades had suffered severe perforation, as depicted in Figure 1b. The 23# WT in a wind farm in Yongzhou, Hunan Province, also suffered extensive concrete cracking around the ESR, and the horizontal misalignment of the ESR reached 12 mm. The owner reported that this WT exhibited a persistently drooping blade in the stationary state, and the blade had undergone multiple repairs, as shown in Figure 1d. In light of these observations, the research group hypothesized that the aerodynamic imbalance of the blades could potentially contribute to the failure of the WT foundation with an ESR. This paper aims to explore the effect of aerodynamic imbalance on the fatigue performance of WT foundations with an ESR.
At present, the research on aerodynamic imbalance mainly focuses on three aspects: (1) the influence of aerodynamic imbalance on the operation performance of a WT; (2) methods for detecting aerodynamic imbalance; and (3) control of aerodynamic imbalance. But the effect of an aerodynamic imbalance on the service performance of a WT concrete foundation with an ESR has not been reported. Niebsch and Jiang et al. [15,16] introduced in detail the force and vibration characteristics of the top of the tower under normal conditions, aerodynamic imbalance, and mass imbalance conditions. Zhao, Wu, and Qin et al. [17,18,19] simulated the WT using GH Bladed software and introduced the time and frequency domain characteristics of tower top load and vibration signals under aerodynamic imbalance conditions. Malik et al. [20,21] proposed a WT condition monitoring method using probabilistic neural networks (PNNs), artificial neural networks (ANNs), and empirical mode decomposition (EMD). Based on FAST, TurbSim, and Simulink simulations, this method can identify WT rotor imbalance faults by receiving current signals from the WT. Tarabini et al. [22] proposed a method for the uncertainty-based combination of signal processing techniques for the identification of rotor imbalances by combining dynamic and static signals. Xing et al. [23] simulated an aerodynamic imbalance by changing the azimuth of the rotor, proposed a novel framework for detecting aerodynamic imbalance based on the intrinsic mode functions of nacelle vibration, determined the degree of the aerodynamic imbalance by using the nacelle acceleration as an input variable through the convolutional neural network, and finally verified the framework by simulation. Li et al. [24] proposed a method that integrates the order tracking analysis method and the power spectral density method, which analyzes the aerodynamic torque to detect imbalance faults using GH Bladed and MATLAB software. In order to mitigate the structural impact of aerodynamic imbalance, Tang et al. [25] analyzed the failure mechanism of the traditional individual pitch controller based on the frequency-domain decomposition method and proposed a robust individual pitch controller to suppress imbalanced loads.
In this paper, the simulation of aerodynamic imbalance is realized by changing the pitch angle of one blade. It combines steady-state wind loads with turbulent wind loads and analyzes the WT’s foundation load and stress response under aerodynamic imbalance. Furthermore, it calculates the fatigue damage to the wind turbine foundation in 3D turbulent wind conditions by considering the probability of the occurrence of wind speed and wind direction. The study also examines the impact of blade aerodynamic imbalance on the operational performance of a pitch-regulated WT. Finally, it analyzes the effect of aerodynamic imbalance on the service performance of the WT concrete foundation with an ESR.

2. Parameters of the WT

The WT used in this case study is a 2 MW pitch-regulated variable speed machine located in a wind farm in Chenzhou, Hunan, China. The WT is located at an altitude of 1000 m, and the type of foundation for this WT is concrete foundations with an ESR. The main parameters of this WT and the principal geometry of the foundation are shown in Table 1 and Figure 2, respectively.
For the purpose of the following description, the coordinate system used for the foundation is shown in Figure 3. The x-axis is the downwind direction along the nacelle, the y-axis and z-axis conform to the right-hand rule, and the six loads on the foundation are Fx, Fy, Fz, Mx, My, and Mz.

3. Effect of Aerodynamic Imbalance on Foundation Loads

3.1. Simulation of Aerodynamic Imbalance

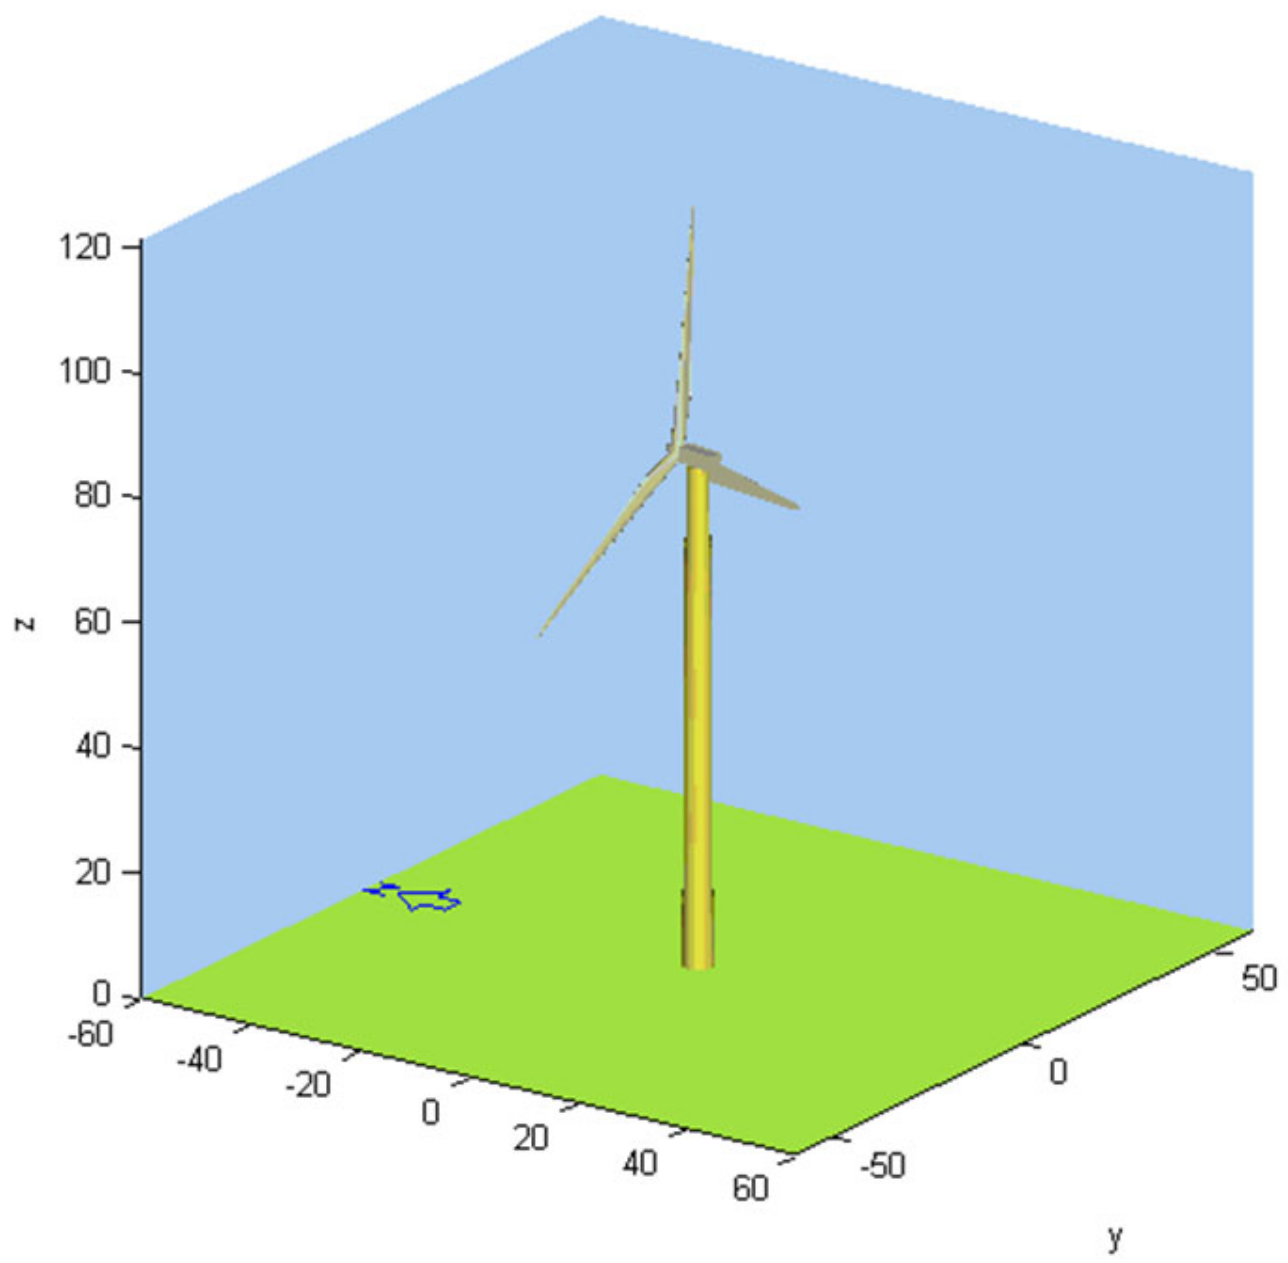
In order to accurately obtain the loads on the WT foundation under the aerodynamic imbalance, the international authority of WT load analysis software, GH Bladed, was used to establish the 2 MW WT, and the main parameters are shown in Table 1. The type of WT foundation was selected as an onshore foundation, and without consideration for rotational and translational stiffness, Figure 4 shows the model of the 2 MW WT established by GH Bladed.
The purpose of this study is to investigate the effect of aerodynamic imbalance on the fatigue damage of the WT foundation with an ESR; therefore, only normal wind conditions are discussed here, not extreme wind conditions. The actual wind load on the WT is 3D turbulent wind; therefore, it is necessary to simulate the turbulent wind at different average wind speeds for load simulation. To make the simulation comprehensive, Table 1 shows that the WT’s normal use is in the wind speed range of 3–25 m/s. GH Bladed calculated 10 turbulent winds for a duration of 600 s, with wind speed values of 4 m/s, 6 m/s, 8 m/s, 10 m/s, 12 m/s, 14 m/s, 16 m/s, 18 m/s, 20 m/s, and 22 m/s (10 min average wind speed).
The parameters of the turbulent wind simulation were calculated according to IEC61400-1 [26]. The Kaimal frequency spectrum was chosen for the type of turbulent spectral, where the turbulence scale parameters are: the longitudinal turbulence scale is 340.2 m, the lateral turbulence scale is 113.4 m, and the vertical turbulence scale is 27.72 m. The turbulence standard deviation, σ1, at different average wind speeds is calculated as follows:
σ 1 = I r e f ( 0.75 V h u b + 5.6 )
where Iref is the reference value of the turbulence intensity, and 0.14 is used here; Vhub is the average hub height wind speed.
Consequently, the turbulence intensity for 3D turbulent wind can be determined as follows: the longitudinal turbulence intensity is σ1/Vhub, the lateral turbulence intensity is 0.8σ1/Vhub, and the vertical turbulence intensity is 0.5σ1/Vhub. It is evident that the lateral and vertical turbulence intensities are directly proportional to the longitudinal turbulence intensity of the turbulent wind. Figure 5 illustrates the variations in the turbulence standard deviation (σ1) and the longitudinal turbulence intensity (σ1/Vhub) with changes in wind speed for different average wind speeds in this study. It can be observed that the turbulence standard deviation (σ1) is proportional to wind speed, while the longitudinal turbulence intensity (σ1/Vhub) is inversely proportional to wind speed.
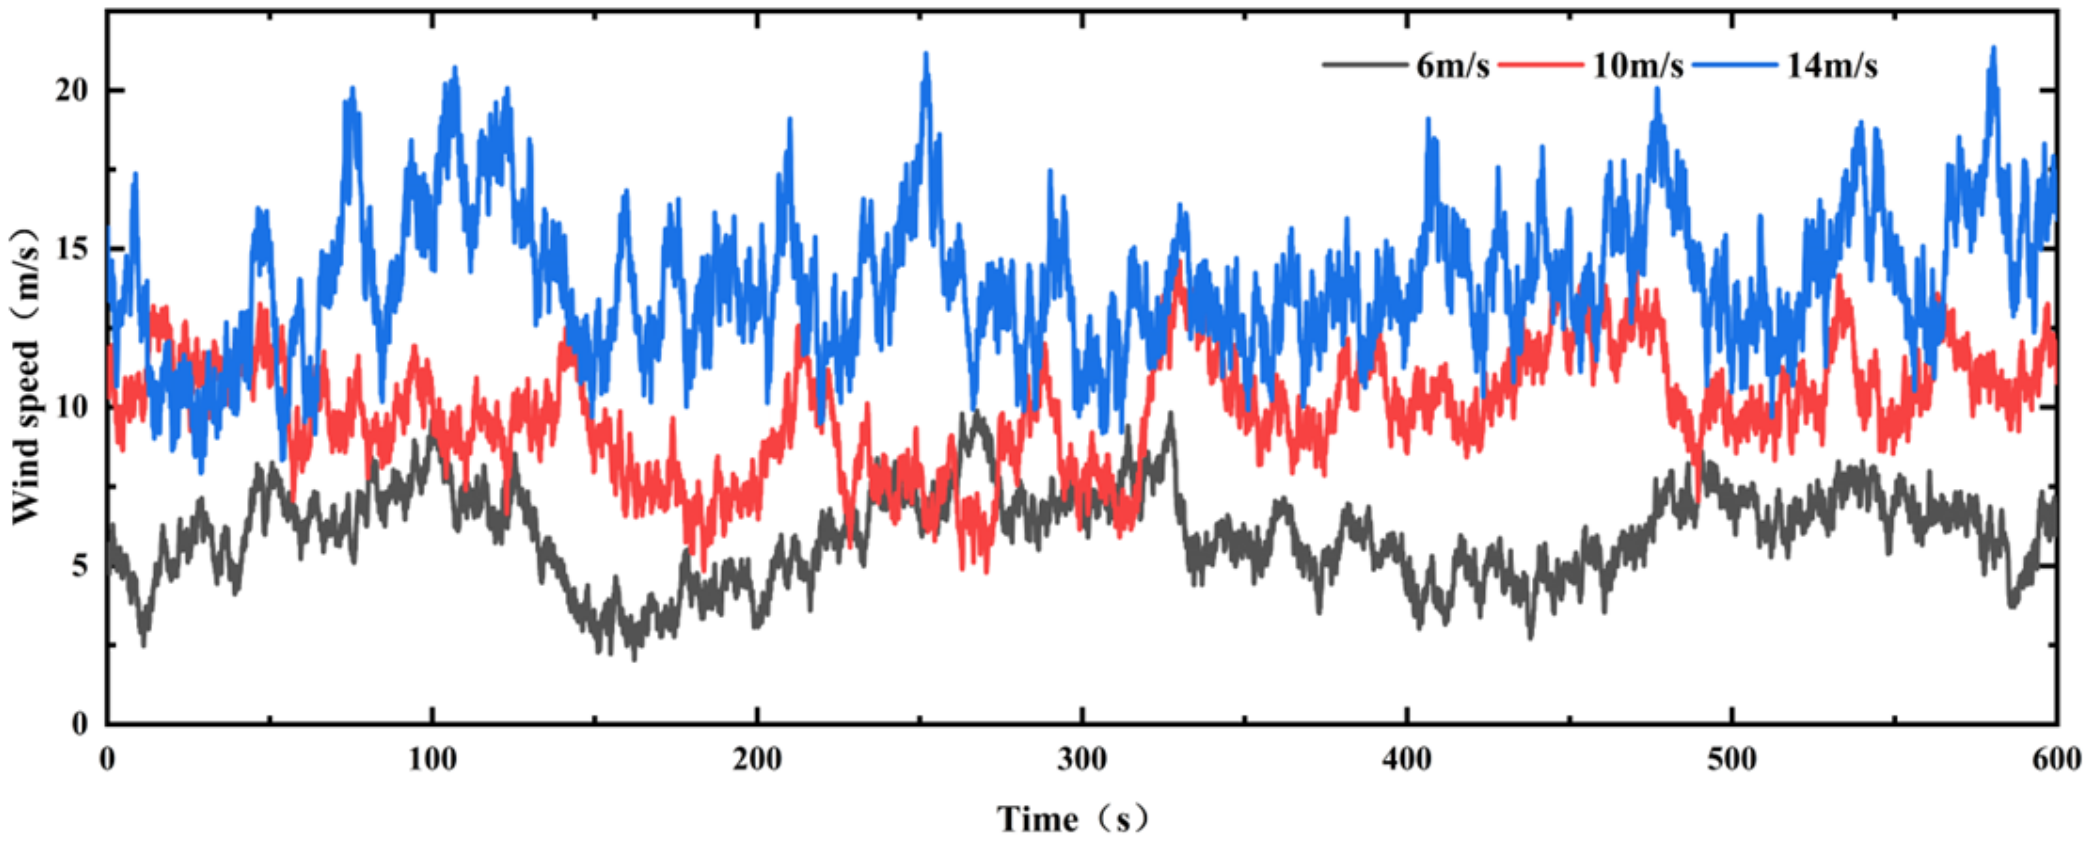
The turbulent wind at different average wind speeds can be obtained by employing the aforementioned settings for turbulent wind parameters. Figure 6 shows the time history curves of turbulent wind at average wind speeds of 6 m/s, 10 m/s, and 14 m/s for a duration of 600 s. The other seven wind speed time history curves are not shown here as space is limited. All subsequent simulations in this paper were conducted under these ten distinct average wind speeds.
The turbulent winds obtained above at different average wind speeds were applied to the model built by GH Bladed. The sampling time was 0.05 s, which corresponds to a sampling rate of 20 Hz. According to IEC61400-1, the influence of an inclination of the mean flow with respect to a horizontal plane of 8° shall be considered, and this flow inclination angle shall be assumed to be invariant with height. There are several causes of aerodynamic imbalance, but PAE, in which a blade does not pitch in its commanded position, provides a convenient simulation method. Only a single blade was commanded to undergo PAE in this paper. In practical WT operation, significant aerodynamic imbalances are not permissible in the wind field. Smaller aerodynamic imbalances are difficult to detect, and they can take various forms. In order to make the simulation and analysis more comprehensive, the PAE was increased from −4° to 4° in increments of 1° on one blade of the WT in this paper. These values were chosen to represent a relatively realistic and small aerodynamic imbalance. In the simulation, 0° is the normal WT operating condition, 1° to 4° is the positive PAE, and −1° to −4° is the negative PAE. From this, the loads on the foundation of the WT can be obtained for different degrees of aerodynamic imbalance.

3.2. Effect of PAE and Wind Velocity on the Foundation Loads

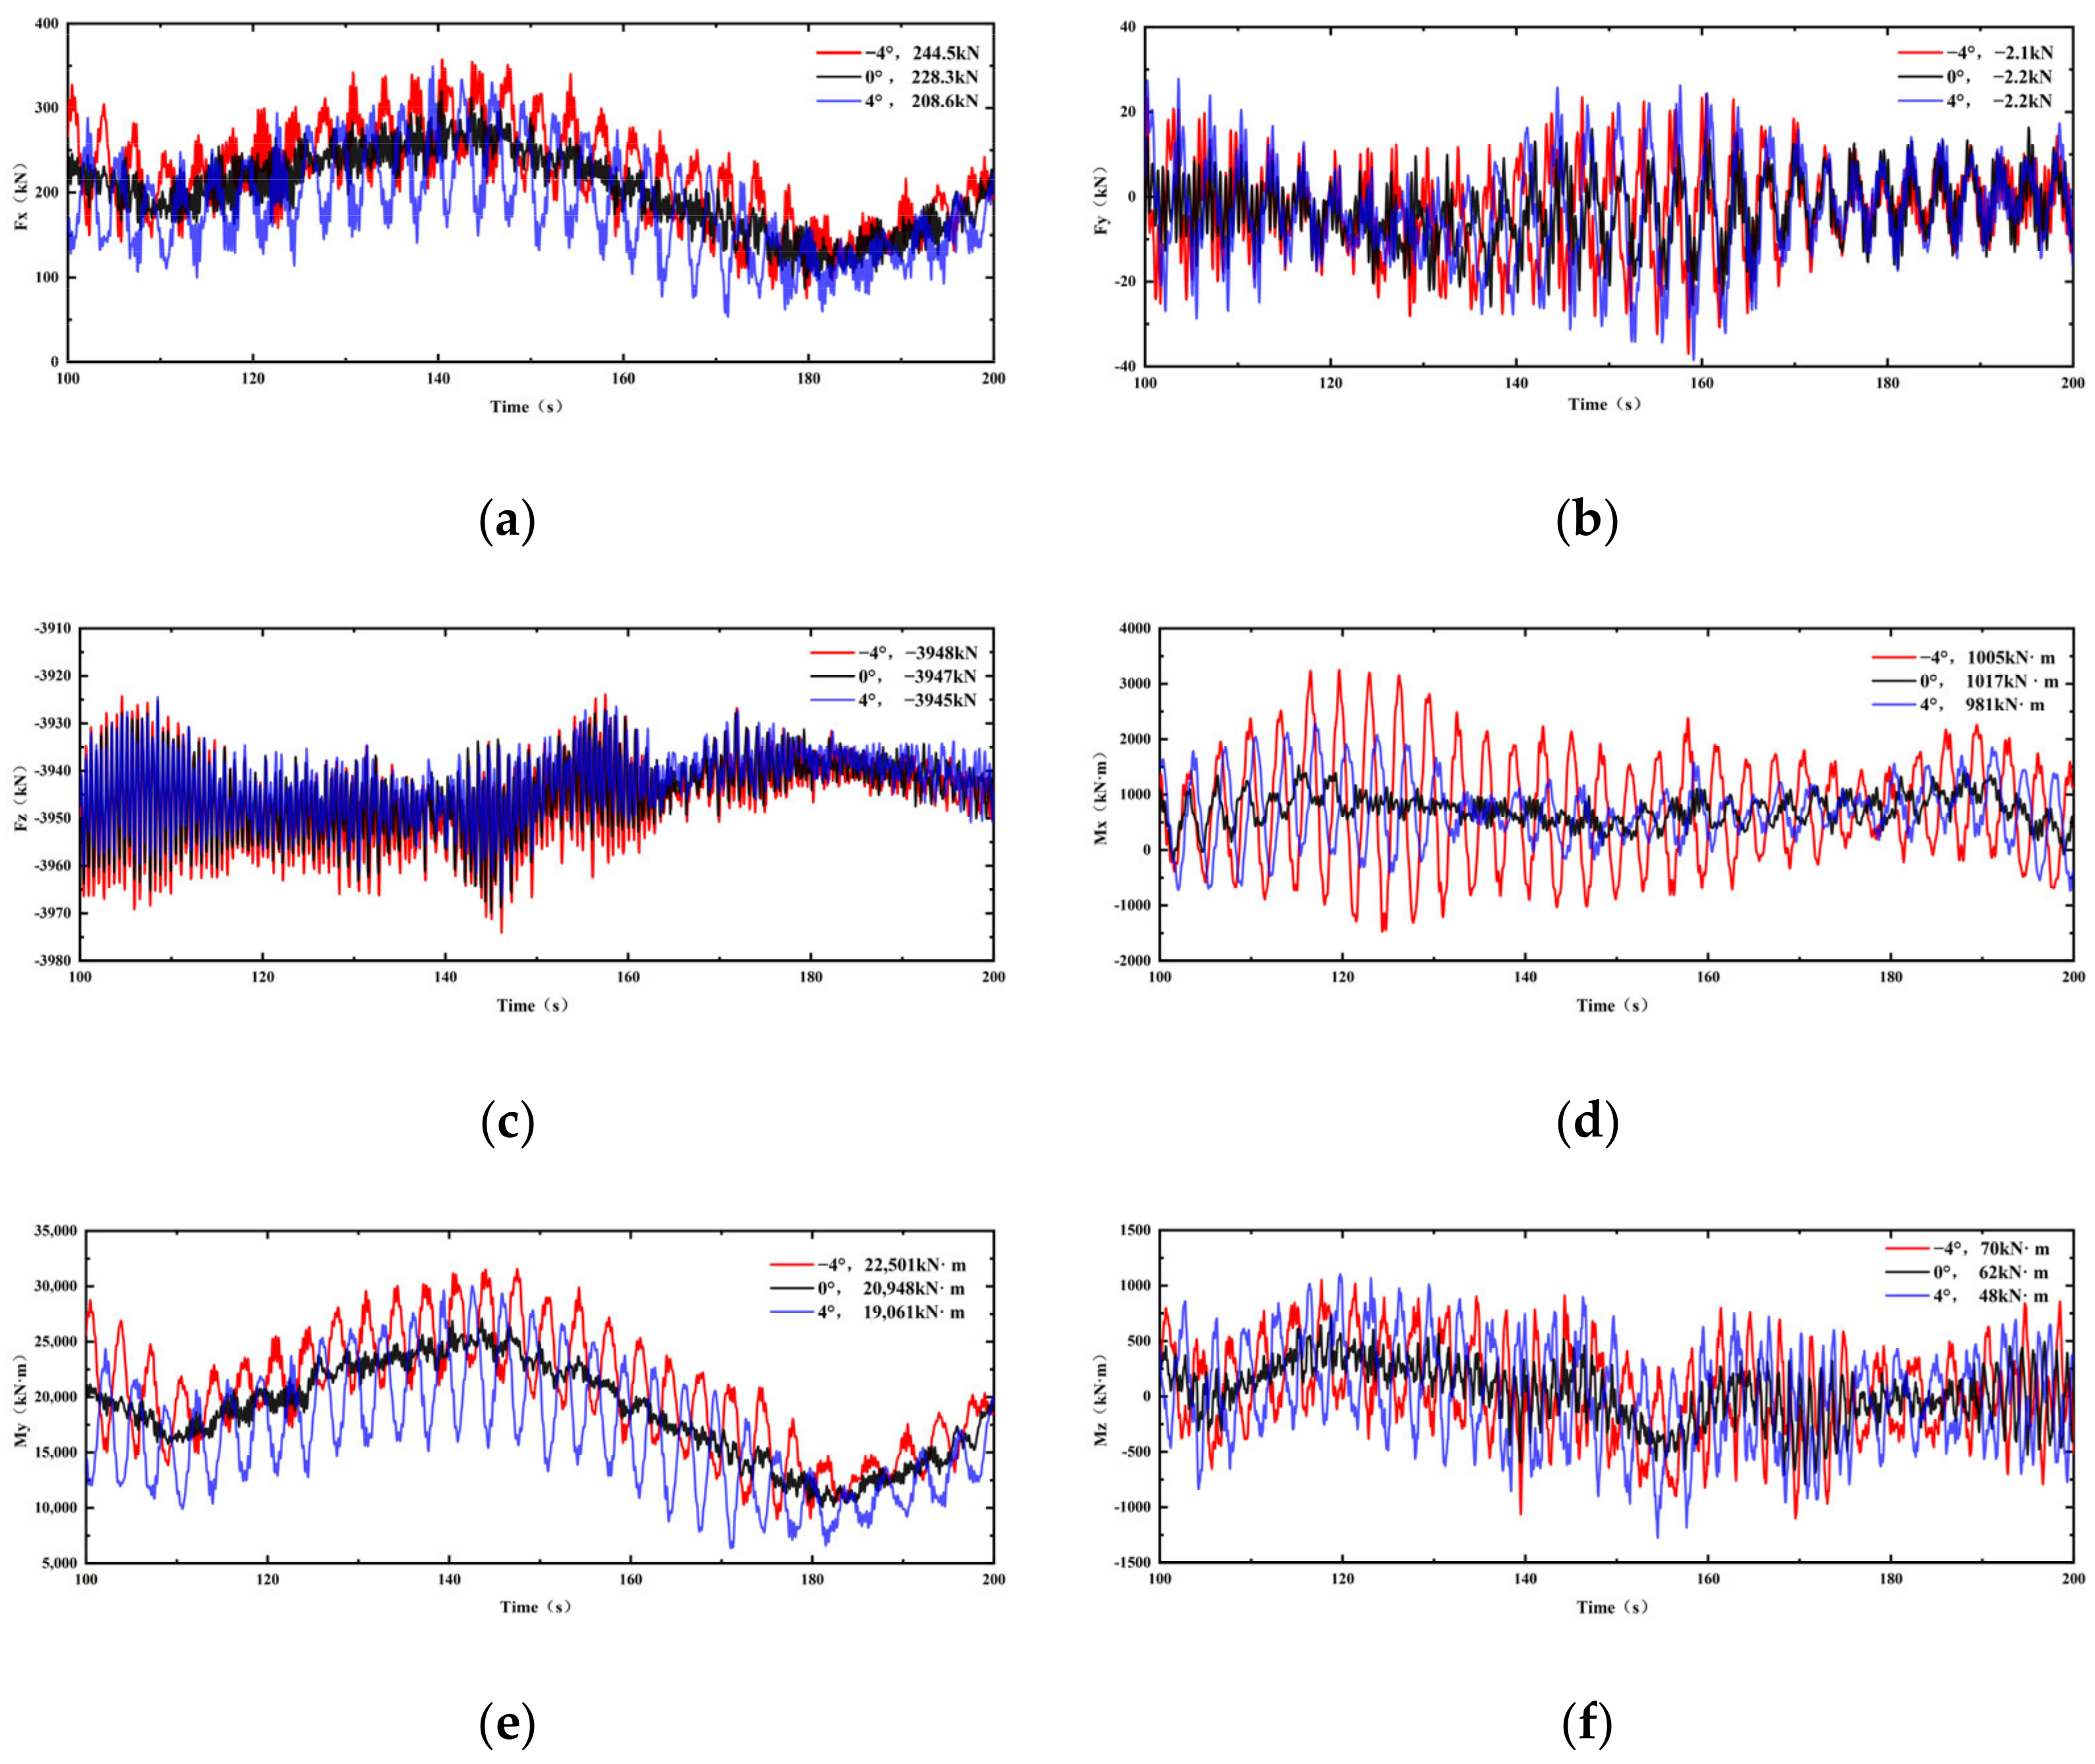
Although the load simulation for 600 s was performed by GH Bladed in Section 3.1, Figure 7 only shows the time history curves of the WT foundation loads for turbulent wind conditions with an average wind speed of 10 m/s within the 100 s to 200 s range for clarity of reading. Additionally, the example box within the figure lists the average value of each load over 600 s. The loads on the WT foundation under other wind speeds are not shown here as space is limited.
As shown in Figure 7, both positive and negative PAE result in an increase in load fluctuation amplitudes. Specifically, the time histories of Fx, Mx, My, and Mz exhibit significant variations, whereas those of Fy and Fz are less pronounced. Looking at the average value of the loads in Figure 7, it can be clearly seen that the average values of Fx, My, and Mz decrease with positive PAE and increase with negative PAE. The average value of Mx decreases for both positive and negative PAE, and the average values of Fy and Fz remain largely unaffected by PAE.
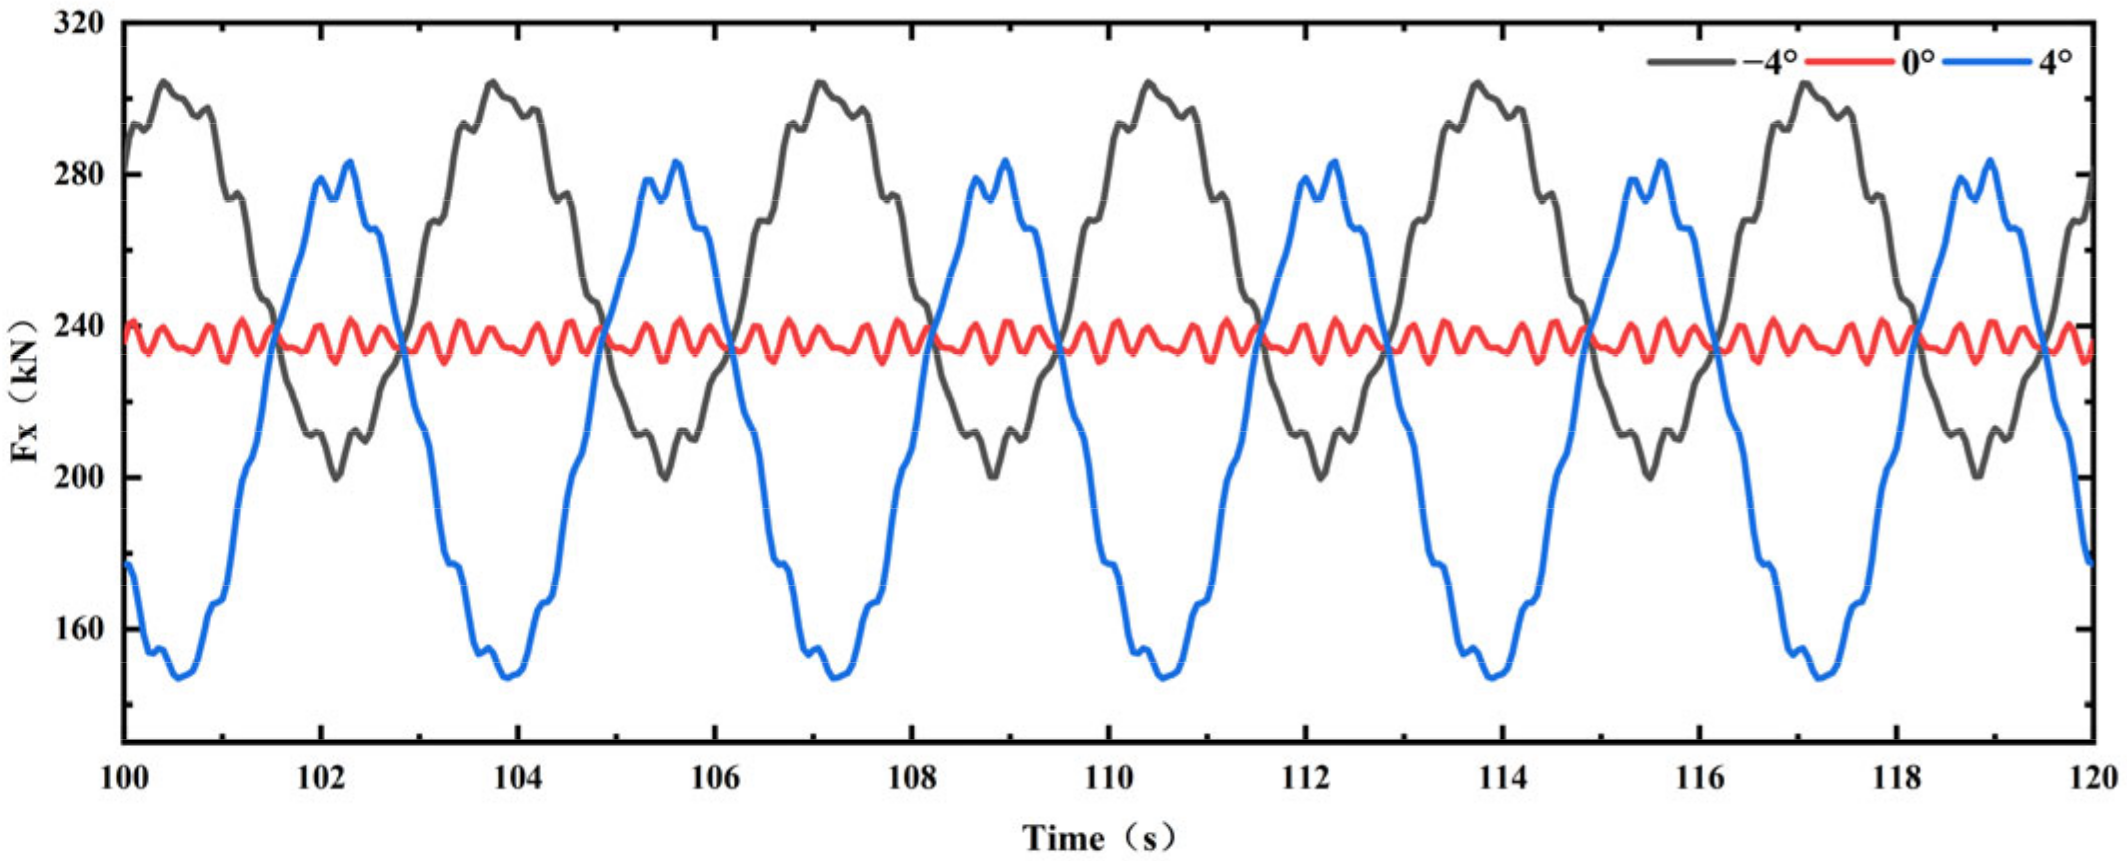
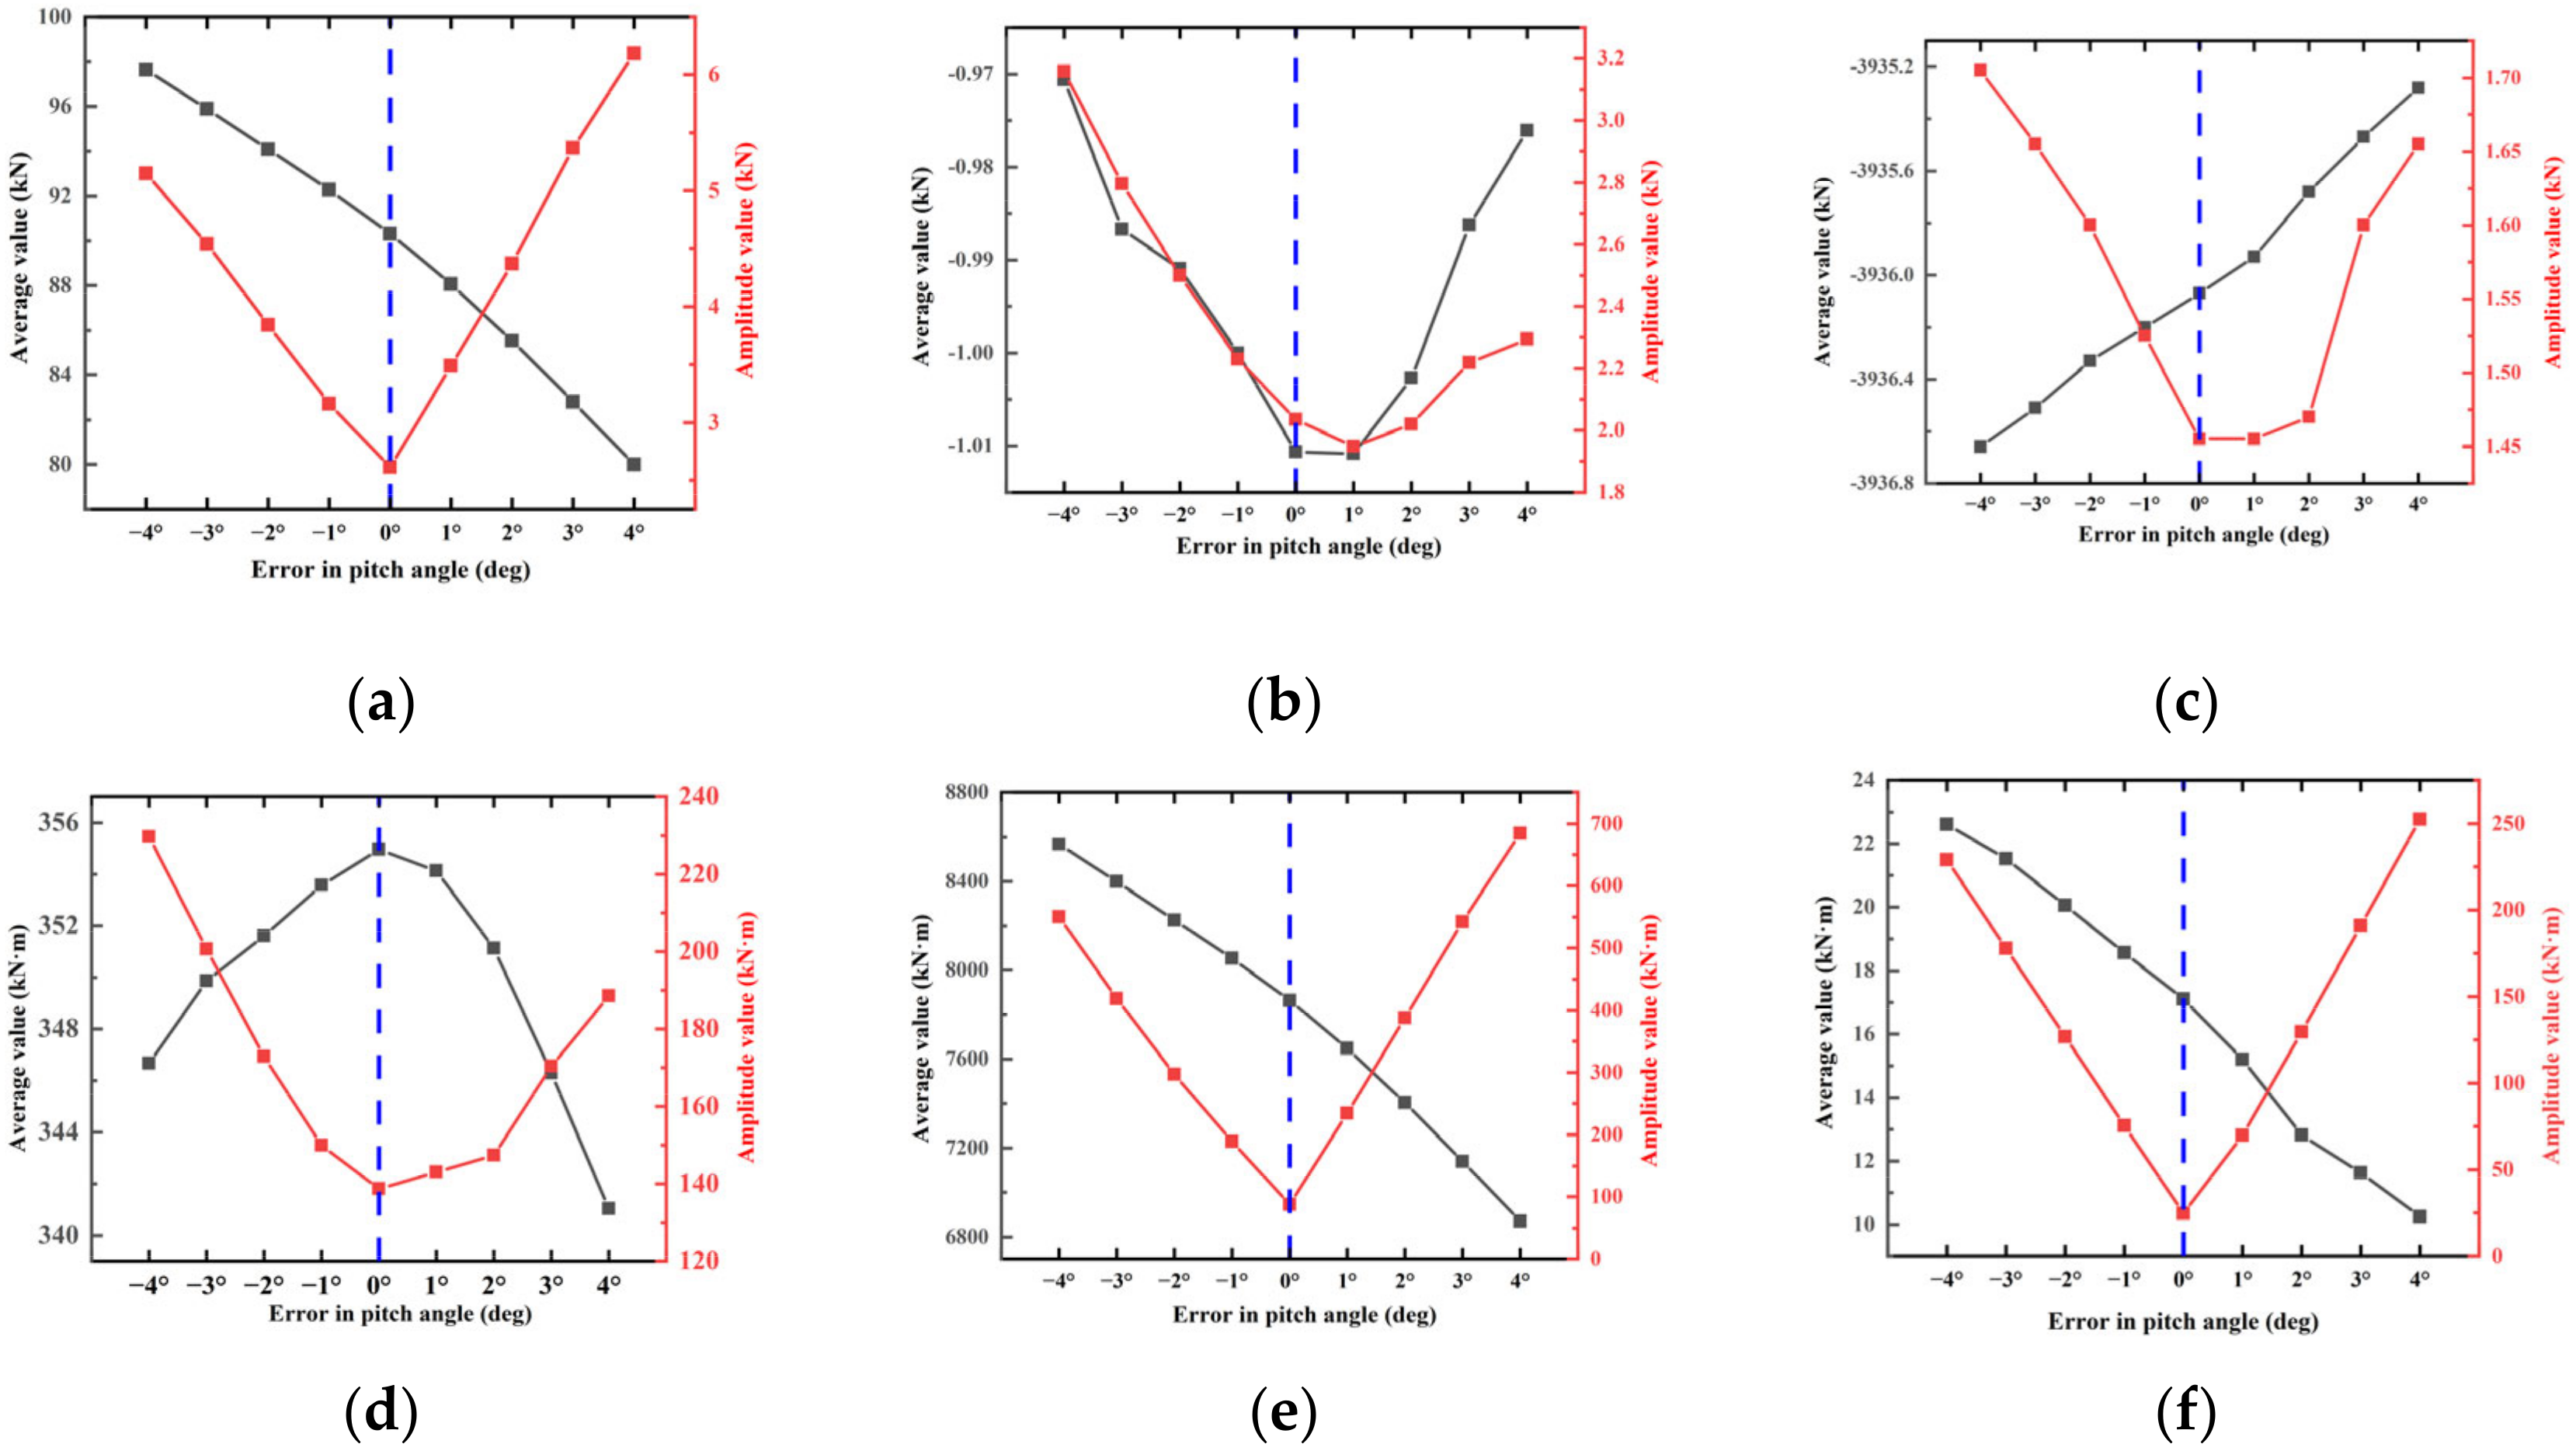
To conduct a more in-depth analysis of the impact of aerodynamic imbalance on the foundation load of a WT, simulations were performed using GH Bladed software under the influence of steady-state wind conditions (6 m/s, 10 m/s, and 14 m/s) for a duration of 600 s. Under steady-state wind conditions, the load response of the WT foundation exhibited a sinusoidal-like time history, as shown in Figure 8. Figure 9 provides definitions for the average and amplitude of this time history curve. The effect of PAE on amplitude and an average value of 6 loads of WT foundation under steady-state wind with an average wind speed of 6 m/s, 10 m/s, and 14 m/s is shown in Figure 10, Figure 11 and Figure 12, where the black solid line represents the average value of the loads and the red solid line represents the amplitude value of the loads.
From the red solid line in Figure 10, Figure 11 and Figure 12, it can be seen that the amplitude value of six loads under steady-state wind will increase with the increase in the positive and negative PAE. At the same time, the effect of the PAE on the amplitude value of the load gradually increases with an increase in wind velocity. Looking at the black solid line in Figure 11, the influence of steady-state wind and turbulent wind on the average value of load is consistent. However, the influence of PAE on load is different under different wind speeds.
In order to understand the effect of PAE on the percent change in load, we define the percent change in load as follows:
p e r c e n t   c h a n g e   o f   l o a d = L o a d   o f   PAE-Load   w i t h o u t   P A E L o a d   w i t h o u t   P A E × 100 %
Figure 13 shows the effect of PAE on the percent change in the average value of the load under steady-state wind. It can be seen that the largest effect is the average value of Mz. Figure 14 shows the effect of PAE on the percent change in the amplitude value of the load under steady-state wind. It can be seen that with the increase in wind speed, the influence of PAE on the amplitude value of Mx becomes more and more significant. At the same time, combined with Figure 10, Figure 11 and Figure 12, it can be seen that the impact of PAE on the amplitude value of My is also very drastic. It is evident that the effect of PAE on the percent change in the load amplitude is significantly greater than that on the load average value.
To summarize, the conclusions are as follows: (1) The influence of PAE under turbulent wind conditions on WT foundation loads exhibits consistency with the patterns observed under steady-state wind conditions. (2) The effect of PAE on the amplitude value of the load is significantly greater than on the average value of the load, and at the same time, the effect of PAE on the amplitude value of the load gradually increases with the increase in wind velocity. (3) Among the six foundation loads, the amplitude values of Mx and My are the most sensitive to PAE. The combined force of Mx and My is the overturning load on the WT foundation and is decisive for the design of the foundation; the drastic change in amplitude value of the overturning load will obviously have a significant impact on the fatigue damage of the WT foundation.

4. Effect of Aerodynamic Imbalance on Foundation Stress

4.1. Finite Element Modeling of the WT Foundation

ABAQUS was used for finite element (FE) modeling and stress analysis in this paper. The load on the foundation of the WT under turbulent wind is obtained from Section 3.1, and the detailed FE model is developed by ABAQUS (as shown in Figure 2). The contact constraints are adopted between the ESR and the concrete. The normal direction of the contact surface is set to be hard contact, and the friction effect of the tangential direction is simulated through the penalty function method. The friction coefficient is taken as 0.4 in the analysis. The reinforcement cage is embedded in the concrete, assuming a perfect bond between the steel and the concrete. A load reference point is developed at the center of the upper flange of the ESR and coupled to the upper flange of the ESR for applying the loads transferred from the tower. Finally, displacements and rotations in all directions at the nodes of the foundation surface are prevented.
The concrete foundation and the ESR are all meshed by the 3D hexahedral linear reduction integral unit C3D8R. The reinforcement cage is modeled with the two-node truss element T3D2. Multi-mesh densities are adopted for different parts of the model, with zones near the ESR using fine meshes.
The strength grade of the concrete of the WT foundation is C40, the density is 2500 kg/m3, the elastic modulus is 32.5 GPa, the expansion angle is 30°, the standard value of tensile strength is 2.39 MPa, the standard value of compressive strength is 26.8 MPa, the biaxial/uniaxial is 1.16, the eccentricity is 0.1, the eccentric distance is 0.6667, and the Poisson’s ratio is 0.2. The concrete-damaged plasticity (CDP) model is adopted in ABAQUS. The ideal elastoplastic models are applied for the ESR and the reinforcing cage, in which their strength grades are HRB400, the density is 7850 kg/m3, the elastic modulus is 206 GPa, the standard value of tensile strength is 345 MPa, the standard value of compressive strength is 345 MPa, and the Poisson’s ratio is 0.3.

4.2. Model Validation

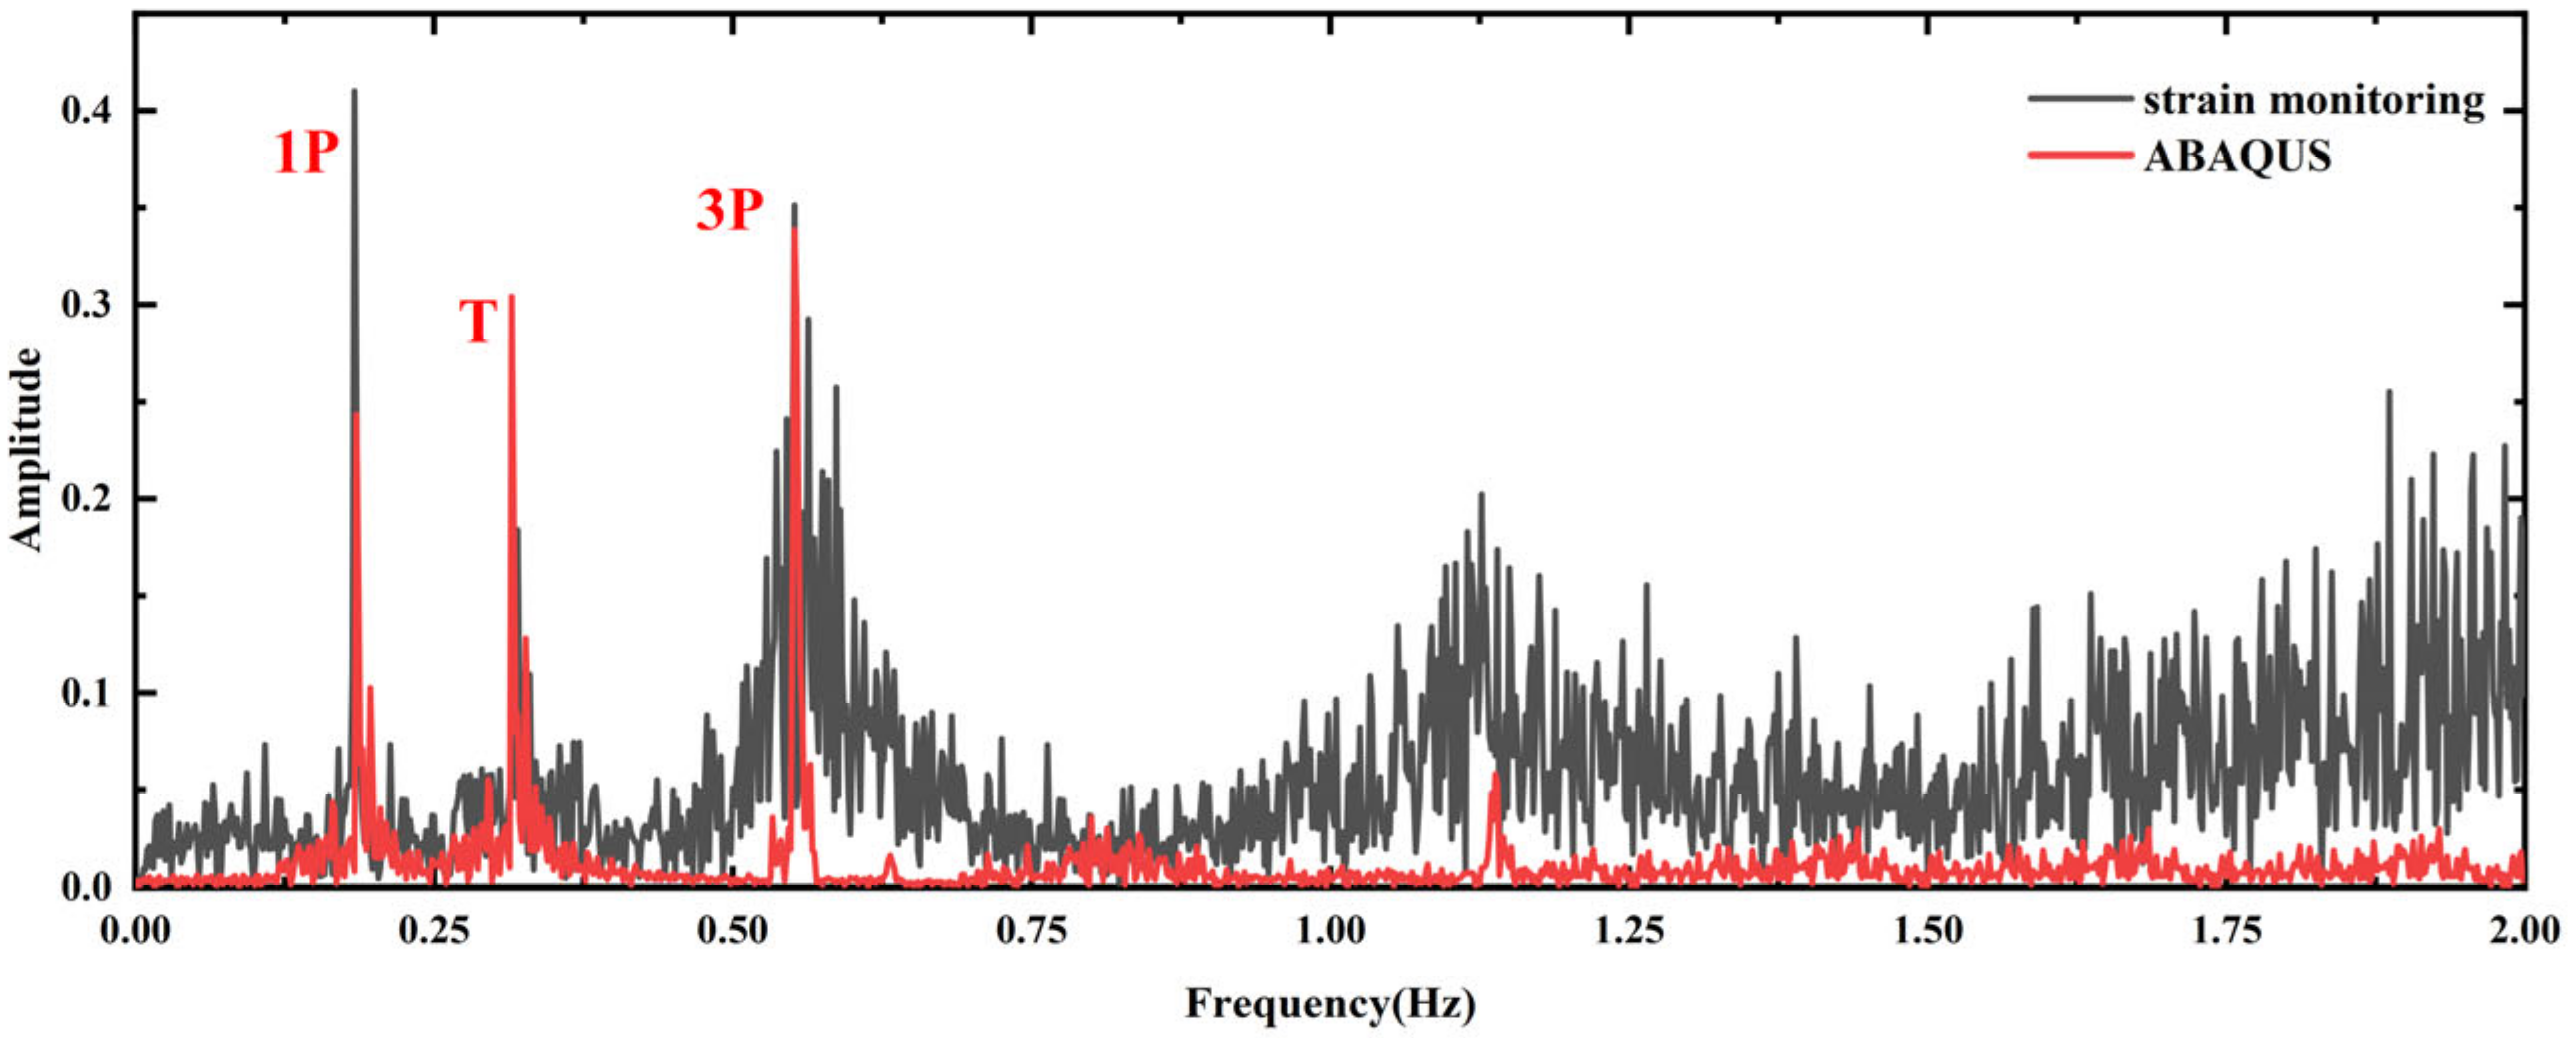
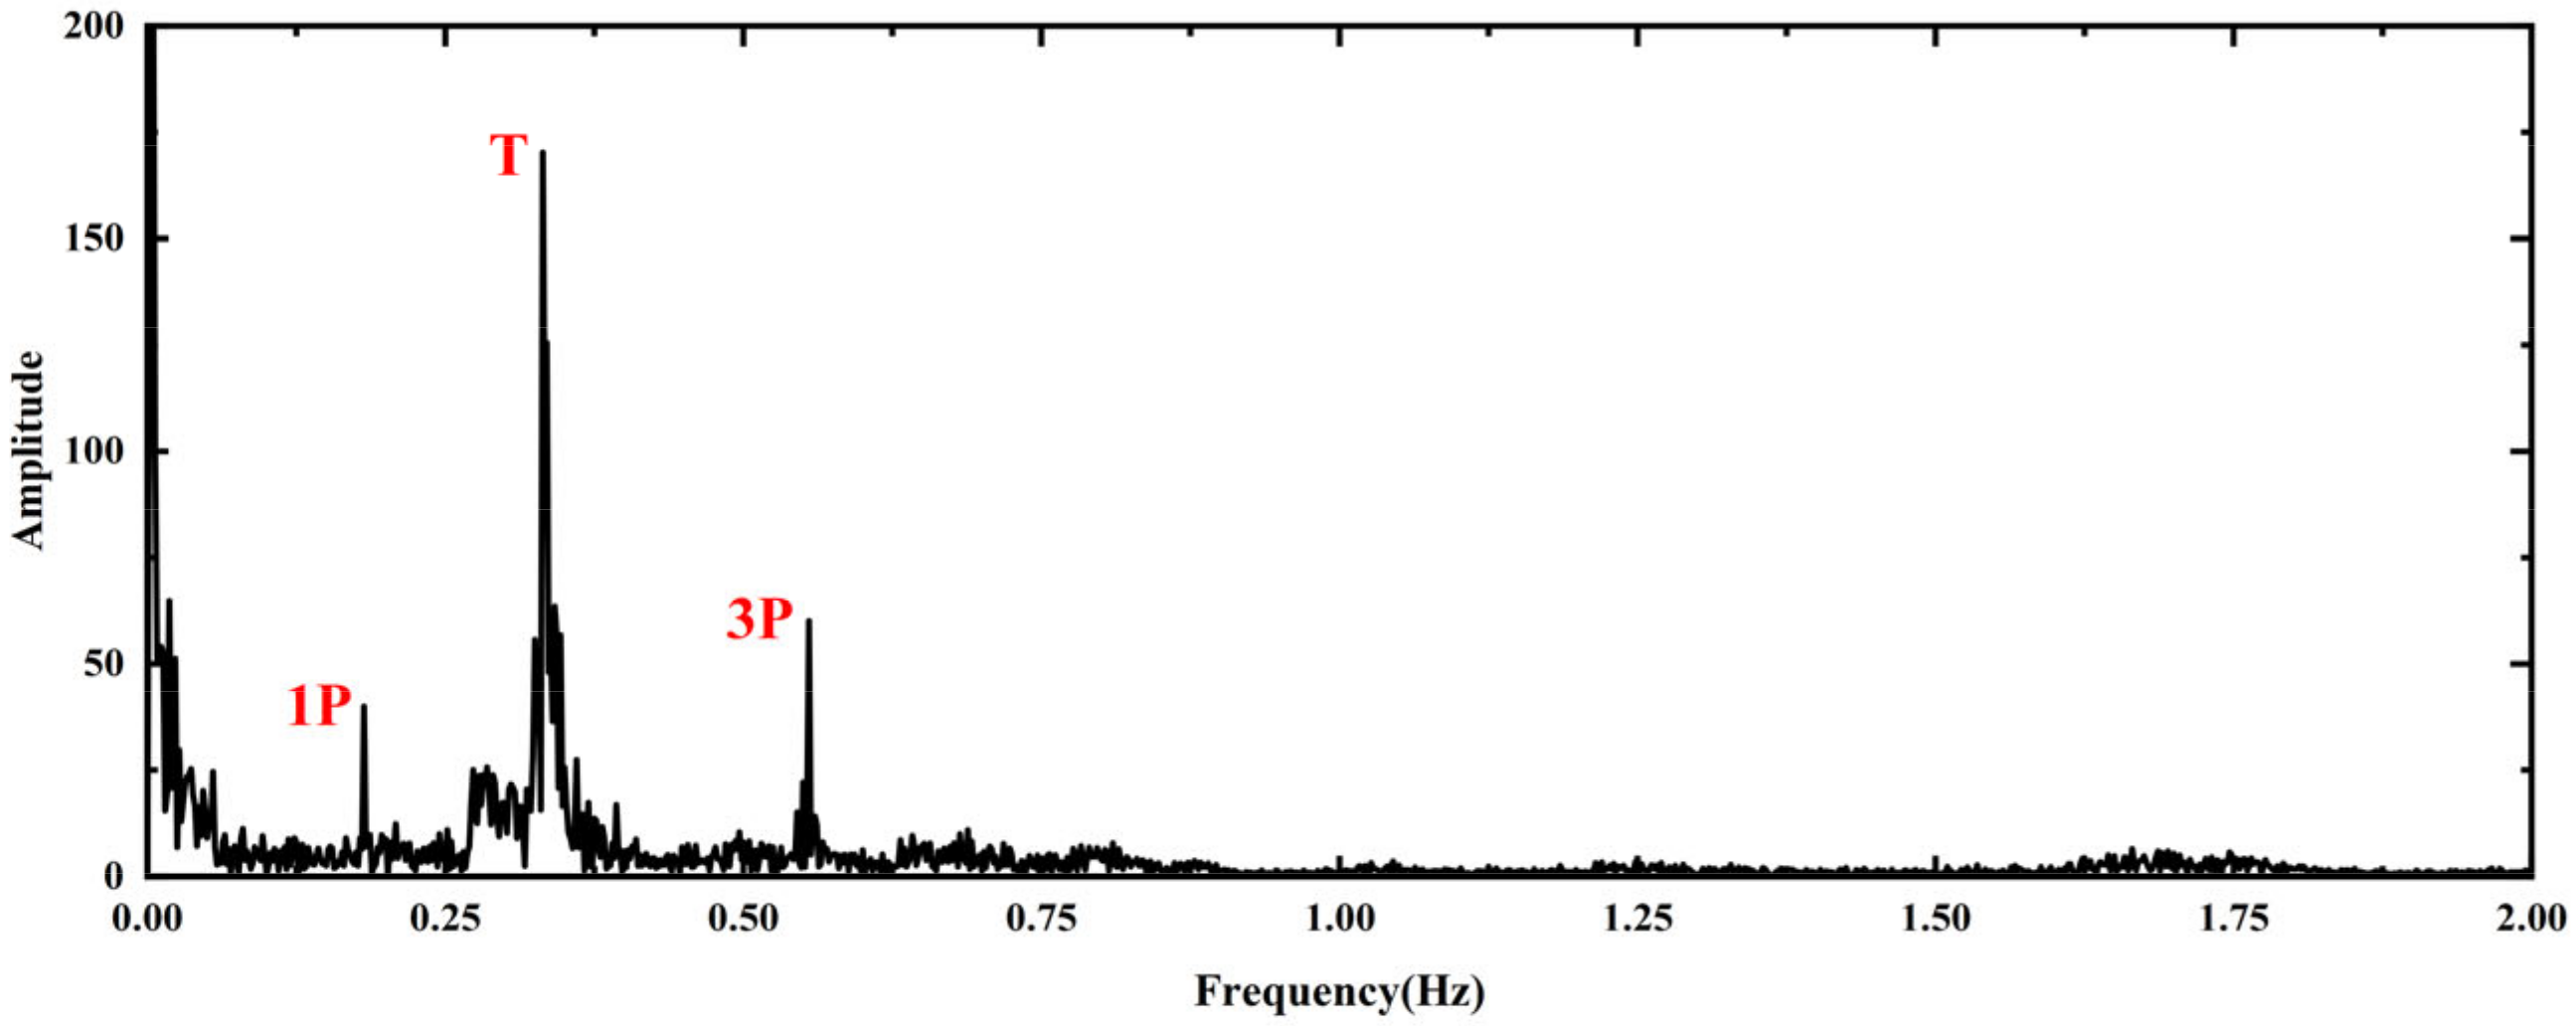
The group carried out strain monitoring of the ESR of the WT foundation under study. The strain monitoring data of nacelle position and hub speed (11 rpm) stability during the monitoring period were extracted. The strain time history at the same hub speed and nacelle position as the experiment was extracted from ABAQUS. Figure 15 shows the frequency domain signal of strain obtained by FFT transformation of the strain time history obtained by experiment and simulation. Due to the close connection between strain and load, the foundation load Mx time history curve was extracted at a hub speed of 11 rpm, and the FFT transformation was performed to obtain the load frequency-domain signal as shown in Figure 16. The other load frequency domain signals are not shown here as space is limited, and their results were similar to Mx.
There are three peaks in both Figure 15 and Figure 16. Where 1P is the 1 time rotation frequency of the rotor (0.183 Hz), 3P is the 3 time rotation frequency of the rotor (0.549 Hz), and T is the natural frequency of the structure (0.34 Hz). The frequency domain signals were found to be in good agreement. The above analysis can prove the reliability of the finite element model and load simulation model in this paper.

4.3. Effect of PAE and Wind Velocity on Foundation Stress

The foundation loads under different PAEs obtained from GH Bladed in Section 3.1 were applied to the foundation FE model. Subsequently, dynamic response analyses were conducted under varying wind speeds and PAEs, resulting in the dynamic response of the WT foundation subjected to 3D turbulent wind for a duration of 600 s. FE results show that stress concentration occurred in the ESR on the leeward side, as well as in the concrete below the bottom flange of the ESR, and the reinforcement cage shows a stress concentration in the area around the upper flange on the windward side, as shown in the interior of the black area in Figure 17. At the same time, the most dangerous elements were marked in Figure 17, and subsequent descriptions of stress concentration positions in this paper refer to the most dangerous elements in the figure.
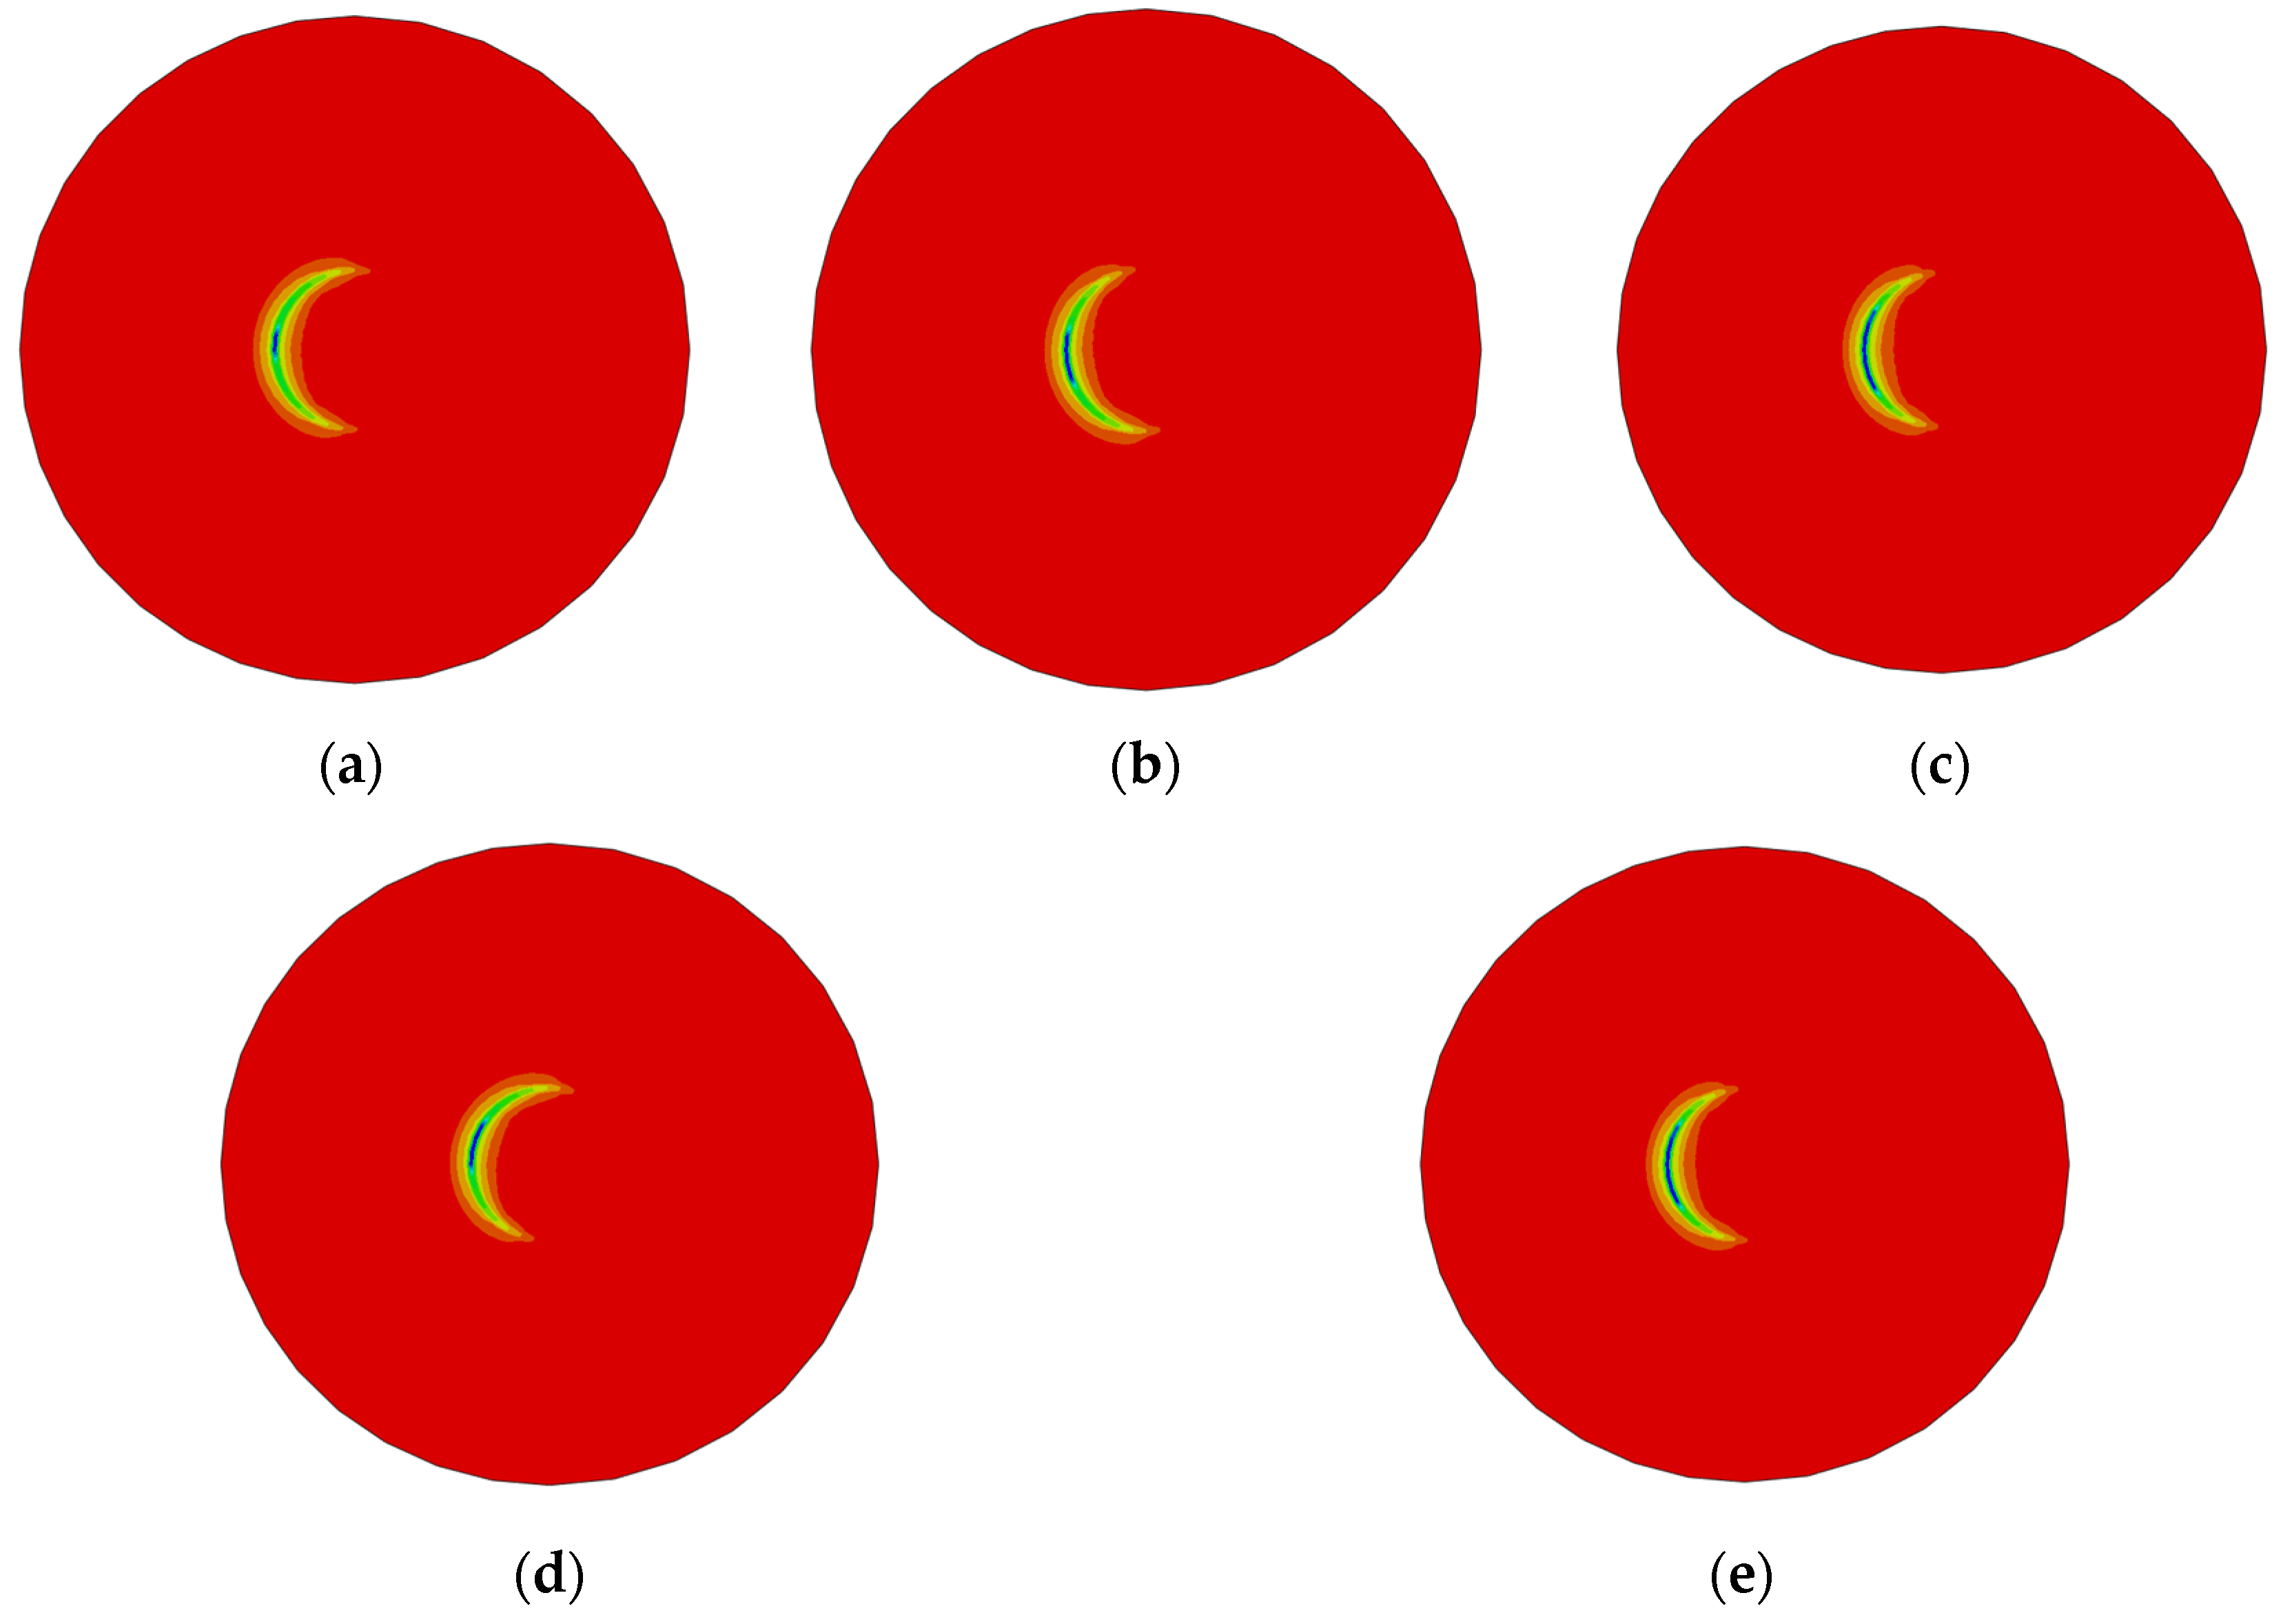
Figure 18 shows the equivalent stress cloud of concrete compressive stress for different PAEs with an average wind speed of 10 m/s. It can be seen that the PAE significantly increases the range of stress concentration in the foundation concrete, and the degree of stress concentration decreases along the projection of the ESR to both sides.
Figure 19 shows the stress–time history curves for the stress concentration positions of the foundation concrete, ESR, and reinforcement cage under turbulent wind with an average wind speed of 10 m/s (100–200 s). Meanwhile, the example box in the figure lists the average value of each stress within a 600 s duration. The time history curves of stress at other wind speeds are not shown here as space is limited.
As shown in Figure 19, both positive and negative PAE will lead to an increase in the stress concentration position fluctuation amplitude. Meanwhile, the average values of compressive stress of concrete and mises stress of the ESR decrease with positive PAE, while they increase with negative PAE. The average value of tensile stress in concrete decreases with both positive and negative PAE, and the average value of mises stress in the reinforcement cage increases with both positive and negative PAE.
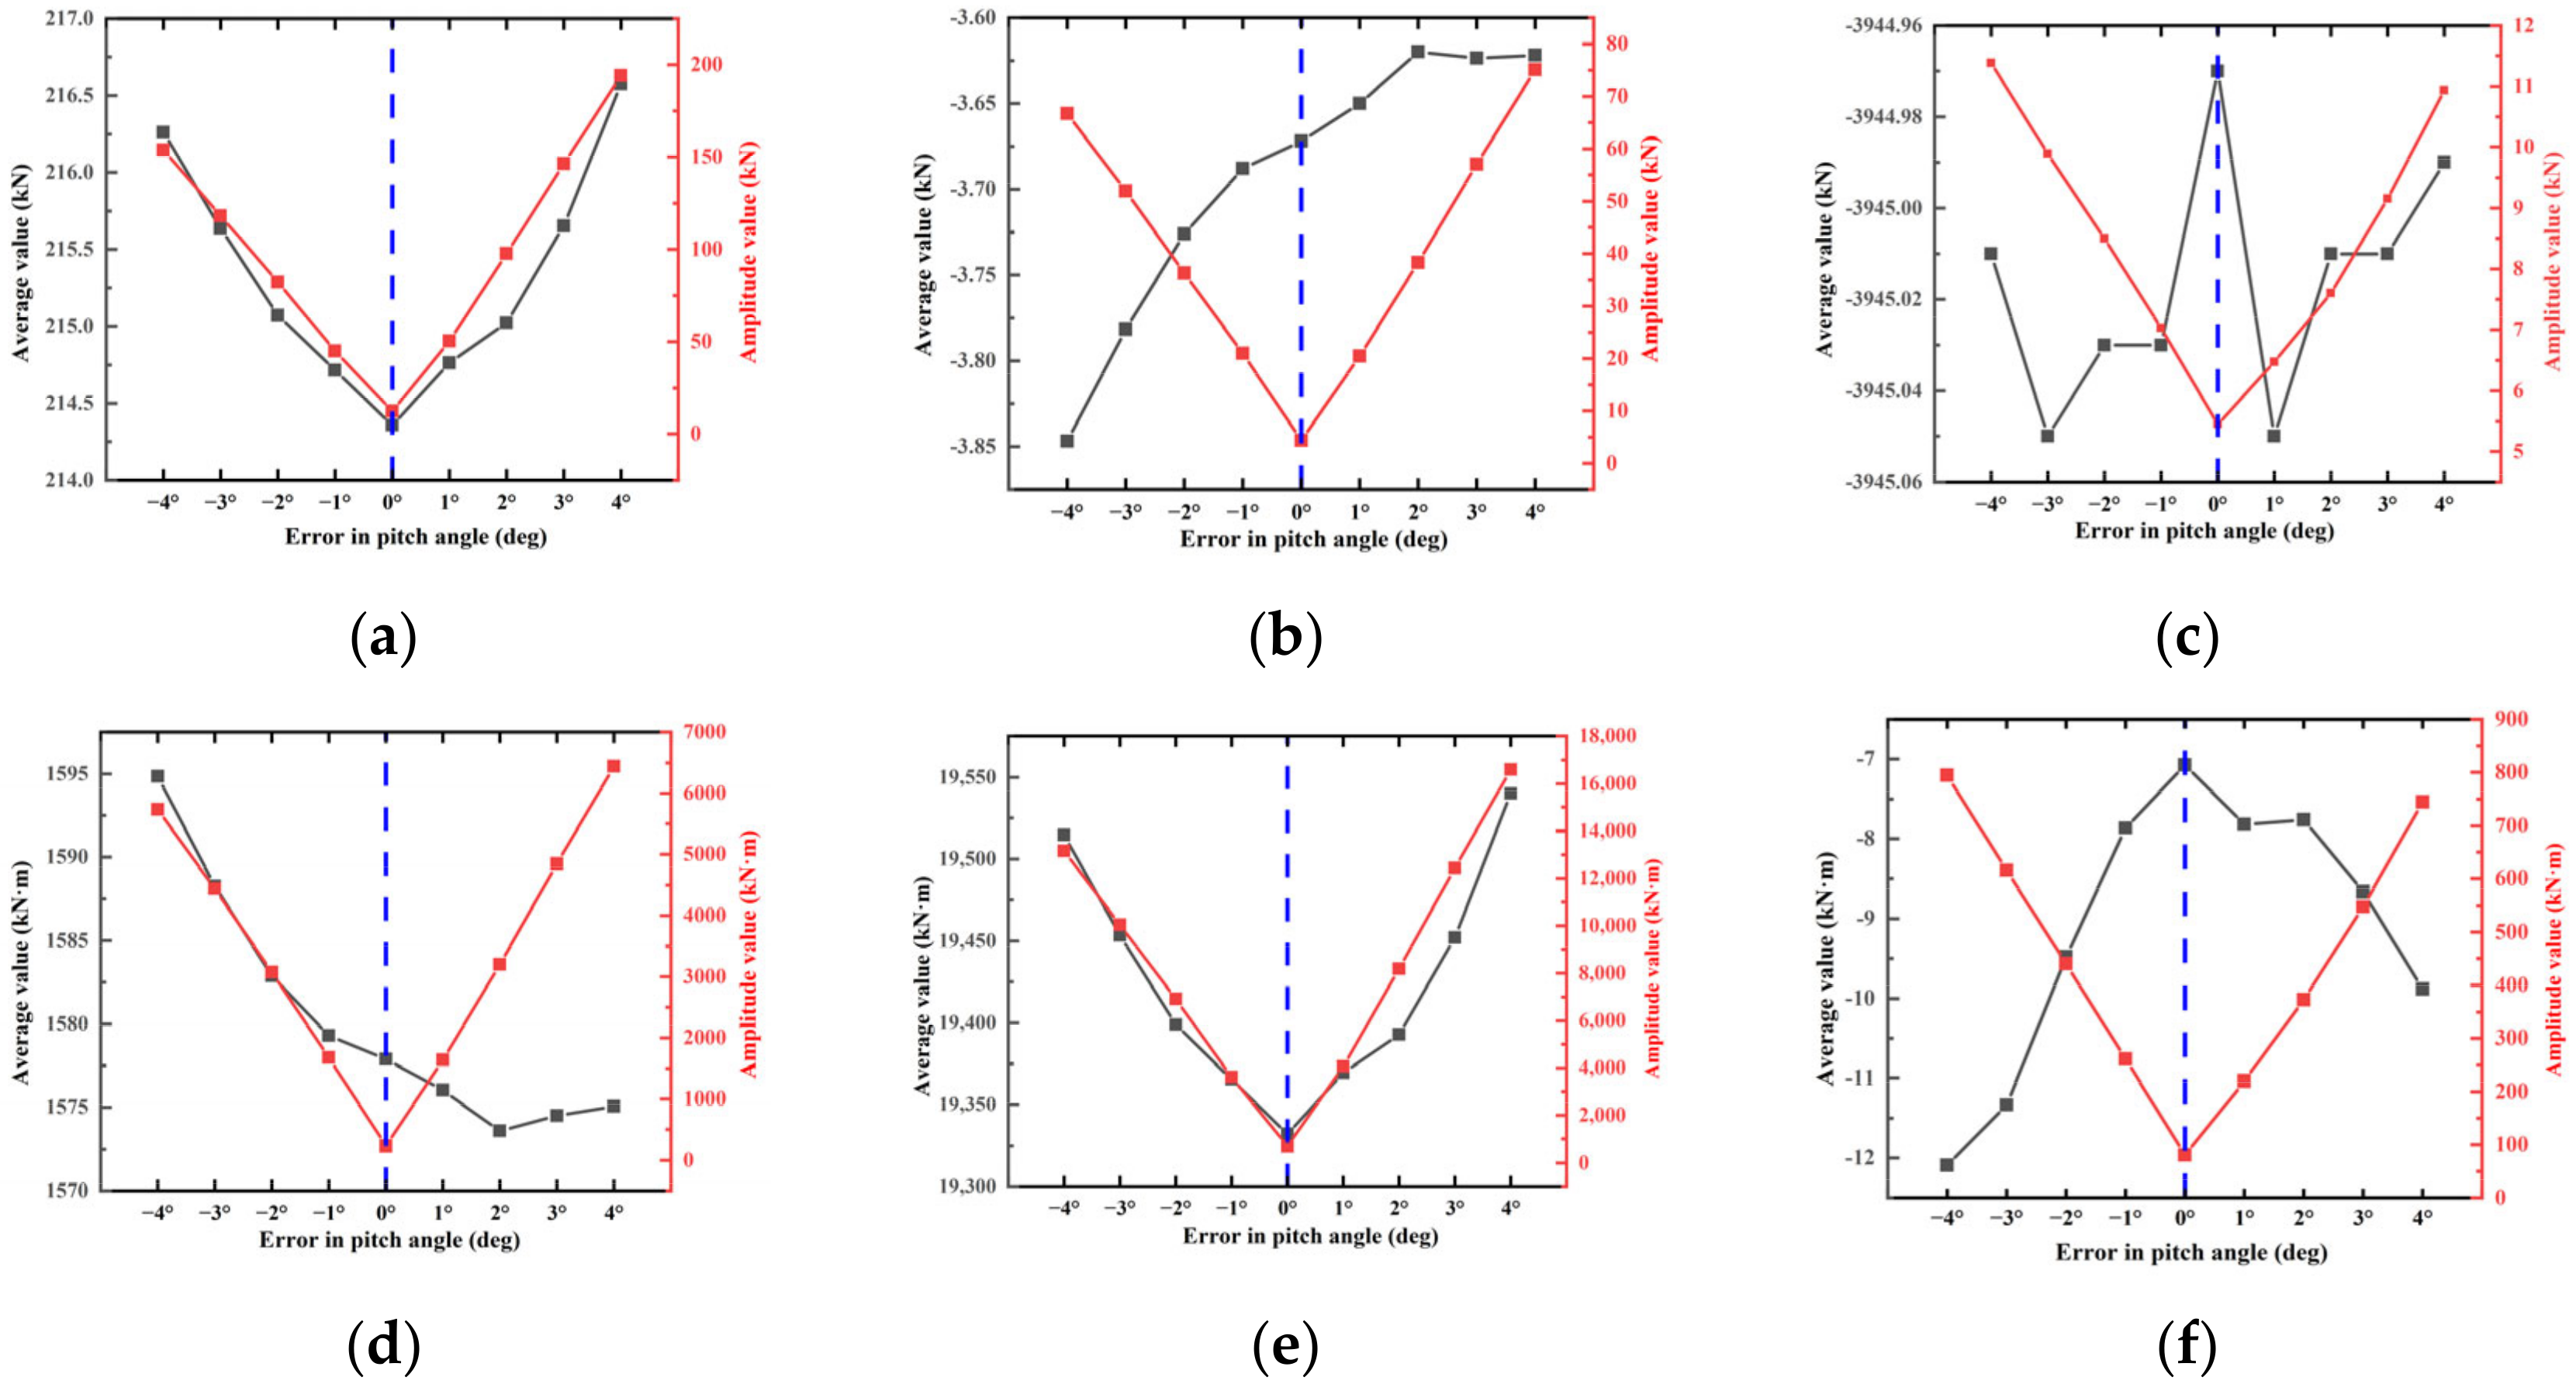
The effect of PAE on the above four stresses under steady-state wind with different wind speeds is shown in Figure 20, Figure 21 and Figure 22, where the black solid line represents the average value of the stress and the red solid line represents the amplitude value of the stress, with the meanings of amplitude and average values consistent with those presented in Figure 9.
From the red solid line in Figure 20, Figure 21 and Figure 22, it can be clearly seen that an amplitude value of stress of 4 under steady-state wind will increase with the increase in the positive and negative PAE. At the same time, the effect of the PAE on the amplitude value of stress gradually increases with an increase in wind velocity. Looking at the black solid line in Figure 21, the influence of steady-state wind and turbulent wind on the average value of stress is consistent. However, the influence of PAE on stress is different at different wind speeds.
The influence of PAE on the percent change in stress, as calculated by Equation (3), is presented in Figure 23 and Figure 24. It can be seen that the percent change in the average value and amplitude value of stress increases with an increase in PAE. The effect of PAE on the amplitude of stress is significantly greater than its effect on the average value of stress. In addition, the effect of the PAE on the amplitude value of stress gradually increases with an increase in wind velocity.
p e r c e n t   c h a n g e   o f   s t r e s s = S t r e s s   o f   PAE-Stress   w i t h o u t   P A E S t r e s s   w i t h o u t   P A E × 100 %
To summarize, the conclusions are as follows: (1) The PAE has a significantly greater effect on the amplitude value of stress at the stress concentration position in concrete, the ESR, and the reinforcement cage than on the corresponding average value of stress. (2) The PAE will significantly increase the amplitude value of stress at a stress concentration position. (3) The effect of the PAE on the amplitude value of stress gradually increases with an increase in wind velocity.

5. Analysis of the Fatigue Damage to the WT Foundation Based on Annual SCADA Data

5.1. One Year of Wind Direction and Speed Analysis

The SCADA data of the 5# WT studied in this paper for the whole year of 2022 were extracted. The 5# WT operated normally for a total of 3000 h during 2022. The wind direction in the SCADA data is divided into 12 directions with an interval of 30°, labeled from N–NNW. In each wind direction area, the average wind speed is divided into 10 intervals: 4 m/s, 6 m/s, 8 m/s, 10 m/s, 12 m/s, 14 m/s, 16 m/s, 18 m/s, 20 m/s, and 22 m/s. Thus, there are 120 wind speed–wind direction combinations. From this, we can calculate the operating time of the 5# WT in 2022 under different wind directions and wind speeds and obtain the probability of the occurrence of each wind speed–wind direction interval in 2022, as shown in Table 2.
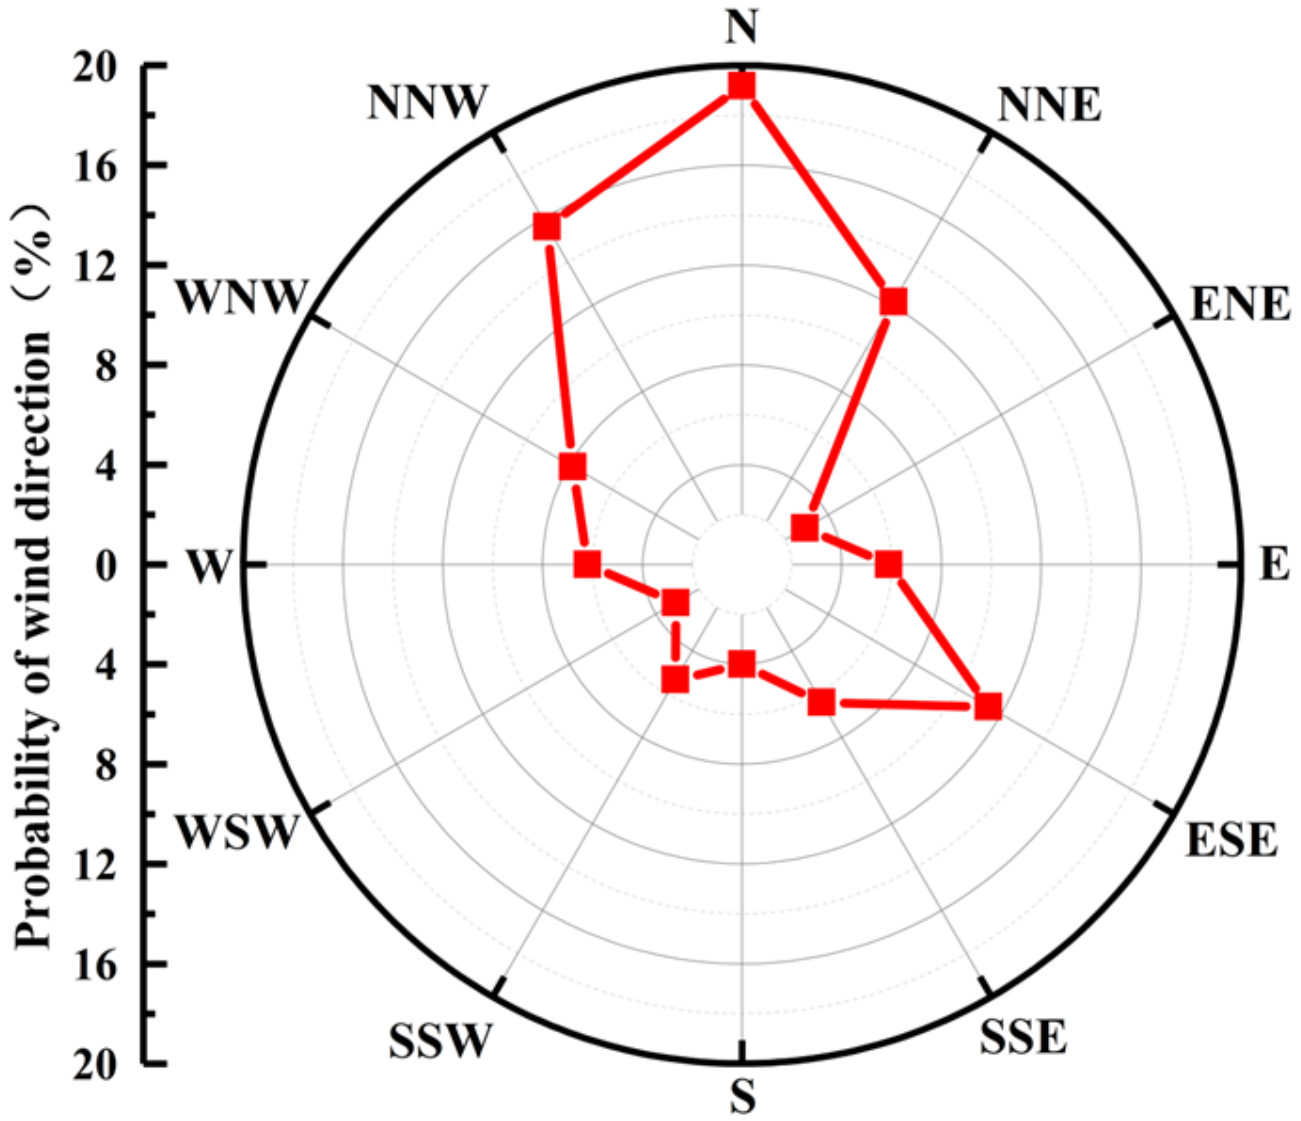
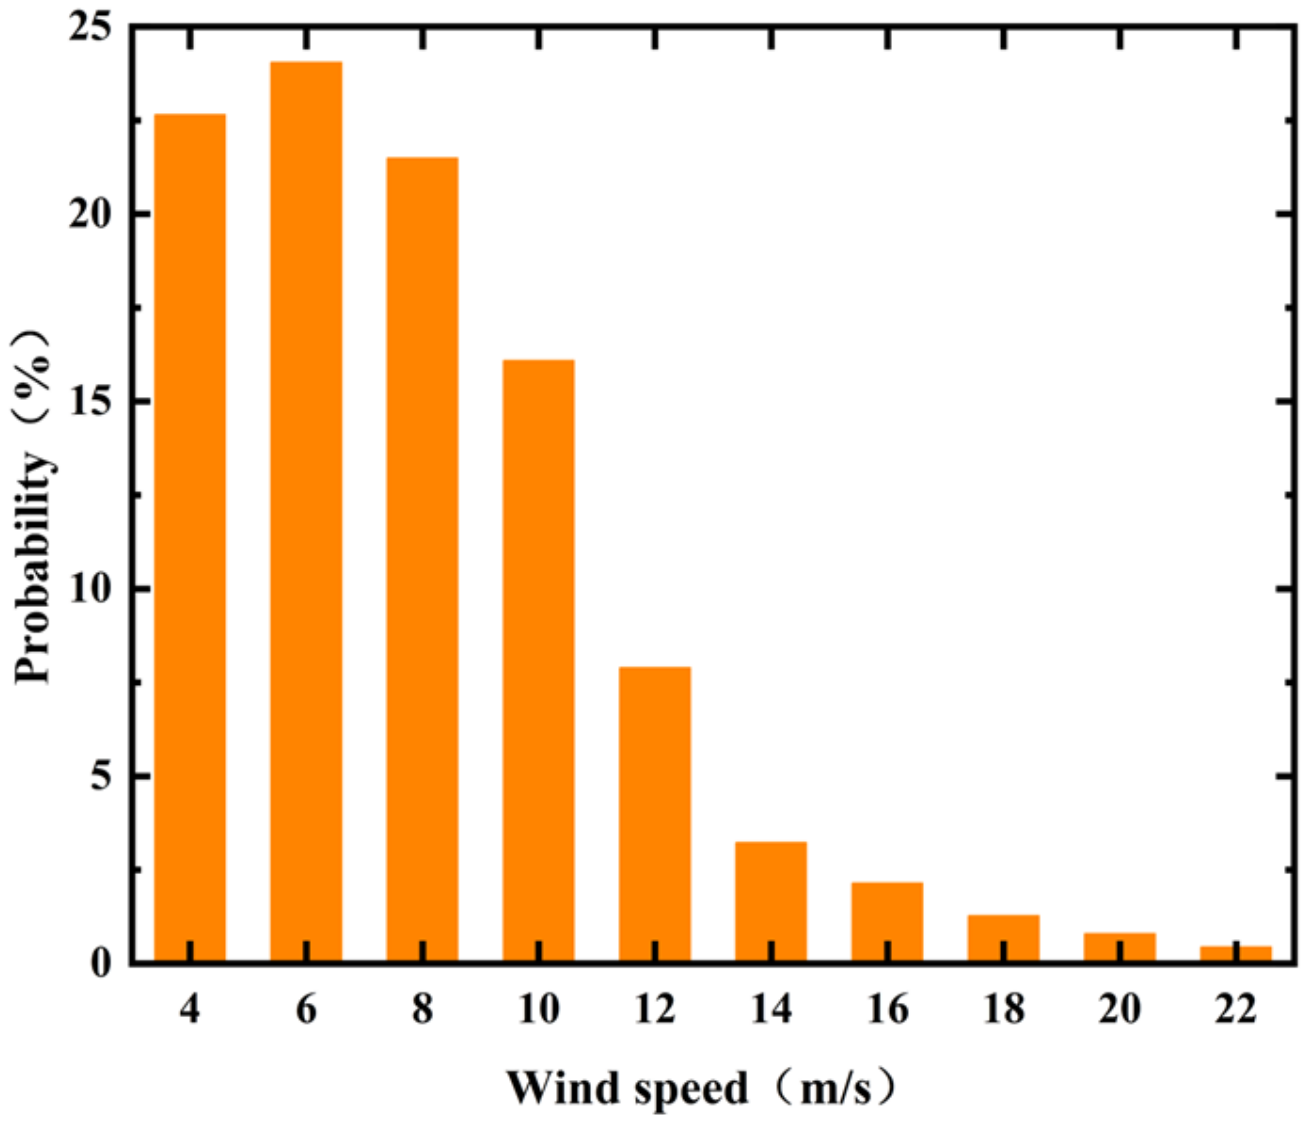
The probability of the occurrence of wind direction and wind speed is shown in Figure 25 and Figure 26, respectively. As can be seen from the figure: (1) In 2022, the wind direction of the 5# WT is mainly concentrated in four directions, N, NNW, NNE, and ESE, and the probability of its occurrence is 19.18%, 15.63%, 12.16%, and 11.41%, respectively. (2) The wind speed is mainly 10 m/s and below, with only a 15% probability of wind speeds exceeding the rated wind speed in 2022.

5.2. S–N Curve of Concrete Fatigue Damage

Fatigue damage [27] refers to the degree of damage to the material under fatigue loading, and it is generally represented by a dimensionless parameter D. The fatigue cumulative damage theory [28,29] is used to calculate structure fatigue damage under the fatigue load. At present, the Palmgren–Miner linear cumulative damage criterion [30,31] is used to calculate the fatigue damage of a structural fatigue hot spot. In this study, we also employ the P–M criterion and utilize S–N curves to assess the effect of PAE on the fatigue damage of a WT foundation with an ESR.
The WT foundation is required to withstand 107 load cycles during its design service life. Therefore, this paper adopts the FIB Model Code [32] issued by the International Federation for Structure Concrete to calculate the fatigue damage of concrete at the bottom flange of the WT foundation. The concrete S–N curve used in this paper is:
log N 1 = 8 Y 1 · ( S c d , max 1 )
log N 2 = 8 + 8 · ln ( 10 ) Y 1 · ( Y S c d , min ) · log ( S c d , max S c d , min Y S c d , min )
where Y = 0.45 + 1.8 · S c d , min 1 + 1.8 · S c d , min 0.3 · S c d , min 2 ; S c d , min is the minimum compressive stress level, which can be obtained by Equation (6); S c d , max is the maximum compressive stress level, which can be obtained by Equation (7); and N1, N2 is the number of cycles to failure, where if logN1 ≤ 8, then logN = logN1, and if logN1 > 8, then logN = logN2.
S c d , min = γ E d σ c , min η c / f c d , f a t
S c d , max = γ E d σ c , max η c / f c d , f a t
where σ c , min is the minimum compressive stress in MPa; σ c , max is the maximum compressive stress in MPa; γ E d is the partial safety factor for fatigue load, and 1.1 is used here; η c is the averaging factor for concrete stresses in the compression zone considering the stress gradient, and 0.8 is used here; and f c d , f a t is the fatigue strength of the concrete within the design life, which can be calculated according to Equations (8) and (9):
f c d , f a t = 0.85 · β c c ( t ) · f c d · ( 1 f c d 400 ) / γ c , f a t
β c c ( t ) = exp { s · [ 1 ( 28 / t ) 0.5 ] }
where β c c ( t ) is a coefficient that depends on the age of concrete at the beginning of fatigue loading; fcd is the characteristic value of the compressive strength of concrete; γ c , f a t is the partial safety factor for material, and 1.5 is used here; s is a coefficient that depends on the strength class of cement; and t is the concrete age in days.
Fatigue damage D of concrete is calculated using the Palmgren–Miner summation:
D = i n i N f i
where D is the fatigue damage, and when D > 1, it indicates that the material has reached its fatigue life; ni is the actual cycles of stress; and Nfi is the failure cycles corresponding to the stress amplitude, which can be calculated according to Equations (4)–(9).

5.3. Calculation Method for Fatigue Damage to the WT Foundation Concrete

It can be seen from Section 4.3 that stress concentration occurs in the bottom flange of the ESR on the leeward side of the WT foundation concrete under wind load. The rain flow counting (RFC) method is used to calculate the stress time history of concrete in this area. Therefore, we can obtain the fatigue stress amplitude, average, and cycles for the 600 s dynamic response.
The statistical results of the time history of the tensile stress of concrete at the stress concentration under turbulent wind (600 s) with an average wind speed of 10 m/s are shown in Figure 27. The RFC results of other stress time histories are not shown here as space is limited. The graph reveals that, in comparison to the case where the PAE is 0°, the occurrence of PAE leads to a significant increase in the number of high-stress amplitude cycles. Furthermore, the influence of positive PAE on stress amplitude is more pronounced than that of negative PAE.
Since the results obtained from the RFC cannot be directly used to calculate the fatigue damage, the Goodman curve is used to equivalently convert the stress amplitude and the average stress in the RFC to obtain the equivalent stress amplitude [33]. These equivalent stress amplitudes are then used in conjunction with material S–N curves to calculate the fatigue damage at critical locations in the structure. This process can be implemented through MATLAB programming.
The fatigue damage to the WT foundation concrete under turbulent wind can be obtained by combining the modified RFC results with the S–N curve of the material.
According to Equations (4)–(10), the fatigue damage of the WT foundation under a single wind speed and a single wind direction in 2022 can be obtained by combining the operating time of the 5# WT in 2022 with the probability of occurrence of wind speed–wind direction. As shown in Table 2, the probability of turbulent wind with a wind speed of 10 m/s in the N direction in 2022 is 4.13%. Given that the WT operates for 3000 h per year, it can be inferred that the WT operates for 123.9 h under the corresponding wind direction and wind speed conditions. Similarly, the WT operates for 120.3 h in turbulent wind with an average wind speed of 6 m/s and 23.1 h in turbulent wind with an average wind speed of 14 m/s. The fatigue damage of concrete at the bottom flange of the ESR on the leeward side (direction S) is calculated according to Equations (4)–(10), as shown in Figure 28. It can be seen that the fatigue damage increases with the increase in PAE. At the same time, although the probability of high wind speed is very small, the influence of high wind speed on the fatigue damage of the foundation is much greater than that of low wind speed.

5.4. Fatigue Damage to the WT Foundation Concrete Caused by PAE

Turbulent wind with different wind speeds and directions will cause different degrees of damage to concrete at different positions of the foundation. In order to accurately analyze the effect of PAE on the fatigue damage to the WT foundation concrete, the fatigue damage to the concrete (12 directions: N–NNW) at the bottom flange of the ESR under different PAEs was calculated based on the statistical data presented in Table 2.
Figure 29 illustrates the fatigue damage to the bottom concrete of the ESR under turbulent wind conditions with a wind direction of N and a wind speed of 10 m/s at various PAEs after 123.9 h. The fatigue damage to the foundation concrete under other PAEs is not shown here as space is limited. It can be observed that: (1) Fatigue damage to the concrete is most severe on the leeward side and gradually decreases towards both sides. (2) Fatigue damage increases with increasing PAE, and the fatigue damage caused by positive PAE is greater than that caused by negative PAE.
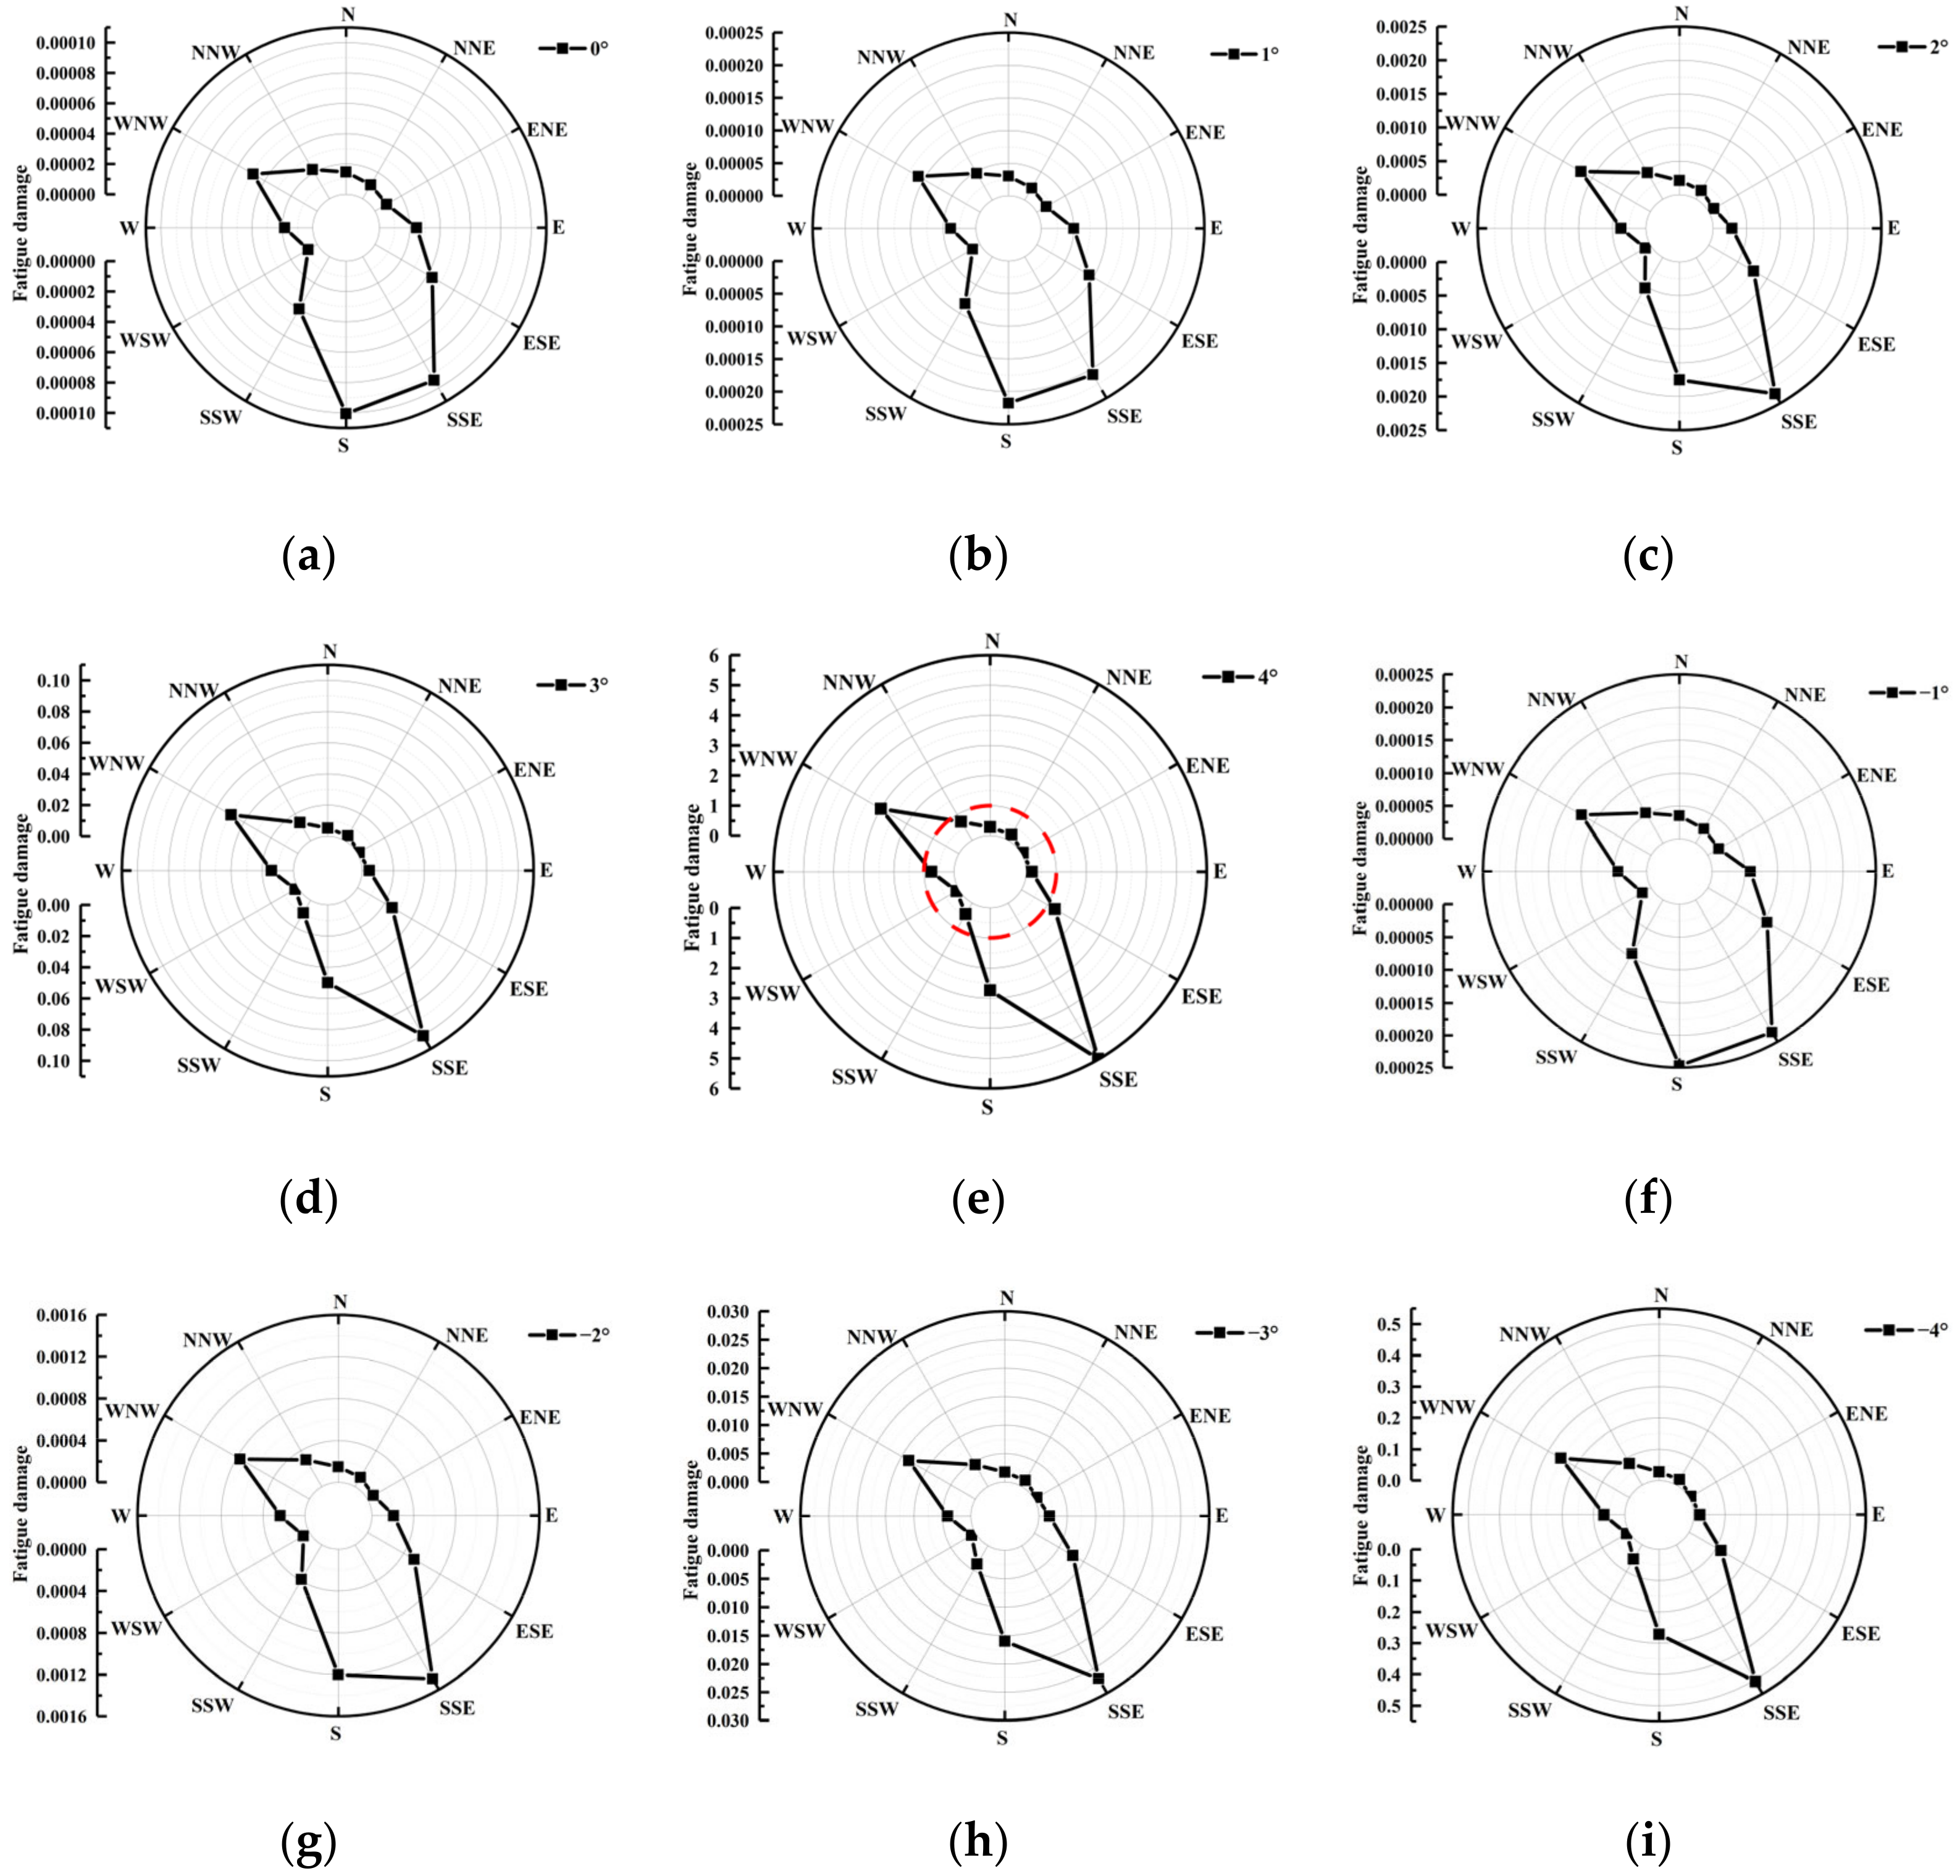
The fatigue damage to the WT foundation is caused by the accumulation of loads from different wind speeds and directions. Therefore, the obtained fatigue damages are multiplied by the probability of occurrence of the respective wind direction–wind speed (as shown in Table 2), and the results are summed to obtain the total fatigue damage after one year of operation (3000 h), as shown in Figure 30. It can be seen from the figure that the relative relationship of fatigue damage in 12 directions is convergent under different PAEs. In other words, the maximum fatigue damage occurs in the S direction or SSE direction, which is obviously related to the main wind direction shown in Figure 25. Figure 31 shows the relationship between the fatigue damage and the PAE in 12 directions. It can be seen that when the PAE is within the range of −3° to 3°, the foundation fatigue damage incurred over one year is minimal, but once this limit is exceeded, the foundation fatigue damage increases dramatically. In particular, for more than 3° positive PAE, one year is enough to cause fatigue failure in the foundation concrete.

5.5. Further Analysis

From Figure 25, it can be seen that the 5# WT has the highest probability of occurrence in the N direction, which reaches 19.14%. Consequently, the direction of the most serious fatigue damage to the foundation concrete should be in the direction of S. However, Figure 30 shows that when the PAE exceeds ±1°, the direction with the maximum fatigue damage is not in the S direction but rather in the SSE direction.
In order to investigate the cause of this phenomenon, the source of fatigue damage in the SSE direction was statistically analyzed, as shown in Figure 32. In the figure, the horizontal coordinate axis on the left side of the three-dimensional figure represents the wind direction, which corresponds to the 12 directions in Table 2, and the horizontal coordinate axis on the right side represents the wind speed, which corresponds to the 10 wind speeds in Table 2. The height of each cubic column in the figure represents the proportion of the fatigue damage occurring in the SSE direction throughout the year under the influence of the respective wind direction and wind speed (with duration calculated based on the probabilities from Table 2). As can be seen from the figure: (1) The primary cause of fatigue damage occurring in the SSE direction is the wind from the NNW direction. (2) When the PAE is 0° or ±1°, the wind from the NNW direction with wind speeds ranging from 10 m/s to 14 m/s results in the highest proportion of fatigue damage in the SSE direction throughout the year. However, when the PAE exceeds ±2°, the proportion of fatigue damage caused by wind speeds of 18 m/s to 22 m/s from the NNW direction dramatically increases. (3) When the PAE reaches ±4°, almost all of the SSE direction’s annual fatigue damage is attributed to winds from the NNW direction with wind speeds of 18 m/s to 22 m/s.
According to Table 2, in the year 2022, the probability of the occurrence of wind with a wind speed of 18–22 m/s in the NNW direction reaches 1.01%, making it the highest probability among the twelve directions. But in the N direction, the probability of the occurrence of wind speeds in the range of 18 m/s to 22 m/s was only 0.39%. It can be seen that the peak value of fatigue damage to the foundation concrete caused by PAE does not necessarily occur in the main wind direction, but in the direction with the highest probability of the occurrence of high wind speeds, and the larger the PAE, the more significant the trend.

6. Conclusions

This study focuses on a 2 MW WT with an ESR to investigate the effect of aerodynamic imbalance on WT foundation loads and stresses. The foundation fatigue damage caused by aerodynamic imbalance based on the SCADA data for one year was analyzed. The conclusions are as follows:
(1)
The influence of PAE under turbulent wind conditions on WT foundation loads exhibits consistency with the patterns observed under steady-state wind conditions. The effect of the PAE on the amplitude value of the load is significantly greater than on the average value of the load. The effect of the PAE on the amplitude value of the load gradually increases with an increase in wind velocity. Among the six foundation loads, the amplitude values of Mx and My are most sensitive to PAE.
(2)
The PAE has a significantly greater effect on the amplitude value of stress at stress concentration positions in concrete, the ESR, and the reinforcement cage than on the corresponding average value of stress. The PAE will significantly increase the amplitude value of stress at the stress concentration position. The effect of the PAE on the amplitude value of stress gradually increases with an increase in wind velocity.
(3)
Fatigue damage to the concrete is the most severe on the leeward side and gradually decreases on both sides. Fatigue damage increases with increasing PAE, and the fatigue damage caused by positive PAE is greater than that caused by negative PAE.
(4)
When the PAE is within the range of −3° to 3°, the foundation fatigue damage incurred over one year is minimal, but once this limit is exceeded, the foundation fatigue damage increases dramatically. In particular, for more than 3° positive PAE, one year is enough to cause fatigue failure in the foundation concrete.
(5)
The peak value of fatigue damage to the foundation concrete caused by PAE does not necessarily occur in the main wind direction, but in the direction with the highest probability of the occurrence of high wind speeds, and the larger the PAE, the more significant the trend.

Author Contributions

Methodology, Z.L.; Software, P.L.; Validation, P.L. and H.Z.; Formal analysis, S.F.; Resources, Z.X.; Data curation, Q.H. and C.Q.; Writing—original draft, P.L.; Writing—review and editing, Z.L.; Supervision, H.Z.; Project administration, Z.X. All authors have read and agreed to the published version of the manuscript.

Funding

This research received no external funding.

Data Availability Statement

The raw data supporting the conclusions of this article will be made available by the authors on request.

Conflicts of Interest

Authors Qi Han, Chenxin Qin, Shougang Fan and Zhijie Xu were employed by the company Huadian New Energy Group Corporation Limited Hunan Branch. The remaining authors declare that the research was conducted in the absence of any commercial or financial relationships that could be construed as a potential conflict of interest.

References

  1. Wang, J.W.; Xu, X.Y.; Zhang, D.; Tian, J. Finite Element Method Mechanical Characteristics Analysis of Tower Foundation for Wind Turbine Generator System. Adv. Mater. Res. 2012, 499, 327–330. [Google Scholar] [CrossRef]
  2. McAlorum, J.; Perry, M.; Fusiek, G.; Niewczas, P.; McKeeman, I.; Rubert, T. Deterioration of cracks in onshore wind turbine foundations. Eng. Struct. 2018, 167, 121–131. [Google Scholar] [CrossRef]
  3. Kang, M.H.; Xu, H.; Huang, X. Local damage analysis of near foundation ring in wind turbine foundation. Acta Energ. Sol. Sinnca 2014, 35, 583–588. [Google Scholar]
  4. Amponsah, E.; Wu, Z.; Feng, Q.; Wang, Z.; Kwame Mantey, S. Analysis of crack propagation in onshore wind turbine foundations using the double-K fracture model. Structures 2022, 41, 925–942. [Google Scholar] [CrossRef]
  5. Amponsah, E.; Wang, Z.; Kwame Mantey, S. Bending-bearing behaviour of embedded steel ring-foundation connection of onshore wind turbines. Structures 2021, 34, 180–197. [Google Scholar] [CrossRef]
  6. Stavridou, N.; Efthymiou, E.; Baniotopoulos, C.C. Verification of Anchoring in Foundations of Wind Turbine Towers. Am. J. Eng. Appl. Sci. 2015, 8, 717–729. [Google Scholar] [CrossRef]
  7. Bai, X.; He, M.; Ma, R.; Huang, D.; Chen, J. Modelling fatigue degradation of the compressive zone of concrete in onshore wind turbine foundations. Constr. Build. Mater. 2017, 132, 425–437. [Google Scholar] [CrossRef]
  8. Li, Z.; Chen, S.; Ma, H.; Feng, T. Design defect of wind turbine operating in typhoon activity zone. Eng. Fail. Anal. 2013, 27, 165–172. [Google Scholar] [CrossRef]
  9. He, M.; Bai, X.; Ma, R.; Huang, D. Structural monitoring of an onshore wind turbine foundation using strain sensors. Struct. Infrastruct. Eng. 2019, 15, 314–333. [Google Scholar] [CrossRef]
  10. Bai, X. Structural condition monitoring of wind turbine foundations. Proc. Inst. Civ. Eng.-Energy 2017, 170, 116–134. [Google Scholar] [CrossRef]
  11. Zhang, Z.; Liu, M.; Zhou, M.; Chen, J. Dynamic reliability analysis of nonlinear structures using a Duffing-system-based equivalent nonlinear system method. Int. J. Approx. Reason. 2020, 126, 84–97. [Google Scholar] [CrossRef]
  12. Zhao, J.B.; Wang, K.W.; Wang, Y.D.; Fu, B. Fatigue reliability calculation of wind turbine foundation based on probability density evolution. J. Hunan Univ. (Nat. Sci.) 2020, 47, 120–127. [Google Scholar]
  13. Mankar, A.; Srensen, J.D. Probabilistic fatigue design of reinforced-concrete wind turbine foundations. In Proceedings of the 13th International Conference on Applications of Statistics and Probability in Civil Engineering, Seoul, Republic of Korea, 26–30 May 2019. [Google Scholar]
  14. Zhu, D.; Ding, Z.; Huang, X.; Li, X. Probabilistic modeling for long-term fatigue reliability of wind turbines based on Markov model and subset simulation. Int. J. Fatigue 2023, 173, 107685. [Google Scholar] [CrossRef]
  15. Niebsch, J.; Ramlau, R.; Nguyen, T.T. Mass and Aerodynamic Imbalance Estimates of Wind Turbines. Energies 2010, 3, 696–710. [Google Scholar] [CrossRef]
  16. Jiang, D.; Huang, Q.; Hong, L. Theoretical and experimental study on wind wheel unbalance for a wind turbine. In Proceedings of the 2009 World Non-Grid-Connected Wind Power and Energy Conference, Nanjing, China, 24–26 September 2009; IEEE: Nanjing, China, 2009; pp. 1–5. [Google Scholar]
  17. Zhao, L.J.; Zhang, F.; Li, W.; Xing, Z.X.; Lu, X.H. Analysis on domain characteristics of imbalanced mechanical loads of wind turbine rotor. Acta Energ. Sol. Sinnca 2020, 41, 342–350. [Google Scholar]
  18. Wu, F.M.; Yang, C.X.; Wang, Q.; Wang, D. Research and verification of aerodynamic unbalance characteristics for large wind turbine. Acta Energ. Sol. Sinnca 2021, 42, 192–197. [Google Scholar]
  19. Qin, S.Y.; Li, Z.F. Analysis on frequency domain characteristics of mechanical loads on wind turbine rotor imbalance. Renew. Energy Resour. 2022, 40, 1202–1208. [Google Scholar]
  20. Malik, H.; Mishra, S. Application of Probabilistic Neural Network in Fault Diagnosis of Wind Turbine Using FAST, TurbSim and Simulink. Procedia Comput. Sci. 2015, 58, 186–193. [Google Scholar] [CrossRef]
  21. Malik, H.; Mishra, S. Artificial neural network and empirical mode decomposition based imbalance fault diagnosis of wind turbine using TurbSim, FAST and Simulink. IET Renew. Power Gener. 2017, 11, 889–902. [Google Scholar] [CrossRef]
  22. Tarabini, M.; Scaccabarozzi, D. Uncertainty-based combination of signal processing techniques for the identification of rotor imbalance. Measurement 2018, 114, 409–416. [Google Scholar] [CrossRef]
  23. Xing, Z.; Chen, M.; Cui, J.; Chen, Z.; Xu, J. Detection of magnitude and position of rotor aerodynamic imbalance of wind turbines using Convolutional Neural Network. Renew. Energy 2022, 197, 1020–1033. [Google Scholar] [CrossRef]
  24. Li, P.; Hu, W.; Hu, R.; Chen, Z. Imbalance fault detection based on the integrated analysis strategy for variable-speed wind turbines. Int. J. Electr. Power Energy Syst. 2020, 116, 105570. [Google Scholar] [CrossRef]
  25. Tang, S.; Tian, D.; Fang, J.; Liu, F.; Zhou, C. Individual pitch controller characteristics analysis and optimization under aerodynamic imbalanced loads of wind turbines. Energy Rep. 2021, 7, 6489–6500. [Google Scholar] [CrossRef]
  26. IEC 61400-1; Wind Energy Generation Systems-Part 1: Design Requirements. International Electrotechnical Commission: Geneva, Switzerland, 2019.
  27. Yao, W.X. Fatigue Life Estimation of Structures; Science Press: Beijing, China, 2019. [Google Scholar]
  28. Fatemi, A.; Yang, L. Cumulative fatigue damage and life prediction theories: A survey of the state of the art for homogeneous materials. Int. J. Fatigue 1998, 20, 9–34. [Google Scholar] [CrossRef]
  29. Zhang, Z.; Liu, Y.; Wang, L.; Li, W.; Ma, G. Probability Analysis of Duration of Stochastic Process Exceeding Fixed Threshold and Its Application on Structural Cumulative Damage and Fatigue Reliability Evaluation. ASCE-ASME J. Risk Uncertain. Eng. Syst. Part A Civ. Eng. 2024, 10, 04024007. [Google Scholar] [CrossRef]
  30. Miner, M.A. Cumulative Damage in Fatigue. J. Appl. Mech. 1945, 12, A159–A164. [Google Scholar] [CrossRef]
  31. Sonsino, C.M.; Baumgartner, J.; Breitenberger, M. Equivalent stress concepts for transforming of variable amplitude into constant amplitude loading and consequences for design and durability approval. Int. J. Fatigue 2022, 162, 106949. [Google Scholar] [CrossRef]
  32. Model Code 2010: First Complete Draft; International Federation for Structural Concrete: Lausanne, Switzerland, 2010; Volume 2.
  33. Vantadori, S.; Carpinteri, A.; Luciano, R.; Ronchei, C.; Scorza, D.; Zanichelli, A. Mean stress effect on fatigue life estimation for Inconel 718 alloy. Int. J. Fatigue 2020, 133, 105391. [Google Scholar] [CrossRef]
Figure 1. Problematic WT field detection diagram: (a) 15# problematic WT foundation; (b) 15# problematic WT blade; (c) 23# problematic WT foundation; (d) 23# problematic WT blade.
Buildings 14 01141 g001
Figure 2. Principal geometry of the WT foundation with an ESR (unit: mm).
Buildings 14 01141 g002
Figure 3. Foundation coordinate system and the six loads.
Buildings 14 01141 g003
Figure 4. 2 MW WT model established by GH Bladed.
Buildings 14 01141 g004
Figure 5. Turbulence standard deviation and longitudinal turbulence intensity for the normal turbulence model.
Buildings 14 01141 g005
Figure 6. Turbulent wind time history curve with an average wind speed of 6 m/s, 10 m/s, and 14 m/s.
Buildings 14 01141 g006
Figure 7. Time history curves and average value of six foundation loads under turbulent wind with an average wind speed of 10 m/s: (a) time history curve of Fx; (b) time history curve of Fy; (c) time history curve of Fz; (d) time history curve of Mx; (e) time history curve of My; (f) time history curve of Mz.
Buildings 14 01141 g007
Figure 8. Time history curves of foundation Fx under a steady-state wind speed of 10 m/s. (The PAE is −4°, 0°, and 4°, respectively).
Buildings 14 01141 g008
Figure 9. Definition of the load average value and amplitude value under steady-state wind.
Buildings 14 01141 g009
Figure 10. Effect of PAE on amplitude and average value of six foundation loads under steady-state wind with an average wind speed of 6 m/s: (a) Fx; (b) Fy; (c) Fz; (d) Mx; (e) My; (f) Mz.
Buildings 14 01141 g010
Figure 11. Effect of PAE on amplitude and average value of six foundation loads under steady-state wind with an average wind speed of 10 m/s: (a) Fx; (b) Fy; (c) Fz; (d) Mx; (e) My; (f) Mz.
Buildings 14 01141 g011
Figure 12. Effect of PAE on amplitude and average value of six foundation loads under steady-state wind with an average wind speed of 14 m/s: (a) Fx; (b) Fy; (c) Fz; (d) Mx; (e) My; (f) Mz.
Buildings 14 01141 g012
Figure 13. Effect of PAE on the percent change in the average value of the load under steady-state wind: (a) 6 m/s; (b) 10 m/s; (c) 14 m/s.
Buildings 14 01141 g013
Figure 14. Effect of PAE on the percent change in the amplitude value of the load under steady-state wind: (a) 6 m/s; (b) 10 m/s; (c) 14 m/s.
Buildings 14 01141 g014
Figure 15. Experimental and simulated strain frequency domain signals.
Buildings 14 01141 g015
Figure 16. Frequency domain signals of the foundation load of Mx in GH Bladed.
Buildings 14 01141 g016
Figure 17. WT foundation stress concentration position display: (a) embedded steel ring; (b) concrete; (c) reinforcement cage.
Buildings 14 01141 g017
Figure 18. Equivalent stress cloud of concrete compressive stress for different PAEs with an average wind speed of 10 m/s: (a) 0° PAE; (b) 2° PAE; (c) 4° PAE; (d) −2° PAE; (e) −4° PAE.
Buildings 14 01141 g018
Figure 19. Time history curves and average value of stress of the stress concentration position under turbulent wind with an average wind speed of 10 m/s: (a) compressive stress of concrete; (b) tensile stress of concrete; (c) mises stress of the ESR; (d) mises stress of the reinforcement cage.
Buildings 14 01141 g019
Figure 20. Effect of PAE on amplitude and average value of stress of the stress concentration position under a steady-state wind speed of 6 m/s: (a) compressive stress of concrete; (b) tensile stress of concrete; (c) mises stress of the ESR; (d) mises stress of the reinforcement cage.
Buildings 14 01141 g020
Figure 21. Effect of PAE on amplitude and average value of stress of the stress concentration position under a steady-state wind speed of 10 m/s: (a) compressive stress of concrete; (b) tensile stress of concrete; (c) mises stress of the ESR; (d) mises stress of the reinforcement cage.
Buildings 14 01141 g021
Figure 22. Effect of PAE on amplitude and average value of stress of the stress concentration position under steady-state wind speed of 14 m/s: (a) compressive stress of concrete; (b) tensile stress of concrete; (c) mises stress of the ESR; (d) mises stress of the reinforcement cage.
Buildings 14 01141 g022
Figure 23. Effect of PAE on the percent change in the average value of stress under steady-state wind: (a) 6 m/s; (b) 10 m/s; (c) 14 m/s.
Buildings 14 01141 g023
Figure 24. Effect of PAE on the percent change in the amplitude value of stress under steady-state wind: (a) 6 m/s; (b) 10 m/s; (c) 14 m/s.
Buildings 14 01141 g024
Figure 25. The probability of the occurrence of a wind direction.
Buildings 14 01141 g025
Figure 26. The probability of the occurrence of a wind speed.
Buildings 14 01141 g026
Figure 27. Statistical results of the time history of the tensile stress of concrete at the stress concentration under turbulent wind (600 s) with an average wind speed of 10 m/s: (a) 0° PAE; (b) 4° PAE; (c) −4° PAE.
Buildings 14 01141 g027
Figure 28. Fatigue damage to the concrete at the bottom flange of the ESR on the leeward side under turbulent wind with wind direction N: (a) wind speed is 6 m/s; (b) wind speed is 10 m/s; (c) wind speed is 14 m/s.
Buildings 14 01141 g028
Figure 29. Fatigue damage to the concrete at the bottom flange of the ESR in 12 directions under turbulent wind with wind direction N and a wind speed of 10 m/s under different PAEs after 123.9 h: (a) −4° PAE; (b) 0° PAE; (c) 4° PAE.
Buildings 14 01141 g029
Figure 30. Fatigue damage distribution of the concrete at the bottom flange of the ESR after one year of operation for the 5# WT with different PAEs: (a) 0° PAE; (b) 1° PAE; (c) 2° PAE; (d) 3° PAE; (e) 4° PAE; (f) −1° PAE; (g) −2° PAE; (h) −3° PAE; (i) −4° PAE.
Buildings 14 01141 g030
Figure 31. Fatigue damage to the concrete at the bottom flange of the ESR in 12 directions after one year of operation for the 5# WT with different PAEs.
Buildings 14 01141 g031
Figure 32. Proportion of fatigue damage at SSE points for different wind speeds and directions: (a) 0° PAE; (b) 1° PAE; (c) 2° PAE; (d) 3° PAE; (e) 4° PAE; (f) −1° PAE; (g) −2° PAE; (h) −3° PAE; (i) −4° PAE.
Buildings 14 01141 g032
Table 1. Main parameters of the WT.
ParametersValueParametersValue
Rated power2 MWFixed/VariableVariable
Design service life20 aCut-in wind speed3.0 m/s
Hub height80 mRated wind speed10.5 m/s
Rotor diameter95.872 mCut-out wind speed25.0 m/s
Rated rotational speed16.83 rpmWeight of first order tower62.9 t
Weight of nacelle and generator84.4 tWeight of second order tower54.1 t
Weight of blades48.4 tWeight of third order tower37.9 t
Table 2. The probability of the occurrence of each wind speed–wind direction at the 5# WT (unit: %).
Wind Speed
Wind Direct
4 m/s6 m/s8 m/s10 m/s12 m/s14 m/s16 m/s18 m/s20 m/s22 m/sSummary
N2.724.014.594.132.10.770.430.210.120.0619.14
NNE2.623.223.292.010.670.200.090.040.010.0012.15
ENE1.500.930.320.100.030.010.010.000.000.002.9
E2.301.610.920.500.240.110.080.060.040.025.88
ESE2.852.462.001.671.060.510.380.240.160.0911.42
SSE1.961.731.230.810.350.140.090.040.020.016.38
S0.931.010.920.730.270.070.040.020.010.014.01
SSW1.221.841.370.630.180.040.020.010.010.015.33
WSW1.010.920.670.340.100.020.010.000.000.003.07
W1.261.511.581.160.450.140.060.020.010.006.19
WNW1.811.831.561.230.660.310.210.120.070.047.84
NNW2.482.973.032.771.760.890.710.490.330.1915.62
Summary22.6624.0421.4816.087.873.212.131.250.780.43100
Disclaimer/Publisher’s Note: The statements, opinions and data contained in all publications are solely those of the individual author(s) and contributor(s) and not of MDPI and/or the editor(s). MDPI and/or the editor(s) disclaim responsibility for any injury to people or property resulting from any ideas, methods, instructions or products referred to in the content.