Abstract
Phase change thermal energy storage (PCTES) technology has garnered significant attention in addressing thermal management challenges in building HVAC systems. However, the cooling performance of PCTES systems in humid scenarios remains unexplored, which is crucial in subtropical regions, high-humidity underground areas, and densely populated spaces. Taking the mine refuge chamber (MRC) as an example, this study focuses on a passive temperature and humidity control system by employing cold storage phase change plates (PCPs) for 96 h. First, an improved and simplified full-scale numerical model including PCPs and MRC parts is established. Then, the model is validated through the experimental results and solved using a numerical method. Finally, the influence of various factors within the system is investigated and an optimization method involving batch operation is proposed. The results indicate that (1) within 40 h, the use of cold storage PCPs leads to an indoor temperature reduction of 4.8 °C and a 7% decrease in relative humidity; (2) the PCPs show asynchronous states in sensible and latent heat transfer rates; (3) for every 50 additional PCPs, the average indoor temperature increases by 0.6 °C and the relative humidity decreases by 1.5%; (4) implementing batch operation of PCPs ensures that the indoor Heat Index drops by 10 °C, which is vital for human survival. The findings will play a crucial role in the global expansion and application (including geographical and functional aspects) of phase change thermal storage technology.
1. Introduction
The world is currently facing a series of formidable challenges, including energy shortages and severe environmental degradation [1,2]. The United Nations Sustainable Development Goal 7: Affordable and Clean Energy provides directions for exploration in the field of energy, aiming to address these challenges. In recent years, the ongoing development and utilization of renewable energy sources have been continuously expanding in scale and quantity [3,4]. As renewable energy gradually becomes a significant component of national energy portfolios, the associated challenges need to be effectively addressed while injecting new sources into the energy sector. Within the realm of renewable energy, especially for sources such as wind and solar power that are susceptible to natural conditions such as climate and geographical location, the uncertainty in energy acquisition [5,6,7] poses challenges to the supply–demand balance of urban and building energy systems. Energy storage technologies, recognized as essential methods to tackle such issues [8,9,10], not only effectively mitigate the instability of energy supply systems but also enhance system capacity and energy utilization efficiency [11].
There are various methods for thermal energy storage, including sensible heat storage, latent heat storage, and thermal–chemical storage, among which latent heat storage is widely adopted because of its high energy density, small volume, safety, reliability, and technological feasibility [12,13]. In the field of architecture, latent heat storage is employed to regulate building temperatures, enhancing thermal comfort and addressing the temporal and spatial discrepancies between renewable energy availability and actual thermal energy demands. Such achievements are made by applying phase change materials (PCM) to building envelope structures [14,15,16]. Liu et al. [17] investigated the thermal behavior of a novel composite concrete incorporating PCM in building envelope structures. Results showed that, under the climatic conditions of Paris, PCM concrete houses maintained significantly lower indoor air temperatures throughout 1564 h of summer compared to that of the conventional concrete houses. Müslüm Arıcı et al. [18] strategically placed PCM layers on both the inner and outer sides of external walls, adjusting the PCM’s melting temperatures to maximize latent heat utilization. Numerical results indicated that the use of dual PCM layers led to an increase in energy savings from 2.5% to 3.2%, accompanied by a substantial reduction of up to 18.4% in carbon dioxide emissions. Ji et al. [19] synthesized PCM with a transition temperature near 26 °C by using lauric acid and stearic acid. Simulations for the city of Guangzhou demonstrated a remarkable energy-saving efficiency of approximately 20% throughout the material’s life-cycle. Guo et al. [20] conducted comprehensive experiments by comparing the full-scale operation of earth-to-air heat exchanger (EAHE)-PCM combined mode with PCM standalone mode during summer. Results indicated that under the conditions of EAHE-PCM combined mode, indoor temperatures can be effectively controlled within the comfort range. Gao et al. [21] proposed a novel approach coupling phase change chairs (PCC) with phase change plates (PCP) for cooling high-temperature mine refuge chambers and other isolated environments. The study investigated the temperature control effects of PCC and PCP when employed individually or in combination. However, the numerical simulation process did not account for latent heat transfer resulting from moisture dissipation by personnel, causing potential biases in subsequent research findings.
As mentioned above, the research on phase change thermal storage has primarily concentrated on temperature control with little consideration for the impact of high-humidity environments [22,23]. However, the practical application of PCM extends to subtropical regions, high-humidity underground areas, and densely populated spaces, but neglecting the influence of high humidity on the thermal storage process can lead to fatal problems in the design and application process. For instance, in subtropical regions in hot and humid summers, the adoption of free cooling techniques for overnight thermal storage with PCM is widely recommended. However, high temperature and a humid environment during daytime can result in condensation on the surface of the cold storage system, altering the system’s heat exchange rate and subsequently affecting temperature control effectiveness and duration. Similarly, in underground mining scenarios, refuge chambers serve as critical emergency shelters for personnel in the aftermath of mining accidents. The enclosed environment, coupled with heat and moisture dissipation from occupants, results in elevated indoor temperatures and humidity levels. While PCM thermal storage technologies can address cooling challenges in passive conditions, considerations for the impact of high humidity on the cooling process have been ignored in existing studies [24]. Such ignorance may lead to erroneous judgments in the design and practical application of temperature and humidity control systems for refuge chambers, causing severe potential consequences for occupant safety.
Although relevant investigations are limited, there are currently some studies on the application of PCM in high-humidity environments. Sun et al. [25] conducted research to investigate the impact of a humid subtropical climate on the performance of PCM. They studied the thermal properties of a lightweight building incorporating PCM through a commercial numerical model. The results revealed a decrease in the heat release capacity of the PCM wall during the process of increasing outdoor humidity from 40% to 90% in summer. The major reason for this decline was the omission of the condensation of humid air in the numerical model, with the actual impact of latent heat transfer far exceeding the sensible heat. Additionally, the combination of humidity-regulating materials with PCM in composite structures enables the simultaneous control of temperature and humidity [26]. Based on this concept, Zhu et al. [27] proposed a composite double-layer wall panel by using a novel phase change humidity control material (PCHCM) for building applications. The simulation results indicated that the innovative PCHCM wall panel effectively improved the indoor humid-thermal environment, leading to an approximate 8.3% reduction in summer energy consumption and a 24.9% reduction in winter energy consumption compared with the common materials. However, it is important to note that in this study, the dehumidification process and the phase change process were calculated separately, neglecting the impact of the adsorption process on the phase change heat transfer. Thus, it causes certain limitations to the research.
In summary, current research on building temperature control by using phase change thermal storage technology is a hot topic. However, high-humidity environments are prevalent in practical applications, and the influence of high humidity on the phase change thermal storage process is still in the early stages of investigation. In previous studies, the authors [28,29] experimentally explored the impact of high-humidity conditions on the melting process of PCP under natural convection and developed a corresponding mathematical model to describe the process. The results demonstrated that the melting rate of PCPs could be increased by over 60%, with a latent heat transfer ratio exceeding 80%. It is evident that high-humidity conditions significantly affect the heat transfer of phase change units, but exploration in real-world application scenarios is lacking. Therefore, two pressing issues remain to be addressed: First, the issue regarding the extent to which the PCM unit is affected by time-varying high-humidity environments along with corresponding design and control methods, which is not yet clear in practical application scenarios. Second, the feasibility of utilizing the condensation characteristics of the PCM unit in high-humidity environments for simultaneous passive temperature and humidity regulation is also unknown and requires further exploration.
To address these two scientific research gaps, taking the temperature and humidity control in the mine refuge chamber (MRC) with PCPs as an example, this paper establishes an improved full-scale numerical model, which is validated through experimental results. Based on this model, the melting characteristics of the cold storage PCM units under dynamic humidity environments, as well as their heat and mass transfer characteristics, are studied. The influence of factors on the thermal storage of PCPs and the indoor air temperature and humidity control process is explored. Ultimately, a segmented operational optimization control method is proposed to meet the long-term temperature and humidity regulation requirements.
2. Establishment of Mathematical Model
2.1. System Description
This paper introduces the temperature and humidity control performance in the MRC with PCM thermal storage units, as illustrated in Figure 1. The refuge chamber is a temporary shelter for personnel in the event of disasters when they cannot be evacuated in time. In China, the use of non-intrinsically safe electrical appliances is prohibited in MRC, making it difficult to use large air conditioning systems with batteries. However, encapsulated cold storage PCM can be used as cooling devices due to the lack of flammability and explosiveness. Taking a 50-person refuge chamber in Chongqing, China, as an example, it is a long arch structure with internal dimensions of 17 m in length, 2.8 m in side wall height, 3.5 m in arch height, 4 m in width, and a constant temperature of around 26 °C. Since the chamber is in a power-off state after the disaster, the passive temperature and humidity control method with cold storage PCPs is employed. During normal conditions, the PCPs are placed in the thermal storage box, and intermittent cooling of the PCPs is achieved by using the natural cool source underground or by introducing an artificial cooling source from the underground mining face (around 12 °C). Due to the limited number of cold storage PCPs and insulation measures, this method requires less cooling capacity and does not need an additional refrigeration system. During disaster relief, the PCPs are taken out and placed in a manner similar to Figure 1a. The heat and humidity dissipation from the human body and equipment cause the indoor temperature and humidity to increase in the enclosed environment. However, the nearly constant melting temperature characteristics of the PCPs maintain a low-temperature surface for an extended period. This enables passive temperature and humidity control inside the chamber through surface heat convection and condensation. The surrounding rock, based on its sensible thermal storage capacity, transfers heat to the far boundary to assist in controlling the indoor temperature, as seen in Figure 1b.
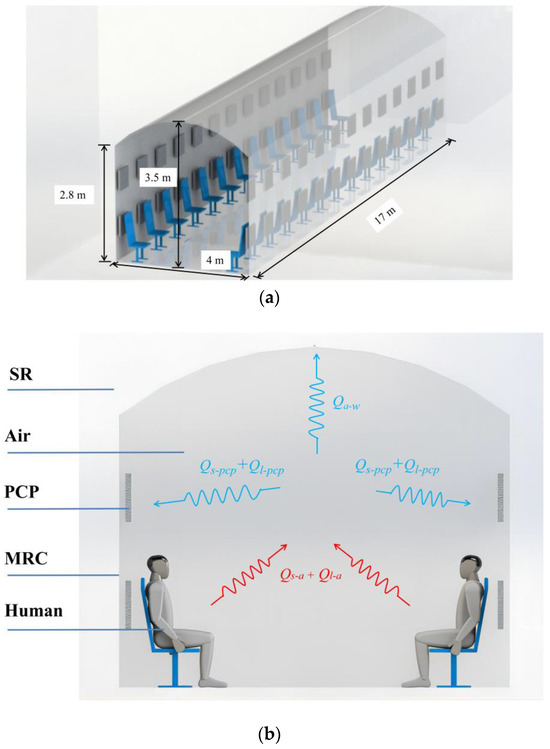
Figure 1.
Schematic diagram of the temperature and humidity control system for MRC with cold storage phase change units: (a) system layout diagram; (b) system schematic diagram.
The advantage of this temperature and humidity control method is that the phase change units are pre-cooled by using natural or artificial cooling sources, which allows them to passively control the indoor air temperature and humidity under a closed, power-off condition and without the need for traditional refrigeration equipment.
2.2. Mathematical Model Establishment
For the case of using numerous PCPs in a large space, if a commercial CFD software is used for calculation, the number of grids and calculation time will be astronomical and unacceptable. In this case, the simplified calculation model in this paper will be a solution that can solve the problem quickly. In this section, an improved full-scale mathematical model for indoor temperature and humidity control with PCPs in a dynamic thermal-humidity environment is established. The physical model demonstrates that the main heat and mass transfer occur in the natural convection zone around the PCP and the surface heat and mass transfer occur in the zone between the indoor air and the surrounding structure. Therefore, the model could be divided into two parts: (i) the PCP sub-model, covering internal melting, surface heat, and mass transfer, along with surrounding natural convection; and (ii) the MRC sub-model, encompassing indoor air, surrounding rock, and dynamic thermal-humidity sources from human body. The PCP sub-model calculates the outflow parameters of natural convection under changing environmental conditions and outputs them to the MRC sub-model. The MRC sub-model calculates the coupled heat and mass transfer process among the human body, air, and the surrounding rock based on the input parameters and updates the environmental parameters output to the PCP sub-model.
This improved integrated model fully considers the detailed heat and mass transfer process between the PCP and indoor air (including evaporation, condensation, and sliding movement of the liquid film). Additionally, the dynamic variations in the heat and moisture sources of the human body changing with environmental temperature and humidity are also considered. Additionally, the model incorporates the impact of the temperature of the surrounding rock on indoor air temperature and humidity. Therefore, a comprehensive mathematical model is established for large-scale application by using PCPs for indoor air temperature and humidity control, as shown in Figure 2.
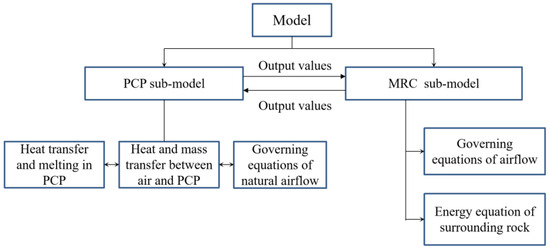
Figure 2.
The configuration of the model for MRC with cooling PCPs.
2.2.1. PCP Sub-Model
The PCP sub-model comprises three components, progressing from the outermost to the innermost layers: the near-wall natural convection, the on-wall heat and moisture transfer, and the internal heat transfer and melting. Specifically, during the system operation, the cold storage PCP is exposed to a high-temperature and high-humidity environment. The temperature and humidity differences between the PCM surface and the environment lead to the downward-flowing near-wall natural convection. On the metal surface of the PCP, condensation occurs when the surface temperature is lower than the ambient dew point temperature, forming a liquid film that slides downward under gravity. When the saturated water vapor pressure of the liquid film exceeds the water vapor pressure in the ambient environment, the liquid film evaporates.
To calculate the complex heat and moisture exchange processes described above, reasonable simplifications must be made. This paper adopts a simplified two-zone model, as illustrated in Figure 3, which improves calculation speed, and the results are reliable [29]. According to the temperature and velocity distribution characteristics of the wall natural convection, the near-wall flow is divided into two regions. Zone I represents the primary area including the main natural convection flow. Zone II is the secondary natural convection area, where the natural convection is weak and the vertical flow velocity u is almost zero, which can be disregarded.

Figure 3.
Simplified two-zone model of natural convection heat and mass transfer on the surface of the PCP in MRCs.
The remaining simplifications are as follows: (i) a symmetric model can be employed for simplified calculations based on the typical symmetric feature of the PCP; (ii) the water film, with its thin thickness (<10−4 m) [30], is treated as a virtual component that does not occupy actual volume, yet it must be included in the source terms for its downward flow, evaporation, and condensation; and (iii) considering the experimental results [31], if the rectangular PCP has a small width-to-height ratio, the influence of internal natural convection is reduced due to the high flow resistance. Additionally, the external air temperature exhibits a higher temperature at the top and a lower temperature at the bottom, further weakening the natural convection within the PCP. Thus, the influence of buoyancy force within the PCP is disregarded.
Air Natural Convection Region
In Air Zone I, since the air temperature change is less than 15 °C, the Boussinesq assumption is employed. Consequently, the conservation equations can be expressed as follows [29]:
where, is the density; is the viscosity; and the subscript am is the air in MRC. is the gas expansion coefficient; is the humidity ratio in mass of humid air.
In Equation (2), the first and second terms on the right side constitute the natural convection driving force. The first term is the temperature difference and the second term is the humidity ratio difference. Due to the increase in the humidity ratio, a density reduction coefficient of humid air is defined and the calculation equation is the following [29]:
In Equation (3), a represents the thermal diffusivity coefficient; S is the convective heat transfer source term and introduced in Section 2.2.2. Ha is the enthalpy, and its calculation formula is as follows [28]:
The humidity ratio conservation equation is the following [29]:
where D is the mass diffusion coefficient; Sd is the convective mass transfer source term and introduced in Section 2.2.2.
In Air Zone II, the vertical velocity u is assumed to be zero. Thus, the conservation equations are as follows [29]:
Heat and Mass Transfer between Air and PCP
The heat and mass transfer process between the air and the surface of PCP can be described in a unified form:
where W1 is the width of Region I; the subscript mp indicates the metal plate of the PCP; h is the natural convection heat transfer coefficient under a humidity condition, which is defined as follows [28]:
where , , , C1 = 1.0471 × 10⁻¹⁴, C2 = −0.1754, n = 2.4430, m = 1.0478. Gr is the Grashof number of air; Pr is the Prandtl number of air; l is the height of the PCP. Grd is the self-defined humidity Grashof number of air utilized to reflect the impact of humidity on the convective heat transfer [28].
During the sensible heat transfer stage, the air maintains a constant humidity ratio, which means
If the humidity ratio of air is larger than the saturated humidity ratio of air at the temperature of PCP outer wall, condensation will occur. Due to the thin thickness of the water film, the temperature of the water film is assumed to be equal to that of the PCP outer wall [32]. Therefore, it is
where dmp is the saturated humidity ratio of air at the temperature of PCP outer wall. Hmd is the mass transfer coefficient, which is defined as follows [28]:
where, Sc is the Schmidt number ; C3 = 2.9512 × 10⁻¹³; C4 = −0.2042.
If the air temperature drops to the dew point, saturated condensation will occur. At that time, the relative humidity of air remains . Additionally, if the humidity ratio of airflow is smaller than the and there is a water film on the PCP outer wall, the evaporation of the liquid film will occur. Equation (16) can still be used as the source term.
Condensate Water Film
The thickness of the water film , is calculated as follows:
where uδ is the flow velocity, which is calculated by the free-falling film equation [32]:
where μ is the water viscosity; L is the width of the water film; and is the mass flow rate.
PCP
In this part, the PCM melting process is computed using the enthalpy method. The heat conduction equation of internal PCP is as follows [21]:
The enthalpy HPCM is as follows [21]:
where L is the latent heat; f is the liquid fraction, which is calculated as follows [21]:
where Ts is the initial melting temperature of PCM; Tl is the completely melted temperature of PCM.
The heat transfer between the metal plate and the PCM is as follows:
where RPCM,mp is the thermal contact resistance.
The energy equation of the metal plate is as follows:
2.2.2. MRC Sub-Model
The MRC sub-model mainly consists of two components: the air module and the surrounding rock module. Given the low height of the refuge chamber, the phenomenon of temperature stratification inside the chamber is not obvious. Therefore, the air module adopts the lumped parameter method based on the principles of energy conservation and mass conservation. The surrounding rock module considers the heat and moisture transfer between the rock surface and the indoor air, as well as the heat conduction of the surrounding rock towards the far boundary within a certain thickness.
Control Equations of the Indoor Air
The indoor air, interacting with the PCPs, surrounding rock, and the human body, forms the central node of the entire heat and mass transfer system. Based on whether condensation occurs on the inner wall of surrounding rock, the indoor air control equations can be divided into two states: the sensible heat transfer state and the latent heat transfer state.
In the sensible heat transfer state, where the rock wall temperature is higher than the air dew point temperature, the energy and humidity control equations are as follows:
where is the volume; is the internal surface area; represents the natural convection outflow; subscript represents the natural convection outflow from the PCP; subscript represents the inner wall of the surrounding rock; and hwm is the forced convection heat transfer coefficient between air and surrounding rock, which is as follows [30]:
When the surface temperature of surrounding rock is lower than the air dew point temperature, condensation occurs. At this point, the heat exchange between air and the rock surface is in the latent heat transfer state. The energy and humidity control equations are as follows:
where, represents the humidity ratio of saturated air corresponding to the temperature of the inner wall of the surrounding rock; hwmd is the mass transfer coefficient, which is defined by the Lewis formula as follows [30]:
In Equations (26) and (29), Sp is the total heat dissipation from the human body and is calculated by
where qs is the sensible heat and ql is the latent heat. Taking the psychological stress of the trapped miners into account, the heat generated is set to 132 W. With the variation in ambient temperature, the proportions of sensible heat and latent heat vary. The fitted calculation formulas of qs, ql are shown as follows [33]:
where t is the Celsius temperature.
In Equations (25) and (28), Spd represents the total moisture dissipation from the human body and can be calculated as follows:
Energy Equations of the Surrounding Rock
Before the energy model for the surrounding rock in the MRC is formulated, certain reasonable simplifications need to be applied. The heat transfer dynamics in the long arch chamber closely resemble those of a long cylindrical chamber. Hence, the chamber can be regarded as a cylinder [34], as illustrated in Figure 4.

Figure 4.
Schematic of simplified structure of MRC: (a) before simplification; (b) after simplification.
Thus, the energy equation of the surrounding rock requires [24]
The boundary equations are written as
In Equation (34), α is thermal diffusivity of the surrounding rock; is the thermal conductivity of the surrounding rock; ro is the radius of far boundary and calculated by [24].
2.3. Model Solution
From the established model, it is evident that there are numerous PCPs with small volumes, involving intricate surface heat and moisture transfer, natural convection, and internal phase change processes. On the other hand, the refuge chamber has a larger volume, but its internal and surface heat transfer processes are relatively straightforward. Modeling this multi-scale scenario through a holistic approach would require significant computational resources. Therefore, this study adopts an independent grid approach for each sub-model by using the indoor air temperature and humidity parameters as intermediaries to facilitate heat and moisture transfer between the PCP sub-model and the MRC sub-model.
2.3.1. Grid Division
As described earlier, the solution process for the governing equations is accordingly divided into two parts: the PCP sub-model and the MRC sub-model, as illustrated in Figure 5.
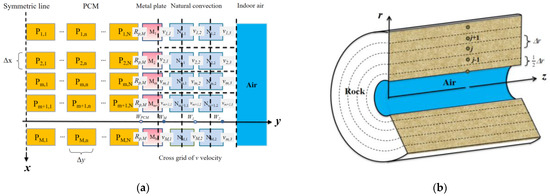
Figure 5.
Schematic of grid division of MRC: (a) PCP sub-model; (b) MRC sub-model.
The PCP sub-model is divided into three regions: PCM, metal plate, and the natural convection region. The overall system employs a structured grid division in the vertical direction, uniformly partitioned into M grids with a unit size of ∆x. In the horizontal direction, the PCM region is uniformly divided into N grids with a unit size of ∆y, while the metal plate, due to its small thickness and high thermal conductivity, is represented by a single grid without further division. The water film is not explicitly shown in the grid representation as it does not occupy an actual grid volume. However, the condensation, flow, and evaporation of the water film are considered in source terms to consider their influence on heat and moisture transfer. The natural convection region is divided into two grids horizontally, following the two-region model mentioned earlier, with thicknesses of W1 and W2, respectively. The values of W1 and W2 are obtained from experimental results and set as W ≈ 0.05H [35]. Additionally, a staggered grid is employed to compute the near-wall horizontal velocity v to ensure the existence of horizontal airflow velocity in Air Zone I and vi,1 = 0 when at the wall.
The MRC sub-model is divided into two regions: the indoor air and the surrounding rock. The lumped parameter method is employed to calculate the indoor air, and no grid partition is applied. The refuge chamber’s protective structure is simplified to a cylindrical shape according to the established model. Therefore, a cylindrical coordinate system is used for grid partitioning. The radial region is uniformly divided into J grids with a grid thickness of ∆r. The axial region does not undergo grid partitioning due to the uniform distribution of personnel and PCPs. Additionally, the thickness of the inner wall grid (i.e., the first layer grid of the surrounding rock) is set to 1/2∆r to ensure that the central node lies on the inner wall surface of the surrounding rock.
2.3.2. Discretization and Numerical Solution
The equations are discretized with the finite volume method. The time discrete unit is Δτ and it is represented by the superscript n. On the issue of laminar natural convection on the PCP, more information is obtained from the upwind direction than that of the leeward direction, which can better reflect the physical properties of the natural flow process. The second-order upwind scheme is adopted in the convective term. The control equations for the boundary grids are discretized by using a first-order discretization format. In Equation (22), are the conductive thermal resistances between PCM and the metal plate, which are calculated as follows:
After discretization, the equations are programmed with C language and solved by using MATLAB R2016a software. The numerical calculation flow chart for the integrated MRC and PCP cooling and dehumidifying system is illustrated in Figure 6. Implicit discrete equations are solved through a joint-iteration method. The computational process starts at time n = 1 and layer I = 1 in the PCP sub-model. Once the calculation for one layer is completed, it stops and proceeds to the next layer. After all layers are computed at this time step, the results of natural convection air are transferred to the MRC sub-model as boundary conditions. Upon completing the computations for the indoor air and surrounding rock in the MRC sub-model, the indoor air parameters are read by the PCP sub-model, and the calculation progresses to the next time step.
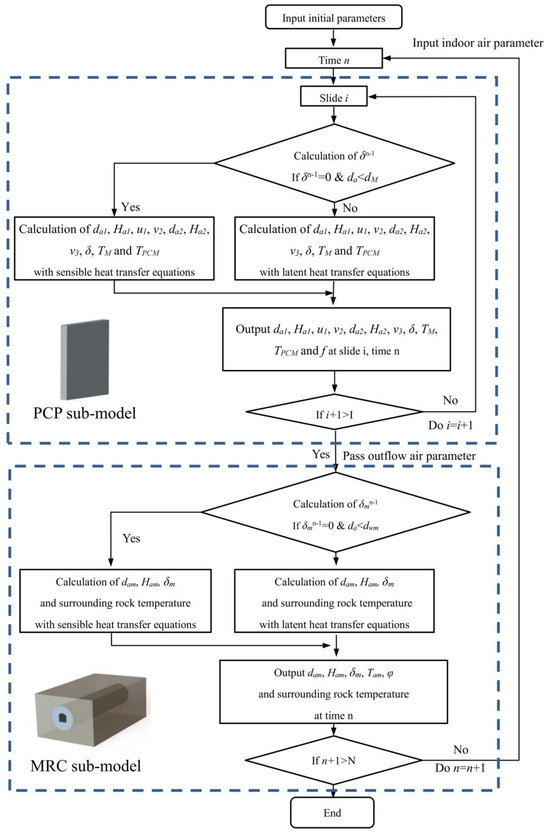
Figure 6.
Flow chart of the numerical solution.
2.4. Model Validation
Because of the limitations in experimental conditions, it is not feasible to deploy a sufficient number of PCPs within the refuge chamber for experimentation. Therefore, the PCP sub-model and MRC sub-model were independently validated. The PCP sub-model was validated in an experimental room located in Chongqing, China, as depicted in Figure 7 [28]. The melting experiments of PCPs were conducted under ten different kinds of temperature and humidity conditions, and each condition was repeated twice, indicating the repeatability of the experiment results [28]. Paraffin PCM with a melting temperature of 18 °C was encapsulated within a galvanized iron plate measuring 200 × 300 × 40 mm. The ambient temperature was kept at 29 °C and the relative humidity was 85%.
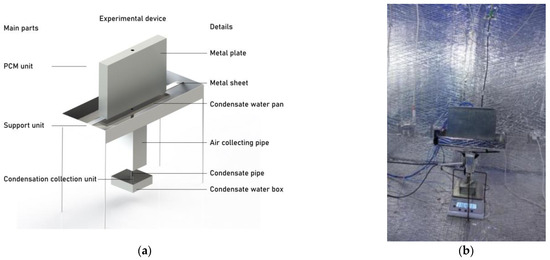
Figure 7.
Experimental device: (a) experimental schematic; (b) the picture of the experimental device. Reprinted/adapted with permission from Ref. [28]. 2022, Elsevier.
Figure 8 illustrates a comparison between numerical simulation results and experimental test data for the PCP’s melting rate, natural convection airflow temperature, humidity, and velocity. The overall agreement is deemed acceptable. The average error of melting rate is 6%, the average error of temperature is 0.4 °C, the max error of relative humidity is 5%.
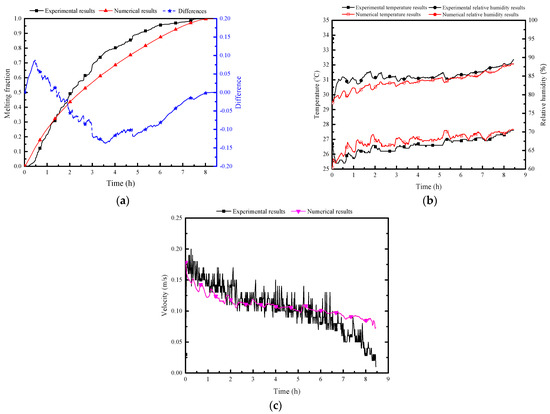
Figure 8.
Validation of numerical results with experimental test data: (a) melting rate of PCP; (b) natural convection airflow temperature and humidity; (c) airflow velocity.
The MRC experiment was conducted in a 50-person MRC laboratory, also located in Chongqing, China, as shown in Figure 9 [36]. The laboratory walls are constructed in concrete with a thickness of 0.7 m. The MRC is equipped with 40 heat lamps, each rated at 150 W, to simulate the heat production of the human body. The initial air temperature in the MRC is set to 25 °C.
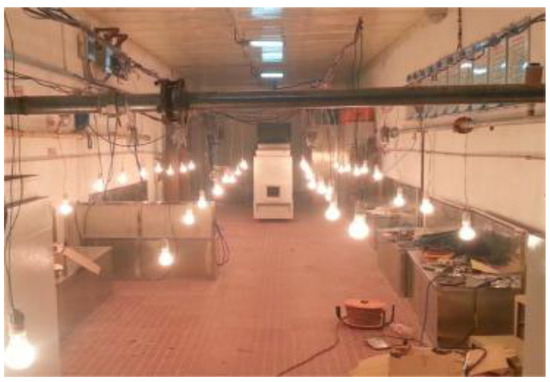
Figure 9.
Experimental scenery. Reprinted/adapted with permission from Ref. [36]. 2018, Elsevier.
Figure 10 presents a comparison between numerical and measured results over a 10.3 h period. The numerical result is observed to align well with the experimental result. There is a slight discrepancy showing that temperature in the numerical result is 0.3 °C higher than the experimental result.
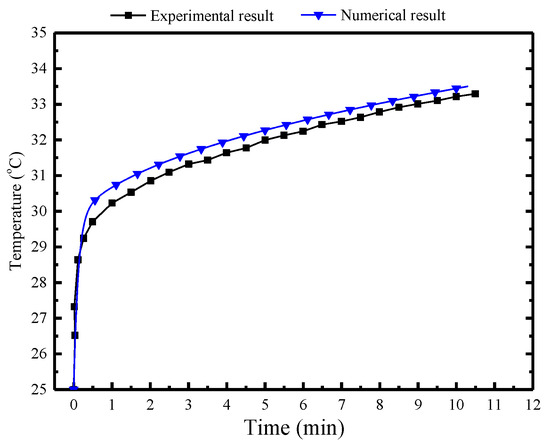
Figure 10.
Comparison of the numerical and experimental results in the MRC.
3. Results and Discussion
In order to assess the feasibility of temperature and humidity control in a high-temperature and high-humidity environment by using a phase change thermal storage system, this section, taking a typical working condition as an example, first analyzes the variations in indoor temperature and humidity under the joint influence of PCPs, surrounding structure, and indoor personnel. Secondly, it explores the impact of key factors on the melting characteristics of PCPs and indoor temperature and humidity control characteristics. Finally, addressing the mismatch between the thermal storage of the phase change units and the heat dissipation of personnel, corresponding operational optimization methods are proposed.
3.1. Parameter Settings of Typical Conditions
The simulation environment in this study is based on a real refuge chamber in Chongqing, China, with its structural parameters described in Section 2.1. A corresponding passive cooling and dehumidifying system with cold storage phase change units is established. The parameters related to PCPs, MRC and other relevant parameters are presented in Table 1.

Table 1.
Calculation parameters used for simulation models [28,30].
Prior to conducting simulations, a grid independence validation is performed to ensure that the results are not significantly influenced by the mesh size. The temperature and humidity of the indoor air is used as a metric for comparison. Figure 11 illustrates the comparison results of the temperature and humidity ratio of airflow under seven different mesh and time sizes. The chosen mesh and time settings, based on this validation, are Δy = 0.002 m in the horizontal direction and Δτ = 0.01 s.
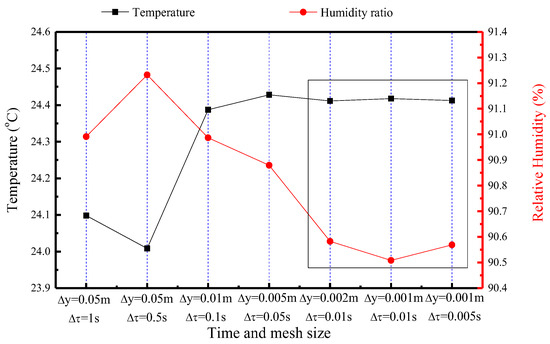
Figure 11.
Comparison of temperature and relative humidity of the indoor air under seven different time and mesh sizes (The data are obtained from the indoor air at the 10th hour).
3.2. Results for Typical Conditions
This section demonstrates the operational characteristics of each component of the system under the typical condition, including the melting process of the PCP, temperature variations of the SR, natural convection intensity on the PCP surface, changes in surface condensation water, as well as the sensible and latent heat flux exchange processes.
3.2.1. PCP and Surrounding Rock
Figure 12 displays the variation of the melting fraction and average surface temperature of PCM over time. Due to the significant temperature differences between the air and the PCM at the initial moment, the PCM melts rapidly, gradually decreases the melting rate, and completes melting within 38 h. The surface temperature of the PCM is a crucial factor to decide its heat and moisture transfer rate with indoor air. Influenced by the external heat and the moisture transfer, the surface temperature rises rapidly to 20 °C within the first hour. This rapid heating period is the initial thermal equilibrium adjustment when the PCP comes into contact with high-temperature and high-humidity air. It then enters a relatively stable heating period, reaching 24 °C. After the PCM has melted by 85%, there is a brief (25–38 h) rapid heating period, reaching 27 °C. This rapid heating period is the second readjustment of thermal equilibrium. Subsequently, complete melting occurs, and the temperature gradually rises with room temperature, reaching 31.8 °C at the 96th hour.
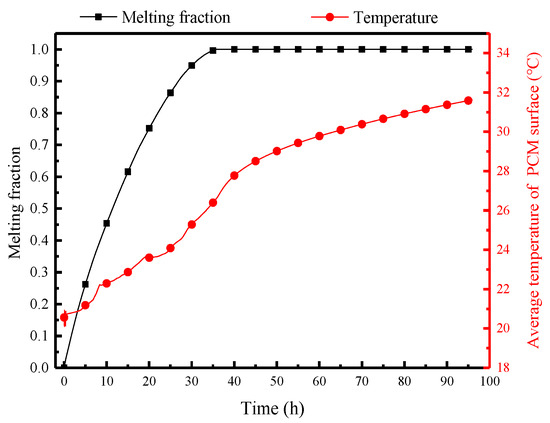
Figure 12.
Variation of the melting fraction and average surface temperature of the PCP over 96 h.
As the protective structure in the refuge chamber, the surrounding rock also undergoes heat transfer with the indoor air, as shown in Figure 13. The temperature of the inner surface of the surrounding rock gradually decreases from the initial 26 °C to 25.2 °C and then rises to 26 °C at the 33rd hour, which indicates that the natural convection cooling process of the PCP indirectly influences the wall temperature through convective heat transfer with airflow. However, as the PCP completely melts, its cooling effect gradually diminishes. Subsequently, the wall temperature of the surrounding rock enters a warming period and eventually rises to 31 °C. In comparison, the temperature variation inside the surrounding rock exhibits a decreasing magnitude of temperature change and a time delay relative to the wall temperature. When the depth reaches 1 m, the temperature variation becomes negligible. This concept is regarded as the thermal adjustment circle of the surrounding rock, facilitating the selection of the far boundary. The thermal adjustment circle of the surrounding rock can be predicted based on the formula presented in the Equation (39).

Figure 13.
Variation of the surrounding rock temperatures at different depths over time.
3.2.2. Natural Convection Airflow and Indoor Air
Figure 14 presents the natural convection airflow parameters of the PCP, including temperature, relative humidity, humidity ratio in mass, and velocity over time. As shown in Figure 14a, the PCP initially exhibits an outflow air temperature as low as around 20 °C under the influence of natural convection. With ongoing heat and moisture transfer with the indoor air, its temperature gradually rises, leading to an increase in the outflow air temperature. After complete melting of the PCP, it enters a stable warming period, during which the natural convection air temperature approaches the indoor temperature, indicating the loss of cooling capacity of PCP. Due to the substantial reduction in the temperature of the outflow air under natural convection, the relative humidity remains at approximately 100%. Combined with the variation in humidity ratio shown in Figure 14b, the PCP demonstrates a certain dehumidification capacity in the first 38 h. There is a significant trough in the humidity ratio of the outflow air under natural convection, with a reduction of approximately 4 g/kg compared with the ambient humidity ratio. The natural convection velocity exhibits a gradual decrease, reaching 0.23 m/s initially and maintaining a relatively high value within the first 38 h, and then it decreases to below 0.05 m/s. The natural convection velocity directly reflects the strength of natural convection, and it can be considered that the natural convection phenomena basically disappear after 38 h.

Figure 14.
Natural convection airflow parameters of the PCP: (a) temperature and relative humidity; (b) humidity ratio in mass and velocity.
Figure 15 illustrates the indoor air parameters in the MRC, including temperature, relative humidity, and the thermal index over time. In Figure 15a, the variation of temperature and humidity in the refuge chamber can be divided into three stages. The first stage is the rapid temperature control period within the initial 30 min, influenced by the exposed cold storage PCPs. During this stage, the indoor air temperature quickly decreases from the initial 26 °C to 23.5 °C, while the relative humidity increases to 87.5%. The second stage represents the temperature control and dehumidification period, maintaining indoor temperatures between 23 and 29 °C, with relative humidity ranging from 87.5 to 97%. The third stage is the non-control period, where the PCPs have completely melted, resulting in a steady increase in indoor temperature and relative humidity approaching and maintaining 100%. Figure 15a also presents the indoor temperature and humidity variation without the PCPs, which shows that with the temperature control and dehumidification effect of the PCPs, the indoor average temperature decreases by 4.8 °C, and the average relative humidity decreases by 7% within 40 h. Even after complete melting of the PCM board, its sensible heat storage capacity helps maintain a temperature reduction of approximately 1.5 °C.
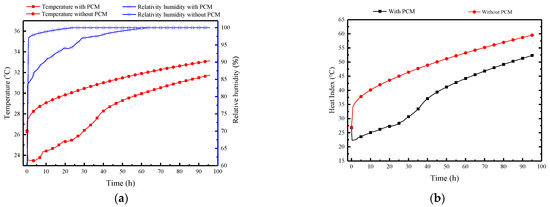
Figure 15.
Indoor air parameters in the MRC: (a) temperature and relative humidity; (b) thermal index.
Figure 15b introduces the concept of the Heat Index (HI). HI is a measure of how hot it really feels when relative humidity is factored in with the actual air temperature [37]. The equation of HI is as follows [37]:
When RH > 85%, the following adjustment is added [37]:
where TF is the temperature in Fahrenheit. In this paper, the unit of HI has been converted to Centigrade. When HI is 27–32 °C, there is a need to stay alert under such conditions; when HI is 33–39 °C, extreme caution should be taken; when HI is 40–51 °C, the environment becomes dangerous; when HI is above 52 °C, it becomes extremely dangerous [37].
It is evident that the HI varies significantly with and without the PCPs. In the first 38 h, the indoor thermal index can reach 35–48 °C without the PCPs; whereas under the conditions of PCPs, the indoor thermal index ranges from 23 to 35 °C. The results indicate that, despite the relatively short duration of 38 h, the low-temperature PCPs, through their temperature control and dehumidification effects, can significantly improve the thermal-humid survival environment for sheltered individuals, thus preventing casualties.
3.2.3. Heat and Mass Transfer between PCP and Indoor Air
Figure 16a illustrates the variation of the water film thickness on the PCP surface over time and location, reflecting the time/location patterns of condensation, movement, and evaporation of the water film. The blue area represents regions without condensate water film, indicating that in the initial 10 h, the PCP primarily relies on sensible heat storage, and condensation has not yet occurred. The yellow area represents regions with a thicker condensate water film, indicating that condensation primarily occurs between 10 and 40 h and it is concentrated on the middle and lower parts. After 40 h, the thickness of the condensate water film gradually decreases due to the combined effects of gravity and evaporation. Figure 16b presents the cumulative weight of condensate water droplets on the PCP surface over time. The condensate water droplets on the PCP surface are concentrated on the time period from 11 to 41 h, slightly lagging behind the condensation time period. The final total weight of condensate water is approximately 375 g, resulting in an average dehumidification rate of 12.5 g/h during the effective dehumidification period of 30 h (calculated from 10 to 40 h).
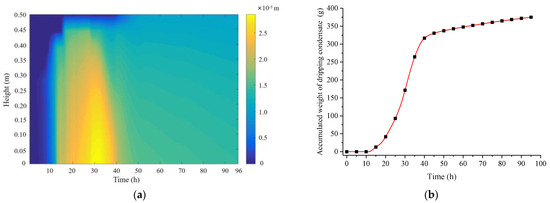
Figure 16.
Variations in the water film thickness and condensate water quantity on the PCP surface: (a) water film thickness; (b) cumulative condensate water quantity.
Figure 17 illustrates the variation of the surface heat flux of the PCP and the indoor heat and moisture source over time, allowing for an analysis of the changes in the indoor thermal and humid environment. First, considering the indoor heat and moisture source, influenced by the gradual increase in ambient temperature, the sensible heat generation from individuals decreases gradually from an initial 4 kW to 2 kW, while the corresponding latent heat generation increases from 3 kW to 5 kW. The heat transfer trend of the PCP, however, is completely different between the sensible heat transfer and the latent heat transfer. In the initial 10 h, the sensible heat transfer predominates, reaching up to 14 kW, and significantly exceeding the indoor heat generation, which results in a decrease in room temperature and surrounding rock temperature. During the period from 10 to 30 h, the sensible heat transfer gradually decreases, and the latent heat transfer gradually reaches a peak of 3.5 kW, balancing the indoor latent heat generation. Subsequently, with the PCP melting, the surface heat and the moisture transfer rate gradually decreases and completely loses its thermal storage ability after 40 h. It can be observed that the cooling and dehumidifying capacity of PCP does not match the indoor thermal and moisture generation rate, leading to ineffective control of indoor temperature and humidity over 96 h.

Figure 17.
Variation in surface heat and mass transfer rates of the PCP and the heat and moisture generation rates of individuals.
3.3. Sensitivity Analysis
To optimize the performance of the PCP-based temperature and humidity control system, various factors need to be considered. These factors can be categorized into two main aspects: the parameters related to the PCP itself, such as the thermophysical properties of the PCM, the dimensions, and the quantity of the PCP; and the parameters related to the environmental conditions, such as the initial temperature and humidity, the rate of heat dissipation, the dimensions, and thermophysical properties of the MRC. In a given MRC, the factors that can be adjusted manually include the cold storage temperature, PCM melting temperature, thermal conductivity of the PCM, quantity, and dimensions of the PCP, among which the selection of the PCM melting temperature is influenced by the cold storage temperature. Based on the previous research, the impact of the thermal conductivity of the PCM has been shown to be limited [29]. Thus, it is not further analyzed.
3.3.1. PCM Cold Storage/Melting Temperature
The selected cold storage temperatures Tc and PCM melting temperatures Tm for each set of conditions have a certain difference of 2 °C to ensure that they will not melt during the cold storage period. The variation range for the cold storage temperature is 16–24 °C, corresponding to a variation range for the melting temperature of the PCM of 18–26 °C, and the other parameters keep consistent with the typical conditions.
Figure 18a shows that an increase in the Tc/Tm significantly slows down the melting process of the PCP. Specifically, the complete melting times at Tm of 18–26 °C are 36, 42, 55, 73, and 96 h, respectively. This indicates that the linear increase in the Tm corresponds to an exponential increase in the melting time, highlighting the critical impact of the Tm selection on the melting process of the PCP.
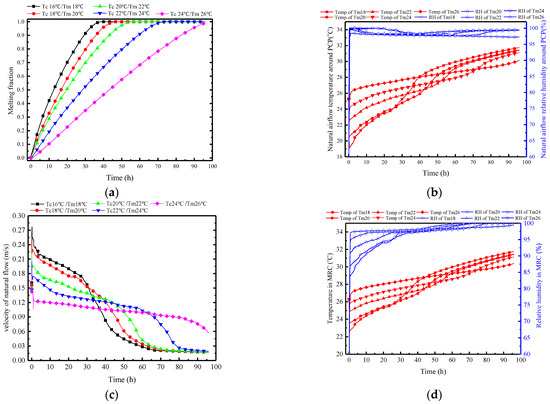
Figure 18.
Variation in parameters of the PCP and MRC at different Tc/Tm: (a) melting rate of PCP; (b) natural airflow temperature and humidity around PCP; (c) natural flow velocity around PCP; (d) temperature and humidity in MRC.
Figure 18b presents the influence of Tc/Tm on the natural convection airflow. A lower Tc/Tm leads to a lower average temperature of the airflow in the early stage, with a corresponding reduction in duration. The impact of the Tc/Tm on the average temperature of natural airflow is more significant before 38 h. After 38 h, the PCP with a Tm of 18 °C begins to melt completely, and the surface temperature rises rapidly, losing its temperature control ability. Other PCPs with higher Tm still have a certain control ability as they have not completely melted. Additionally, for PCPs with lower Tm, the sharp decrease in airflow temperature leads to an increase in relative humidity. For PCPs with higher Tm, the increase in relative humidity is caused by the moisture dissipation from the trapped miners. Thus, the relative humidity of the natural airflow is generally above 97%, but it is triggered by different reasons.
In Figure 18c, it is observed that the lower the Tm, the greater the temperature difference in the airflow, with a maximum airflow velocity of 0.23 m/s when the Tm is 18 °C. However, the time with a velocity greater than 0.1 m/s is only about 38 h. Therefore, a deduction can be made that the variation in Tc/Tm affects the natural convection mainly through changing the airflow temperature and humidity. The decrease in Tc/Tm enlarges the density difference between the natural convection airflow and the ambient air, thereby strengthening the intensity of the natural convection.
Figure 18d, together with Figure 18b, shows that the natural convection airflow parameters have a direct impact on the indoor temperature and humidity in the MRC. Lower Tc/Tm results in lower temperatures and relative humidity. For every 2 °C decrease in Tm, the indoor temperature decreases by approximately 1 °C during the controlled period, and the relative humidity decreases by around 3%.
Figure 19 demonstrates the variations of HI in MRC at different Tc/Tm. The indoor HI further clarifies that PCPs with lower Tc/Tm have superior control capabilities in the early stages in regulating indoor temperature and humidity, but it becomes less effective subsequently. When the Tm is set to 18 °C, the initial HI is 23 °C, which is 10 °C lower than when the Tm is 26 °C. However, after 45 h, the HI of Tm18 begins to surpass Tm26, reaching a difference of approximately 9 °C by the 96th hour. Therefore, from another perspective, if the maximum HI within 96 h is used as the benchmark, a higher Tm of 26 °C may be preferable.
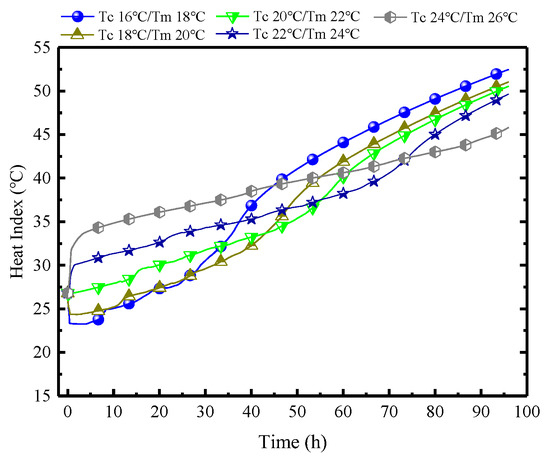
Figure 19.
Variations of HI in MRC at different Tc/Tm.
Figure 20 depicts the changes in surface heat transfer rate of PCP at different Tc/Tm. In Figure 20a, it is observed that as the Tm decreases, the sensible heat storage rate during the melting period increases, the latent heat storage occurs later, and the duration is shorter. When the Tm is 18 °C, the peak period of latent heat storage occurs at the 30th hour, with a total duration of only 30 h. This is because the low Tm initially controls the indoor temperature and humidity, thereby failing to generate a sufficient condensation moisture difference. Furthermore, based on Figure 20b, it can be inferred that during the melting period, higher Tm conditions can effectively suppress the proportion of sensible heat storage, increase the proportion of latent heat storage, and extend the effective controlled period. For every 2 °C increase in Tm, the proportion of latent heat storage increases by approximately 12%, and the effective controlled period extends by about 15 h. When the phase change temperature is 26 °C, the proportion of latent heat storage reaches 70%, and the effective controlled period extends to 96 h.
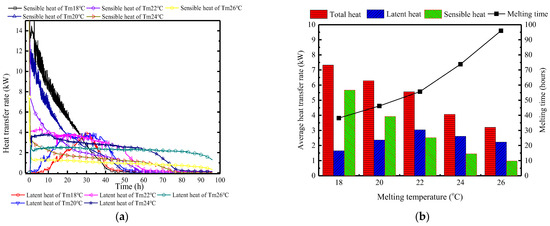
Figure 20.
Surface heat transfer rate of PCP at different Tc/Tm: (a) instantaneous values over time; (b) statistical averages during the melting period.
Discussion: the key aspect of changing the Tc/Tm lies in its impact on the temporal distribution of the indoor temperature and humidity control. Lowering the Tm essentially concentrates the PCP’s thermal storage capacity on the early sensible heat storage, thereby delaying the dehumidification effect. This results in phenomena of initial low indoor air temperature and strong natural convection intensity, but there is a short duration of indoor temperature and humidity control. On the other hand, raising the Tm distributes the PCP’s thermal storage capacity through the entire period, causing the indoor air temperature to rise more rapidly in the early stages and accelerating the advance of the dehumidification effect.
3.3.2. Quantity of PCPs
The selection of the quantity of PCPs is closely related to temperature and humidity control effects, as well as initial investment and indoor space occupation. Here, the selected PCP quantity ranges from 150 to 350, with intervals of 50, and the remaining parameters stay consistent with the typical conditions.
As shown in Figure 21a, an increase in the number of PCPs extends the melting time. However, the number of boards increases from 150 to 350, only extending the melting time from 30 h to 42.5 h; thus, the impact is significantly less than that of the Tc/Tm. The main reason lies in the indirect effect of the variation in the number of PCPs on the heat transfer process. Initially, the increase in the number reduces the indoor temperature and humidity, indirectly affecting the heat and moisture transfer process between the PCP and indoor air. Meanwhile, the surrounding rock, through its heat exchange with indoor air, indirectly absorbs the released cold from the PCP, weakening this process.
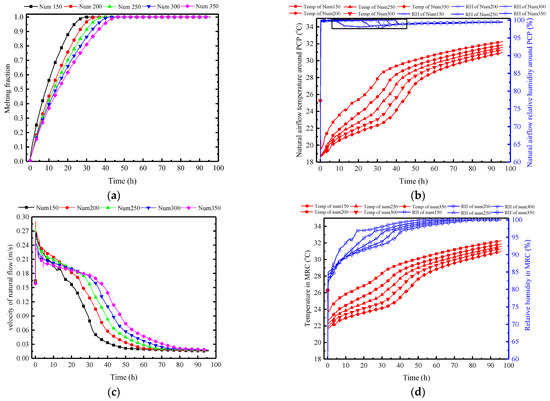
Figure 21.
Variation in parameters of the PCP and MRC at different quantities: (a) melting rate of PCP; (b) natural airflow temperature and humidity around PCP; (c) natural flow velocity around PCP; (d) temperature and humidity in MRC.
This is confirmed by Figure 21b. It also shows that an increase in the number of PCPs reduces the average temperature of the natural airflow, maintaining relative humidity between 97% and 100%. Specifically, for every 50 additional PCPs, the average outlet temperature decreases by 1 °C, and the temperature control time extends by approximately 3 h. It is noteworthy that the rapid initial increase in the relative humidity is caused by the drastic drop in temperature, at which point the humidity ratio of indoor air is insufficient for condensation to occur. As the indoor temperature gradually increases, the indoor humidity ratio rises, and the condensation first occurs after 10 h in the Num150 case, with the indoor relative humidity dropping to 97%. The more PCPs there are, the lower the indoor temperature is, and the later the condensation occurs, indicating that the condensation heat transfer is more difficult to achieve.
The temperature and humidity change of natural convection induces a relatively insignificant variation in wind speed, as shown in Figure 21c. While an increase in the number of PCPs reduces the outlet airflow temperature, it concurrently lowers the indoor air temperature. This results in a negligible variation in temperature difference between the natural airflow and the indoor air. At the same time, the humidity ratio difference between natural airflow and the indoor air is also minimal for each condition. These factors contribute to the limited impact of PCP’s quantity on the natural convection intensity.
Influenced by the parameters of the natural convection outflow around PCPs, Figure 21d shows that the indoor air temperature decreases with an increase in the number of PCPs. The decrease is 0.6 °C for every 50 additional PCPs, and the temperature control time is correspondingly extended. Within the temperature control period, the relative humidity decreases by an average of 1.5% for every 50 additional PCPs, indicating that an increase in the number of PCPs enhances dehumidification capability.
Figure 22 illustrates the impact of different quantities of PCPs on the indoor air HI. As analyzed previously, the impact of the number of PCPs on indoor temperature and humidity is primarily manifested in the prolonged duration of temperature control and dehumidification, as well as a certain reduction in temperature. Therefore, the indoor HI index decreases continuously with the increase in the quantities of PCPs, and the platform period is extended, but the effect slightly decreases. For every increase of 50 PCPs, the average HI decreases by 2 °C and the average platform period is extended by 3 h. Considering the proportional increase in expenditure caused by the increase in the quantities of PCPs, the preferred quantity of PCPs in this condition is between 250 and 300.
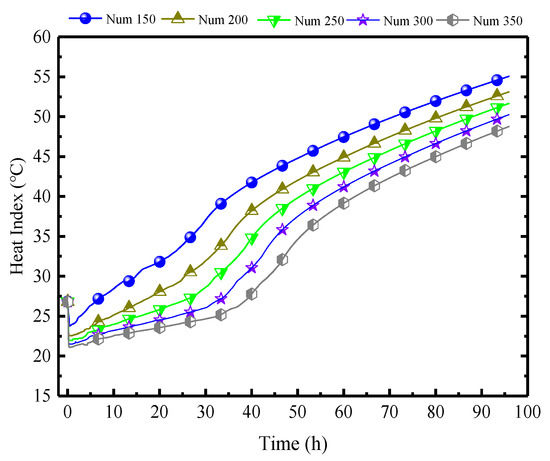
Figure 22.
Impact of different quantities of PCPs on the indoor air HI.
Figure 23a illustrates the variation of the surface heat and moisture transfer rate over time under different quantities of PCPs. With an increase in the number of PCPs, the peak of sensible heat transfer rate gradually increases from 12.5 kW to 18 kW, leading to controlled indoor temperatures that make condensation conditions difficult to achieve. Consequently, the latent heat transfer rate gradually decreases, and the peak time is significantly delayed from the 8th hour to the 42nd hour. When considering a single PCP, the increase in the number of PCPs weakens the temperature and humidity control, and the dehumidification capacity of each PCP. This is attributed to the reduction in the indoor air temperature and humidity, which is concluded by Figure 23b. During the melting period, the average sensible heat transfer rate increases by 0.9 kW per 50 PCPs, where the latent heat transfer rate remains relatively small. Due to the gradual extension of the temperature control period, the total heat storage capacity will further increase.
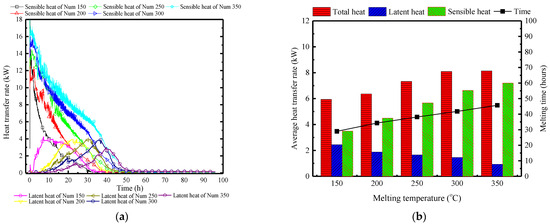
Figure 23.
Surface heat and moisture transfer rate of PCP under different quantities: (a) instantaneous values over time; (b) statistically averaged values during the melting period.
Conclusion: Varying the quantity of PCPs mainly lies in the indirect impact on the single PCP’s heat transfer capacity. Increasing the number of PCPs directly reduces the indoor temperature and humidity, thereby indirectly weakening the thermal storage and dehumidification capacity of each PCP. This results in an extension of the temperature and humidity control period. Due to the overall increase in the number of PCPs, the temperature and humidity control capacity is strengthened, but the effect slightly decreases.
3.3.3. The Size of PCP
In terms of PCP dimensions, height is the most crucial factor in influencing natural convection. Therefore, in this subsection, with the volume and length of the PCP held constant, the aspect ratio varies to investigate the impact of changes in the size of the PCP on the natural convection process and its influence on the indoor air temperature and humidity control. Here, the changes in the width-to-height ratio (W/H) of the PCP are set as 0.04:1, 0.06:0.67, 0.08:0.5, 0.1:0.4, and other parameters are kept consistent with the typical conditions.
Figure 24a indicates that decreasing the width-to-height ratio significantly enhances the melting rate. Taking the melting time at a typical condition of W/H = 0.08/0.5 as a reference (38.1 h), the melting times change by 30%, −30%, and −60% when W/H is set to 0.1:0.4, 0.06:0.67, and 0.04:1, respectively. This pattern does not show a diminishing trend, suggesting that as long as the width-to-height ratio is small enough, instantaneous melting can be achieved. However, this may not be conducive to long-term thermal control. A preliminary inference can be drawn that the increase in PCP height can significantly strengthen the natural convection intensity, as confirmed by Figure 24c. When W/H is set to 0.04:1, it has the highest initial airflow velocity of 0.35 m/s, while W/H at 0.1:0.4 has an initial value of 0.23 m/s. Furthermore, Figure 24b observes that the near-wall natural convection outflow temperature and humidity are essentially consistent. This is due to the uniformity of the PCP’s cooling temperature, enabling the natural convection airflow to approximate the cooling temperature of the PCP. It can be further inferred that changes in the width-to-height ratio of the PCP have a different impact on the natural convection compared to the Tc/Tm. This impact is reflected by changes in the airflow velocity rather than the airflow temperature and humidity. The increase in the height of the PCP prolongs the natural convection path, allowing for more ambient air to be entrained into natural convection, thereby strengthening the intensity of natural convection.
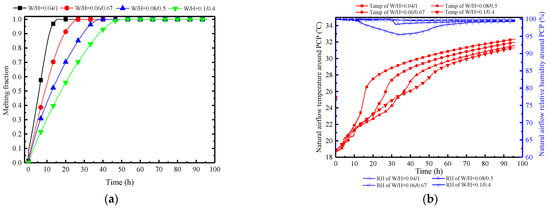
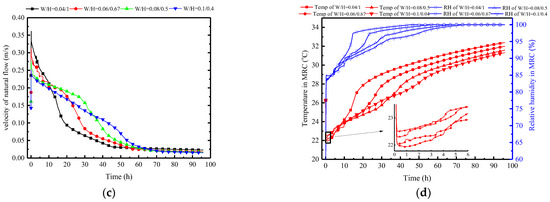
Figure 24.
Variation in parameters of the PCP and MRC at different quantities: (a) melting rate of PCP; (b) natural airflow temperature and humidity around PCP; (c) natural flow velocity around PCP; (d) temperature and humidity in MRC.
Therefore, as the W/H ratio of the PCP increases, both the indoor temperature and the relative humidity show a decreasing trend, as shown in Figure 24d. Overall, a larger W/H ratio results in better temperature and humidity control effects, but it is with limitations. Within the initial 5 h, the W/H ratio of 0.04:1 demonstrates the most effective temperature and humidity control effect. This is attributed to the smaller W/H ratio providing greater natural convection intensity in the initial period, enabling lower indoor temperature and humidity control, albeit with a significantly shorter duration.
Figure 25 shows the influence of different W/H ratios of PCPs on indoor air HI. Apart from the case of W/H = 0.08:0.5, the enhancement of thermal control diminishes significantly, and the early-stage phenomena of higher temperature and humidity become apparent. Notably, for a W/H ratio of 0.1:0.4, the inflection point occurs at the 35th hour, and the subsequent reduction in thermal indicators reaches 4 °C. Crucially, these two sets of numbers show a trend of further change, namely a gradual postponement of the inflection point and a diminishing reduction in thermal indicators. This indicates that an increase in the W/H ratio of the PCP does not lead to an endless improvement in temperature and humidity control. Based on the current simulated conditions, a W/H ratio of 0.1:0.4 is approaching its critical point.
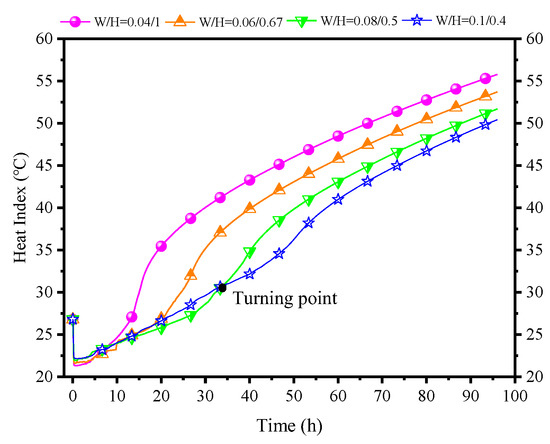
Figure 25.
Influence of different W/H ratios of PCPs on indoor air HI.
Figure 26 displays the variations in surface heat and moisture transfer rates of PCP under different W/H. Clearly, regardless of the PCP’s size, the surface heat and moisture transfer process are concentrated in the early stages. However, the larger the W/H ratio, the smaller the sensible heat peak, and the earlier and longer the latent heat occurrence. This is because the increase in the W/H ratio weakens the natural convection intensity, leading to higher initial indoor temperature and humidity, as seen in Figure 26a. Figure 26b provides a clearer reflection of the overall heat and moisture transfer. It can be observed that at a W/H ratio of 0.04:1, the proportion of the sensible heat transfer reaches 98%. As the W/H ratio increases to 0.1:0.4, there is a significant change in the proportion of latent heat transfer, with an increase to 45%. Additionally, compared to a W/H ratio of 0.04:1, the heat transfer rate decreases by 57%, indicating that an increase in the W/H ratio can extend the melting time, and strengthen the proportion of latent heat.
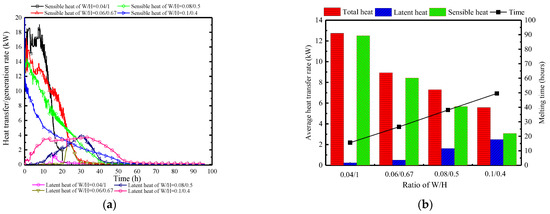
Figure 26.
Surface heat and moisture transfer rate of PCP under different W/H: (a) instantaneous values over time (b) statistically averaged values during the melting period.
Conclusion: The W/H ratio of the PCP directly affects the heat and moisture transfer path between the PCP and the indoor air, altering natural convection intensity. It almost has no impact on the outflow air temperature and humidity, but it influences the indoor temperature and humidity. However, due to the fixed influence of surrounding rock energy storage, its impact is relatively weaker compared to the previous two factors. An increase in the W/H ratio leads to a slight decrease in temperature and humidity during the control period, a slight decrease in natural convection intensity, and an extension of the temperature control time. Therefore, an appropriate W/H ratio can enhance long-term temperature control and dehumidification processes, but it should be neither excessively large nor extremely small. The recommended range under the conditions of this study is between 0.08:0.5 and 0.1:0.4.
3.4. Optimization Approach with Batches
This study is to explore the feasibility of passive temperature and humidity control by utilizing cold storage PCPs. The primary focus lies in examining the effective dehumidification duration and the concurrent thermal indicators for temperature control. Through the above investigation, it is evident that, irrespective of the adjusted factors, sustaining indoor temperature and humidity at appropriate levels over an extended period proves challenging. This challenge persists even when a substantial increase in the number of PCPs is considered, an approach deemed uneconomical and constrained by practical limitations.
Remarkably, in the early stage, striking characteristics of PCPs in temperature and humidity control are observed. In the initial times, these latent thermal storage units efficiently suppress indoor temperature and humidity to lower values. This characteristic accelerates the melting rate in the early stages, but their effectiveness diminishes later on. Additionally, once the indoor temperature drops below the surrounding rock temperature, the surrounding rock changes from being a heat sink to becoming a heat source.
Based on this, this section proposes a staged cooling and dehumidification control method, focusing on evenly distributing the cold released in the early stages throughout the control period with different batches. The 250 PCPs are divided as evenly as possible into 2, 3, 4, and 5 batches. Unused PCPs can be pre-packaged in thermal insulation boxes, and continuous control of indoor temperature and humidity is achieved by retrieving PCPs according to a predetermined schedule, as shown in Table 2.
Table 2.
PCP batch deployment schedule.
Figure 27 shows the indoor air temperature, humidity and HI variation under different batch strategies. Figure 27a,b illustrate that, with an increasing number of batches, indoor temperature gradually becomes more evenly distributed over the time scale, improving the significant early-stage low-temperature and late-stage high-temperature phenomenon. Specifically, the maximum indoor temperature has significantly decreased, from 31.8 °C to 29.5 °C, while the average temperature remains consistent. The distribution of indoor relative humidity also shifts from being concentrated in the early stages to being distributed during the activation periods of each batch. The reason is that an increase in the number of batches results in a reduction in the quantity of PCPs in each batch. Consequently, while indoor temperature and humidity are relatively high in the early stages, the rise is limited due to the assisted heat storage effect of the surrounding rock. Subsequently, with the activation of each batch at regular intervals, the indoor temperature and humidity experience a substantial decrease, ensuring a stable thermal storage and dehumidification process over 96 h. When the number of batches reaches 5, indoor temperature is controlled between 26 °C and 29 °C, and the relative humidity is maintained between 87% and 97%. Based on Figure 27c, the thermal indicators also reveal a similar trend—as the number of batches increases, the minimum value of thermal indicators rises, the maximum value decreases, demonstrating a tendency to converge towards the average value. Additionally, each activation of PCPs in a batch results in a significant decrease in the thermal indicators.
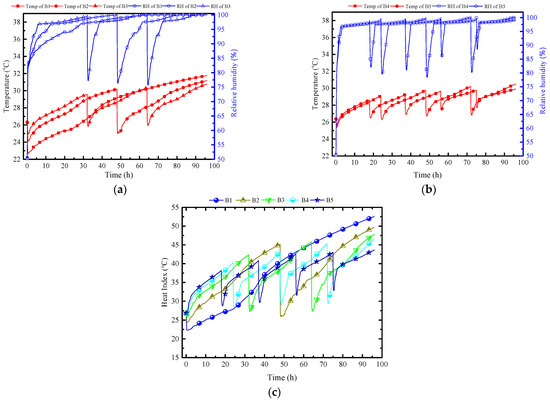
Figure 27.
Indoor air temperature and humidity variation under different batch strategies: (a) 1, 2, 3 batches; (b) 4, 5 batches; (c) HI.
Figure 28 demonstrates the comparison of the HI in MRC in three scenarios: without PCPs, with PCPs, and the optimization approach by using PCPs with 5 batches. In China, the normative time requirements for MRC are 96 h. The result shows that without PCPs, the indoor HI rises continuously, reaching 60 °C. The duration in the danger zone is 41 h, and in the extreme danger zone, it is 44 h. Therefore, sustained human survival is not viable in this environment, and a thermal control system needs to be implemented. With the deployment of PCPs for cooling, there is a significant reduction in the indoor HI. However, the late-stage thermal indicators remain high, with a danger zone duration of 41 h, and an extreme danger zone duration of 10 h. Despite the improvement, it is still unfavorable for survival. Through optimization in batches, as a result, compared to the pre-optimized scenario, the duration in the danger zone is shortened to only 24 h, all at a lower level (below 45 °C), and the extreme danger zone is completely eliminated. It can be foreseen that by strategically increasing a small number of PCPs in batches 3, 4, and 5, complete control of the thermal and humid environment with no danger zone for 96 h can be achieved, which is crucially significant for the survival of trapped personnel.
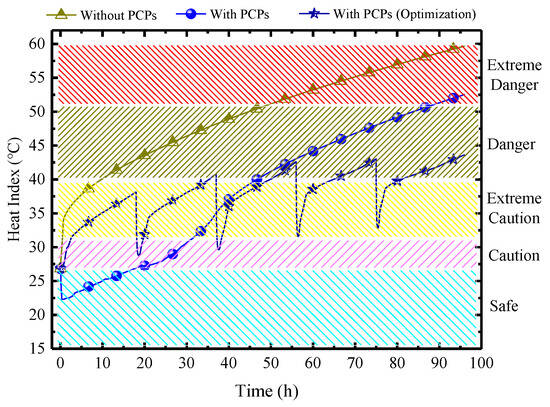
Figure 28.
Variations of HI under three scenarios.
4. Conclusions
In this study, taking the example of 250 cold storage PCPs for the environmental control of a rated shelter of 50 people for 96 h, the influence of high temperature and humidity environments on the melting and heat transfer process of the PCP and its indoor temperature and humidity control characteristics were analyzed based on the HI evaluation method. Furthermore, the feasibility and optimization method of using thermal storage units for temperature and humidity control was investigated, leading to the following conclusions:
- (1)
- During its effective control period, the cold storage PCP presents a significant cooling and dehumidification effect. Under typical conditions, the average indoor temperature decreases by 4.8 °C within 40 h, and the average relative humidity decreases by 7%.
- (2)
- Influenced by the time-varying indoor air temperature and humidity, the cold storage PCP often shows asynchronous states in the sensible heat transfer rate and the latent heat transfer rate. Under typical conditions, the sensible heat transfer is 14 kW in the first 10 h, far exceeding the indoor heat dissipation, and gradually decreasing afterward. The latent heat transfer gradually reaches its peak of 3.5 kW after 30 h, consistent with the moisture dissipation, and then it gradually decreases.
- (3)
- Changing the Tc/Tm essentially affects the time distribution of the indoor temperature and the humidity control process. A lower Tc/Tm shifts and strengthens the sensible heat transfer capacity of the PCP. Under the condition of a Tc of 16 °C and a Tm of 18 °C, the sensible heat transfer proportion can reach 77%, and the latent heat transfer rate is weakened.
- (4)
- Increasing the number of PCPs generally improves the indoor temperature and humidity control effect but weakens the sensible heat transfer and dehumidifying rate for each panel. Under the typical condition, the temperature improvement is an average of 0.6 °C per 50 PCPs and a relative humidity decrease of 1.5%, with diminishing effects as the quantity increases. Thus, considering economy, the preferred number of PCPs is between 250 and 300.
- (5)
- The aspect ratio of the PCP directly affects the natural convection intensity, but it has almost no effect on the outlet air temperature and humidity. An appropriate aspect ratio can enhance suitability for the long-term temperature and humidity control processes. The recommended range under the study conditions is between 0.08/0.5 and 0.1/0.4.
- (6)
- For indoor air temperature and humidity control processes over an extended period, under limited total quantity of PCPs, it is recommended to use the batch operation optimization method. This method can effectively suppress the occurrence of extremely hot and humid environments. Compared with a one-time input of all PCPs, using the PCPs in 5 batches can completely eliminate the “Extreme Danger” zone in the HI within 96 h. It also reduces the duration of the “Danger” zone from 41 h to 24 h, and the HI remains below 43 °C, which is crucial for people to survive in a closed chamber.
In summary, the indoor temperature and humidity are affected by various factors. Only by comprehensively considering multiple influencing factors can a scientific basis be provided for the design of the passive cooling and dehumidifying system with cold storage phase change units. To address this issue, this study is made to offer both scientific and technical support for thermal storage unit’s design and operation in humid environment. Future research will be conducted to explore the melting and condensation characteristics of the thermal storage unit by combining conditions of forced ventilation and high humidity to provide scientific support for its further applications.
Author Contributions
Methodology, X.G.; Validation, Q.S.; Formal analysis, Q.S.; Resources, N.L.; Writing—original draft, X.G.; Writing—review & editing, N.L. All authors have read and agreed to the published version of the manuscript.
Funding
This research was funded by the project of the National Natural Science Foundation of China (NO. 51908080) and the China Postdoctoral Science Foundation (NO. 2022M713375) for the financial support for this study.
Data Availability Statement
The data presented in this study are available on request from the corresponding author.
Conflicts of Interest
The authors declare no conflict of interest.
References
- Hussain, S.A.; Razi, F.; Hewage, K.; Sadiq, R. The perspective of energy poverty and 1st energy crisis of green transition. Energy 2023, 275, 127487. [Google Scholar] [CrossRef]
- Li, J.; Sun, S.; Sharma, D.; Ho, M.S.; Liu, H. Tracking the drivers of global greenhouse gas emissions with spillover effects in the post-financial crisis era. Energy Policy 2023, 174, 113464. [Google Scholar] [CrossRef]
- Azarpour, A.; Mohammadzadeh, O.; Rezaei, N.; Zendehboudi, S. Current status and future prospects of renewable and sustainable energy in North America: Progress and challenges. Energy Convers. Manag. 2022, 269, 115945. [Google Scholar] [CrossRef]
- An, Y.; Tan, X.; Gu, B.; Zhu, K.; Shi, L.; Ding, Z. An assessment of renewable energy development in Belt and Road Initiative countries: An entropy and TOPSIS approach. Energy Rep. 2023, 10, 3545–3560. [Google Scholar] [CrossRef]
- Jiang, H.; Du, E.; He, B.; Zhang, N.; Wang, P.; Li, F.; Ji, J. Analysis and modeling of seasonal characteristics of renewable energy generation. Renew. Energy 2023, 219, 119414. [Google Scholar] [CrossRef]
- Li, F.; Chen, S.; Ju, C.; Zhang, X.; Ma, G.; Huang, W. Research on short-term joint optimization scheduling strategy for hydro-wind-solar hybrid systems considering uncertainty in renewable energy generation. Energy Strat. Rev. 2023, 50, 101242. [Google Scholar] [CrossRef]
- Rad, M.A.V.; Kasaeian, A.; Niu, X.; Zhang, K.; Mahian, O. Excess electricity problem in off-grid hybrid renewable energy systems: A comprehensive review from challenges to prevalent solutions. Renew. Energy 2023, 212, 538–560. [Google Scholar]
- Wu, Y.; Zhang, T.; Gao, R.; Wu, C. Portfolio planning of renewable energy with energy storage technologies for different applications from electricity grid. Appl. Energy 2021, 287, 116562. [Google Scholar] [CrossRef]
- Simonsen, G.; Ravotti, R.; O’Neill, P.; Stamatiou, A. Biobased phase change materials in energy storage and thermal management technologies. Renew. Sustain. Energy Rev. 2023, 184, 113546. [Google Scholar] [CrossRef]
- Wang, D.; Liu, N.; Chen, F.; Wang, Y.; Mao, J. Progress and prospects of energy storage technology research: Based on multidimensional comparison. J. Energy Storage 2024, 75, 109710. [Google Scholar] [CrossRef]
- Ghalambaz, M.; Zadeh, S.M.H.; Mehryan, S.A.M.; Ayoubloo, K.A.; Sedaghatizadeh, N. Non-Newtonian behavior of an electrical and magnetizable phase change material in a filled enclosure in the presence of a non-uniform magnetic field. Int. Commun. Heat Mass Transf. 2020, 110, 104437. [Google Scholar] [CrossRef]
- Li, Z.; Lu, Y.; Huang, R.; Chang, J.; Yu, X.; Jiang, R.; Yu, X.; Roskilly, A.P. Applications and technological challenges for heat recovery, storage and utilisation with latent thermal energy storage. Appl. Energy 2021, 283, 116277. [Google Scholar] [CrossRef]
- Mehryan, S.; Heidarshenas, M.H.; Hajjar, A.; Ghalambaz, M. Numerical study of melting-process of a non-Newtonian fluid inside a metal foam. Alex. Eng. J. 2020, 59, 191–207. [Google Scholar] [CrossRef]
- Afgan, S.; Bing, C. Scientometric review of international research trends on thermal energy storage cement based composites via integration of phase change materials from 1993 to 2020. Constr. Build. Mater. 2021, 278, 122344. [Google Scholar] [CrossRef]
- Junaid, M.F.; Rehman, Z.U.; Čekon, M.; Čurpek, J.; Farooq, R.; Cui, H.; Khan, I. Inorganic phase change materials in thermal energy storage: A review on perspectives and technological advances in building applications. Energy Build. 2021, 252, 111443. [Google Scholar] [CrossRef]
- Zhao, J.; Li, Y.; Fang, X.; Sun, J.; Zhang, W.; Wang, B.; Xu, J.; Liu, Y.; Guo, H. High interface compatibility and phase change enthalpy of heat storage wood plastic composites as bio-based building materials for energy saving. J. Energy Storage 2022, 51, 104293. [Google Scholar] [CrossRef]
- Liu, X.; Yang, Y.; Sheng, Z.; Wu, W.; Wang, Y.; Dumoulin, J. Study on thermal storage effectiveness of a novel PCM concrete applied in buildings located at four cities. Renew. Energy 2023, 218, 119262. [Google Scholar] [CrossRef]
- Arıcı, M.; Bilgin, F.; Krajčík, M.; Nižetić, S.; Karabay, H. Energy saving and CO2 reduction potential of external building walls containing two layers of phase change material. Energy 2022, 252, 124010. [Google Scholar] [CrossRef]
- Ji, R.; Li, X.; Lv, C. Synthesis and evaluation of phase change material suitable for energy-saving and carbon reduction of building envelopes. Energy Build. 2023, 278, 112603. [Google Scholar] [CrossRef]
- Guo, X.; Wei, H.; He, X.; He, M.; Yang, D. Integrating phase change material in building envelopes combined with the earth-to-air heat exchanger for indoor thermal environment regulation. J. Affect. Disord. 2022, 221, 109318. [Google Scholar] [CrossRef]
- Gao, X.; Zhang, Z.; Yuan, Y.; Cao, X.; Zeng, C.; Yan, D. Coupled cooling method for multiple latent heat thermal storage devices combined with pre-cooling of envelope: Model development and operation optimization. Energy 2018, 159, 508–524. [Google Scholar] [CrossRef]
- Dong, Y.; Zhang, L.; Wang, P.; Liu, Z.; Su, X.; Liao, H.; Jiang, X. Potential evaluation of energy flexibility and energy-saving of PCM-integrated office building walls. J. Build. Eng. 2023, 79, 107857. [Google Scholar] [CrossRef]
- Mehryan, S.A.M.; Ayoubi-Ayoubloo, K.; Shahabadi, M.; Ghalambaz, M.; Talebizadehsardari, P.; Chamkha, A. Conjugate Phase Change Heat Transfer in an Inclined Compound Cavity Partially Filled with a Porous Medium: A Deformed Mesh Approach. Transp. Porous Media 2020, 132, 657–681. [Google Scholar] [CrossRef]
- Yuan, Y.; Gao, X.; Wu, H.; Zhang, Z.; Cao, X.; Sun, L.; Yu, N. Coupled cooling method and application of latent heat thermal energy storage combined with pre-cooling of envelope: Method and model development. Energy 2017, 119, 817–833. [Google Scholar] [CrossRef]
- Sun, X.; Zhu, Z.; Fan, S.; Li, J. Thermal performance of a lightweight building with phase change material under a humid subtropical climate. Energy Built Environ. 2022, 3, 73–85. [Google Scholar] [CrossRef]
- Liang, J.Y.; Zhang, X.L.; Ji, J. Hygroscopic phase change composite material-A review. J. Energy Storage 2021, 36, 102395. [Google Scholar] [CrossRef]
- Zhu, N.; Li, X.; Hu, P.; Lei, F.; Wei, S.; Wang, W. An exploration on the performance of using phase change humidity control material wallboards in office buildings. Energy 2022, 239, 122433. [Google Scholar] [CrossRef]
- Gao, X.; Xiao, Y.; Gao, P.; Zhang, Z.; Sun, M. Experimental study of the effect of high humidity on the phase change plate thermal storage under natural convection. Energy 2022, 256, 124645. [Google Scholar] [CrossRef]
- Gao, X.; Li, N.; Xiao, Y.; Zhang, Z.; Sun, M.; Gao, P. Thermal storage process of phase change materials under high humidity and laminar natural convection condition: Prediction model and sensitivity analysis. Energy 2024, 286, 129558. [Google Scholar] [CrossRef]
- Gao, X.; Zhang, Z.; Xiao, Y. Modelling and thermo-hygrometric performance study of an underground chamber with a long vertical earth-air heat exchanger system. Appl. Therm. Eng. 2020, 180, 115773. [Google Scholar] [CrossRef]
- Vogel, J.; Felbinger, J.; Johnson, M. Natural convection in high temperature flat plate latent heat thermal energy storage systems. Appl. Energy 2016, 184, 184–196. [Google Scholar] [CrossRef]
- Lian, Z. Principle and Equipment of Heat and Mass Transfer; China Architecture & Building Press: Beijing, China, 2006. [Google Scholar]
- Zhu, Y. Built Environment, 4th ed.; China Architecture & Building Press: Beijing, China, 2016. [Google Scholar]
- Su, H.; Liu, X.B.; Ji, L.; Mu, J.Y. A numerical model of a deeply buried air–earth–tunnel heat exchanger. Energy Build. 2011, 48, 233–239. [Google Scholar] [CrossRef]
- Andreozzi, A.; Buonomo, B.; Cascetta, F.; Manca, O. Transient air natural convection in asymmetrically heated vertical channels. Int. Commun. Heat Mass Transf. 2020, 116, 104697. [Google Scholar] [CrossRef]
- Zhang, Z.; Day, R.; Wang, K.; Wu, H.; Yuan, Y. Thermal performance analysis of an underground closed chamber with human body heat sources under natural convection. Appl. Therm. Eng. 2018, 145, 453–463. [Google Scholar] [CrossRef]
- Weather Prediction Center of National Weather Service. The Heat Index Equation. 2014. Available online: https://www.wpc.ncep.noaa.gov/html/heatindex_equation.shtml (accessed on 11 January 2024).
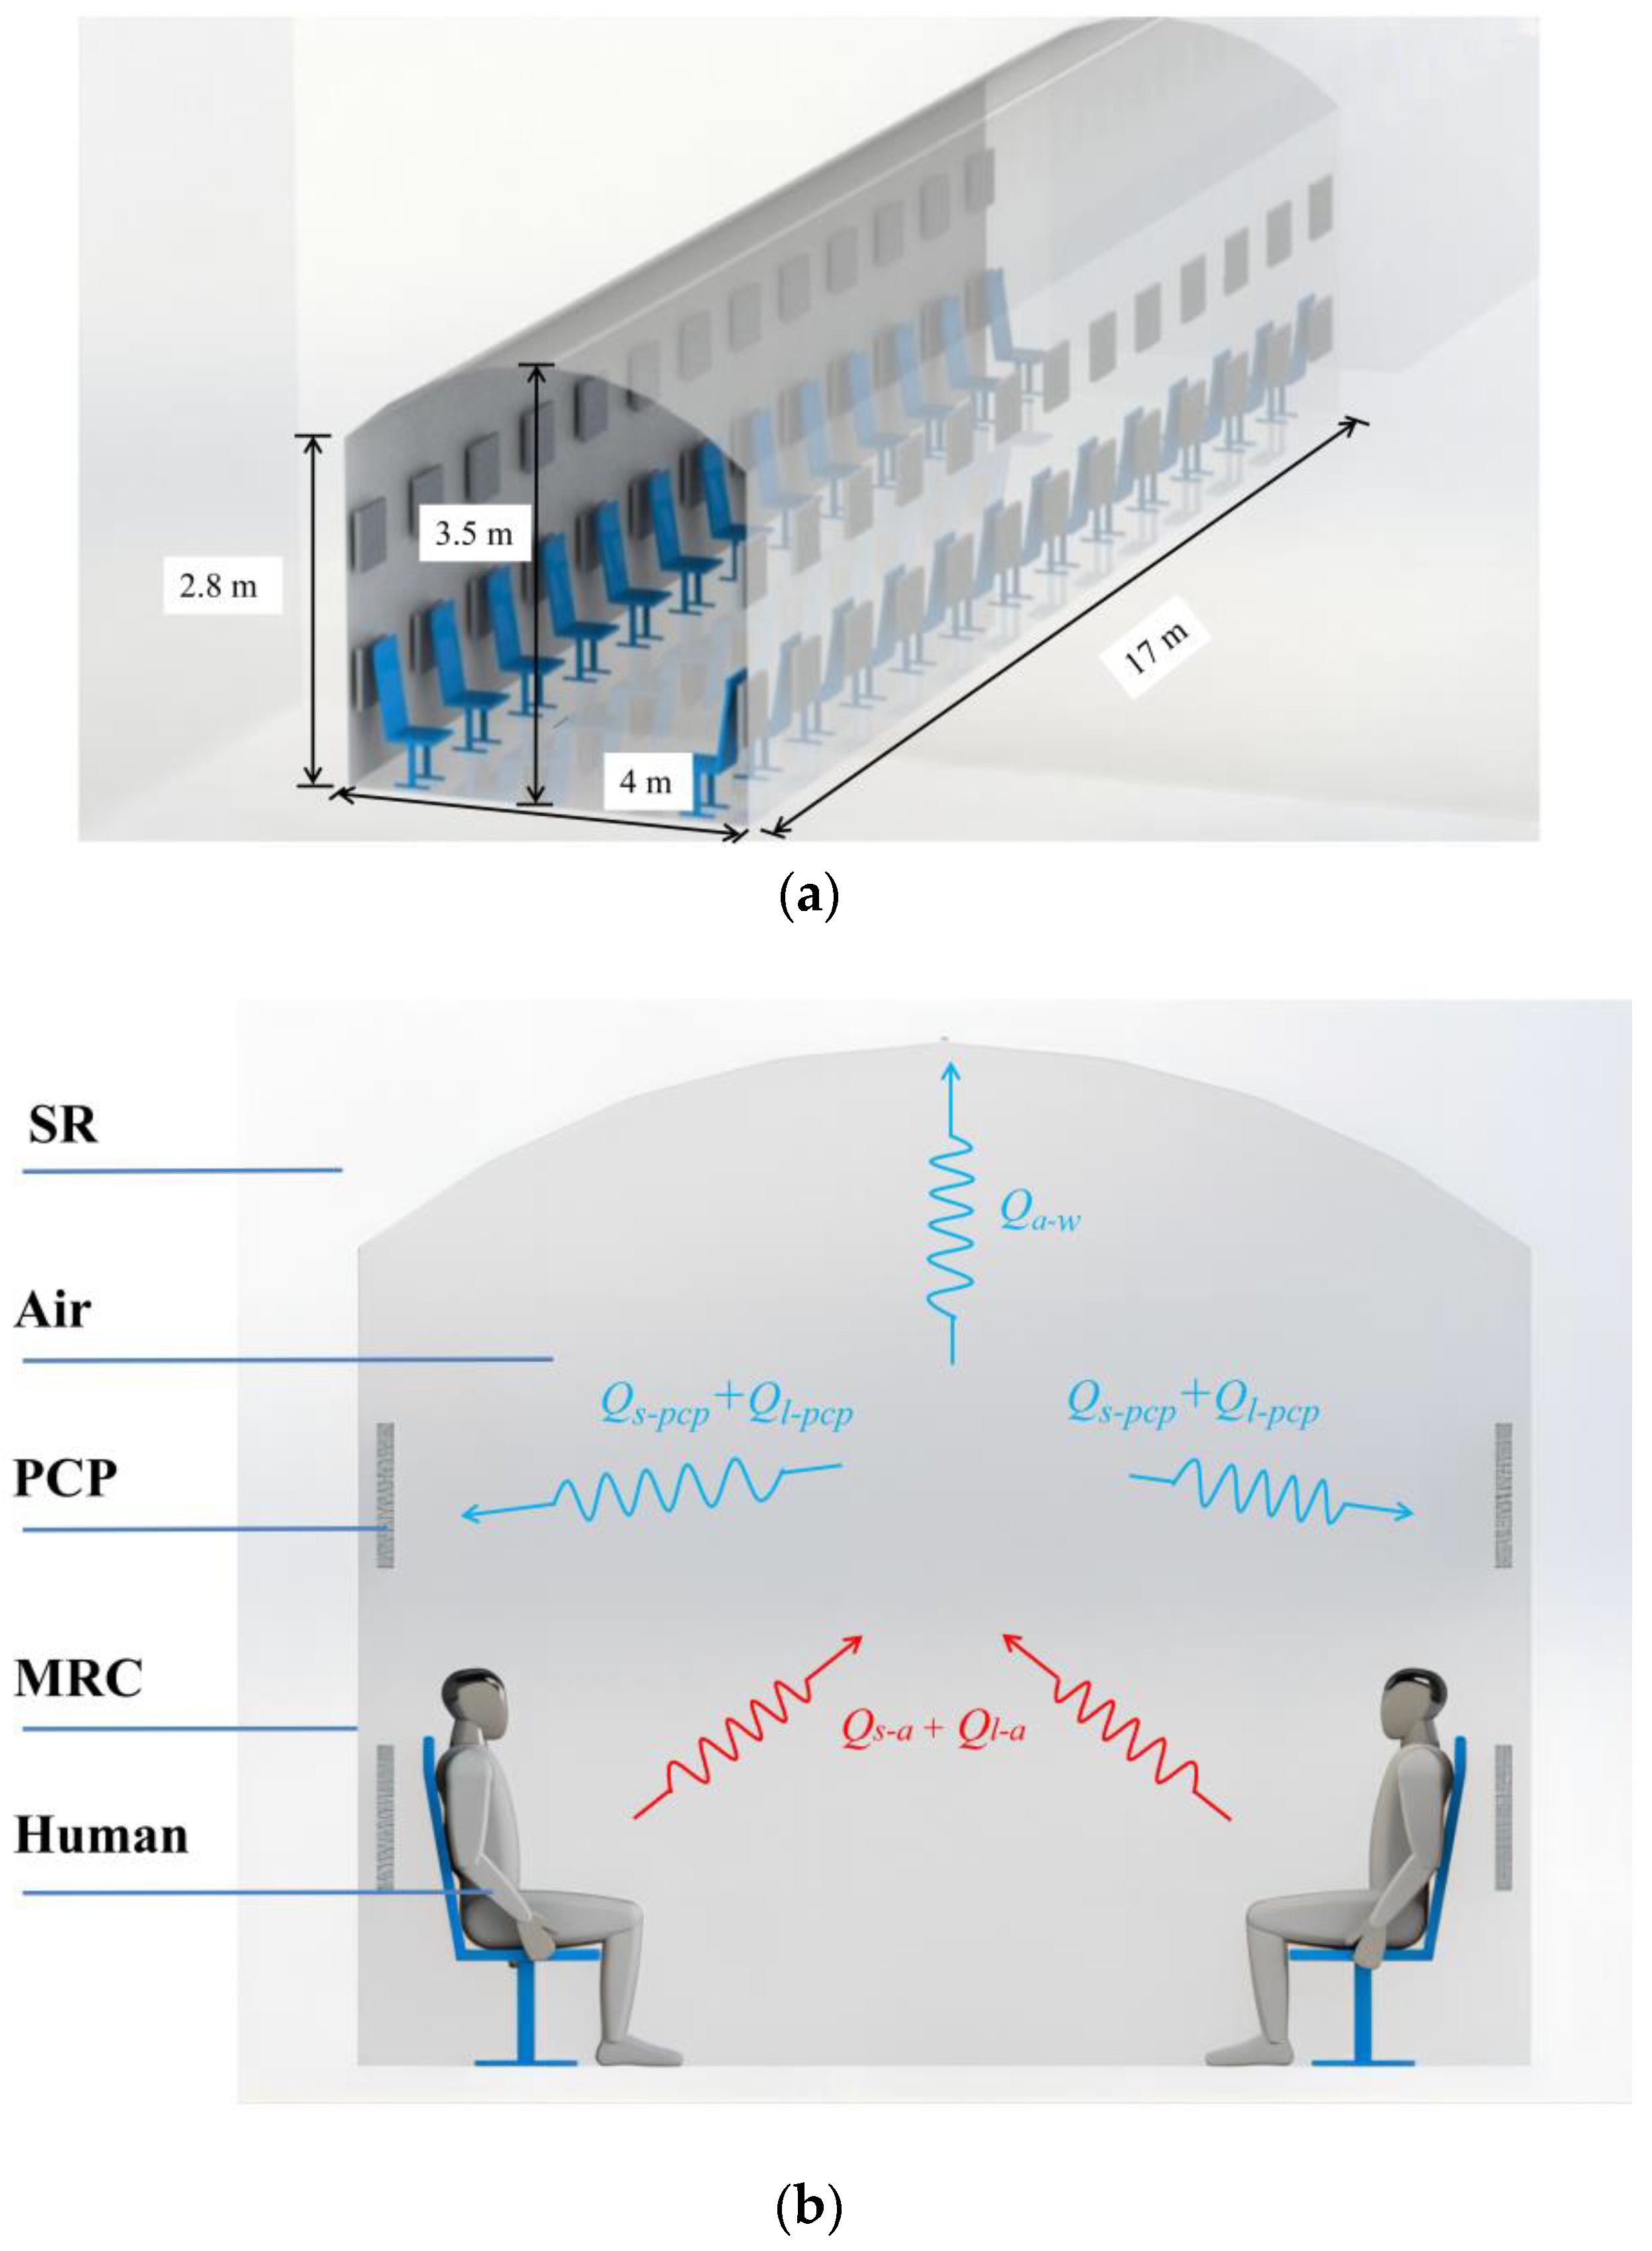

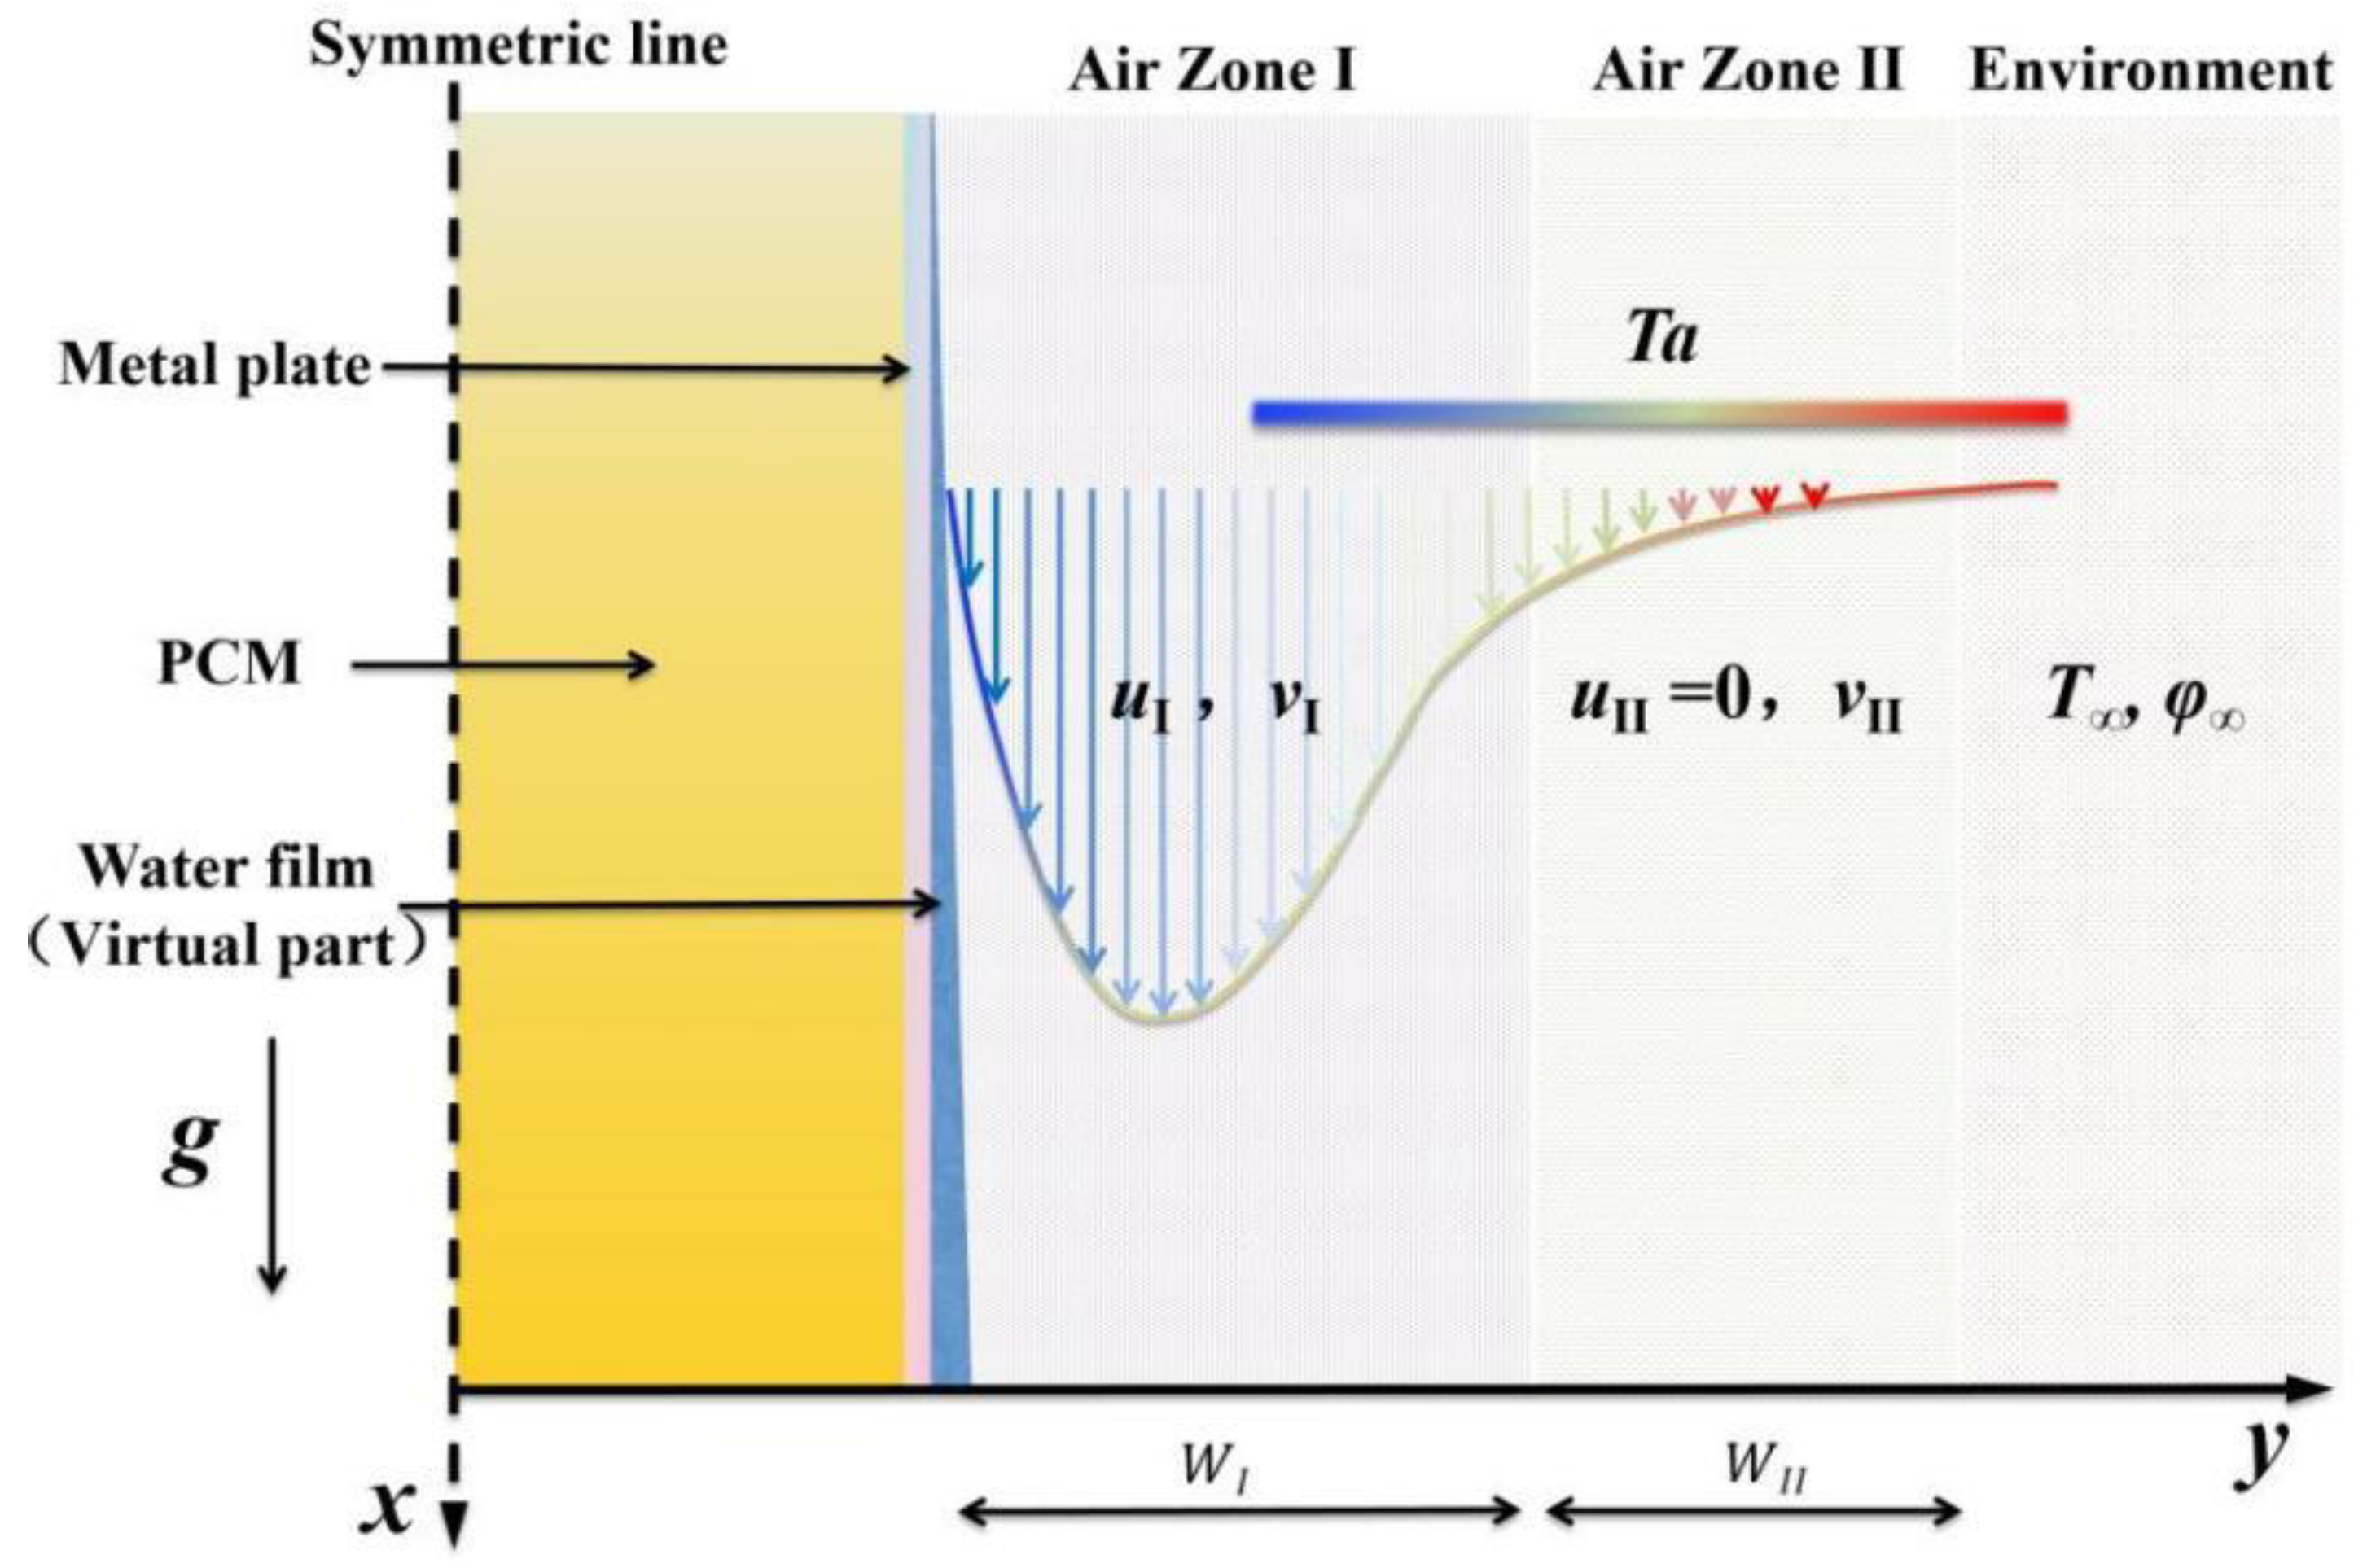
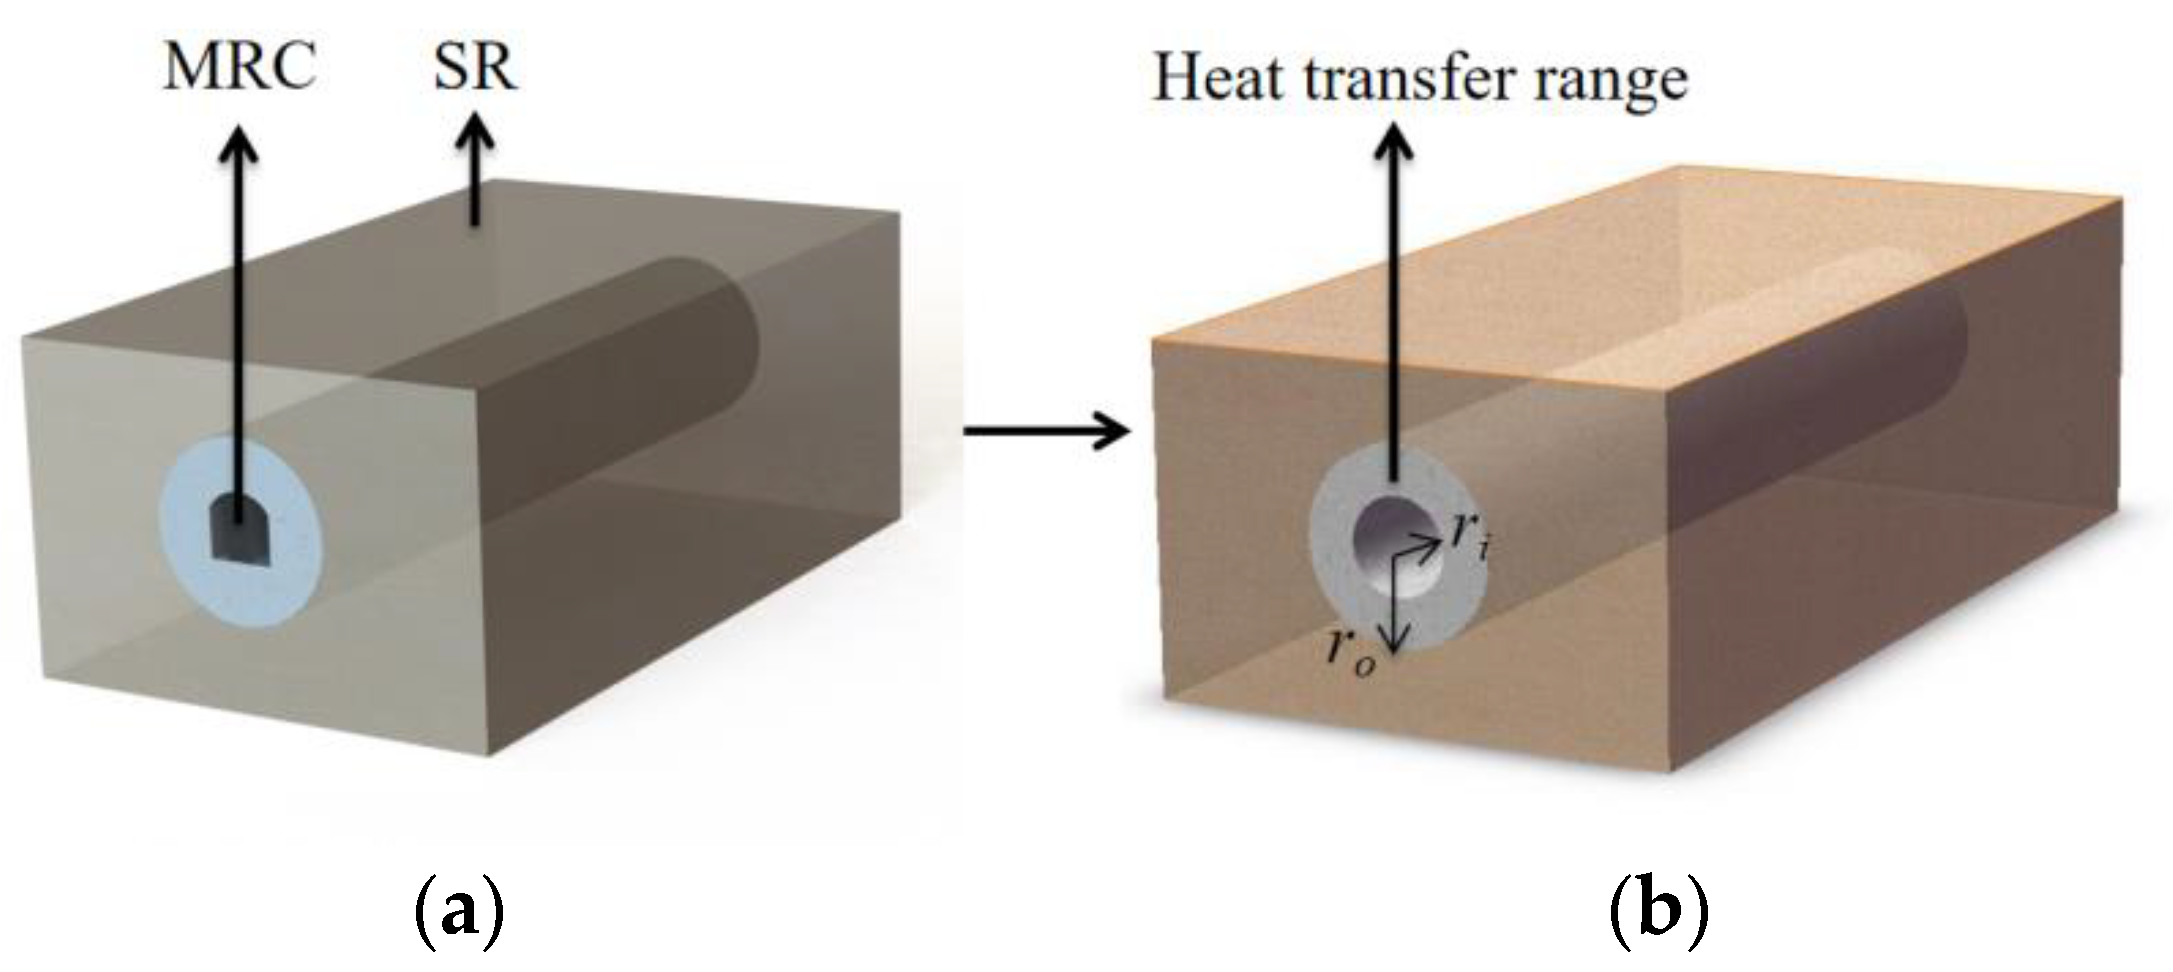
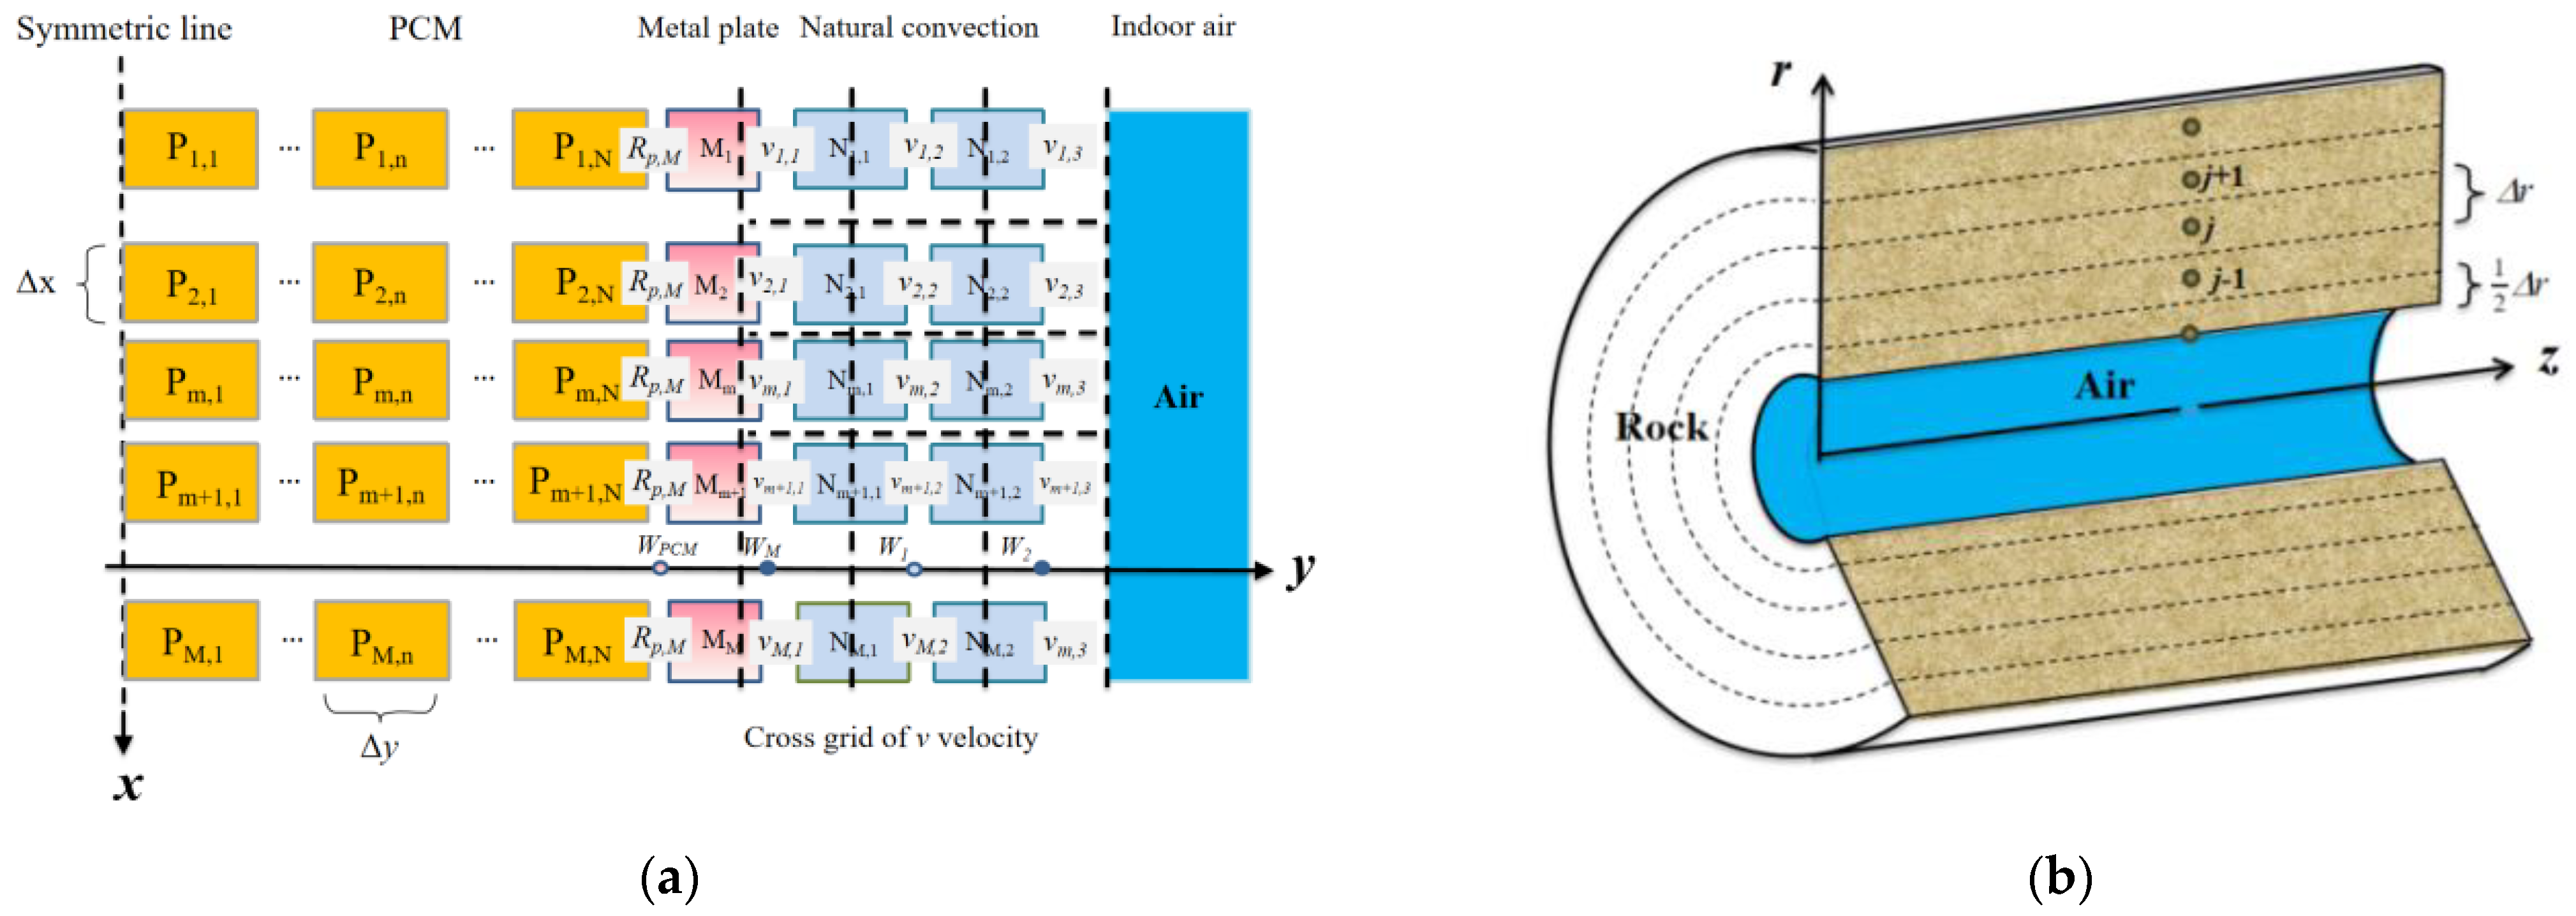
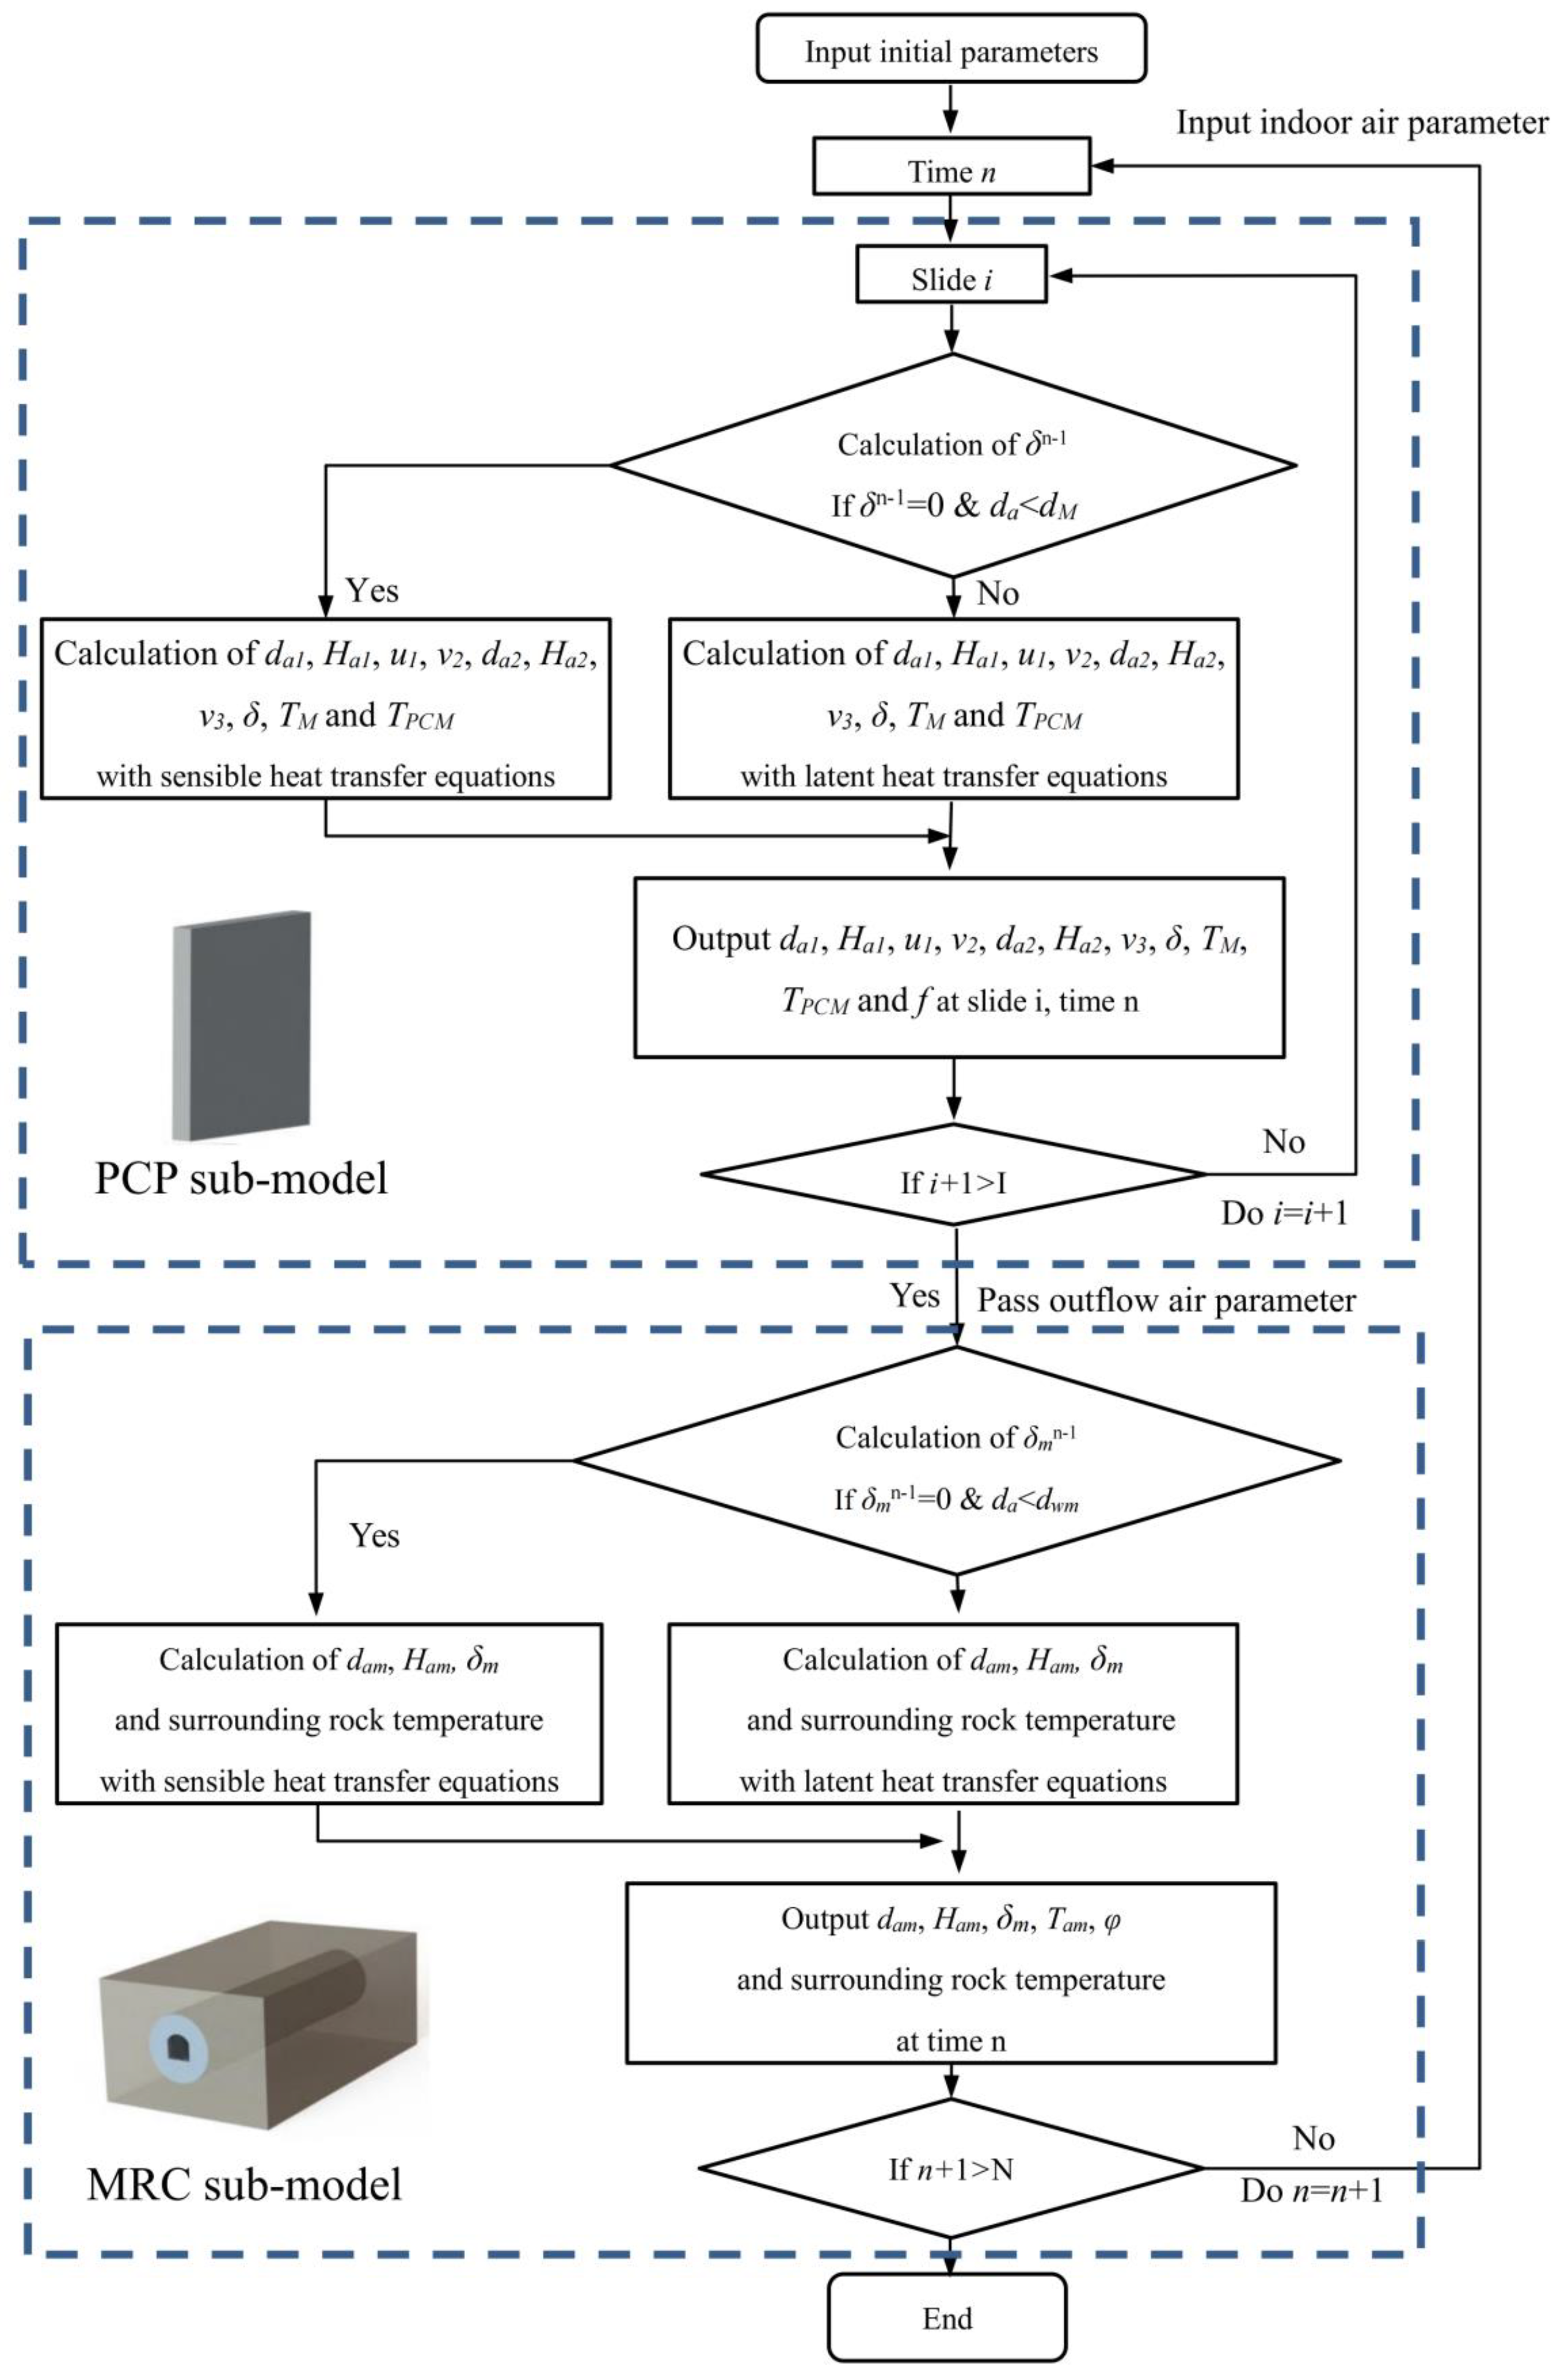
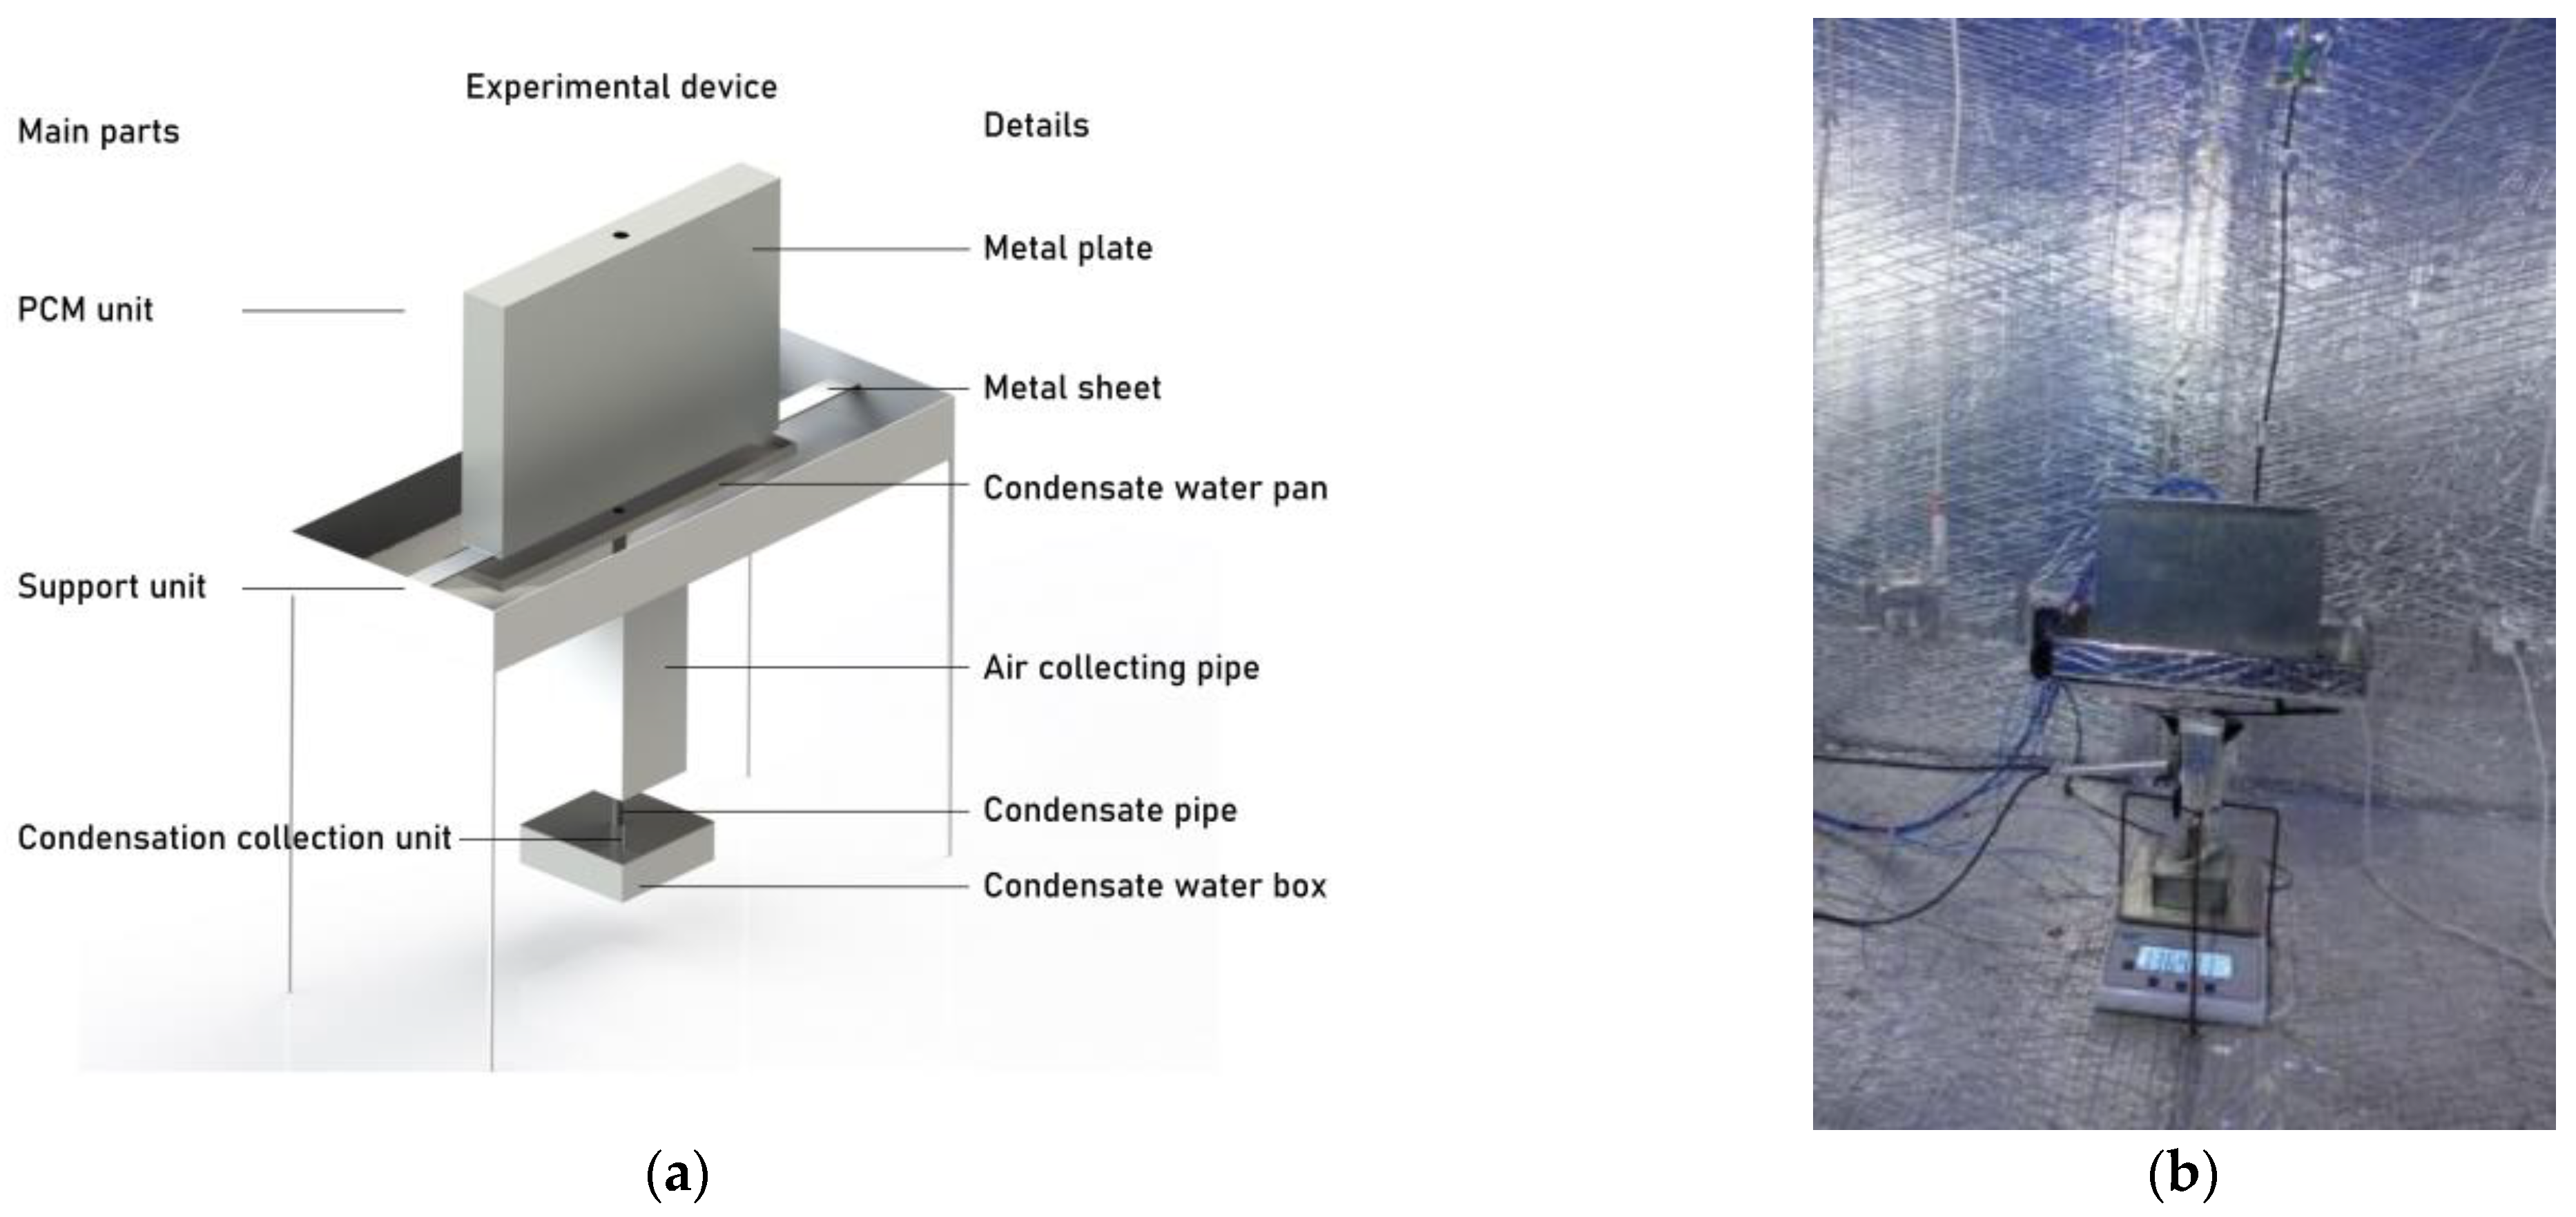
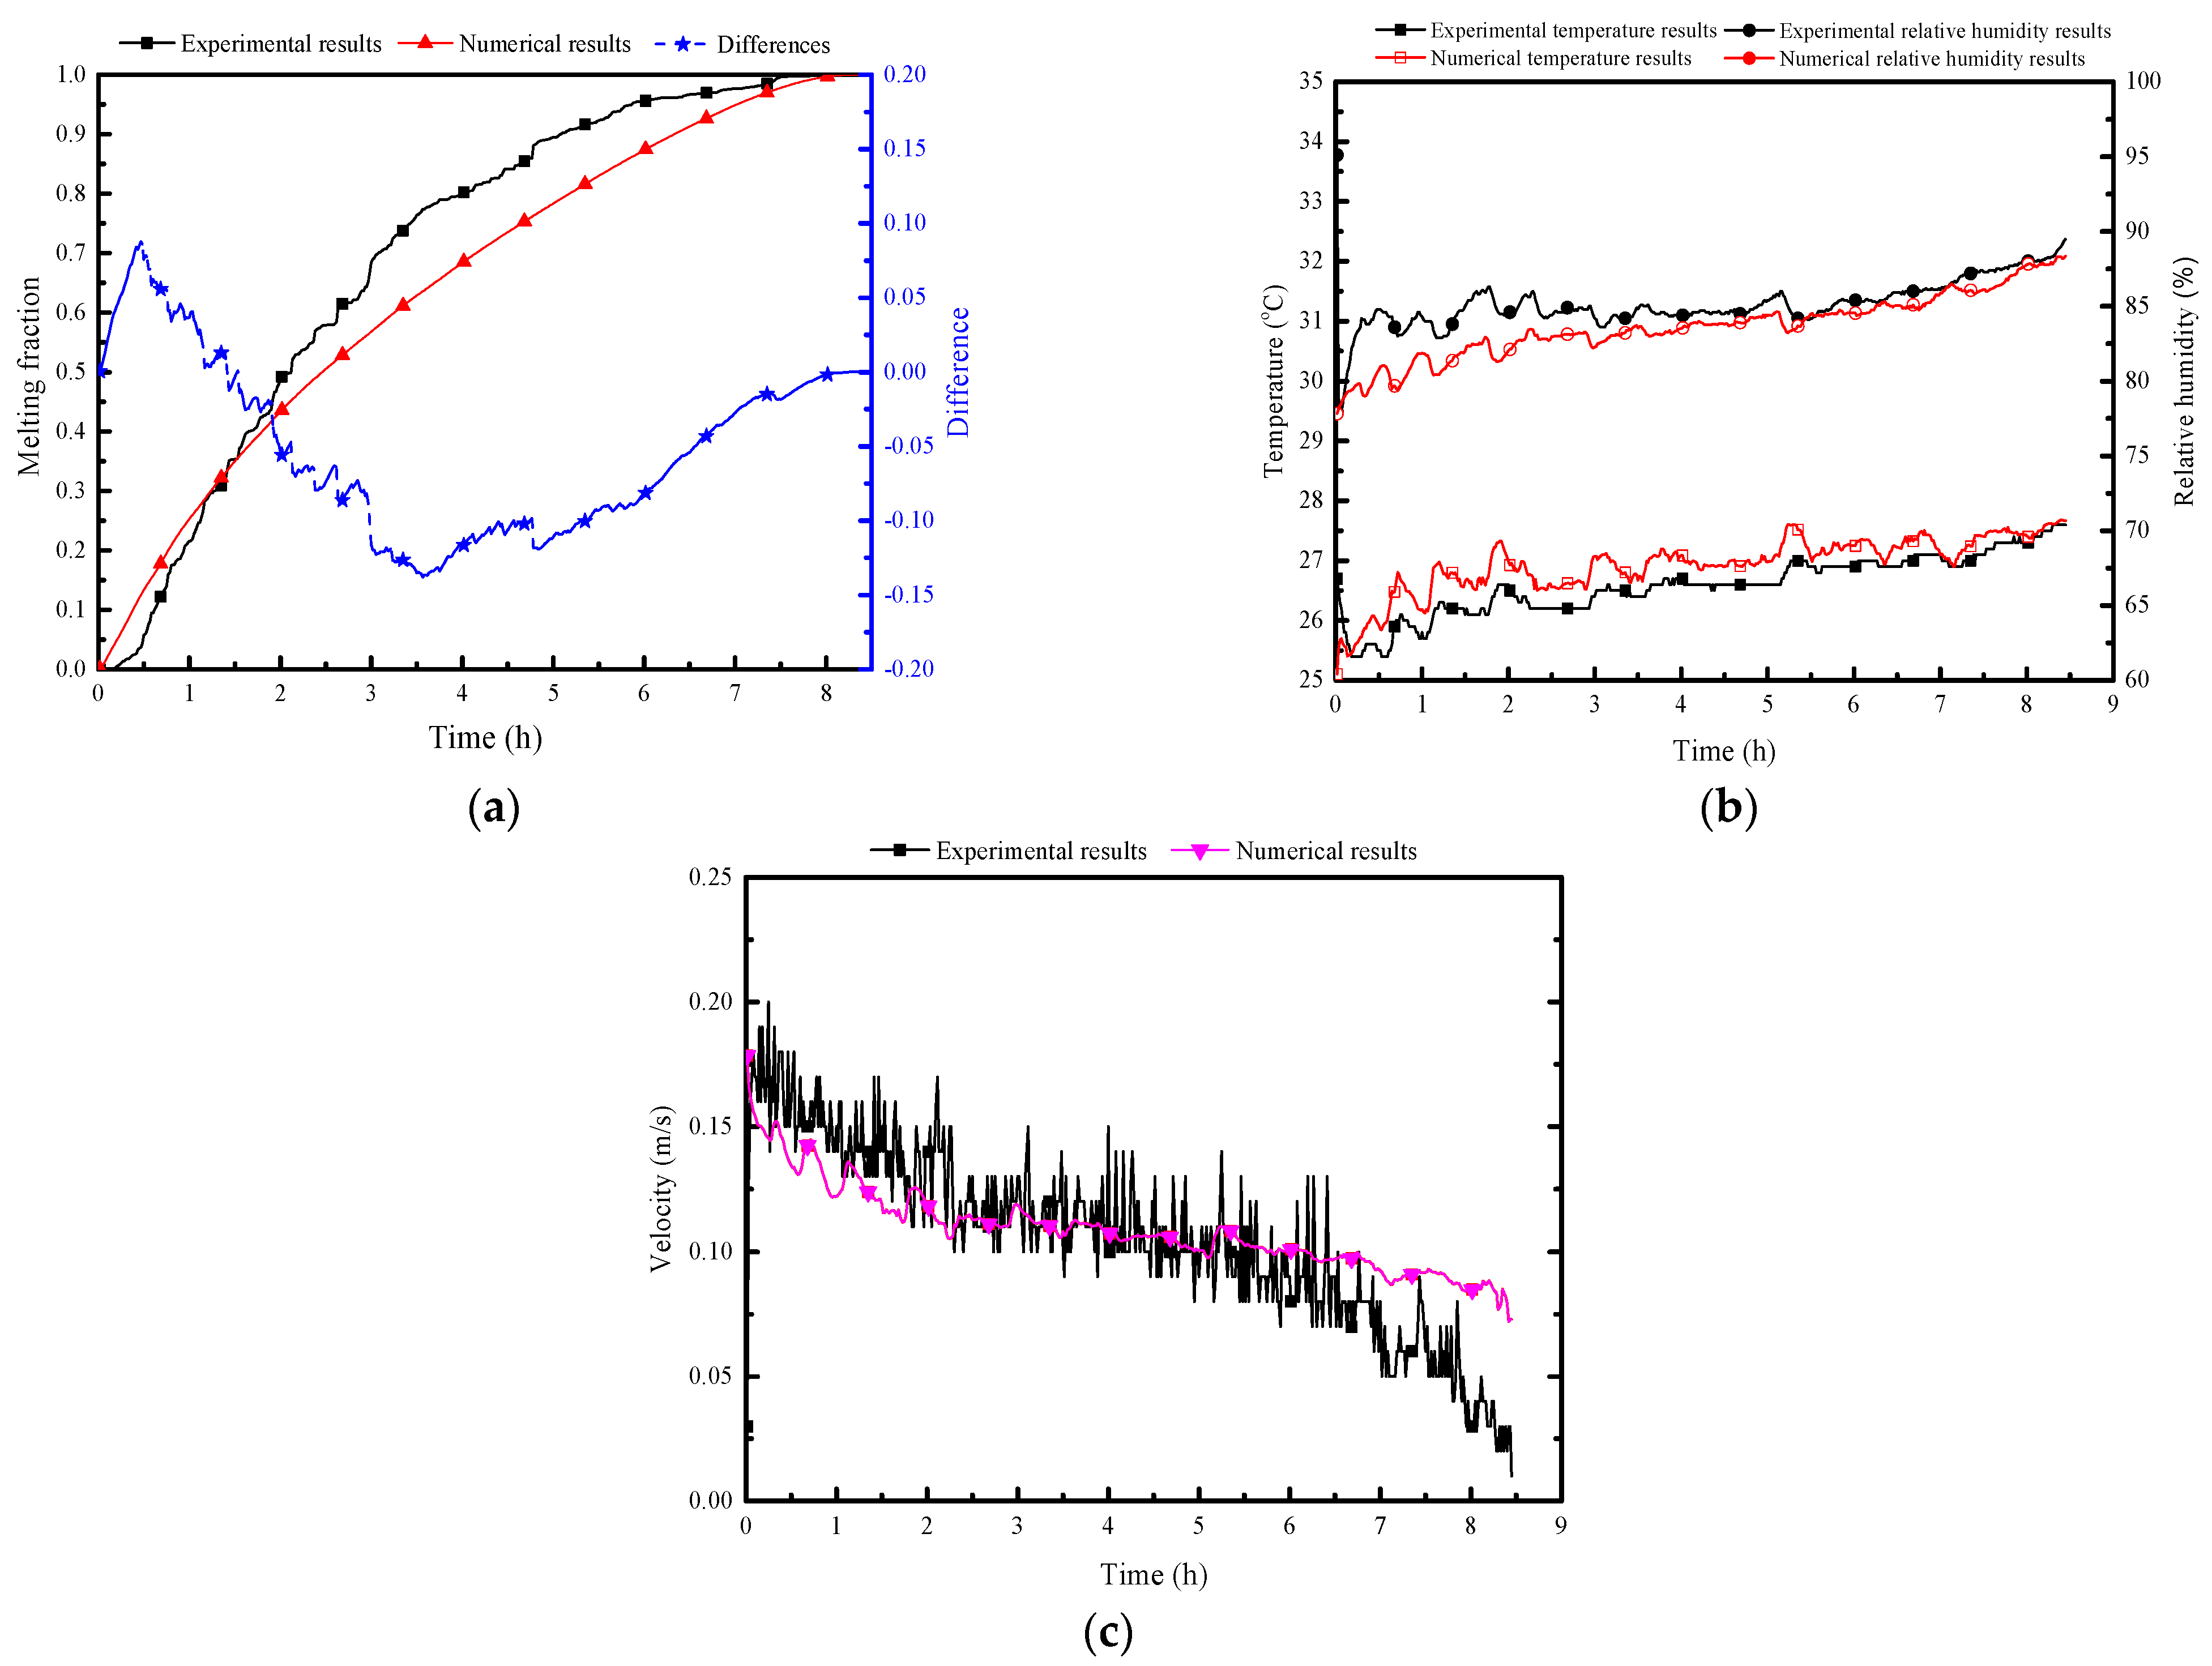
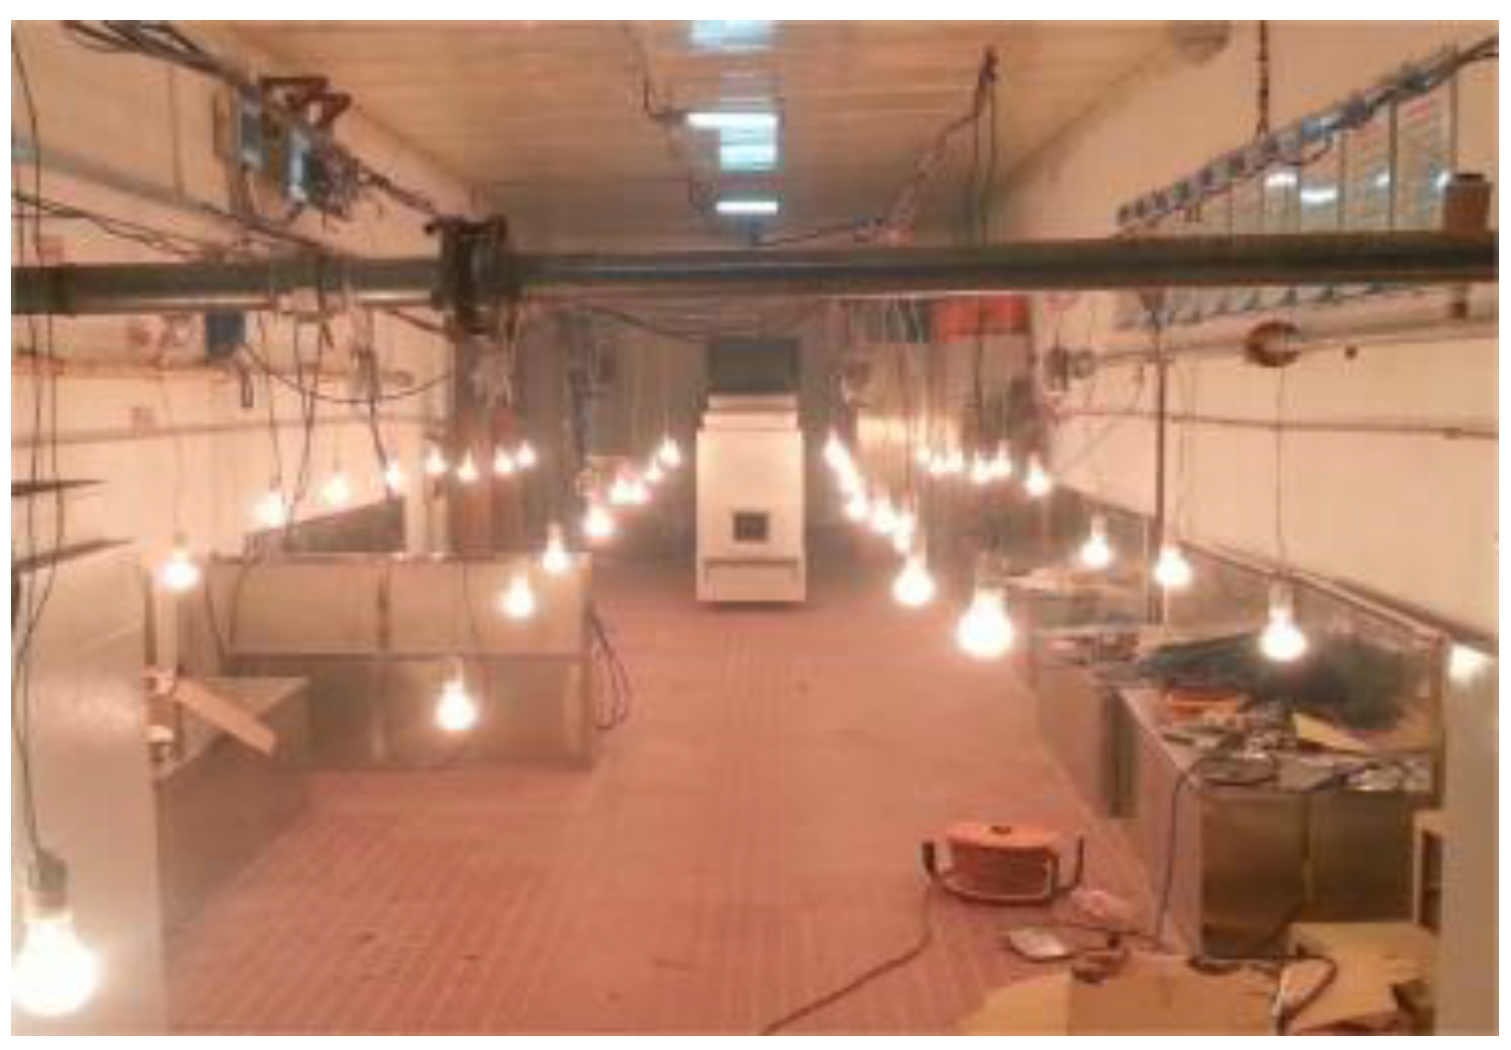
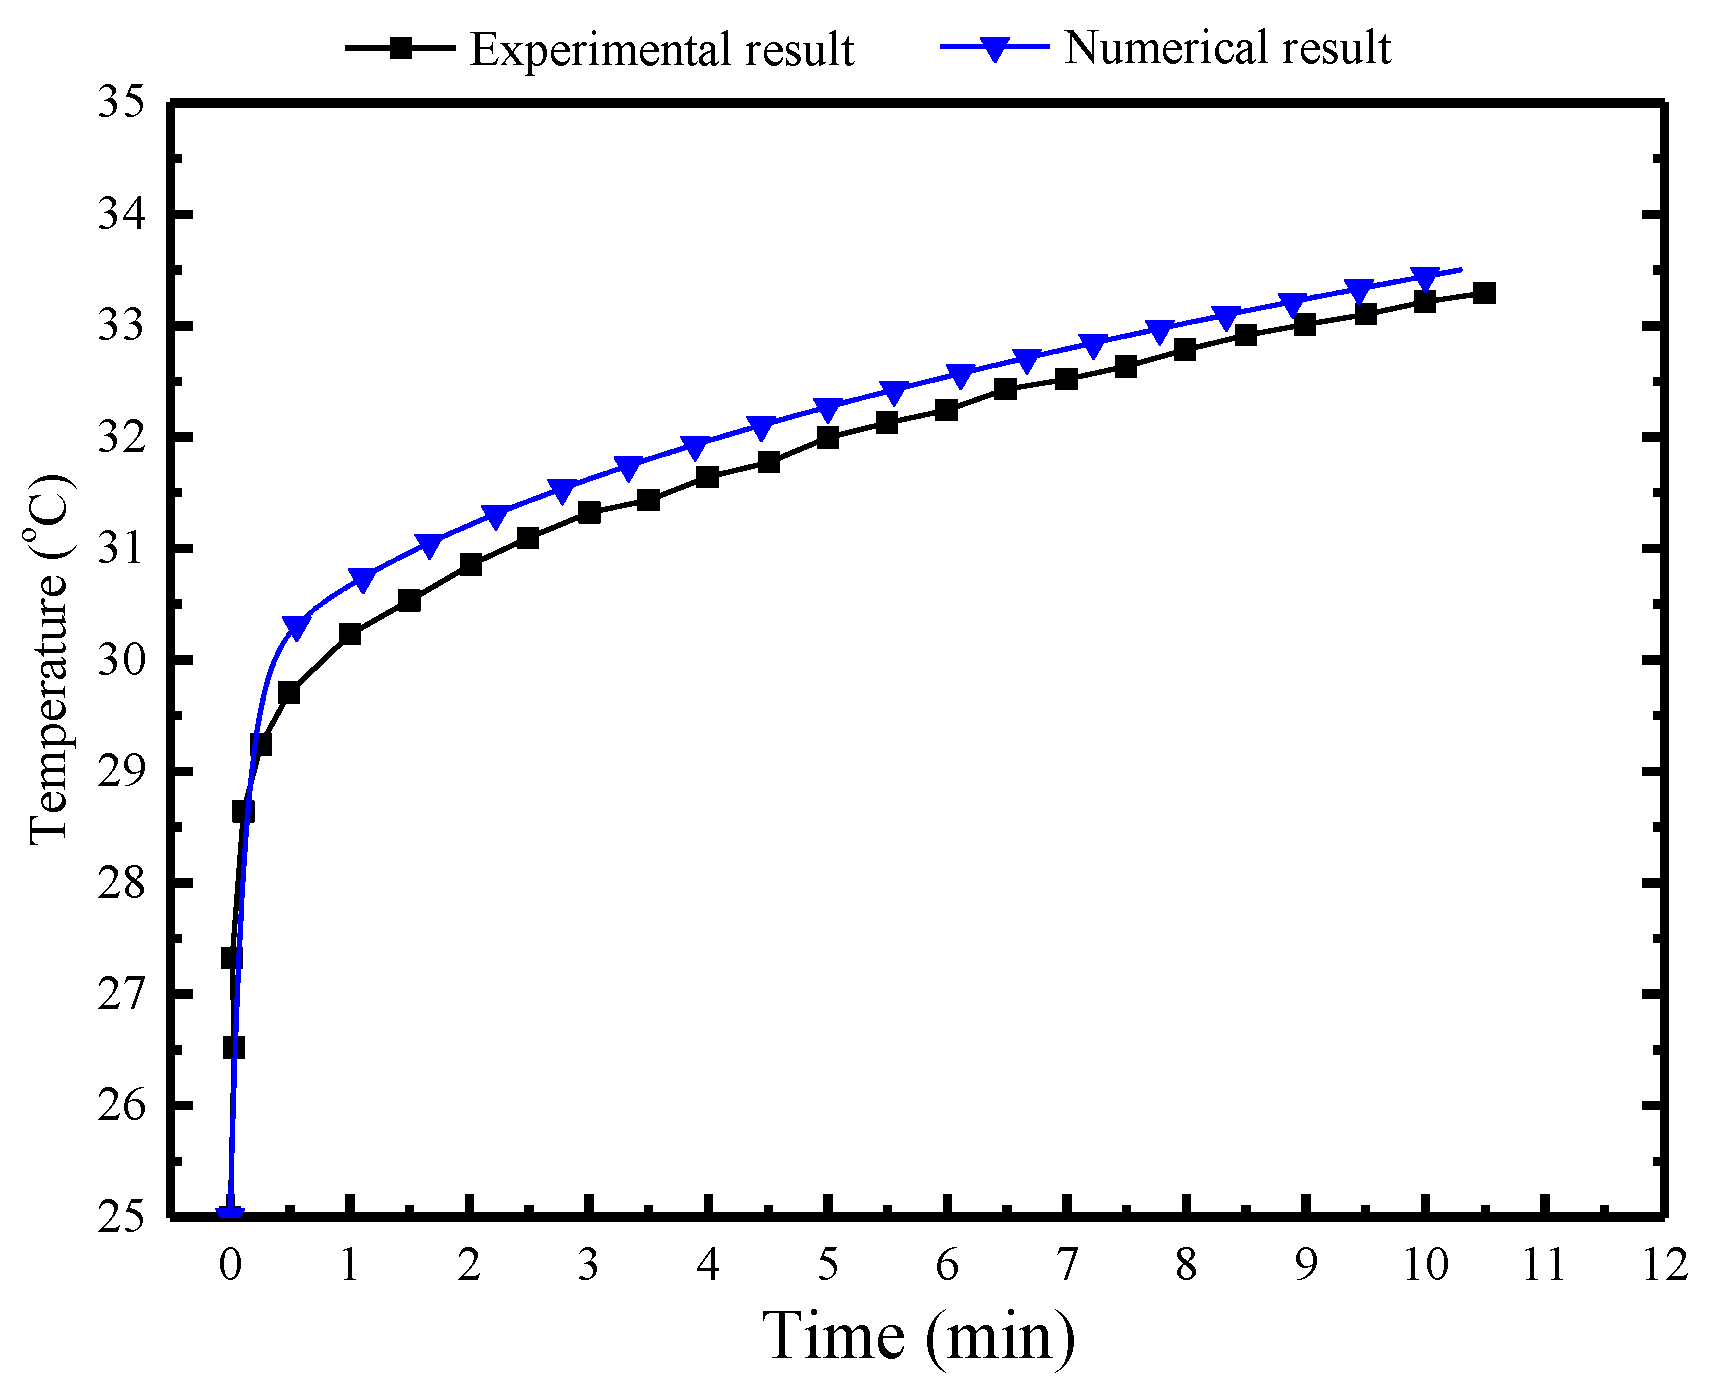
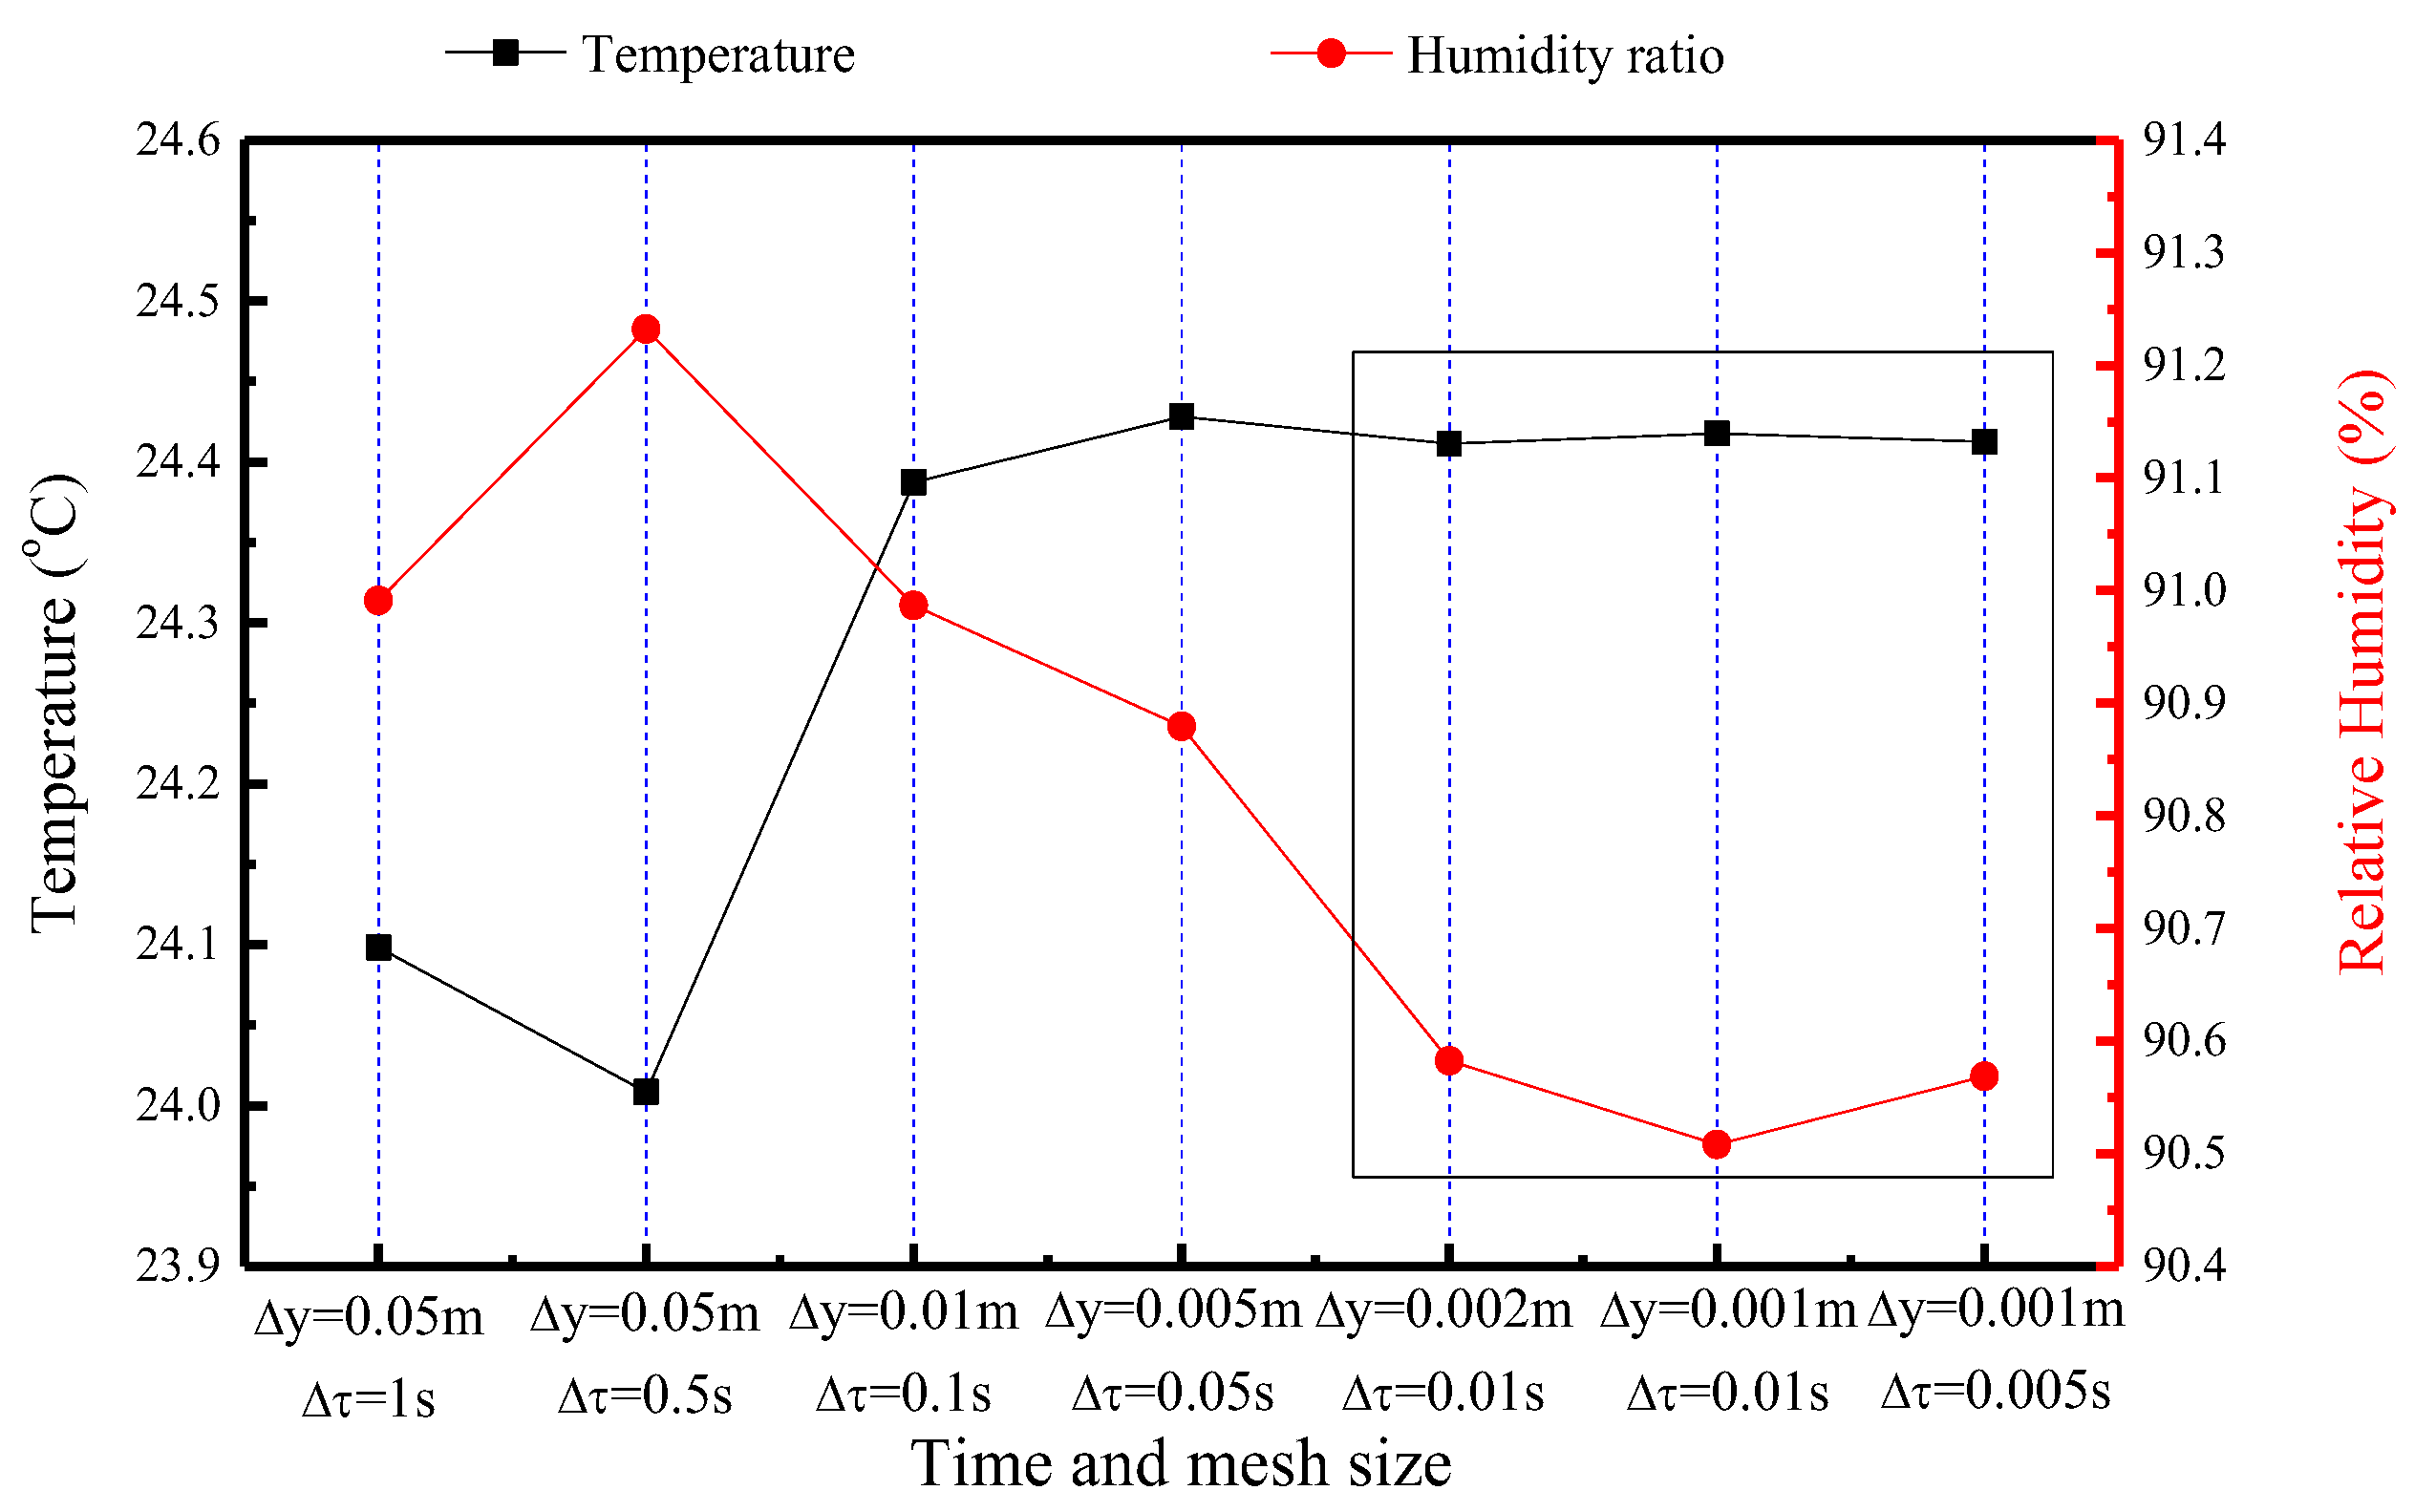

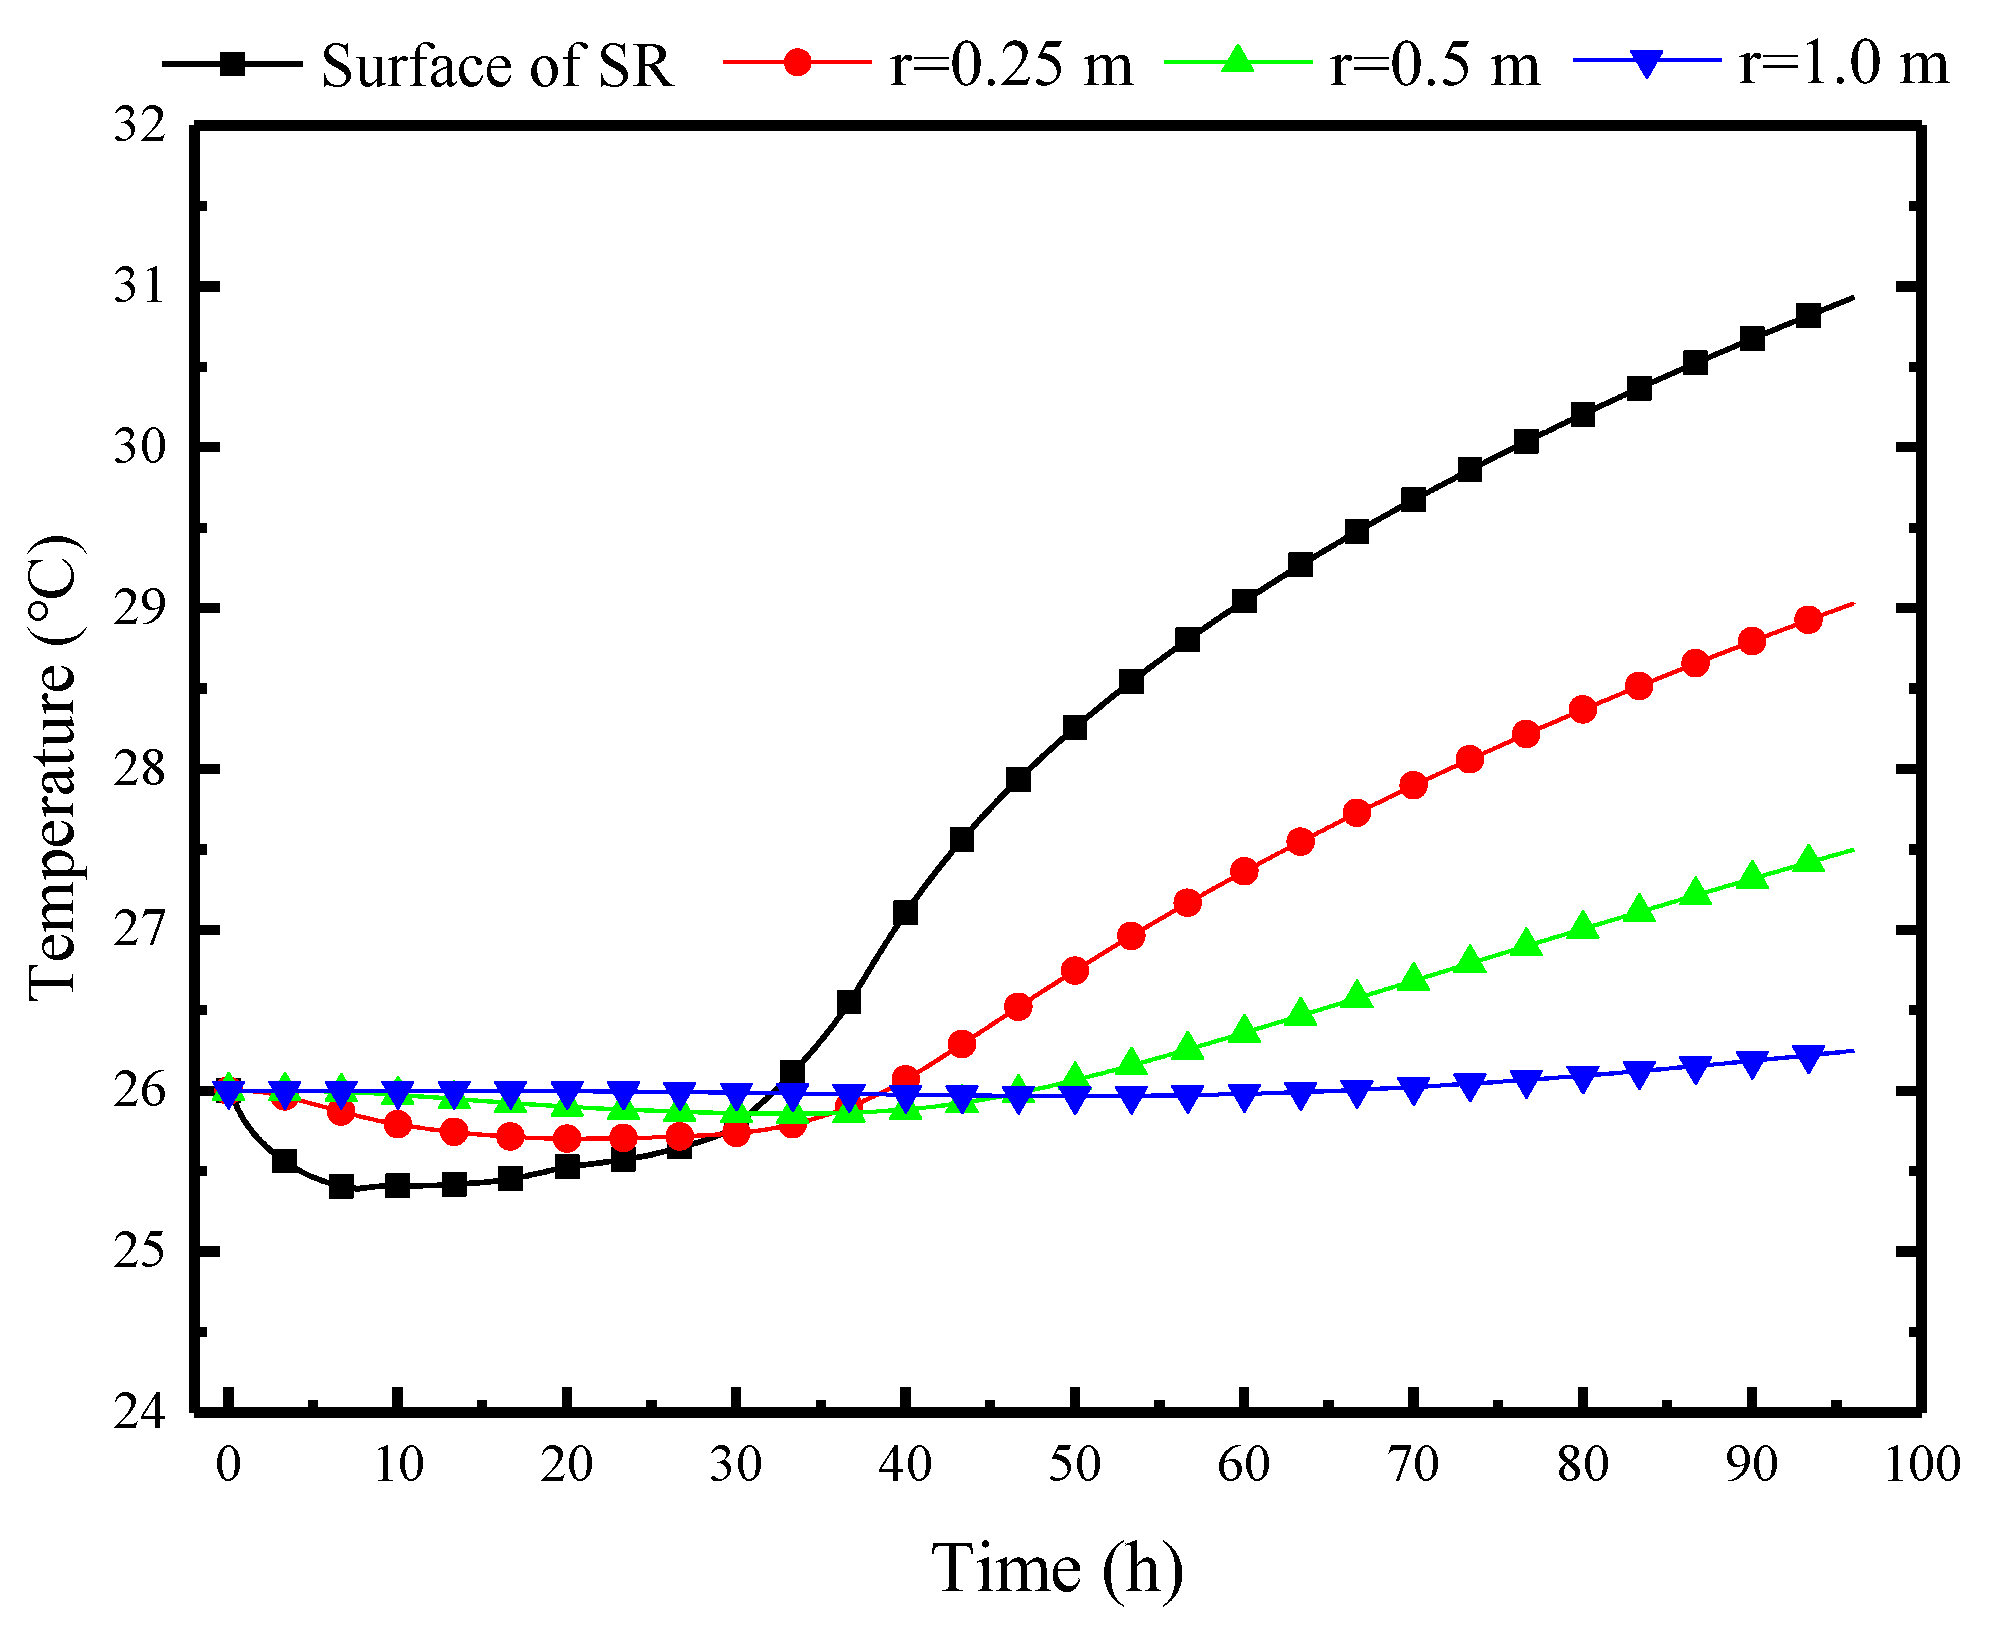
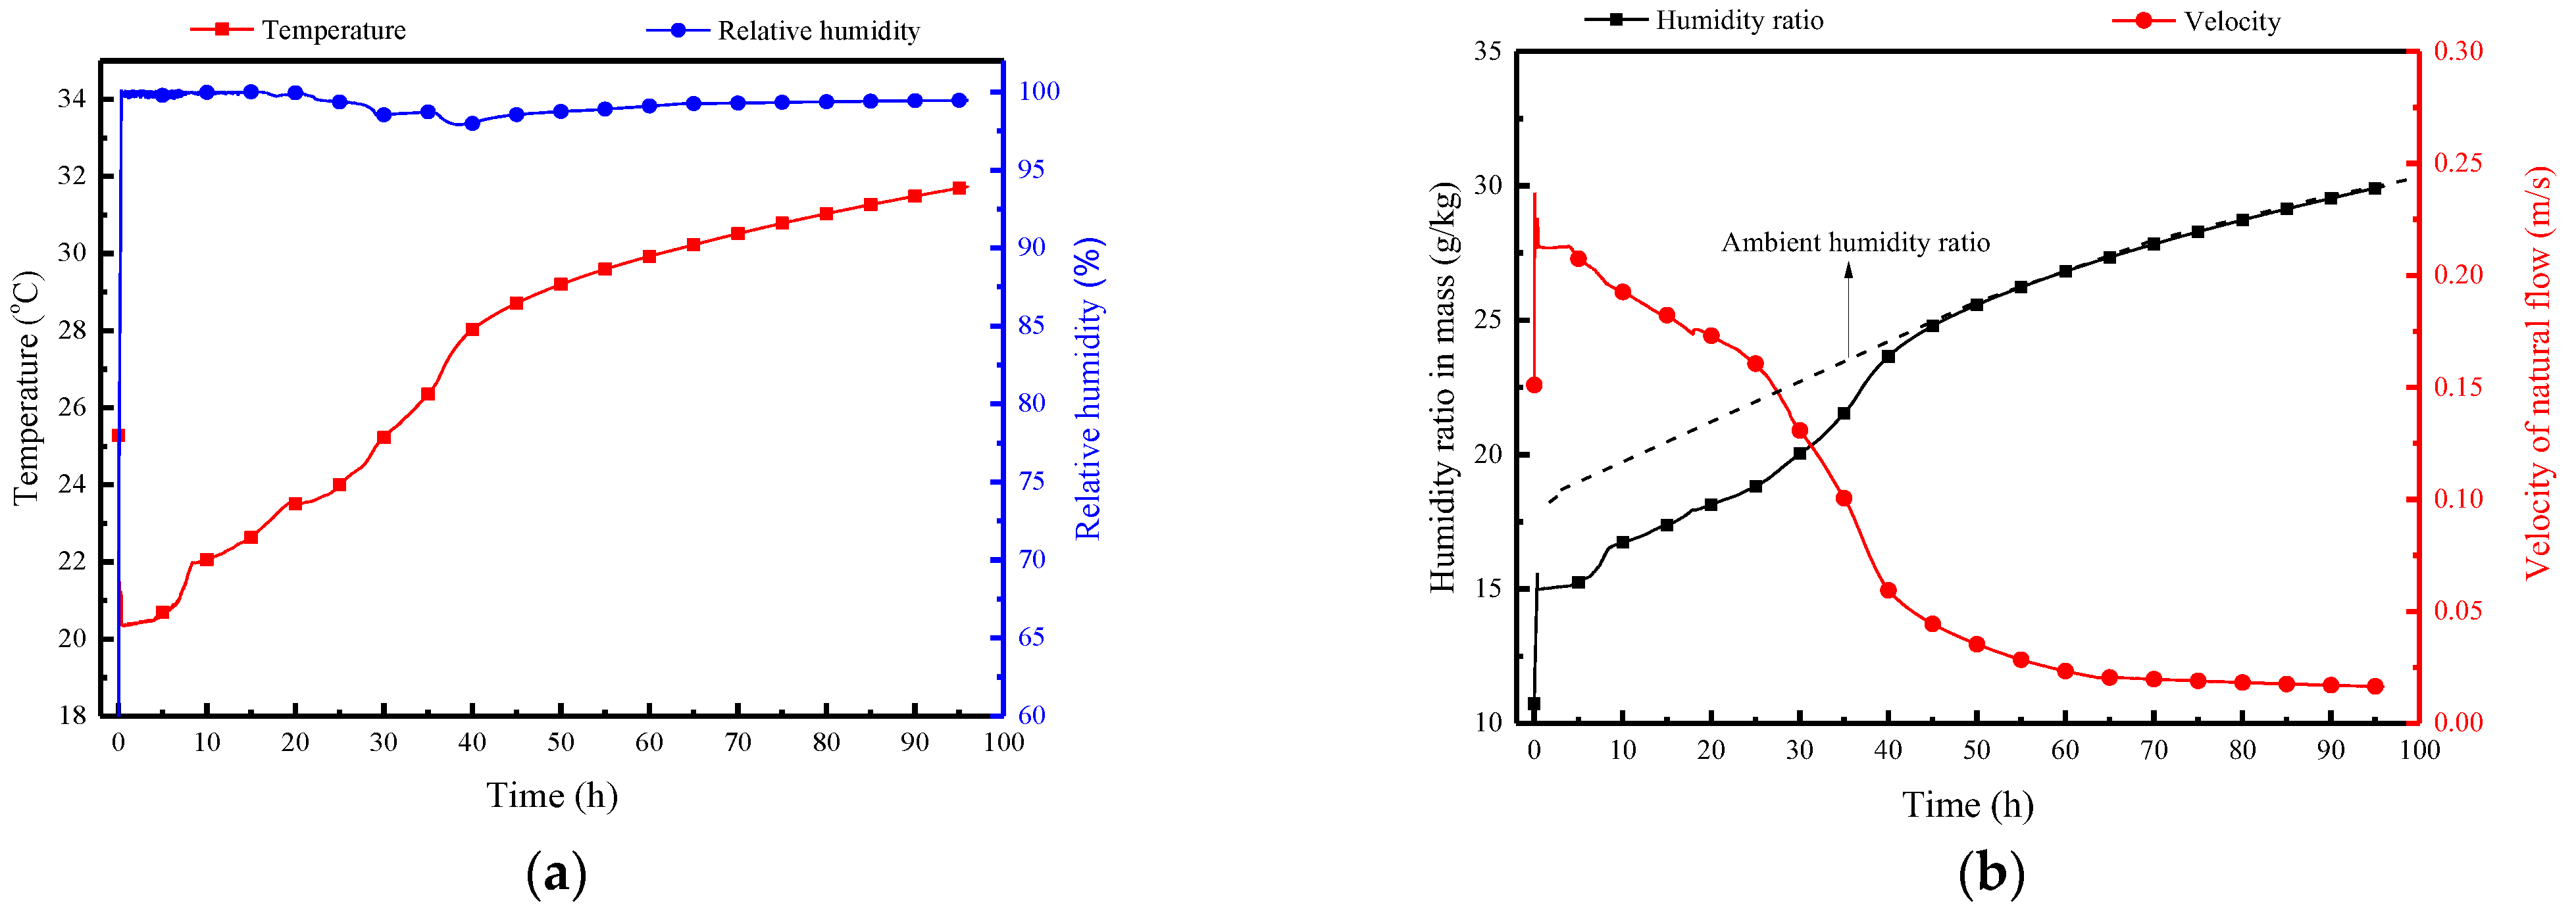

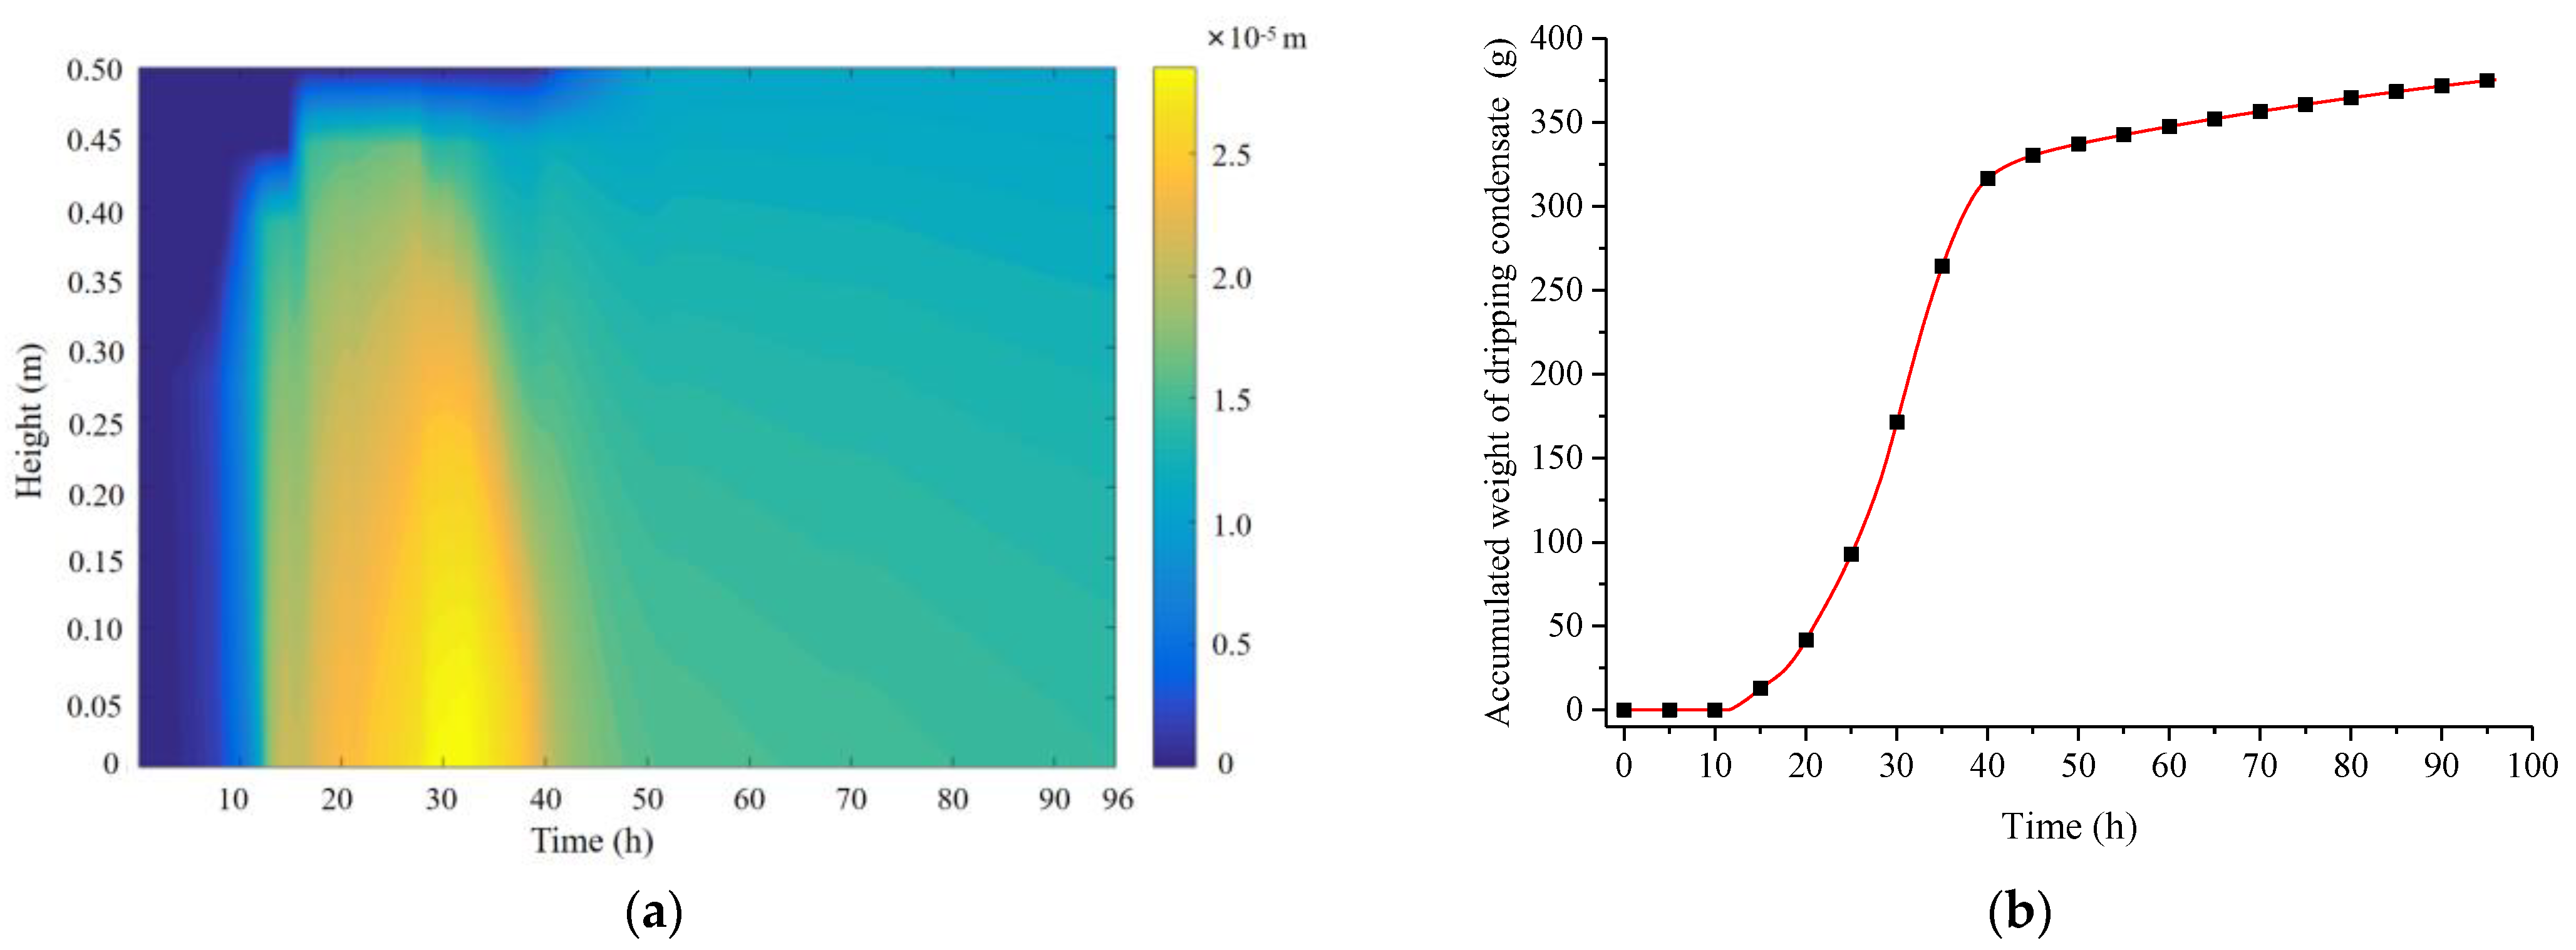
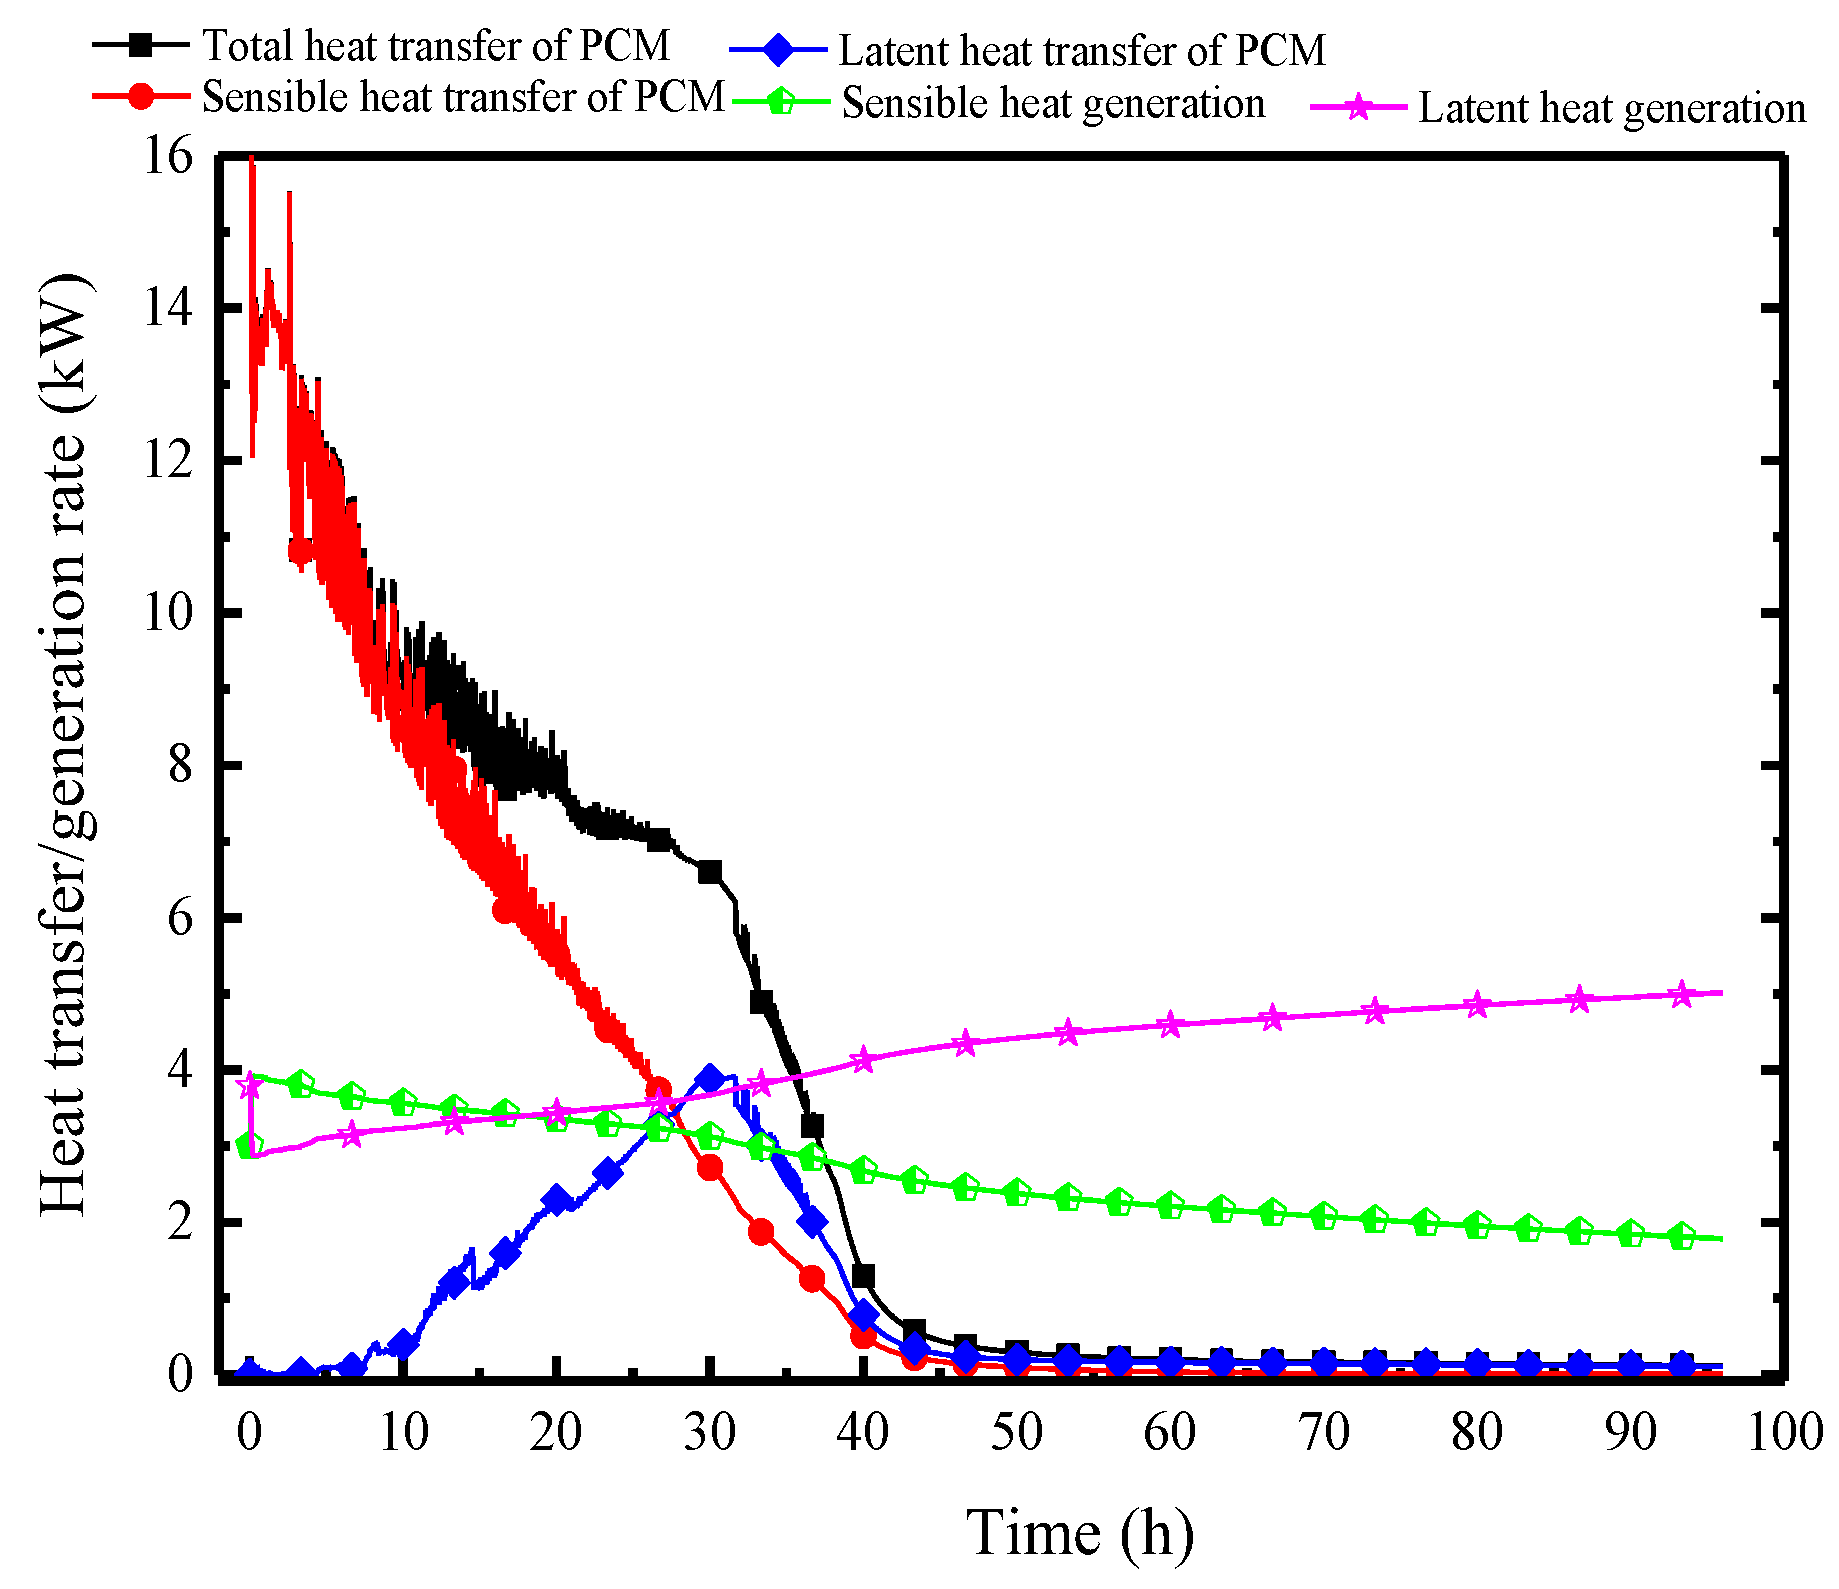
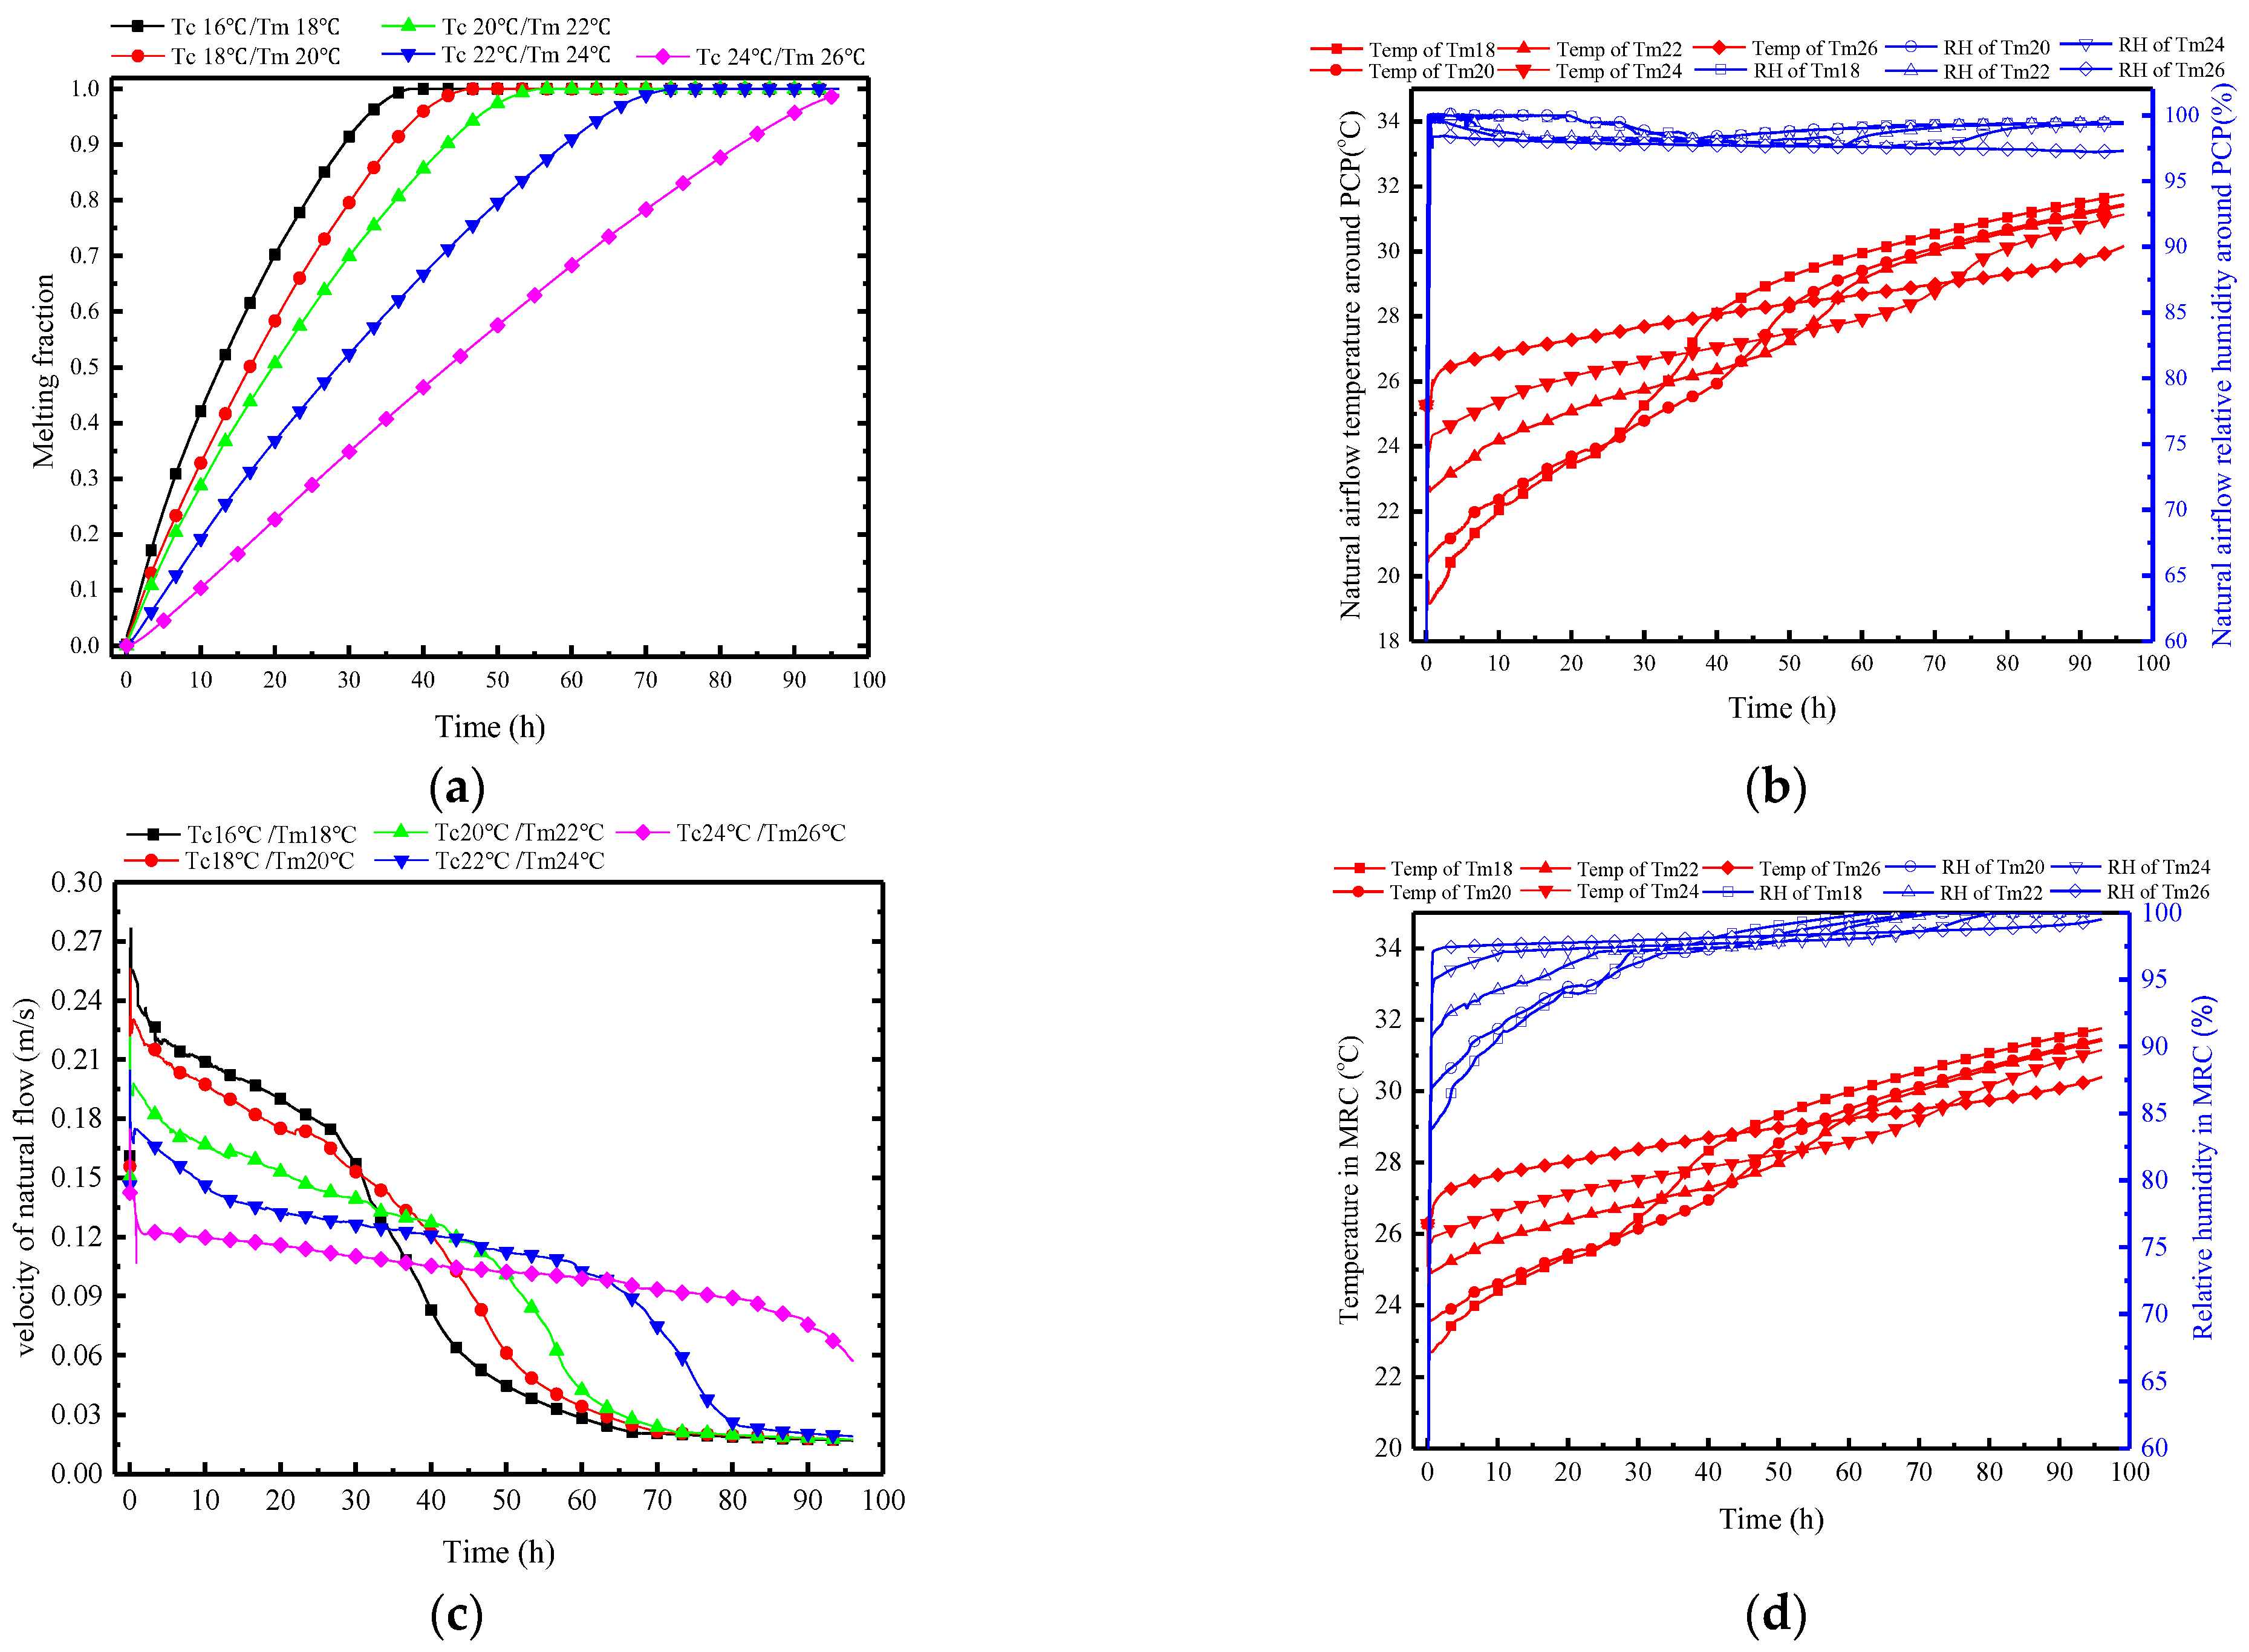
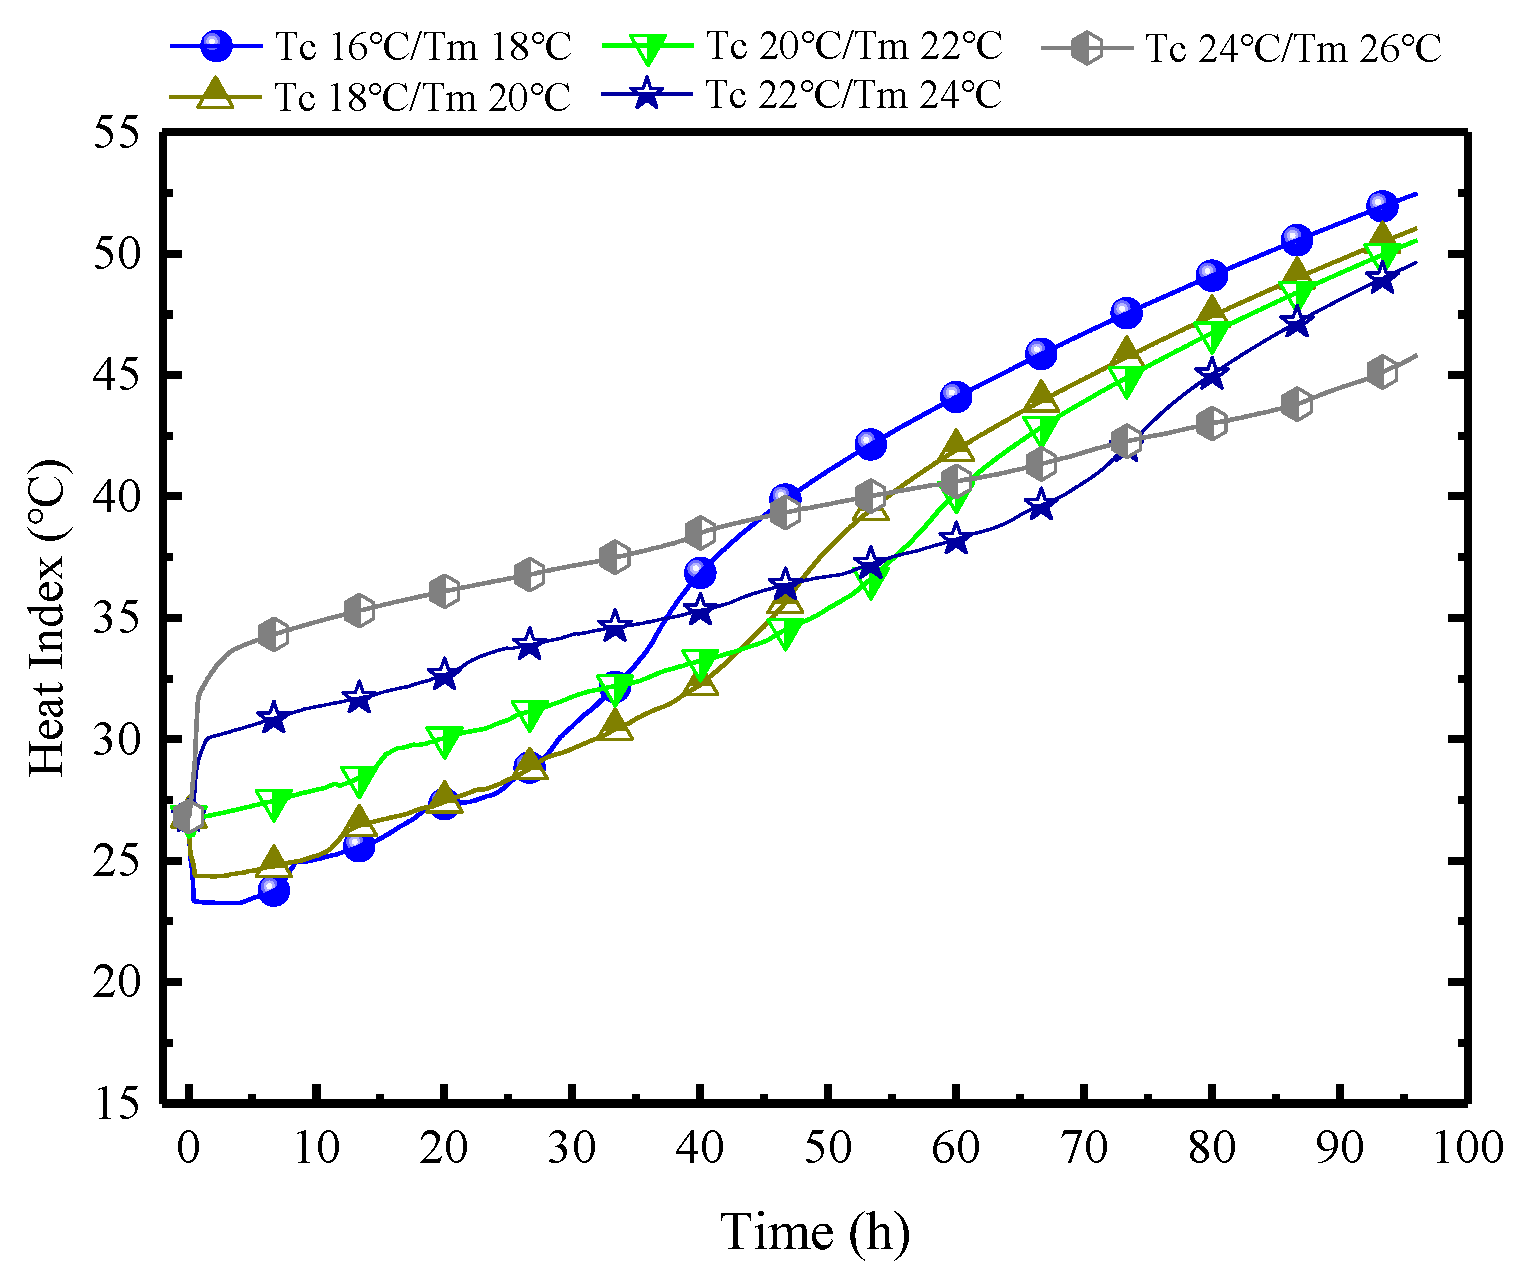
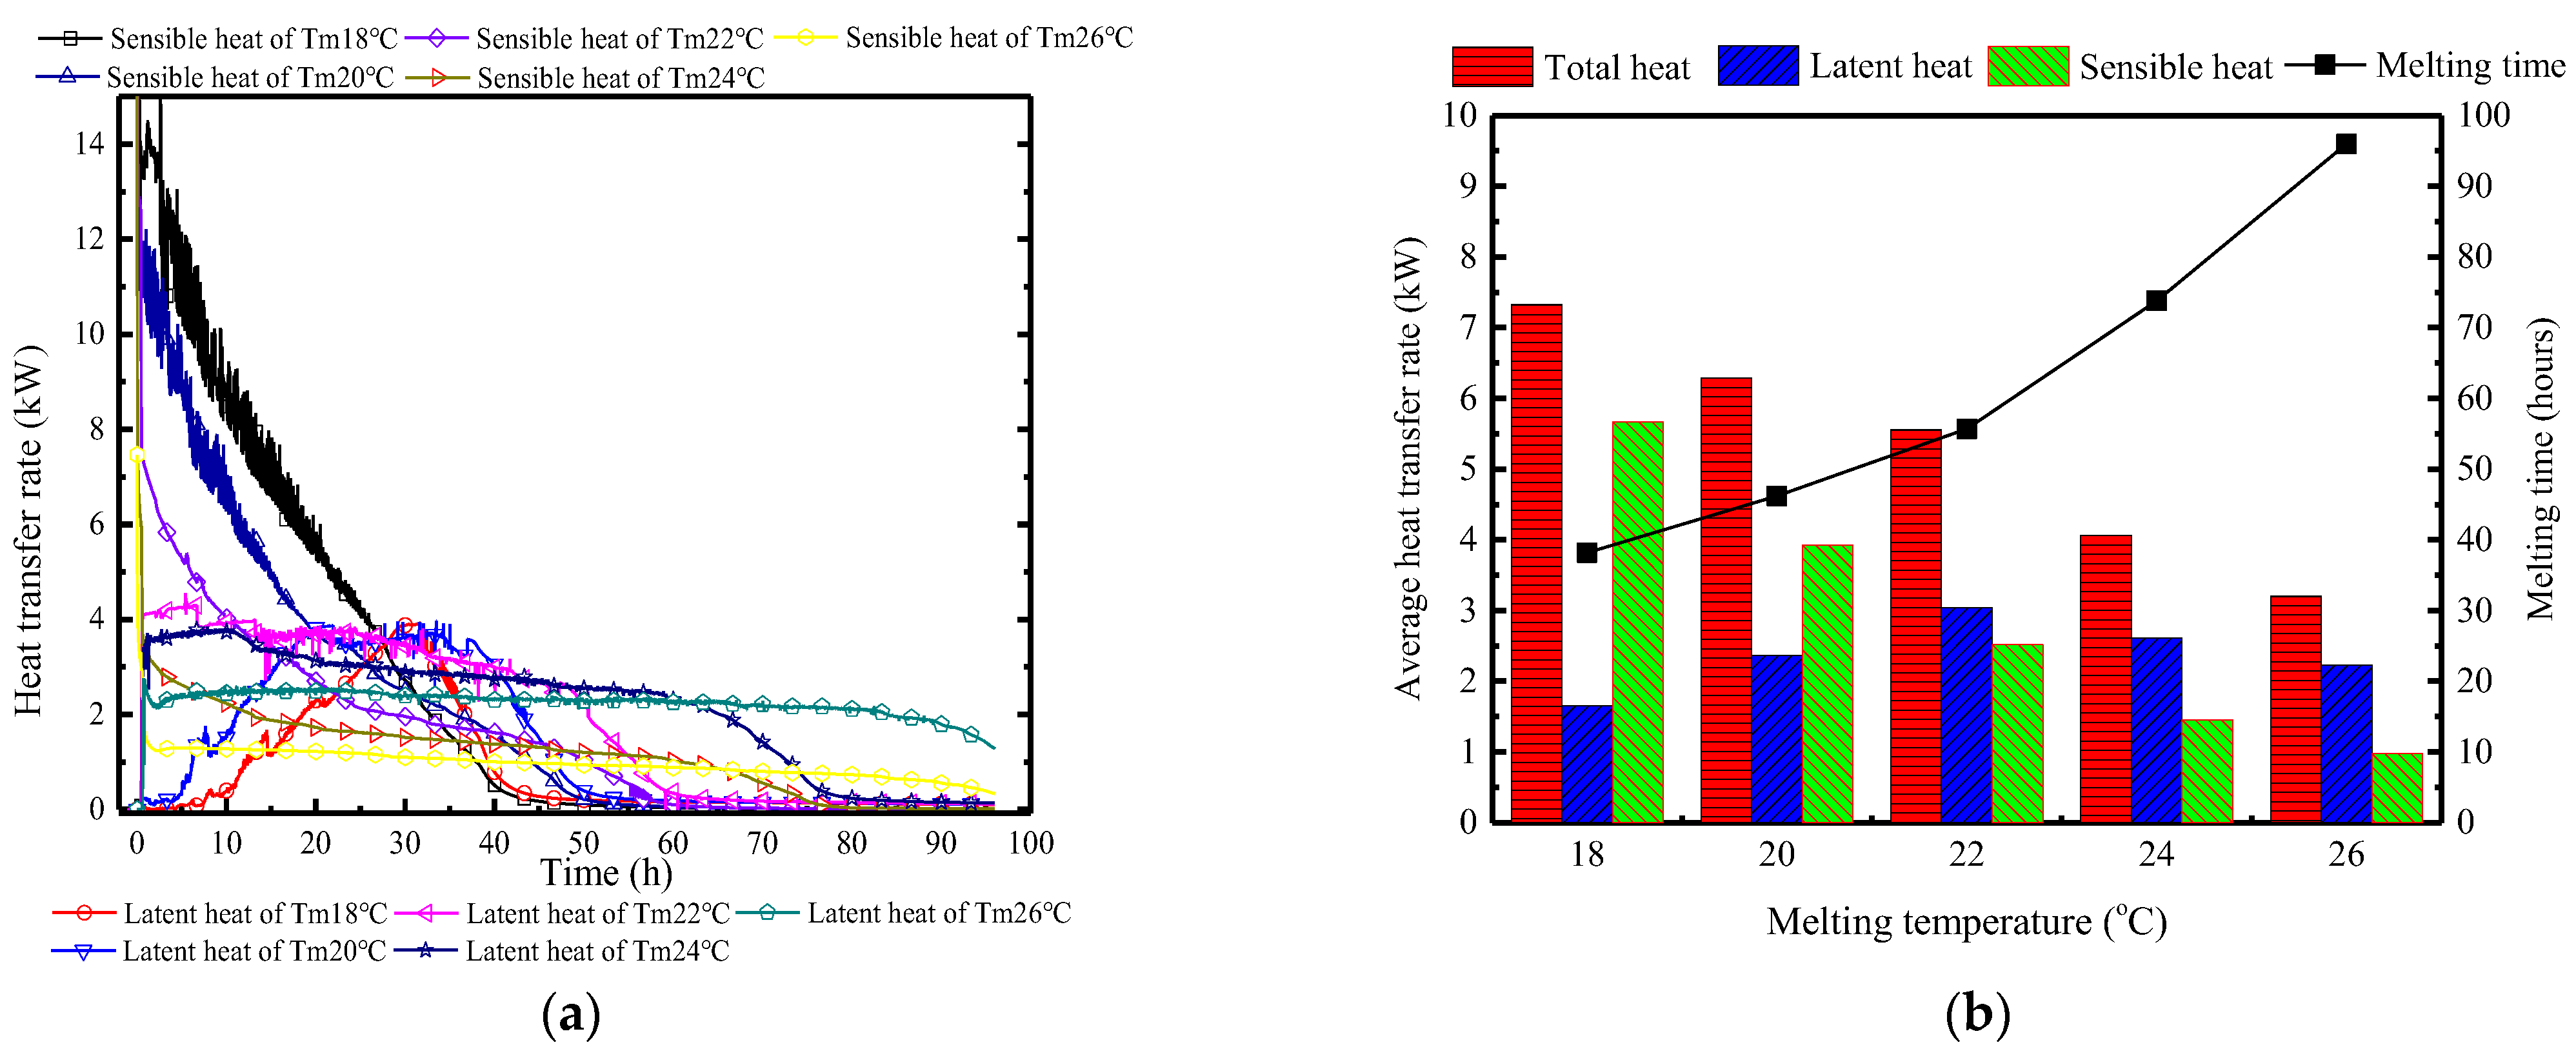
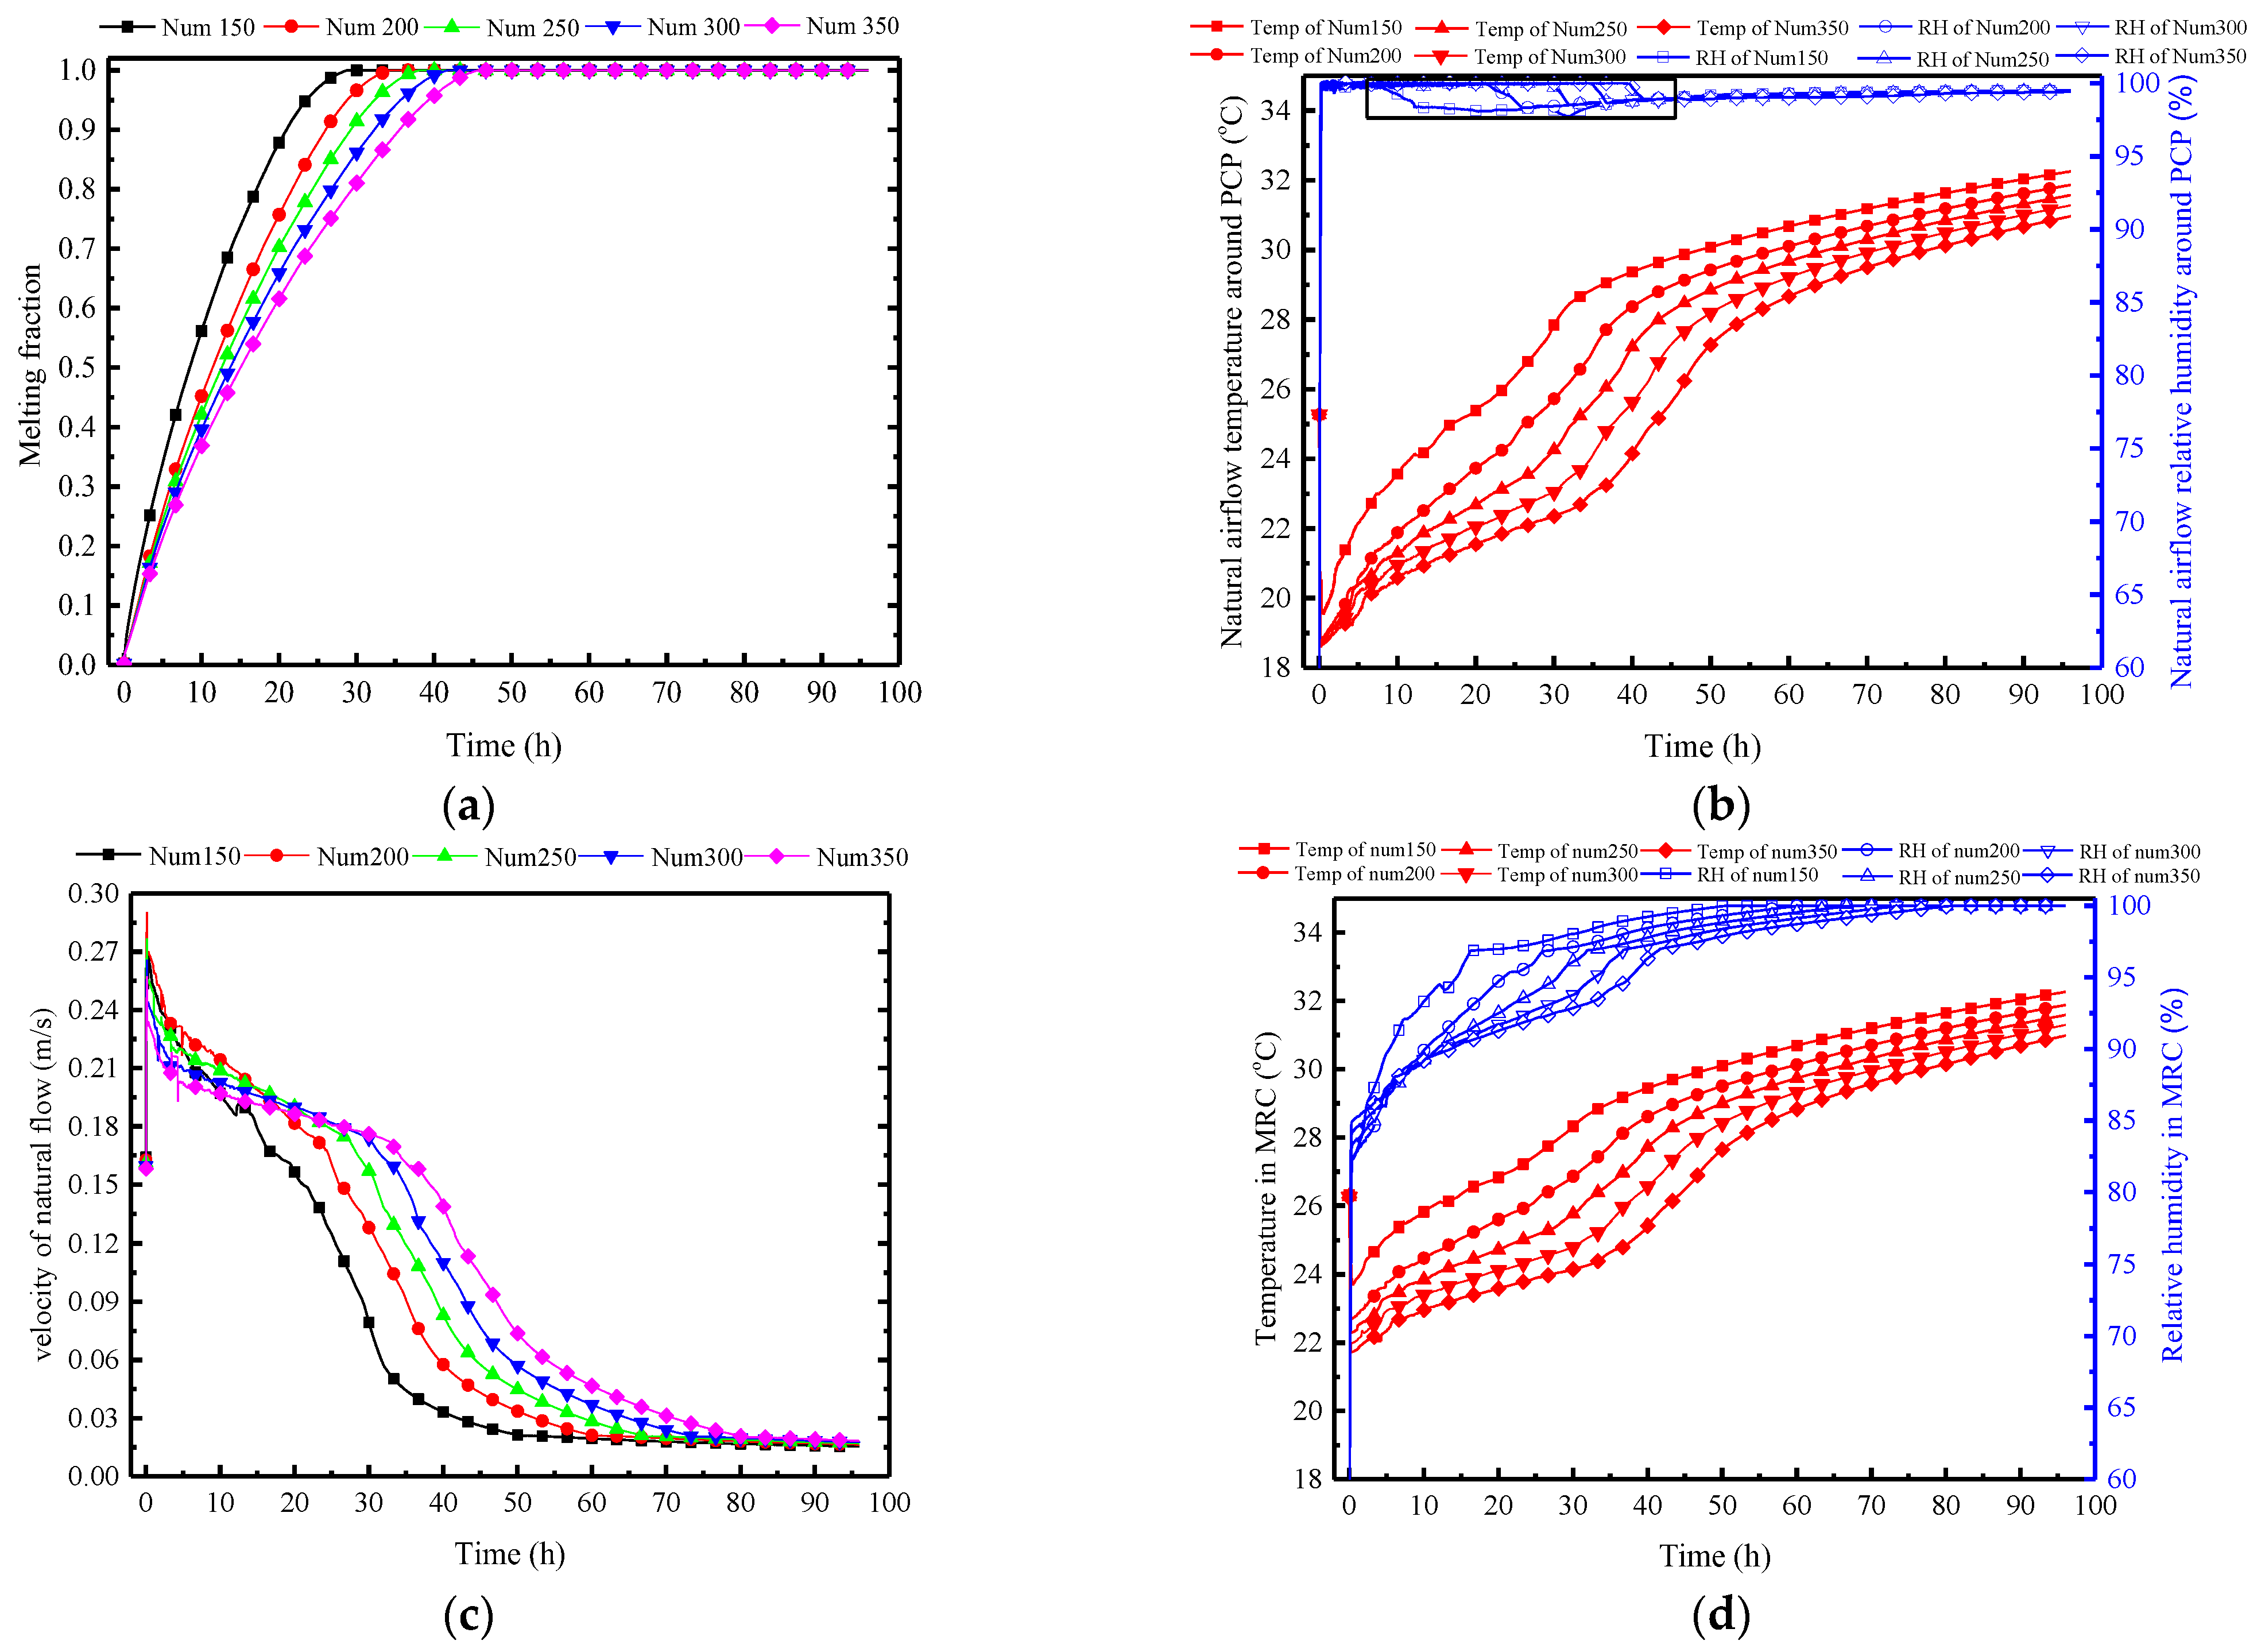
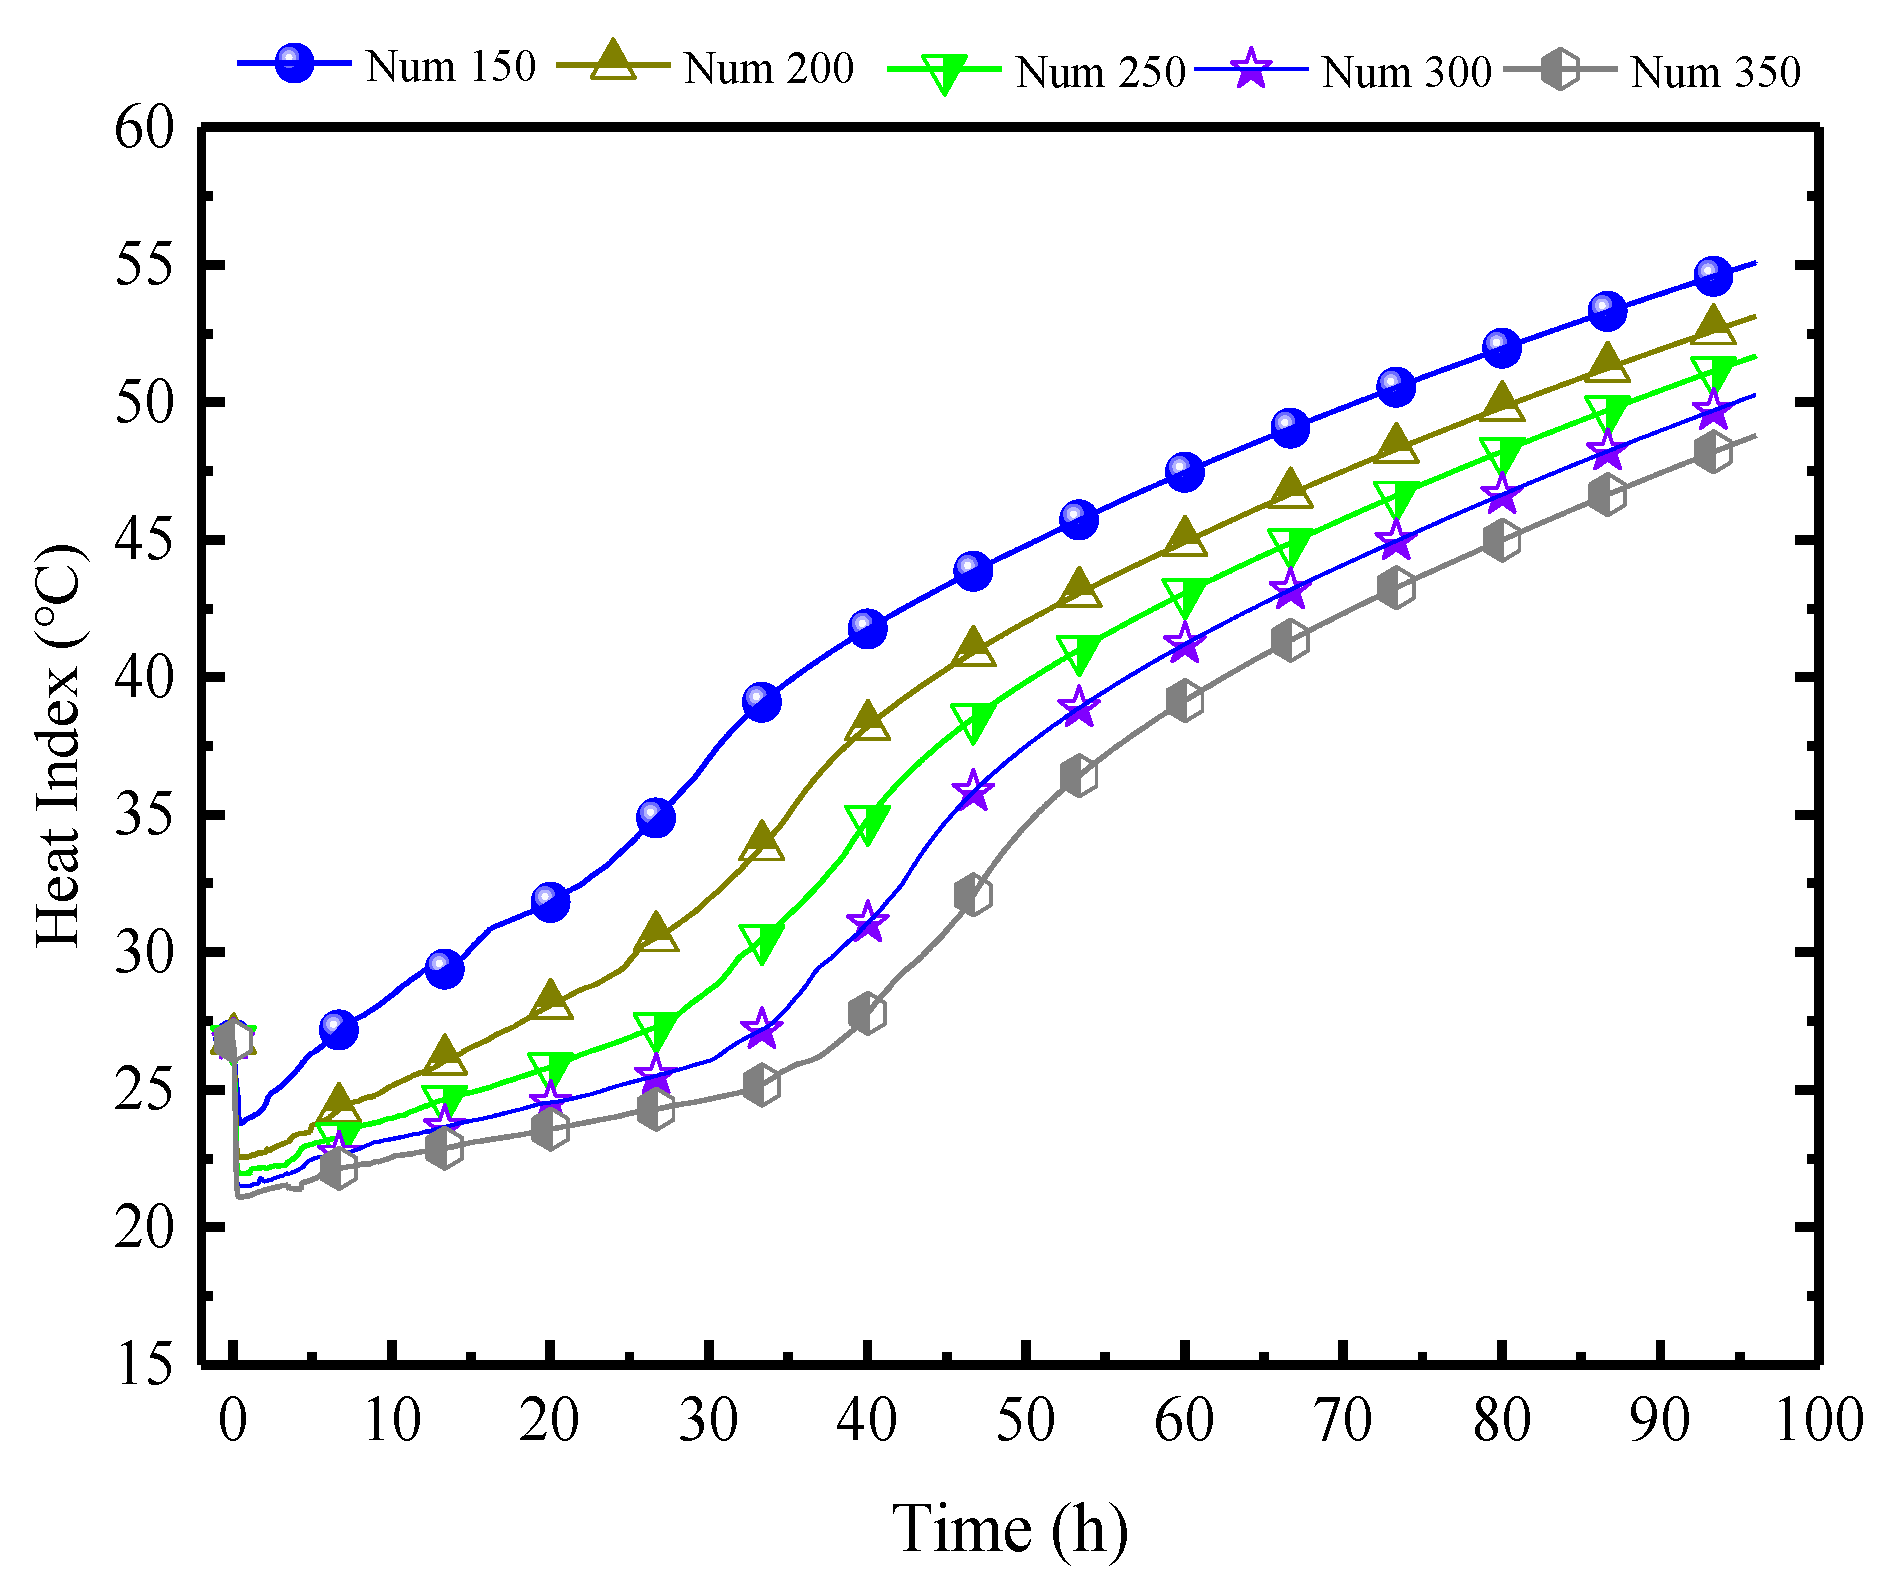
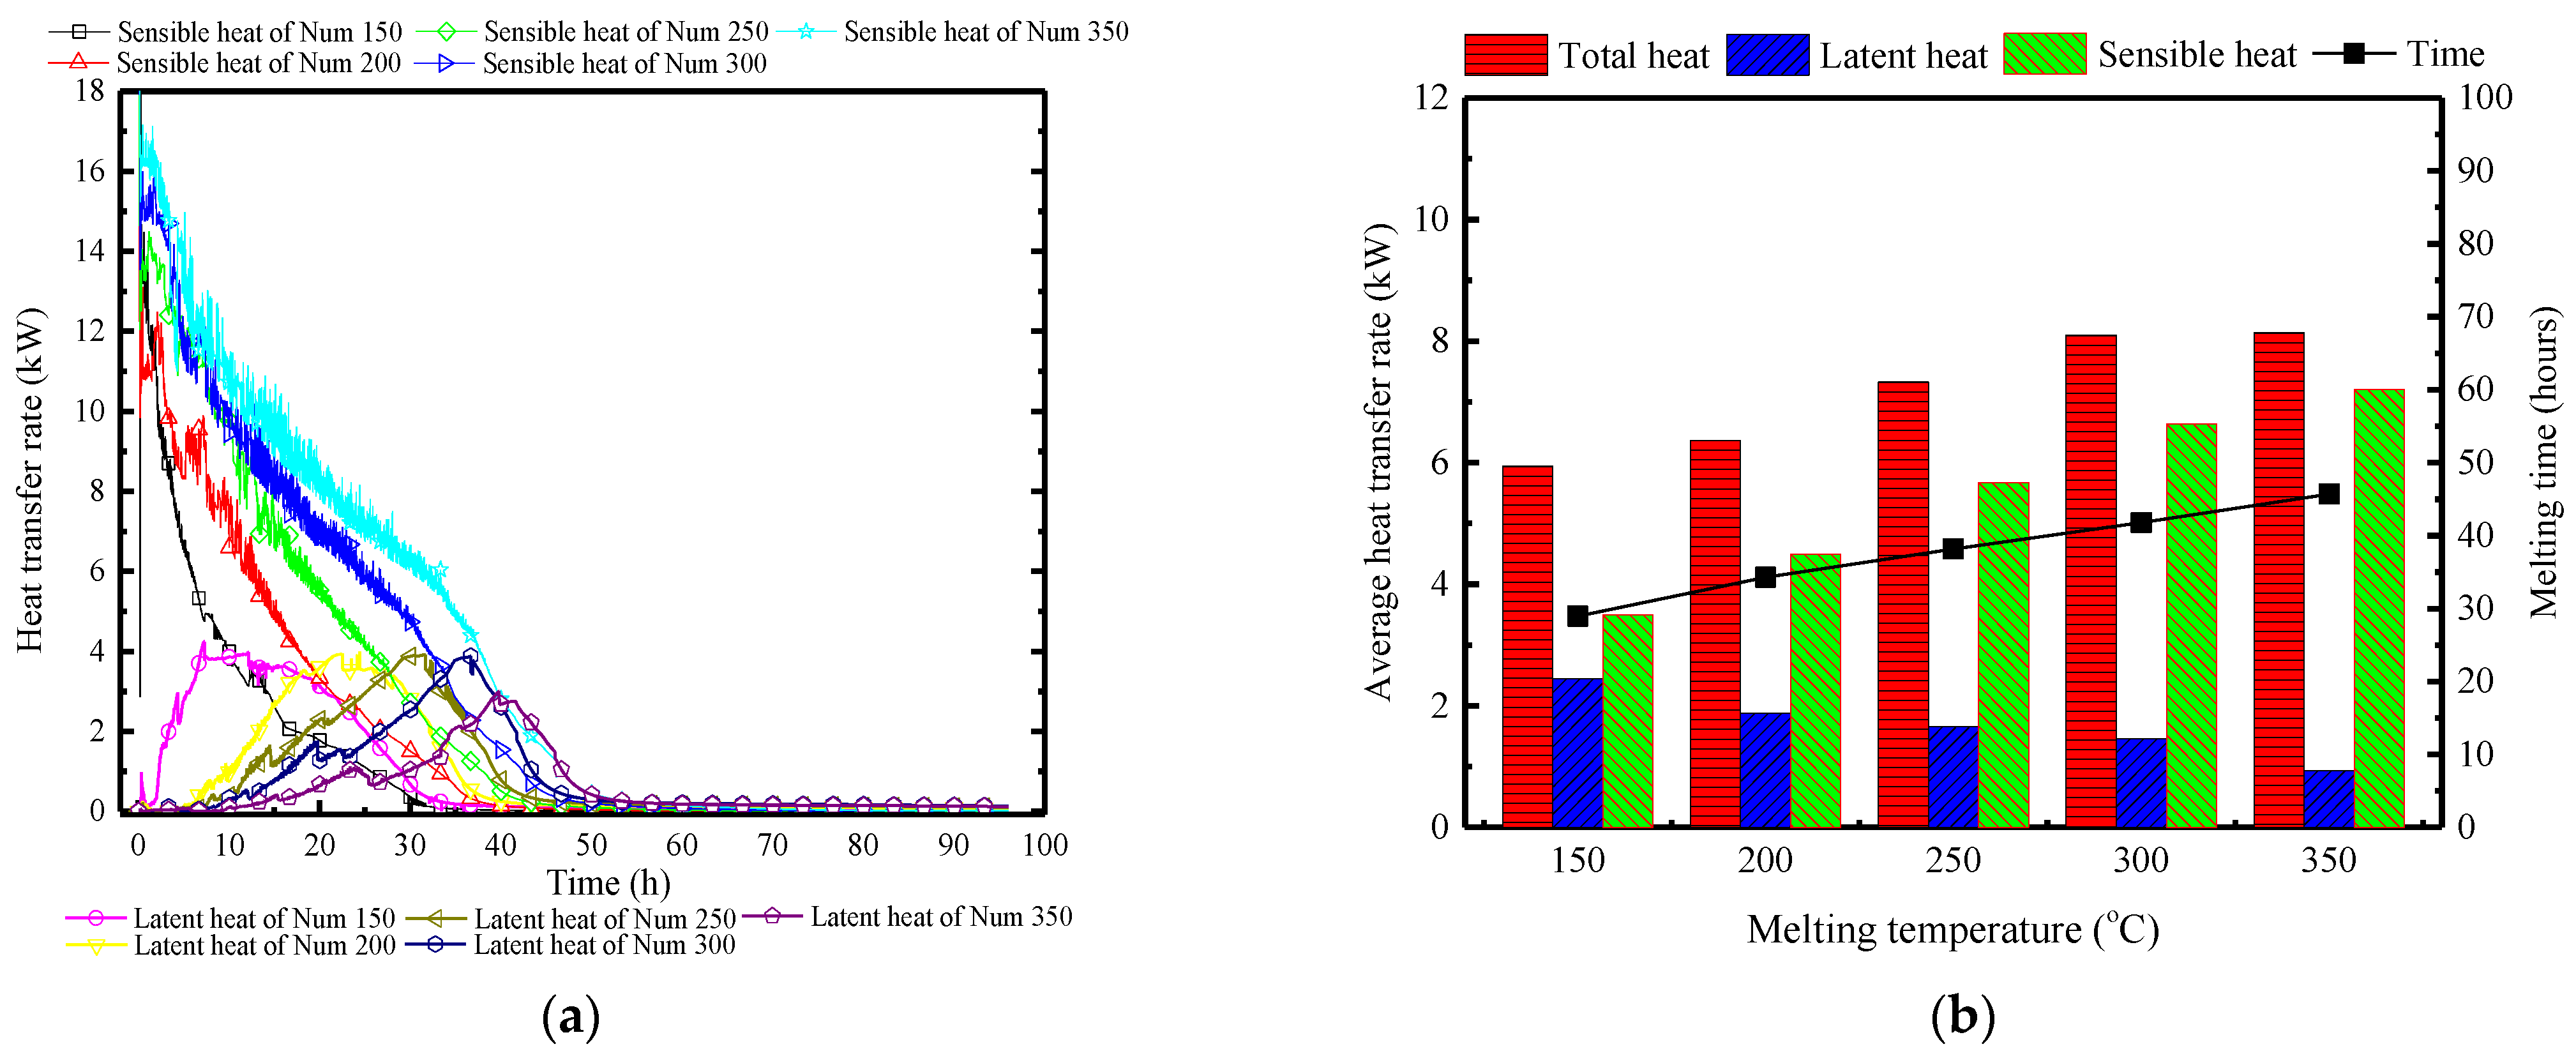
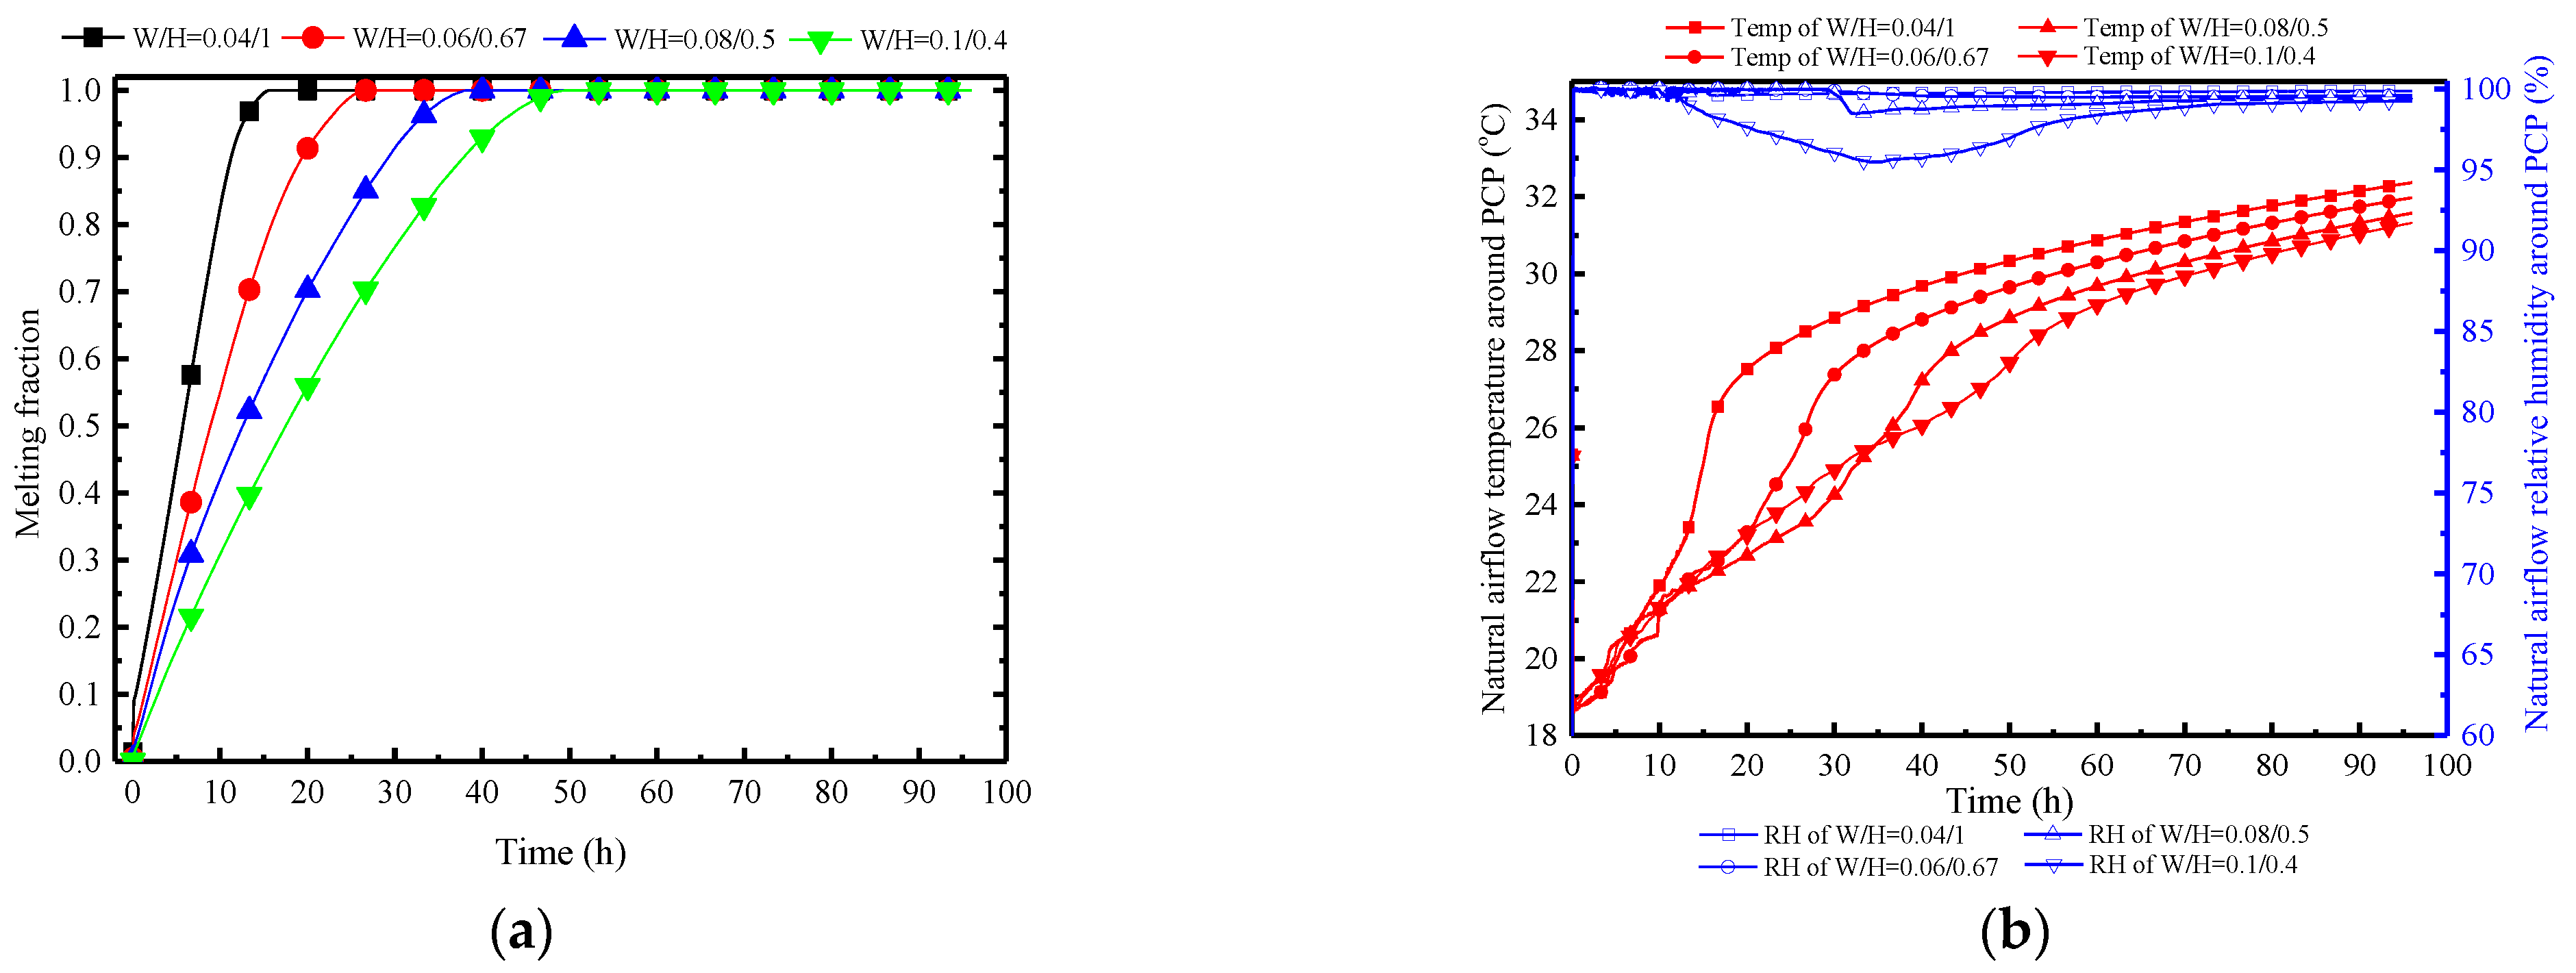
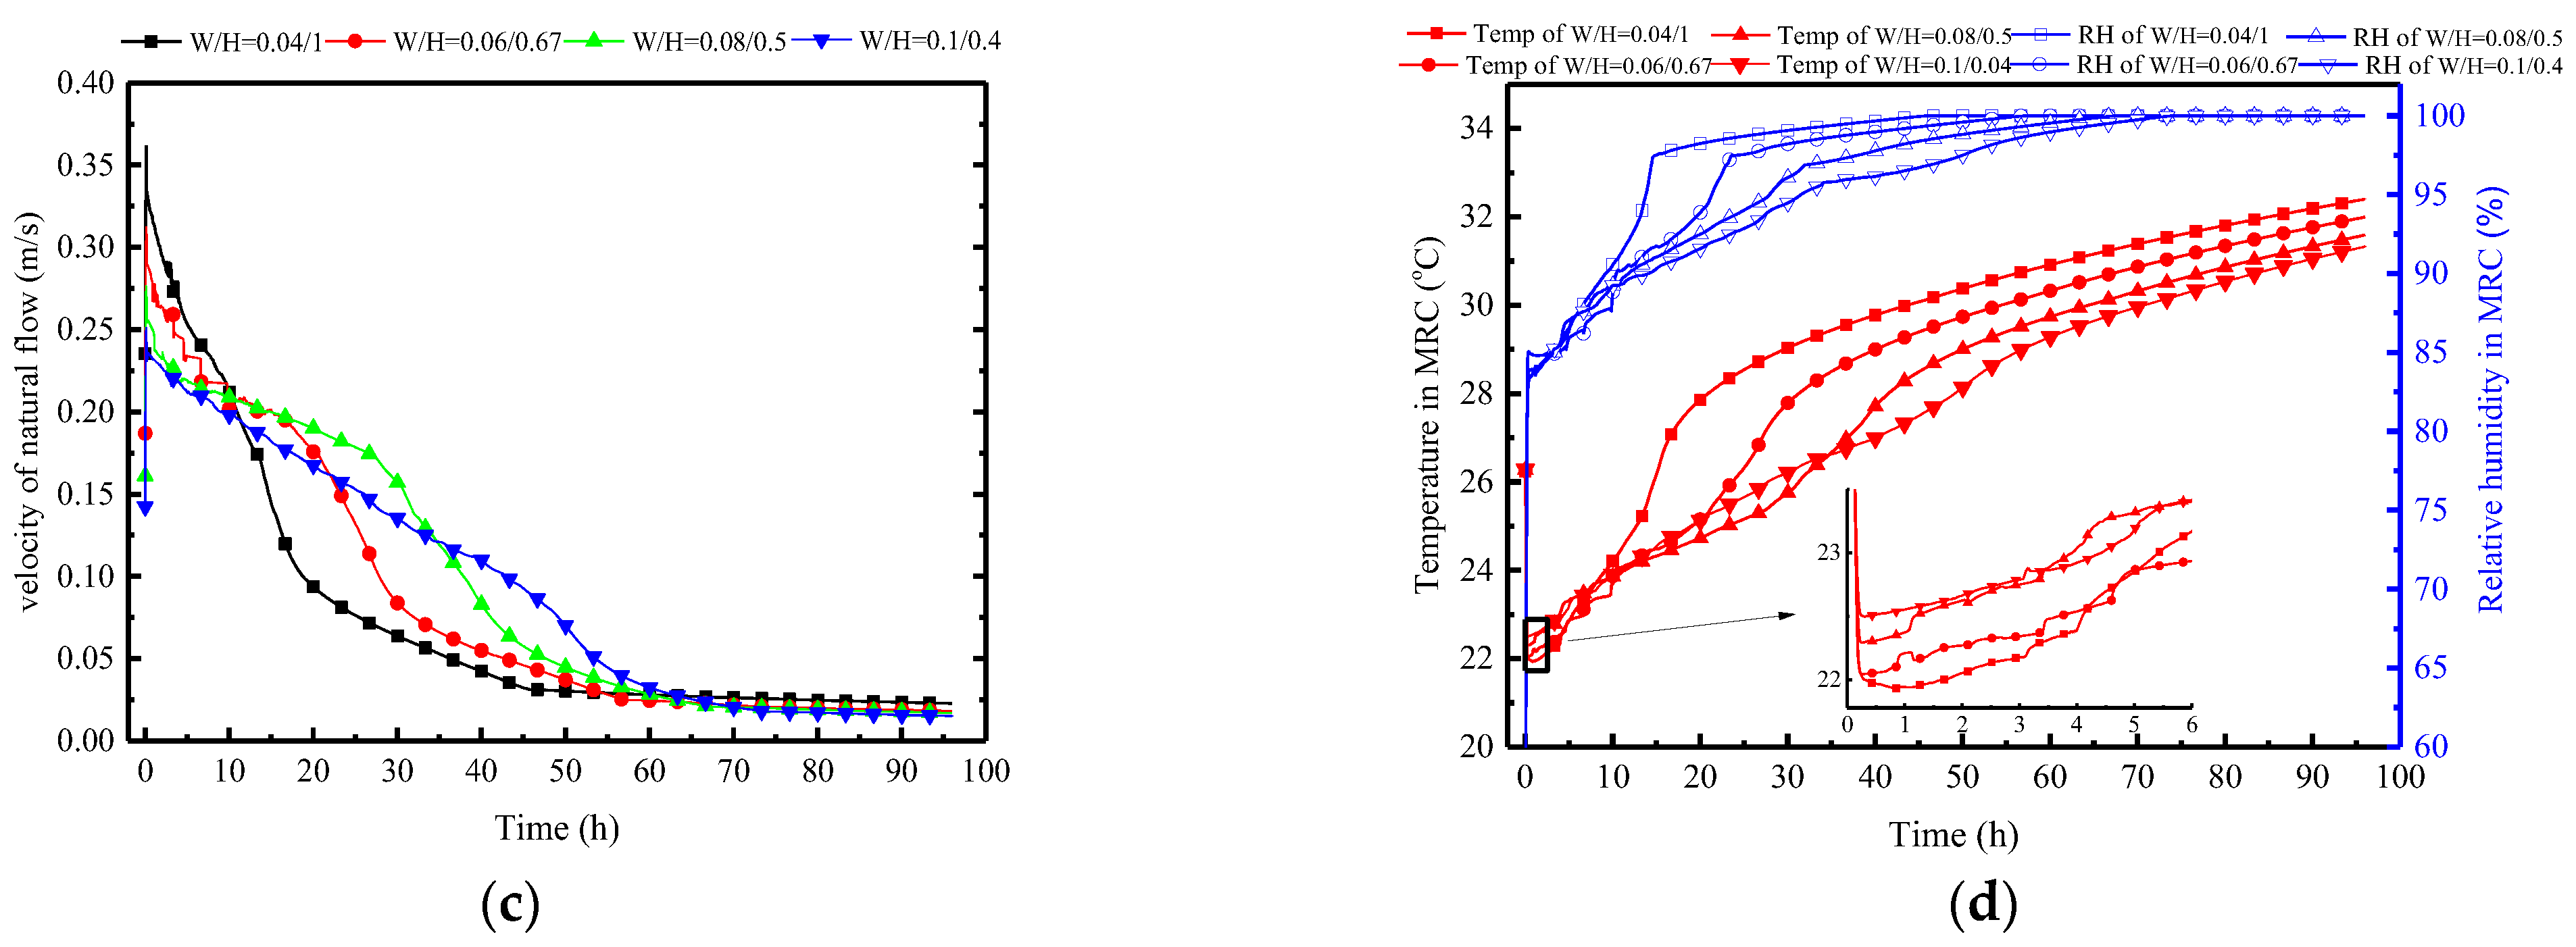
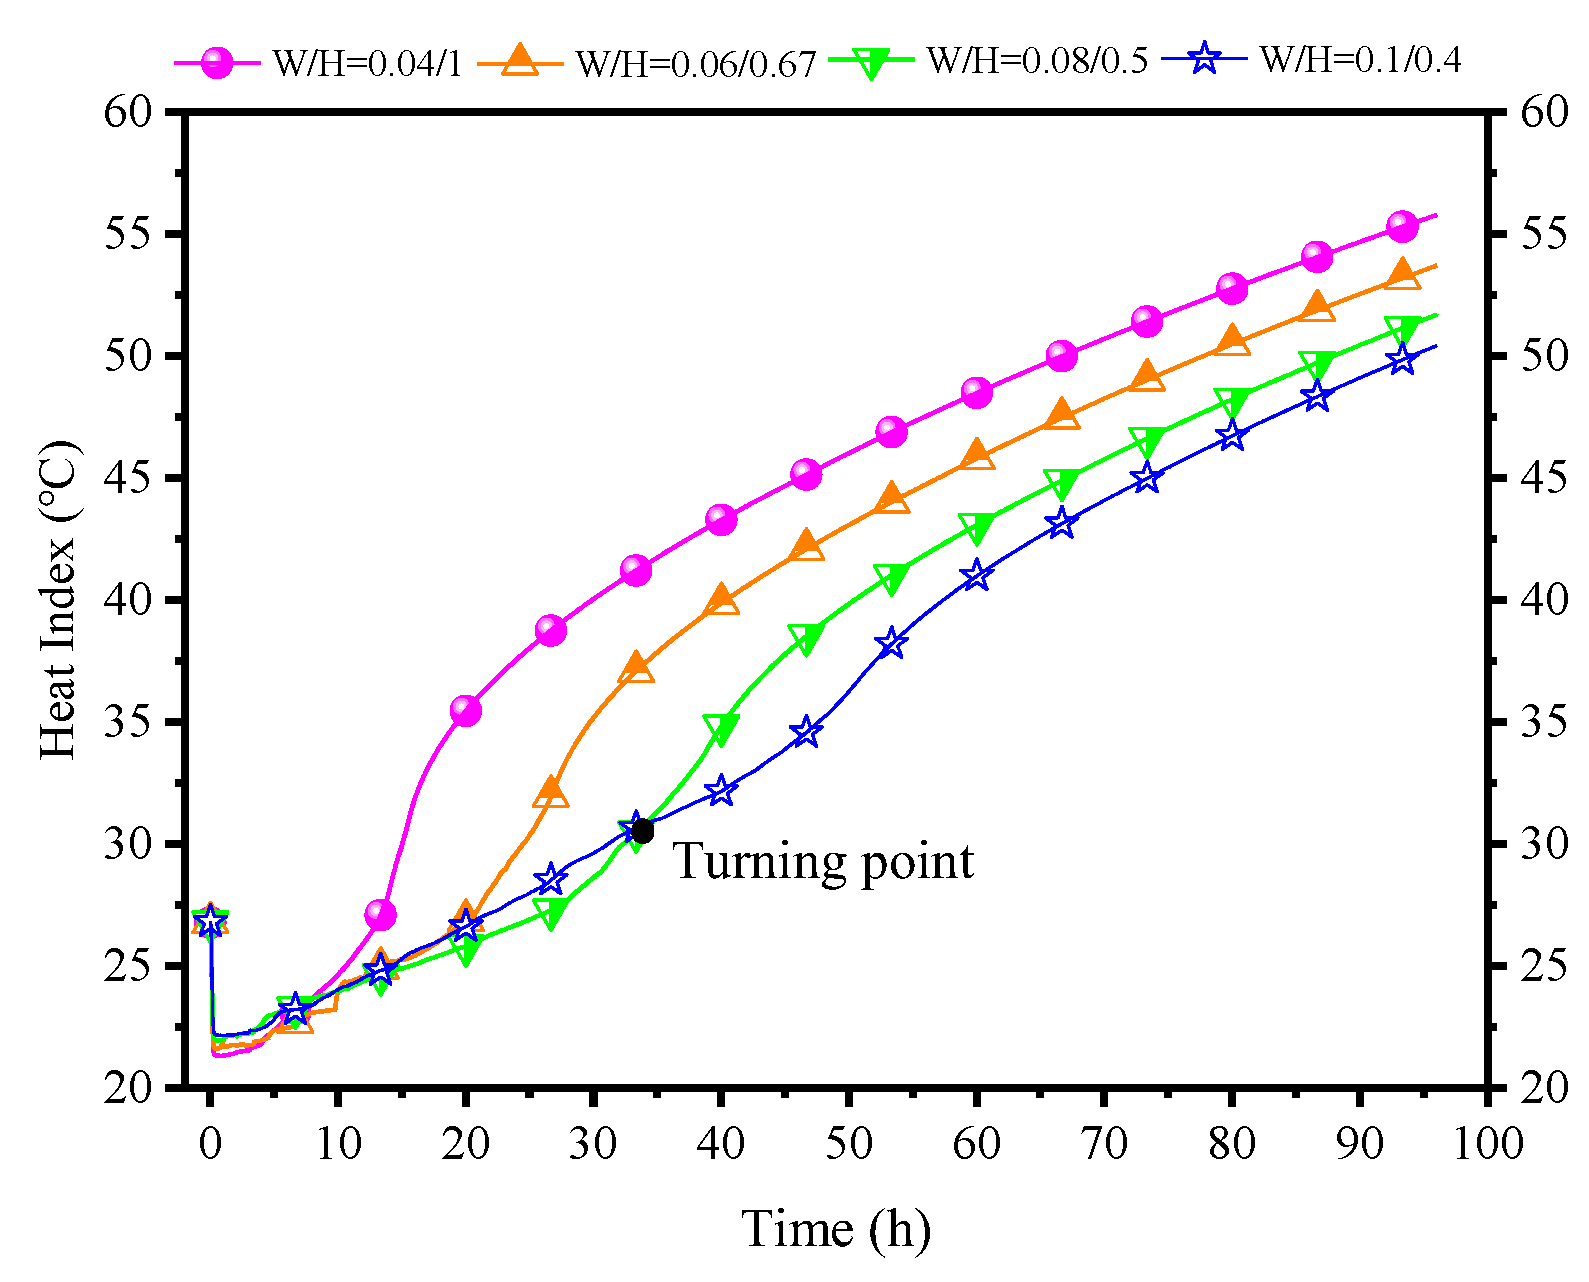
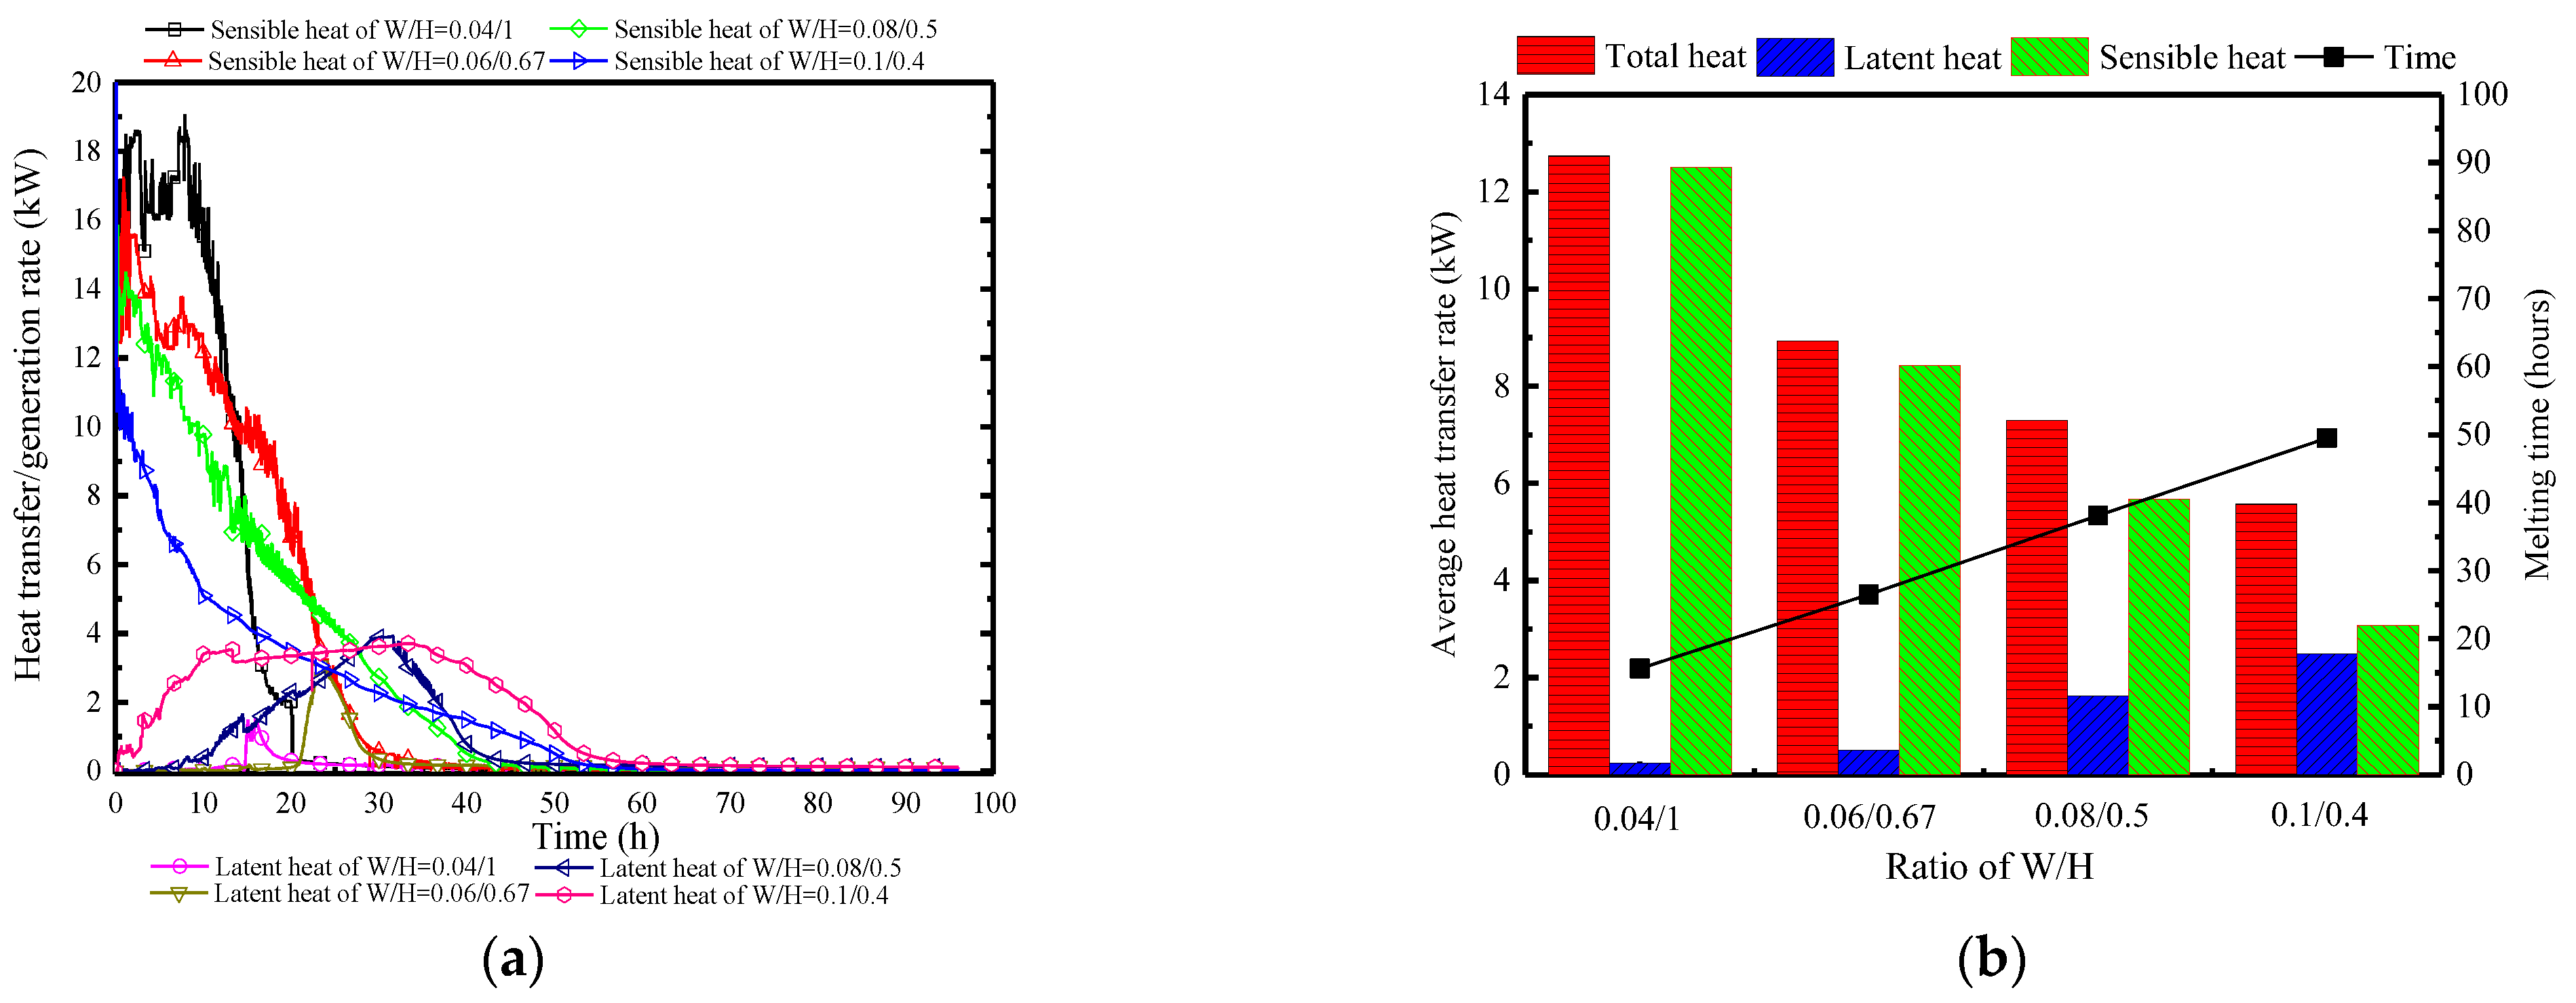
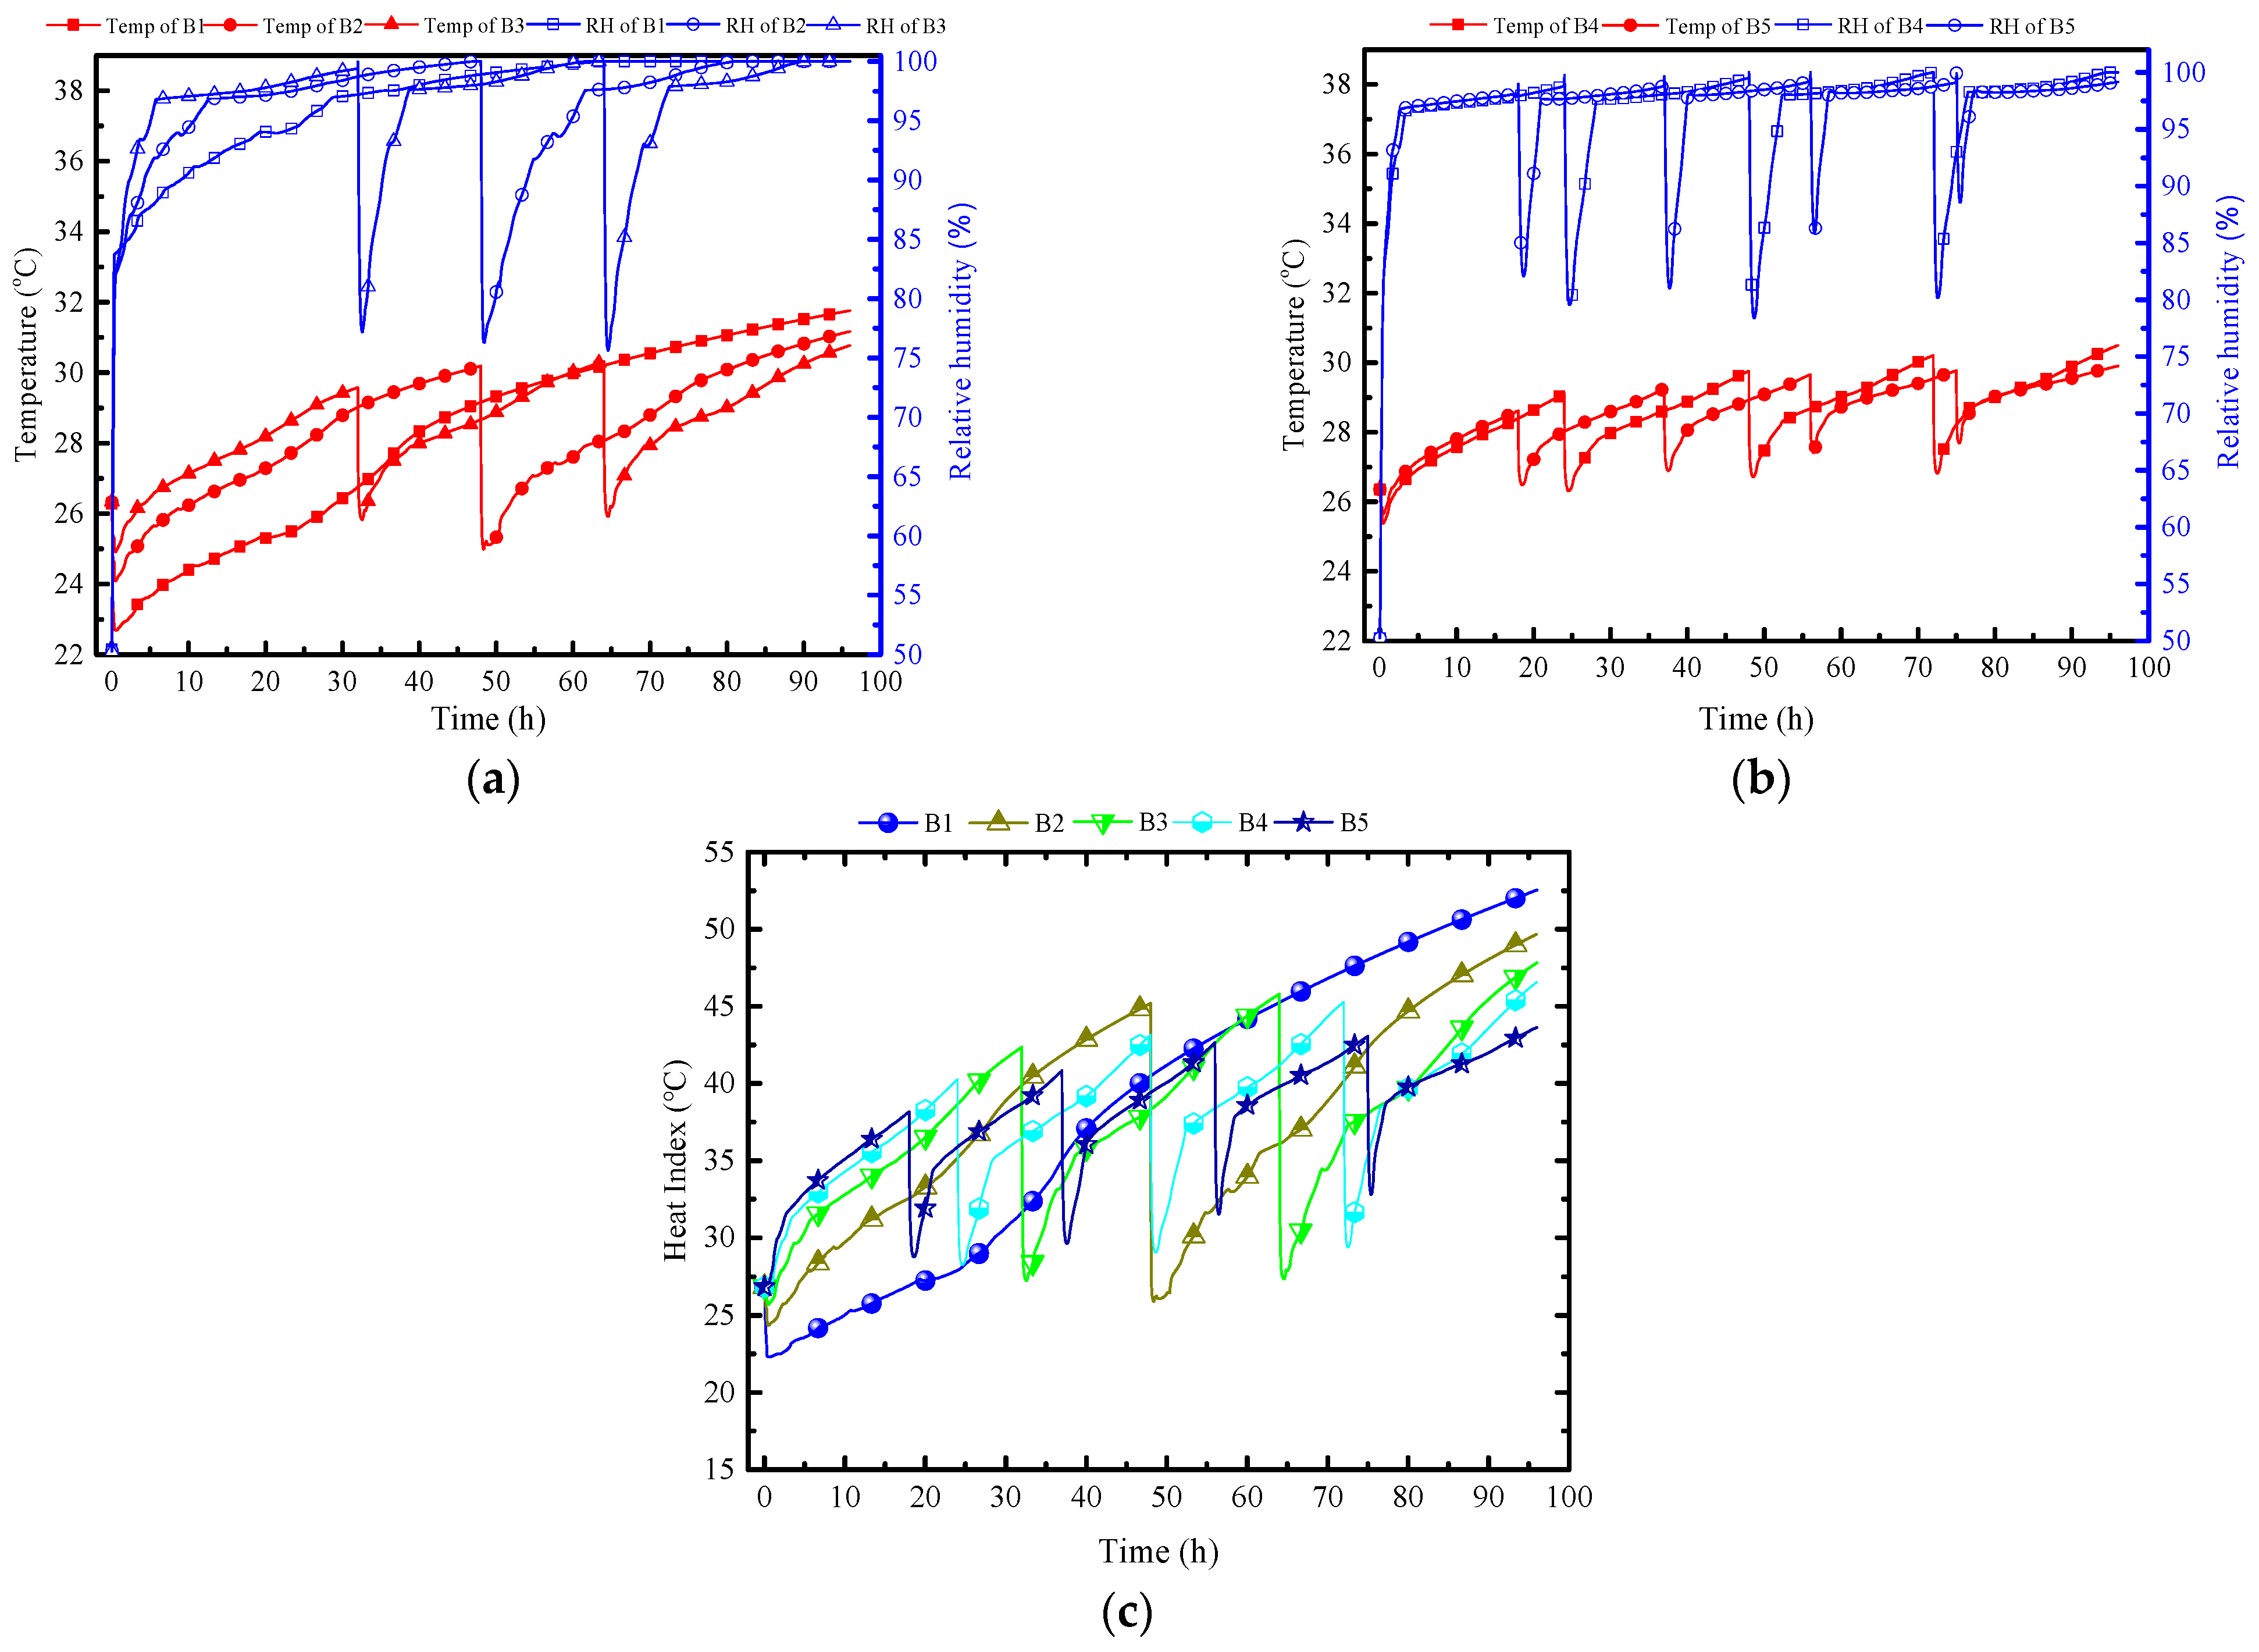
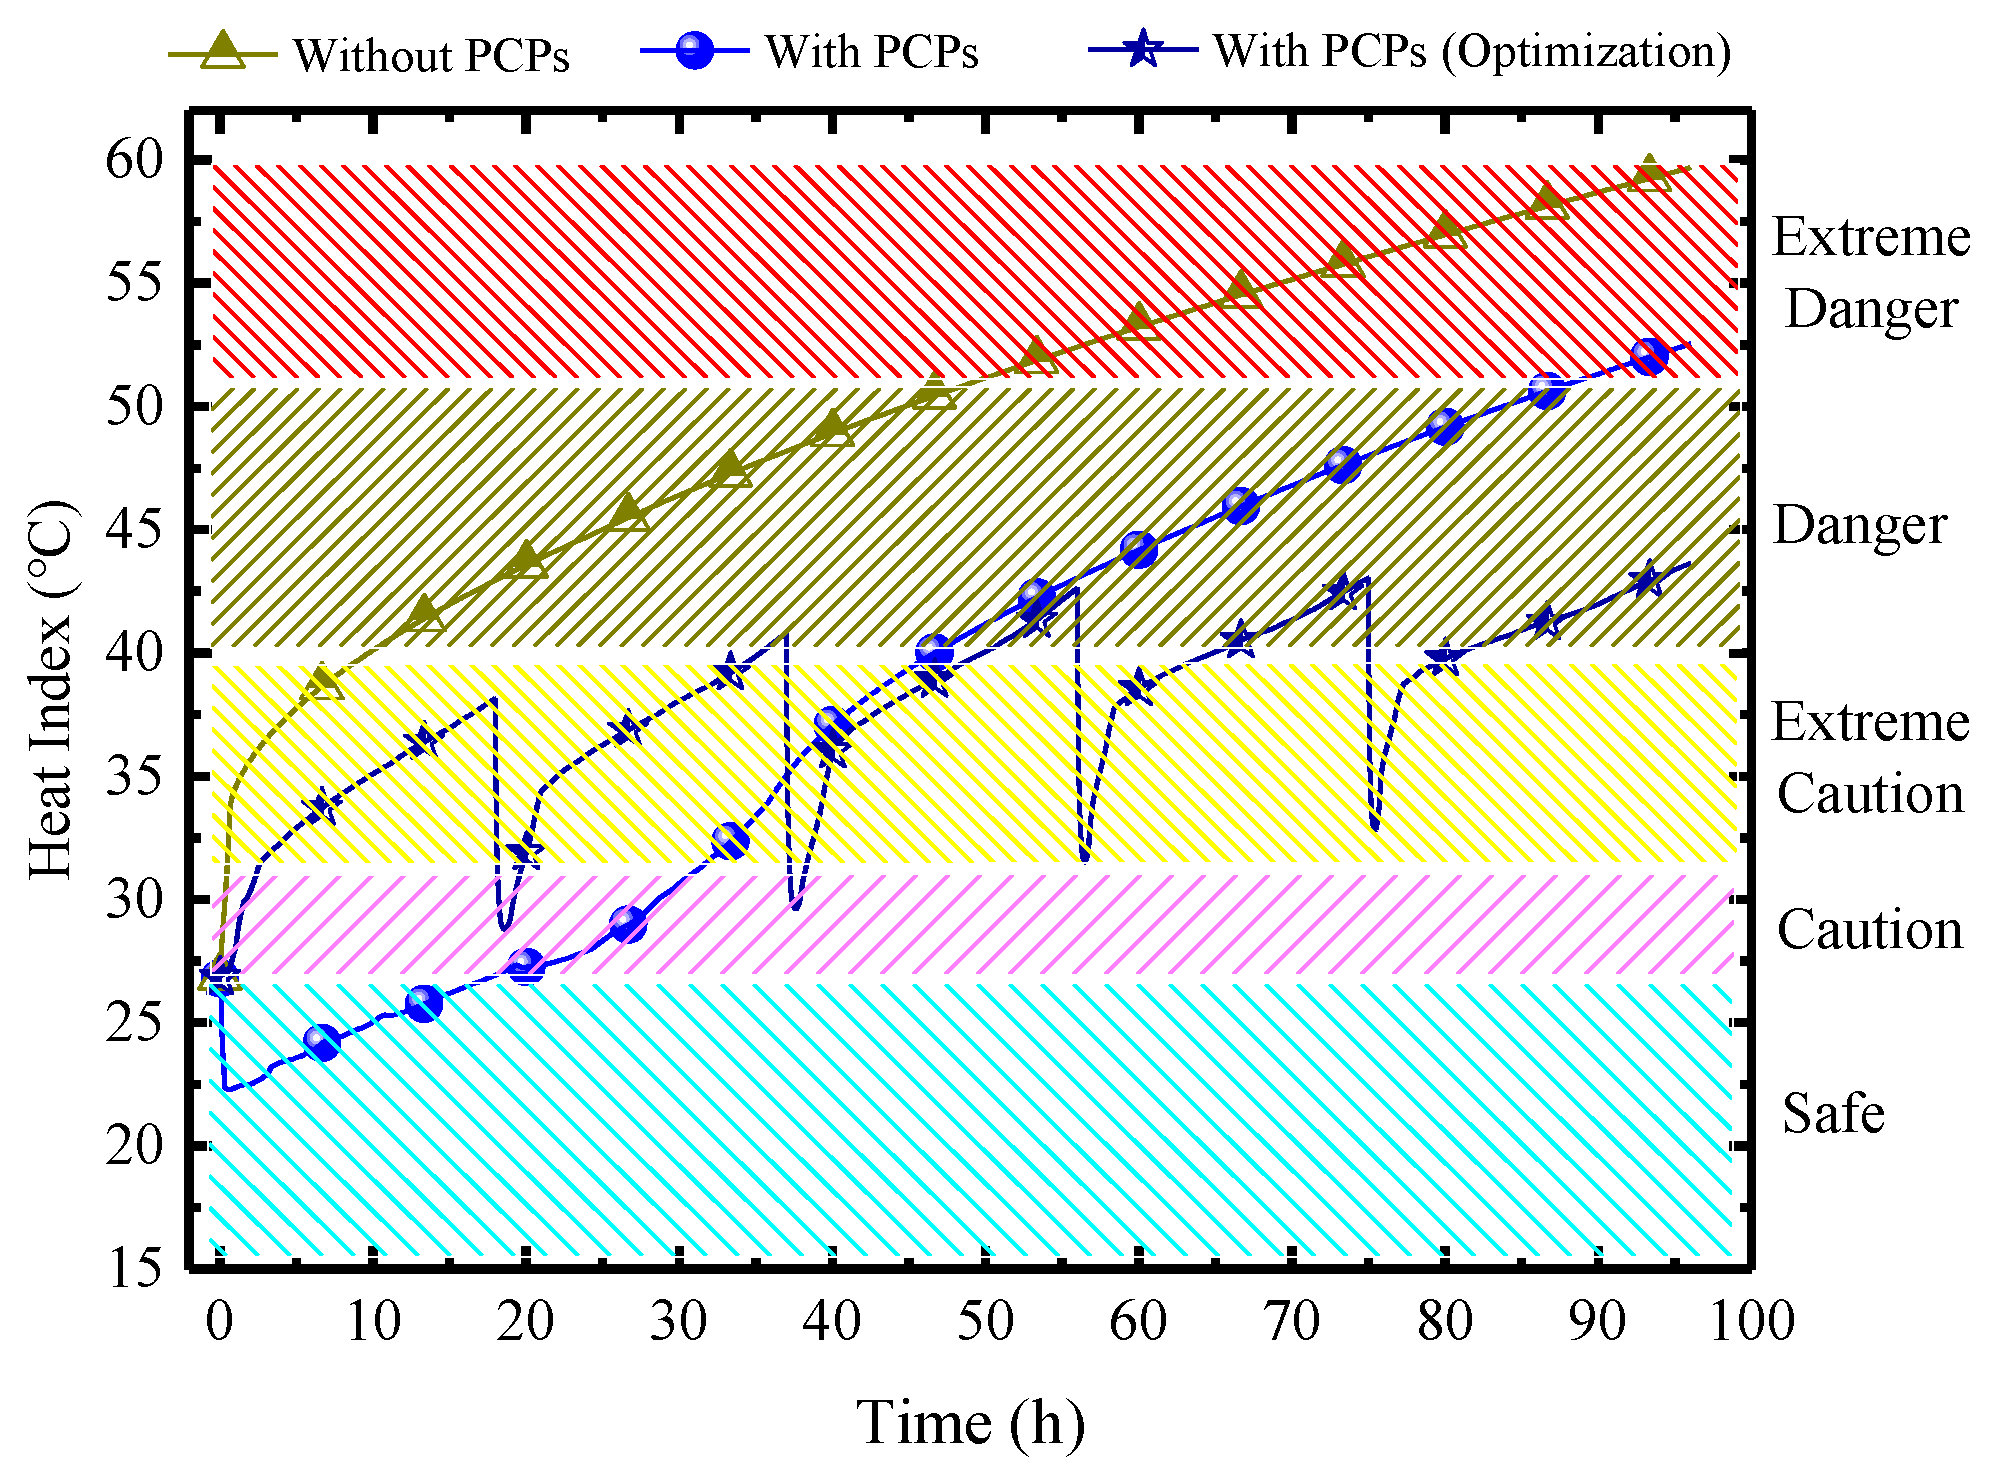
Disclaimer/Publisher’s Note: The statements, opinions and data contained in all publications are solely those of the individual author(s) and contributor(s) and not of MDPI and/or the editor(s). MDPI and/or the editor(s) disclaim responsibility for any injury to people or property resulting from any ideas, methods, instructions or products referred to in the content. |
© 2024 by the authors. Licensee MDPI, Basel, Switzerland. This article is an open access article distributed under the terms and conditions of the Creative Commons Attribution (CC BY) license (https://creativecommons.org/licenses/by/4.0/).