
Long-Term Analysis of Energy Consumption and Thermal Comfort in a Passivhaus Apartment in Spain


Abstract
:1. Introduction
2. Materials and Methods
2.1. Description of the Case Study
2.2. Monitoring and Data Collection
2.3. Comfort Analysis
2.4. Energy Consumption Data
3. Results
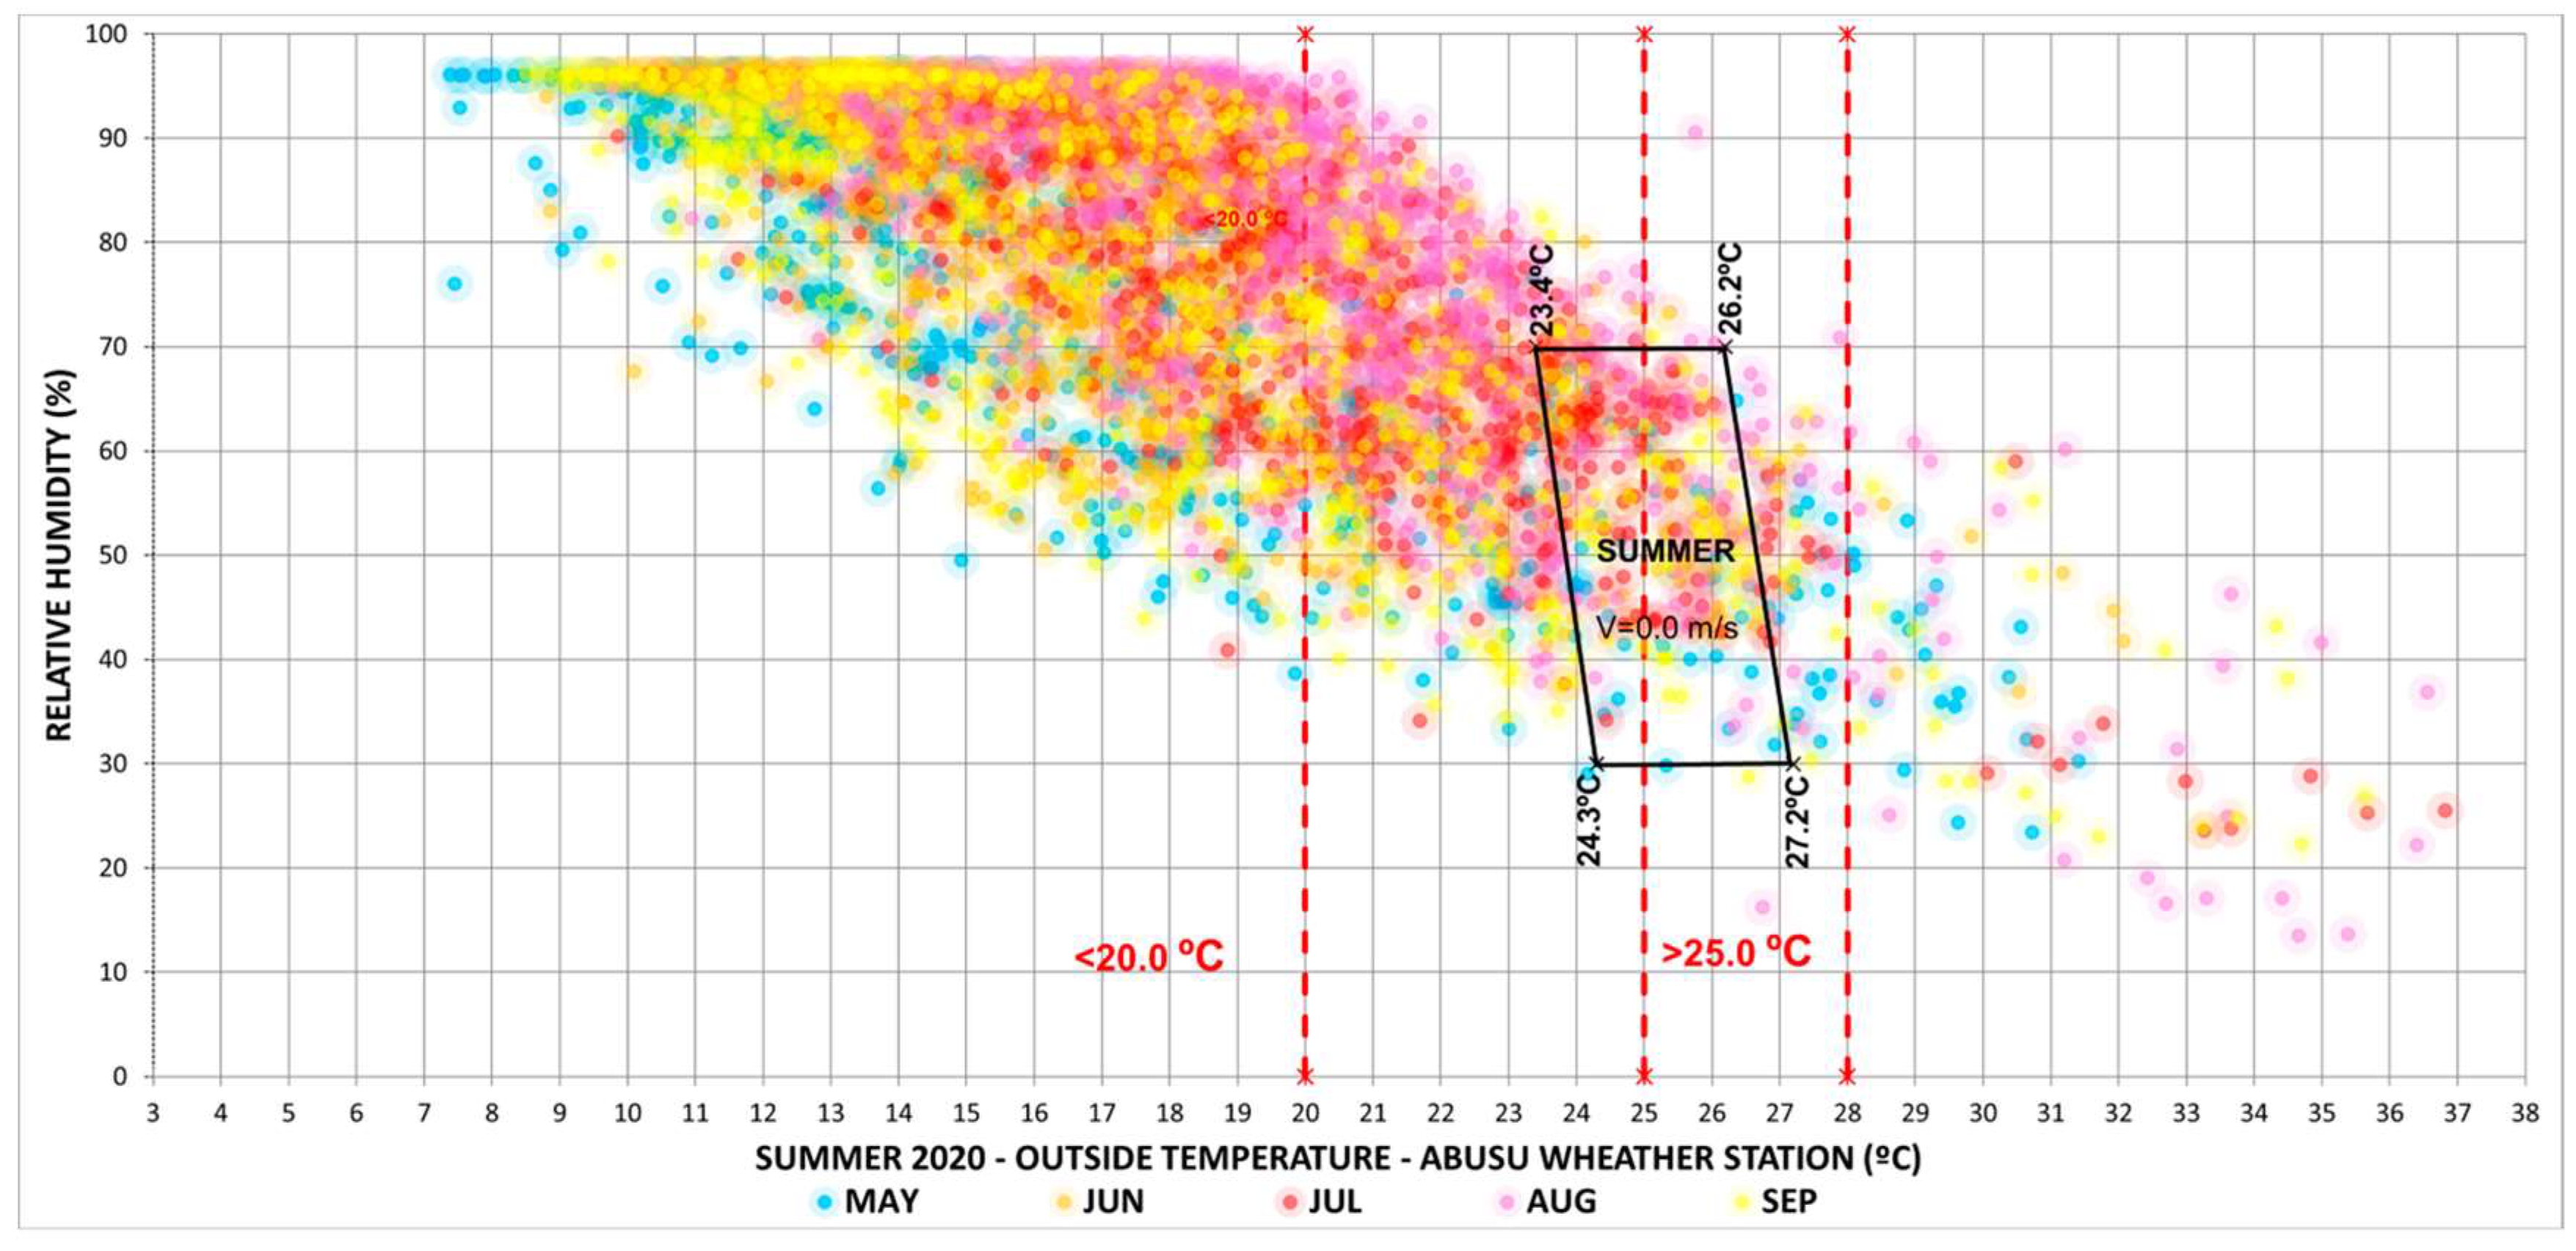
3.1. Exterior Climate
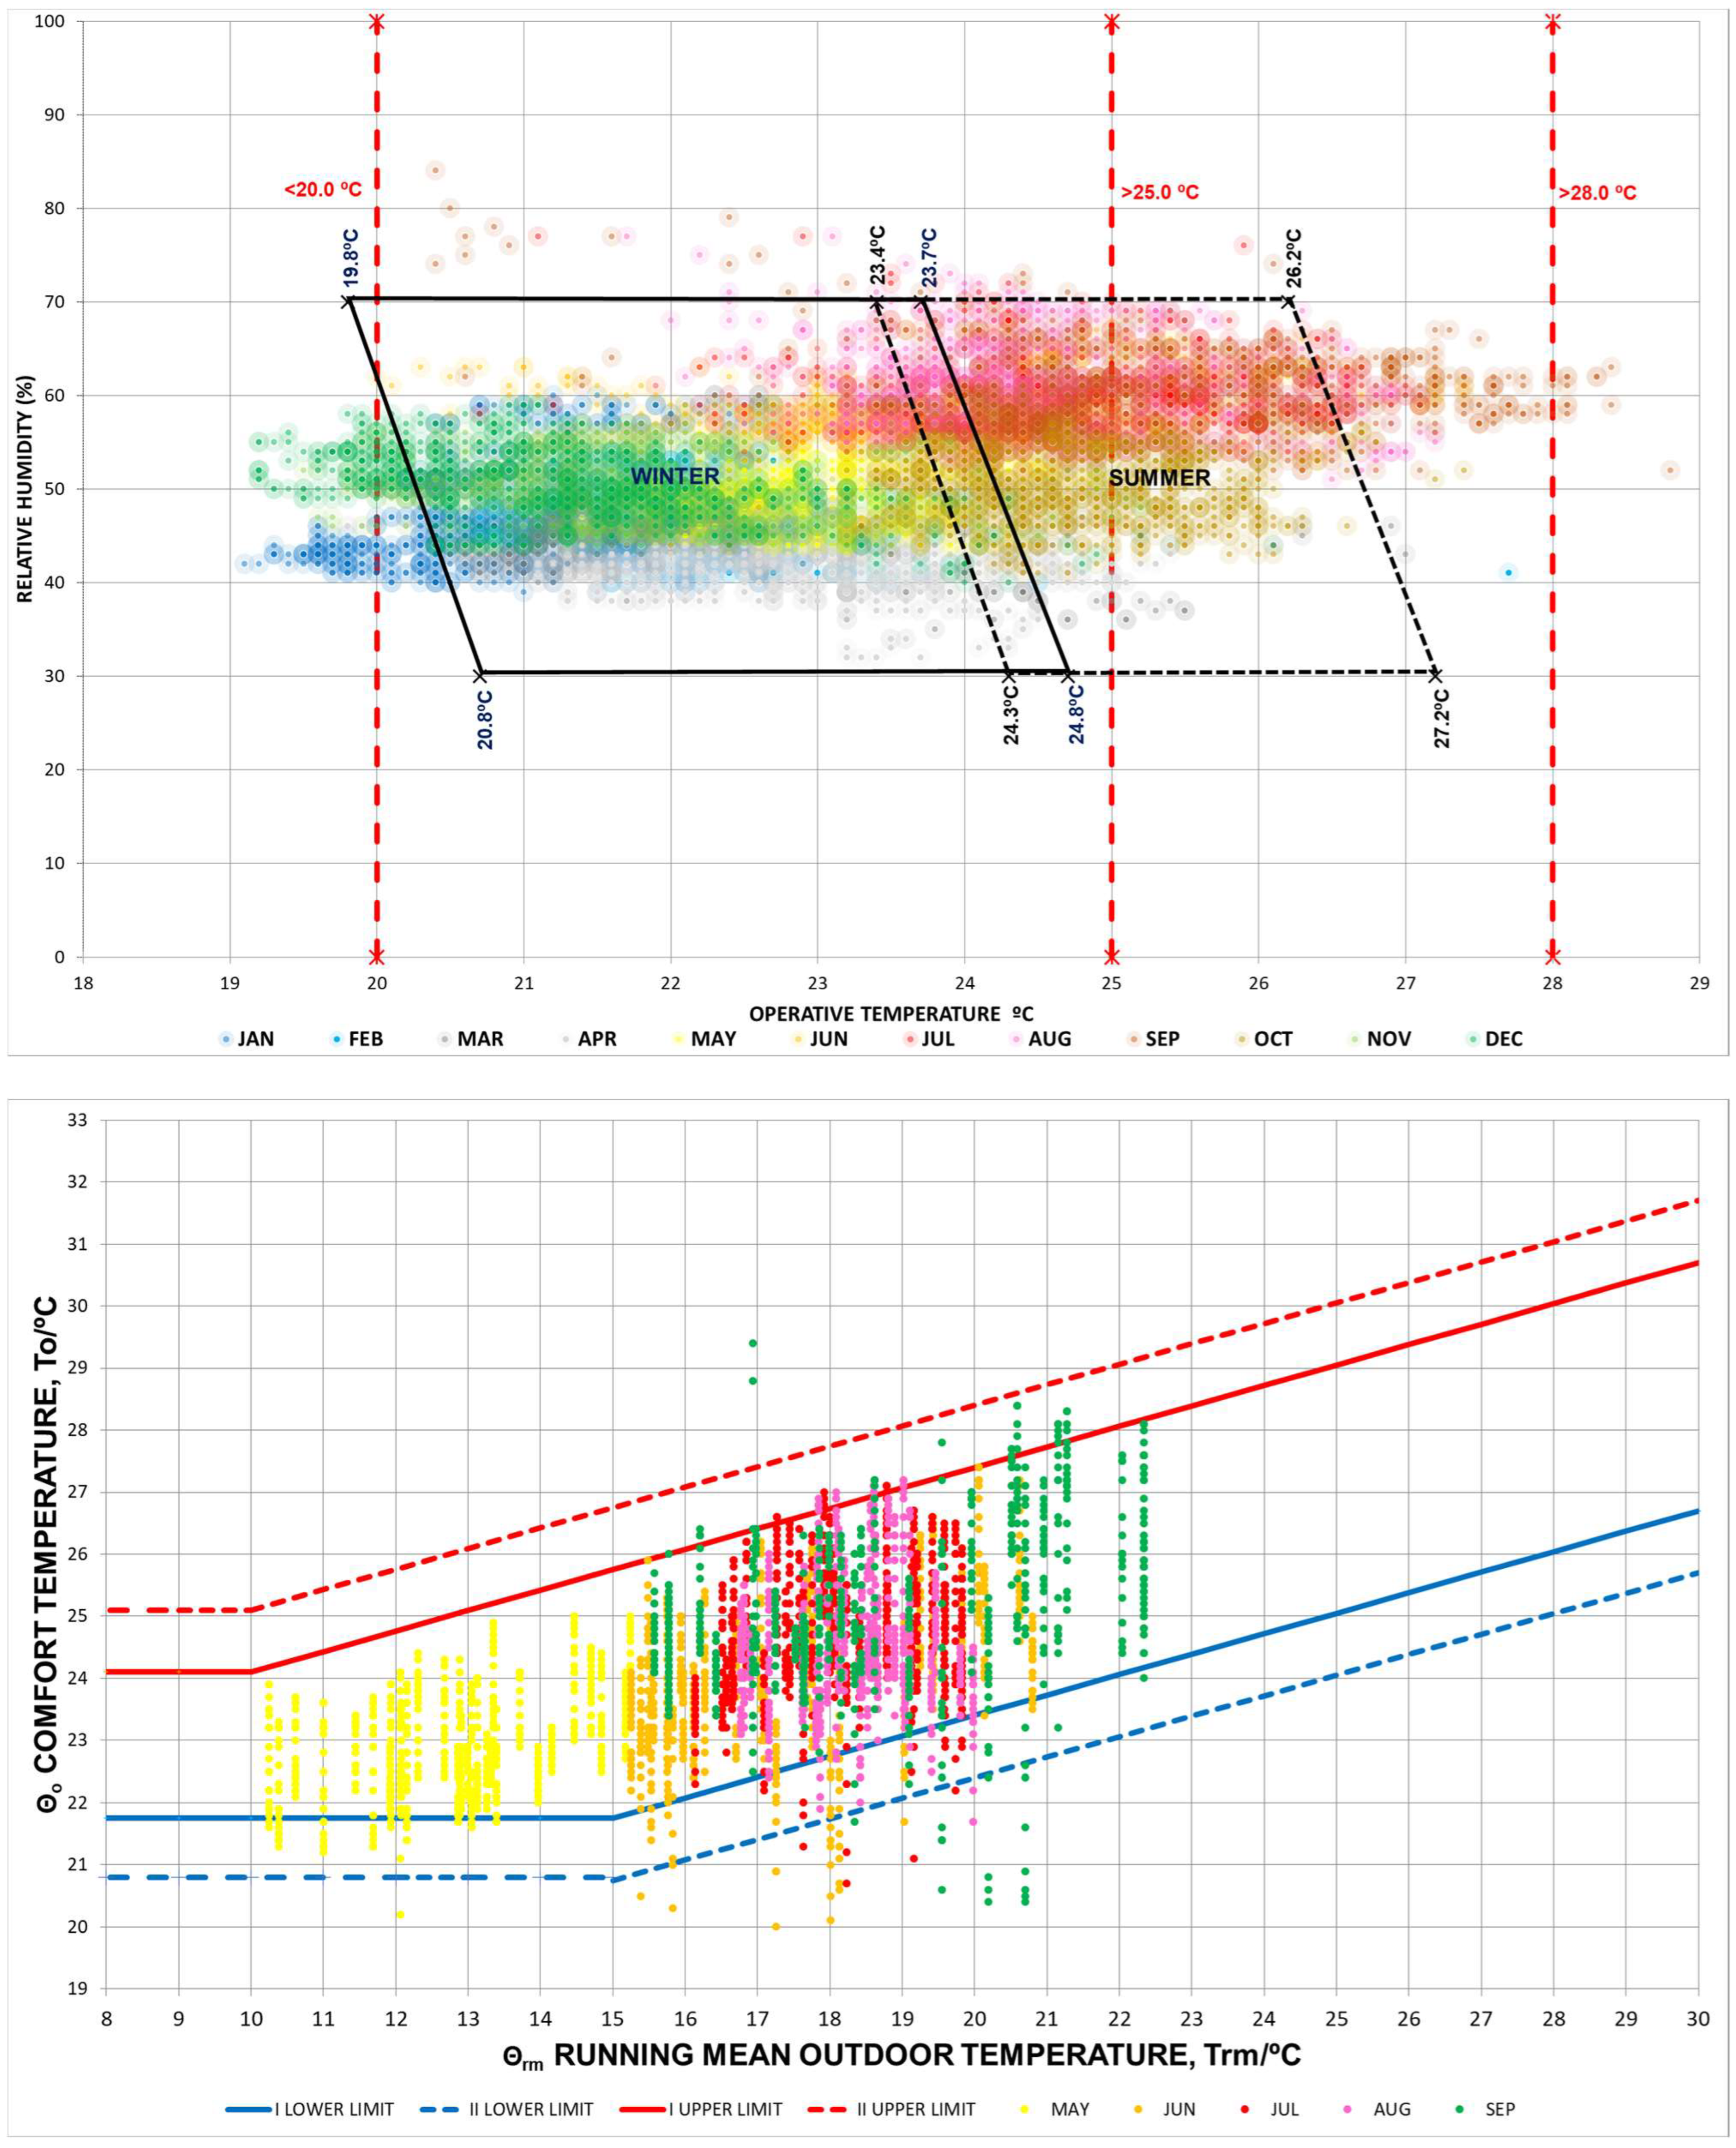
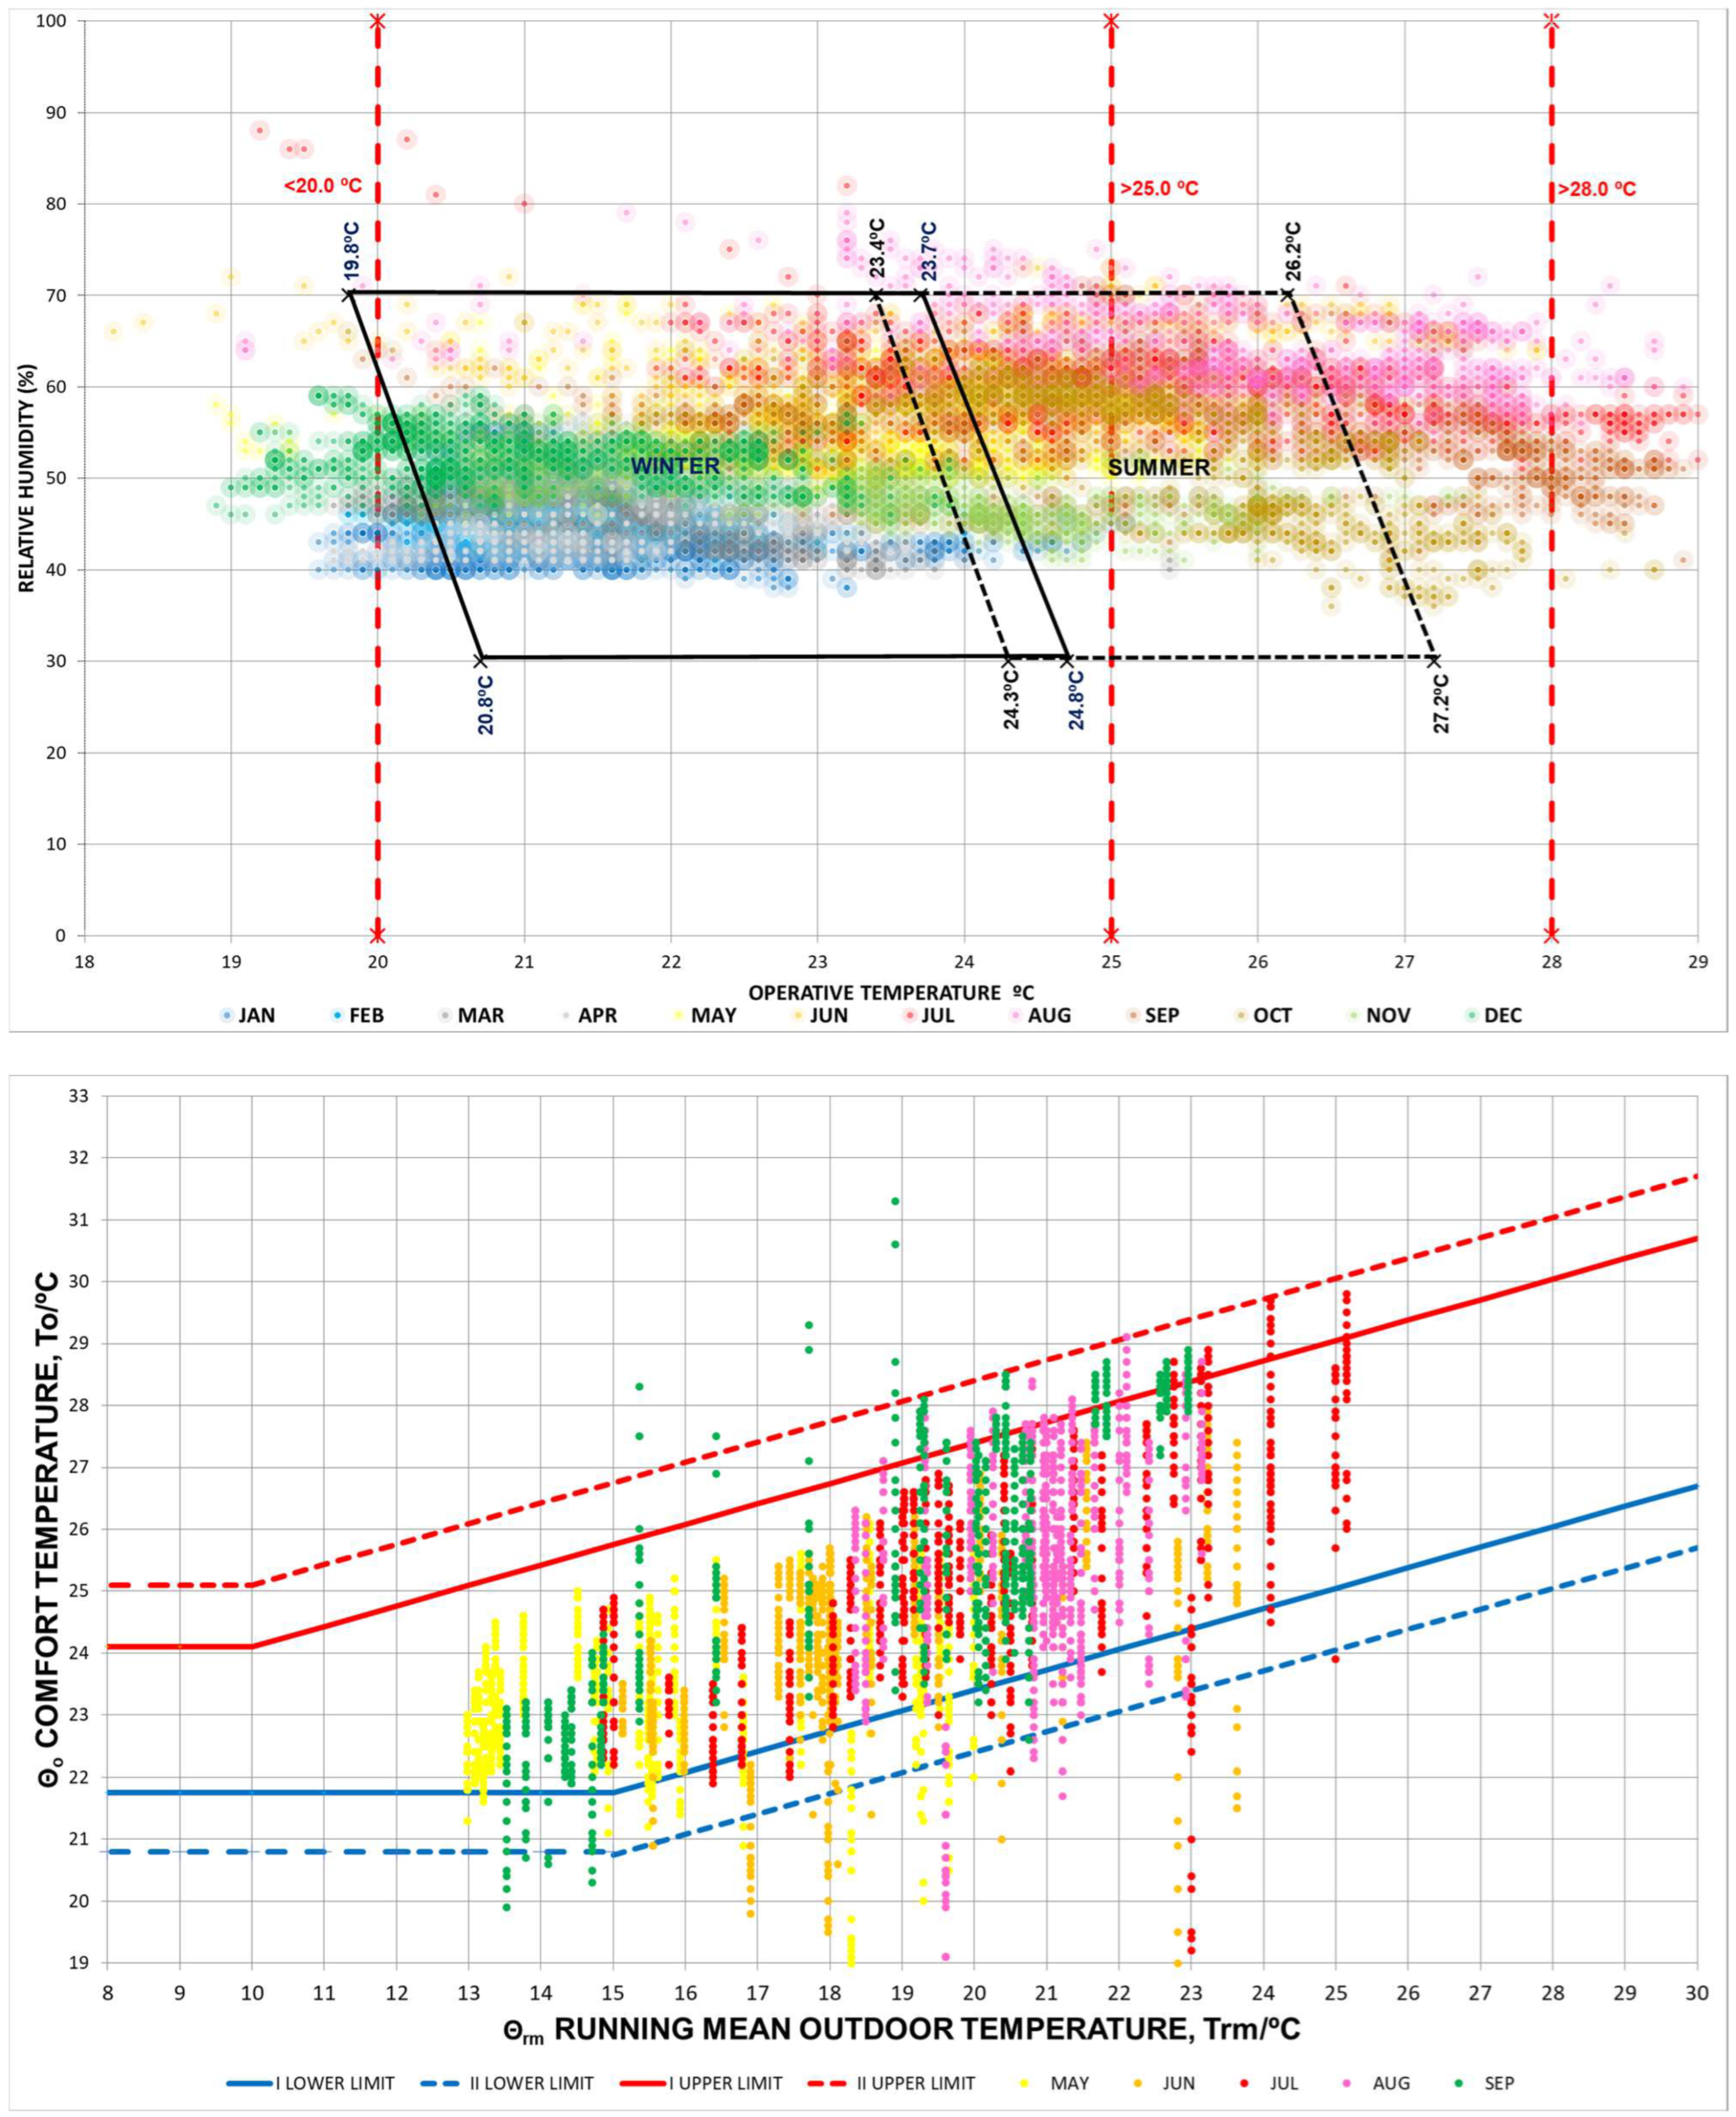
3.2. Comfort Analysis
3.2.1. Temperature, Relative Humidity, and CO2 Concentration Analysis
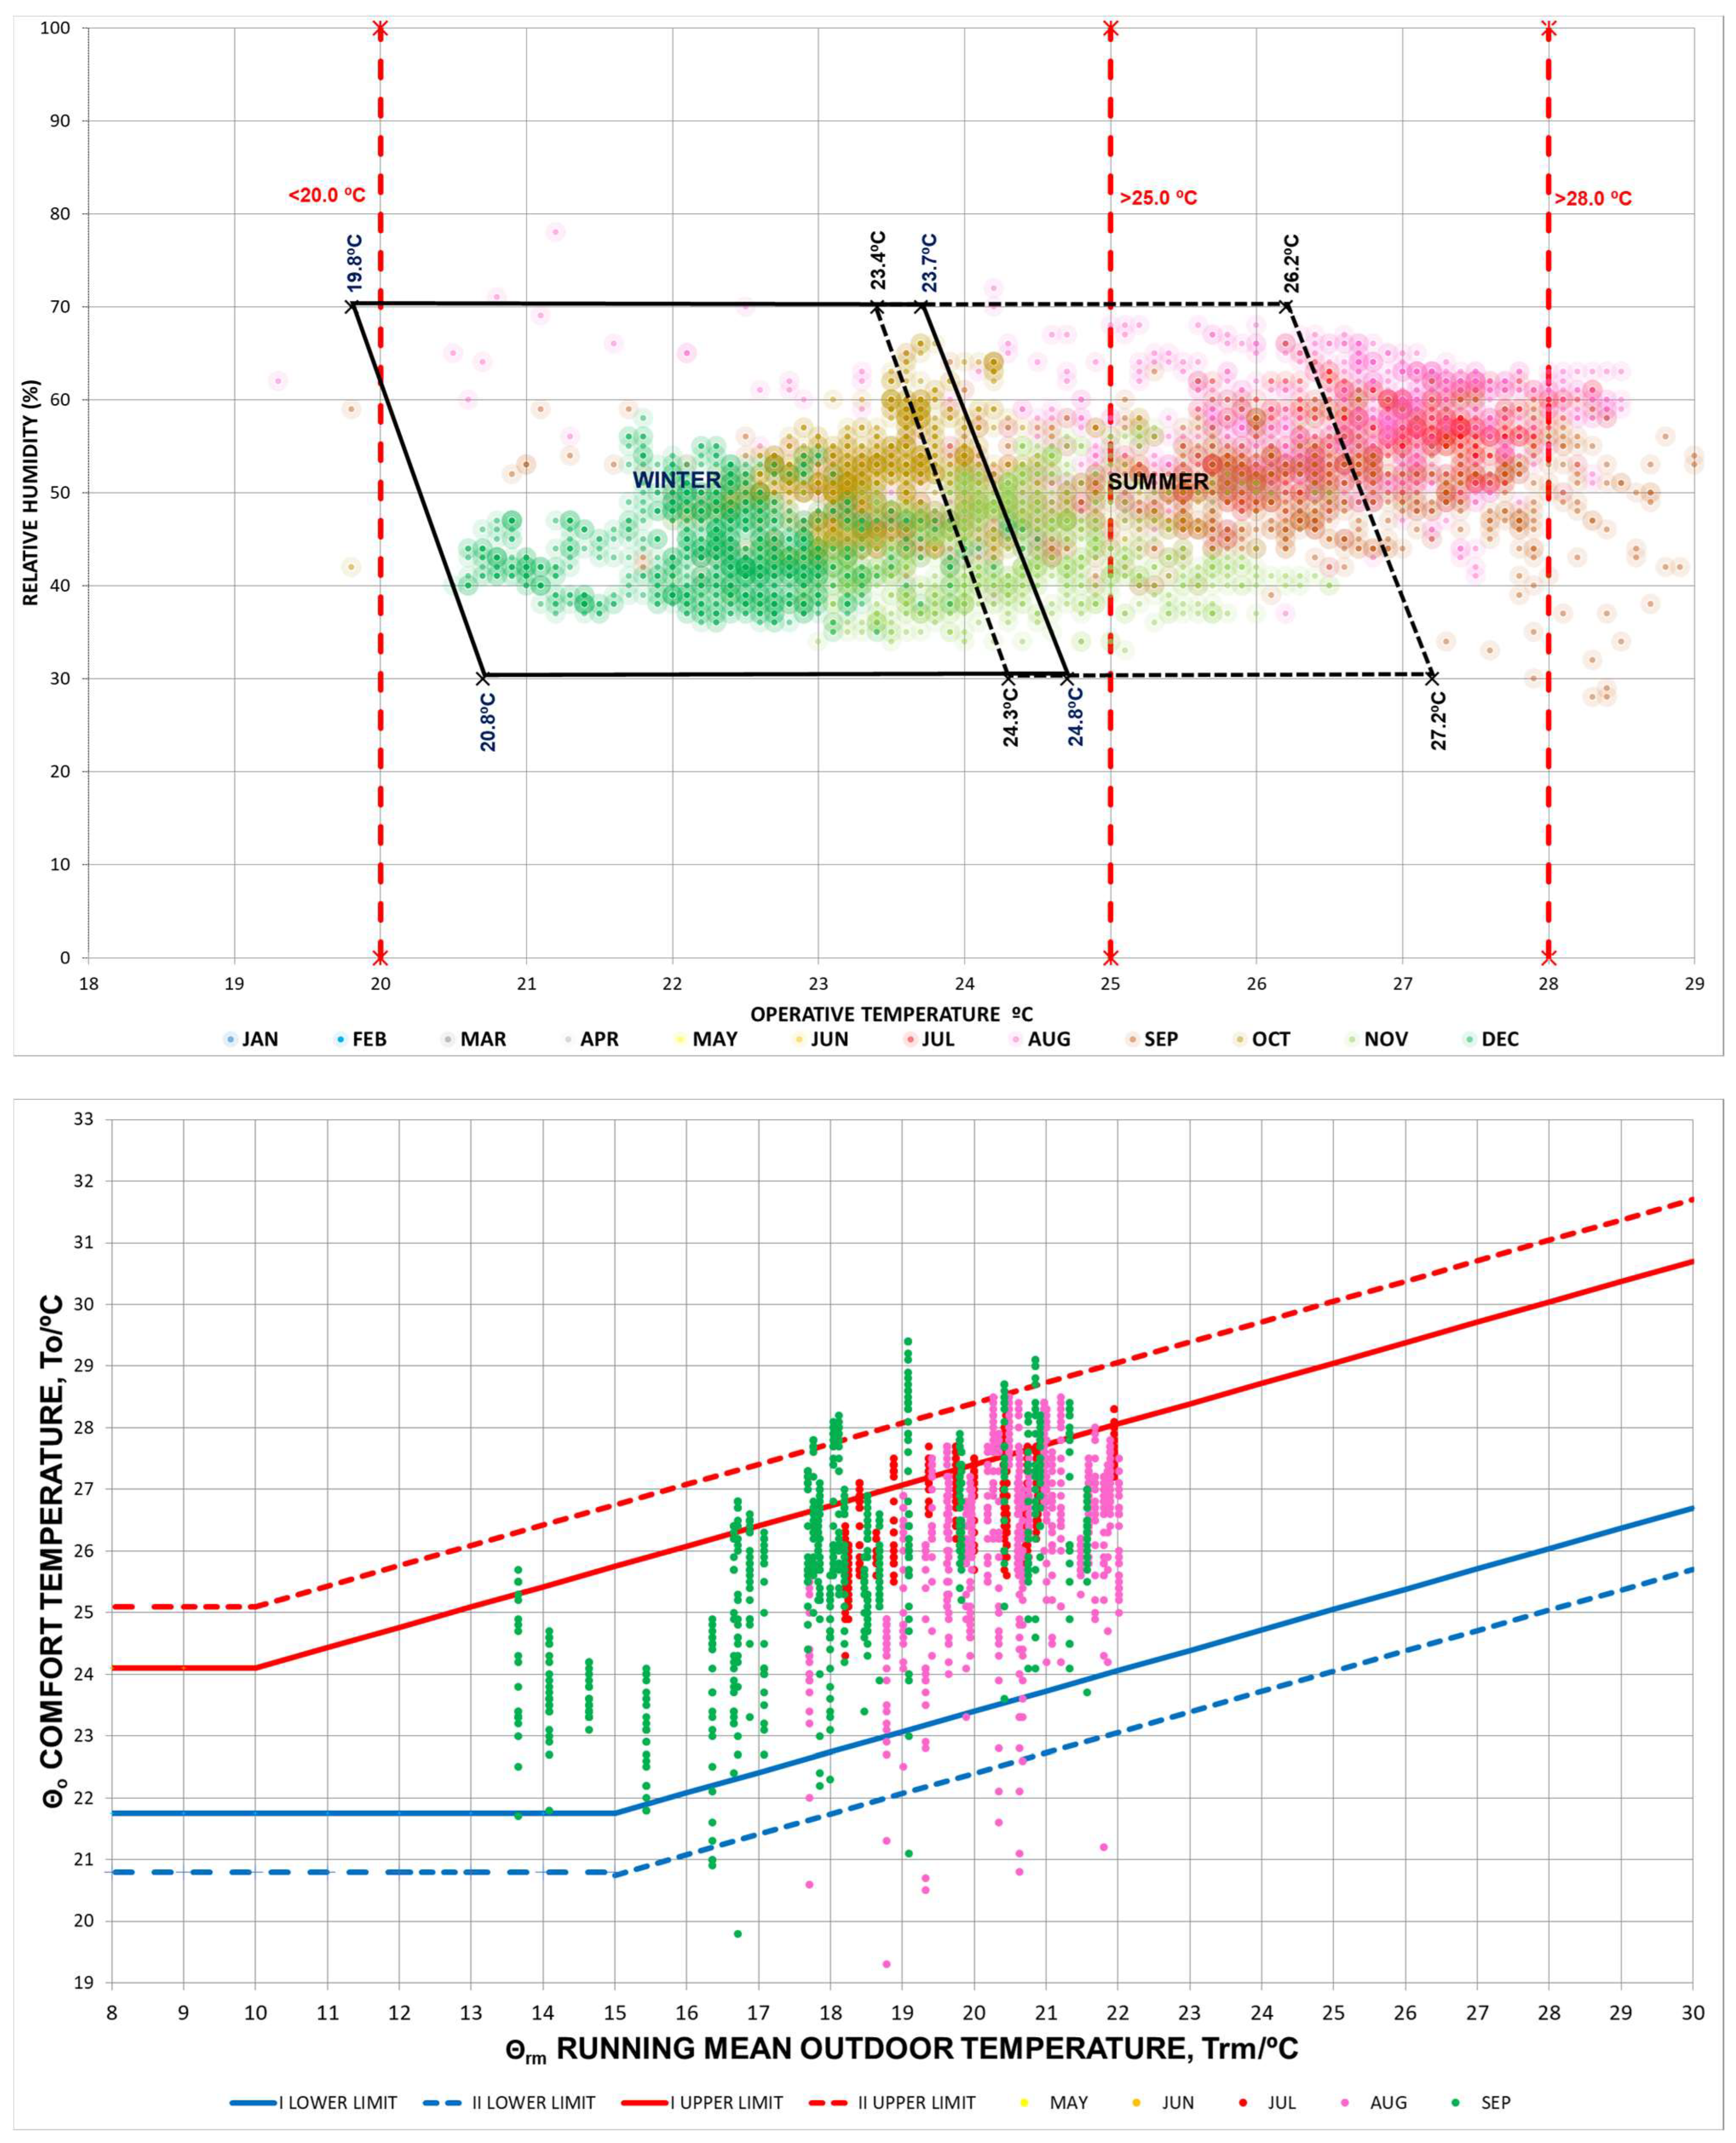
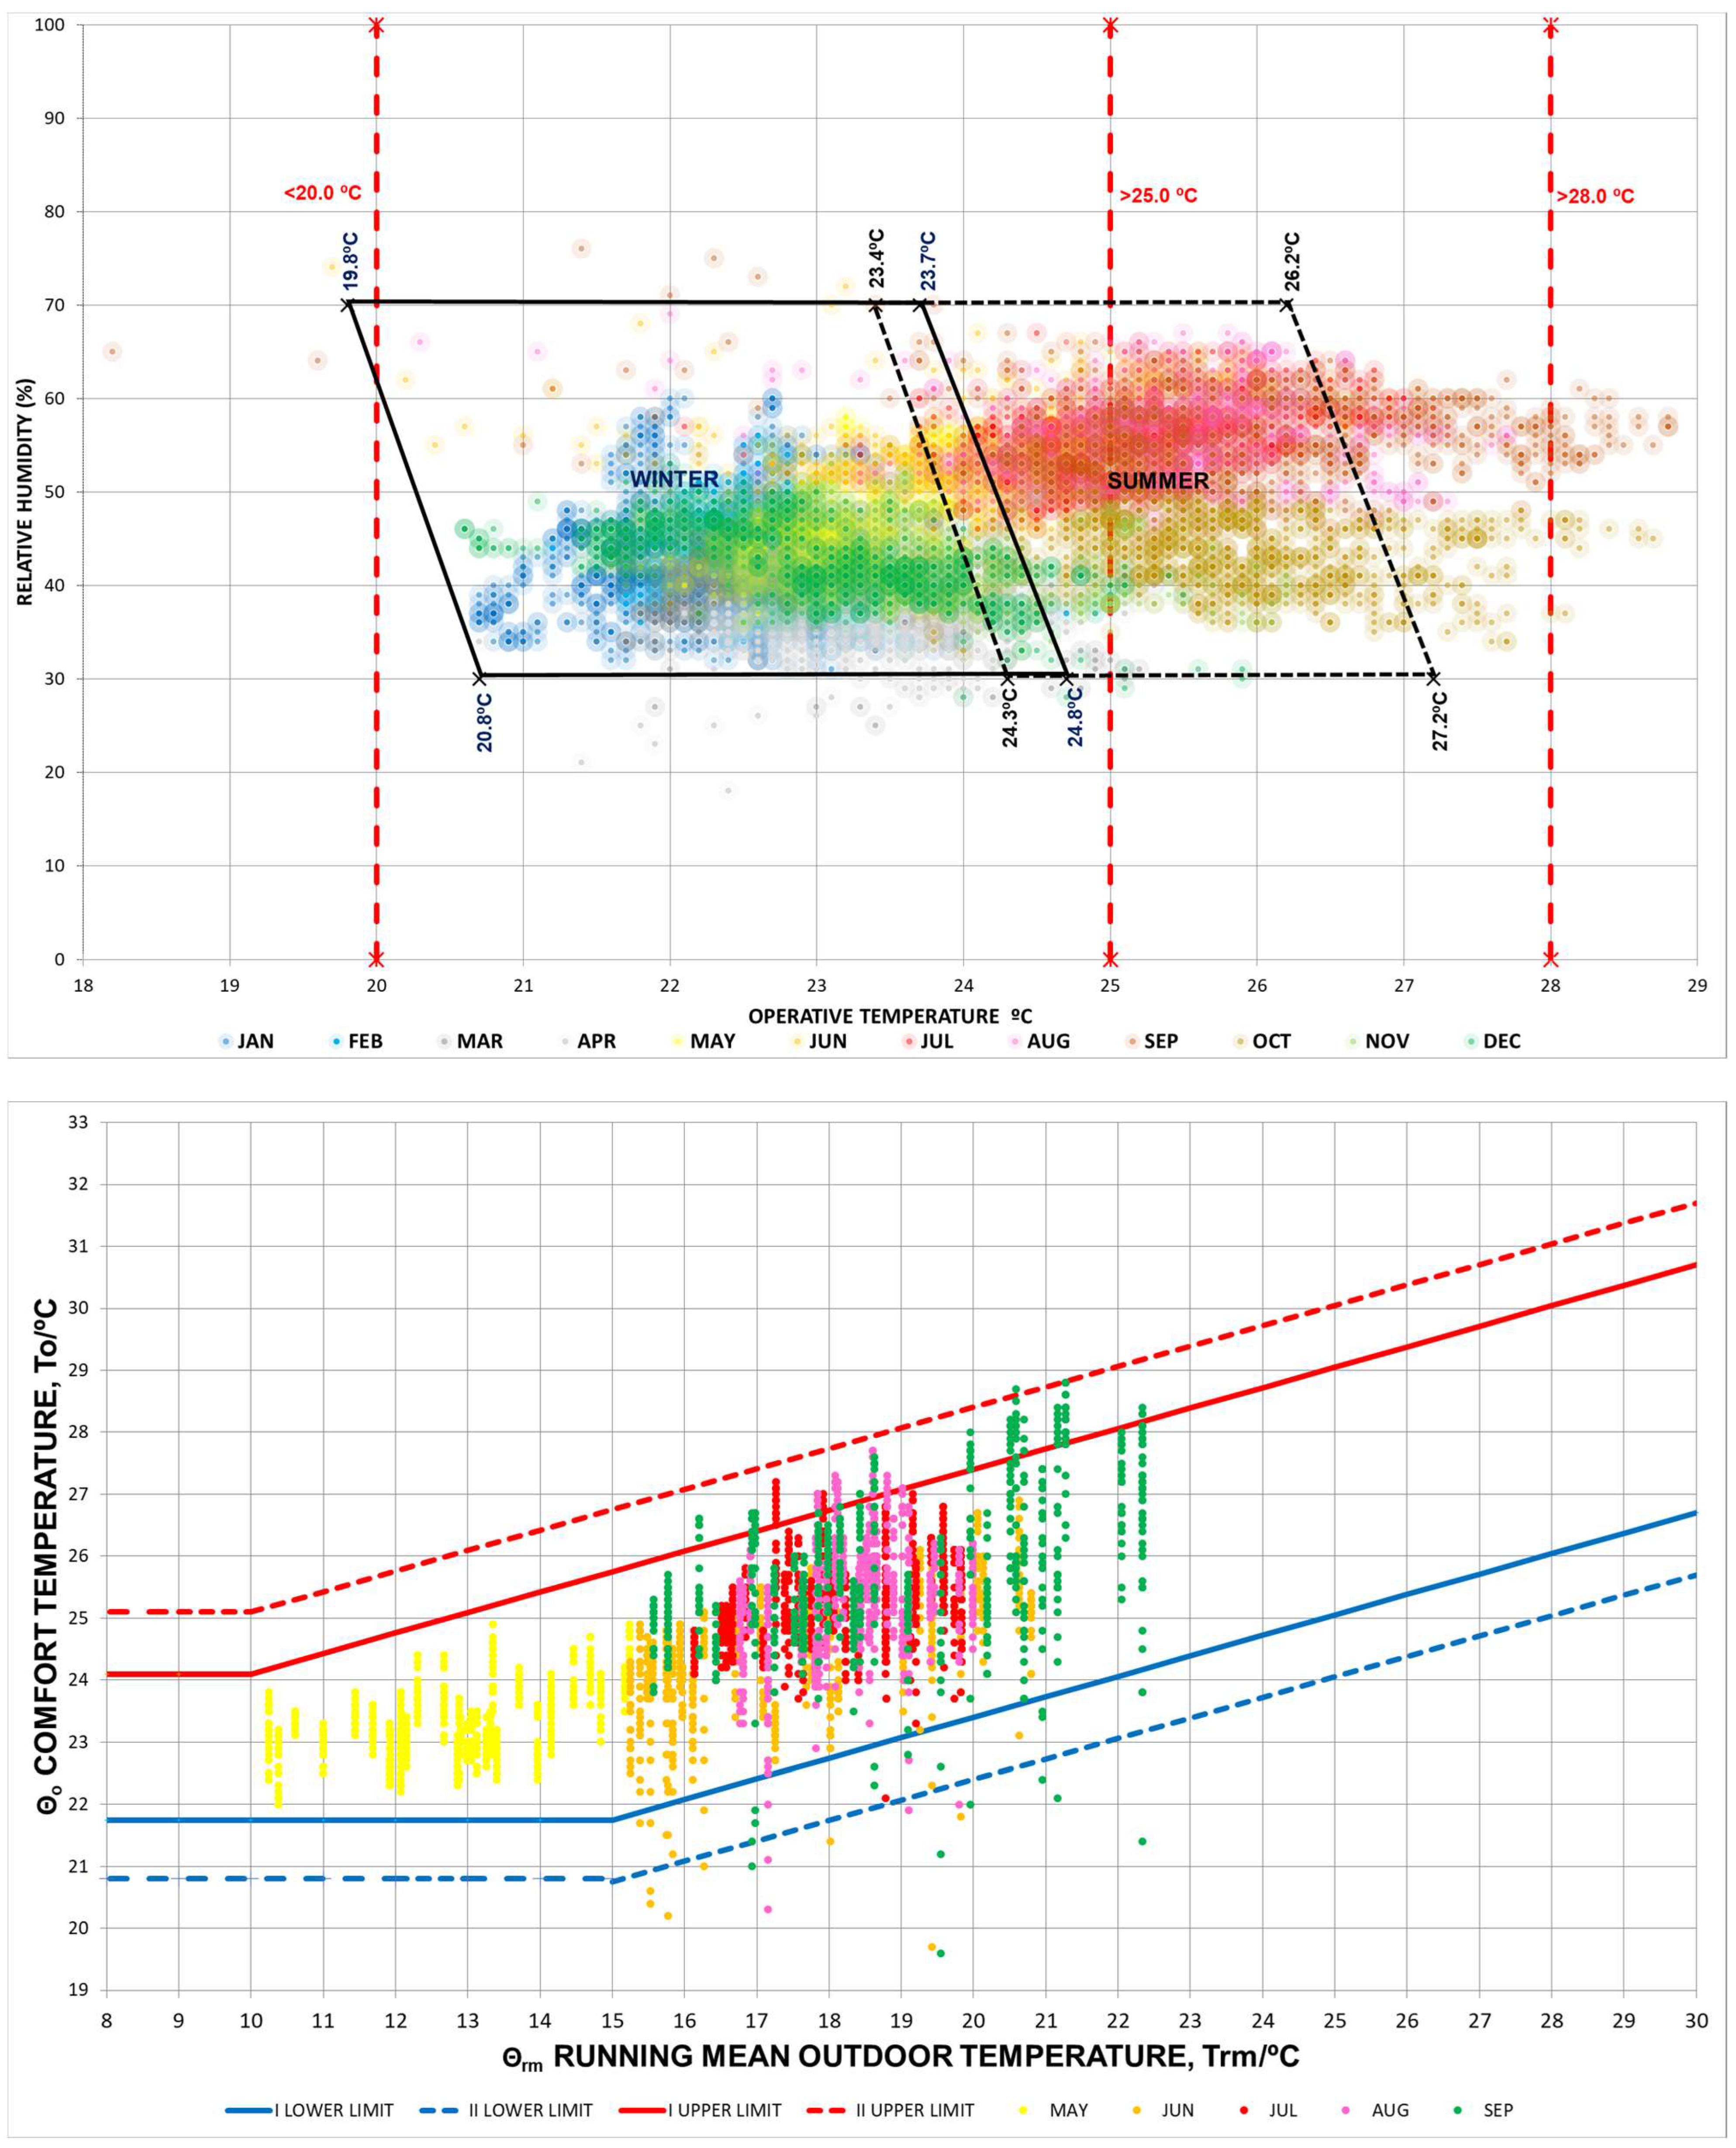
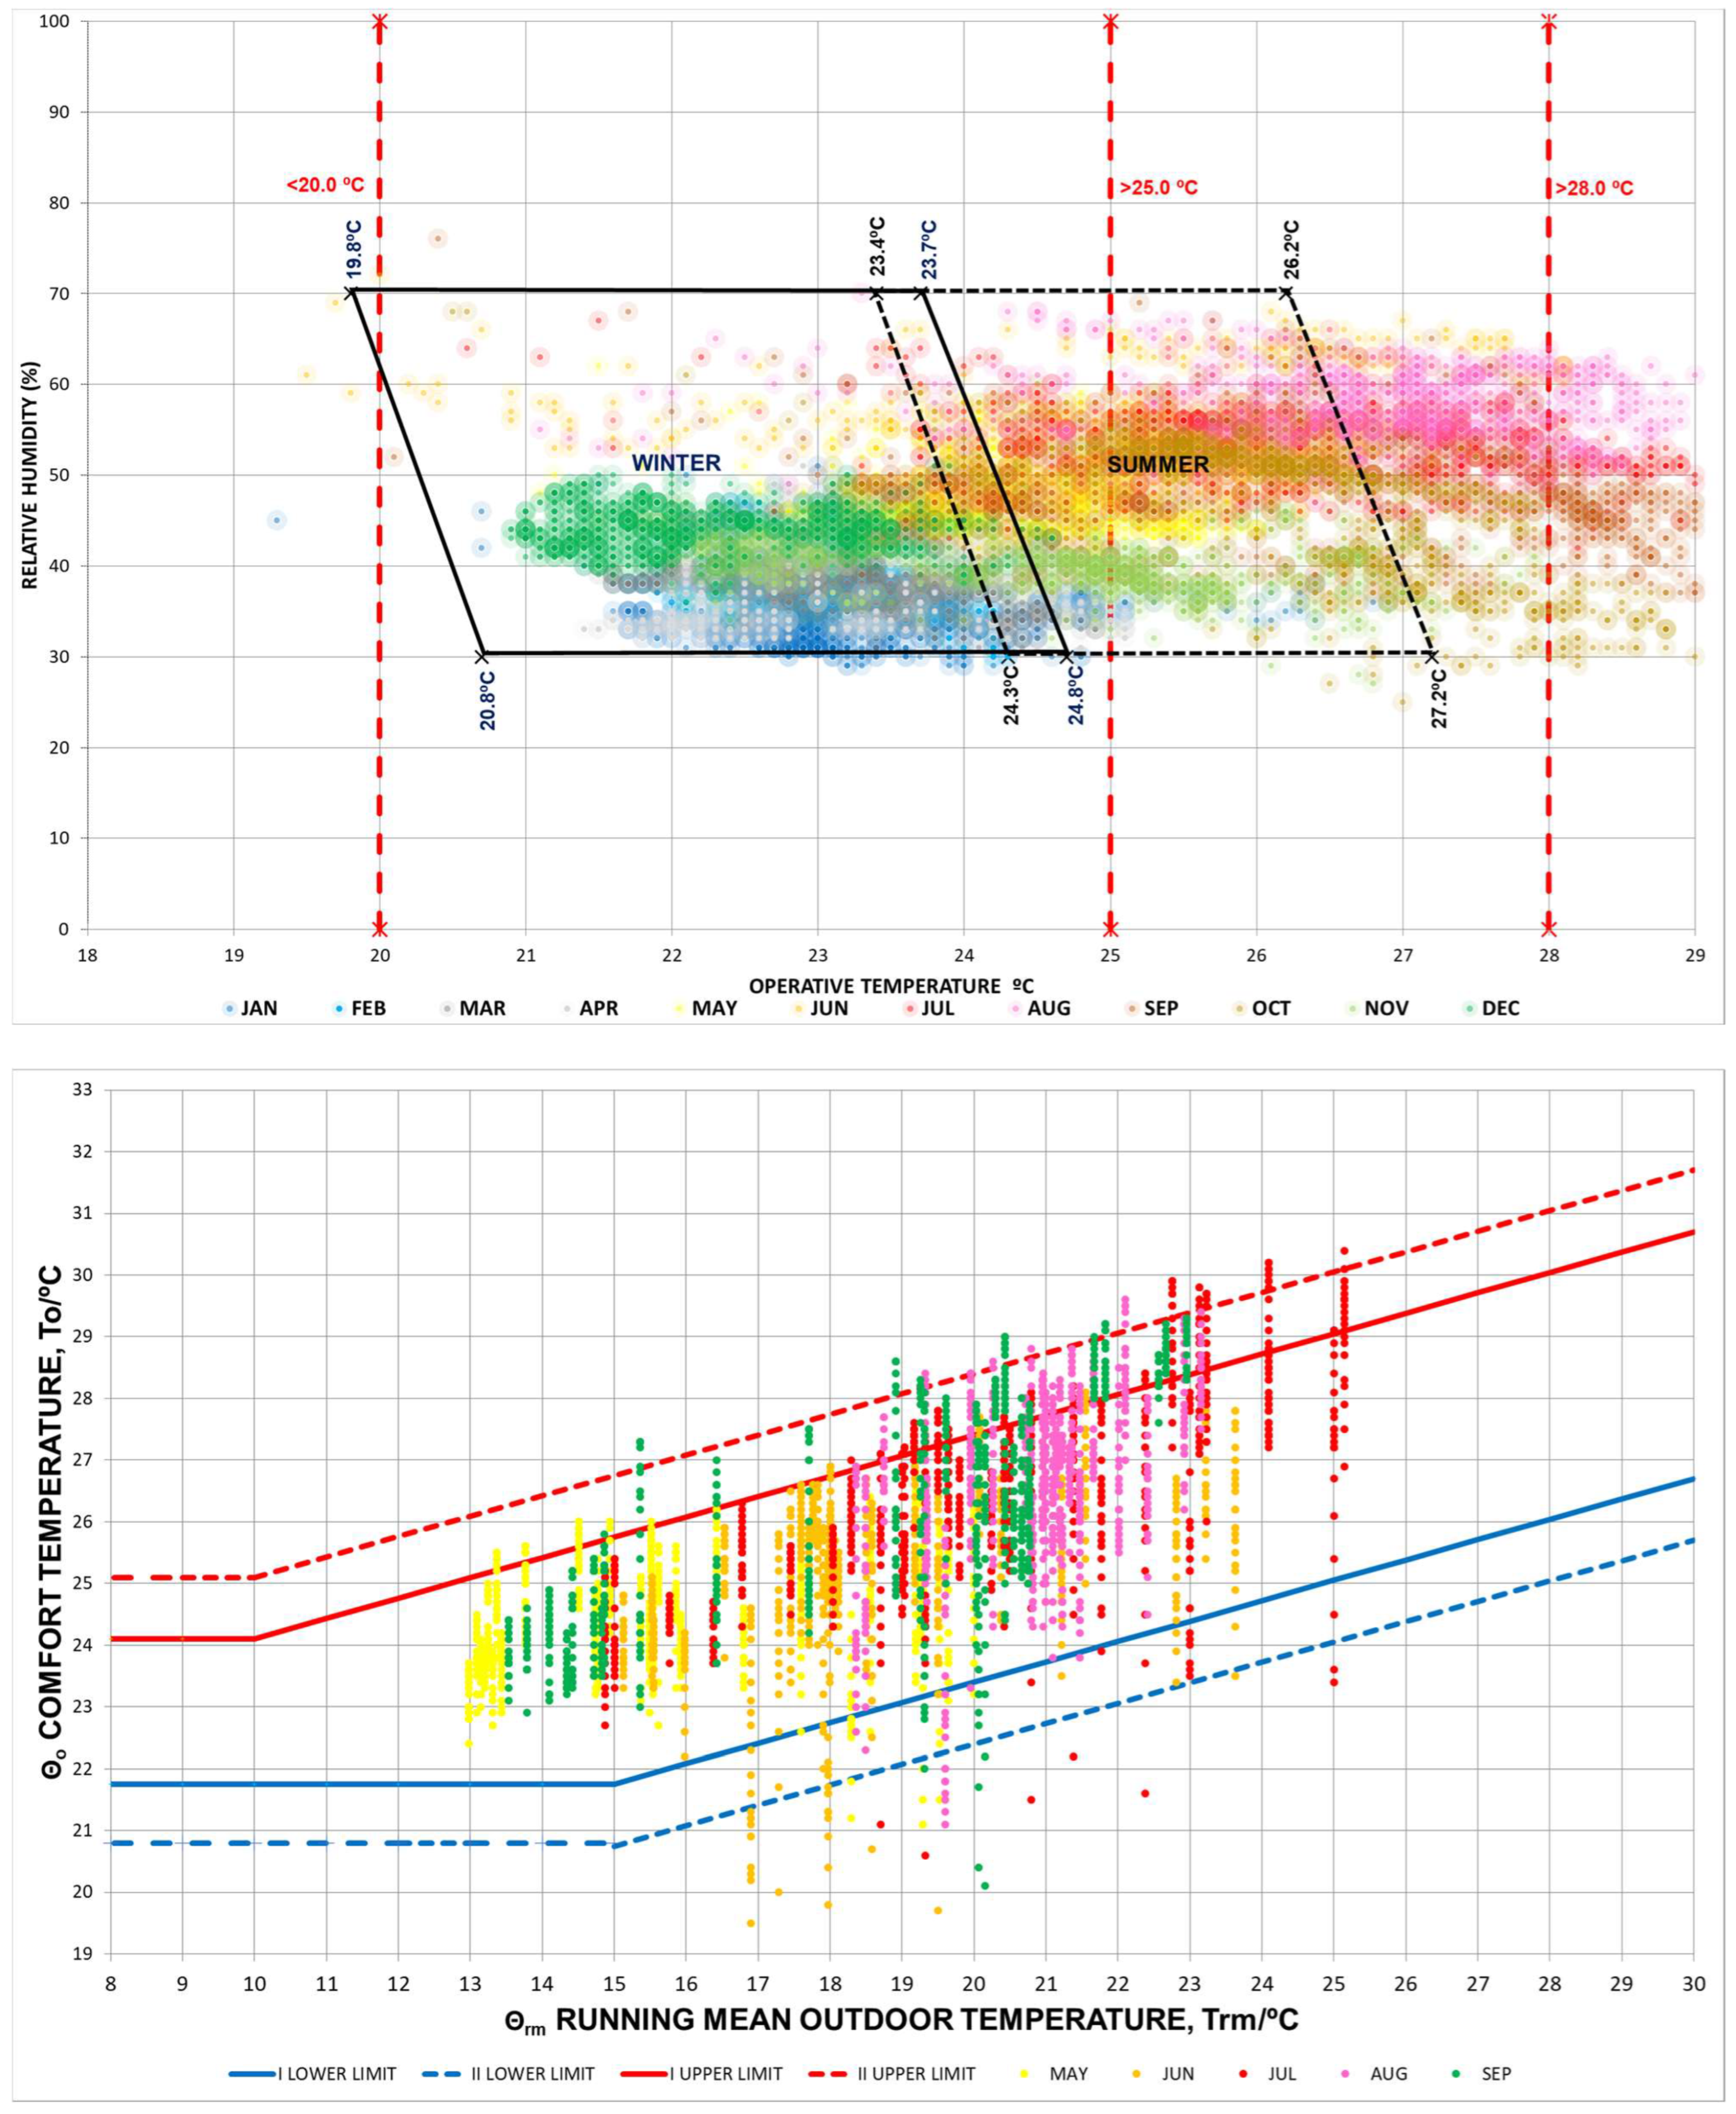
3.2.2. Thermal Comfort Evaluation
Passivhaus Institut Criteria
CIBSE TM59 and EN 16798
CIBSE Guide A
3.2.3. Survey Insights
3.3. Energy Consumption Analysis
3.3.1. Cold Water Consumption
3.3.2. Domestic Hot Water and Heating Consumption
3.3.3. Electrical Consumption
4. Discussion
5. Conclusions
Author Contributions
Funding
Data Availability Statement
Acknowledgments
Conflicts of Interest
Appendix A

| Summer (3672 h) | May | Jun. | Jul. | Aug. | Sep. | |
|---|---|---|---|---|---|---|
| Hours T < 20 °C | 2434 (66.3%) | 560 (72.6%) | 591 (82.0%) | 425 (57.2%) | 374 (50.3%) | 484 (67.2%) |
| Hours T > 25 °C | 296 (8.1%) | 60 (8.1%) | 32 (4.4%) | 51 (6.9%) | 87 (11.7%) | 66 (9.2%) |
| Hours T > 28 °C | 88 (2.4%) | 19 (2.6%) | 7 (1.0%) | 12 (1.6%) | 29 (3.9%) | 21 (2.9%) |
| Maximum T. | 38.7 °C | 31.4 °C | 32.1 °C | 38.7 °C | 38.2 °C | 35.6 °C |
| Hours R.H. > 70% | 2293 (62.5%) | 466 (62.7%) | 493 (68.6%) | 457 (61.5%) | 513 (69.0%) | 365 (50.8%) |
| Maximum R.H. | 96.3% | 96.3% | 96.2% | 96.2% | 96.3% | 96.2% |

| Summer (3672 h) | May | Jun. | Jul. | Aug. | Sep. | |
|---|---|---|---|---|---|---|
| Hours T < 20 °C | 2788 (66.3%) | 688 (92.5%) | 565 (78.4%) | 532 (71.5%) | 513 (68.9%) | 490 (68.1%) |
| Hours T > 25 °C | 144 (3.9%) | 11 (1.5%) | 27 (3.8%) | 26 (3.5%) | 25 (3.4%) | 55 (7.6%) |
| Hours T > 28 °C | 48 (1.3%) | 5 (0.7%) | 9 (1.2%) | 6 (0.8%) | 0 (0.0%) | 28 (3.9%) |
| Maximum T. | 35.3 °C | 29.3 °C | 33.1 °C | 34.1 °C | 28.0 °C | 35.3 °C |
| Hours R.H. > 70% | 2543 (69.3%) | 440 (59.2%) | 514 (71.5%) | 535 (72.0%) | 526 (70.8%) | 528 (73.4%) |
| Maximum R.H. | 97.2% | 96.2% | 96.6% | 96.3% | 96.4% | 97.2% |
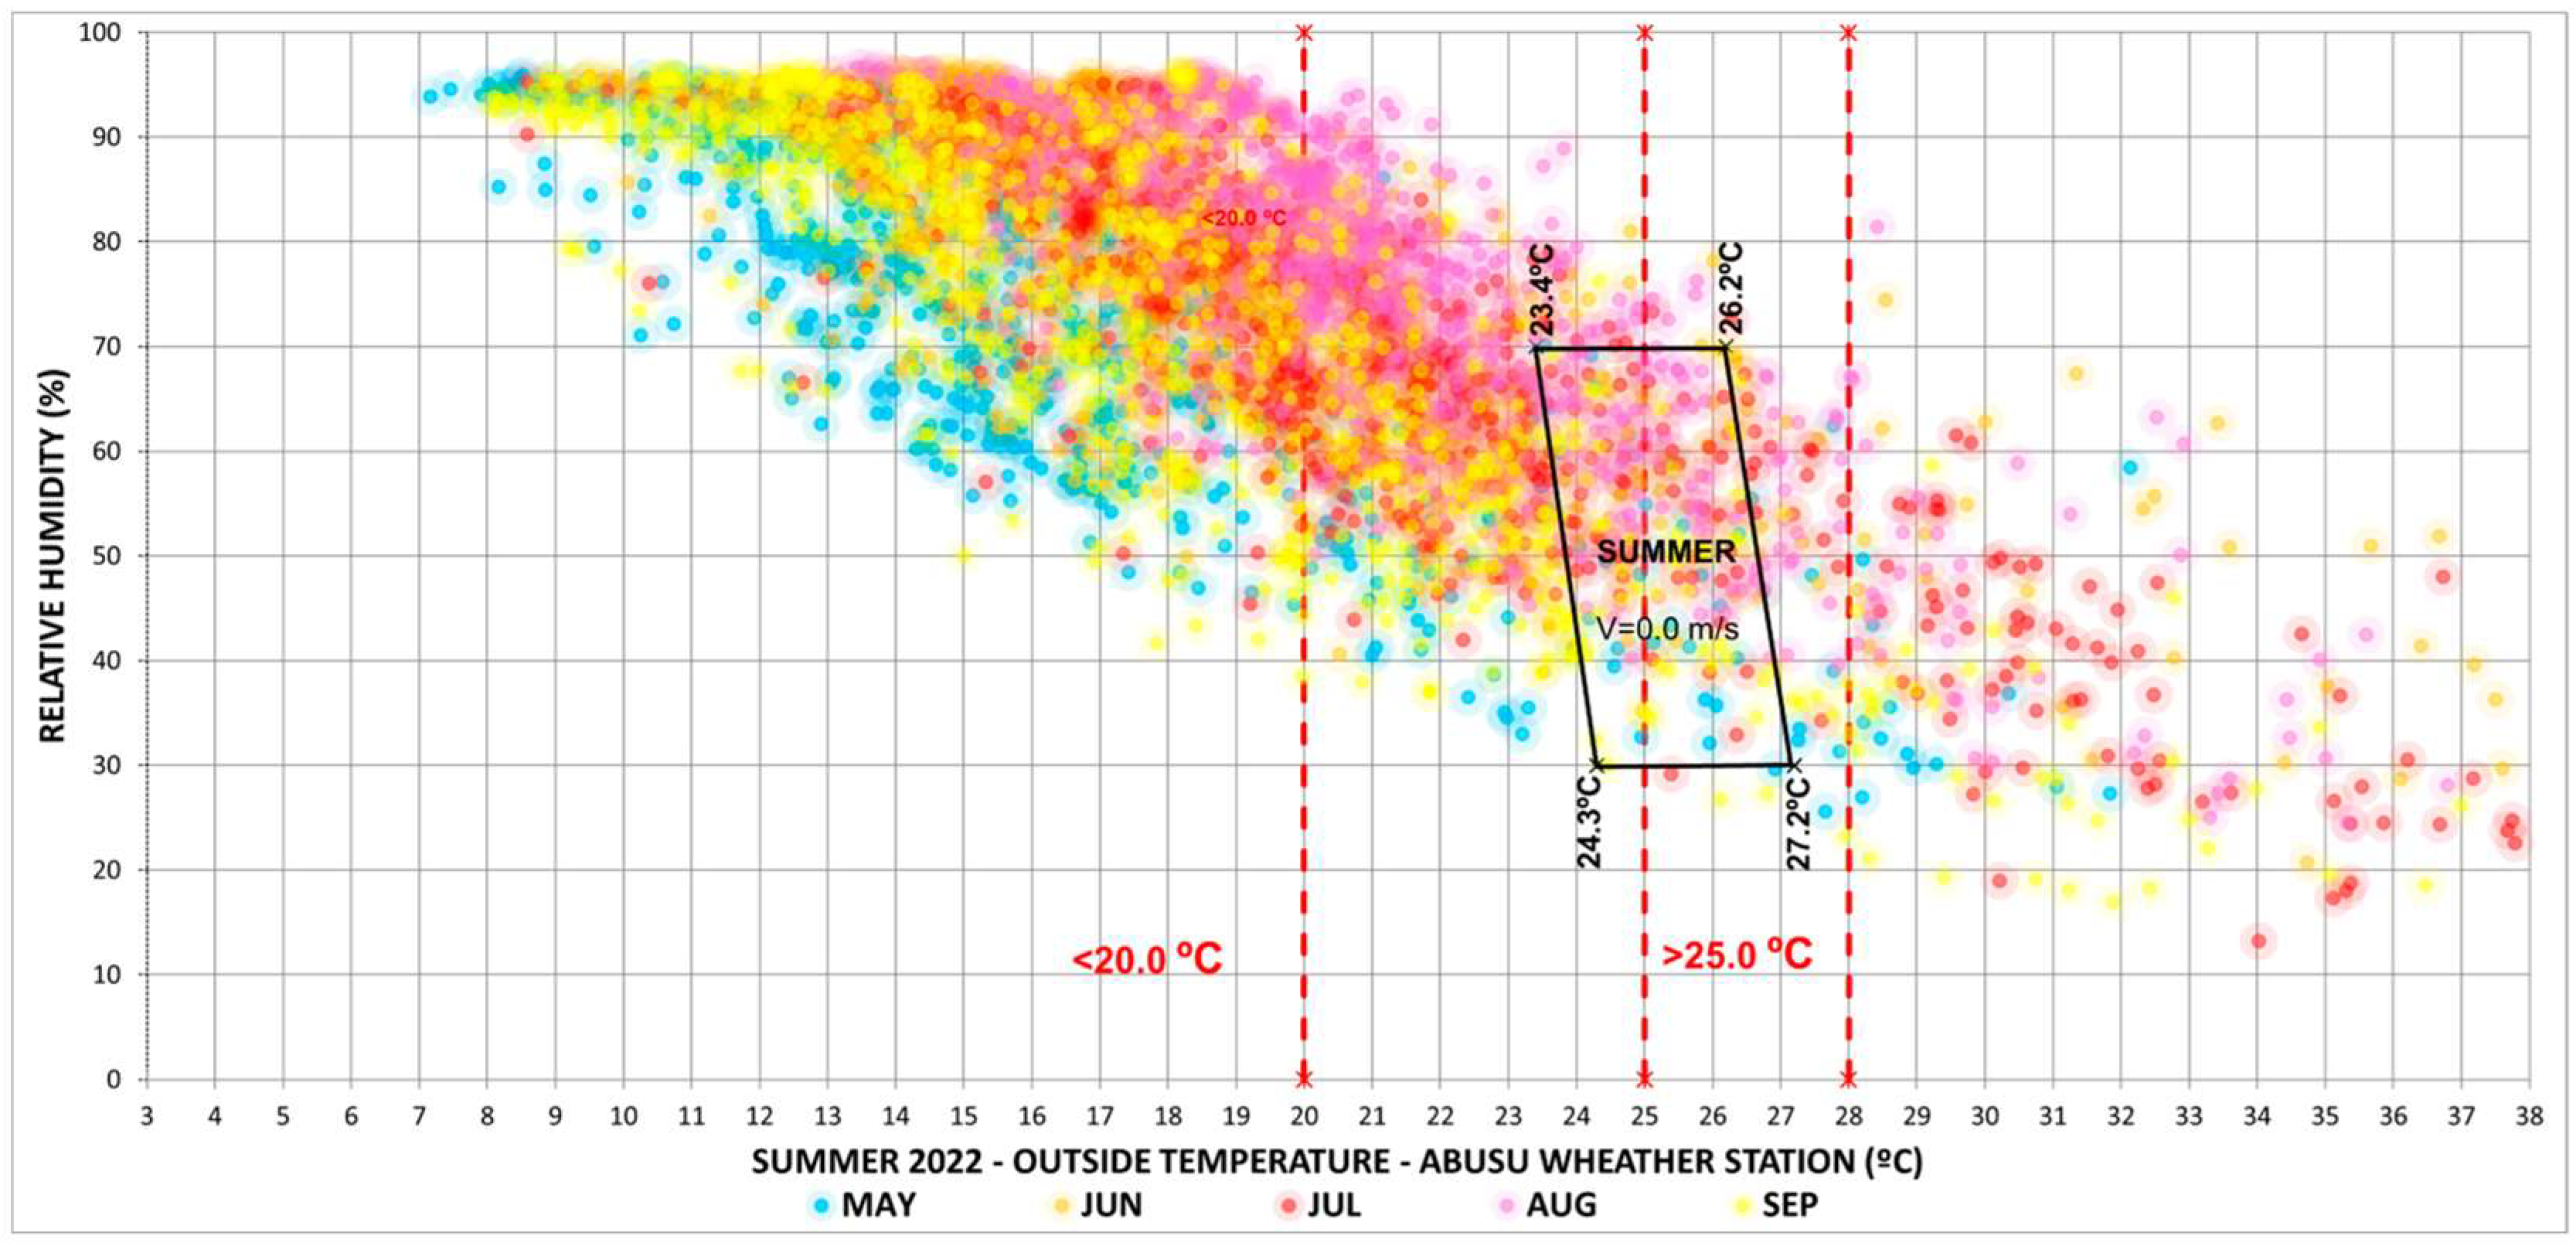
| Summer (3672 h) | May | Jun. | Jul. | Aug. | Sep. | |
|---|---|---|---|---|---|---|
| Hours T < 20 °C | 2303 (62.7%) | 611 (82.1%) | 517 (69.5%) | 377 (50.7%) | 309 (41.5%) | 490 (68.1%) |
| Hours T > 25 °C | 380 (10.3%) | 39 (5.2%) | 53 (7.4%) | 115 (15.5%) | 100 (13.4%) | 73 (10.1%) |
| Hours T > 28 °C | 190 (5.2%) | 13 (1.7%) | 30 (4.2%) | 71 (9.5%) | 40 (5.4%) | 36 (5.0%) |
| Maximum T. | 39.4 °C | 32.1 °C | 38.1 °C | 39.4 °C | 36.8 °C | 37.0 °C |
| Hours R.H. > 70% | 2283 (62.2%) | 460 (61.9%) | 515 (71.6%) | 402 (54.1%) | 494 (66.5%) | 412 (57.3%) |
| Maximum R.H. | 96.7% | 96.2% | 96.6% | 96.3% | 96.4% | 97.2% |
Appendix B

References
- Tollefson, J. What the war in Ukraine means for energy, climate and food. Nature 2022, 604, 232–233. [Google Scholar] [CrossRef] [PubMed]
- Szczepanik-Scislo, N.; Scislo, L. Dynamic Real-Time Measurements and a Comparison of Gas and Wood Furnaces in a Dual-Fuel Heating System in Order to Evaluate the Occupants’ Safety and Indoor Air Quality. Buildings 2023, 13, 2125. [Google Scholar] [CrossRef]
- Tink, V.; Porritt, S.; Allinson, D.; Loveday, D. Measuring and mitigating overheating risk in solid wall dwellings retrofitted with internal wall insulation. Build. Environ. 2018, 141, 247–261. [Google Scholar] [CrossRef]
- Otaegi, J.; Hernández, R.J.; Oregi, X.; Martín-Garín, A.; Rodríguez-Vidal, I. Comparative Analysis of the Effect of the Evolution of Energy Saving Regulations on the Indoor Summer Comfort of Five Homes on the Coast of the Basque Country. Buildings 2022, 12, 1047. [Google Scholar] [CrossRef]
- Taylor, J.; McLeod, R.; Petrou, G.; Hopfe, C.; Mavrogianni, A.; Castaño-Rosa, R.; Pelsmakers, S.; Lomas, K. Ten questions concerning residential overheating in Central and Northern Europe. Build. Environ. 2023, 234, 110154. [Google Scholar] [CrossRef]
- Ruíz, M.A.; Mack-Vergara, Y.L. Resilient and Sustainable Housing Models against Climate Change: A Review. Sustainability 2023, 15, 13544. [Google Scholar] [CrossRef]
- Hernández, D. Climate Justice Starts at Home: Building Resilient Housing to Reduce Disparate Impacts from Climate Change in Residential Settings. Am. J. Public Health 2022, 112, 66–68. [Google Scholar] [CrossRef] [PubMed]
- NOAA National Centers for Environmental Information (NCEI). Annual 2021 Global Climate Report. 2022. Available online: https://www.ncei.noaa.gov/access/monitoring/monthly-report/global/202113 (accessed on 19 March 2024).
- Lindsey, R. 2021 Global Climate Summary: 6th-Warmest Year on Record|NOAA Climate.gov, Climate.Gov News & Features (Website). 2022. Available online: https://www.climate.gov/news-features/features/2021-global-climate-summary-6th-warmest-year-record (accessed on 12 December 2023).
- AEMET. Resumen Estacional Climatológico—Verano 2022. 2022. Available online: https://www.aemet.es/documentos/es/serviciosclimaticos/vigilancia_clima/resumenes_climat/estacionales/2022/Est_verano_22.pdf (accessed on 29 November 2023).
- AEMET. Resumen Estacional Climatológico—Invierno 2022–2023. 2023. Available online: https://www.aemet.es/documentos/es/serviciosclimaticos/vigilancia_clima/resumenes_climat/estacionales/2022/Est_invierno_22_23.pdf (accessed on 29 November 2023).
- AEMET, Resumen Anual Climatológico—2022, Madrid. 2023. Available online: https://www.aemet.es/en/serviciosclimaticos/vigilancia_clima/resumenes?w=0&datos=2 (accessed on 13 December 2023).
- Rodríguez-Vidal, I.; Otaegi, J.; Oregi, X. Thermal Comfort in NZEB Collective Housing in Northern Spain. Sustainability 2020, 12, 9630. [Google Scholar] [CrossRef]
- Passive House Database, Passive House Database. 2018. Available online: https://passivehouse-database.org/index.php?lang=en#d_5233 (accessed on 26 November 2022).
- CEN. ISO 7730:2006. Ergonomics of the Thermal Environment—Analytical Determination and Interpretation of Thermal Comfort Using Calculation of the PMV and PPD Indices and Local THERMAL Comfort Criteria. Available online: https://www.une.org/encuentra-tu-norma/busca-tu-norma/norma?c=N0037517 (accessed on 1 April 2023).
- The Passive House Definition, Passipedia. The Passive House Resource. Available online: https://passipedia.org/basics/the_passive_house_-_definition (accessed on 28 November 2022).
- Moreno-Rangel, A. Passivhaus. Encyclopedia 2021, 1, 20–29. [Google Scholar] [CrossRef]
- Brunsgaard, C. Understanding of Danish Passive Houses based on Pilot Project Comfort Houses, Institut for Arkitektur og Medieteknologi. 2011. Available online: https://vbn.aau.dk/en/publications/understanding-of-danish-passive-houses-based-on-pilot-project-com-2 (accessed on 14 December 2023).
- Heat Stress-Temperature-Health and Safety Executive. Available online: https://www.hse.gov.uk/temperature/employer/heat-stress.htm (accessed on 14 December 2023).
- Heat Stress Related Illness|NIOSH|CDC. Available online: https://www.cdc.gov/niosh/topics/heatstress/heatrelillness.html (accessed on 21 November 2022).
- Murray, K.O.; Brant, J.O.; Iwaniec, J.D.; Sheikh, L.H.; de Carvalho, L.; Garcia, C.K.; Robinson, G.P.; Alzahrani, J.M.; Riva, A.; Laitano, O.; et al. Exertional heat stroke leads to concurrent long-term epigenetic memory, immunosuppression and altered heat shock response in female mice. J. Physiol. 2021, 599, 119–141. [Google Scholar] [CrossRef]
- Andrews, O.; Le Quéré, C.; Kjellstrom, T.; Lemke, B.; Haines, A. Implications for workability and survivability in populations exposed to extreme heat under climate change: A modelling study. Lancet Planet Health 2018, 2, e540–e547. [Google Scholar] [CrossRef] [PubMed]
- de’ Donato, F.K.; Leone, M.; Scortichini, M.; De Sario, M.; Katsouyanni, K.; Lanki, T.; Basagaña, X.; Ballester, F.; Åström, C.; Paldy, A.; et al. Changes in the Effect of Heat on Mortality in the Last 20 Years in Nine European Cities. Results from the PHASE Project. Int. J. Environ. Res. Public Health 2015, 12, 15567–15583. [Google Scholar] [CrossRef] [PubMed]
- Heat Mortality Monitoring Report: 2020—GOV.UK. Available online: https://www.gov.uk/government/publications/heat-mortality-monitoring-reports/heat-mortality-monitoring-report-2020#heatwave-and-covid-19 (accessed on 21 November 2023).
- Heat Mortality Monitoring Report: 2021—GOV.UK. Available online: https://www.gov.uk/government/publications/heat-mortality-monitoring-reports/heat-mortality-monitoring-report-2021 (accessed on 21 November 2023).
- Excess Mortality during Heat-Periods—Office for National Statistics. Available online: https://www.ons.gov.uk/peoplepopulationandcommunity/birthsdeathsandmarriages/deaths/articles/excessmortalityduringheatperiods/englandandwales1juneto31august2022#excess-mortality-during-heat-periods-data (accessed on 21 November 2022).
- Lin, Z.; Deng, S. A questionnaire survey on sleeping thermal environment and bedroom air conditioning in high-rise residences in Hong Kong. Energy Build. 2006, 38, 1302–1307. [Google Scholar] [CrossRef]
- Zheng, G.; Li, K.; Wang, Y. The Effects of High-Temperature Weather on Human Sleep Quality and Appetite. Int. J. Environ. Res. Public Health 2019, 16, 270. [Google Scholar] [CrossRef] [PubMed]
- Mullington, J.M.; Haack, M.; Toth, M.; Serrador, J.M.; Meier-Ewert, H.K. Cardiovascular, inflammatory, and metabolic consequences of sleep deprivation. Prog. Cardiovasc. Dis. 2009, 51, 294–302. [Google Scholar] [CrossRef] [PubMed]
- Okamoto-Mizuno, K.; Mizuno, K. Effects of thermal environment on sleep and circadian rhythm. J. Physiol. Anthropol. 2012, 31, 14. [Google Scholar] [CrossRef]
- Grandner, M.A. Sleep, Health, and Society. Sleep Med. Clin. 2017, 12, 1–22. [Google Scholar] [CrossRef]
- Gingerich, S.B.; Seaverson, E.L.D.; Anderson, D.R. Association between Sleep and Productivity Loss among 598 676 Employees from Multiple Industries. Am. J. Health Promot. 2017, 32, 1091–1094. [Google Scholar] [CrossRef]
- Ishibashi, Y.; Shimura, A. Association between work productivity and sleep health: A cross-sectional study in Japan. Sleep Health 2020, 6, 270–276. [Google Scholar] [CrossRef]
- Watson, N.F.; Badr, M.S.; Belenky, G.; Bliwise, D.L.; Buxton, O.M.; Buysse, D.; Dinges, D.F.; Gangwisch, J.; Grandner, M.A.; Kushida, C.; et al. Recommended Amount of Sleep for a Healthy Adult: A Joint Consensus Statement of the American Academy of Sleep Medicine and Sleep Research Society. Sleep 2015, 38, 843–844. [Google Scholar] [CrossRef]
- Watson, N.F.; Badr, M.S.; Belenky, G.; Bliwise, D.L.; Buxton, O.M.; Buysse, D.; Dinges, D.F.; Gangwisch, J.; Grandner, M.A.; Kushida, C.; et al. Joint Consensus Statement of the American Academy of Sleep Medicine and Sleep Research Society on the Recommended Amount of Sleep for a Healthy Adult: Methodology and Discussion. J. Clin. Sleep Med. 2015, 11, 931–952. [Google Scholar] [CrossRef]
- Watson, N.F.; Badr, M.S.; Belenky, G.; Bliwise, D.L.; Buxton, O.M.; Buysse, D.; Dinges, D.F.; Gangwisch, J.; Grandner, M.A.; Kushida, C.; et al. Recommended Amount of Sleep for a Healthy Adult: A Joint Consensus Statement of the American Academy of Sleep Medicine and Sleep Research Society. J. Clin. Sleep Med. 2015, 11, 591–592. [Google Scholar] [CrossRef]
- Frey, D.J.; Fleshner, M.; Wright, K.P. The effects of 40 hours of total sleep deprivation on inflammatory markers in healthy young adults. Brain Behav. Immun. 2007, 21, 1050–1057. [Google Scholar] [CrossRef]
- Schmidt-Kessen, W.; Kendel, K. Einfluß der Raumtemperatur auf den Nachtschlaf. Res. Exp. Med. 1973, 160, 220–233. [Google Scholar] [CrossRef]
- Buguet, A.; Gati, R.; Soubiran, G.; Straboni, J.P.; Hanniquet, A.M.; Livecchi-Gonnot, G.; Bittel, J. Seasonal changes in circadian rhythms of body temperatures in humans living in a dry tropical climate. Eur. J. Appl. Physiol. Occup. Physiol. 1988, 58, 334–339. [Google Scholar] [CrossRef]
- Haskell, E.H.; Palca, J.W.; Walker, J.M.; Berger, R.J.; Heller, H.C. Metabolism and thermoregulation during stages of sleep in humans exposed to heat and cold. J. Appl. Physiol. 1981, 51, 948–954. [Google Scholar] [CrossRef]
- Henane, R.; Buguet, A.; Roussel, B.; Bittel, J. Variations in evaporation and body temperatures during sleep in man. J. Appl. Physiol. 1977, 42, 50–55. [Google Scholar] [CrossRef] [PubMed]
- Brockmann, P.E.; Gozal, D.; Villarroel, L.; Damiani, F.; Nuñez, F.; Cajochen, C. Geographic latitude and sleep duration: A population-based survey from the Tropic of Capricorn to the Antarctic Circle. Chronobiol. Int. 2017, 34, 373–381. [Google Scholar] [CrossRef] [PubMed]
- Mattingly, S.M.; Grover, T.; Martinez, G.J.; Aledavood, T.; Robles-Granda, P.; Nies, K.; Striegel, A.; Mark, G. The effects of seasons and weather on sleep patterns measured through longitudinal multimodal sensing. NPJ Digit. Med. 2021, 4, 76. [Google Scholar] [CrossRef] [PubMed]
- Wang, Y.; Deng, S.; Wang, L.; Xiang, M.; Long, E. The Influence of the Deteriorations in Living Environments on the Health of Disaster Victims Following a Natural Disaster. Procedia Eng. 2015, 121, 203–211. [Google Scholar] [CrossRef]
- Liao, C.; Akimoto, M.; Bivolarova, M.P.; Sekhar, C.; Laverge, J.; Fan, X.; Lan, L.; Wargocki, P. A survey of bedroom ventilation types and the subjective sleep quality associated with them in Danish housing. Sci. Total Environ. 2021, 798, 149209. [Google Scholar] [CrossRef] [PubMed]
- Milojevich, H.M.; Lukowski, A.F. Sleep and Mental Health in Undergraduate Students with Generally Healthy Sleep Habits. PLoS ONE 2016, 11, e0156372. [Google Scholar] [CrossRef]
- Xue, B.; Xue, Y.; Zheng, X.; Shi, L.; Liang, P.; Dong, F.; Xiao, S.; Zhang, J.; Qin, Z.; Xu, Y.; et al. Association of sleep with mental health in Chinese high school students: A cross-sectional study. J. Sleep Res. 2022, 31, e13697. [Google Scholar] [CrossRef] [PubMed]
- Breslau, N.; Roth, T.; Rosenthal, L.; Andreski, P. Sleep disturbance and psychiatric disorders: A longitudinal epidemiological study of young Adults. Biol. Psychiatry 1996, 39, 411–418. [Google Scholar] [CrossRef] [PubMed]
- Reid, K.J.; Martinovich, Z.; Finkel, S.; Statsinger, J.; Golden, R.; Harter, K.; Zee, P.C. Sleep: A Marker of Physical and Mental Health in the Elderly. Am. J. Geriatr. Psychiatry 2006, 14, 860–866. [Google Scholar] [CrossRef] [PubMed]
- Crestani, F.; Williams, G.; Breheny, M.; Tupara, H.; Cunningham, C.; Gander, P.; Gibson, R. Sleep health in later life: Interviews exploring experiences, attitudes and behaviours of older people. Ageing Soc. 2022, 1–23. [Google Scholar] [CrossRef]
- Shochat, T. Sleep health and aging. In Foundations of Sleep Health; Academic Press: Cambridge, MA, USA, 2022; pp. 173–198. [Google Scholar] [CrossRef]
- Vitiello, M.V.; Moe, K.E.; Prinz, P.N. Sleep complaints cosegregate with illness in older adults: Clinical research informed by and informing epidemiological studies of sleep. J. Psychosom. Res. 2002, 53, 555–559. [Google Scholar] [CrossRef]
- Eurostat. Housing Conditions—Statistics Explained. 2018. Available online: https://ec.europa.eu/eurostat/statistics-explained/index.php?title=Archive:Housing_conditions (accessed on 12 February 2024).
- Euskal Estatistika Erakundea, Instituto Vasco de Estadística, Nota de Prensa del 9 de junio de 2020, Vitoria-Gasteiz. 2020. Available online: https://www.eustat.eus/elem/ele0017300/not0017383_c.pdf (accessed on 12 February 2024).
- Dol, K.; Haffner, M. Housing Statistics in the European Union 2010, The Hague. 2010. Available online: https://www.iut.nu/wp-content/uploads/2017/07/Housing-Affordability-Housing-Statistics.pdf (accessed on 12 February 2024).
- Swiss Society of Engineers and Architects, SIA 2040:2017 Energy Efficiency Path. Available online: https://shop.sia.ch/dokumentationen/%C3%B6kologie%20und%20nachhaltigkeit/sia%202040/d/2017/D/Product (accessed on 12 February 2024).
- INE Continuous Household Survey (CHS) Year 2019, Madrid. 2020. Available online: https://www.ine.es/en/prensa/ech_2019_en.pdf (accessed on 12 February 2024).
- Mitchell, R.; Natarajan, S. UK Passivhaus and the energy performance gap. Energy Build. 2020, 224, 110240. [Google Scholar] [CrossRef]
- The First Passive House in Darmstadt at the Passive House Database, Passive House Database (Web). Available online: https://passivehouse-database.org/index.php?lang=en#d_195 (accessed on 13 March 2024).
- Passipedia—The World’s First Passive House, Darmstadt-Kranichstein, Germany. Available online: https://passipedia.org/examples/residential_buildings/multi-family_buildings/central_europe/the_world_s_first_passive_house_darmstadt-kranichstein_germany (accessed on 13 March 2024).
- Feist, W. 6th Update. Report on The World’s First Passive House, Darmstadt-Kranichstein, Germany. 2016. Available online: https://www.researchgate.net/publication/273766969_The_world%27s_first_Passive_House_Darmstadt-Kranichstein_Germany?channel=doi&linkId=550bd25d0cf290bdc11208e5&showFulltext=true (accessed on 12 February 2024). [CrossRef]
- Johnston, D.; Siddall, M.; Ottinger, O.; Peper, S.; Feist, W. Are the energy savings of the passive house standard reliable? A review of the as-built thermal and space heating performance of passive house dwellings from 1990 to 2018. Energy Effic. 2020, 13, 1605–1631. [Google Scholar] [CrossRef]
- Passipedia—Monitoring in the Passive House District of Bahnstadt, Heidelberg. Available online: https://passipedia.org/operation/operation_and_experience/monitoring_in_the_passive_house_district_of_bahnstadt_heidelberg (accessed on 13 March 2024).
- Passive House Database. Available online: https://passivehouse-database.org/index.php (accessed on 12 February 2024).
- CIBSE TM:52; The Limits of Thermal Comfort: Avoiding Overheating in European Buildings. Chartered Institution of Building Services Engineers: London, UK, 2013.
- Chartered Institution of Building Services Engineers. CIBSE Guide A: Environmental Design; Chartered Institution of Building Services Engineers: London, UK, 2015. [Google Scholar]
- VISESA. Bolueta Tower 1 in the VISESA Database. Available online: https://apps.visesa.eus/app/promociones-detalle.asp?id=7363&idioma=1 (accessed on 29 November 2023).
- VISESA. Bolueta Tower 2 in the VISESA Database. Available online: https://apps.visesa.eus/app/promociones-detalle.asp?id=8099&idioma=1 (accessed on 29 November 2023).
- de Apodaka, L.A.C.O.; Galdós, J.T.; La Peña Irigoyen, H. Passivhaus en altura en Bolueta-Bilbao. Proyecto de 361 VPO, sociales y tasadas en dos bloques (28 y 21 alturas sobrer rasante). Cumple Estándares Passivhaus. In CONTART 2018: VII Convención de La Edificación; Pérez, V.M., Colegio Oficial de Aparejadores y Arquitectos Técnicos de Zaragoza, Eds.; Escuela Universitaria Politécnica de La Almunia: Zaragoza, Spain, 2018; pp. 331–339. Available online: https://2018.contart.es/wp-content/uploads/CONTART_LIBRO_2018_1_Junio-opt.pdf (accessed on 27 November 2022).
- Rahif, R.; Amaripadath, D.; Attia, S. Review on Time-Integrated Overheating Evaluation Methods for Residential Buildings in Temperate Climates of Europe. Energy Build. 2021, 252, 111463. [Google Scholar] [CrossRef]
- de Dear, R.J.; Brager, G. Developing an adaptive model of thermal comfort and preference. ASHRAE Trans. 1998, 104, 145–167. Available online: https://escholarship.org/uc/item/4qq2p9c6#main (accessed on 16 February 2024).
- CEN, EN 16798-1:2020. Energy Performance of Buildings—Ventilation for Buildings—Part 1: Indoor Environmental Input Parameters for Design and Assessment of Energy Performance of Buildings Addressing Indoor Air Quality, Thermal Environment, Lighting and Acoustics—Module M1-6. 2020. Available online: https://www.une.org/encuentra-tu-norma/busca-tu-norma/norma/?c=N0063261 (accessed on 1 April 2023).
- ASHRAE 55-2017; Thermal Environmental Conditions for Human Occupancy. ASHRAE: Peachtree Corners, GA, USA, 2017.
- Attia, S.; Eleftheriou, P.; Xeni, F.; Morlot, R.; Ménézo, C.; Kostopoulos, V.; Betsi, M.; Kalaitzoglou, I.; Pagliano, L.; Cellura, M.; et al. Overview and future challenges of nearly zero energy buildings (nZEB) design in Southern Europe. Energy Build. 2017, 155, 439–458. [Google Scholar] [CrossRef]
- Álvarez-Cascos Fernández, F. Real Decreto 1751/1998, de 31 de Julio, por el que se Aprueba el Reglamento de Instalaciones Térmicas en los Edificios (RITE) y sus Instrucciones Técnicas Complementarias (ITE). Ministerio de la Presidencia del Gobierno de España, Madrid. 1998. Available online: https://www.boe.es/boe/dias/1998/08/05/pdfs/A26585-26634.pdf (accessed on 26 August 2022).
- CIBSE TM:59; Design Methodology for the Assessment of Overheating Risk in Homes. Chartered Institution of Building Services Engineers: London, UK, 2017.
- Euskalmet, Informe Meteorológico Verano. 2020. Available online: https://www.euskalmet.euskadi.eus/contenidos/informacion/meteo_report_season_2020/es_def/adjuntos/verano_2020.pdf (accessed on 19 February 2024).
- Euskalmet, Informe Meteorológico Verano. 2022. Available online: https://www.euskalmet.euskadi.eus/contenidos/informacion/meteo_report_season_2022/es_def/adjuntos/verano_2022.pdf (accessed on 19 March 2024).
- Ávila, J.M.S.; Martín, J.R.; Alonso, C.J.; de Cos Escuin, M.C.S.; Cadalso, J.M.; Bartolomé, M.L. Atlas de Radiación Solar en España —State Meteorological Agency—AEMET—Spanish Government, n.d. Available online: https://www.aemet.es/en/serviciosclimaticos/datosclimatologicos/atlas_radiacion_solar (accessed on 16 February 2024).
- EVE. IKERLAN, Atlas de Radiación Solar del País Vasco. In Solar Radiation Atlas of the Basque Country, 3rd ed.; Ente Vasco de la Energía (EVE): Bilbao, Spain, 1999; Available online: https://www.eve.eus/Conoce-la-Energia/La-energia-en-Euskadi/Publicaciones/Energias-Renovables/Atlas-de-radiacion-solar-del-Pais-Vasco?lang=es-es (accessed on 16 February 2024).
- Meteonorm Software Website. Available online: https://meteonorm.com/en/ (accessed on 16 February 2024).
- Código Técnico de la Edificación. Documento Básico HS. Salubridad. Versión 2022, Ministerio de Transportes, Movilidad y Agenda Urbana. 2022. Available online: https://www.codigotecnico.org/pdf/Documentos/HS/DBHS.pdf (accessed on 27 November 2022).
- Departamento de Planificación y Estudios—IDEA. SPAHOUSEC II: Análisis Estadístico del Consumo de gas Natural en las Viviendas Principales con Calefacción Individual, Madrid. 2019. Available online: https://www.idae.es/publicaciones/spahousec-ii-analisis-estadistico-del-consumo-de-gas-natural-en-las-viviendas (accessed on 16 February 2024).
- Departamento de Planificación y Estudios—IDAE, Final Report of the SECH-SPAHOUSEC Project, Madrid. 2011. Available online: https://www.idae.es/uploads/documentos/documentos_Informe_SPAHOUSEC_ACC_f68291a3.pdf (accessed on 16 February 2024).
- Teitelbaum, E.; Miller, C.; Meggers, F. Highway to the Comfort Zone: History of the Psychrometric Chart. Buildings 2023, 13, 797. [Google Scholar] [CrossRef]
- Teitelbaum, E.; Jayathissa, P.; Miller, C.; Meggers, F. Design with Comfort: Expanding the psychrometric chart with radiation and convection dimensions. Energy Build. 2020, 209, 109591. [Google Scholar] [CrossRef]
- Guo, H.; Aviv, D.; Loyola, M.; Teitelbaum, E.; Houchois, N.; Meggers, F. On the understanding of the mean radiant temperature within both the indoor and outdoor environment, a critical review. Renew. Sustain. Energy Rev. 2020, 117, 109207. [Google Scholar] [CrossRef]
- Kim, J.; Schiavon, S.; Brager, G. Personal comfort models—A new paradigm in thermal comfort for occupant-centric environmental control. Build. Environ. 2018, 132, 114–124. [Google Scholar] [CrossRef]
- Zhao, Q.; Lian, Z.; Lai, D. Thermal comfort models and their developments: A review. Energy Built Environ. 2021, 2, 21–33. [Google Scholar] [CrossRef]
- EVE, Ente Vasco de la Energía. Claves energéticas del Sector Doméstico en Euskadi. 2013. Available online: https://www.eve.eus/Conoce-la-Energia/La-energia-en-Euskadi/Publicaciones/General-Energia/Euskadiko-etxeko-sektoreko-energia-erabilerari-bur?lang=en-gb (accessed on 11 March 2024).


| YoC 1 | Floor Area | Interior Volume | Occupation | Orientation 2 | Glazed Area 3 | Shading System | Cross-Vent. | |
|---|---|---|---|---|---|---|---|---|
| 2018 | 82.42 m2 | 197.89 m3 | 1 adult | Two | S-W | 8.46 m2 | Int. Blinds | Corner |
| Standard | Overheating Criteria |
|---|---|
| Passivhaus Institut Comfort Criteria | Limits number hours T > 25 °C Max. hours where T > 25 °C: 10%, recommends < 5% |
| CIBSE Guide A [66] | Tmax 25 °C for living rooms and 23 °C for bedrooms Overheating when T > 28 °C for living rooms and T > 26 °C for bedrooms |
| ISO 7730 [15] | Predominantly mechanically ventilated buildings: - Category A: Tmin 20 °C, Tmax 25 °C - Category B: Tmin 21 °C, Tmax 25.5 °C - Category C: Tmin 19 °C, Tmax 27 °C RH should remain in the 40% to 60% range. |
| EN 16798 [72] | Predominantly naturally ventilated buildings: - Category I: Buildings with vulnerable occupants: Tcomf = 0.33 Tm + 18.8 + 2 - Category II: Other buildings: Tcomf = 0.33 Tm + 18.8 + 3 When the upper temperature limits according to the categories cannot be guaranteed by passive means, active cooling is considered unavoidable. |
| CIBSE TM:52 [65] | Predominantly naturally ventilated buildings; a room is overheated if any two of the three following criteria fail: - Criterion 1: hours of exceedance (He) 1 - Criterion 2: daily weighted exceedance (We) 2 - Criterion 3: upper limit temperature (Tupp) 3 |
| CIBSE TM:59 [76] | Predominantly naturally ventilated buildings:
Predominantly mechanically ventilated buildings:
|
| Year | Winter | Summer | May | Jun. | Jul. | Aug. | Sep. | ||
|---|---|---|---|---|---|---|---|---|---|
| 8760 h | 5088 h | 3672 h | 744 h | 720 h | 744 h | 744 h | 720 h | ||
| Hours T > 20 °C | 2020 | 7390 | 4867 | 2434 | 560 | 591 | 425 | 374 | 484 |
| 2021 | 7714 | 4844 | 2788 | 688 | 565 | 532 | 513 | 490 | |
| 2022 | 7086 | 4699 | 2303 | 611 | 517 | 377 | 309 | 490 | |
| Hours T > 25 °C | 2020 | 299 | 3 | 296 | 60 | 32 | 51 | 87 | 66 |
| 2021 | 158 | 14 | 144 | 11 | 27 | 26 | 25 | 55 | |
| 2022 | 412 | 32 | 380 | 39 | 53 | 115 | 100 | 73 | |
| % Hours T > 25 °C | 2020 | 3.4 | 0.1 | 8.1 | 8.1 | 4.4 | 6.9 | 11.7 | 9.2 |
| 2021 | 1.8 | 0.3 | 3.9 | 1.5 | 3.8 | 3.5 | 3.4 | 7.6 | |
| 2022 | 4.7 | 0.6 | 10.3 | 5.2 | 7.4 | 15.5 | 13.4 | 10.1 | |
| Hours > T 28 °C | 2020 | 88 | 0 | 88 | 19 | 7 | 12 | 29 | 21 |
| 2021 | 48 | 0 | 48 | 5 | 9 | 6 | 0 | 28 | |
| 2022 | 190 | 0 | 190 | 13 | 30 | 71 | 40 | 36 | |
| Max. T | 2020 | 38.7 | 25.8 | 38.7 | 31.4 | 32.1 | 38.7 | 38.2 | 35.6 |
| 2021 | 35.3 | 27.0 | 35.3 | 35.3 | 35.3 | 35.3 | 35.3 | 35.3 | |
| 2022 | 39.4 | 27.1 | 39.4 | 32.1 | 38.1 | 39.4 | 36.8 | 37.0 | |
| Hours RH > 70% | 2020 | 6060 | 3687 | 2293 | 466 | 493 | 457 | 513 | 365 |
| 2021 | 5766 | 3199 | 2543 | 440 | 514 | 535 | 526 | 528 | |
| 2022 | 5467 | 3164 | 2283 | 460 | 515 | 402 | 494 | 412 | |
| % Hours RH > 70% | 2020 | 69.2 | 42.1 | 62.5 | 62.7 | 68.6 | 61.5 | 69.0 | 50.8 |
| 2021 | 65.8 | 36.5 | 69.3 | 59.2 | 71.5 | 72.0 | 70.8 | 73.4 | |
| 2022 | 62.4 | 36.1 | 62.2 | 61.9 | 71.6 | 54.1 | 66.5 | 57.3 | |
| Max. RH | 2020 | 98.2 | 98.2 | 96.3 | 96.3 | 96.2 | 96.2 | 96.3 | 96.2 |
| 2021 | 97.2 | 96.2 | 97.2 | 96.2 | 96.6 | 96.3 | 96.4 | 97.2 | |
| 2022 | 96.3 | 96.3 | 96.3 | 96.3 | 96.3 | 96.3 | 96.3 | 96.3 |
| Jan. | Feb. | Mar. | Apr. | May | Jun. | Jul. | Aug. | Sep. | Oct. | Nov. | Dec. | Year | |
|---|---|---|---|---|---|---|---|---|---|---|---|---|---|
| kWh/m2Day | kWh/m2y | ||||||||||||
| 2019 | 1.53 | 3.39 | 5.15 | 5.26 | 7.16 | 7.41 | 7.04 | 6.50 | 5.18 | 3.43 | 1.52 | 1.73 | 1684 |
| 2020 | 2.05 | 2.92 | 4.29 | 5.05 | 7.44 | 6.56 | 7.49 | 6.27 | 5.51 | 2.81 | 2.47 | 1.38 | 1652 |
| 2021 | 1.55 | 2.26 | 4.27 | 5.53 | 6.65 | 6.33 | 6.44 | 6.12 | 4.48 | 3.83 | 1.67 | 1.74 | 1552 |
| 2022 | 2.32 | 2.81 | 3.71 | 5.20 | 7.16 | 6.50 | 7.53 | 6.34 | 5.00 | 3.35 | 1.95 | 1.41 | 1624 |
| Avg. | 1.86 | 2.84 | 4.35 | 5.26 | 7.10 | 6.70 | 7.13 | 6.31 | 5.05 | 3.35 | 1.90 | 1.57 | 1628 |
| AEMET Solar Radiation Atlas 2003–2005 [79] | |||||||||||||
| 1.56 | 2.23 | 3.43 | 4.30 | 5.17 | 5.55 | 5.49 | 4.87 | 4.08 | 2.72 | 1.70 | 1.38 | 1294 | |
| EVE Solar Radiation Atlas of the Basque Country [80] | |||||||||||||
| 1.33 | 1.99 | 2.85 | 3.88 | 4.71 | 5.10 | 5.09 | 4.59 | 3.59 | 2.50 | 1.62 | 1.11 | 1169 | |
| Bolueta data by interpolation using Meteonorm 2000–2009 (Temperature) 1981–1990 (Radiation) | |||||||||||||
| 1.90 | 3.04 | 4.52 | 6.30 | 6.71 | 7.77 | 7.42 | 6.10 | 5.50 | 3.61 | 2.30 | 1.68 | 1731 | |
| Bolueta data by interpolation using Meteonorm 2000–2009 (Temperature) 1991–2010 (Radiation) | |||||||||||||
| 1.35 | 2.11 | 3.32 | 4.23 | 5.06 | 5.47 | 5.35 | 4.68 | 3.80 | 2.58 | 1.53 | 1.13 | 1238 | |
| Living Room | ||||||||||||||
|---|---|---|---|---|---|---|---|---|---|---|---|---|---|---|
| Jan. | Feb. | Mar. | Apr. | May | Jun. | Jul. | Aug. | Sep. | Oct. | Nov. | Dec. | Overall | ||
| 2020 | Avg. T (°C) | 23.32 | 22.52 | 21.49 | 22.77 | 23.94 | 23.85 | 25.54 | 25.77 | 25.16 | 22.10 | 22.59 | 21.51 | 23.22 |
| Min. T (°C) | 19.40 | 19.80 | 19.50 | 19.50 | 19.20 | 20.00 | 22.70 | 20.40 | 17.50 | 20.40 | 15.20 | 19.00 | 15.20 | |
| Max. T (°C) | 24.10 | 24.60 | 24.00 | 24.90 | 27.10 | 26.90 | 28.10 | 29.00 | 29.40 | 25.80 | 25.90 | 24.10 | 29.40 | |
| 2021 | Avg. T (°C) | 21.09 | 21.99 | 22.28 | 22.91 | 22.94 | 24.04 | 24.76 | 24.47 | 25.18 | 24.63 | 21.63 | 21.30 | 23.11 |
| Min. T (°C) | 19.10 | 20.70 | 20.50 | 19.80 | 20.20 | 20.00 | 20.70 | 21.70 | 20.40 | 22.00 | 19.50 | 19.20 | 19.10 | |
| Max. T (°C) | 23.10 | 27.70 | 27.00 | 25.40 | 25.00 | 27.40 | 27.10 | 27.20 | 29.40 | 27.40 | 25.20 | 24.90 | 29.40 | |
| 2022 | Avg. T (°C) | 21.55 | 21.23 | 21.54 | 21.67 | 23.28 | 24.10 | 25.33 | 25.63 | 25.28 | 23.31 1 | |||
| Min. T (°C) | 19.60 | 19.80 | 19.70 | 19.70 | 17.60 | 17.60 | 19.20 | 19.10 | 19.90 | 17.60 | ||||
| Max. T (°C) | 25.10 | 24.20 | 25.40 | 24.70 | 26.10 | 27.90 | 29.80 | 29.10 | 31.30 | 31.30 | ||||
| Bedroom | ||||||||||||||
| Jan. | Feb. | Mar. | Apr. | May | Jun. | Jul. | Aug. | Sep. | Oct. | Nov. | Dec. | Total | ||
| 2020 | Avg. T (°C) | 26.80 2 | 26.24 | 25.76 | 23.44 | 24.25 | 22.29 | 24.62 2 | ||||||
| Min. T (°C) | 24.30 2 | 19.30 | 19.80 | 19.80 | 22.00 | 20.50 | 19.30 | |||||||
| Max. T (°C) | 28.30 2 | 28.30 | 28.50 | 29.40 | 25.60 | 26.50 | 29.40 | |||||||
| 2021 | Avg. T (°C) | 22.07 | 22.64 | 22.86 | 23.35 | 23.32 | 24.42 | 25.31 | 25.31 | 25.69 | 25.75 | 23.42 | 22.95 | 23.93 |
| Min. T (°C) | 20.70 | 21.20 | 21.70 | 20.70 | 22.00 | 19.70 | 22.10 | 20.30 | 16.70 | 22.00 | 21.60 | 20.60 | 16.70 | |
| Max. T (°C) | 23.80 | 25.10 | 25.40 | 25.30 | 24.90 | 26.90 | 27.20 | 27.70 | 28.80 | 28.70 | 26.20 | 25.90 | 28.80 | |
| 2022 | Avg. T (°C) | 23.07 | 23.11 | 23.21 | 24.51 | 25.19 | 26.52 | 26.65 | 26.04 | 25.28 | 24.85 1 | |||
| Min. T (°C) | 21.60 | 21.50 | 21.40 | 21.10 | 19.50 | 20.60 | 21.10 | 20.10 | 19.90 | 19.50 | ||||
| Max. T (°C) | 24.70 | 24.90 | 25.20 | 26.80 | 28.10 | 30.40 | 29.60 | 29.30 | 31.30 | 31.30 | ||||
| Living Room | ||||||||||||||
|---|---|---|---|---|---|---|---|---|---|---|---|---|---|---|
| Jan. | Feb. | Mar. | Apr. | May | Jun. | Jul. | Aug. | Sep. | Oct. | Nov. | Dec. | Overall | ||
| 2020 | Avg. RH (%) | 43.6 | 46.4 | 47.7 | 51.2 | 54.0 | 56.0 | 57.9 | 60.0 | 53.9 | 55.1 | 49.5 | 48.4 | 52.0 |
| Min. RH (%) | 39.0 | 41.0 | 40.0 | 36.0 | 48.0 | 46.0 | 50.0 | 45.0 | 40.0 | 47.0 | 42.0 | 42.0 | 36.0 | |
| Max. RH (%) | 50.0 | 53.0 | 57.0 | 59.0 | 64.0 | 66.0 | 71.0 | 77.0 | 67.0 | 64.0 | 67.0 | 56.0 | 77.0 | |
| 2021 | Avg. RH (%) | 47.0 | 47.6 | 44.8 | 43.1 | 49.7 | 58.6 | 59.6 | 61.2 | 60.0 | 49.9 | 50.7 | 50.2 | 51.9 |
| Min. RH (%) | 39.0 | 40.0 | 35.0 | 32.0 | 44.0 | 52.0 | 53.0 | 51.0 | 51.0 | 41.0 | 44.0 | 40.0 | 32.0 | |
| Max. RH (%) | 60.0 | 54.0 | 52.0 | 52.0 | 59.0 | 68.0 | 77.0 | 77.0 | 84.0 | 59.0 | 57.0 | 59.0 | 84.0 | |
| 2022 | Avg. RH (%) | 43.6 | 46.4 | 46.0 | 48.2 | 54.8 | 60.7 | 59.6 | 63.4 | 54.8 | 53.1 1 | |||
| Min. RH (%) | 38.0 | 41.0 | 40.0 | 41.0 | 49.0 | 50.0 | 51.0 | 54.0 | 41.0 | 38.0 | ||||
| Max. RH (%) | 56.0 | 53.0 | 51.0 | 57.0 | 69.0 | 73.0 | 88.0 | 76.0 | 79.0 | 79.0 | ||||
| Bedroom | ||||||||||||||
| Jan. | Feb. | Mar. | Apr. | May | Jun. | Jul. | Aug. | Sep. | Oct. | Nov. | Dec. | Total | ||
| 2020 | Avg. RH (%) | 55.5 2 | 56.7 | 49.5 | 51.3 | 43.8 | 43.8 | 49.6 2 | ||||||
| Min. RH (%) | 48.0 2 | 37.0 | 28.0 | 39.0 | 33.0 | 35.0 | 28.0 | |||||||
| Max. RH (%) | 65.0 2 | 78.0 | 66.0 | 66.0 | 57.0 | 58.0 | 78.0 | |||||||
| 2021 | Avg. RH (%) | 42.4 | 43.2 | 40.3 | 38.0 | 45.8 | 55.2 | 55.5 | 56.0 | 55.4 | 43.2 | 42.6 | 42.6 | 46.7 |
| Min. RH (%) | 31.0 | 33.0 | 25.0 | 18.0 | 36.0 | 41.0 | 46.0 | 45.0 | 44.0 | 33.0 | 33.0 | 28.0 | 18.0 | |
| Max. RH (%) | 60.0 | 56.0 | 51.0 | 50.0 | 60.0 | 74.0 | 67.0 | 69.0 | 76.0 | 55.0 | 53.0 | 53.0 | 76.0 | |
| 2022 | Avg. RH (%) | 37.8 | 37.6 | 40.0 | 47.7 | 54.1 | 52.9 | 57.1 | 47.2 | 54.8 | 47.8 1 | |||
| Min. RH (%) | 30.0 | 31.0 | 31.0 | 41.0 | 43.0 | 42.0 | 47.0 | 37.0 | 41.0 | 30.0 | ||||
| Max. RH (%) | 79.0 | 53.0 | 51.0 | 57.0 | 69.0 | 73.0 | 88.0 | 76.0 | 79.0 | 88.0 | ||||
| Living Room | ||||||||||||||
|---|---|---|---|---|---|---|---|---|---|---|---|---|---|---|
| Jan. | Feb. | Mar. | Apr. | May | Jun. | Jul. | Aug. | Sep. | Oct. | Nov. | Dec. | Overall | ||
| 2020 | Avg. [CO2] (ppm) | 530 | 510 | 522 | 563 | 580 | 539 | 505 | 532 | 538 | 580 | 2072 | 566 | 668 |
| Min. [CO2] (ppm) | 398 | 315 | 398 | 415 | 398 | 386 | 413 | 367 | 371 | 448 | 434 | 394 | 315 | |
| Max. [CO2] (ppm) | 1076 | 774 | 779 | 778 | 834 | 766 | 664 | 744 | 762 | 913 | 5014 | 1122 | 5014 | |
| 2021 | Avg. [CO2] (ppm) | 574 | 532 | 558 | 540 | 542 | 554 | 541 | 514 | 540 | 508 | 574 | 547 | 544 |
| Min. [CO2] (ppm) | 413 | 389 | 398 | 407 | 407 | 415 | 418 | 411 | 373 | 414 | 410 | 398 | 373 | |
| Max. [CO2] (ppm) | 1097 | 691 | 845 | 767 | 736 | 870 | 683 | 702 | 711 | 655 | 1290 | 742 | 1290 | |
| 2022 | Avg. [CO2] (ppm) | 536 | 529 | 526 | 520 | 507 | 527 | 549 | 543 | 561 | 533 1 | |||
| Min. [CO2] (ppm) | 402 | 400 | 412 | 395 | 387 | 389 | 416 | 381 | 432 | 381 | ||||
| Max. [CO2] (ppm) | 1152 | 718 | 770 | 644 | 674 | 758 | 780 | 794 | 834 | 1152 | ||||
| Bedroom | ||||||||||||||
| Jan. | Feb. | Mar. | Apr. | May | Jun. | Jul. | Aug. | Sep. | Oct. | Nov. | Dec. | Overall | ||
| 2020 | Avg. [CO2] (ppm) | 496 2 | 485 | 509 | 734 | 672 | 719 | 611 2 | ||||||
| Min. [CO2] (ppm) | 388 2 | 375 | 389 | 388 | 399 | 381 | 375 | |||||||
| Max. [CO2] (ppm) | 706 2 | 698 | 1207 | 2001 | 1457 | 1501 | 2001 | |||||||
| 2021 | Avg. [CO2] (ppm) | 751 | 672 | 723 | 585 | 639 | 534 | 523 | 491 | 505 | 517 | 665 | 659 | 605 |
| Min. [CO2] (ppm) | 374 | 366 | 378 | 369 | 387 | 385 | 389 | 386 | 393 | 384 | 388 | 377 | 366 | |
| Max. [CO2] (ppm) | 1552 | 691 | 845 | 767 | 736 | 870 | 683 | 702 | 711 | 655 | 1290 | 742 | 1552 | |
| 2022 | Avg. [CO2] (ppm) | 604 | 594 | 548 | 525 | 483 | 472 | 476 | 458 | 561 | 524 1 | |||
| Min. [CO2] (ppm) | 380 | 380 | 392 | 392 | 389 | 384 | 393 | 386 | 432 | 380 | ||||
| Max. [CO2] (ppm) | 1152 | 718 | 770 | 644 | 674 | 758 | 780 | 794 | 834 | 1152 | ||||
| Living Room | ||||||||
|---|---|---|---|---|---|---|---|---|
| Year | Total Year Hours | Analysed Hours | HoursT > 25 °C | % Hours T > 25 °C (Analysis) | % Hours T > 25 °C (Year) | Yearly Limit | Assessment 2 | |
| 2020 1 | 8760 h | 8760 h | 1790 h | 20.43% | 20.43% | 876 h (10%) | “Catastrophic” | • |
| 2021 | 8760 h | 1181 h | 13.48% | 13.48% | “Poor” | • | ||
| 2022 | 6582 h | 1528 h | 23.21% | 17.44% | “Catastrophic” | • | ||
| Bedroom | ||||||||
| Year | Total year hours | Analysed hours | HoursT > 25 °C | % Hours T > 25 °C (analysis) | % Hours T > 25 °C (year) | Yearly limit | Assessment | |
| 2020 1 | 8760 h | 4064 h | 1645 h | 40.48% | 18.78% | 876 h (10%) | “Catastrophic” | • |
| 2021 | 8760 h | 2270 h | 25.91% | 25.91% | “Catastrophic” | • | ||
| 2022 | 6552 h | 2786 h | 42.52% | 31.80% | “Catastrophic” | • | ||
| Living Room | |||||||||||||
| Year | Jan. | Feb. | Mar. | Apr. | May | Jun. | Jul. | Aug. | Sep. | Oct. | Nov. | Dec. | Total 1 |
| 2020 | - | - | - | - | 19.49% | 19.03% | 69.76% | 74.06% | 56.94% | 0.27% | 3.61% | - | 20.43% |
| 2021 | - | 0.60% | 1.48% | 0.83% | - | 18.61% | 35.89% | 24.87% | 46.94% | 31.32% | 0.42% | - | 13.48% |
| 2022 | 0.27% | 0.00% | 0.27% | 0.00% | 6.72% | 26.67% | 52.82% | 68.55% | 52.64% | 17.44% | |||
| Bedroom | |||||||||||||
| Year | Jan. | Feb. | Mar. | Apr. | May | Jun. | Jul. | Aug. | Sep. | Oct. | Nov. | Dec. | Total 1 |
| 2020 | 52.15% | 83.20% | 70.28% | 2.28% | 15.97% | - | 18.78% | ||||||
| 2021 | - | 0.15% | 0.94% | 0.69% | - | 25.00% | 64.38% | 64.92% | 68.89% | 77.69% | 4.31% | 1.34% | 25.91% |
| 2022 | - | - | 1.48% | 30.42% | 60.22% | 81.53% | 88.98% | 64.52% | 52.64% | 31.80% | |||
| Living Room | ||||||||
|---|---|---|---|---|---|---|---|---|
| Year | Total Year Hours | Analysed Hours | Hours W > 12 g/kg | % Hours W > 12 g/kg (Analysis) | % Hours W > 12 g/kg (Year) | Yearly Limit | Assessment 2 | |
| 2020 1 | 8760 h | 8760 h | 1065 h | 12.16% | 12.16% | 1752 h (20%) | Pass | • |
| 2021 | 8760 h | 1074 h | 12.26% | 12.26% | Pass | • | ||
| 2022 | 6582 h | 1405 h | 21.35% | 16.04% | Pass | • | ||
| Bedroom | ||||||||
| Year | Total year hours | Analysed hours | Hours W > 12 g/kg | % Hours W > 12 g/kg (analysis) | % Hours W > 12 g/kg (year) | Yearly limit | Assessment | |
| 2020 1 | 8760 h | 4064 h | 726 h | 17.86% | 8.29% | 1752 h (20%) | Pass | • |
| 2021 | 8760 h | 735 h | 8.39% | 8.39% | Pass | • | ||
| 2022 | 6552 h | 1173 h | 17.90% | 13.39% | Pass | • | ||
| 2020 | ||||||||||||
|---|---|---|---|---|---|---|---|---|---|---|---|---|
| Room | Analysed Hours | Cat. | Hours of Exceedance, He 1 | Night Hours T > 26 °C 2 | Overheating 3 | |||||||
| Hours | % | Limit | Hours | % | Limit | |||||||
| Living room | 8760 h | I | 30 h | 0.34% | 3% | • | No | • | ||||
| II | 0 h | 0.00% | • | No | • | |||||||
| Bedroom | 4064 h | I | 50 h | 0.57% | 3% | • | 365 h | 11.1% | 1% | • | Yes | • |
| II | 6 h | 0.07% | • | |||||||||
| 2021 | ||||||||||||
| Room | Analysed hours | Cat. | Hours of Exceedance, He 1 | Night Hours T > 26 °C 2 | Overheating | |||||||
| Hours | % | Limit | Hours | % | Limit | |||||||
| Living room | 8760 h | I | 2 h | 0.02% | 3% | • | No | • | ||||
| II | 0 h | 0.00% | • | No | • | |||||||
| Bedroom | 8760 h | I | 1 h | 0.01% | 3% | • | 181 h | 5.51% | 1% | • | Yes | • |
| II | 0 h | 0.00% | • | |||||||||
| 2022 | ||||||||||||
| Room | Analysed hours | Cat. | Hours of Exceedance, He 1 | Night Hours T > 26 °C 2 | Overheating | |||||||
| Hours | % | Limit | Hours | % | Limit | |||||||
| Living room | 6582 h | I | 12 h | 0.14% | 3% | • | No | • | ||||
| II | 4 h | 0.05% | • | No | • | |||||||
| Bedroom | 6552 h | I | 323 h | 3.69% | 3% | • | 572 h | 17.41% | 1% | • | Yes | • |
| II | 46 h | 0.53% | • | |||||||||
| Living Room | |||||||||||||||
|---|---|---|---|---|---|---|---|---|---|---|---|---|---|---|---|
| Year | Jan. | Feb. | Mar. | Apr. | May | Jun. | Jul. | Aug. | Sep. | Oct. | Nov. | Dec. | Total | Overheating 1 | |
| 2020 | - | - | - | - | 5.24% | 6.53% | 30.78% | 46.10% | 32.50% | - | - | - | 10.18% | Yes | • |
| 2021 | - | - | - | - | 5.24% | 6.53% | 30.78% | 46.10% | 32.50% | - | - | - | 4.77% | Yes | • |
| 2022 | - | - | - | - | 0.13% | 7.50% | 35.62% | 40.46% | 37.92% | 10.21% | Yes | • | |||
| Bedroom | |||||||||||||||
| Year | Jan. | Feb. | Mar. | Apr. | May | Jun. | Jul. | Aug. | Sep. | Oct. | Nov. | Dec. | Total | Overheating 1 | |
| 2020 | 42.61% | 63.84% | 45.56% | - | - | - | 12.91% | Yes | • | ||||||
| 2021 | - | - | - | - | - | 2.78% | 13.17% | 17.61% | 36.25% | 34.68% | 0.69% | - | 8.82% | Yes | • |
| 2022 | - | - | - | 3.33% | 25.94% | 58.47% | 72.85% | 49.19% | 37.92% | 20.76% | Yes | • | |||
| Living Room | |||||||||||||
| Year | Jan. | Feb. | Mar. | Apr. | May | Jun. | Jul. | Aug. | Sep. | Oct. | Nov. | Dec. | Total 1 |
| 2020 | - | - | - | 6.67% | 49.82% | 38.52% | 92.83% | 85.30% | 74.81% | 0.72% | 10.00% | 0.00% | 30.11% |
| 2021 | - | - | 2.38% | 11.11% | 5.73% | 45.93% | 72.76% | 51.61% | 81.48% | 75.27% | - | - | 29.01% |
| 2022 | 2.15% | - | - | 0.37% | 15.77% | 38.89% | 70.97% | 80.29% | 60.37% | 22.56% | |||
| Bedroom | |||||||||||||
| Year | Jan. | Feb. | Mar. | Apr. | May | Jun. | Jul. | Aug. | Sep. | Oct. | Nov. | Dec. | Total 1 |
| 2020 | 52.33% | 89.96% | 78.89% | 8.60% | 47.04% | - | 23.17% | ||||||
| 2021 | - | - | 1.98% | 14.81% | 10.75% | 77.04% | 96.77% | 91.40% | 92.59% | 91.76% | 17.41% | 7.17% | 42.04% |
| 2022 | 4.30% | 12.30% | 17.46% | 67.78% | 85.30% | 95.56% | 94.98% | 81.36% | 60.37% | 43.26% | |||
| Living Room | Bedroom | |||||||||||
|---|---|---|---|---|---|---|---|---|---|---|---|---|
| Year | Average [CO2] | Limit | Assessment | Excess 1 (ppm·h) | Limit (ppm·h) | Assessment | Average [CO2] | Limit | Assessment | Excess 1 (ppm·h) | Limit (ppm·h) | Assessment |
| 2020 | 668 ppm | 900 ppm | Pass • | 652,531 | 500,000 | Fail • | 668 ppm | 900 ppm | Pass • | 821 | 500,000 | Pass • |
| 2021 | 544 ppm | 900 ppm | Pass • | 0 | 500,000 | Pass • | 544 ppm | 900 ppm | Pass • | 0 | 500,000 | Pass • |
| 2022 | 533 ppm | 900 ppm | Pass • | 0 | 500,000 | Pass • | 533 ppm | 900 ppm | Pass • | 0 | 500,000 | Pass • |
| Question | October 2020 (84 Respondents) | October 2023 (134 Respondents) | ||
|---|---|---|---|---|
| What is your usual thermal sensation in the winter inside your home? | Neutral | 66.7% | Neutral | 64.4% |
| Slightly warm | 11.9% | Slightly warm | 12.2% | |
| Warm | 14.3% | Warm | 11.1% | |
| Very warm | 0.5% | Very warm | 4.4% | |
| In winter, do you have difficulty sleeping due to discomfort in your home? | No | 72.7% | No | 74.4% |
| Yes, due to heat | 18.2% | Yes, due to heat | 14.4% | |
| What is your usual thermal sensation in the summer inside your home? * | Slightly warm | 2.4% | Slightly warm | 8.9% |
| Warm | 97.6% | Warm | 27.8% | |
| Very warm | 60.0% | |||
| In summer, do you have difficulty sleeping due to discomfort in your home? | Yes, due to heat | 97.0% | Yes, due to heat | 81.1% |
| No | 3.0% | No | 18.9% | |
| Rate from 1 to 10 the overall quality of your dwelling. | <5, | 19.1% | <5, | 15.5% |
| 5–6, | 39.2% | 5–6, | 18.9% | |
| 7–8, | 35.7% | 7–8, | 62.2% | |
| 9–10 | 6.0% | 9–10 | 3.3% | |
| Period | Start Date | End Date | Number of Days | m3 | L/Day |
|---|---|---|---|---|---|
| Year | 20/07/2021 | 20/07/2022 | 365 | 47 | 128.8 |
| Total | 10/03/2019 | 19/01/2023 | 1441 | 165 | 116.9 |
| DHW (Normative) | Heating | ||||||||
|---|---|---|---|---|---|---|---|---|---|
| Start Date | End Date | No. of Days | kWh/Year | kWh/Day | kWh/Year | kWh/Day | kWh/Year | Heating kWh/Day | |
| Year | 20/07/2021 | 20/07/2022 | 365 | 732 | 2.01 | 590 | 1.62 | 142 | 0.39 |
| Total | 10/03/2019 | 19/01/2023 | 1441 | 165 | 1.95 | 590 | 1.62 | 142 | 0.33 |
| Total | DHW (Normative) | Heating | |||||||
|---|---|---|---|---|---|---|---|---|---|
| Start Date | End Date | No. of Days | W/m2y | kWh/m2y | kWh/m2y | % | kWh/m2y | % | |
| Year | 20/07/2021 | 20/07/2022 | 365 | 1.01 | 8.78 | 7.08 | 80.6% | 1.70 | 19.4% |
| Total | 10/03/2019 | 19/01/2023 | 1441 | 0.96 | 8.54 | 7.08 | 82.9% | 1.46 | 17.1% |
| Year | Start Date | End Date | Number of Days | kWh/Day | kWh/Year | kWh (Period) | kWh/m2y |
|---|---|---|---|---|---|---|---|
| 2019 | 10/03/2019 | 31/12/2019 | 296 | 3.21 | 1172.72 | 951.03 | 14.07 |
| 2020 | 01/01/2020 | 31/12/2020 | 365 | 4.98 | 1816.06 | 1816.06 | 21.79 |
| 2021 | 01/01/2021 | 31/12/2021 | 364 | 5.95 | 2170.26 | 2164.31 | 26.04 |
| 2022 | 01/01/2022 | 31/12/2022 | 364 | 5.35 | 1953.87 | 1948.52 | 23.44 |
| Total | 10/03/2019 | 31/12/2022 | 1389 | 4.95 | 7112.91 | 6879.92 | 21.69 |
| Sum of Monthly Consumption [kWh] | Monthly Consumption per Unit of Area [kWh/m2] | ||||||||
|---|---|---|---|---|---|---|---|---|---|
| Month | 2019 | 2020 | 2021 | 2022 | Month | 2019 | 2020 | 2021 | 2022 |
| Jan. | 44.79 | 105.25 | 183.46 | 175.67 | Jan. | 0.54 | 1.28 | 2.23 | 2.13 |
| Feb. | 44.31 | 104.35 | 172.48 | 146.06 | Feb. | 0.54 | 1.27 | 2.10 | 1.77 |
| Mar. | 56.29 | 107.40 | 175.81 | 159.69 | Mar. | 0.68 | 1.30 | 2.14 | 1.94 |
| Apr. | 77.69 | 155.68 | 178.07 | 167.08 | Apr. | 0.94 | 1.89 | 2.16 | 2.03 |
| May | 101.00 | 151.56 | 189.75 | 168.52 | May | 1.23 | 1.84 | 2.31 | 2.05 |
| Jun. | 95.92 | 158.83 | 185.30 | 155.47 | Jun. | 1.17 | 1.93 | 2.25 | 1.89 |
| Jul. | 100.11 | 163.45 | 167.63 | 170.32 | Jul. | 1.22 | 1.99 | 2.04 | 2.07 |
| Aug. | 133.59 | 186.01 | 186.60 | 187.04 | Aug. | 1.62 | 2.26 | 2.27 | 2.27 |
| Sep. | 101.14 | 156.75 | 169.98 | 135.52 | Sep. | 1.23 | 1.90 | 2.06 | 1.65 |
| Oct. | 97.21 | 151.50 | 180.06 | 157.00 | Oct. | 1.18 | 1.84 | 2.19 | 1.91 |
| Nov. | 89.28 | 171.84 | 197.91 | 159.95 | Nov. | 1.08 | 2.09 | 2.40 | 1.94 |
| Dec. | 113.69 | 203.45 | 176.82 | 166.20 | Dec. | 1.38 | 2.47 | 2.15 | 2.02 |
| Total | 1055.00 | 1816.06 | 2163.88 | 1948.52 | Total | 12.82 | 22.06 | 26.29 | 23.67 |
Disclaimer/Publisher’s Note: The statements, opinions and data contained in all publications are solely those of the individual author(s) and contributor(s) and not of MDPI and/or the editor(s). MDPI and/or the editor(s) disclaim responsibility for any injury to people or property resulting from any ideas, methods, instructions or products referred to in the content. |
© 2024 by the authors. Licensee MDPI, Basel, Switzerland. This article is an open access article distributed under the terms and conditions of the Creative Commons Attribution (CC BY) license (https://creativecommons.org/licenses/by/4.0/).
Share and Cite
Rodríguez-Vidal, I.; Hernández-Minguillón, R.J.; Otaegi, J. Long-Term Analysis of Energy Consumption and Thermal Comfort in a Passivhaus Apartment in Spain. Buildings 2024, 14, 878. https://doi.org/10.3390/buildings14040878
Rodríguez-Vidal I, Hernández-Minguillón RJ, Otaegi J. Long-Term Analysis of Energy Consumption and Thermal Comfort in a Passivhaus Apartment in Spain. Buildings. 2024; 14(4):878. https://doi.org/10.3390/buildings14040878
Chicago/Turabian StyleRodríguez-Vidal, Iñigo, Rufino J. Hernández-Minguillón, and Jorge Otaegi. 2024. "Long-Term Analysis of Energy Consumption and Thermal Comfort in a Passivhaus Apartment in Spain" Buildings 14, no. 4: 878. https://doi.org/10.3390/buildings14040878
APA StyleRodríguez-Vidal, I., Hernández-Minguillón, R. J., & Otaegi, J. (2024). Long-Term Analysis of Energy Consumption and Thermal Comfort in a Passivhaus Apartment in Spain. Buildings, 14(4), 878. https://doi.org/10.3390/buildings14040878