Article

Seeing and Thinking about Urban Blue–Green Space: Monitoring Public Landscape Preferences Using Bimodal Data

by
Chenglong Dao
1 and
Jun Qi
1,2,*
1
College of Landscape Architecture and Horticulture, Southwest Forestry University, Kunming 650224, China
2
Southwest Research Center for Landscape Architecture Engineering, State Forestry and Grassland Administration, Kunming 650224, China
*
Author to whom correspondence should be addressed.
Buildings 2024, 14(5), 1426; https://doi.org/10.3390/buildings14051426
Submission received: 12 April 2024 / Revised: 12 May 2024 / Accepted: 13 May 2024 / Published: 15 May 2024
(This article belongs to the Special Issue Text Mining and Natural Language Processing in the Built Environment)

Abstract

:
Urban blue–green spaces (UBGSs) are a significant avenue for addressing the worldwide mental health crisis. To effectively optimise landscape design and management for the promotion of health benefits from UBGS, it is crucial to objectively understand public preferences. This paper proposes a method to evaluate public landscape preference from the perspective of seeing and thinking, takes the examples of seven parks around the Dianchi Lake in Kunming, China, and analyses the social media data by using natural language processing technology and image semantic segmentation technology. The conclusions are as follows: (1) The public exhibits significantly high positive sentiments towards various UBGSs, with over 93% of comments expressed positive sentiments. (2) Differences exist in the frequency and perception of landscape features between image and text modalities. Landscape elements related to stability are perceived more in images than in text, while dynamic and experiential elements are perceived more in text than in images. (3) In both modalities, the distinctive landscape features of parks are more frequently perceived and preferred by the public. In the end, the intrinsic links between landscape elements and public sentiment and preferences are discussed, and suggestions for design and management improvements are made to consolidate their health benefits to the public.

1. Introduction

Urban blue–green spaces (UBGSs) are considered one of the most vital ecosystems and dynamic urban places [1]. They serve as essential providers of ecological regulation services [2] and recreational opportunities in urban environments [3]. Beyond their ecological and sociocultural benefits, UBGSs significantly enhance public physical and mental health, thus contributing to human well-being [4,5]. Empirical studies have substantiated that natural environments offer more favourable outcomes in terms of reducing stress, facilitating perceptual recovery, and improving affect and cognition for the general public in comparison to urban artificial environments [6,7,8,9]. However, increasing urbanization has resulted in the expansion of urban environments and a fast-paced, high-intensity lifestyle that significantly reduces opportunities and time for urban residents to access natural environments. This poses a serious threat to the mental health of those residing in urban areas. Therefore, utilising the accessibility advantage of UBGSs and maximising its health benefits has emerged as a feasible solution to tackle the worldwide public mental health crisis [10].
Currently, investigations into UBGSs and their influence on public mental health largely centre around two key outlooks: the macro perspective and the humanistic perspective [11]. From a macro perspective, a large number of studies have examined the relationship between the availability of UBGSs (e.g., quantity, area, distance) and residents’ mental health from a supply and demand perspective using large-scale cross-sectional measures, mainly based on the criterion of “quantity” [12,13,14]. However, not all natural environments in urban areas equally promote mental health, as different spatial types [15,16] and landscape features [17] have been found to have different effects on individual well-being. As the demand for quality UBGSs continues to grow, assessments of landscape quality and preferences from a humanistic perspective are becoming increasingly important based on the interactions between the physical characteristics of the landscape and the public’s perceptions [18,19,20].
Landscape preference serves as a rapid and intuitive expression of an individual’s perception of the environment. Studies have indicated a correlation between landscape preference and mental health in the general public [21,22]. Van den Berg and his colleagues examined the mediating role of recovery in environmental preferences by having participants view environmental videos. They found that higher preferences were associated with greater affective restoration (including restoration from mental fatigue and restoration from anxiety-based stress). Stress reduction theory suggests that features of attractive natural environments stimulate positive emotional states and restorative psychophysiological responses in the human autonomic nervous system through the activation of the parasympathetic nervous system and a reduction in concomitant stress [23,24], resulting in favourable alterations in physical and psychological well-being. In other words, individuals who have a greater preference for a specific natural landscape have a higher potential for emotional restoration. Conversely, the potential for restoration can decrease when individuals encounter elements in the environment that they do not favour. For instance, visible pollutants [25], overgrown vegetation [26], and potentially threatening wildlife [24] may elicit aversive emotions. Some studies indicate that interacting with nature through physical contact can have a greater positive impact on stress relief and feelings of recovery than merely observing or being present within a natural environment [27,28]. Thus, engaging with nature in a preferred environment can therefore have greater psychological benefits. However, the impact of UBGS on individuals differs based on personal necessities, aesthetic preferences, and specific landscape features that influence perceptions [29,30,31].
The development of the internet and smart devices has provided a new approach to studying public perception and evaluation of UBGSs. Collecting multisource data from social media or online review platforms (e.g., Flickr, Twitter, Weibo, Dianping, Ctrip), researchers examine the public’s perceptions of physical features such as landscape space and resources in different types and sizes of UBGSs. This approach from a humanistic perspective offers valuable insight into individuals’ spatial choices, emotions, and landscape preferences, along with the factors that affect them [20,32,33]. Of the available data types, text and images are the most commonly utilised. In recent years, advancements in deep learning technology have enabled the large-scale automated processing of text and image data in online comments through natural language processing and image processing [34,35]. This breakthrough has eliminated the limitations posed by traditional methods, such as questionnaire surveys and expert scores in terms of information sources, data volume, and authenticity for quantitative analysis. Methodologically, it overcomes the constraints of prior research, which mainly depended on manual coding and qualitative analysis. In these studies, the results were prone to individual bias and subjectivity [36] and were not easily applicable to large datasets and broad research fields.
Web review platforms in the Web 2.0 era embody the behaviour of subjective evaluation grounded in usage and consumption [37]. These platforms encourage users to evaluate and share their sentiments regarding parks or attractions by uploading photos. The user-generated comments not only convey subjective evaluations but also combine textual and visual elements, resulting in what is commonly known as “truth in images”. However, when conveying the same information, discrepancies in interpretation may emerge between image and text [38]. For instance, text comments reflect processed perceptual information and exhibit abstract, core, and decontextualised features [39]. Individual cognitive factors may limit the comprehensiveness of people’s expressions regarding environmental perceptual elements, which can lead to incomplete quantification issues. However, text comments often contain intense individual sentiment, providing a broader view of individuals’ satisfaction with UBGSs [34] and the impact of the environment on their psychological well-being [14]. On the other hand, for photographs, intuitive visual content can serve as the primary component in photo narratives [35] to visually represent public perception and compensate for the absence of linguistic expression. However, it is worth noting that the photographs within the comments represent not only people’s aesthetic appreciation of the objects but also an expression of the scene in front of them and their own feelings in a “documentary” form [37]. In essence, user-uploaded comment photos not only encompass positive emotions and “likes” but also serve as evidence of negative emotions and “dislikes” [40]. In prior studies on landscape preferences using commented photographs, researchers have often regarded the photos’ contents as aesthetic objects for the general public, emphasising the semantic information conveyed by the images while overlooking the emotional expressions in users’ comments. When exploring the public’s landscape preferences and sentiment tendencies through comment data, reliance on single modal data may be inadequate to fully extract users’ perceptual information and emotional tendencies. In this regard, text and images have certain complementary roles.
This thesis proposes a landscape preference assessment method based on bimodal data with the aim of exploring which landscape elements contribute to the public’s positive and negative perceptions of UBGSs. The objective is to provide more targeted recommendations for the design and management of landscapes in UBGSs in order to optimise positive perceptions. The framework is presented in Figure 1. Initially, we employed textual sentiment analysis approaches to establish users’ sentiments towards the park and categorise positive and negative comments in order to gauge their level of satisfaction. Second, to determine the landscape elements and assess the similarity in landscape perception frequency and degree across both data modalities, textual data mining and image semantic segmentation techniques were employed. Following this, a method for assessing landscape preferences based on bimodal data was used to quantify the preferences of the public for four different types of parks. Finally, this thesis examines the causes of the public’s opinions on UBGS landscapes and the efficacy of the bimodal approach in measuring landscape preference.

2. Data and Methods

2.1. Case Study Area

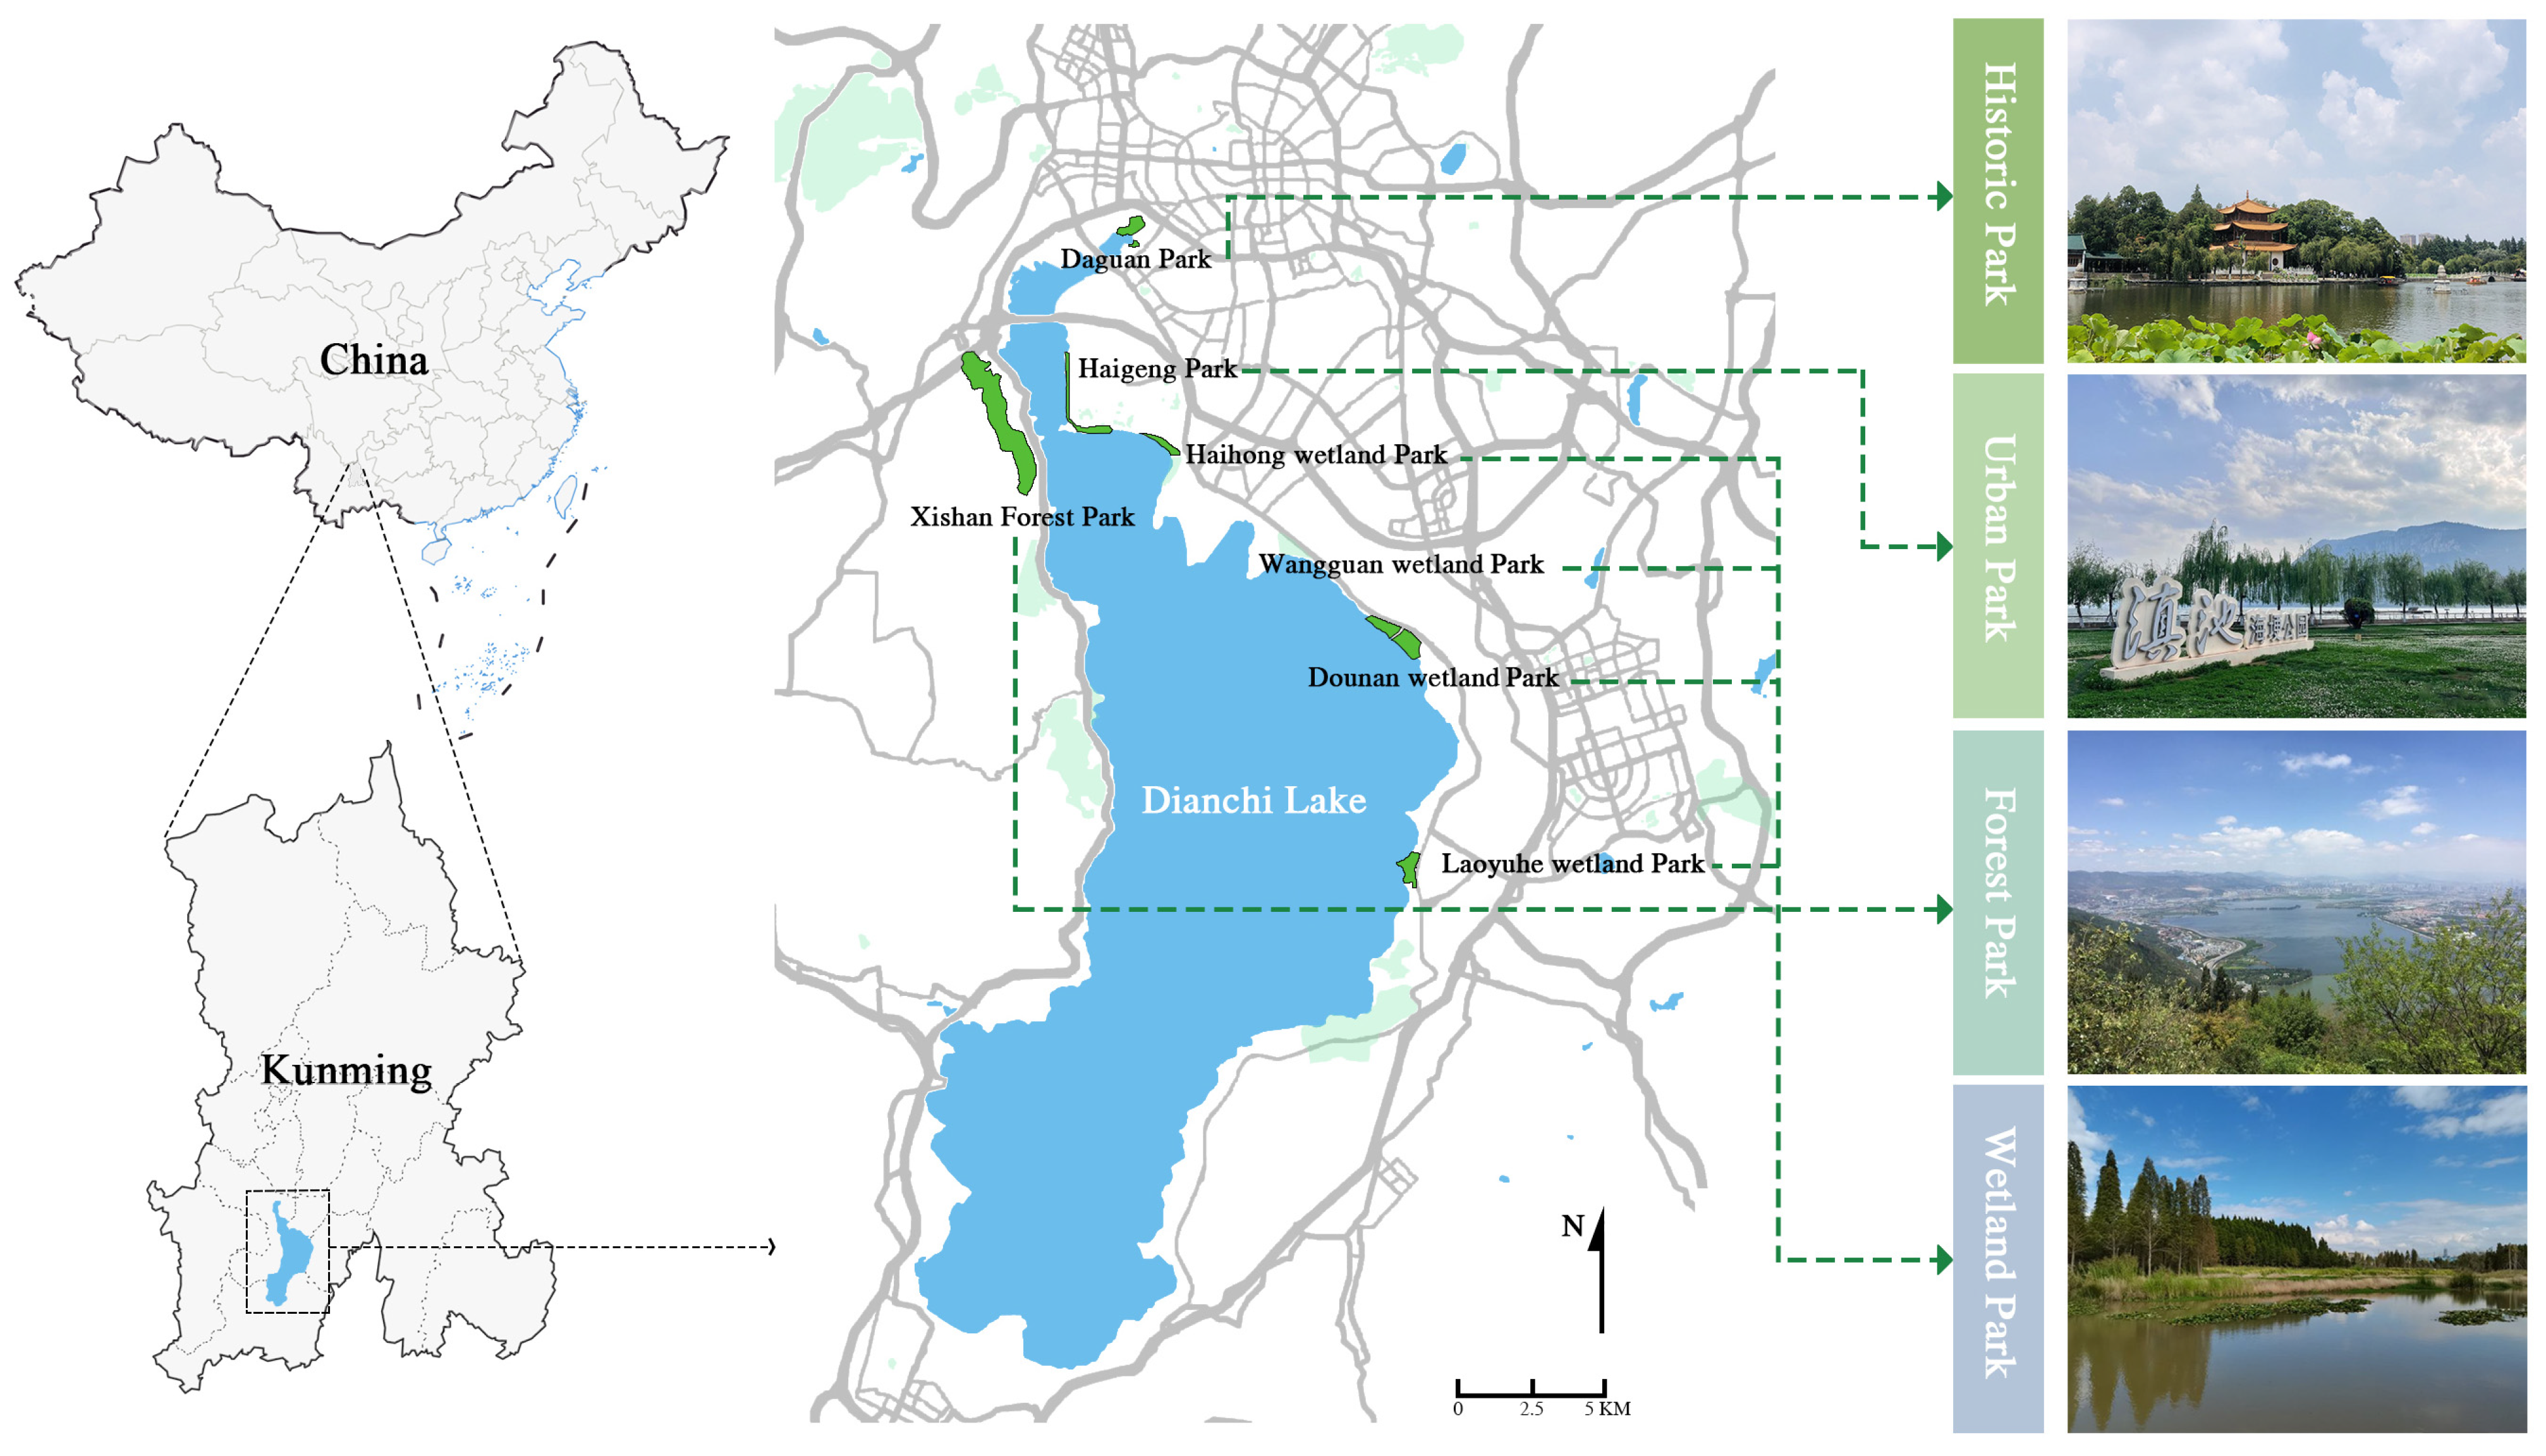
We selected seven parks located along Dianchi Lake, the largest lake in Yunnan Province and the focal point of Kunming’s ancient city construction, as representatives of UBGSs (Figure 2). Dianchi Lake, together with the surrounding green spaces such as parks, forests, wetlands, and classical gardens, constitutes the UBGSs. It offers diverse leisure spaces and cultural experiences for the public. However, as people’s demand for leisure and spirituality increases, there is a mismatch between the quality of physical spaces and the public’s needs, which even negatively affects the public’s mental and physical health. These types of problems are prevalent in different UBGSs. To study the public’s preferences and dislikes of landscape elements in various types of UBGSs, we divided the case study region into four groups. Our categorization was based on park size, geographical location, the number of images and text feedback received, and the particular landscape characteristics of each park. The four groups are urban parks, historical parks, forest parks, and wetland parks, and they are indicative of our research on UBGSs. Table 1 provides further details on the park categories.

2.2. Data Collection and Preprocessing

The data for this study were primarily obtained from three major Chinese online review platforms: Meituan.com, Ctrip.com, and Dianping.com. These platforms possess a vast user base and a substantial amount of comment data, thus offering a rich source of information that can effectively cater to the data requirements of this study. We utilised the park name as the primary search term to gather comments and subsequently screened comments with photos. The data collected included user ID, upload time, text comments, and photos. To ensure that the image and text data were linked, the first photo was selected as the image data for analysis. Our data collection spanned from 1 March 2018, to 1 March 2023, and we obtained a total of 14,503 data points through the Python program. Finally, we preprocessed the comment data by eliminating any comment data unrelated to the landscape, such as those regarding advertisements, restaurants, and accommodations. Furthermore, we removed any non-landscape photos, such as selfies, food pictures, maps, and tickets. After these processes, we acquired 12,766 text data and corresponding image data for the review dataset. Of these, urban parks, historical parks, and forest parks represented 5777, 2005, and 3230 entries, respectively. Due to the limited amount of data received on a single wetland park and for the sake of ensuring data balance, four comparable wetland parks were chosen as case sites, which resulted in the accumulation of 1754 data entries.

2.3. Text Sentiment Polarity Classification

In this study, we utilised the text sentiment propensity model training platform provided by EASYDL (ai.baidu.com) to train and invoke the text sentiment classification model, achieving the automated classification of text comments into either a positive or negative sentiment. As displayed in Table 2, after training on 1200 random samples, the model obtained an overall precision rate of 92.5%, an overall recall rate of 91.6%, and every classification metric surpassed 88.0%. These results indicate that the model performed proficiently overall. According to the documentation of the Baidu Sentiment Analysis algorithm, we selected 12,766 items of data with a confidence level higher than 0.5. The sentiment parameters were classified into three categories: positive sentiment (0.667–1.000], neutral sentiment [0.333–0.667], and negative sentiment [0–0.333). To investigate the factors that influence the formation of positive and negative attitudes among the general public, we chose to analyse two types of data—positive and negative sentiments.

2.4. TF-IDF Computation

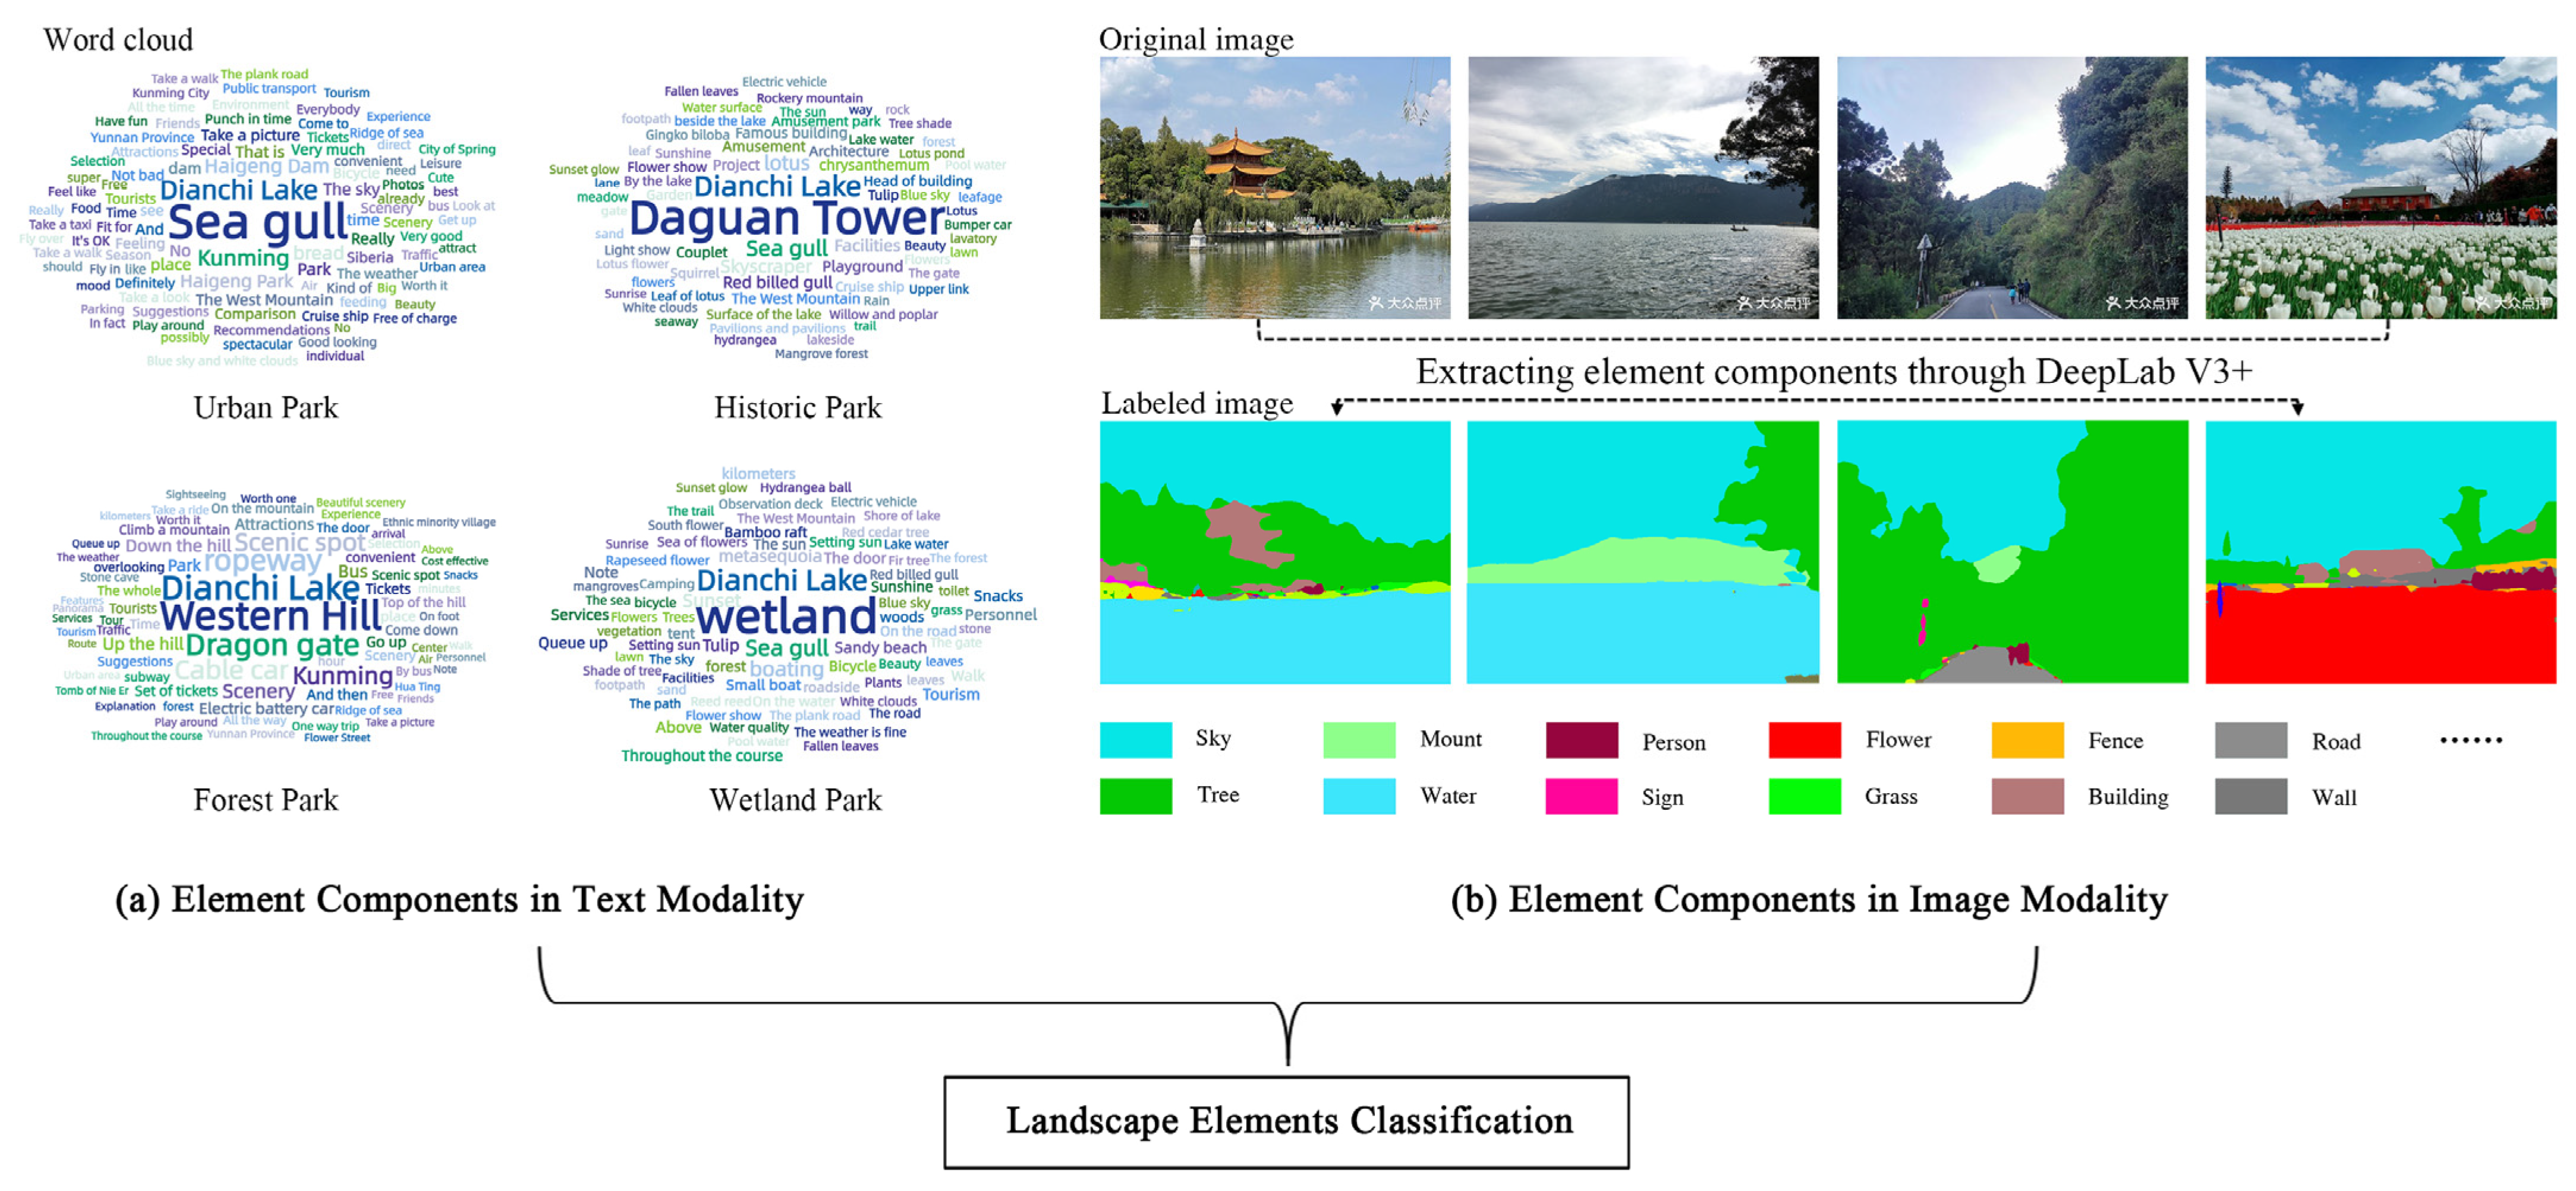
TF-IDF is primarily utilised for assessing and computing the significance of particular words within a collection of documents or corpus. Thus, a higher TF-IDF score indicates that the word appears often in the document but is relatively rare in the entire document set, demonstrating its representativeness and uniqueness [41]. In this study, we utilised Python to compute the TF-IDF of textual landscape elemental components for positive and negative review data of four park types. Initially, we conducted word frequency analysis to obtain high-frequency words (Figure 3a). Landscape-related words were selected from the top 500 high-frequency words for synonym merging, and subsequently, the TF-IDF weights of the landscape words were calculated. Calculation of the TF-IDF follows this formula:
T F I D F ( t , d , D ) = T F ( t , d ) × I D F ( t , D ) = n t , d N d × log ( N D n t )
where TF(t, d) represents the word frequency of lexical item t in document d, nt,d refers to the number of occurrences of lexical item t in document d, Nd denotes the total number of words in document d, IDF(t, D) represents the inverse document frequency of lexical item t, ND represents the total number of documents in the document set D, and nt represents the number of documents where the lexical item t appears in the document set D.

2.5. Image Semantic Segmentation

The rapid development in deep learning and computer vision provides robust backing for image semantic segmentation. At present, deep neural networks are predominantly used to derive image features and accomplish pixel-level classification via automatic learning for tasks related to image semantic segmentation [42]. In this study, we implemented the task of semantic segmentation for landscape photos using Python coding and the DeepLabv3+ model, which was pre-trained with the ADE20K dataset (Figure 3b). The ADE20K dataset encompasses diverse urban scenes covering multiple categories, including buildings, roads, sky, water bodies, and more. The DeepLabv3+ model presents methods including null convolution and global average pooling that are broadly applicable to landscape image segmentation tasks dealing with multiple categories, large scales, and complex backgrounds [43]. Following this, we utilised Adobe Photoshop2020 image processing software to manually correct incorrectly recognised labeled pixels such as sculptures, birds, cable cars, and Ferris wheels. Finally, we utilised the PIL and Numpy libraries to detect and compute the pixel coverage of each category of label.

2.6. Landscape Elements Classification and Cosine Similarity Calculation

We utilised the landscape vocabulary extracted from the text data and the labels obtained from the labeled images (Figure 3) as a basis for summarising the perceptual elements of the public into two main landscape categories, including eight landscape elements and 24 element components (Table 3). The similarity between element components in text and images was measured using cosine similarity. Cosine similarity is a technique for measuring the degree of similarity between two vectors by calculating the cosine of the angle between them. A higher value implies a greater frequency of co-occurrence of an element component in both text and image modalities. In this study, we utilised keyword search to generate text vectors for multiple landscape elements, based on the generalization outcomes of the element components. If an element component is included in the text data, its corresponding position in the vector is assigned a value of 1, otherwise, it is assigned a value of 0. The same approach is used for image data, with element components in the images recognised using the image semantic segmentation technique discussed earlier and represented as the corresponding image vectors. The cosine similarity between the text and picture data is calculated as indicated by Equation (2):
s i m i l a r t y ( T , I ) = T I T I = j = 1 n t j i j j = 1 n t j 2 j = 1 n i j 2
where T represents a vector of element components in the text, and I represents a vector of element components in the image. n denotes the number of element components, while tj and ij denote the occurrence of the jth element component in the text and image, respectively.

2.7. Integrating Text and Images to Assess Preference

After analysing the TF-IDF of the respective element components, the images’ area share, the similarity, and the weights are combined and added to determine element components’ comprehensive preference in both text and image collections. To ensure objectivity, our study employs the entropy assignment method for calculating the weights of each criterion in multilevel and multicriteria decision-making problems. This method determines criterion weight by utilising data change variability. Finally, utilising the summation of the second-level classification as demonstrated in Equation (3), we can ascertain the landscape element preference as follows:
L E P i = α T F I D F j + β A r e a j , p + γ s i m j , t , p
where LEPi represents the overall preference score of landscape element i. j denotes the element component belonging to the landscape element group. α, β, and γ are the weighting coefficients of the TF-IDF value, area share in the picture, and cosine similarity, respectively. In this paper, α = 0.213, β = 0.529, and γ = 0.257. TF-IDFj represents the TF-IDF value of component j, Areaj,p represents the area share of element component j in image set p, and simj,t,p represents the cosine similarity of element component j in text set t and image set p.

3. Results

3.1. Overall Sentiment Tendency

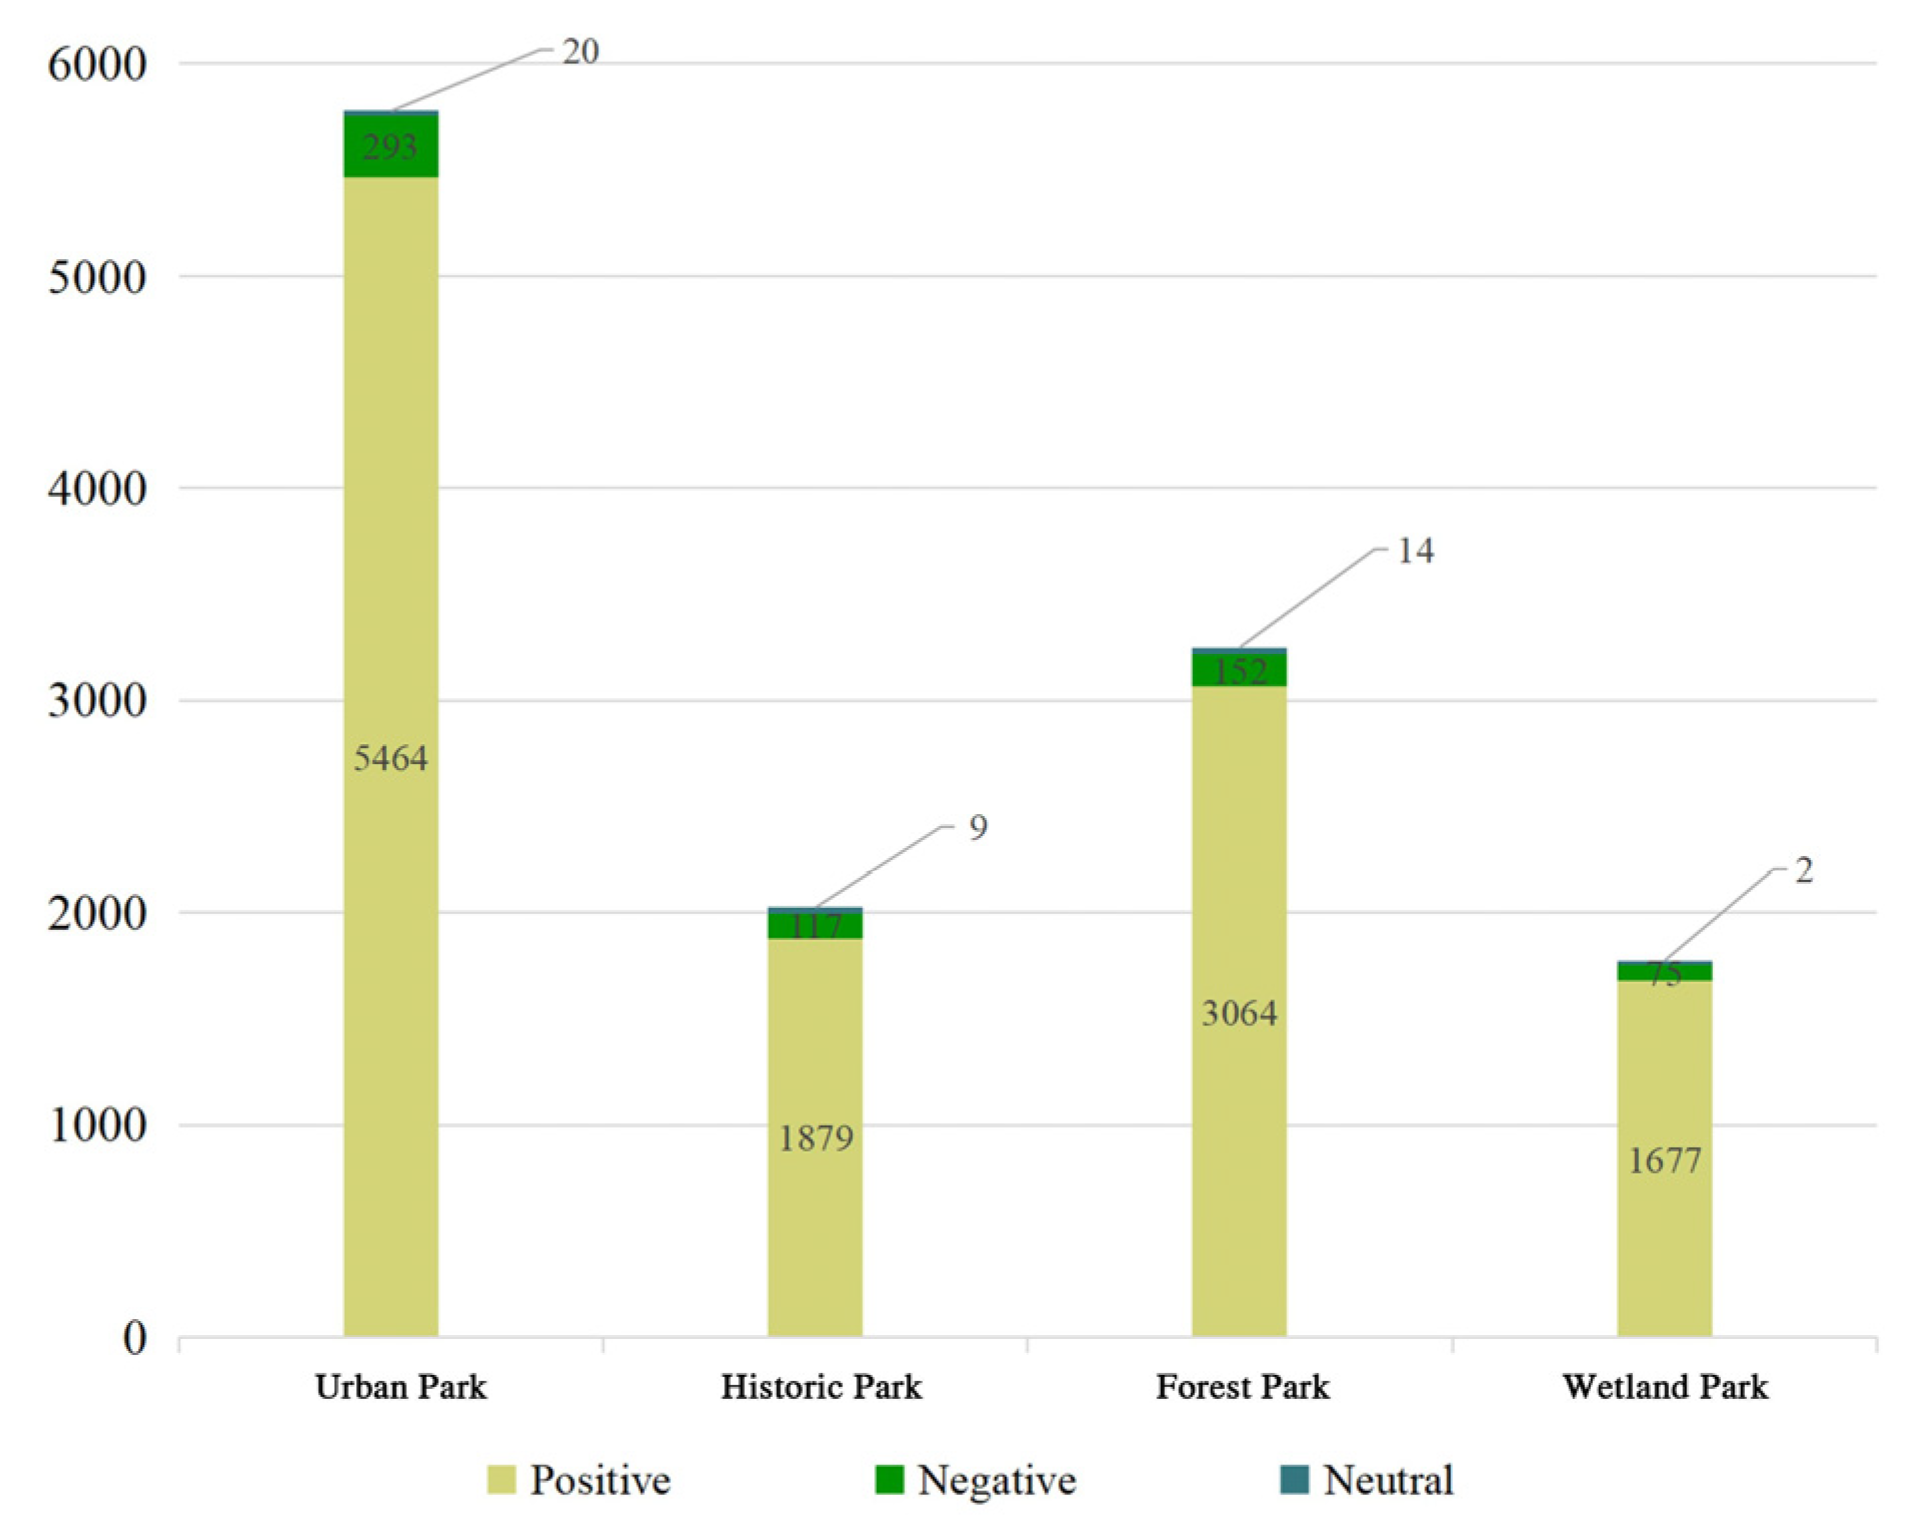
The number of comments and the overall sentiment tendency can reflect the popularity of a park and the public’s satisfaction with it on a macro level. We conducted sentiment analysis on the cleaned data of 12,766 texts. As shown in Figure 4, urban parks ranked highest in popularity, followed by forest and historical parks, while wetland parks had fewer comments. The findings provide important clues about the popularity and public satisfaction of different types of parks. Urban parks, with their multifunctional features, are more favoured than other specialised parks. This implies that urban parks have gained widespread recognition and become popular because they effectively cater to the public’s requirements regarding natural landscapes, recreational facilities, and sociable environments. Furthermore, a greater number of comments expressed positive sentiments than negative sentiments for all parks. More than 90% of comments expressed positive sentiments, while less than 6% expressed negative sentiments, and relatively few comments expressed neutral sentiments. The overall data on sentiment trends for all types of parks suggest that the public generally has a positive view of these parks.

3.2. Landscape Elements Perception

To examine the similarities and differences in the public’s perception of park landscape elements in the image and text modalities, we classified the park data into eight categories based on sentiment tendencies and park types and then analysed the data based on two dimensions: the frequency of perceiving element components and the degree of perceiving landscape elements in both modalities.

3.2.1. Similarity Analysis

We selected element components that exhibit similarity in both image and text modalities (Figure 5). Higher cosine similarity values indicate greater similarity, whereas values close to zero suggest a lack of significant similarity. The element components’ cosine similarity for each park category showed variations under different sentiment tendencies. Under a positive sentiment tendency, urban parks exhibit higher similarity in birds (1.000), water (0.786), and sky (0.649), whereas historic parks show higher similarity in buildings (0.683) and flowers (0.589). Forest parks display high similarity in buildings (0.853), water (0.712), and cable cars (0.586), while wetland parks show high similarity in the sky (0.767), trees (0.783), water (0.733), and flowers (0.537) in both image and text modalities. In contrast, in parks with a negative sentiment trend, urban parks show a higher similarity with water (0.805) and birds (0.767), followed by the sky (0.511). Historical parks display the highest similarity with buildings (0.670). In forest parks, buildings (0.824) and water (0.683) show higher similarity, while in wetland parks, the highest similarity was observed with the sky (0.625), flowers (0.676), and buildings (0.525). These findings suggest that the occurrence of these element components is similar in both modalities.

3.2.2. Disparity Analysis

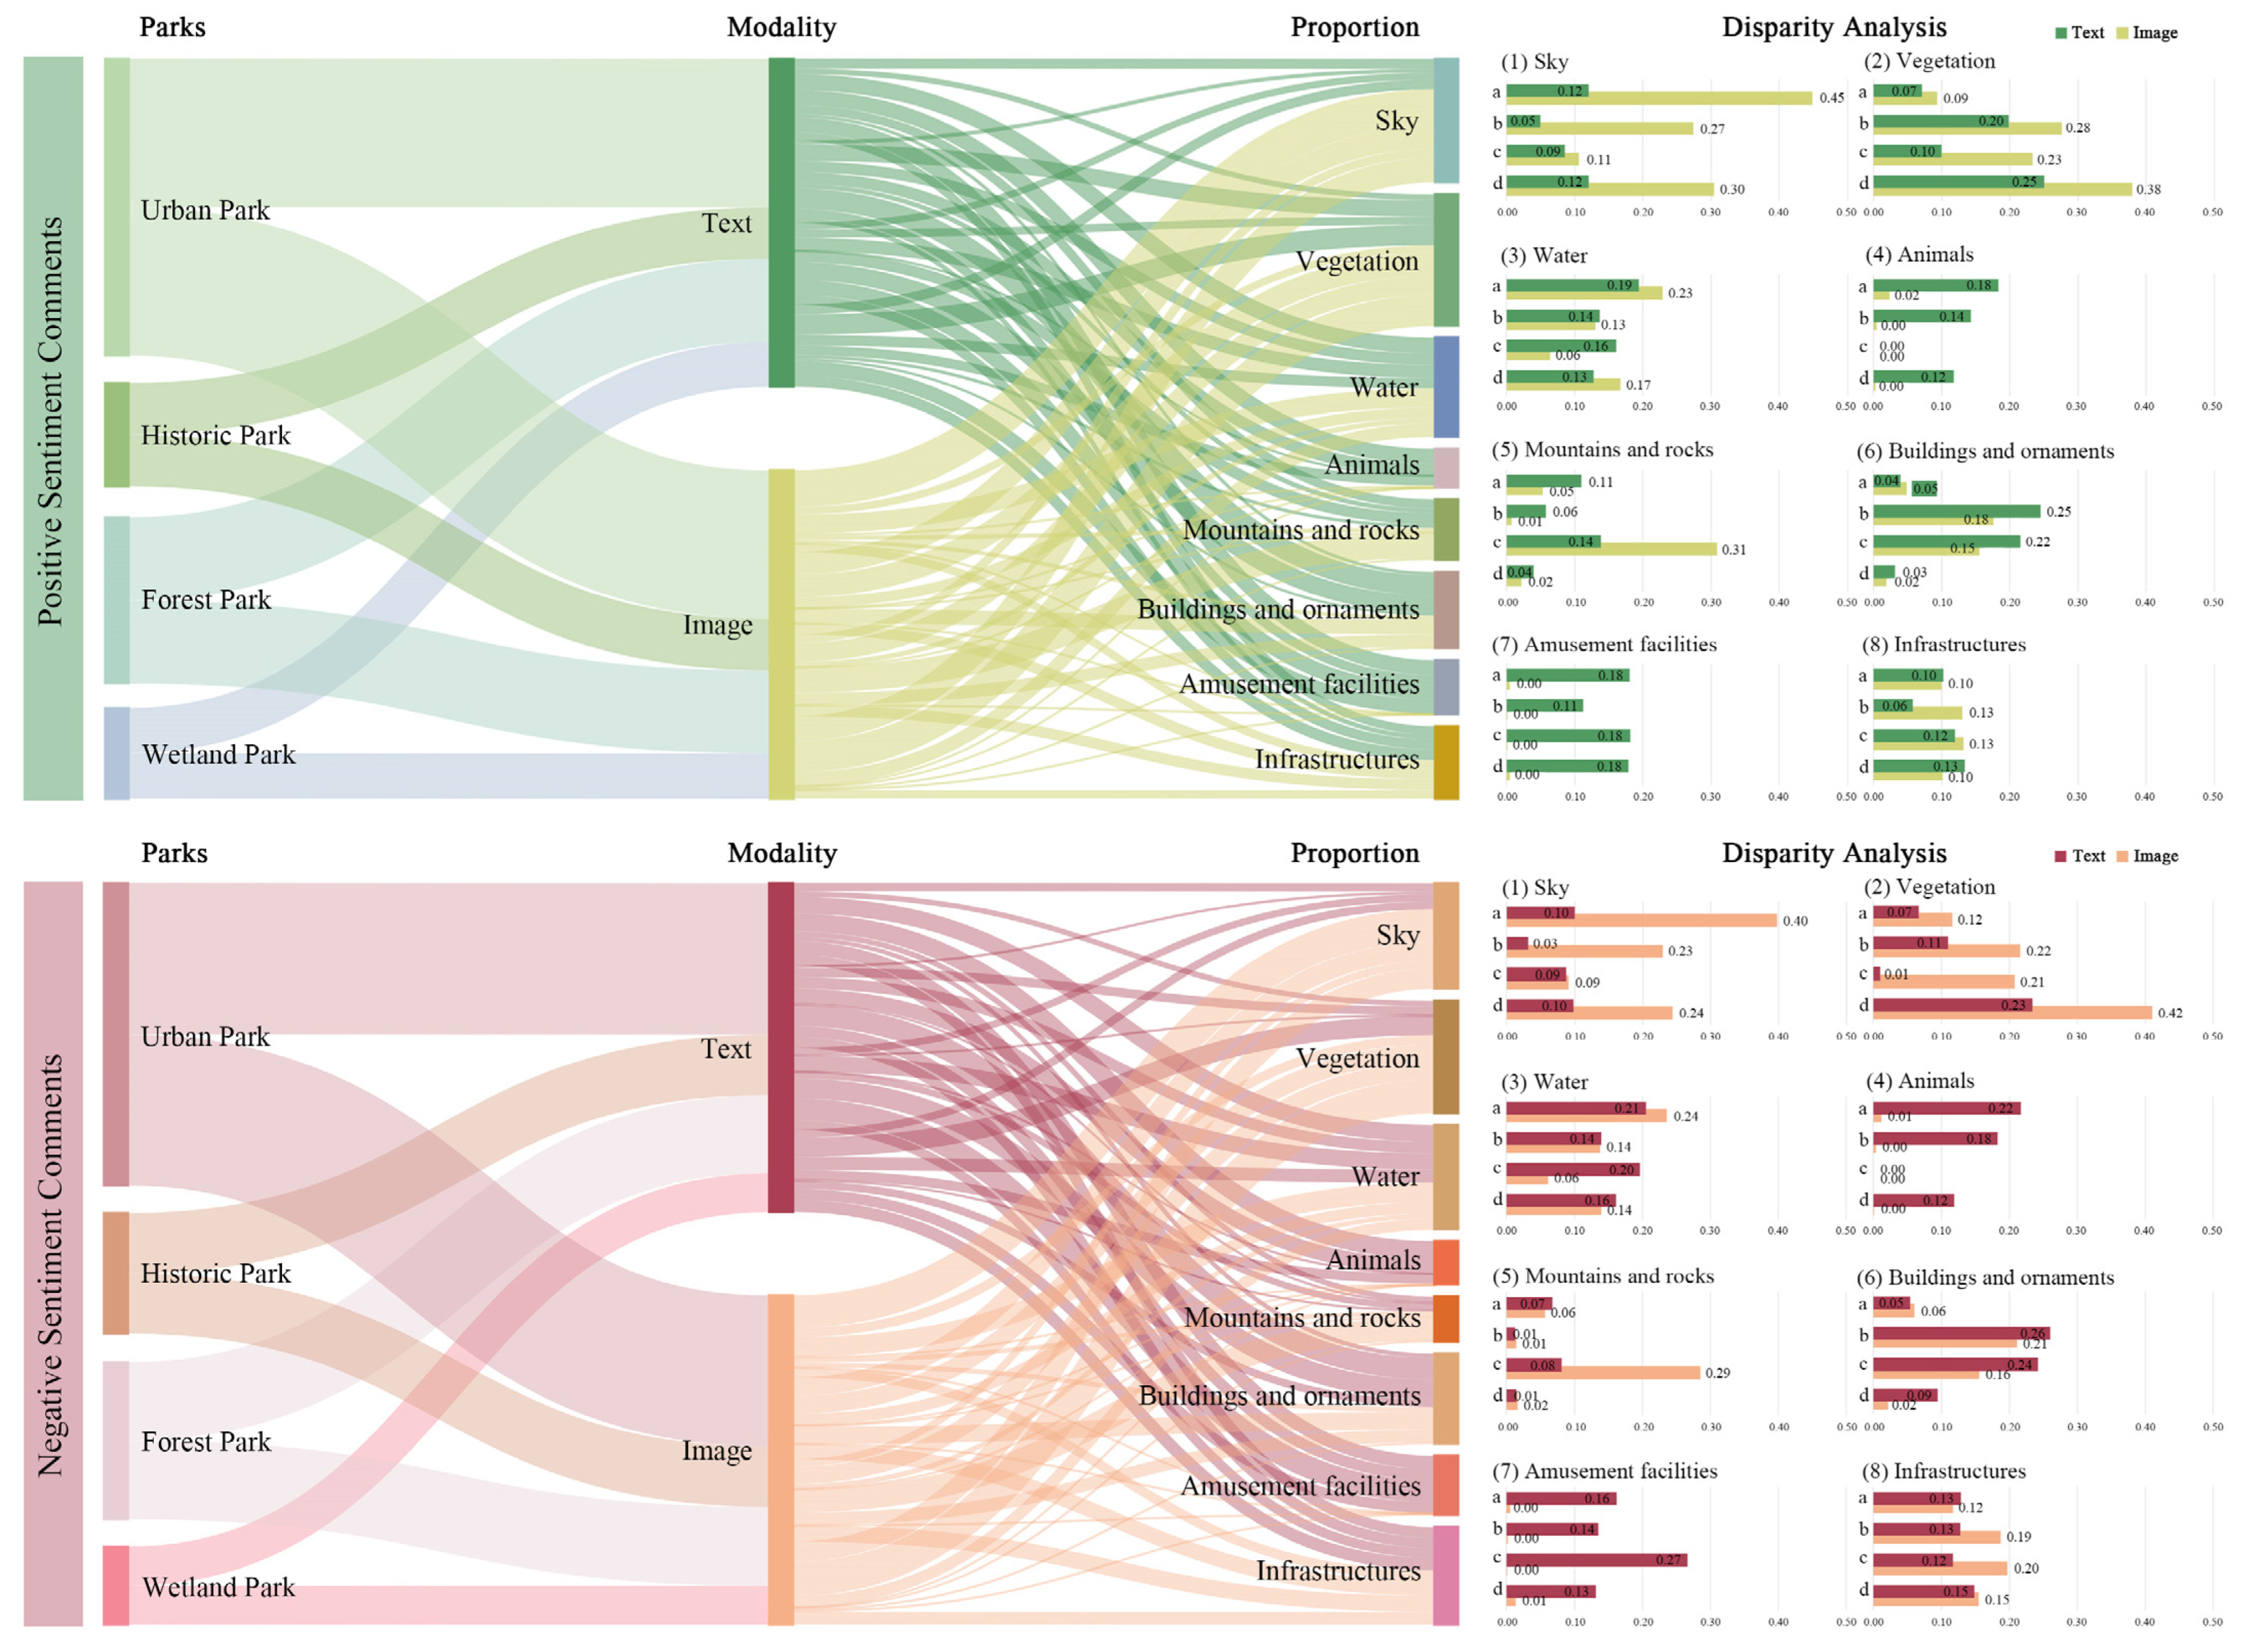
To investigate the variances in how the public perceives landscape elements in both modalities, we normalised the TF-IDF and image area proportions of the element components in each dataset, calculated their percentages in the dataset, and finally merged them into the corresponding secondary classification (landscape elements). As shown in Figure 6, a comparison of the proportions of eight different landscape elements using both text and image modalities revealed significant discrepancies in public perception. Notably, the disparities in perception between the two modalities exhibited consistent patterns regardless of whether the sentiments expressed were positive or negative. In all parks, the text modality exhibited greater emphasis on animals and amusement facilities, whereas the image modality emphasised sky and vegetation. Sky and vegetation are more stable and ubiquitous in the park setting, making them more likely to be captured in imagery by photographers across various scenes. Conversely, animals are more dynamic and are subject to temporal factors, which may impact their presentation in images. Amusement facilities prioritise user experience and interaction, whose comprehensive conveyance through text is more effortless compared to images. For water features, the proportions in both modalities are relatively consistent for urban parks, historic parks, and wetland parks. However, the forest park is situated on the high part of Xishan Mountain, with a height difference of approximately 620 metres from the lake level of Dianchi Lake. The visual effect of viewpoints tends to draw people’s attention towards the distant landscape, leading them to disregard the surrounding landscape. The spatial relationship between the forest park and Dianchi Lake hinders the visibility of the lake within the park, leading to a significant disparity in the proportion of water and mountain views seen in the two modalities. However, in the case of the other three park types, the mountain landscape lies on the opposite side of the lakeshore that is further away from the parks. Consequently, these parks exhibit a comparatively greater proportion of the mountain landscape in the text modality than in the picture modality.

3.3. Bimodal Landscape Preference

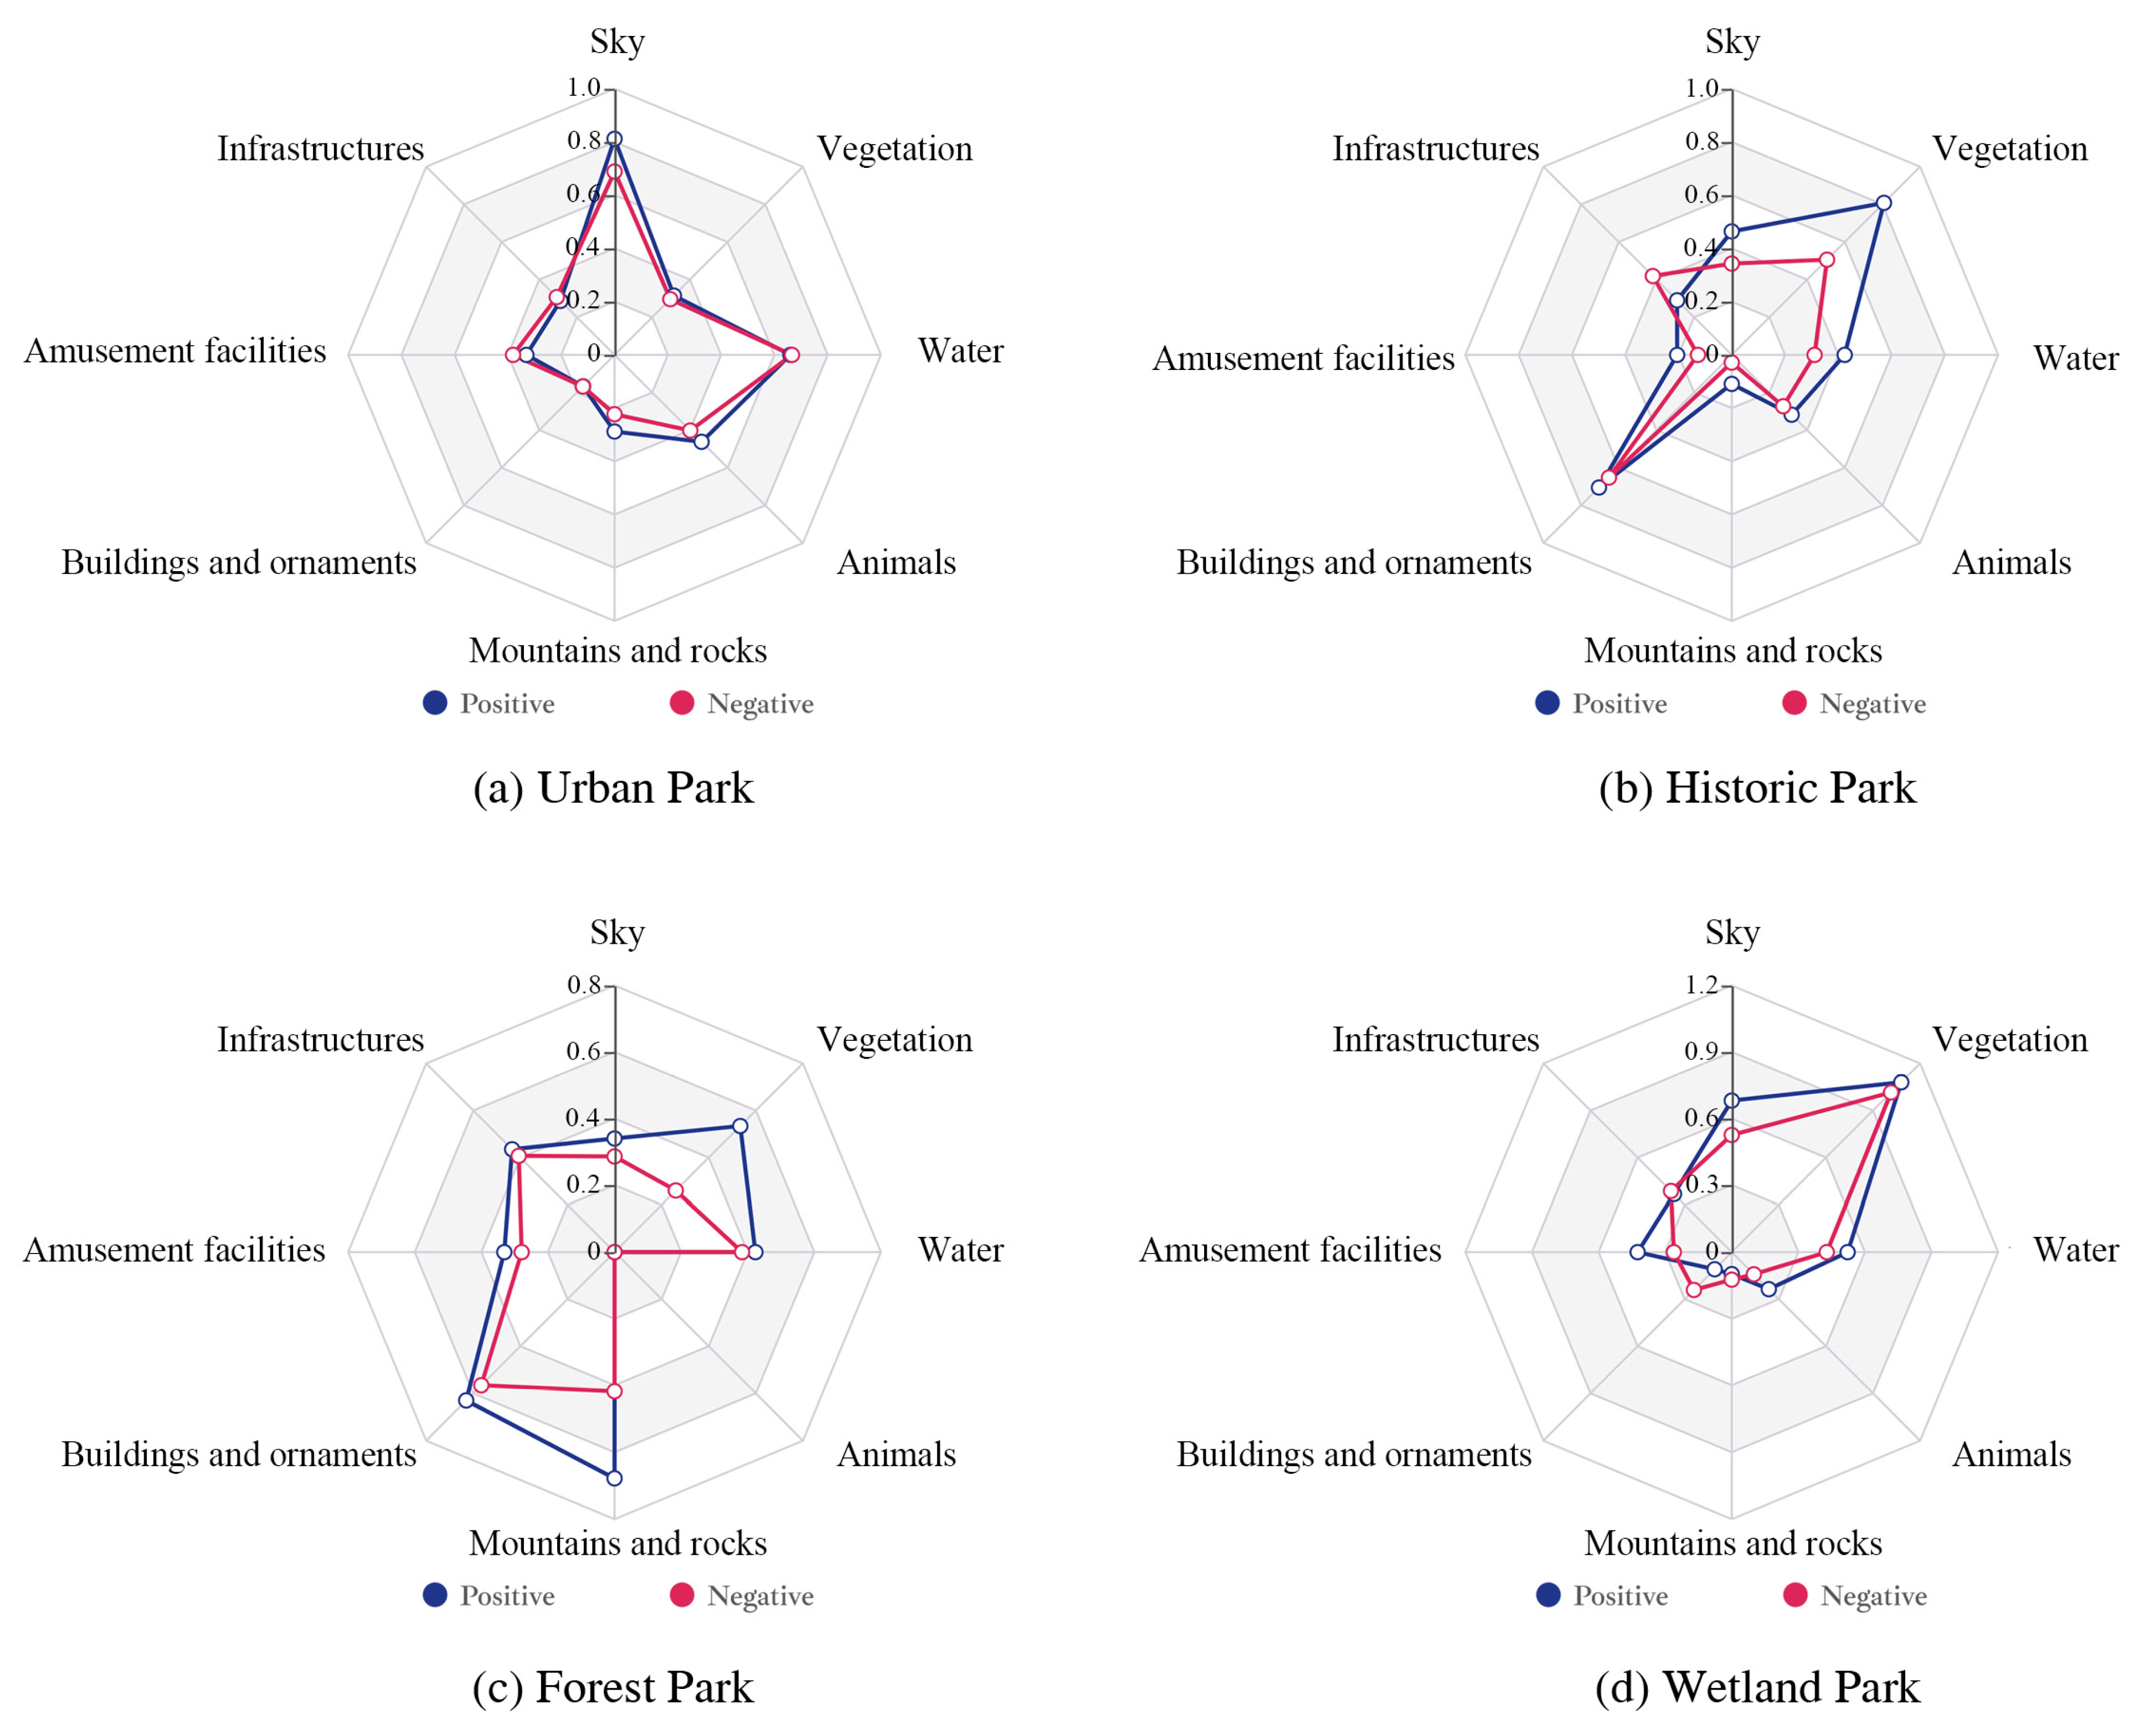
We computed the landscape element preference scores for each park type by aggregating the element component scores based on landscape element classification. Then, we analysed the perceived preference characteristics under positive and negative sentiment tendencies (Figure 7). In general, there were notable variations in the perceived landscape characteristics across the four park types. Perceived characteristics remained fairly consistent across positive and negative sentiments. Through the analysis of textual comments and photographs, we can gain a clear and intuitive understanding of the public’s preferences and dislikes for the different landscape elements in different park types.

3.3.1. Urban Park

Regarding urban parks, the primary draws are the sky (0.812), water (0.660), and animals (0.462). In the winter and spring, Dianchi serves as a winter habitat for Siberian seagulls, whose actions may garner a great deal of interest. The positive opinions mainly centred around seagulls, sky, and Dianchi, such as “The sunny day is conducive to observing seagulls” and “Seagulls elegantly soar amidst the blue sky, white clouds, mountains, and water”. In contrast, water (0.666), amusement facilities (0.381), and infrastructure (0.307) had more negative sentiments, with their “dislike” scores higher than their “preference” scores, and the negative comments were usually related to water pollution, overcommercialisation, and inadequate facilities. For example, “The lake is covered with a thick layer of green sediment”, “The commercial activity is impressive to witness”, “The facilities are inadequate, and the supporting amenities are subpar”. In summary, urban parks offer the public a variety of natural landscapes and multi-functional activities, and are conducive to alleviating urban pressure. The pro-water mentality and desire for natural landscapes of the general public largely influence their perceptual preferences. However, the layout, number and poor maintenance of artificial facilities, as well as other reasons, lead to negative public perceptions.

3.3.2. Historic Park

Strong positive preferences were shown for vegetation (0.808), buildings and ornaments (0.705) in the historical park. Comments mainly described classical garden architecture, lotus ponds, flowers, and various flower displays. Some negative criticisms mentioned the lack of grandeur in classical architecture and crowded amenities. For instance, “The Daguan Tower is too short and not impressive”, “The amusement area ruins the atmosphere”. Historical parks usually blend contemporary amenities with ancient monuments, creating spacious public areas. The existence of historical structures, garden landscapes and features evokes a positive response. However, the inclusion of modern amenities may create negative feelings. This is especially true when such modern facilities do not align with the historical nature of the area and are seen as jeopardising its artistic value.

3.3.3. Forest Park

In the forest park, the level of positive preference was higher for mountains and rocks (0.678), buildings and ornaments (0.630), and vegetation (0.533). The comments focused on Xishan Mountain, cliffs, pavilions, and forest vegetation. However, negative feedback centred around steep trails, inadequate facilities, and limited access within the park. For instance, “The climb up and down the mountain is steep and hazardous”, “The amenities are somewhat antiquated”. Forest parks, based on the natural environment of forests, offer recreational activities, forest bathing, and other amenities to the public, making them a highly popular and valuable public resource. The recreational facilities and forest trails provide a place for people to view and experience natural beauty. While some mountain and forest paths offer exciting and captivating experiences, others may lead to treacherous terrains and a lack of maintenance facilities, resulting in fearfulness and affecting people’s feelings to a great extent.

3.3.4. Wetland Park

Wetland park users preferred vegetation (1.080), sky (0.681), water (0.522), and amusement (0.424). An analysis of comments and photo content revealed positive portrayals of various aquatic plants, flowers, scenic views including sunsets and evenings, and recreational activities such as camping and boating. For example, “Exploring the serene waters of the forest while surrounded by beautiful emerald green and blue skies” and “The sunsets in this location are always an unforgettable sight” These positive descriptions suggest that wetland parks, as a specific category of parks, have distinct landscape preferences. They effectively offer charming natural surroundings and diverse recreational activities, providing a sense of calm and pleasure. Nevertheless, negative feedback points out pungent smells coming from water plants, insufficient facilities, and water quality concerns. To some degree, these issues impact the public’s experience and viewpoint.

4. Discussion

4.1. Landscape Elements and Public Preferences

As mentioned earlier, a notable positive correlation is evident between affective restoration and landscape preference [21]. Moreover, positive emotions can act as indicators of perceived restorative changes [23]. Studies have demonstrated that visiting UBGSs can have a profound impact on the mental and physical health of attendees. For instance, individuals often encounter a sense of tranquility when exposed to natural surroundings, leading to psychological recuperation that fosters positive emotions and enhances overall well-being [7,8,44]. Our research indicates that positive sentiments accounted for more than 93% of public evaluations of all parks, which is significantly higher than other types of sentiments (Figure 4). This finding is consistent with previous studies in other cities that have demonstrated that public perceptions of UBGSs tend to be positive. For example, Huai and Van de Voorde’s study in the cities of Shanghai and Brussels yielded similar results, and the results of surveys of public satisfaction with urban parks carried out by local governments also support this conclusion [45].
In UBGSs, vegetation plays a crucial role in providing ecological services and enhancing aesthetic appeal. Research has demonstrated a positive correlation between plant-related landscape features, such as trees, lawns, and flowers, and psychological recovery [17,46,47]. Our findings also confirm that people show a higher preference for vegetation in positive comments. Additionally, water bodies are a significant component of blue spaces. The study revealed that the public has a significant preference for Dianchi Lake and water scenes. This aligns with previous research, such as Ulrich’s prior study, which demonstrated that natural scenes, particularly those with water, had a positive effect on participants’ psychological states [48]. A national survey conducted in Ireland revealed a predilection among the public for landscapes related to water [49]. Additionally, White et al. found that individuals prefer natural and built landscapes with water and that images of “built” environments with water bodies are considered positive as natural “green” spaces [50]. While our findings are consistent with the majority of studies confirming a strong public preference for water features, this study also uncovers a unique discovery. Water features in urban parks received higher “dislike” ratings than “preference” ratings. Negative comments suggest that issues with water quality had negative impacts on visitor experiences. This aligns with a study performed in China, which determined that lakes were considered the least restorative landscapes because of water quality pollution and litter problems [51]. Furthermore, our study brings to light a previously disregarded aspect of the landscape: the sky. While previous research frequently disregarded the sky [52], our findings suggest that individuals possess a significant inclination towards skyscapes in metropolitan parks and wetland parks located along the eastern coast of Dianchi Lake. This occurrence can be linked to the fact that the Dianchi region receives direct sunlight from the plateau persistently throughout the year. On clear days, the visual effect of “Five hundred miles of Dianchi Lake coming to the bottom of the eye, and the joy of the vast emptiness without boundaries” is apparent [53]. Furthermore, the sky serves as a visual vehicle for the presence of sunsets, clouds, and birds of prey that blend topographic features and environmental factors (e.g., horizon, skyline, and canopy line) to create a natural fascination. This fascination is also an important feature of restorative landscapes [52].
In addition to natural landscapes, individuals exhibit a strong preference for humanistic landscape elements. This encompasses cultural elements such as plaques, couplets, and stone carvings, as well as artistic elements such as buildings, rockeries, and sculptures. This provides further evidence that historic buildings [54], cultural heritage sites [55], and historic sites [56] typically have high attractiveness and can have positive emotional restorative effects. The scenery in historic parks and forest parks, like most traditional Chinese gardens, is strongly reminiscent of poetry and paintings. The humanistic landscape elements that carry the “poetic mood” are rich in aesthetic, literary, and historical information [57], which can easily arouse people’s visual attention and cognitive desire. The integration of traditional architecture with landscaping creates a visually appealing “picturesque view” [57], which helps people relax and seek spiritual solace. As a result, humanistic landscaping holds a distinctive significance in UBGSs, differing from that of natural landscapes. Humanistic landscaping not only offers visual pleasure but also fosters a bond between people and their surroundings, affecting their perception, experiences, and emotional outlook towards UBGSs. Furthermore, such landscaping shapes individuals’ emotional identity and sense of belonging to the environment.

4.2. Differences and Connections between Images and Text

Regarding the methodology, there were differences in the frequency and degree of perception in the two modalities. Image modality allowed for the easy recording of landscape elements unique to the park with high stability. In contrast, textual modality easily captured and expressed dynamic or interactive features, including animals and rides, as well as landscape elements with park characteristics. As stated previously, both modalities serve as sources of data pertaining to landscape preference. However, they deviate in their degree of interpretation [38]. Images focus on reflecting the raw information of landscape perception as a representation of the content when the subject is seeing the object, while texts have the characteristics of abstraction, core, and decontextualization, which omit trivial details [39], and focus on reflecting the processed perceptual information, so that one reflects more concrete and contextualised content, and the other reflects more focus or interest, both of which are important aspects of landscape perceptual preference.
Moreover, we discovered that the contents of photos are impacted not only by objective factors such as the traits of landscape elements and spatial and temporal features but also by the emotional experience of the photographer. As a result, the findings of landscape preference solely based on image modality are not definitive, as exemplified by unfavourable reviews in online feedback. In the last ten years, the city’s rapid growth has led to haphazard development in the vicinity of Dianchi Lake. Chronic water pollution issues persist before lake governance, exacerbating a range of ecological and environmental problems and ultimately resulting in the degradation of water quality [58]. However, when measuring preferences for landscapes based on image modality, even if the photos show signs of pollution, it is not possible to judge the negative evaluation of users by relying on the semantics of the images, which makes the quantification of the landscape objects seen by the public, based on image modality as the basis of landscape preference, likely to be out of touch with reality. On the other hand, commenting on text habitually utilises accumulated prior knowledge and messages to evaluate the object, indicating a structured thought process [59]. The quantification of sentiment through natural language processing technology can also serve as a basis for determining a user’s positive or negative evaluation. However, the quantifying of landscape perception is incomplete due to its abstractness and decontextualization, and can be supplemented by image content. Supplementing pictures may enhance comprehension and objectivity. For a more comprehensive and unbiased understanding of the public’s perception and preference for UBGSs, visual presentations and reflective feedback in pictures and texts should be combined.

4.3. Implications for UBGS Planning

The management and restoration of water ecosystems are crucial in maintaining the health of water bodies and in enhancing public preference for aquatic landscapes. Measures such as stringent pollution control, water quality monitoring and ecological restoration can improve the ecological conditions of water bodies and thus increase the public’s positive preference for water landscapes. Furthermore, the development of a rich waterfront, the enhancement of the hydrophilic nature of the waterfront, and the establishment of recreational areas that contribute to the closeness to nature can further contribute to the positive impact of water landscaping on the restoration of UBGSs. The selection and arrangement of trees and flowers, in addition to the extent of accessibility of recreational areas such as lawns and forests, significantly influence the public’s preference for green landscapes. Encouraging vegetation near the lakefront and granting communal access to green spaces, while incorporating cities’ blue–green infrastructure, can provide a diverse range of open green spaces. This further enhances the benefits of greening for ecological restoration and the restoration of human physical and mental health. Rooting UBGSs in local history and culture while emphasising regional culture and the uniqueness of humanistic landscapes is an important means of avoiding landscape homogenisation. UBGSs contain rich cultural elements that can provoke emotional resonance and create a sense of inner peace and fulfilment.

4.4. Limitations and Future Directions

While this study ensures objectivity and comprehensiveness in assessing landscape preferences by combining the visual presentations of the public in images and texts with reflective feedback, there are several limitations to this paper. All user-generated datasets and associated analyses are susceptible to biases that ought to be acknowledged in research [60]. User sampling bias represents a subjective attribute inherent in online review platforms [61]. This implies that user-generated data does not provide a comprehensive representation of all user groups, especially those belonging to older age groups and children who may be less likely to access the Internet. Another inherent bias in this user-generated data is self-selective sampling. This means that not everyone is willing to share content publicly [62]. Furthermore, the sharing of comments is also influenced by the phenomenon of the “positive bias” [63,64]. This refers to the tendency of individuals to share positive emotions more readily than negative emotions when posting comments [64]. In future studies, researchers can widen the scope of their data by integrating online and offline data sources, enhancing the complexity of landscape semantics and computation, and decreasing the impact of user bias and technical constraints.

5. Conclusions

The purpose of this research is to test and validate a landscape preference assessment method that uses bimodal data. This method allows for a thorough analysis of the public’s perceptions and preferences for landscape elements found in UBGSs. The two modes of “seeing” and “thinking” are combined by using both pictures and text. Under these two modalities, the text mode offers insight into the public’s emotional disposition and a fundamental perception of the landscape when interacting with the UBGSs, whereas the visual mode provides a more detailed perception of the landscape. These two modes of perception can complement each other in quantifying landscape preferences.
Our research indicates that UBGSs promote positive feelings and enhance people’s emotional experience. Our analysis of online comments, including both text and image content, shows that this bimodal approach is able to capture the public’s perception of different landscape elements in UBGSs at a very detailed level. Nevertheless, our analyses also revealed differences between the two modalities in the frequency and percentage of landscape element preferences. These disparities can be traced back to the sensory registrations and expressive customs of the respective modalities, as well as the features of the landscape components themselves. These distinctions enhance our knowledge of landscape inclinations. Furthermore, our study unveils disparities in landscape element preferences among various park types, indicating that different landscape elements play unique roles in different types of parks, as evidenced by public visual and cognitive preferences. These findings offer crucial references for further optimising and planning UBGSs to cater to public requirements.

Author Contributions

Conceptualization, C.D.; Methodology, C.D.; Software, C.D.; Writing—original draft preparation, C.D.; Writing—review and editing, J.Q.; Visualization, C.D.; Supervision, J.Q. All authors have read and agreed to the published version of the manuscript.

Funding

This work was supported by the National Natural Science Foundation of China under Grant No. 51908477.

Data Availability Statement

Data supporting the results of this study are available by mail from the corresponding authors upon reasonable request.

Conflicts of Interest

The authors declare no conflicts of interest.

References

  1. Wang, R.; Browning, M.H.E.M.; Kee, F.; Hunter, R.F. Exploring mechanistic pathways linking urban green and blue space to mental wellbeing before and after urban regeneration of a greenway: Evidence from the Connswater Community Greenway, Belfast, UK. Landsc. Urban Plan. 2023, 235, 104739. [Google Scholar] [CrossRef]
  2. Yang, G.; Yu, Z.; Jørgensen, G.; Vejre, H. How can urban blue-green space be planned for climate adaptation in high-latitude cities? A seasonal perspective. Sustain. Cities Soc. 2020, 53, 101932. [Google Scholar] [CrossRef]
  3. Remme, R.P.; Frumkin, H.; Guerry, A.D.; King, A.C.; Mandle, L.; Sarabu, C.; Bratman, G.N.; Giles-Corti, B.; Hamel, P.; Han, B.; et al. An ecosystem service perspective on urban nature, physical activity, and health. Proc. Natl. Acad. Sci. USA 2021, 118, e2018472118. [Google Scholar] [CrossRef]
  4. Yin, J.; Ramanpong, J.; Chang, J.; Wu, C.-D.; Chao, P.-H.; Yu, C.-P. Effects of blue space exposure in urban and natural environments on psychological and physiological responses: A within-subject experiment. Urban For. Urban Green. 2023, 87, 128066. [Google Scholar] [CrossRef]
  5. Reyes-Riveros, R.; Altamirano, A.; De La Barrera, F.; Rozas-Vásquez, D.; Vieli, L.; Meli, P. Linking public urban green spaces and human well-being: A systematic review. Urban For. Urban Green. 2021, 61, 127105. [Google Scholar] [CrossRef]
  6. Velarde, M.D.; Fry, G.; Tveit, M. Health effects of viewing landscapes—Landscape types in environmental psychology. Urban For. Urban Green. 2007, 6, 199–212. [Google Scholar] [CrossRef]
  7. Ode Sang, Å.; Knez, I.; Gunnarsson, B.; Hedblom, M. The effects of naturalness, gender, and age on how urban green space is perceived and used. Urban For. Urban Green. 2016, 18, 268–276. [Google Scholar] [CrossRef]
  8. Fisher, J.C.; Irvine, K.N.; Bicknell, J.E.; Hayes, W.M.; Fernandes, D.; Mistry, J.; Davies, Z.G. Perceived biodiversity, sound, naturalness, and safety enhance the restorative quality and wellbeing benefits of green and blue space in a neotropical city. Sci. Total Environ. 2020, 755, 143095. [Google Scholar] [CrossRef]
  9. Berman, M.G.; Jonides, J.; Kaplan, S. The cognitive benefits of interacting with nature. Psychol. Sci. 2008, 19, 1207–1212. [Google Scholar] [CrossRef]
  10. Csomós, G.; Farkas, J.Z.; Szabó, B.; Bertus, Z.; Kovács, Z. Exploring the use and perceptions of inner-city small urban parks: A case study of Budapest, Hungary. Urban For. Urban Green. 2023, 86, 128003. [Google Scholar] [CrossRef]
  11. Leng, H.; Yan, T.J.; Yuan, Q. Research Progress on Mental Health Effect of Blue-Green Space and Its Enlightenments. Urban Plann. Int. 2022, 37, 34–43. [Google Scholar] [CrossRef]
  12. Van den Berg, A.E.; Maas, J.; Verheij, R.A.; Groenewegen, P.P. Green space as a buffer between stressful life events and health. Soc. Sci. Med. 2010, 70, 1203–1210. [Google Scholar] [CrossRef] [PubMed]
  13. Wu, W.; Yun, Y.; Zhai, J.; Sun, Y.; Zhang, G.; Wang, R. Residential self-selection in the greenness-wellbeing connection: A family composition perspective. Urban For. Urban Green. 2021, 59, 127000. [Google Scholar] [CrossRef]
  14. Georgiou, M.; Tieges, Z.; Morison, G.; Smith, N.; Chastin, S. A population-based retrospective study of the modifying effect of urban blue space on the impact of socioeconomic deprivation on mental health. Sci. Rep. 2022, 12, 13040. [Google Scholar] [CrossRef] [PubMed]
  15. Akpinar, A.; Barbosa-Leiker, C.; Brooks, K.R. Does green space matter? Exploring relationships between green space type and health indicators. Urban For. Urban Green. 2016, 20, 407–418. [Google Scholar] [CrossRef]
  16. Carrus, G.; Lafortezza, R.; Colangelo, G.; Dentamaro, I.; Scopelliti, M.; Sanesi, G. Relations between naturalness and perceived restorativeness of different urban green spaces. Psyecology 2013, 4, 227–244. [Google Scholar] [CrossRef]
  17. Huang, Q.; Yang, M.; Jane, H.; Li, S.; Bauer, N. Trees, grass, or concrete? The effects of different types of environments on stress reduction. Landsc. Urban Plan. 2020, 193, 103654. [Google Scholar] [CrossRef]
  18. Tveit, M.S.; Ode Sang, Å.; Hagerhall, C.M. Scenic beauty: Visual landscape assessment and human landscape perception. In Environmental Psychology: An Introduction; John Wiley & Sons, Ltd.: Hoboken, NJ, USA, 2018; pp. 45–54. [Google Scholar] [CrossRef]
  19. Mundher, R.; Abu Bakar, S.; Maulan, S.; Mohd Yusof, M.J.; Al-Sharaa, A.; Aziz, A.; Gao, H. Aesthetic quality assessment of landscapes as a model for urban forest areas: A systematic literature review. Forests 2022, 13, 991. [Google Scholar] [CrossRef]
  20. Schrammeijer, E.A.; van Zanten, B.T.; Davis, J.; Verburg, P.H. The advantage of mobile technologies in crowdsourcing landscape preferences: Testing a mobile app to inform planning decisions. Urban For. Urban Green. 2022, 73, 127610. [Google Scholar] [CrossRef]
  21. Van den Berg, A.E.; Koole, S.L.; van der Wulp, N.Y. Environmental preference and restoration: (How) are they related? J. Environ. Psychol. 2003, 23, 135–146. [Google Scholar] [CrossRef]
  22. Abkar, M.; Kamal, M.; Maulan, S.; Mariapan, M.; Davoodi, S.R. Relationship between the preference and perceived restorative potential of urban landscapes. HortTechnology 2011, 21, 514–519. [Google Scholar] [CrossRef]
  23. Ulrich, R.S. Aesthetic and affective response to natural environment. In Behavior and the Natural Environment; Springer: Boston, MA, USA, 1983; pp. 85–125. [Google Scholar] [CrossRef]
  24. Ulrich, R.S.; Simons, R.F.; Losito, B.D.; Fiorito, E.; Miles, M.A.; Zelson, M. Stress recovery during exposure to natural and urban environments. J. Environ. Psychol. 1991, 11, 201–230. [Google Scholar] [CrossRef]
  25. McCormack, G.R.; Rock, M.; Toohey, A.M.; Hignell, D. Characteristics of urban parks associated with park use and physical activity: A review of qualitative research. Health Place 2010, 16, 712–726. [Google Scholar] [CrossRef] [PubMed]
  26. Ulrich, R.S. Human responses to vegetation and landscapes. Landsc. Urban Plan. 1986, 13, 29–44. [Google Scholar] [CrossRef]
  27. Lottrup, L.; Grahn, P.; Stigsdotter, U.K. Workplace greenery and perceived level of stress: Benefits of access to a green outdoor environment at the workplace. Landsc. Urban Plan. 2013, 110, 5–11. [Google Scholar] [CrossRef]
  28. Perrins, S.P.; Varanasi, U.; Seto, E.; Bratman, G.N. Nature at work: The effects of day-to-day nature contact on workers’ stress and psychological well-being. Urban For. Urban Green. 2021, 66, 127404. [Google Scholar] [CrossRef]
  29. Bratman, G.N.; Anderson, C.B.; Berman, M.G.; Cochran, B.; de Vries, S.; Flanders, J.; Folke, C.; Frumkin, H.; Gross, J.J.; Hartig, T.; et al. Nature and mental health: An ecosystem service perspective. Sci. Adv. 2019, 5, eaax0903. [Google Scholar] [CrossRef] [PubMed]
  30. Chen, X.; de Vries, S.; Assmuth, T.; Dick, J.; Hermans, T.; Hertel, O.; Jensen, A.; Jones, L.; Kabisch, S.; Lanki, T.; et al. Research challenges for cultural ecosystem services and public health in (peri-) urban environments. Sci. Total Environ. 2019, 651, 2118–2129. [Google Scholar] [CrossRef]
  31. Jarvis, I.; Koehoorn, M.; Gergel, S.E.; van den Bosch, M. Different types of urban natural environments influence various dimensions of self-reported health. Environ. Res. 2020, 186, 109614. [Google Scholar] [CrossRef]
  32. Wood, S.A.; Guerry, A.D.; Silver, J.M.; Lacayo, M. Using social media to quantify nature-based tourism and recreation. Sci. Rep. 2013, 3, 2976. [Google Scholar] [CrossRef]
  33. Liang, H.; Yan, Q.; Yan, Y.; Zhang, L.; Zhang, Q. Spatiotemporal Study of Park Sentiments at Metropolitan Scale Using Multiple Social Media Data. Land 2022, 11, 1497. [Google Scholar] [CrossRef]
  34. Guo, Y.; Barnes, S.J.; Jia, Q. Mining meaning from online ratings and reviews: Tourist satisfaction analysis using latent Dirichlet allocation. Tour. Manag. 2017, 59, 467–483. [Google Scholar] [CrossRef]
  35. Wilkins, E.J.; Van Berkel, D.; Zhang, H.; Dorning, M.A.; Beck, S.M.; Smith, J.W. Promises and pitfalls of using computer vision to make inferences about landscape preferences: Evidence from an urban-proximate park system. Landsc. Urban Plan. 2022, 219, 104315. [Google Scholar] [CrossRef]
  36. Araujo, T.; Lock, I.; van de Velde, B. Automated visual content analysis (AVCA) in communication research: A protocol for large scale image classification with pre-trained computer vision models. Commun. Methods Meas. 2020, 14, 239–265. [Google Scholar] [CrossRef]
  37. Liang, J.J.; Chen, K.N. From gaze to sweeping: A shift in viewing patterns in mobile photography and travel situations. Shanghai Journal. Rev. 2020, 9, 47–62. [Google Scholar] [CrossRef]
  38. Yang, Y.; Zhu, Y. Effects of online pictorial versus verbal reviews of experience product on consumer’s judgment. Acta Psychol. Sin. 2016, 48, 1026. [Google Scholar] [CrossRef]
  39. Bar, M. Visual objects in context. Nat. Rev. Neurosci. 2004, 5, 617–629. [Google Scholar] [CrossRef] [PubMed]
  40. Zeng, X.; Zhong, Y.; Yang, L.; Wei, J.; Tang, X. Analysis of Forest Landscape Preferences and Emotional Features of Chinese Forest Recreationists Based on Deep Learning of Geotagged Photos. Forests 2022, 13, 892. [Google Scholar] [CrossRef]
  41. Zhang, W.; Yoshida, T.; Tang, X. A comparative study of TF*IDF, LSI and multi-words for text classification. Expert Syst. Appl. 2011, 38, 2758–2765. [Google Scholar] [CrossRef]
  42. Kuang, H.Y.; Wu, J.J. Survey of image semantic segmentation based on deep learning. Comput. Eng. Appl. 2019, 55, 12–21. [Google Scholar]
  43. Xu, H.; Zhu, Y.; Zhen, T.; Li, Z. Survey of Image Semantic Segmentation Methods Based on Deep Neural Network. J. Front. Comput. Sci. Technol. 2021, 15, 47. [Google Scholar] [CrossRef]
  44. Loder, A.K.F.; Schwerdtfeger, A.R.; van Poppel, M.N.M. Perceived greenness at home and at university are independently associated with mental health. BMC Public Health 2020, 20, 802. [Google Scholar] [CrossRef]
  45. Huai, S.; Van de Voorde, T. Which environmental features contribute to positive and negative perceptions of urban parks? A cross-cultural comparison using online reviews and Natural Language Processing methods. Landsc. Urban Plan. 2022, 218, 104307. [Google Scholar] [CrossRef]
  46. Wang, X.; Rodiek, S.; Wu, C.; Chen, Y.; Li, Y. Stress recovery and restorative effects of viewing different urban park scenes in Shanghai, China. Urban For. Urban Green. 2016, 15, 112–122. [Google Scholar] [CrossRef]
  47. Zhang, L.; Dempsey, N.; Cameron, R. Flowers–Sunshine for the soul! How does floral colour influence preference, feelings of relaxation, and positive uplift? Urban For. Urban Green. 2023, 79, 127795. [Google Scholar] [CrossRef]
  48. Ulrich, R.S. Natural Versus Urban Scenes. Environ. Behav. 1981, 13, 523–556. [Google Scholar] [CrossRef]
  49. Howley, P. Landscape aesthetics: Assessing the general public’s preferences towards rural landscapes. Ecol. Econ. 2011, 72, 161–169. [Google Scholar] [CrossRef]
  50. White, M.; Smith, A.; Humphryes, K.; Pahl, S.; Snelling, D.; Depledge, M. Blue space: The importance of water for preference, affect, and restorativeness ratings of natural and built scenes. J. Environ. Psychol. 2010, 30, 482–493. [Google Scholar] [CrossRef]
  51. Deng, L.; Li, X.; Luo, H.; Fu, E.-K.; Ma, J.; Sun, L.-X.; Huang, Z.; Cai, S.-Z.; Jia, Y. Empirical study of landscape types, landscape elements, and landscape components of the urban park promoting physiological and psychological restoration. Urban For. Urban Green. 2020, 48, 126488. [Google Scholar] [CrossRef]
  52. Jiang, B. Urban Natural Landscape and Citizens’ Mental Health: Key Issues. Landsc. Archit. 2020, 27, 17–23. [Google Scholar] [CrossRef]
  53. Yin, L.X.; Sun, B.; Zhao, M. Poetic Dwelling: Analysis on Landscape of the Ancient Kunming Town. Chin. Landsc. Archit. 2020, 36, 139. [Google Scholar] [CrossRef]
  54. Deghati Najd, M.; Ismail, N.A.; Maulan, S.; Mohd Yunos, M.Y.; Dabbagh Niya, M. Visual preference dimensions of historic urban areas: The determinants for urban heritage conservation. Habitat Int. 2015, 49, 115–125. [Google Scholar] [CrossRef]
  55. Packer, J.; Bond, N. Museums as Restorative Environments. Curator: Mus. J. 2010, 53, 421–436. [Google Scholar] [CrossRef]
  56. Gallou, E.; Uzzell, D.; Sofaer, J. Perceived place qualities, restorative effects, and self-reported wellbeing benefits of visits to heritage sites: Empirical evidence from a visitor survey in England. Wellbeing Space Soc. 2022, 3, 100106. [Google Scholar] [CrossRef]
  57. Zhou, W. The History of Classical Chinese Gardens, 3rd ed.; Tsinghua University Press: Beijing, China, 1999; pp. 29–33. [Google Scholar]
  58. Wei, W.; Li, Z.H. A Study on the Evolution of Waterfront Landscape Pattern in Dianchi Lake. J. Kunming Univ. Sci. Technol. (Nat. Sci.) 2018, 43, 113–118. [Google Scholar] [CrossRef]
  59. Hirschman, E.C. The effect of verbal and pictorial advertising stimuli on aesthetic, utilitarian, and familiarity perceptions. J. Advert. 1986, 15, 27–34. [Google Scholar] [CrossRef]
  60. Boyd, D.; Crawford, K. Critical questions for big data: Provocations for a cultural, technological, and scholarly phenomenon. Inf. Commun. Soc. 2012, 15, 662–679. [Google Scholar] [CrossRef]
  61. Hargittai, E. Potential Biases in Big Data: Omitted Voices on Social Media. Soc. Sci. Comput. Rev 2018, 38, 10–24. [Google Scholar] [CrossRef]
  62. Heikinheimo, V.; Tenkanen, H.; Bergroth, C.; Järv, O.; Hiippala, T.; Toivonen, T. Understanding the use of urban green spaces from user-generated geographic information. Landsc. Urban Plan. 2020, 201, 103845. [Google Scholar] [CrossRef]
  63. Waterloo, S.F.; Baumgartner, S.E.; Peter, J.; Valkenburg, P.M. Norms of online expressions of emotion: Comparing Facebook, Twitter, Instagram, and WhatsApp. New Media Soc. 2018, 20, 1813–1831. [Google Scholar] [CrossRef]
  64. Reinecke, L.; Sabine, T. Authenticity and well-being on social network sites: A two-wave longitudinal study on the effects of online authenticity and the positivity bias in SNS communication. Comput. Hum. Behav. 2014, 30, 95–102. [Google Scholar] [CrossRef]
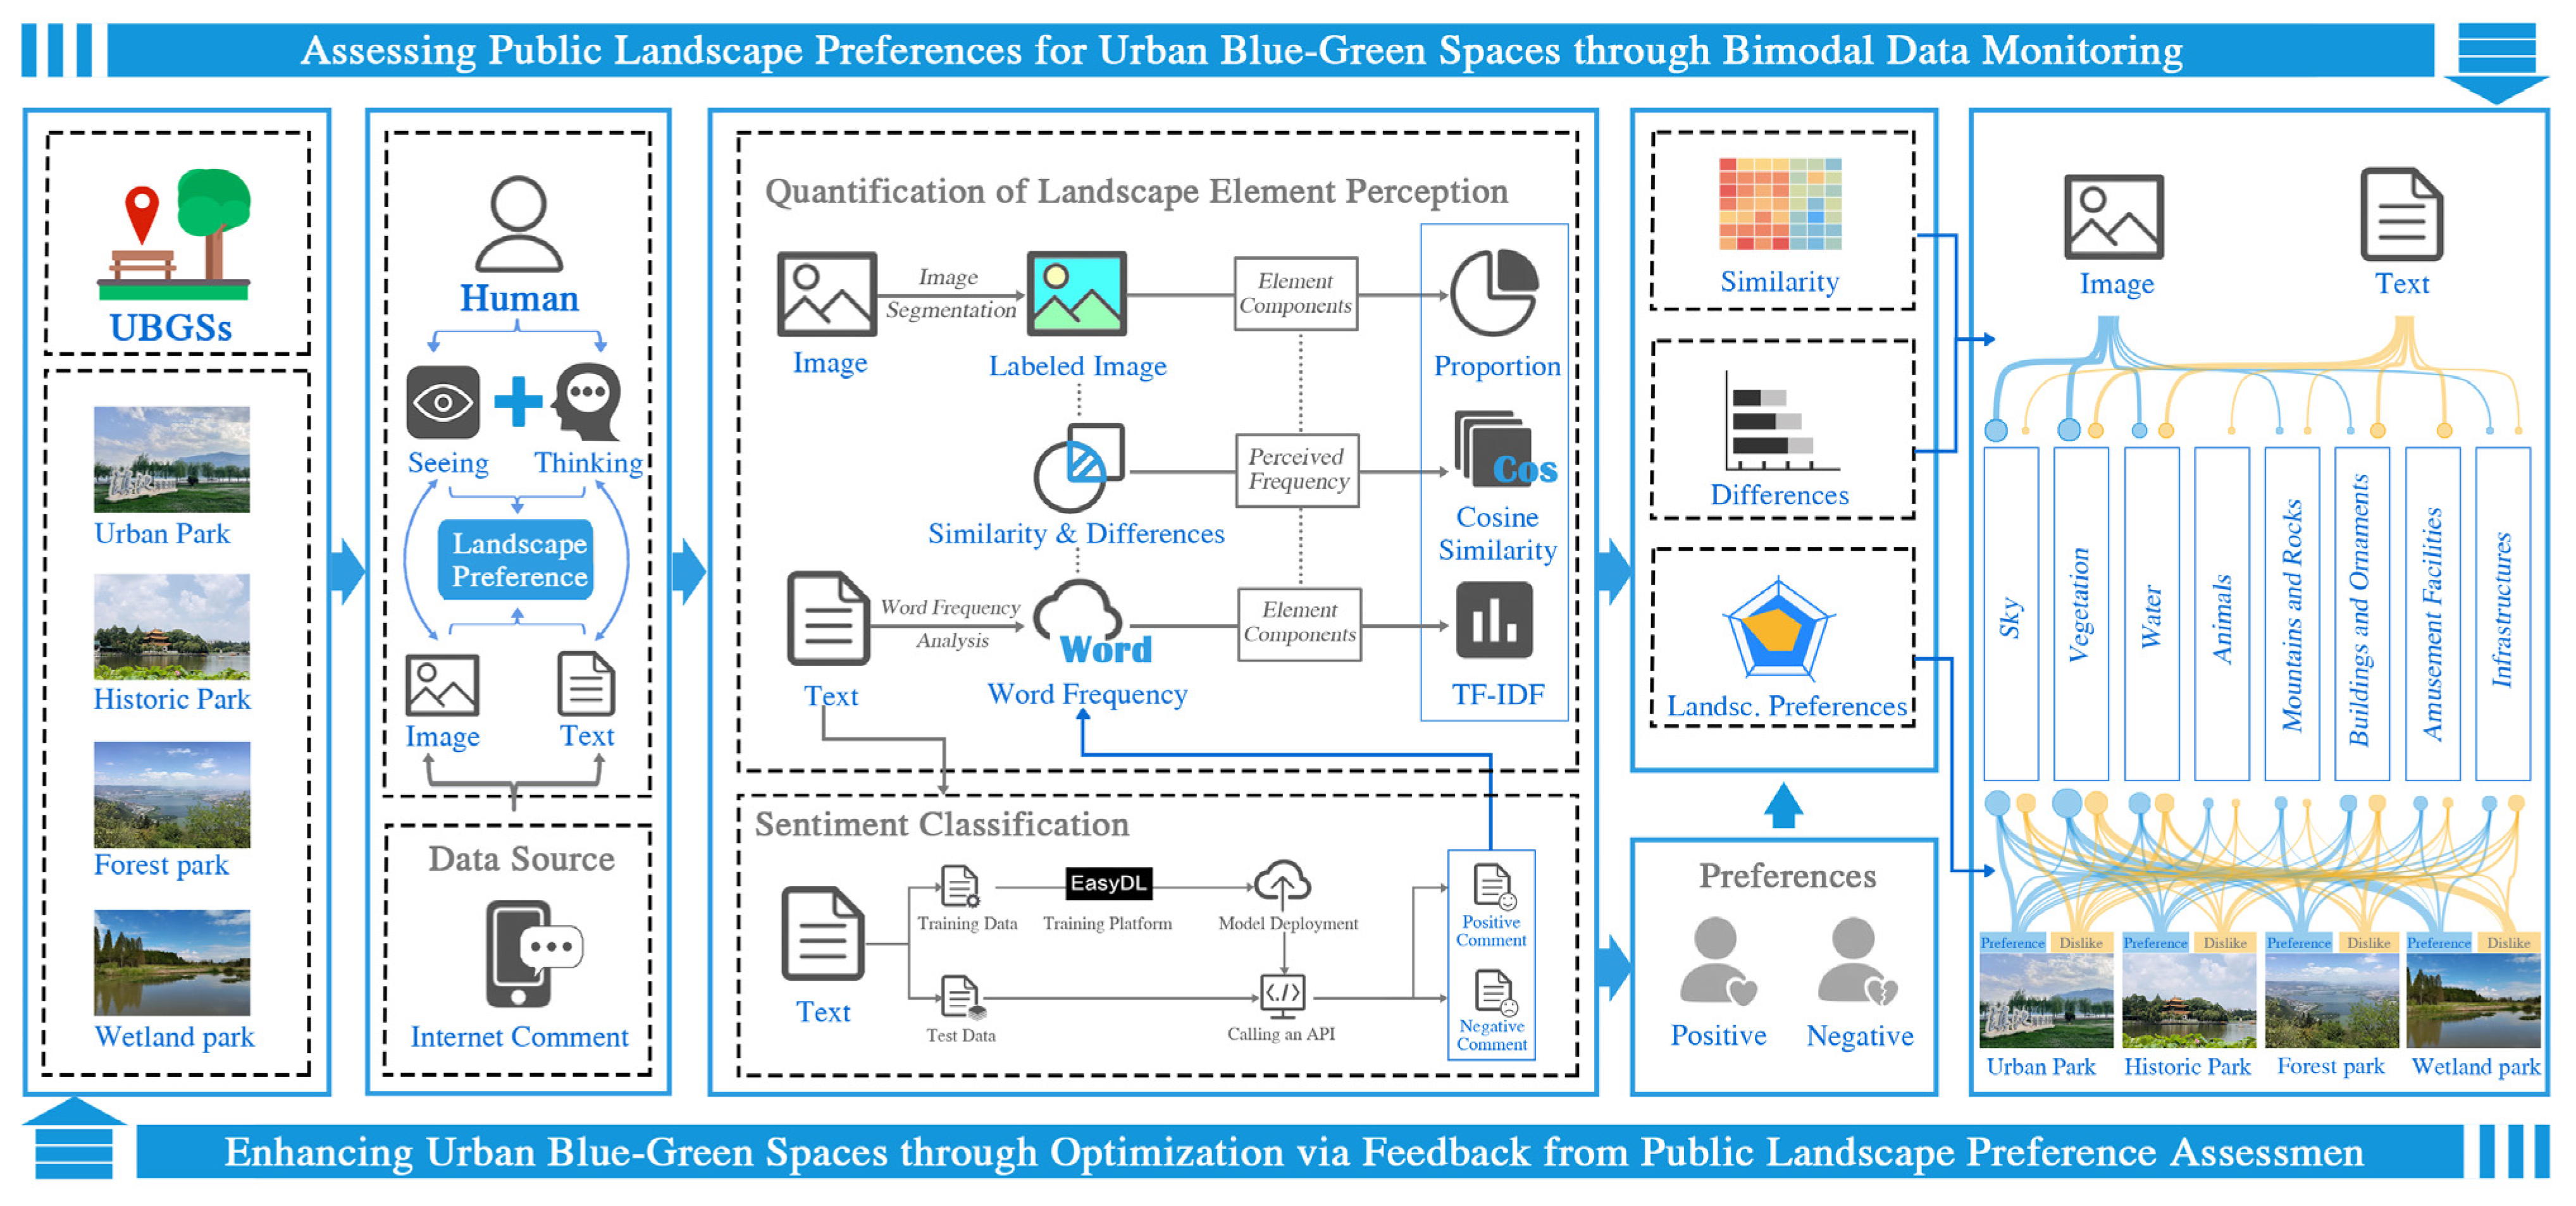
Figure 1. Framework of landscape preference assessment based on bimodal data.
Buildings 14 01426 g001
Figure 2. The case study encompasses 7 parks surrounding Dianchi Lake in southwest Kunming, China.
Buildings 14 01426 g002
Figure 3. Text and image data are integrated to extract and classify landscape elements.
Buildings 14 01426 g003
Figure 4. The number of park comments and the number of three sentiments.
Buildings 14 01426 g004
Figure 5. Similarity scores of element components in different parks and different sentiments. (p) and (n) indicate positive and negative comments, respectively.
Buildings 14 01426 g005
Figure 6. Comparison of landscape element proportions in image and text modes for two sentiment tendencies. (a), (b), (c) and (d) represent urban park, historic park, forest park and wetland park, respectively.
Buildings 14 01426 g006
Figure 7. Comparison of landscape element preferences and dislikes.
Buildings 14 01426 g007
Table 1. Descriptions of the case sites.
NameArea/haTypeLandscape Features
Dagauan Park46Historic parkThe historic park is built along the water, with lake embankments, lotus ponds, and exquisite pavilions and terraces. The park, dating back to the Kangxi period, features the renowned Daguan Tower, from which people can enjoy views of Xishan mountain and Dianchi Lake.
Haigeng Park50Urban parkThe urban park functions as the chief site for observing Dianchi Lake and Siberian seagulls. Along the lakefront, trees sway in shades of green, accompanied by orange and yellow paths, green lawns, and an array of vibrant sculptures, catering to people’s desires for leisure, physical activity, and social interaction.
Xishan Forest Park889Forest parkThe Forest Park, adjacent to Dianchi Lake, boasts lush vegetation and a fresh and elegant environment. From this park, one can also have a panoramic view of the vast Dianchi Lake, making it an ideal destination for city residents to climb and enjoy the scenery. The numerous ancient temples and Qing Dynasty grottoes on the mountain are must-visit places for tourists who have a deep appreciation for cultural heritage.
Haihong Wetland Park26Wetland parkWetland parks are situated around Dianchi Lake, serving ecological restoration and recreation purposes. The park encompasses waterborne forests, lawns, floral gardens, and natural-style revetments lining the waterfront, offering people opportunities to experience nature and participate in leisure activities.
Wangguan Wetland Park48
Dounan Wetland Park43
Laoyuhe Wetland Park53
Table 2. Model Training Results.
PrecisionRecallF1-Score
Positive0.960.970.96
Negative0.890.870.88
Overall0.930.920.92
Table 3. Landscape Elements Classification.
Landscape CategoriesLandscape ElementsElement Components
Natural landscapesSkysky
Vegetationtrees
grass
flowers
Waterwater
Animalsbirds
pets
Mountains and rocksmountains
rocks
Artificial landscapesBuildings and ornamentsbuildings
sculptures
lights
display boards
bridges
Amusement facilitiesboats
tents
grandstand
cable cars
Ferris wheels
bicycles
Infrastructuresbarrier
steps
roads
ground
Disclaimer/Publisher’s Note: The statements, opinions and data contained in all publications are solely those of the individual author(s) and contributor(s) and not of MDPI and/or the editor(s). MDPI and/or the editor(s) disclaim responsibility for any injury to people or property resulting from any ideas, methods, instructions or products referred to in the content.