Article

A Multiphysics Simulation Study of the Thermomechanical Coupling Response of Energy Piles

1
No. 6 Geological Team of Shandong Provincial Bureau of Geology and Mineral Resources, Weihai 264209, China
2
Beijing Urban Construction Group Co., Ltd., Beijing 100089, China
3
School of Civil Engineering, Qingdao University of Technology, Qingdao 266520, China
4
Shandong Hi-Speed Qingdao Industry Investment Co., Ltd., Qingdao 266100, China
5
Shandong Road and Bridge Group Qingdao Construction Co., Ltd., Qingdao 266100, China
*
Author to whom correspondence should be addressed.
Buildings 2024, 14(5), 1440; https://doi.org/10.3390/buildings14051440
Submission received: 12 March 2024 / Revised: 5 May 2024 / Accepted: 14 May 2024 / Published: 16 May 2024
(This article belongs to the Special Issue Trends and Prospects in Civil Engineering Structures)

Abstract

:
The global demand for energy is on the rise, accompanied by increasing requirements for low-carbon environmental protection. In recent years, China’s “double carbon action” initiative has brought about new development opportunities across various sectors. The concept of energy pile foundation aims to harness geothermal energy, aligning well with green, low-carbon, and sustainable development principles, thus offering extensive application prospects in engineering. Drawing from existing research globally, this paper delves into four key aspects impacting the thermodynamic properties of energy piles: the design of buried pipes, pile structure, heat storage materials within the pipe core, and soil treatment around the pile using carbon fiber urease mineralization. Leveraging the innovative mineralization technique known as urease-induced carbonate mineralization precipitation (EICP), this study employs COMSOL Multiphysics simulation software to analyze heat transfer dynamics and establish twelve sets of numerical models for energy piles. The buried pipe design encompasses two types, U-shaped and spiral, while the pile structure includes concrete solid energy piles and tubular energy piles. Soil conditions around the pile are classified into undisturbed sand and carbon fiber-infused EICP mineralized sand. Different inner core heat storage materials such as air, water, unaltered sand, and carbon fiber-based EICP mineralized sand are examined within tubular piles. Key findings indicate that spiral buried pipes outperform U-shaped ones, especially when filled with liquid thermal energy storage (TES) materials, enhancing temperature control of energy piles. The carbon fiber urease mineralization technique significantly improves heat exchange between energy piles and surrounding soil, reducing soil porosity to 4.9%. With a carbon fiber content of 1.2%, the ultimate compressive strength reaches 1419.4 kPa. Tubular energy piles mitigate pile stress during summer temperature fluctuations. Pile stress distribution varies under load and temperature stresses, with downward and upward friction observed at different points along the pile length. Overall, this research underscores the efficacy of energy pile technologies in optimizing energy efficiency while aligning with sustainable development goals.

1. Introduction

The development of energy piles has its origins in geothermal heat pump (GHP) systems and pile foundations. A GHP system is an application project connected to a building to control the indoor temperature by using geothermal energy, while a pile foundation is a bridge to transfer loads between the building and the ground. Both systems are underground. With the development of engineering technology, the two were integrated and expanded into an energy pile.
In order to study the factors influencing the thermal conductivity of energy piles, relevant scientists examined various buried pipe shapes. It has been found that energy piles in the form of buried spiral pipes have a higher average temperature, a more uniform temperature distribution in the cross section, and better thermal performance than piles in other pipe shapes. It is suggested that spiral pitch is an important factor affecting thermal conductivity [1,2,3]. It has also been found that the thermal conductivity of the soil around a pile also greatly influences that of the energy pile [4,5,6]. In addition, in a parameter analysis, the pile length, number of pipes, and liquid volume flow also have a large influence on the thermal conductivity of energy piles, while the concrete cover and pile diameter only have a small impact [7,8,9].
In addition to the study of the thermal conductivity of energy piles, the study of the thermomechanical coupling properties of energy piles has also attracted many researchers at home and abroad. Gong Jianqing and Peng Wenzhe [10] analyzed the changes in lateral friction of energy piles at different positions with temperature differences. Large temperature differences affect the axial load and lateral friction of a pile. Thermal load is the greatest in the middle of a pile. As the temperature increases, the relative displacement of the soil around a pile also increases, and the energy pile generates additional settlement and unrecoverable axial forces [11,12,13,14]. According to Du Ting, Li Yubo et al. [15], as thermal load increases, the temperature fluctuation range of the soil around a pile increases, the strain and displacement of a pile body also increase, and the residual strain and plastic displacement after temperature change also increase. According to Weibo Yang, Laijun Zhang et al. [16], under thermal load alone, the displacement of a pile top in the summer can be restored to its original state, and in the winter, an irreversible displacement occurs. The thermomechanical coupling load increases as the inlet temperature increases in the summer or decreases in the winter. Huang Xu, Kong Gang-Qiang et al. [17] focused on the displacement change in a pile top during heating and cooling cycles under summer operating conditions. Regarding pile displacement and load changes during temperature changes, Fang Jin-cheng, Kong Gang-qiang et al. [18] found that residual compressive stress was mainly caused by resistance of the surrounding soil. The study conducted by Zhong-jin Wang [19] shows that the load on the top of an energy pile should not be greater than the value of plastic deformation and nonlinear settlement of a pile top. For the heat transfer efficiency at different positions of a pile, Chen Zhi, Yao Jinwen et al. [20] assume that the upper part of a pile has a larger thermal radius and a higher heat exchange rate per linear meter than the lower part. When it comes to software simulation, Li Qi, You Shuang et al. [21] studied the structural response and bearing capacity of energy piles under heating and cooling conditions using COMSOL. According to them, the axial load on the upper part of a pile body increases, that on the lower part is greater than the force from the structural stress alone, and the lateral friction increases. Under cooling conditions, the lateral friction of the pile body decreases at its upper end and increases at its lower end.
Recently, numerical modelling has often been applied to the design of borehole heat exchanger fields. Casasso [22] conducted a simulation of the heat exchange of a borehole heat exchanger with soil and an aquifer system through FEFLOW 6.0. Antelmi and Vespasiano [23,24] proposed that too many borehole heat exchangers is wasteful and uneconomical, and, therefore, a numerical solution is necessary. In the process of numerical simulation, the selection of model parameters is particularly important. Alberti et al. [25] consider two types of ground source heat pumps, fitting the numerical ground response with analytical solutions and comparing the two models; the effect of the grout material was assessed in terms of exchanged energy and temperature distribution in the subsoil. In the simulation process, the same parameters obtained different results in different simulation processes (Di Dato et al. [26]); the interaction between heterogeneity and some thermal hydrogeological parameters and engineering parameters is studied in this process. With thermal break time and recirculation ratio as the main design parameters, thermal break time alone will lead to the conclusion of system error.
Based on current research on energy piles, this paper synthesizes existing experimental and field data, selects parameters essential for subsequent numerical calculations, and employs COMSOL6.0 Multiphysics simulation software. The numerical model of the energy pile is established under diverse conditions such as U-shaped buried pipes, spiral buried pipes, solid piles, embedded energy material pipe piles, undisturbed sandy subsoil, and carbon fiber-based EICP mineralized sand subsoil. Through theoretical analysis, heat transfer conditions, solution equations for energy pile thermodynamics, mechanical analysis conditions, and solution equations are delineated. The simulation software is then utilized to assess the impact of various factors and their combined effects on the thermodynamic performance of energy piles during summer and winter conditions. This analysis aims to optimize the design parameters of energy piles and evaluate the influence of the carbon fiber-based EICP grouting mineralization method on energy pile performance.

2. Energy Pile Simulation Study, Mechanism Analysis, and Modeling

2.1. Study and Analysis of Energy Pile Calculation Model and Mechanism

2.1.1. Analysis of the Heat Conduction Mechanism

After determining the range of affected soils to be considered, heat transfer analysis conditions, as depicted in Figure 1, are established using the following simplification principles:
(1)
Disregard impurities and non-uniformity within the soil around the pile, treating it as uniform with constant thermal conductivity and specific heat capacity.
(2)
The farther away from the pile, the smaller the temperature change in the soil mass, and the smaller the heat transfer effect. Therefore, only the influence of the soil mass within a certain range from the pile tip is considered, and it is considered that the soil mass outside the range will no longer have heat exchange.
(3)
There is contact heat transfer with contact thermal resistance between pile and soil.

2.1.2. Mechanics Analysis

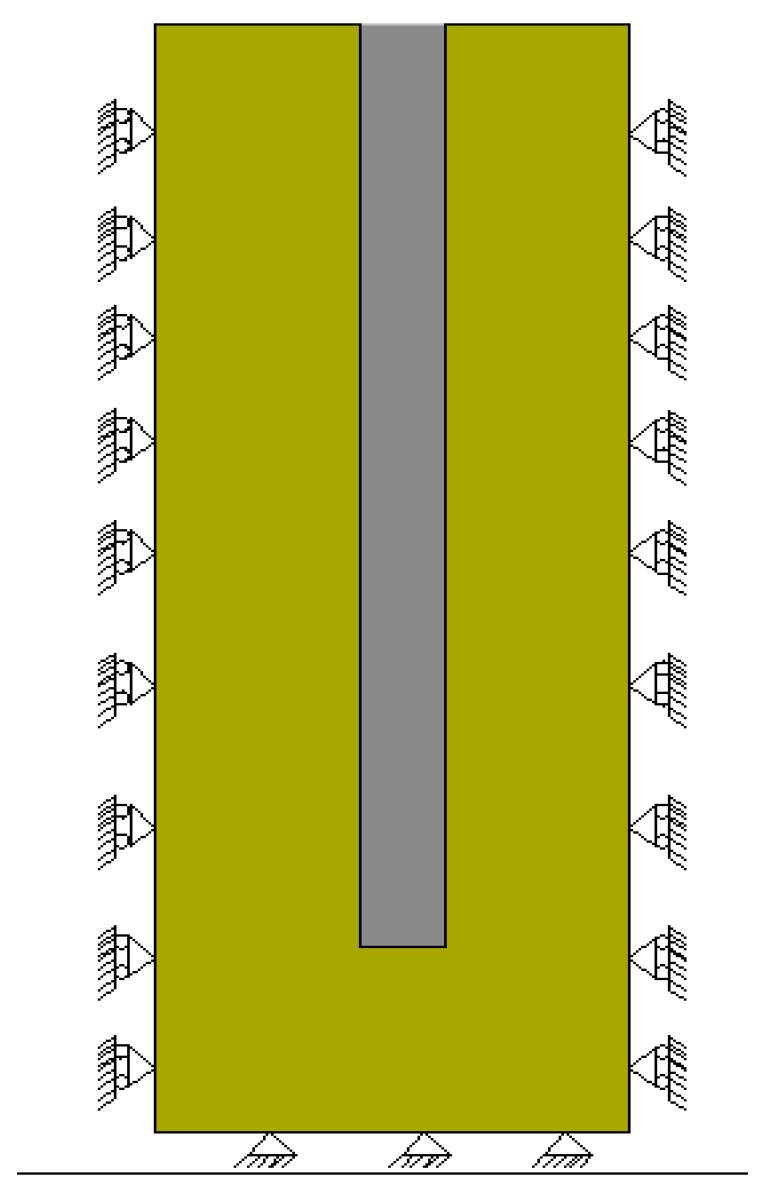
The area of affected soil is determined. The pile–soil interface is assumed to be in full contact through friction and contact pressure, the surface of the soil is freely bounded, and a field-applied load is simulated on the surface of the pile top. Side friction and any fixed constraints that cause displacement out of range are ignored. A mechanical model is created, as shown in Figure 2.

2.1.3. Analysis of Thermomechanical Coupling Mechanism

Heat transfer in this study is divided into solid heat transfer and liquid heat transfer.
Heat transfer between solids occurs primarily in the form of conduction, which can be expressed using Fourier’s law:
Q = k T
Q : conducted heat transfer flux, in ( W / m 2 ); k : thermal conductivity; and T : temperature difference between contacting solids.
Based on the first law of thermodynamics, the law of conservation of energy, the equation of transient solid heat transfer, expressed by temperature, is as follows:
ρ C p T t + u trans T + q + q r = Q
ρ : density of solid materials; C p : specific heat capacity of solid materials; T t : time accumulation, unsteady; T is the dependent variable to be determined, and t is the operation time; u trans : velocity vector of solid translational motion; q r : radiant heat flux; and Q : other external heat sources.
For liquid heat transfer, three aspects must be considered: 1. In the heat transfer equation, liquid heat transfer is realized by convection; 2. The fluid has a viscous effect and a certain heating effect, which can be ignored at low velocity and should be considered at high velocity; and 3. The density of the liquid is affected by the temperature, which produces a thermal effect when compressed or expanded.
In order to reflect these influencing factors, the heat transfer equation of fluid is as follows:
ρ C p T t + u T + q + q r = α p T p t + u p + τ : u + Q
where ρ : density of fluid medium; C p : specific heat capacity of fluid medium; T t : time accumulation, unsteady; u T : convective heat transfer, u is the flow velocity of fluid; and α p : coefficient of thermal expansion of fluid, α p = 1 ρ ρ T ; α p T p t + u p : pressure work. Because the volume of water changes so little, the influence of pressure work is not considered. The simplified control equation is as follows:
ρ C p T t + ρ C p u T + ( k T ) = Q
Solve Equations (1) and (3) to find T = T ( x , y , z , t ) , the temperature at any position at any moment.
In mechanics, the structure is divided into statically indeterminate structure and statically indeterminate structure, and the mechanical problems in life are generally statically indeterminate structure problems. For statically indeterminate problems, most mechanical analyses rely on three types of equations: equilibrium equation, deformation equation, and constitutive relation equation. The equilibrium equation based on Newton’s second law states that any part of any structure is in equilibrium, expressed in terms of stress, as follows:
ρ 2 U 2 t 2 = · s + F ν
where U 2 is the displacement in the second direction; ρ 2 U 2 t 2 is the inertia term in the direction of ν ; F ν is the volume force in the direction of ν ; and s is the stress in the material, and in the problem of spatial elasticity, s is generally expressed by the stress tensor scale.
Constitutive relation is a kind of material model. The material models provided in COMSOL include linear elastic material, non-linear elastic material, elastic–plastic soil material, hyperelastic material, etc. In this study, linear elastic materials are selected, for which the stress is proportional to the strain. In order to simplify the complexity of the research, the model regards the material as the same material and makes two assumptions about the research problem: that the material only produces a small deformation, and that under different temperature conditions, the mechanical properties of the material are constant. The governing equation of linear elastic materials is shown in Equation (6):
S = S a d + C × θ e l
where S a d is the stress of the structure under external load; C = C ( E , ν ) , the function relation formed by elastic modulus E and Poisson’s ratio ν ; and θ e l is the elastic strain of the structure.
The elastic strain of the structure is equal to the strain generated by the structure minus the part of the inelastic strain:
θ e l = θ θ i n e l
where θ i n e l is the inelastic strain term, and θ e l = θ θ i n e l is the sum of initial strain, strain under external load, and temperature strain.
The relation between strain and displacement is as follows:
θ = 1 2 [ U 2 T + U 2 ]
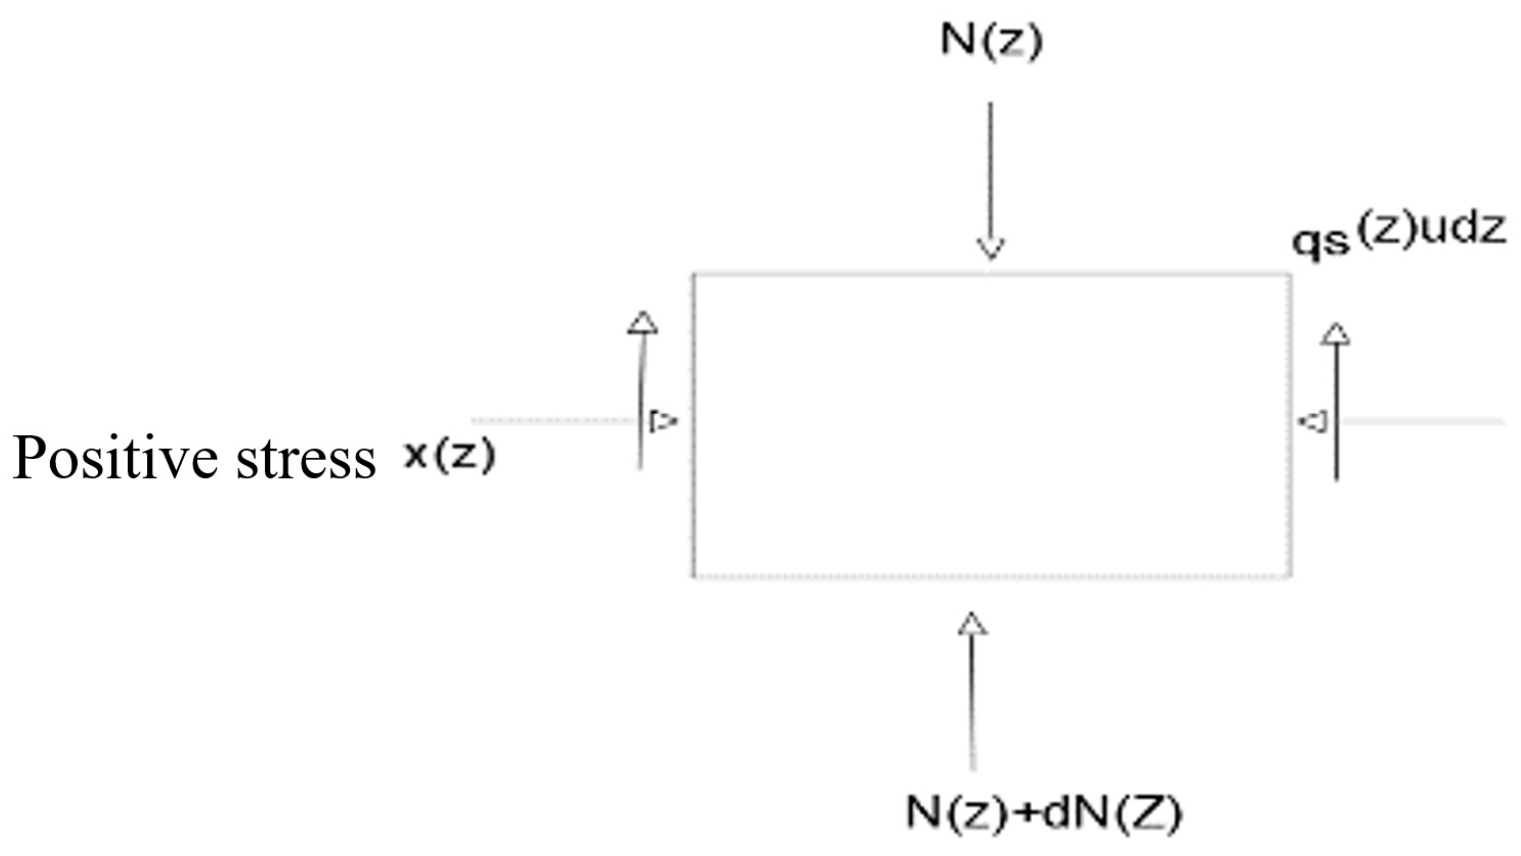
Without the pile’s dead weight considered, the force of the micro-section d z of the pile at the depth z is analyzed. According to the balance condition:
q s ( z ) π d d z + N ( z ) + d N ( z ) N ( z ) = 0
q s ( z ) : lateral resistance at a certain depth; d: pile diameter; and N ( z ) : axial force at a certain depth.
The balance diagram of any element of the pile is shown in Figure 3.
q s ( z ) = 1 π d d N d z
This equation is the fundamental differential equation of load transfer. From this equation, it can be deduced that the lateral resistance caused by the relative displacement of the pile and soil is linearly proportional to the rate of change in the pile axial force at a certain depth.
In this paper, the calculation models for displacement and lateral resistance of a pile at a certain depth under the influence of temperature proposed by Melissa A. Stewart [27] are used. Assuming that the pile tip displacement is 0, the displacement calculation model is as follows:
δ T , i = δ T , i 1 + 1 2 ε T , i 1 + ε T , i Δ l
δ T , i : displacement at pile depth i at temperature T; ε T , i : thermal axial strain at i at temperature T; and Δ l : distance between two marked strains.
The calculation model for lateral resistance is as follows:
f s , mob , j = σ T , j 1 σ T , j D 4 Δ l
f s , mob , j : lateral resistance; J: the point at a distance of j from the top of pile foundation; D: diameter of pile foundation; and Δ l : distance between two points where the thermal axial stress position is known.
The formula for strain caused by temperature change is as follows:
ε T   free = α Δ T
α : coefficient of thermal expansion. According to aggregate mineralogy, the coefficient of thermal expansion of unreinforced concrete is −9 to −14.5 μ ε / C , and that of reinforced concrete is −11.9 to −13 μ ε / C [28]; Δ T : difference between the temperature when the energy pile has run to a certain moment and the initial temperature; and ε T free : ignoring the thermal load on the pile below the soil stiffness, according to geotechnical engineering regulations, strain under compression is defined as positive.
Its axial deformation Δ L T free :
Δ L T free = a Δ T L
L : length of energy pile.
When the pile bottom is the bearing layer and the top has the upper building load, the axial temperature stress σ of the pile is as follows:
σ = E ε T f r e e
E : Young’s modulus of elasticity of pile body.
Axial force F caused by temperature:
F = σ A
A: cross-sectional area of energy pile.
Considering the stiffness of the soil around the pile, if the strain ε T is less than ε T f r e e , the strain ε res constrained by the soil can be expressed as follows:
ε res = ε T f r e e ε T
ε T free : upper limit for temperature strain of pile.
When there is any constraint, the axial stress caused by temperature is as follows:
σ res = E ε res = E ( ε T f r e e ε ) = E ( α Δ T ε T )
Axial compression (elongation) deformation of pile caused by temperature Δ L : Δ L = ( a Δ T ε T ) L .
Temperature additional load:
P = E A ( ε T f r e e ε )
The calculation formulas of axial stress, displacement, and side friction resistance for energy pile under upper load and temperature additional load are introduced into the multi-physical coupling numerical model, and the initial values, boundary conditions, and material properties are formulated according to the engineering practice.

2.2. Design of Calculation Model

In this paper, 12 physical models for energy piles are designed from the perspective of the pile structure, the buried pipe shape, the TES materials in tubular piles, and the soil around the piles. See Table 1.
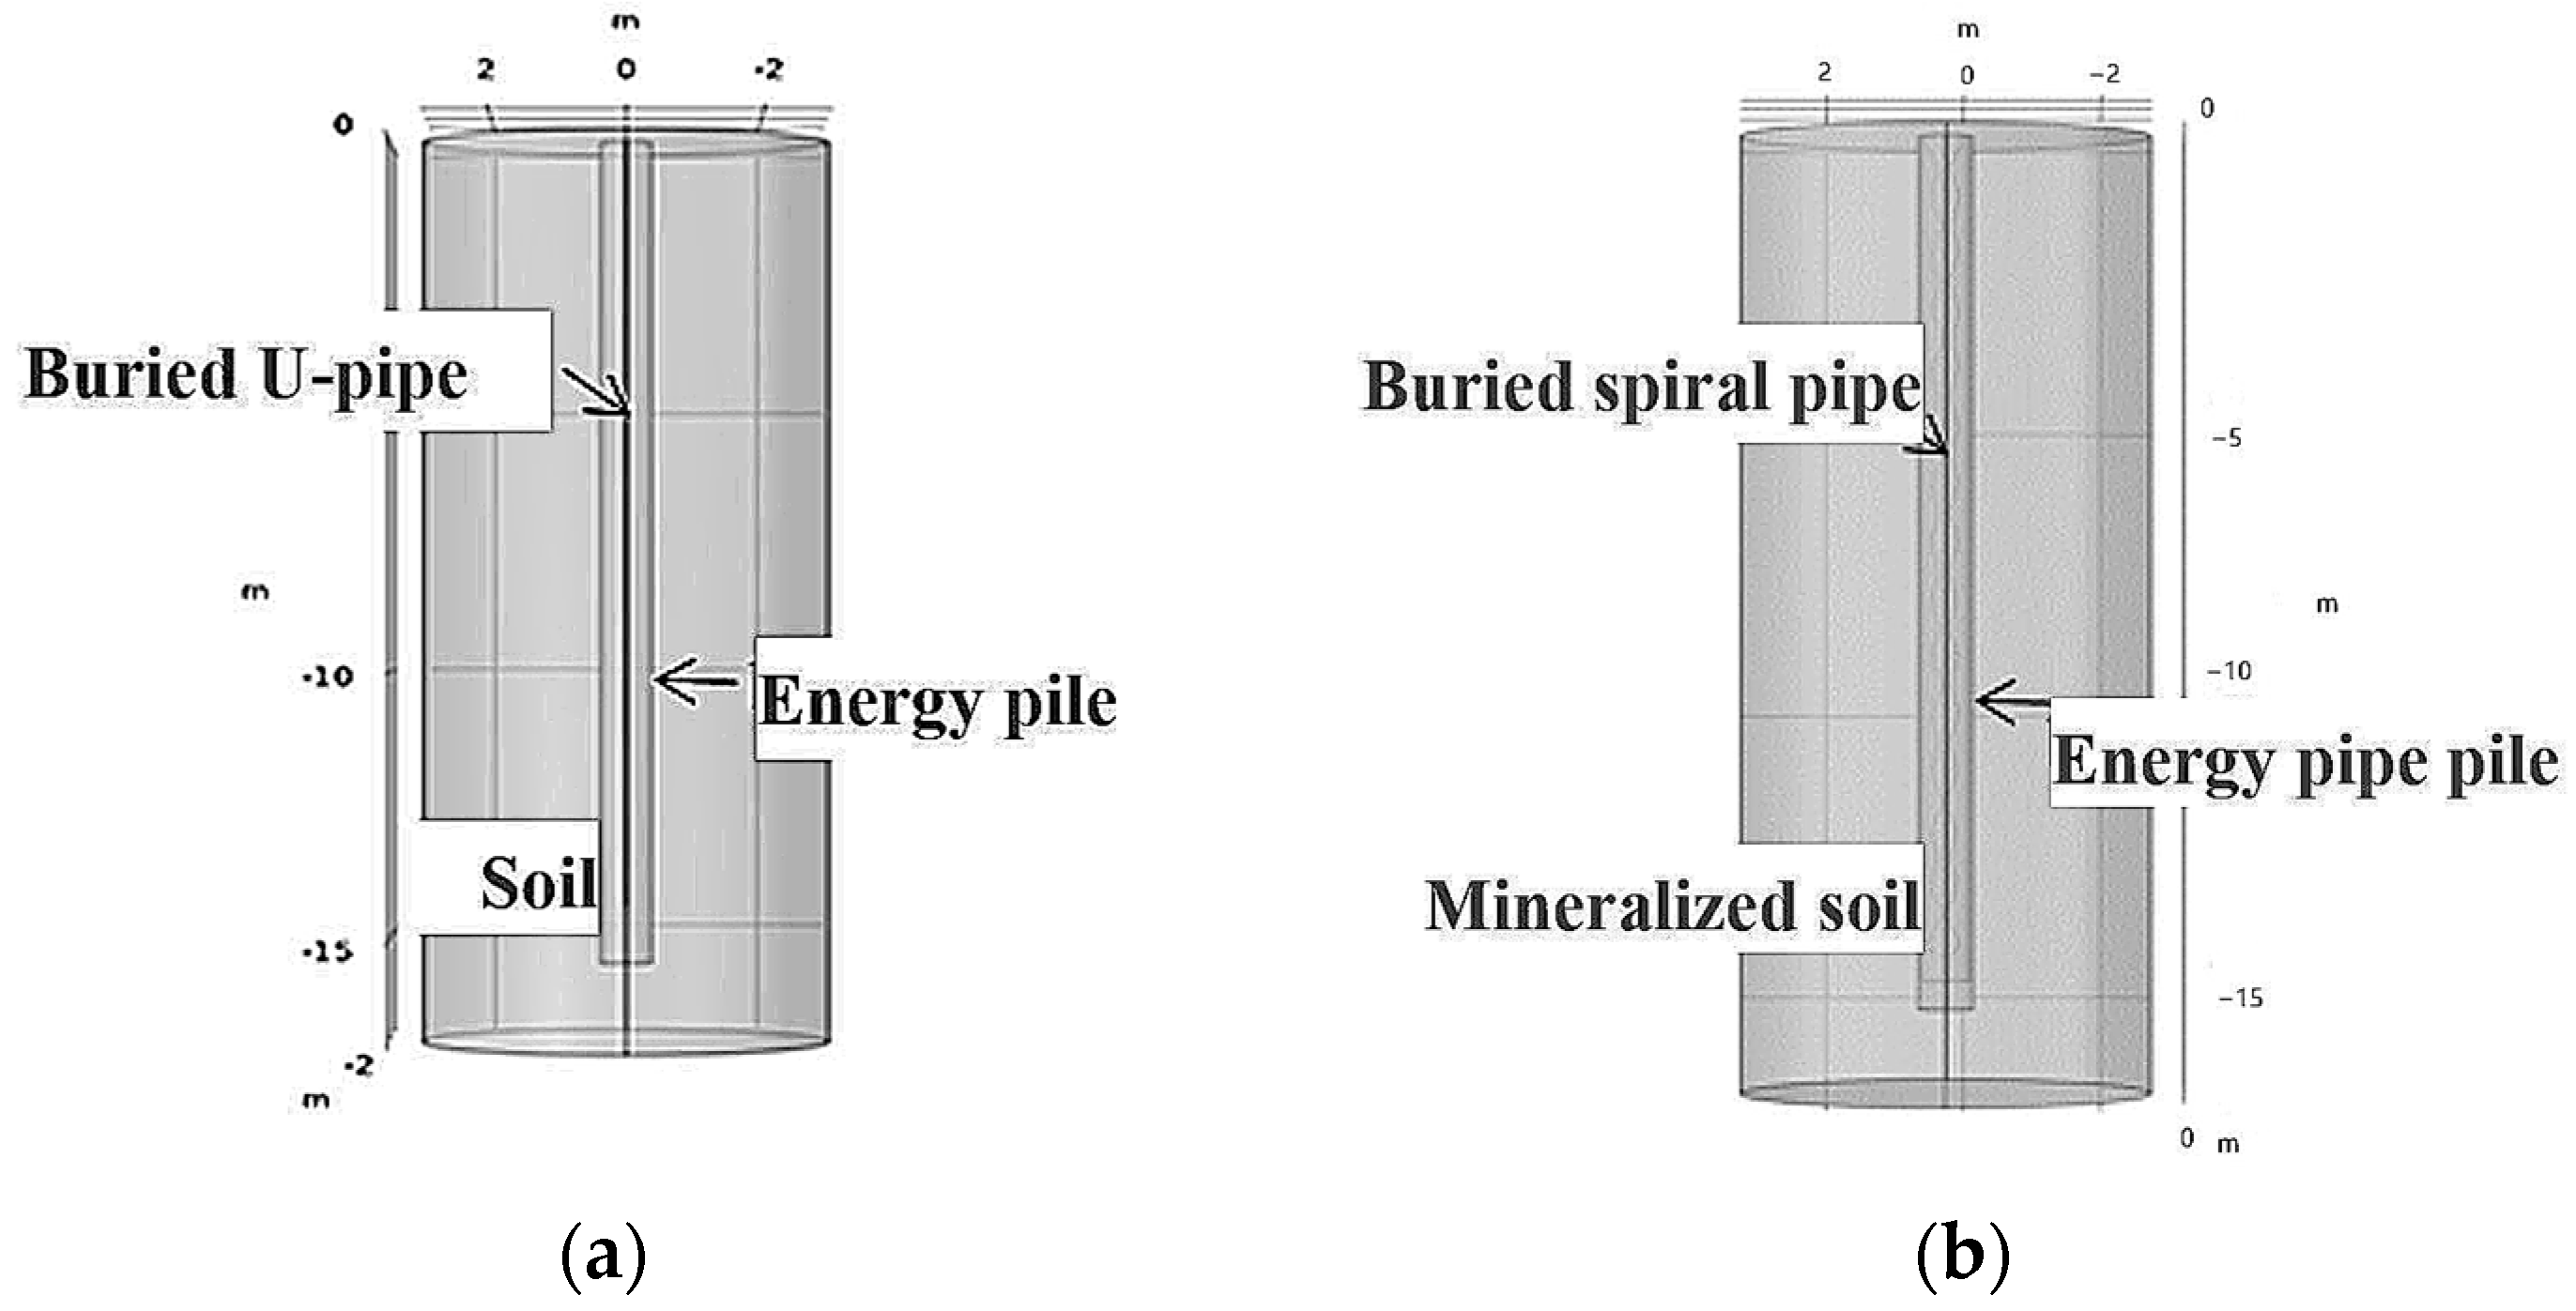
In Figure 4, there are two types of buried pipes: U-shaped and spiral. There are solid and hollow pipe piles. There are two types of soil around a pile: undisturbed sandy soil and EICP mineralized sandy soil mixed with carbon fiber. There are three types of TES materials in piles: water, undisturbed sandy soil, and mineralized soil mixed with fibers. The ground area affected by energy piles is as follows: With the center of the pile plane, with a radius of 3 m in the plane direction, and from the pile top level to a depth of 17.0 m from the plane in the elevation direction.
According to the temperature of 5.5 m underground, the initial temperature of pile, soil around pile, filling material in pipe pile, and working fluid is set at 17.7 °C, the inflow temperature in the summer condition is 36 °C, and the inflow temperature in the winter condition is 4 °C. The working fluid and the filling material of the liquid in the pipe pile are all made of tap water. According to the previous research of our research group [29], the lower the flow velocity of heat transfer fluid, the better the heat transfer effect of energy pile, but the smaller the heat transfer per unit length. Therefore, the flow rate of the heat transfer working fluid should be moderate, and the flow rate of the working fluid in all models in this study is set to 0.30 m/s. According to the research group’s previous research [29], the energy pile has the best heat transfer effect when the buried pipe diameter is 80 mm and the pitch is 200 mm, and the buried pipe in this study adopts this structural form. The parameters of materials in the model mainly focus on three aspects: first, thermal properties; second, the mechanical property; and third, the soil property.
This paper has created energy pile models for buried U-pipes and spiral pipes, models for prefabricated energy piles made of water-filled U-pipes and water-filled spiral pipes, and models for prefabricated energy piles made of U-pipes filled with mineralized soil and of spiral pipes filled with mineralized soil, respectively. COMSOL is used to study the interactive simulation of buried pipe shape, pile type, TES material in the pile, and soil treatment outside the pile. The energy pile model diagram under different conditions is shown in Figure 5.

2.3. Grid Division and Grid Independence Verification for Calculation Model

The calculation of the finite element method (FEM) is completed using the grid division method in COMSOL Multiphysics. The ultra-fine free tetrahedral grid is used for the liquid part, and the fine boundary layer grid is used for the liquid boundary and the water inlet and outlet boundary. Fill materials in the piles and soil outside the piles are divided by a free tetrahedral grid. The density of the pile body grid is set to about twice the density of the soil grid to meet the calculation accuracy requirements. The network division of each part of the energy pile is shown in Figure 6.
In this study, the grid independence of spiral energy pipe piles with an outer radius of 400 mm, an inner radius of 300 mm, and water as filler material is first tested under summer conditions. The grid division for models occurs progressively from thin to dense. The overall grid of the tested models is shown in Table 2. The total number of grids ultimately used is 105,930.
This study is divided into the coupling between three physical fields and is simulated by COMSOL Multiphysics’s solid mechanics, non-isothermal pipeline flow module, and solid and fluid heat transfer submodule.
Conjugate heat transfer in COMSOL Multiphysics is used in the heat transfer mode. Conjugate heat transfer module can provide laminar model interface and turbulence model interface. When connected to the interface, the multi-physical field coupling of “non-isothermal flow” is automatically generated; the physical field interface supports low Mach number (typically less than 0.3) flows, non-Newtonian fluids, incompressible flows, weakly compressible flows, and more, and supports steady-state and time-domain modeling in two-dimensional, two-dimensional axisymmetric, and three-dimensional geometry. During solid heat transfer, the porous medium model in COMSOL conforms to the characteristics of porous soil and groundwater seepage in this study.

3. Simulation Study and Analysis of Heat Transfer Performance of Energy Piles

3.1. Model Reliability Verification

To verify the feasibility of the numerical simulation method, we relied on the square project in front of the high-speed railway station in the northern part of Xinyang City, Henan Province. Temperature adjustment in commercial floors is carried out using pile foundation pipes and GHP systems. The diameter of the pile foundation is 800 mm, the radius of the spiral pipe is 12.5 mm, and the velocity of heat transfer liquid in the pipe is 0.8 m/s. The initial temperature of the soil is 17.7 °C. The piles are distributed in a square shape with a spacing of 4200 mm. Gui Shuqiang [30] et al. conducted an on-site TRT test under pile heating conditions at an inlet water temperature of 33 °C and a transient outlet water temperature of 31.5 °C after 12 h of operation. Based on the parameter information in this case, a model was constructed and simulated, and the simulated value was 31.2 °C. The deviation is 0.3 °C, and the relative error is about 0.5%.
The heat exchange capacity of energy pile is calculated as follows:
q = ρ l i q u i d V ρ l i q u i d C ρ l i q u i d ( T i n T o u t )
where q is the heat exchange capacity, in W; ρ ρ l i q u i d is the density of heat transfer fluid; V ρ l i q u i d is the volume of heat transfer fluid; C ρ l i q u i d is the specific heat capacity of heat transfer fluid; T i n   is the inflow temperature of heat transfer fluid; and    T o u t is the outflow temperature of heat transfer fluid.
The heat exchange capacity of the housing and simulation is calculated. The heat exchange capacity of a single pipe in the project is about 55.1 W/m and that of the simulated energy pile is about 55.8 W/m in the simulation, and the relative error is about 1.27%. It shows that the numerical model can characterize the operating law of an energy pile. After verifying the reliability of the numerical simulation, the parameter optimization design of the energy pile structure is studied based on engineering practice.

3.2. Study on Heat Transfer Performance of Energy Piles

3.2.1. Thermal Energy Analysis of Heat-Carrying Fluid Surface of Energy Piles

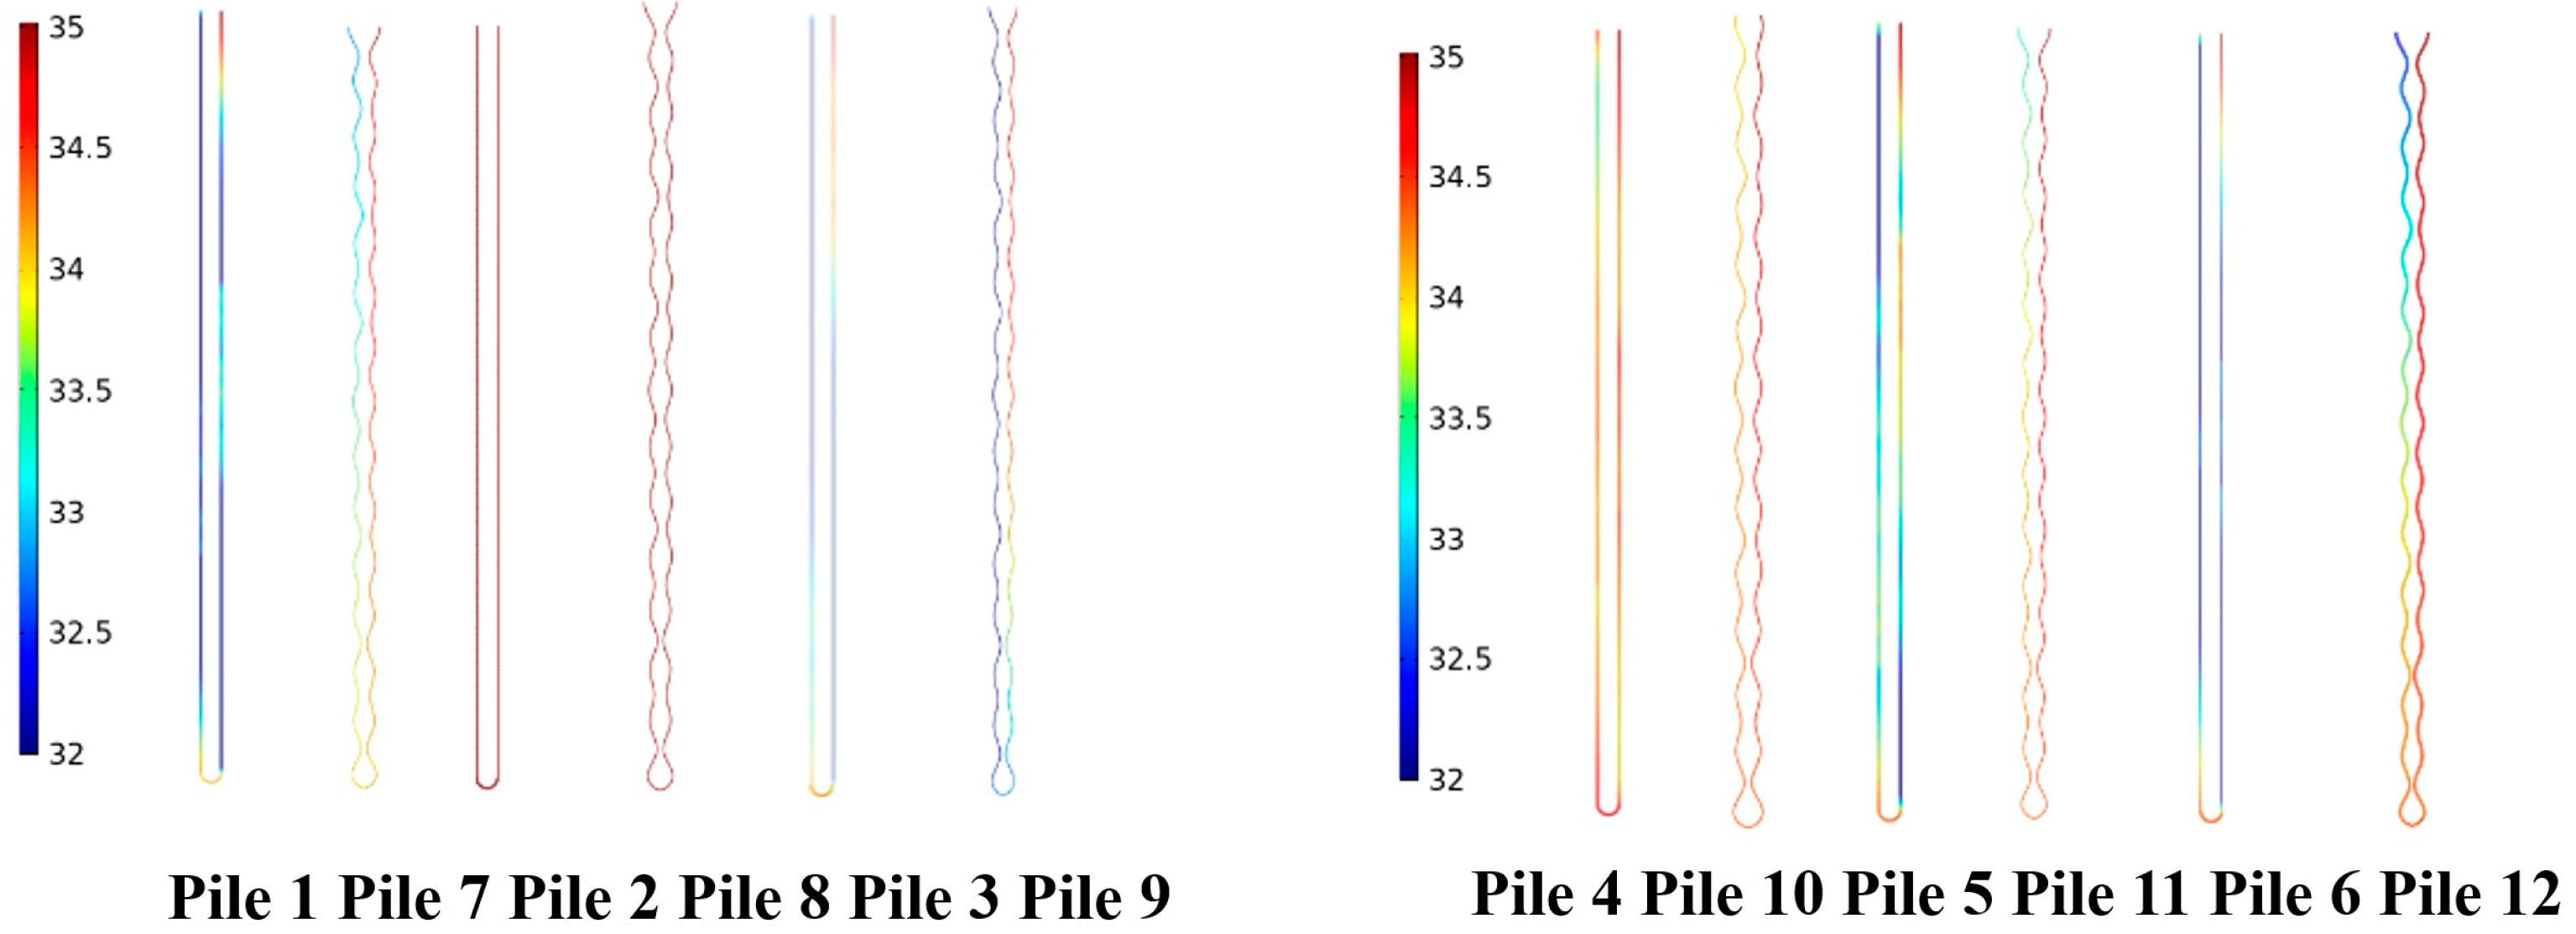
By comparing the six groups of energy piles in Figure 7, it can be found that the surface temperature reduction gradient of liquids in spiral pipes is more stable than that of liquids in U-pipes on the inlet side of buried pipes. On the inlet side, the surface temperature of the liquid in spiral pipes is higher than that of the liquid in U-pipes. The surface temperature at the bottom of the buried U-pipe is higher than the temperature upstream. It shows that when the flow path of the fluid changes, the heat carried by the fluid becomes more concentrated on the unit surface area, resulting in an increased surface temperature of the fluid. This results in an increased temperature difference between the surface of the heat-carrying fluid and the pile and promotes heat exchange between the pile and the fluid. This also explains why the heat exchange efficiency of buried spiral pipes is higher than that of other types of buried pipes.

3.2.2. Analysis of Influencing Factors of Heat Exchange of Energy Piles

In this work, the influence of the shape and structural parameters of buried pipes, the pile form and structural parameters, and soil properties on the heat transfer of energy piles is investigated through simulation studies. The outlet water temperature of each pile is shown in Table 3.
S S T = 22.13 ;   S S A = 20.29 ;   S S B = 0.45 ;   S S ( A * B )   = 0.57 ;
M S A = 5.07 ;   M S B = 0.45 ;   M S ( A * B )   = 0.57 ;
F 0 A = 61.93 ;   F 0 B = 5.50 ;   F 0 ( A * B )   = 1.74
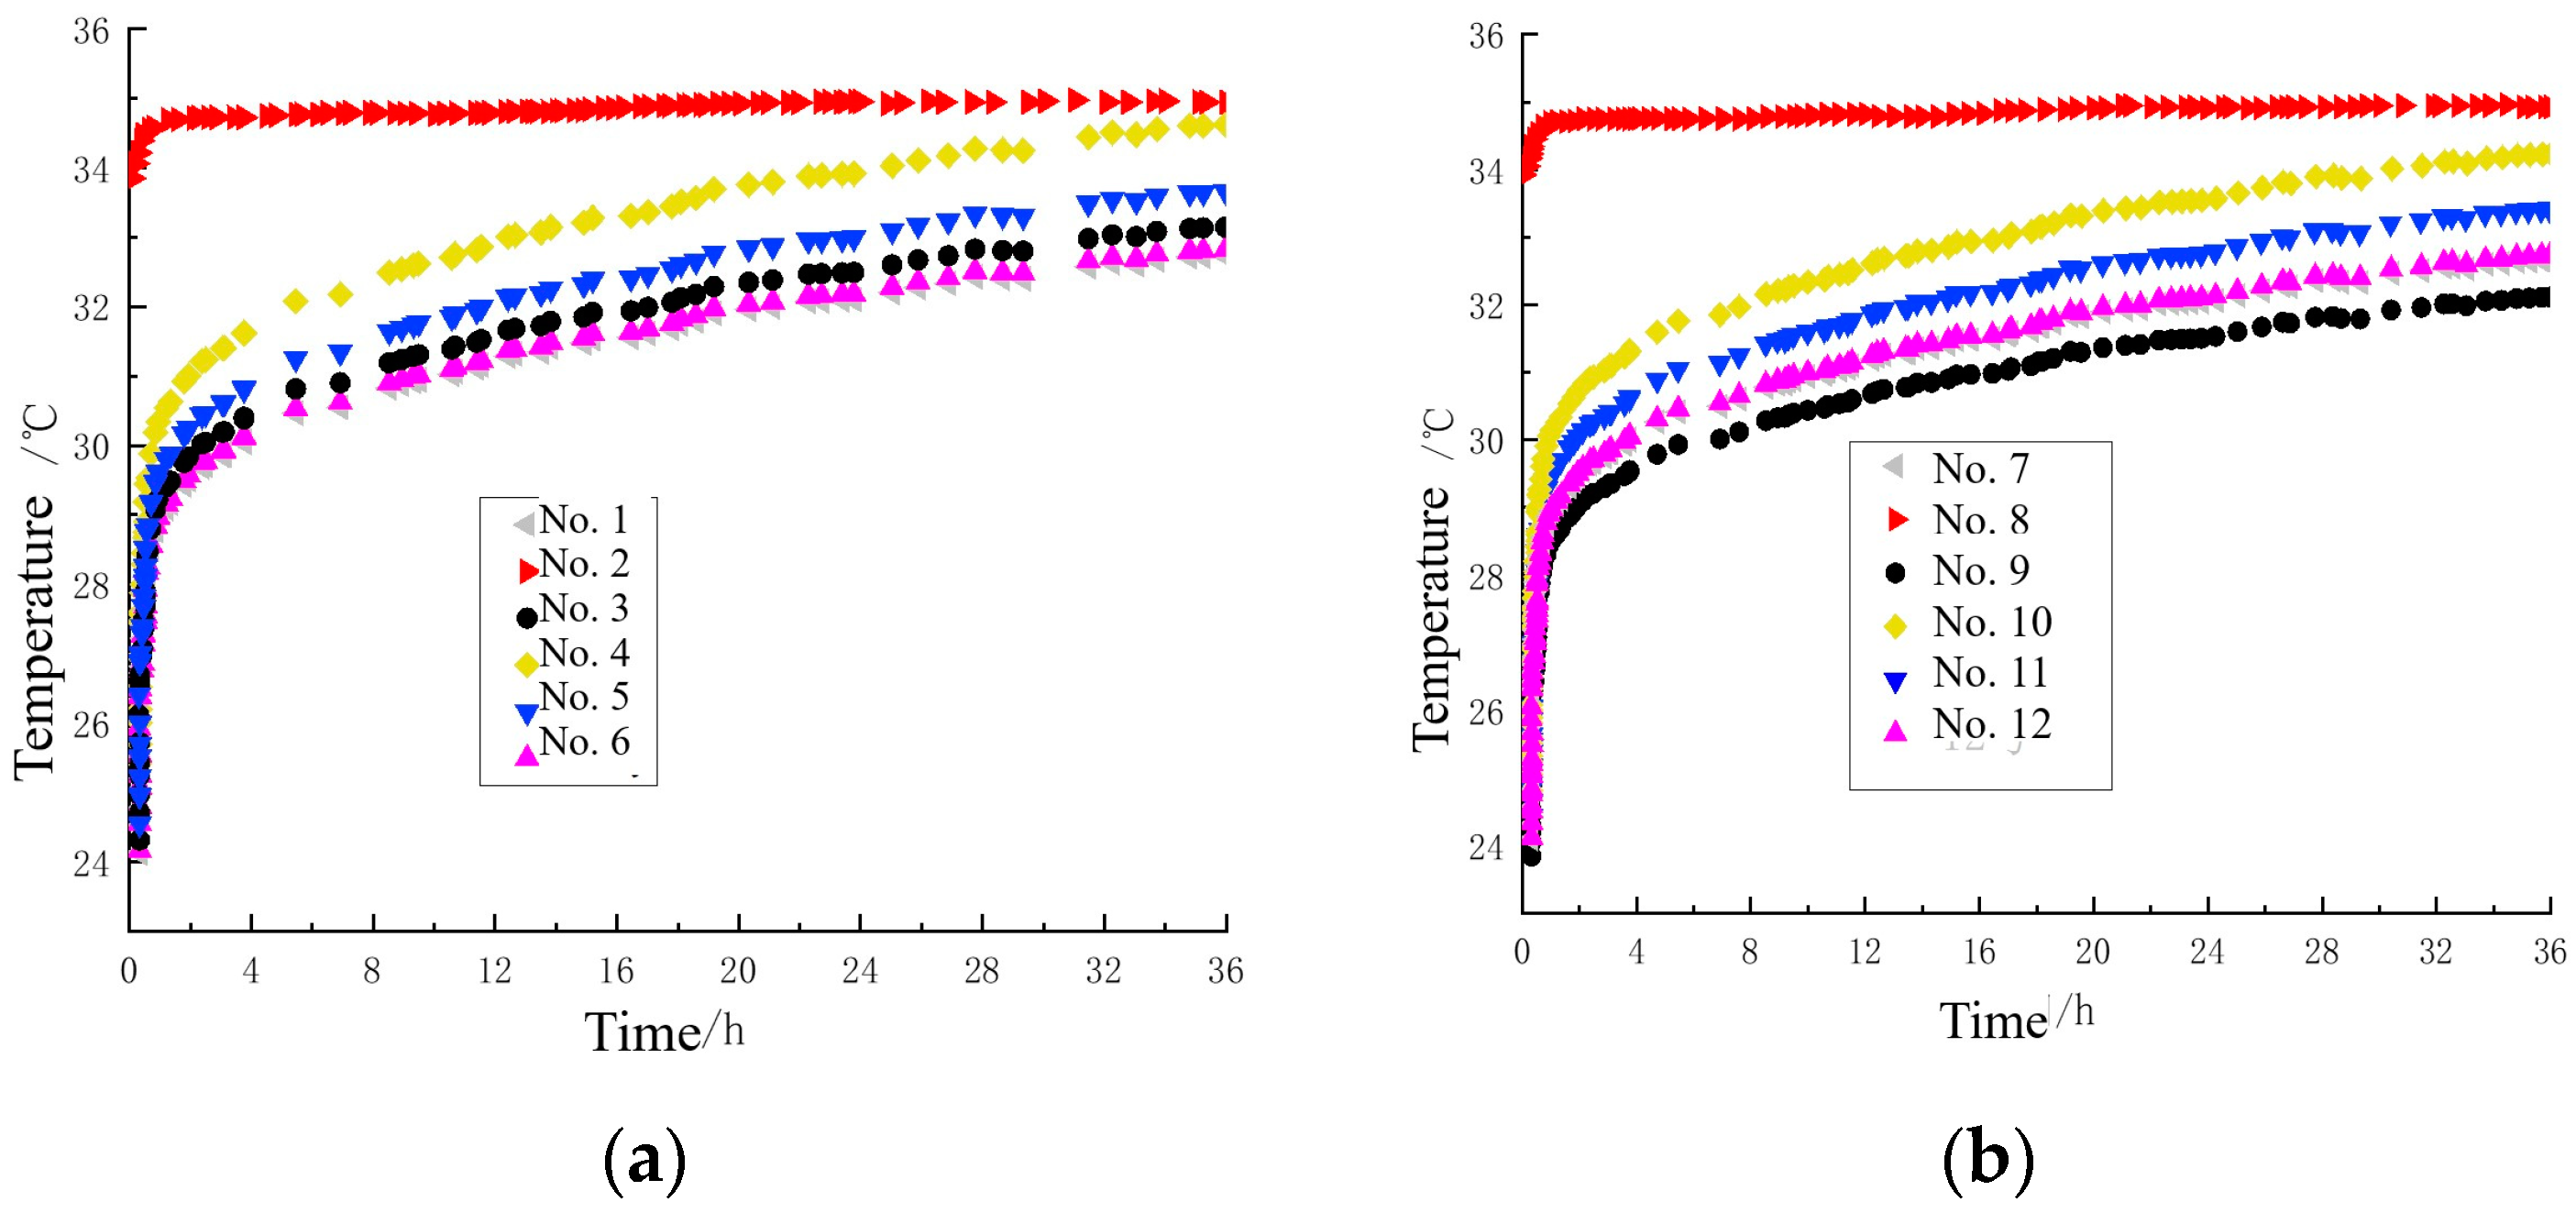
 where F 0 A > F 0.01 . It shows that the influence level of row factors on the outlet temperature of energy piles is highly significant. F 0.05 < F 0 B < F 0.01 . It shows that the influence level of column factors on the outlet temperature of energy piles is significant. F 0 ( A * B ) < F 0.05 . It is assumed that the interaction between factor A and factor B does not have a significant influence on the outlet temperature of energy piles. In order to analyze the influence of Factor A and Factor B on the heat transfer performance of the energy pile and the work law of the energy pile, the variation in outlet temperature of the energy pile with time under summer conditions is plotted in Figure 8.
The outlet water temperatures of energy piles 1–6 and 7–12 in Table 1 are respectively compared, as shown in Figure 8.
As can be seen from Figure 8a, at each time point, the outlet water temperature of pile No. 1 is the lowest, the heat transfer efficiency of pile No. 6 is about 928.66 W, and the heat transfer efficiency of pile No. 6 is only slightly different from that of pile No. 1, with the heat transfer efficiency of 905.94 W. The heat transfer was 811.65 W, 665.68 W, and 391.91 W, respectively. The heat transfer efficiency of pile No. 2 was the worst, and the heat transfer was 312.39 W. The water outlet temperatures of No. 1–6 U-shaped buried pipe energy pile are 32.733 °C, 34.940 °C, 33.142 °C, 34.621 °C, 33.656 °C, and 32.817 °C, respectively.
As can be seen from Figure 8b, the outlet water temperature of pile No. 9 is the lowest and the heat transfer value is the largest at every moment, about 1126.10 W, followed by pile No. 7 and No. 12, and the difference in heat transfer between the two is very small, about 948.54 W and 928.66 W, respectively. It is about 738.43 W and 502.67 W, respectively, and the heat transfer of No. 8 pile is about 305.29 W. The outlet temperatures of No. 7–12 spiral-type buried pipe energy pile are 32.662 °C, 34.925 °C, 32.114 °C, 34.233 °C, 33.414 °C, and 32.733 °C, respectively. The following conclusions are drawn:
  • The heat transfer efficiency of solid piles is better than that of piles filled with ordinary thermal physical materials;
  • For energy pipe piles with U-shaped buried pipes, the materials filled inside have a great influence on the heat transfer efficiency of the piles. The heat transfer efficiency is water, urease mineralized carbon fiber soil, and undisturbed soil from high to low;
  • When the soil around the energy pile is mineralized soil, the heat transfer performance is better than that of the undisturbed soil;
  • When the pipe pile is filled with liquid material, the convection of liquid gives full play to the advantages of large heat exchange area of spiral buried pipe and improves the heat exchange efficiency of energy pile.

3.2.3. Study of the Temperature Distribution in the Longitudinal Section of an Energy Pile under Different Conditions

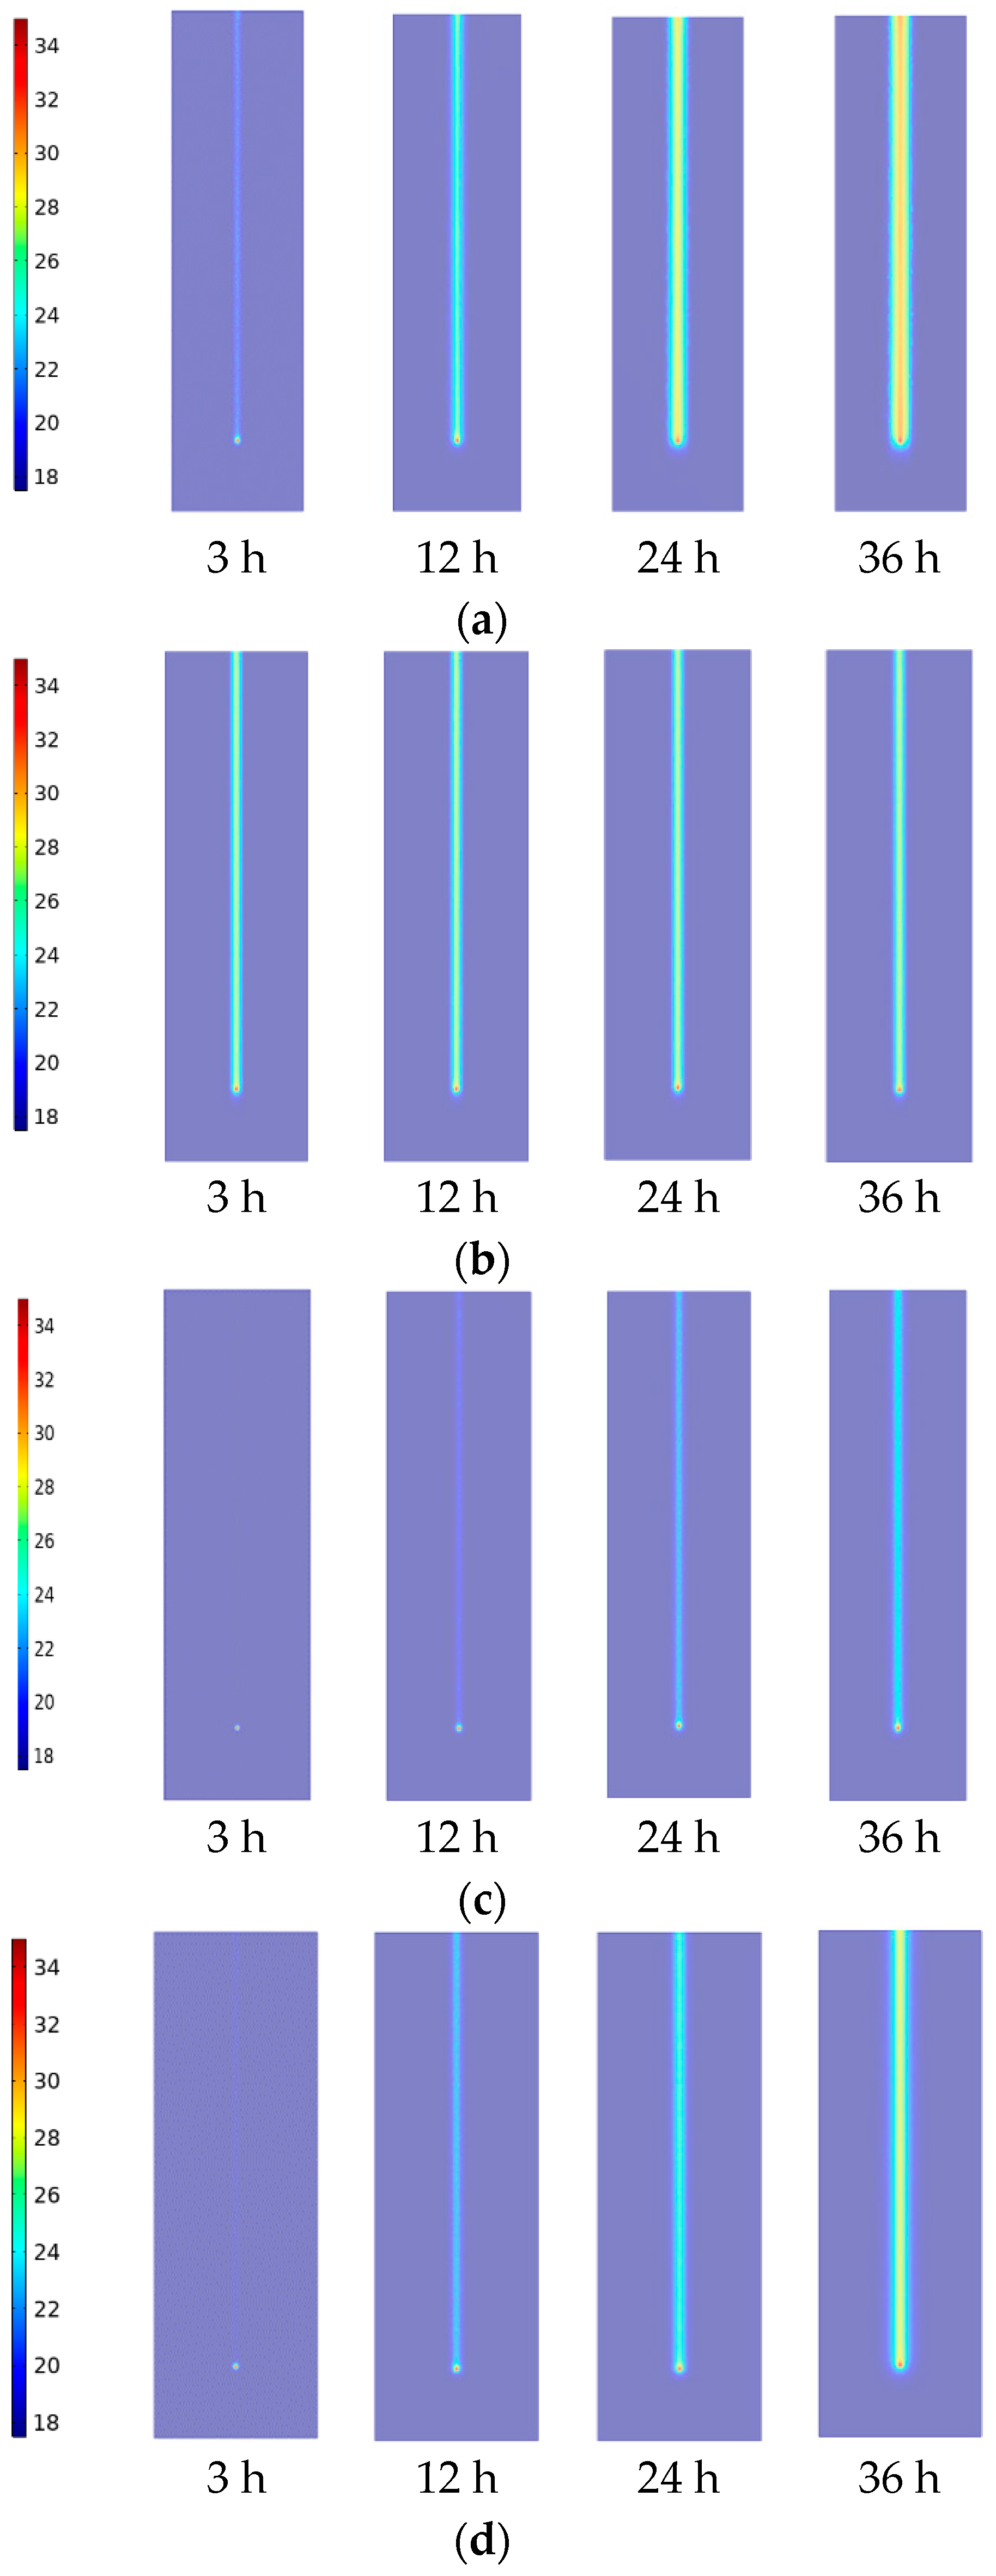
Figure 9 shows the temperature diagram of the longitudinal section of different types of energy piles with buried U-pipes after 3, 12, 24, and 36 h of operation in the summer condition, respectively. Temperature fluctuations of different types of energy piles with buried U-pipes in summer are as follows: For energy piles or solid piles with filling material in the pipe, the temperature changed little after 3 h of operation. After 12 h of operation, the temperature increased significantly, and the heat was transferred to the soil around the piles. After 24 h of operation, the temperature rose sharply, and the impact on the soil around the piles increased. After 36 h of operation, the temperature was still increasing, but after 24 h, there was little difference. It shows that the rate of thermal diffusion was slower in 24–36 h than in 12–24 h. For hollow energy pipe piles, the temperature changed little at 3, 12, 24, and 36 h. It indicated a stable state had been reached after 3 h of operation. The temperature was concentrated in the pipe pile, and the temperature of the soil outside the piles hardly increased. It shows that the heat conduction process of the energy pile was hindered.
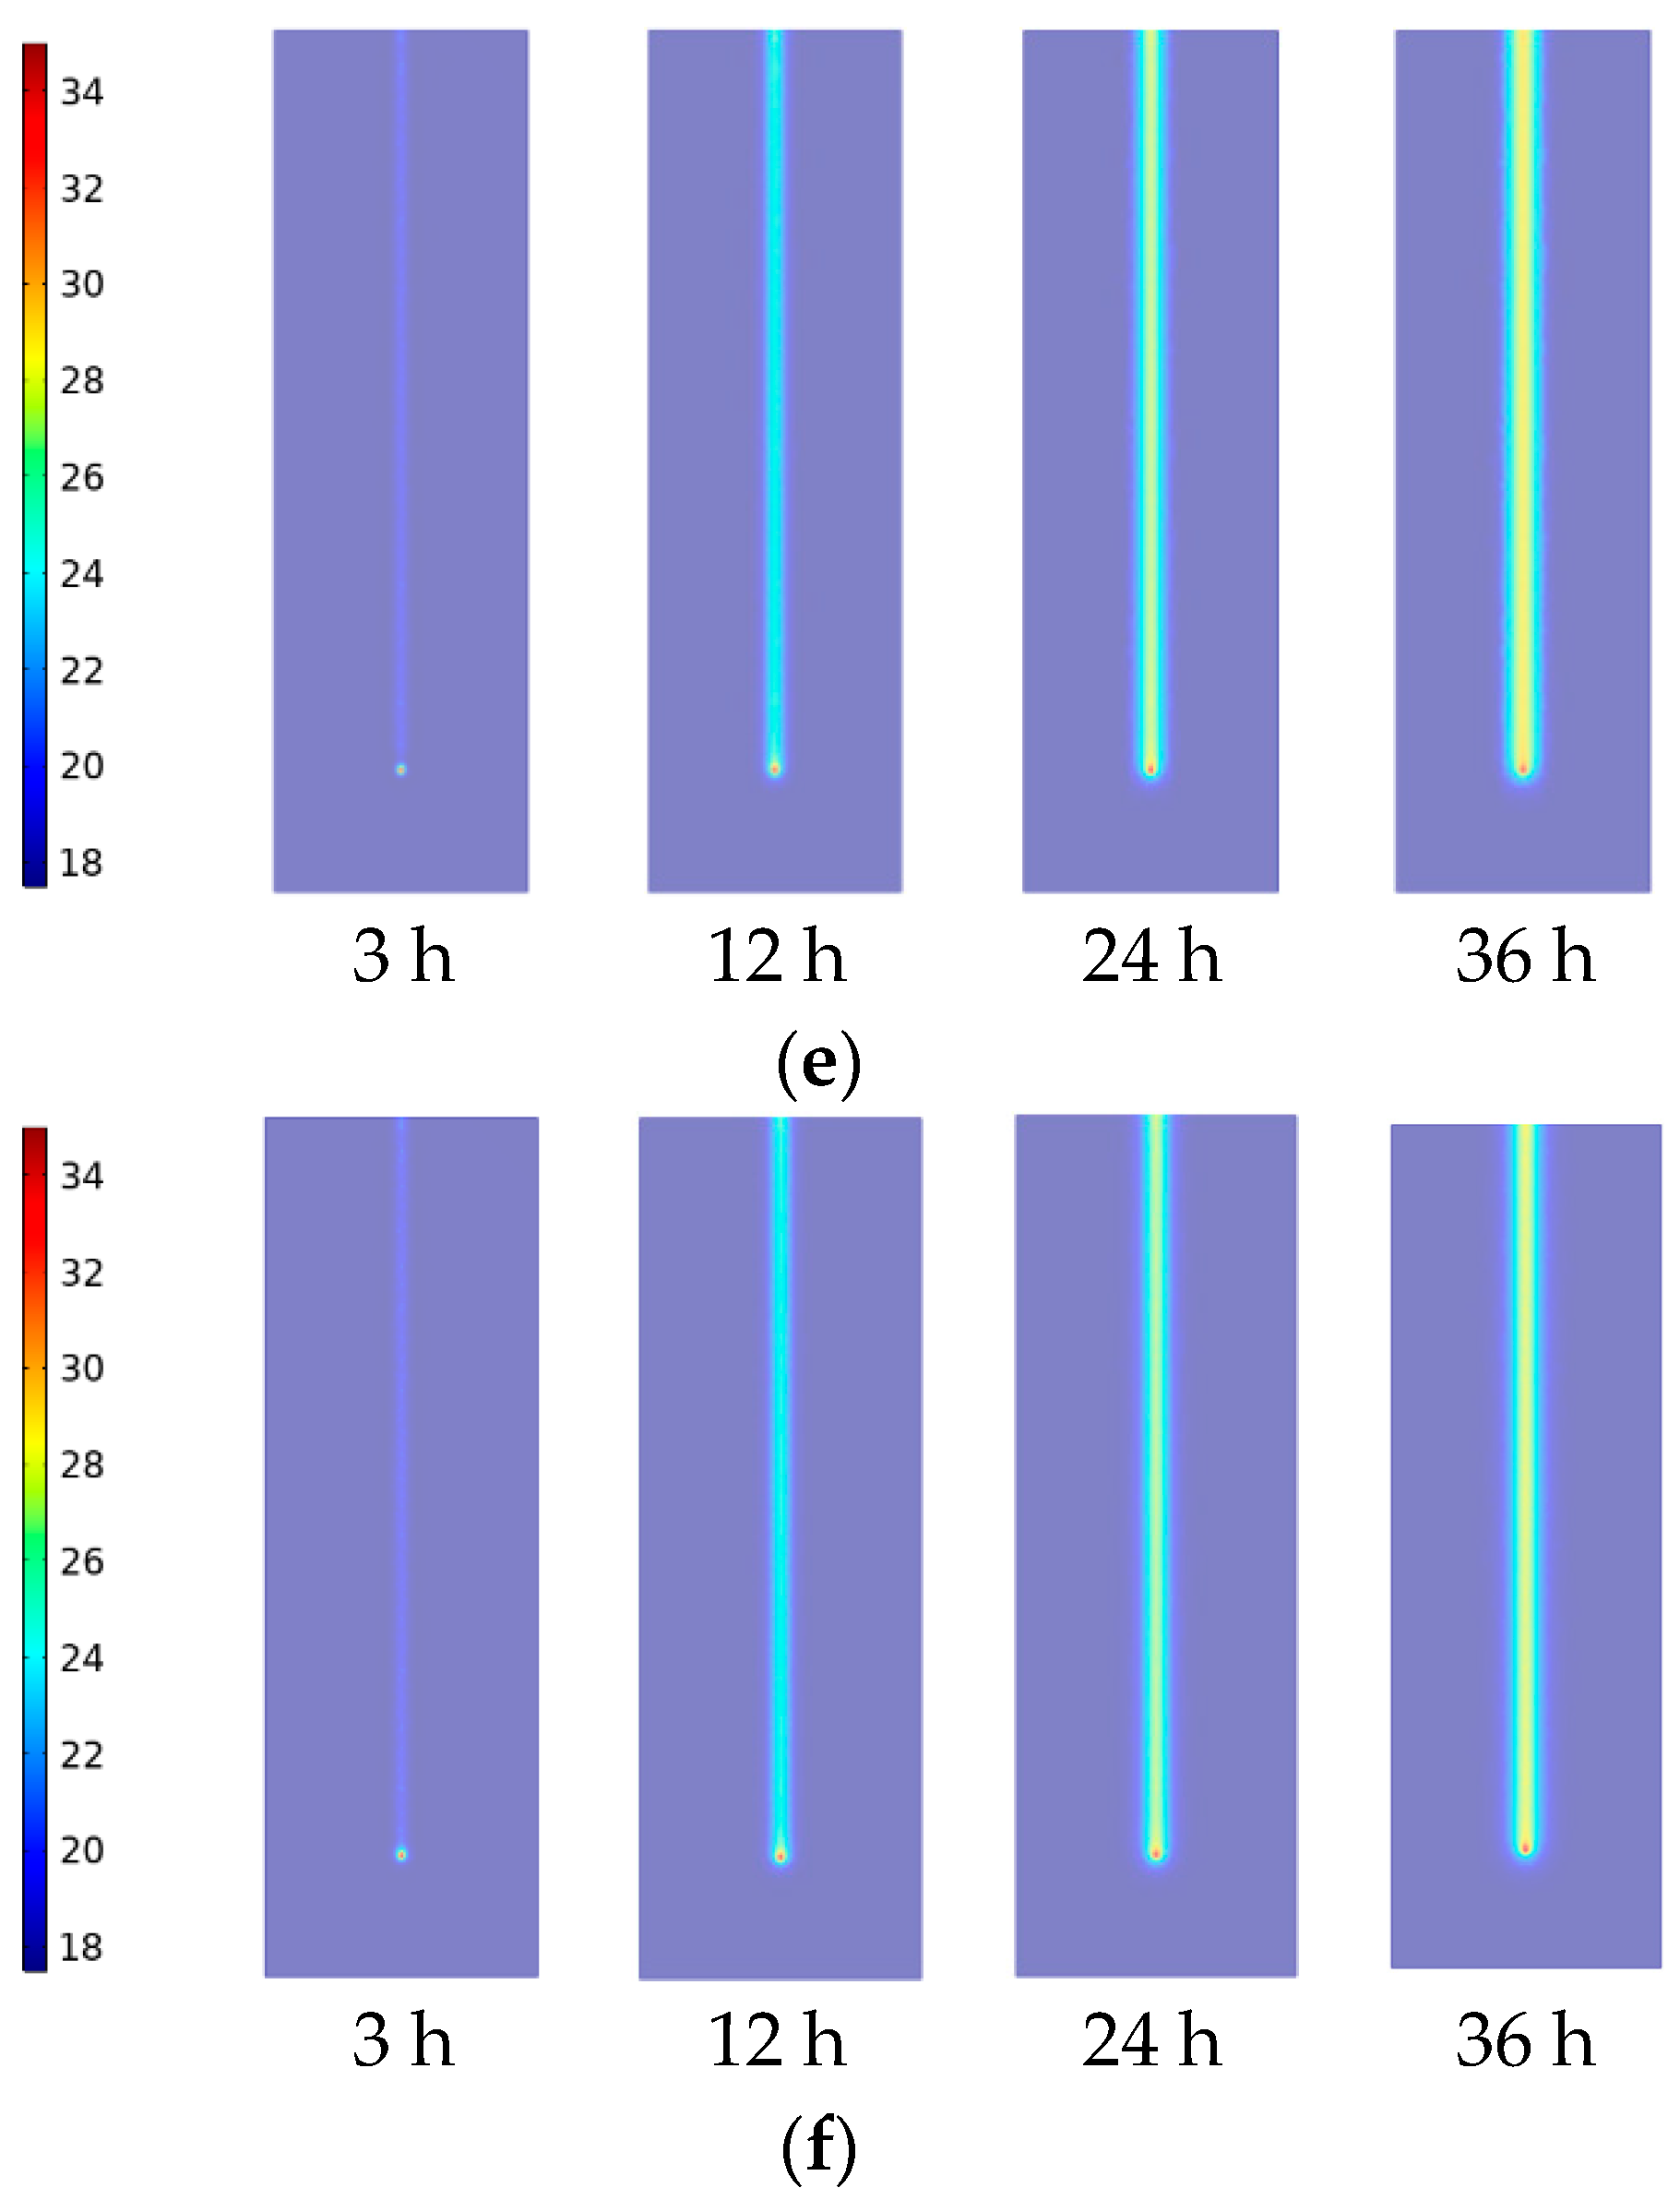
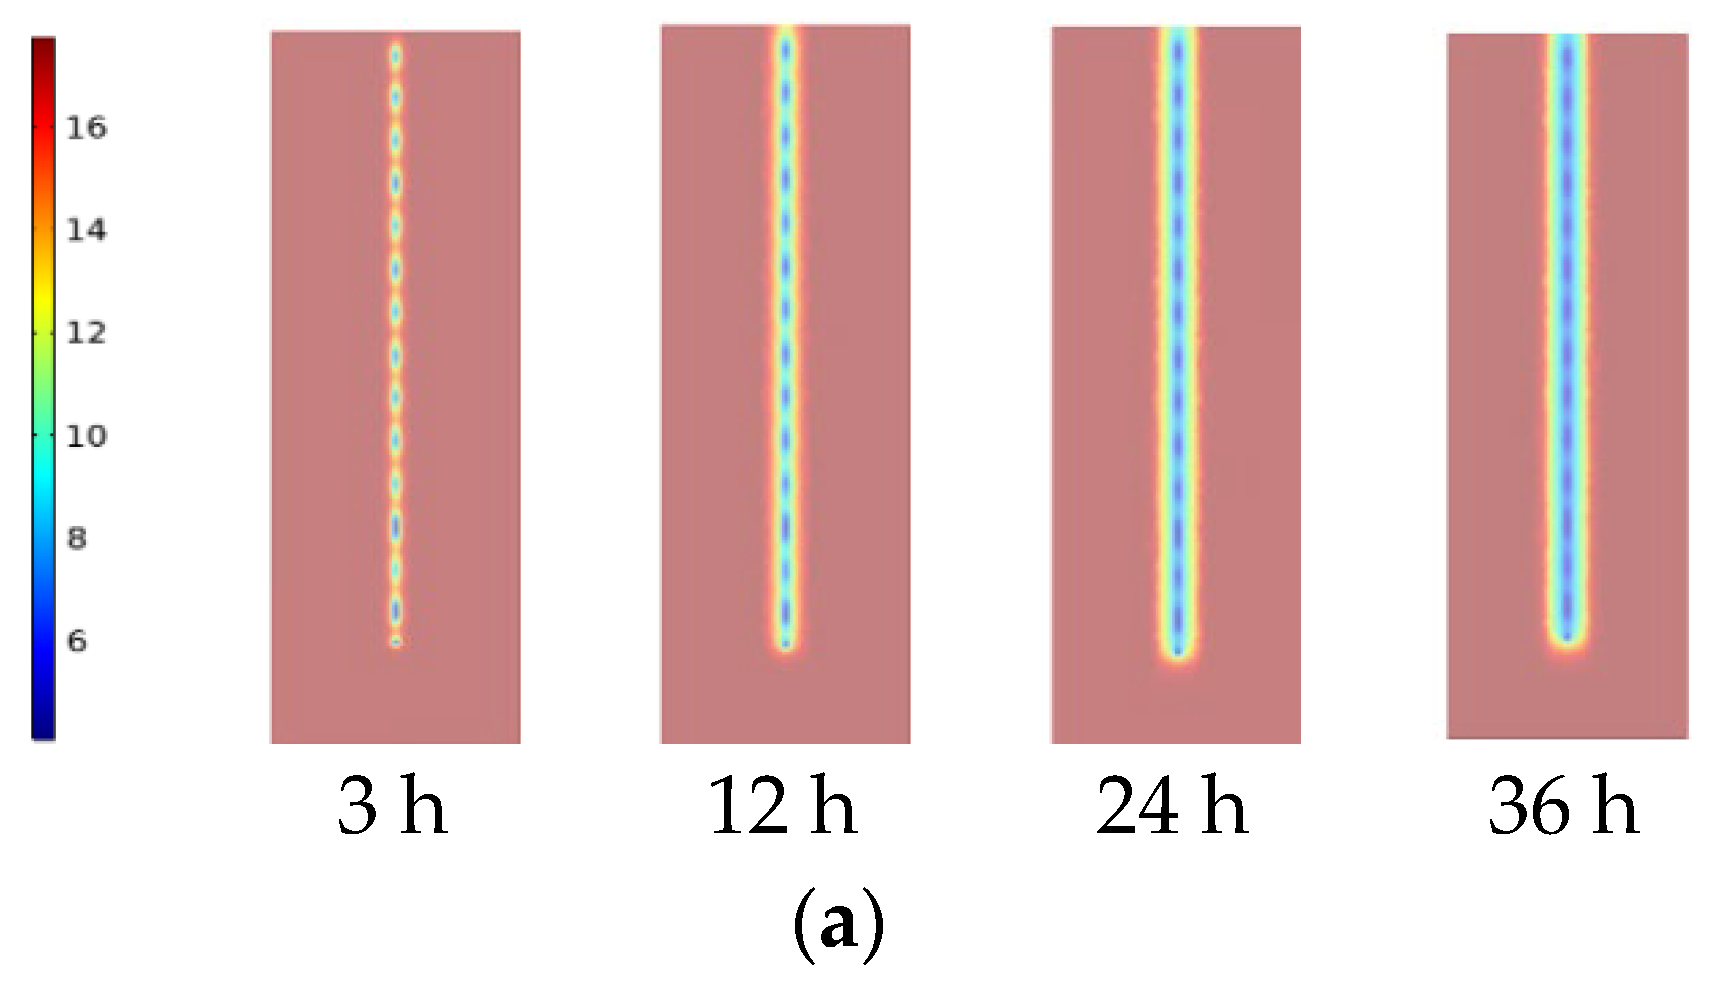
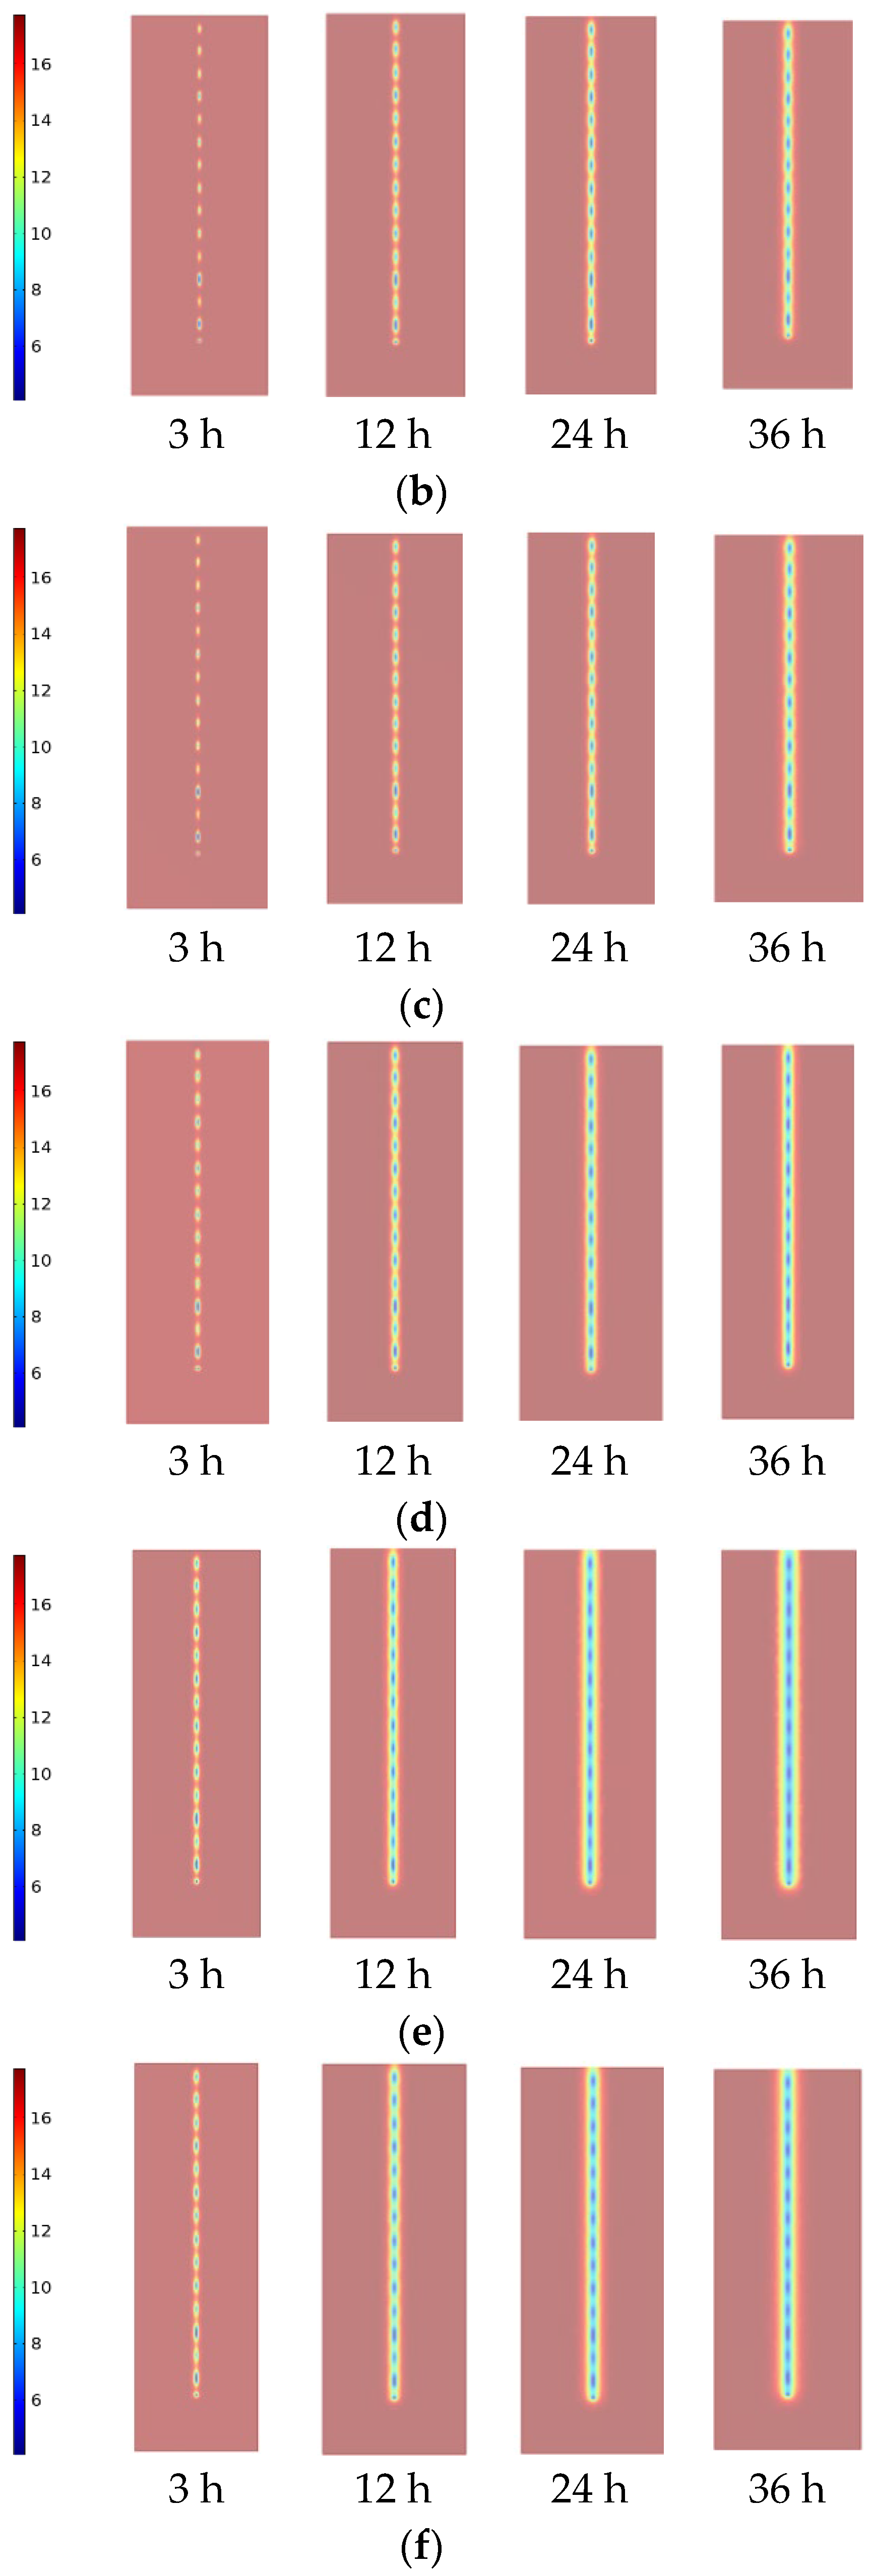
Figure 10 shows the temperature diagram of the longitudinal section of different types of energy piles with buried spiral pipes after 3, 12, 24, and 36 h of operation in the winter condition, respectively. Temperature fluctuations of different types of energy piles with buried spiral pipes in winter are as follows: For energy piles with filling material in the pipes, the temperature near the buried pipes was greatly reduced after 3 h, the heat around the buried pipes was gradually dissipated through the heat-carrying fluid at 12 h, and a large area contributed heat to the heat-carrying fluid at 36 h. For reinforced concrete hollow energy pipe piles, due to the lack of a “thermal bridge” between buried pipes and pipe piles, the heat from energy piles and the soil around the piles could not be transferred to the heat-carrying fluid, and therefore the efficiency of heat exchange was poor.
According to the analysis of experimental data, energy piles with buried water-filled spiral pipes for TES have better temperature adaptability, and the treated soil can improve the heat exchange performance of the energy pile. In the same homogeneous object, heat transfer occurs through diffusion conduction. The temperature difference between neighboring particles is smaller. The contact diffusion heat transfer between different substances is more resistant, and the temperature difference between neighboring particles is larger.

3.2.4. Study of Temperature Distribution in the Energy Pile Body under Different Conditions

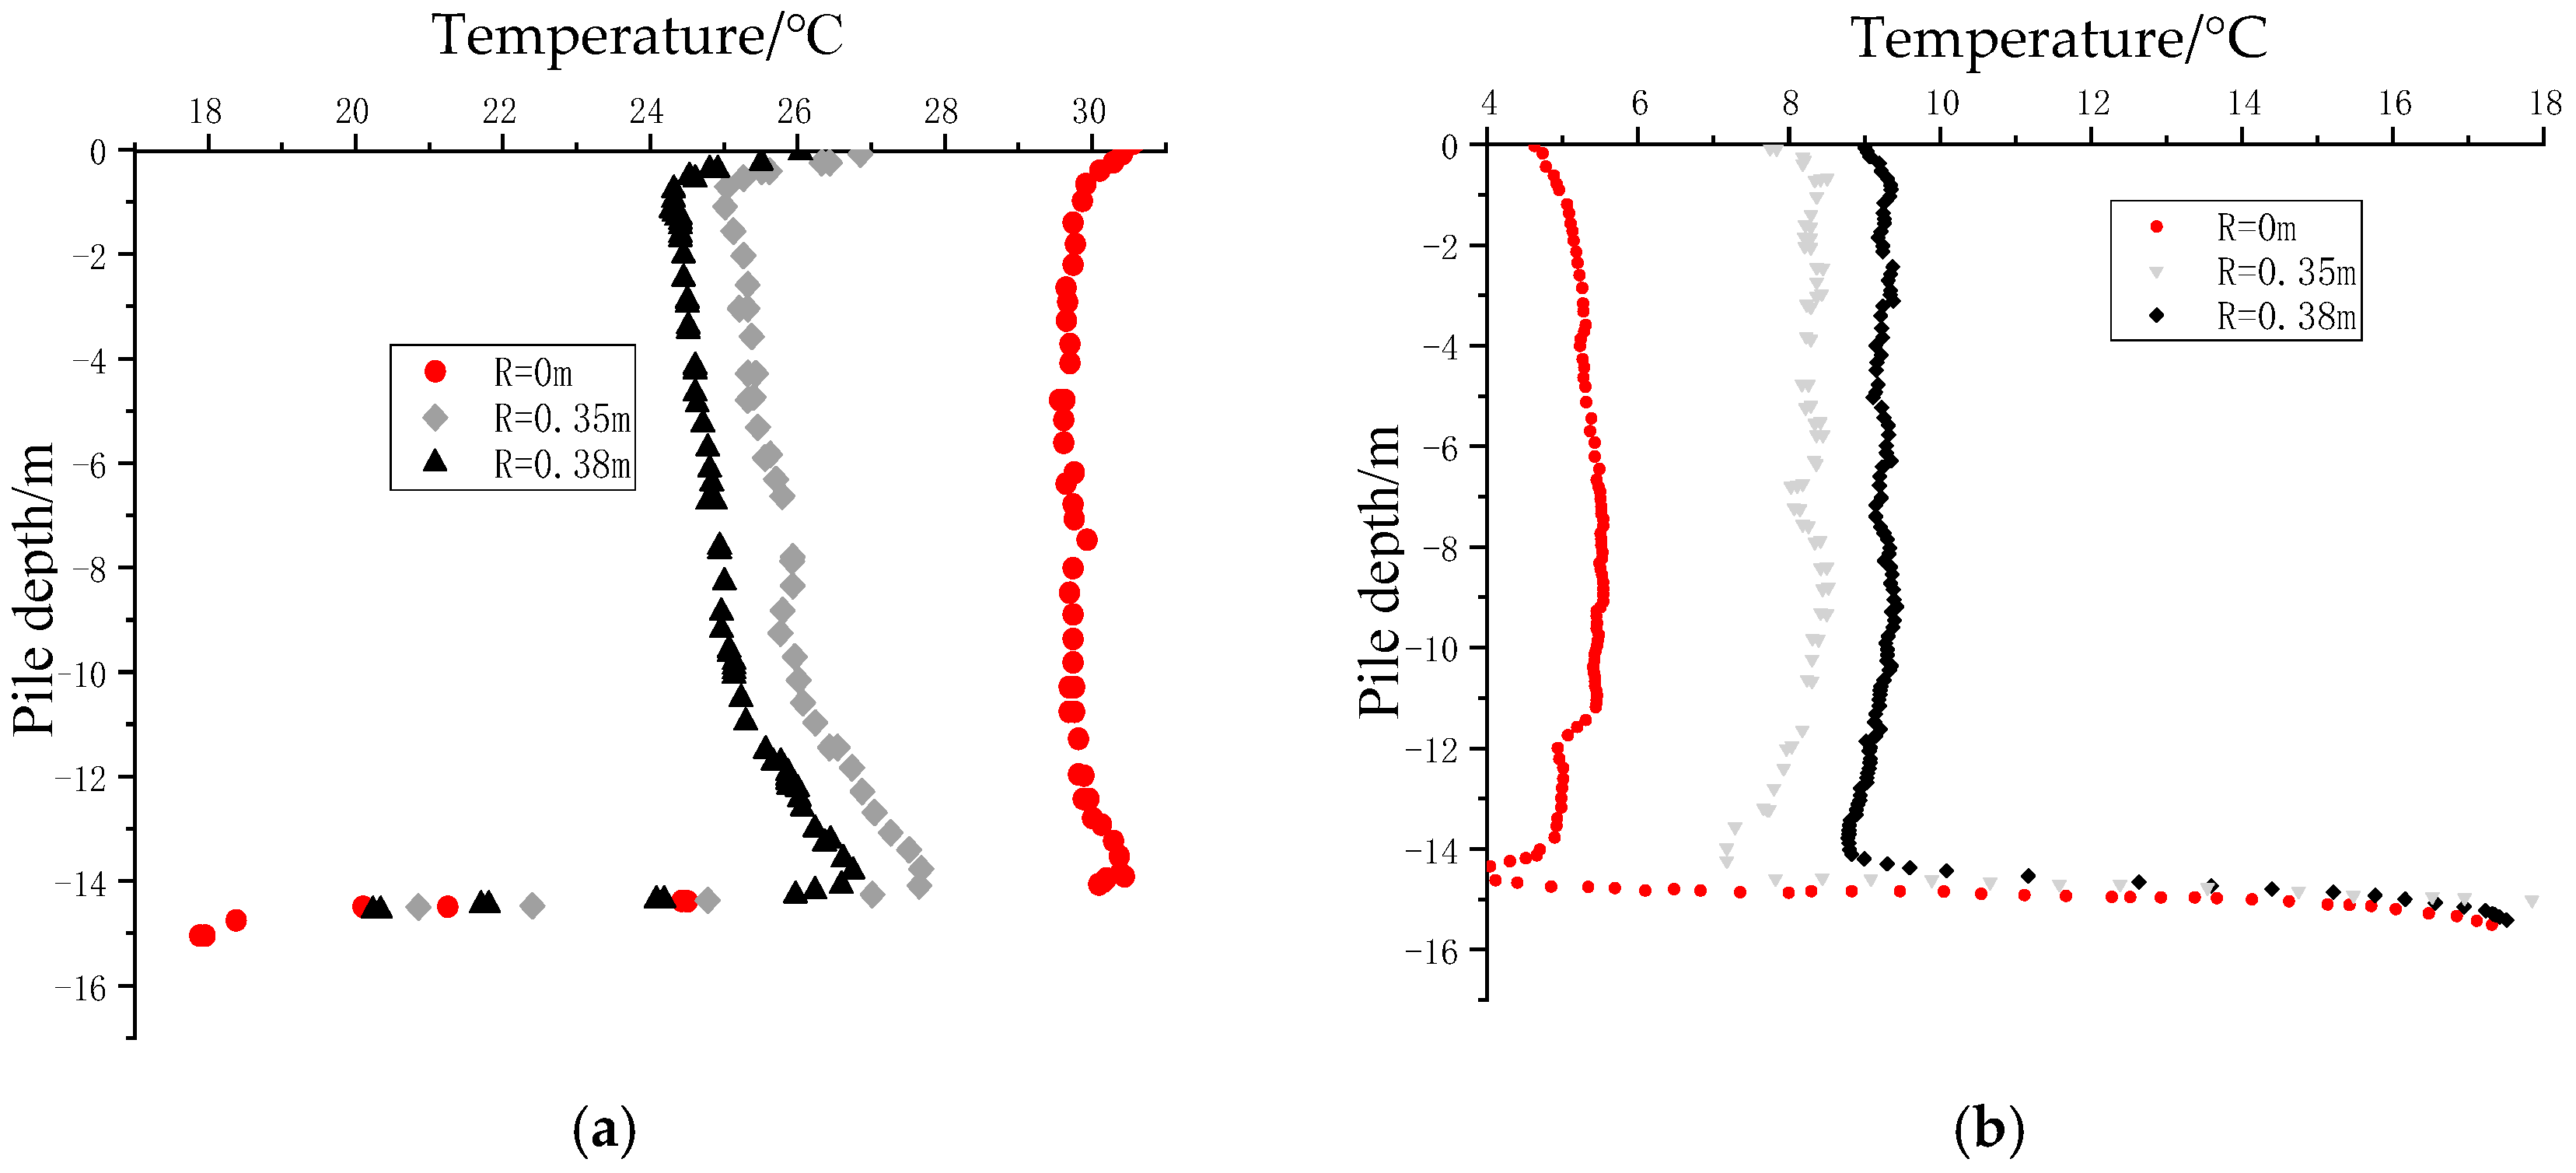
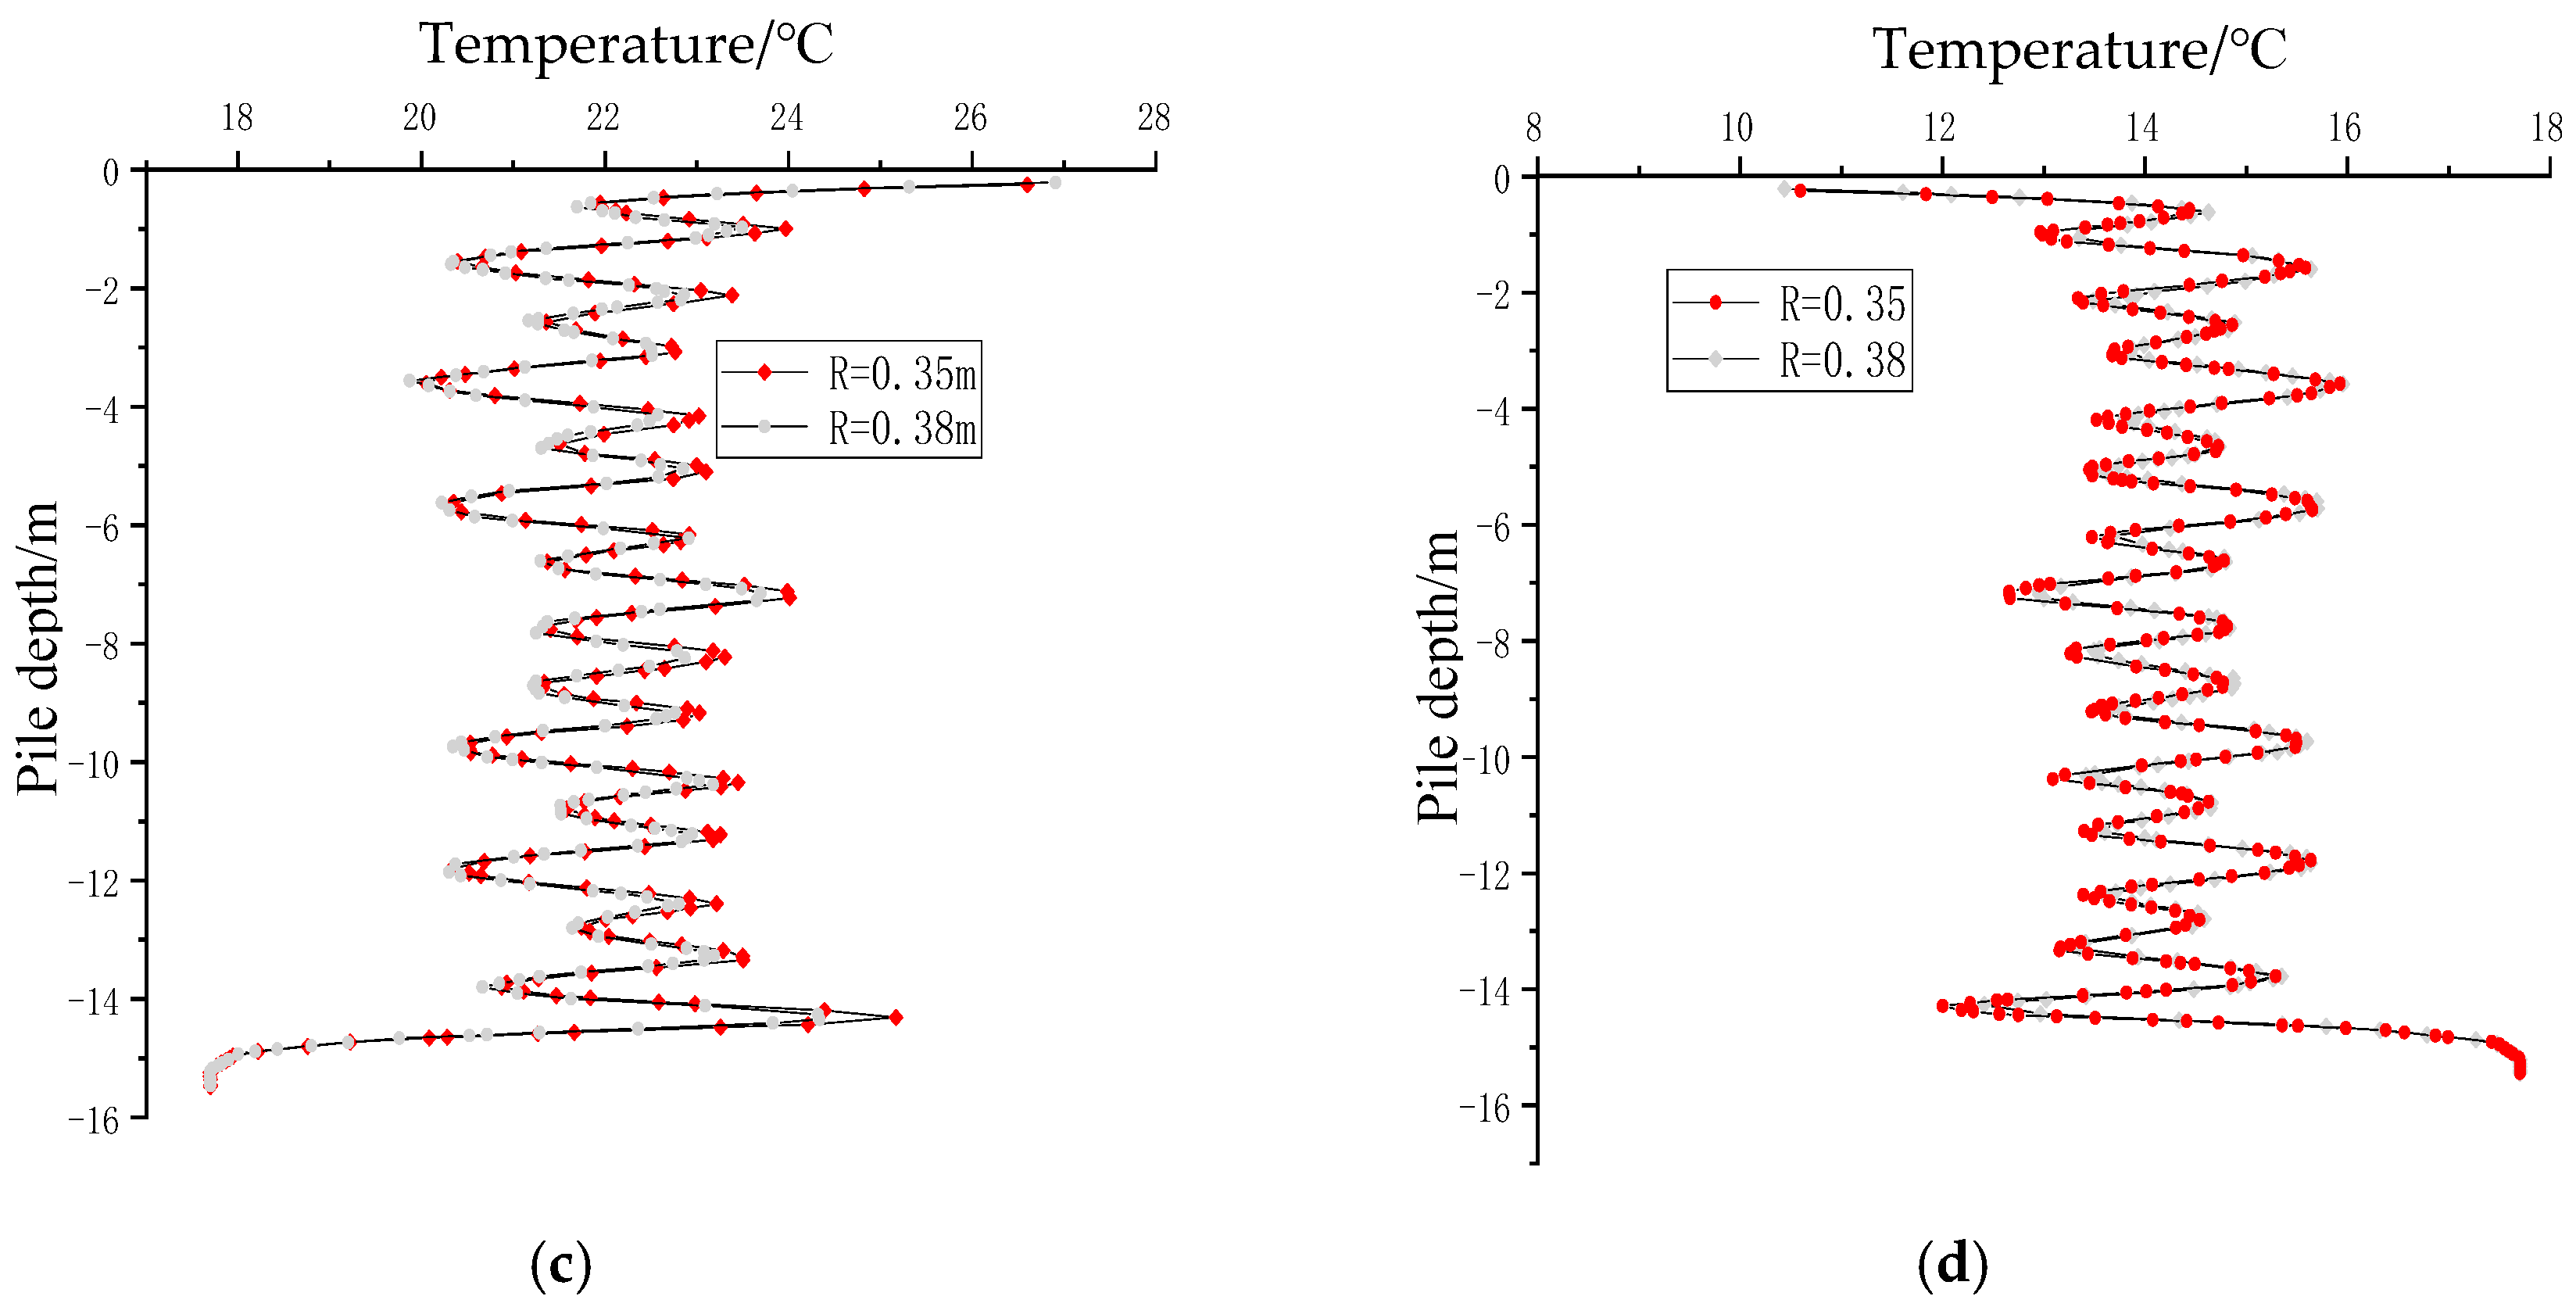
According to Figure 11a,b, the temperature difference between the axis and the outer edge of a solid energy pile in summer and winter is about 4.9 °C and 4.6 °C, respectively. In each vertical section, the temperature from the end face of the pile to a depth of about 0.4 m and the return point of the buried pipe is higher than the center of the pile in summer and lower than that of the center of the pile in winter. The reason is that the pile end is the inlet of the heat-carrying fluid, and the initial temperature difference is the largest. The liquid flow path at the return flow of the buried pipe changes greatly, and the heat of the buried pipe is concentrated, resulting in a higher temperature of the buried pipe, faster heat conduction to the pile, and an abnormally elevated pile temperature.
According to Figure 11c,d, the temperature of the pile body fluctuates back and forth with increasing depth because the distance between the buried spiral pipe and the vertical section changes periodically. Based on the comparison of (a) and (c), (b), and (d), respectively, and the combination with Formula ε T   free = α Δ T , the additional displacement of temperature at the axis can be avoided by using the pipe pile shape. The pile body temperature of the buried water-filled spiral pipe for TES is lower than that of the solid energy pile with the same operating time and is more beneficial to the structural stability. R in Figure 11 represents the distance between the pipe pile core and the outer surface of the pile.

3.2.5. Study on Heat Transfer Performance of Energy Piles with Different Types of Buried Pipes

Figure 12 is a comparison of the change in water outlet temperature over time in the summer for energy piles with different types of buried pipes under the same pile foundation type. As can be seen from the six comparison figures, the outlet temperature of spiral buried pipe is lower than that of U-type when the soil around the pile and the heat storage material inside the pipe core are the same, and the difference is different under different conditions of soil around the pile and the heat storage material inside the pipe pile: Under (a) condition, the outlet temperature of spiral buried pipe is about 0.11 °C lower than that of U-type, and the heat transfer is about 28.40 W higher; (b) Under this condition, there is almost no difference in outlet temperature between U-type and spiral type buried pipe, and the outlet temperature no longer changes after operation for about 1 h; (c) Under this condition, the outlet temperature of spiral buried pipe is about 1.03 °C lower than that of U-type pipe, and the heat exchange is about 292.51 W higher; (d) Under this condition, the outlet temperature of spiral buried pipe is about 0.39 °C lower than that of U-type pipe, and the heat exchange is about 110.75 W higher; Under (e) condition and (f) condition, the effluent temperature of spiral buried pipe energy pile is about 0.24 °C and 0.10 °C lower than that of U-buried pipe, respectively. Under the same conditions, energy piles with spiral-type buried pipe have better heat transfer and temperature control ability, but under the influence of different conditions of energy piles, the degree of advantages of spiral-type buried pipe is different. Under the condition of energy pipe piles with undisturbed sand around the pile and water in the inner core, the advantages of spiral-type buried pipe are maximized.

4. Study and Analysis of the Thermomechanical Properties of Energy Piles

4.1. Study on the Law of Variation of Axial Stress under Load and Temperature

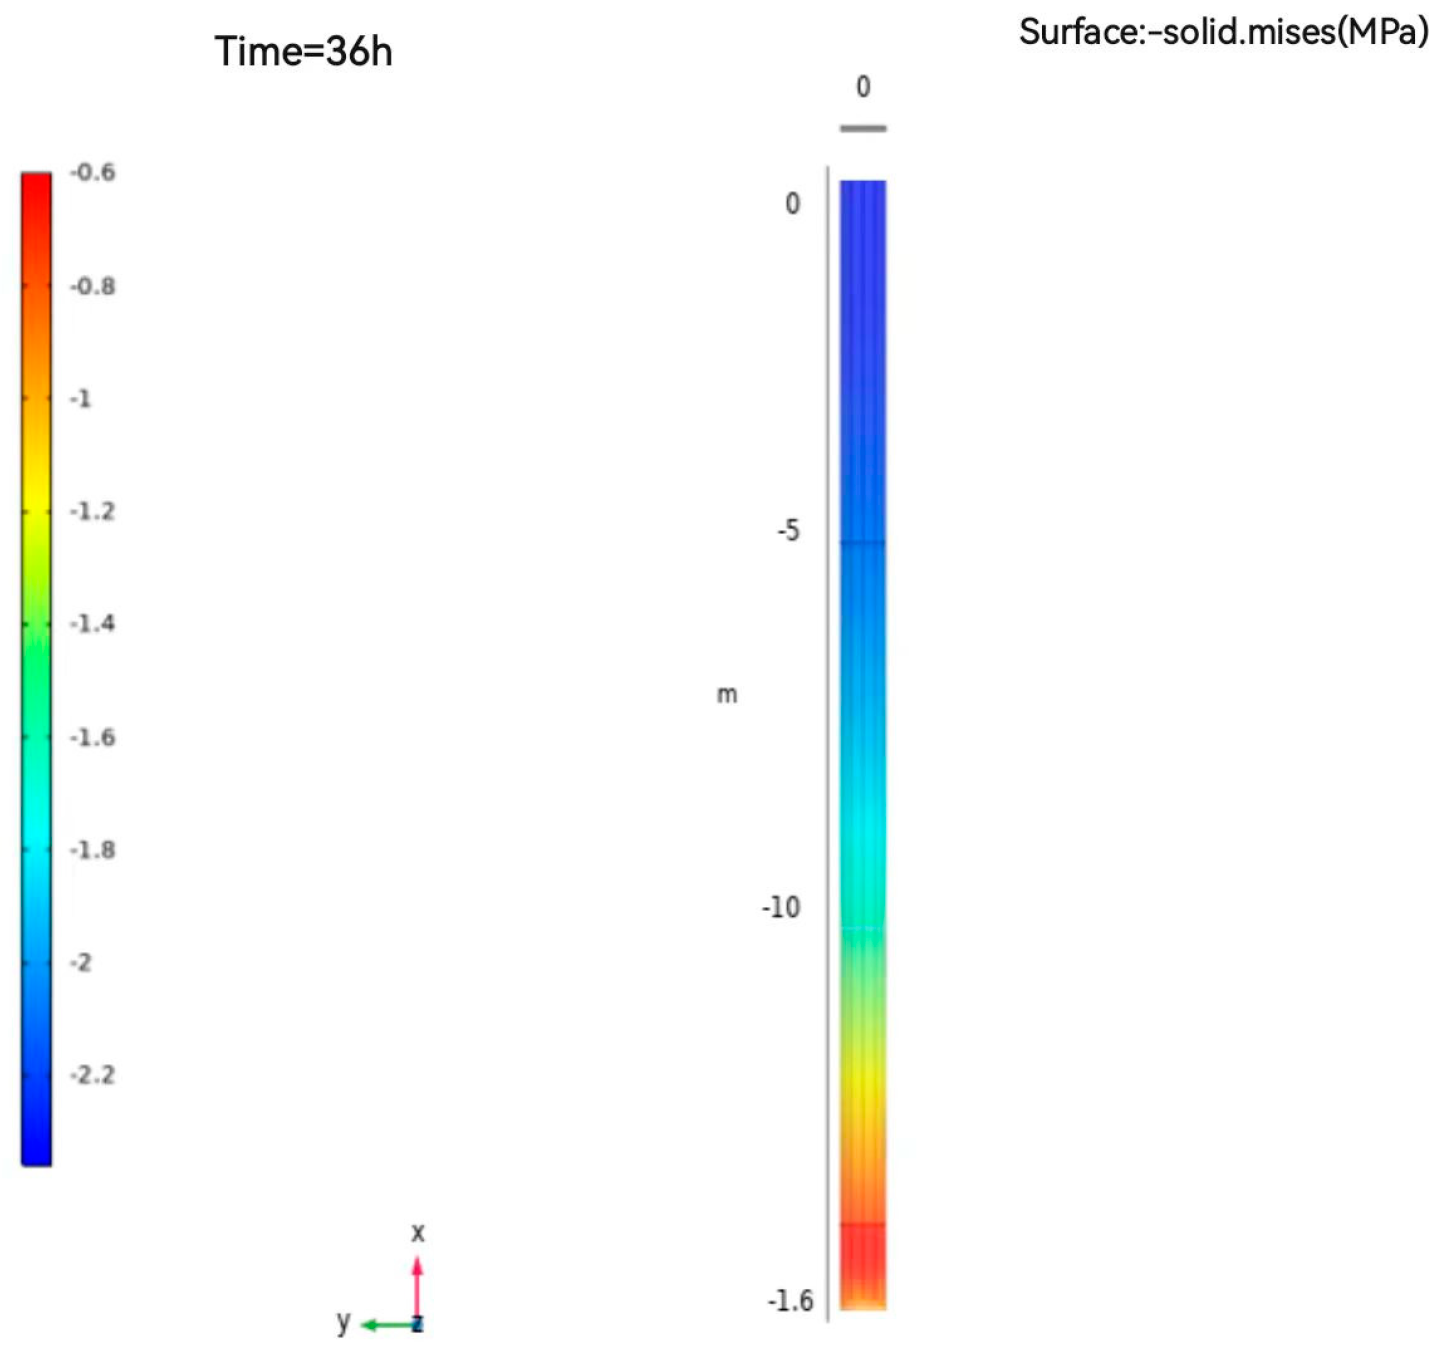
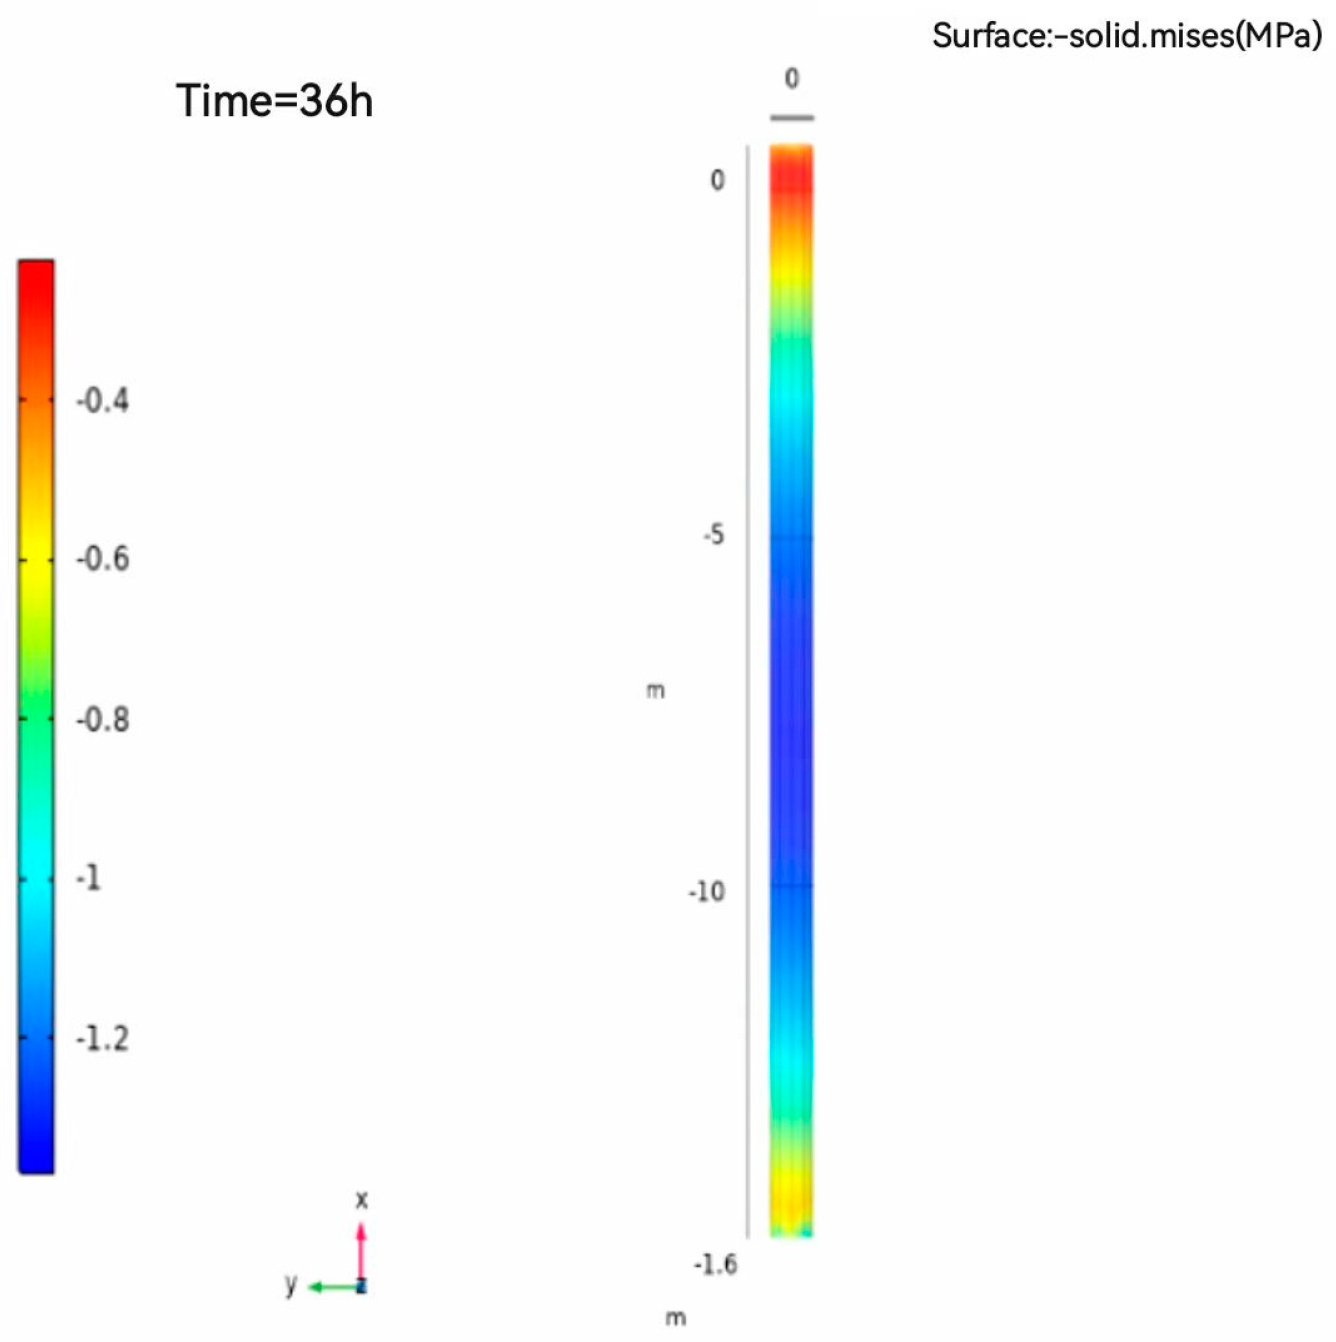
According to Hooke’s law, statically indeterminate structures experience temperature stresses when the temperature changes. The following figures show the surface tension distribution of a solid energy pile with buried spiral pipe under temperature and top load in the summer when the soil around the pile is undisturbed sandy soil.
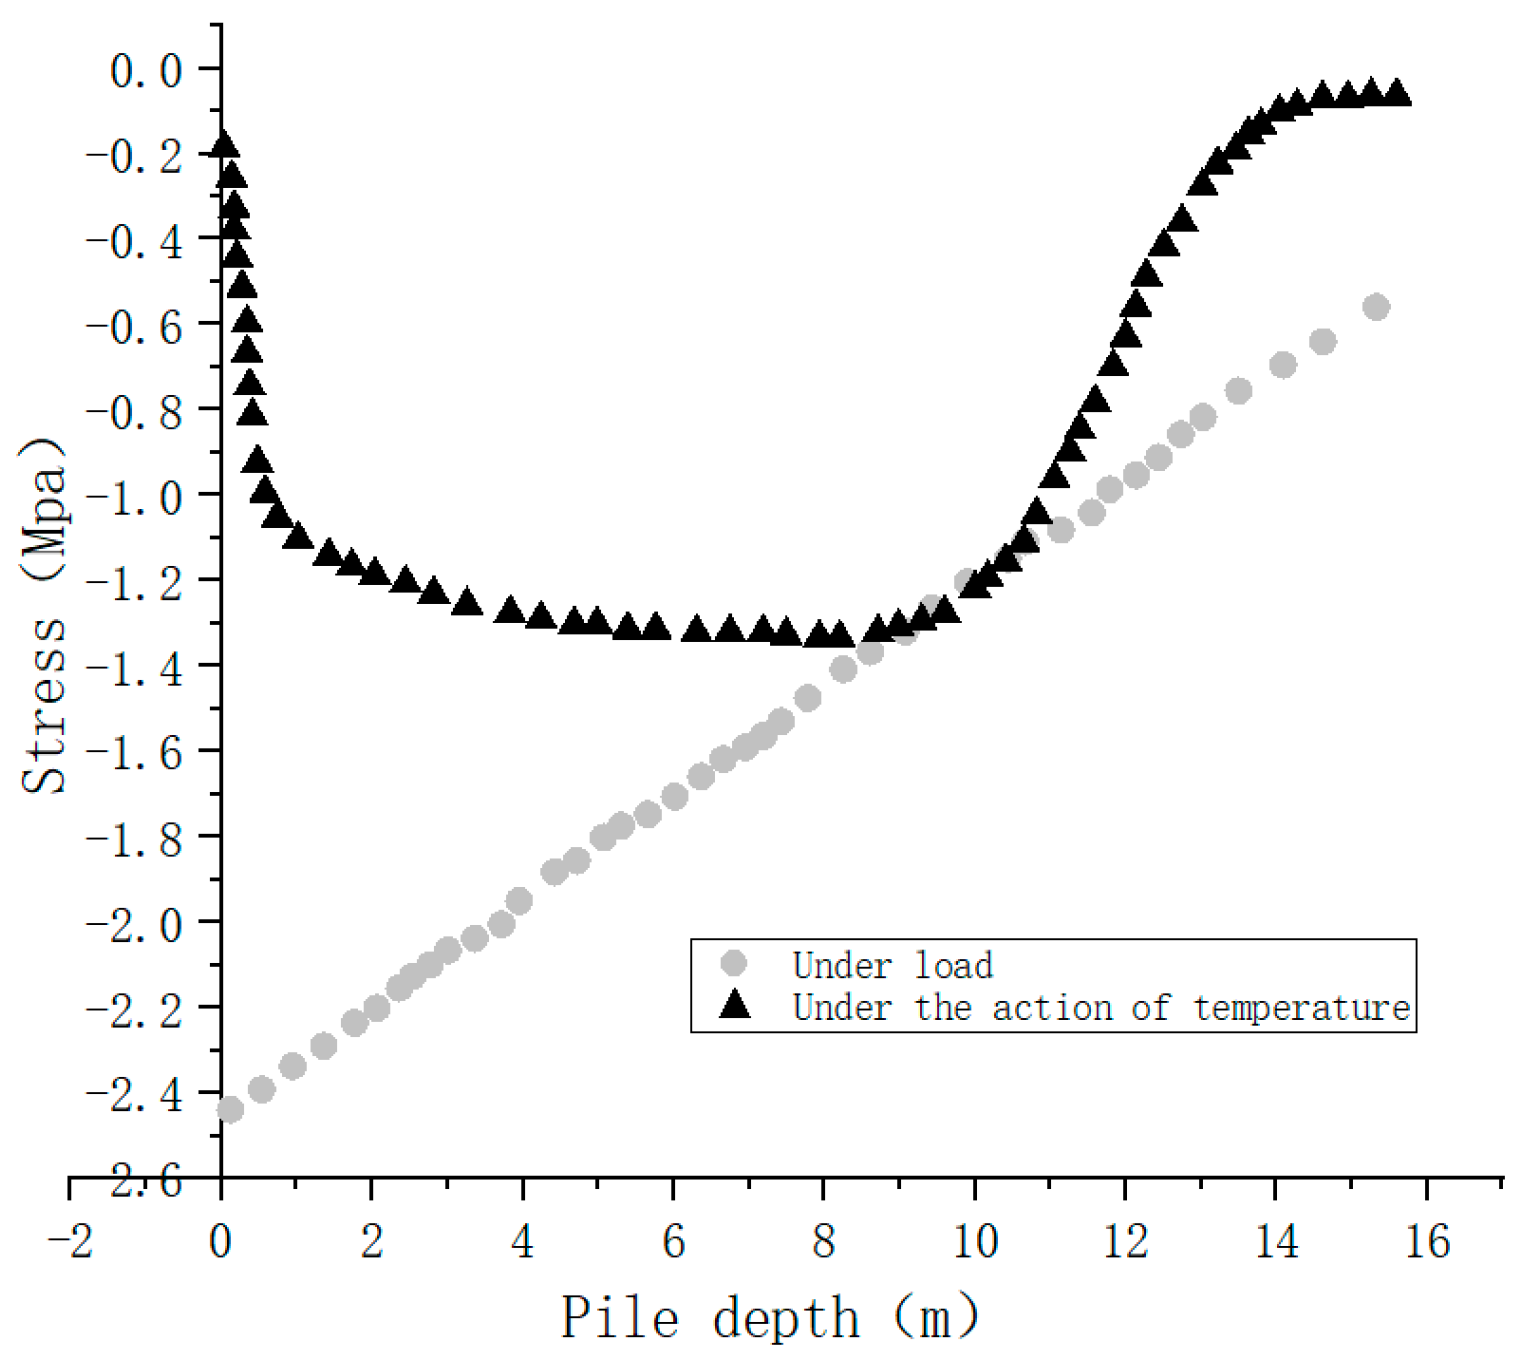
According to Figure 13 and Figure 14, in the summer condition, the maximum temperature load of the pile under temperature is about 1.31 Mpa, and the minimum is about 0.1 Mpa. The maximum compressive stress of the pile under load is about 2.3 Mpa, and the minimum is about 0.6 Mpa. The pile stress under top load and temperature is combined with the pile depth to represent the pile stress line diagram, as shown in Figure 15.
According to Figure 15, the stress under the top load is greatest at the top of the pile and gradually decreases with increasing buried depth. Under temperature, the middle of the pile is a stress equilibrium section, and the two ends of the pile are high stress fluctuation sections, and the temperature stress at the bottom of the pile is less than that at the top of the pile.
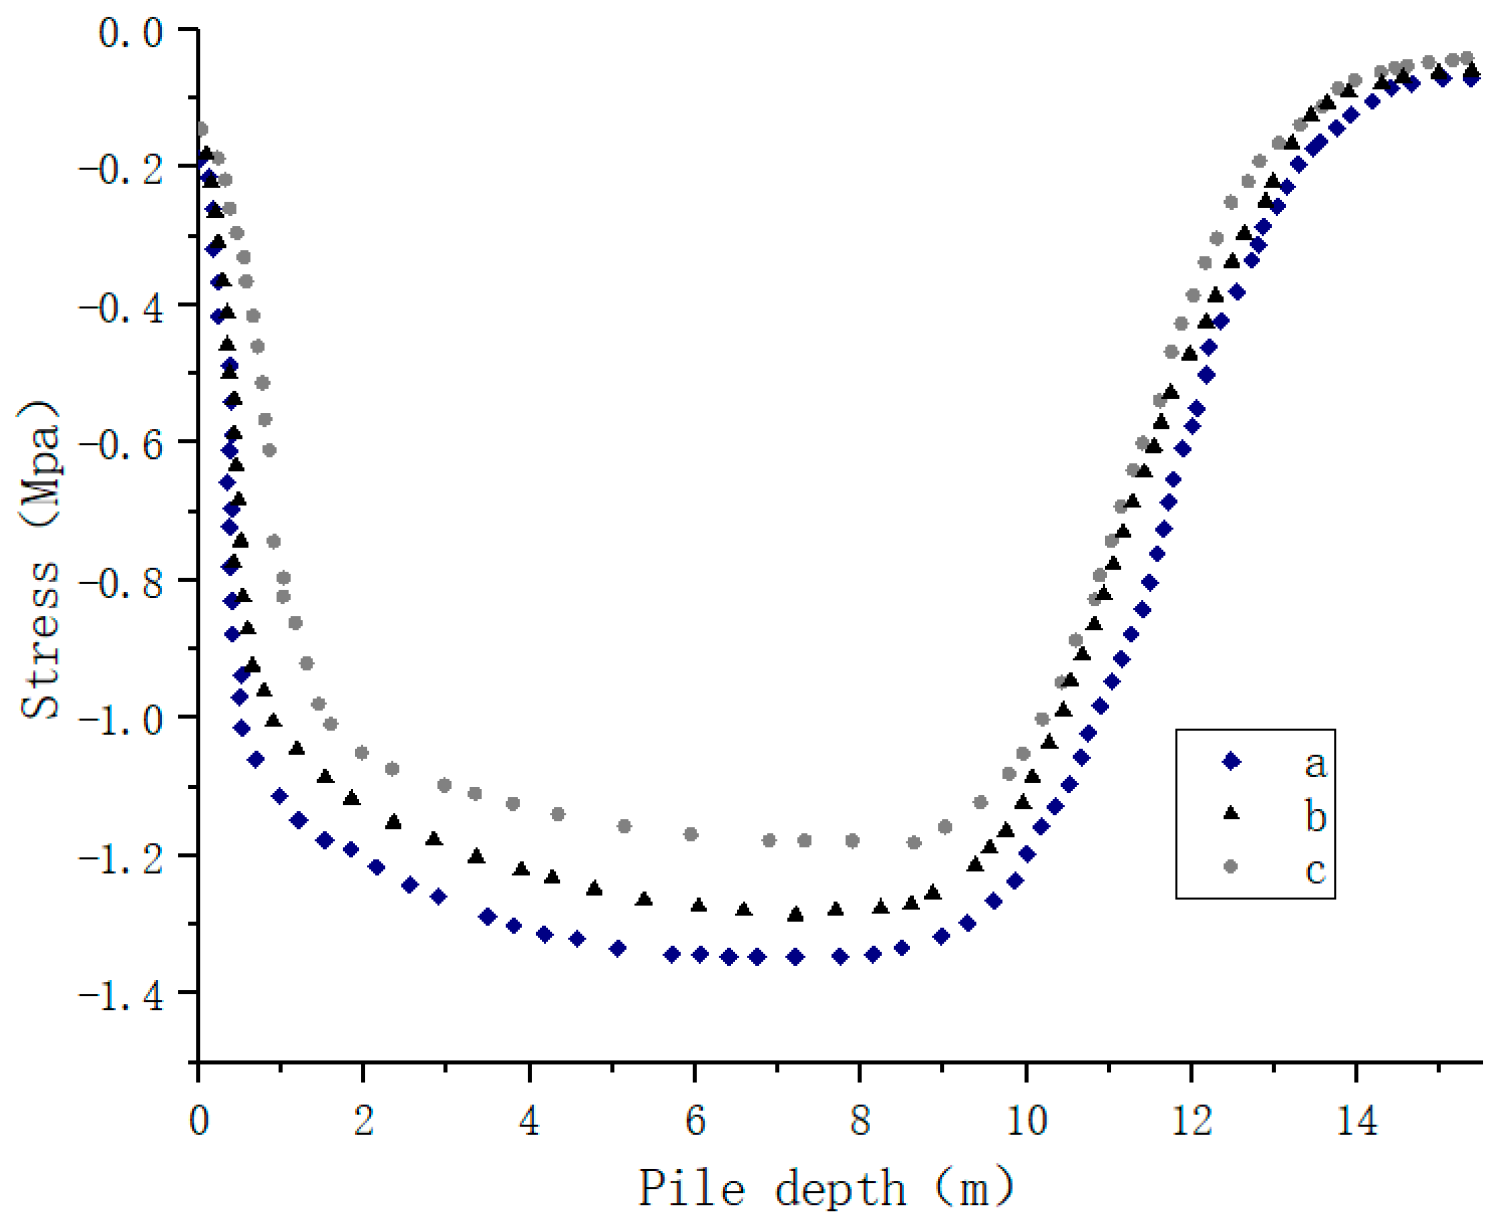
In Figure 16, (a) is a solid spiral buried pipe energy pile with undisturbed sand surrounding the pile; (b) is a spiral buried pipe energy pile with water as internal heat storage material and undisturbed sand surrounding the pile; and (c) is a spiral buried pipe energy pile with water as internal heat storage material and mineralized soil surrounding the pile. As can be seen from Figure 16, temperature stress distribution rules of different types of piles are similar; the difference is that the temperature stress of different types of piles at the same buried depth is different: the overall stress of (c) is less than (b) about 0.07 MPa, and the overall stress of (b) is less than (a) about 0.05 MPa. It shows that the temperature stress of the energy pipe pile with water core is reduced by about 3.85% compared with that of solid pile. When the soil around the pile is treated by the carbon fiber based EICP mineralization soil, the stress of the pile body is reduced by about 5.6% under the action of temperature. Considering that the bearing area of the tubular energy pile is smaller than that of the solid pile, the pressure of the pile body is greater under the same upper load. Therefore, the bearing capacity of tubular pile is weaker than that of solid pile, and each has its own advantages and disadvantages.

4.2. Study on the Law of Variation of Displacement under Load and Temperature

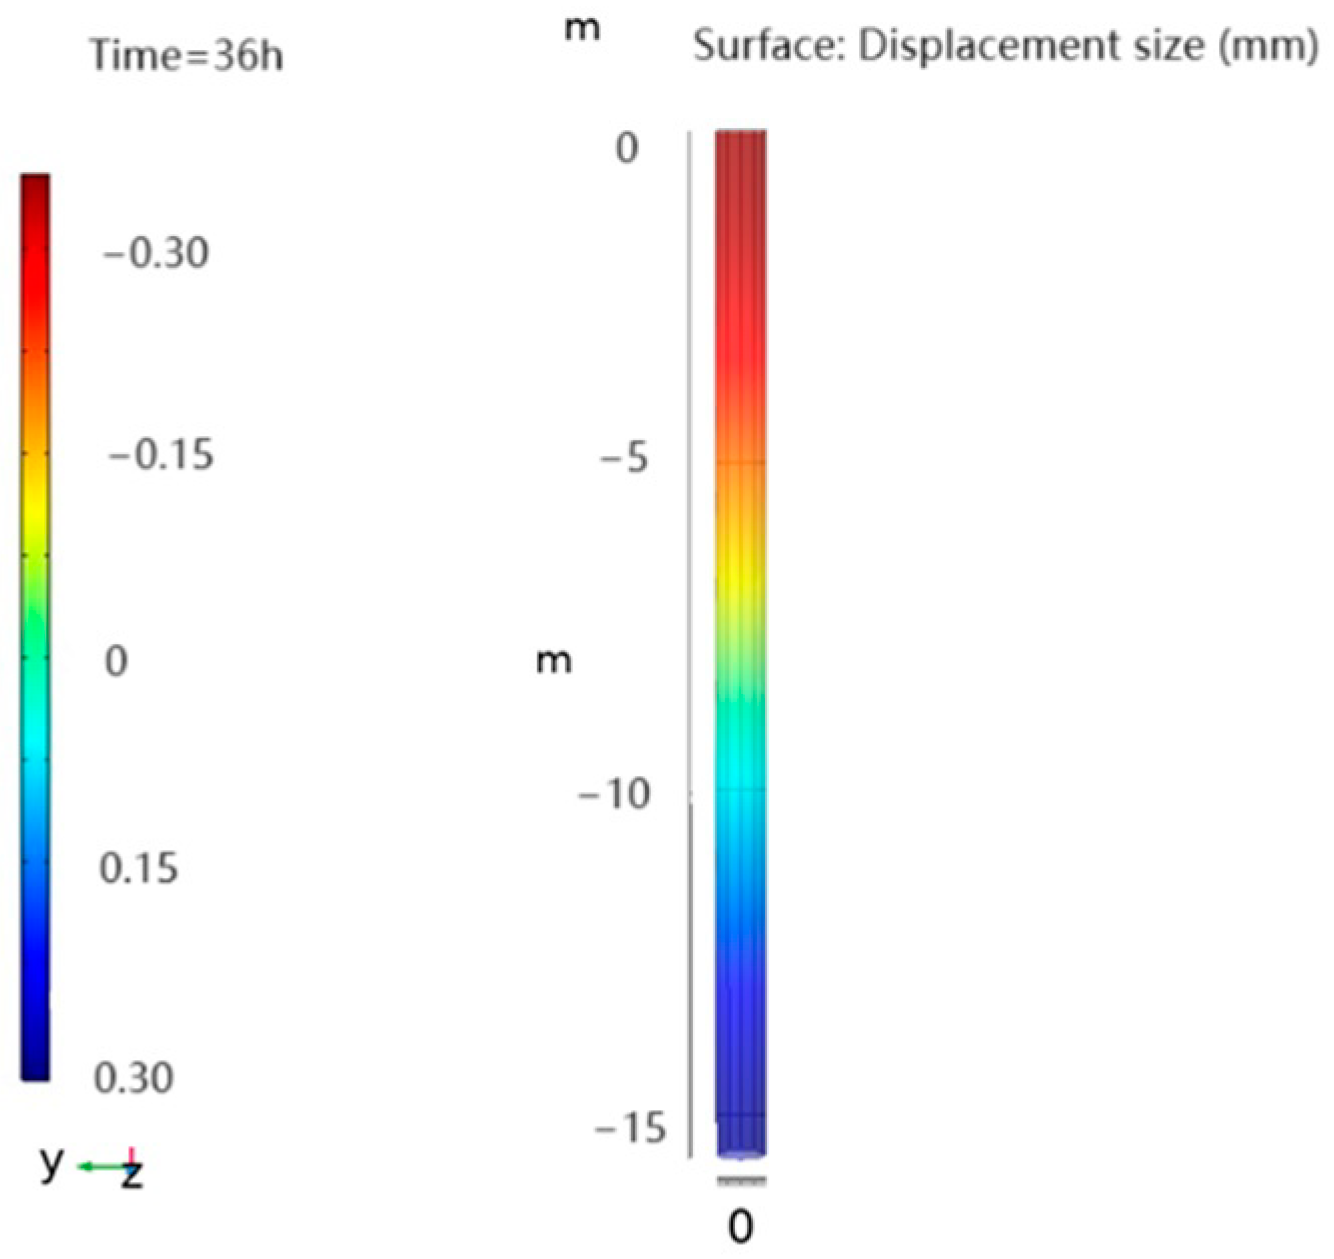
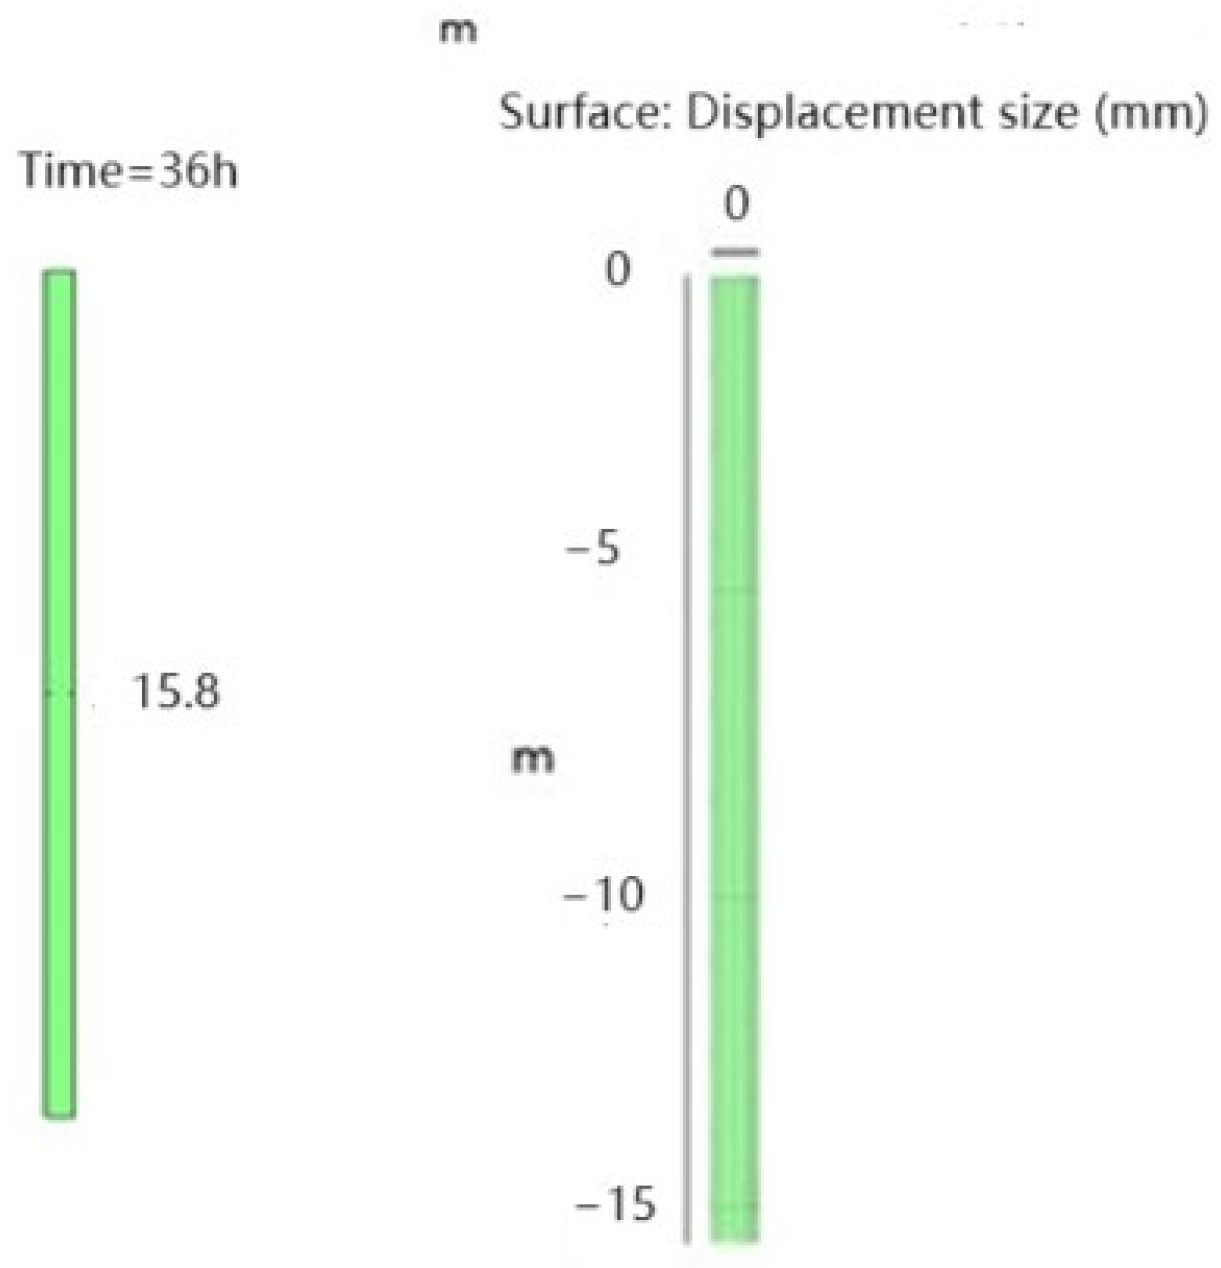
Temperature changes result in temperature stresses in a pile and displacement of the pile. Figure 17 shows the displacement of the solid energy pile made of buried spiral pipes with undisturbed sandy soil around the pile in the summer after 36 h of operation. Figure 18 shows the displacement of a solid energy pile made of buried spiral pipes with undisturbed sandy soil around the pile under a top load of P of 1500 KN after 36 h of operation.
According to Figure 17 and Figure 18, the top of the energy pile exhibits an upward displacement of about 0.31 mm under temperature; the pile base has a downward displacement of approx. 0.28 mm. The displacement of the pile body decreases from both ends towards the middle, and the critical point is the depth of about 9.3 m. Under top load, the difference in displacement between the two pile ends is very small (15.8 mm) because the stiffness of the pile body is much greater than that of the soil.
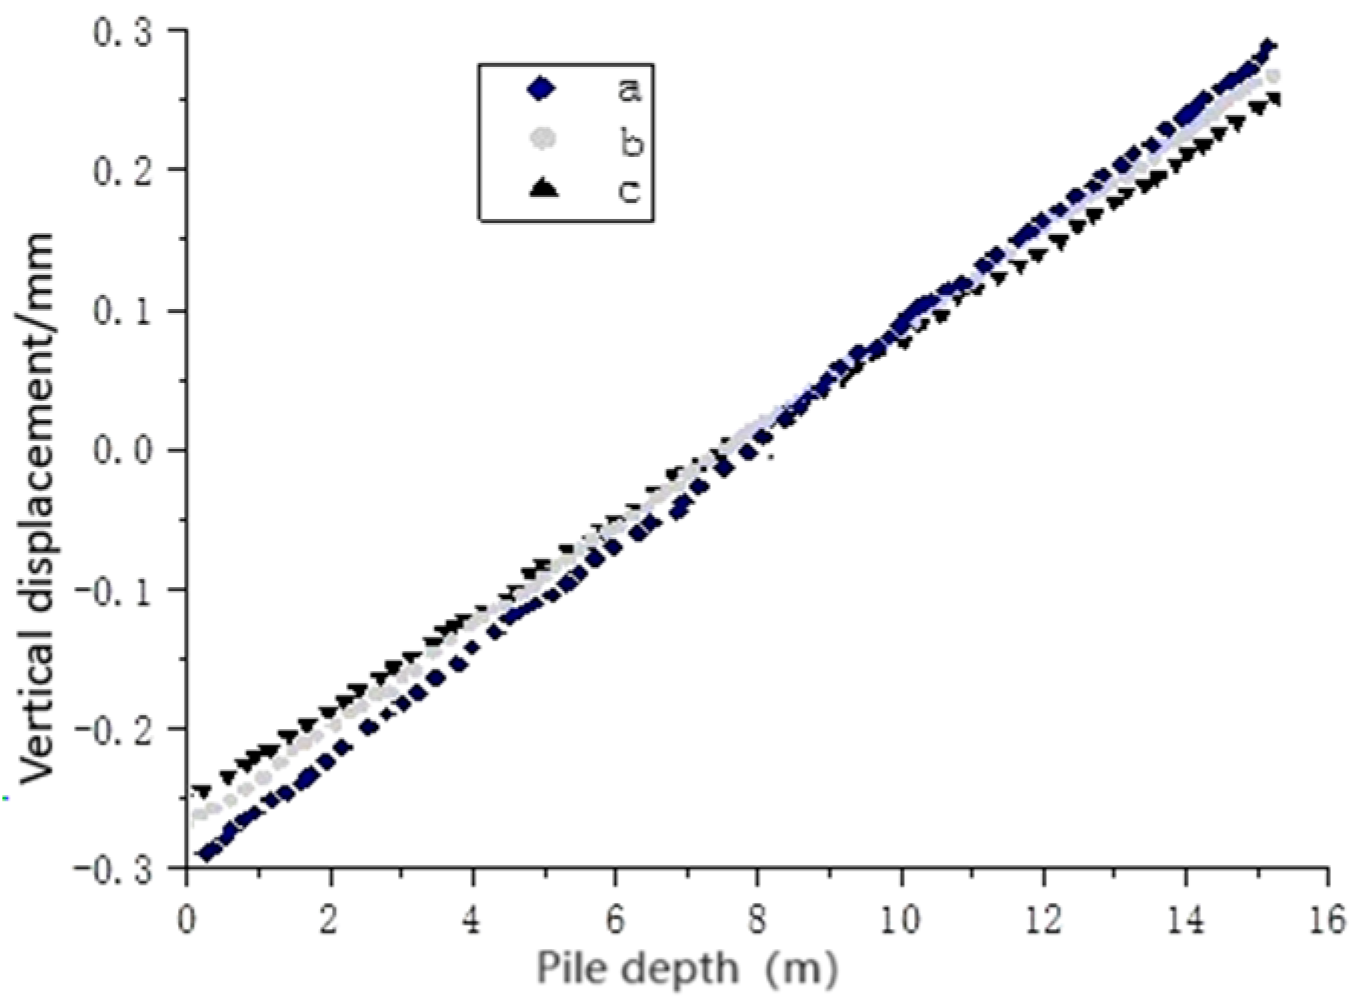
Figure 19 shows the displacement of the three pile types as shown in (a), (b), and (c) in Figure 16. According to the figure, the critical point of displacement for the three types of piles is about 9.3 m away from the top of the pile. For the same pile depth, the displacement of pile (a) is about 0.04 mm greater than that of pile (b), and that of pile (b) is about 0.03 mm greater than that of pile (c). According to the analysis, water as a heat storage medium can reduce the slope of the pile crown under the influence of temperature. After treatment with urease and carbon fiber, the porosity of the soil decreases by about 20%, resulting in increased soil stiffness and greater restriction of pile displacement. The treated soil has improved thermal conductivity and can prevent heat buildup on pile bodies.

4.3. Study of the Law of Variation of Side Friction under Load and Temperature

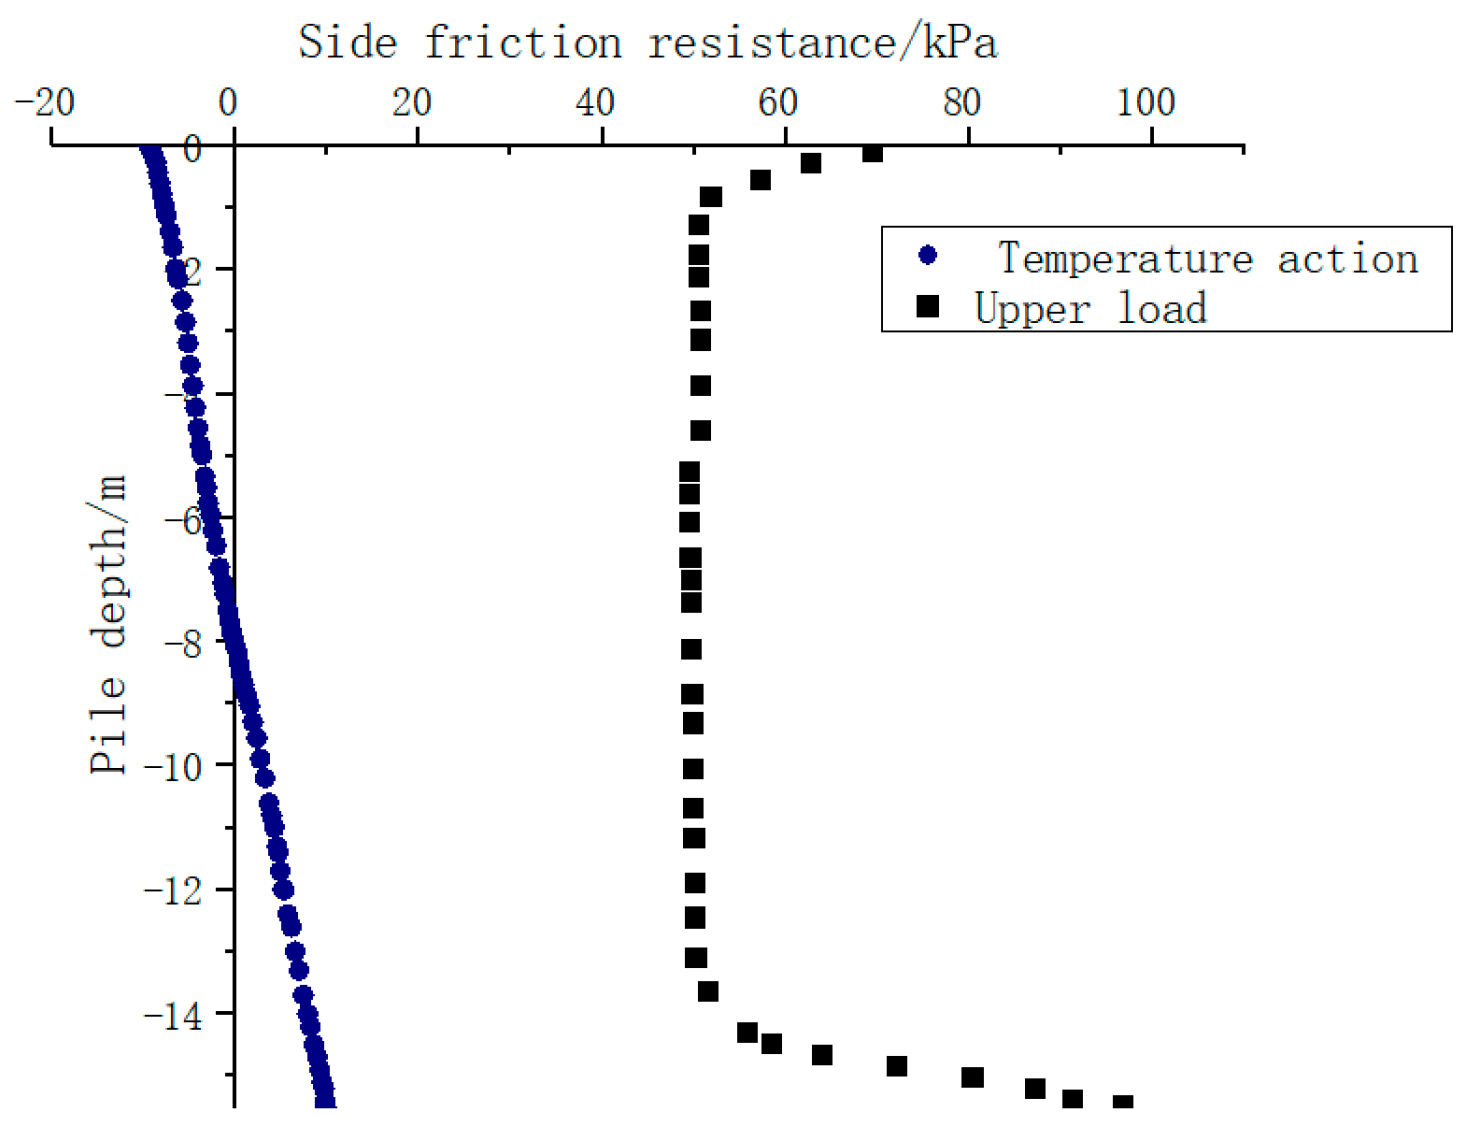
The axial load stress and the thermal stress of the pile are applied in Formulas (10) and (12) to represent the side friction of a solid energy pile with buried spiral pipe in undisturbed sandy soil under top load and summer working temperature in Figure 20.
According to Figure 20, the distribution of side friction on the pile surface under the action of the top load is relatively balanced, and the direction is upward. Under temperature, the side friction of the pile changes linearly with the pile depth and intersects the axis with a side friction of 0. The side friction in the upper part of the intersection is downward, and the side friction in the lower part of the intersection is upward. The side friction versus temperature is much lower than that versus the top load.
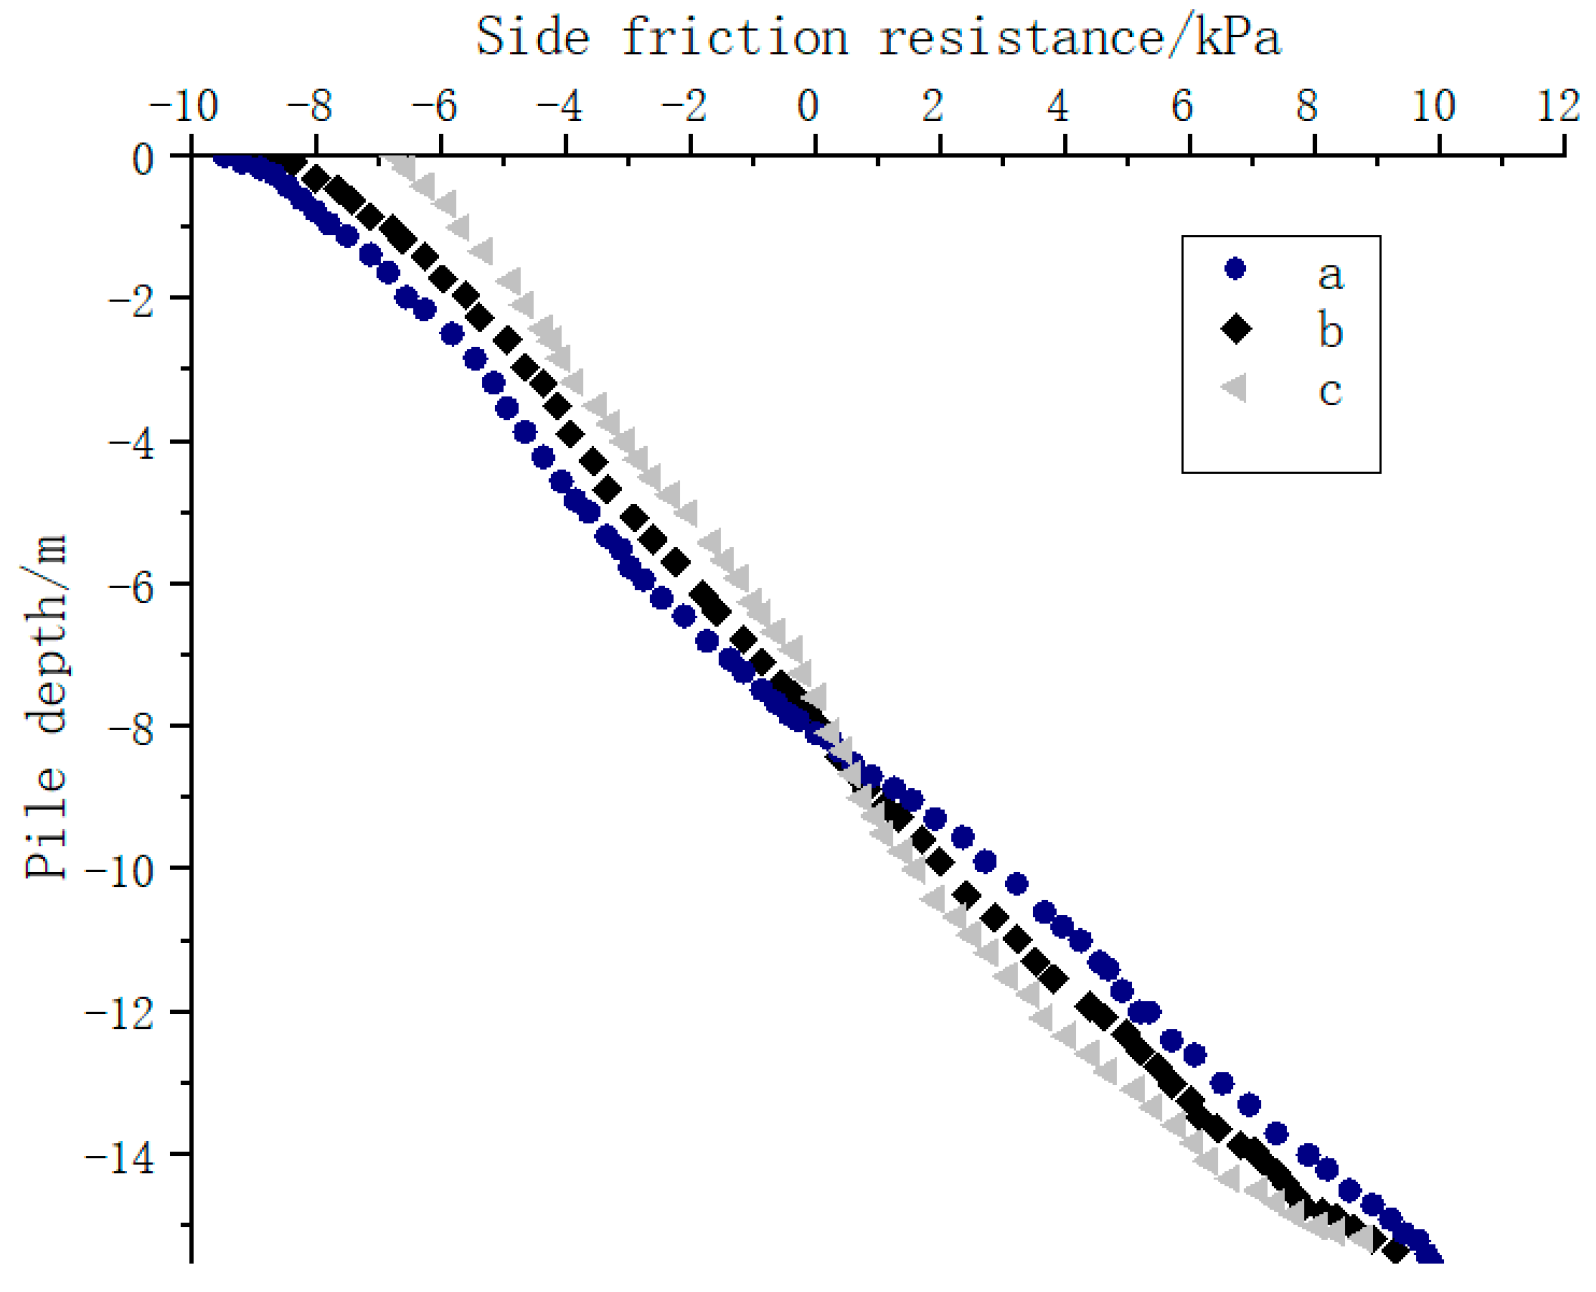
Figure 21 shows the relationship between pile depth and side friction for three pile types, (a), (b), and (c).
According to Figure 21, the side friction is close to the zero displacement position, with the side friction in the upper part of the pile body directed downward and the side friction in the lower part directed upward. The analysis results show that the side friction is not only influenced by the relative displacement between the pile and the soil but is also related to soil properties such as stiffness, friction angle, and cohesion coefficient. It is the result of these factors.

5. Conclusions

The heat transfer control equation and theoretical model for analyzing the mechanical performance of energy piles are derived theoretically. These equations and models are then incorporated into the numerical calculation model using COMSOL Multiphysics simulation software. Subsequently, a simulation study of the energy pile is conducted under both summer and winter conditions, leading to specific conclusions:
(1) The type of buried pipe significantly impacts the heat exchange and temperature control capabilities of energy piles, with spiral buried pipes exhibiting superior performance compared to U-shaped buried pipes. Additionally, employing water as the heat storage and energy storage material within the inner core of tubular energy piles results in maximum heat exchange of 1126.10 W and the lowest outlet temperature. Combining spiral buried pipes with water further enhances temperature control abilities, leading to a positive synergistic effect and reduced temperature fluctuations within the pile body. Moreover, treating the soil around the pile with carbon fiber urease mineralization promotes heat transfer diffusion from the energy within the pile to the surrounding soil. This treatment increases the energy pile’s heat transfer by approximately 190.26 W and improves temperature control capabilities by about 2.5%. Optimizing the type of buried pipe, utilizing water as the inner core heat storage material, and employing soil treatment with carbon fiber urease mineralization significantly enhance the heat exchange and temperature control abilities of energy piles, contributing to more efficient and sustainable energy management.
(2) Under summer conditions, solid concrete energy piles exhibit the largest temperature difference along the radial axis, with the temperature difference at the pile’s edge approximately half that at the axis. In contrast, tubular energy piles mitigate the significant temperature-related stress at the axis, enhancing the safety of the superstructure. Numerical calculations demonstrate that compared to solid piles, tubular energy piles reduce axial stress at the pile top by approximately 3.85% and displacement by 12.9% under temperature effects. Moreover, when the soil around the pile is treated with carbon fiber urease mineralization, the axial stress at the pile top decreases by about 5.6%, and displacement decreases by 11.11% under temperature effects. This soil treatment significantly enhances the overall safety margin of the energy pile system, providing a safer operating space for the structure.
(3) Under vertical loading, the stress within the pile diminishes linearly from the top downward, leading to upward lateral friction forces. Conversely, under temperature fluctuations, stress peaks at the center of the pile and gradually decreases nonlinearly towards both ends. This variation in stress distribution results in both upward and downward friction forces at the top and bottom of the pile. These frictional forces play a crucial role in the structural stability and load-bearing capacity of the energy pile system.

Author Contributions

Conceptualization, C.X.; methodology, C.X. and Y.W.; software, C.X., Y.W., X.M. and H.C.; validation, Q.L.; formal analysis, C.X., Y.W. and X.M.; investigation, Q.W.; data curation, Y.W., X.M. and H.C.; writing—original draft preparation, C.X., X.M. and H.C.; writing—review and editing, Q.L. and Q.W.; project administration, C.X.; funding acquisition, Q.L. All authors have read and agreed to the published version of the manuscript.

Funding

This research was funded by the National Natural Science Fund (42177167).

Data Availability Statement

The original contributions presented in the study are included in the article, further inquiries can be directed to the corresponding author.

Conflicts of Interest

Authors Chang Xu and Xiaolin Meng were employed by the company No. 6 Geological Team of Shandong Provincial Bureau of Geology and Mineral Resources. Author Yawen Wang was employed by the company Beijing Urban Construction Group Co., Ltd. Author Hui Chen was employed by the company Shandong Hi-Speed Qingdao Industry Investment Co., Ltd. Author Qingdong Wu was employed by the company Shandong Road and Bridge Group Qingdao Construction Co., Ltd. The remaining author declares that the research was conducted in the absence of any commercial or financial relationships that could be construed as a potential conflict of interest.

References

  1. Zhao, Q.; Chen, B.; Liu, F. Study on the thermal performance of several types of energy pile ground heat exchaners: U-shaped, W-shaped and spiral-shaped. Energy Build. 2016, 133, 335–344. [Google Scholar] [CrossRef]
  2. Li, X.-Y.; Guo, H.-X.; Cheng, X.-H. Experimental and numerical study on temperature distribution in energy piles. Civ. Eng. J. 2016, 49, 102–110. [Google Scholar]
  3. Hamzeh, F.A.; Behrad, A.; Mohsen, R. Thermal performance analysis of an energy pile with triple helix ground heat exchanger. Geothermics 2022, 104, 102459. [Google Scholar]
  4. Rui, Y. Thermo-hydro-mechanical coupling analysis of a thermal pile. Proc. Inst. Civ. Eng.-Geotech. Eng. 2018, 172, 155–173. [Google Scholar] [CrossRef]
  5. Francesco, C.; Diana, S. Energy performance assessment of thermo-active micro-piles via numerical modeling and statistical analysis. Geomech. Energy Environ. 2021, 29, 100268. [Google Scholar]
  6. Seokjae, L.; Sangwoo, P.; Dongwook, A.; Hangseok, C. Thermal performance of novel cast-in-place energy piles equipped with multipurpose steel pipe heat exchangers (SPHXs). Geothermics 2022, 102, 102389. [Google Scholar]
  7. Ding, X.-M.; Peng, C.; Wang, C.-L.; Kong, G.-Q. Heat transfer performance of energy piles in seasonally frozen soil areas. Renew. Energy 2022, 190, 903–918. [Google Scholar] [CrossRef]
  8. Mohammed, F.; Abdelmalek, B.; John, S.M. Thermal resistance analysis of an energy pile and adjacent soil using radial temperature gradients. Renew. Energy 2022, 190, 1066–1077. [Google Scholar]
  9. Sani, A.K.; Singh, R.M.; de Hollanda Cavalcanti Tsuha, C.; Cavarretta, I. Pipe–pipe thermal interaction in a geothermal energy pile. Geothermics 2019, 81, 209–223. [Google Scholar] [CrossRef]
  10. Gong, J.; Peng, W. Three-dimensional finite element analysis of deformation characteristics of energy piles under inclined load. J. Geotech. Eng. 2021, 43, 2105–2111. [Google Scholar]
  11. Han, C.; Yu, X. Analyses of the thermo-hydro-mechanical responses of energy pile subjected to non-isothermal heat exchange condition. Renew. Energy 2020, 157, 150–163. [Google Scholar] [CrossRef]
  12. Aria, M.; Mohammed, F.; Abdelmalek, B.; John, S.M. Cross-sectional thermo-mechanical responses of energy piles. Comput. Geotech. 2021, 138, 104320. [Google Scholar]
  13. Yu, L.; Deng, Y.-B.; Cao, G.-X.; Han, Y.-D.; Zhang, R.-H. The effect of thermal consolidation on bearing char-acteristics of static drilling rooted energy pile. In Proceedings of the ISRM Regional Symposium—11th Asian Rock Mechanics Symposium, Beijing, China, 21–25 October 2021; Volume 861. [Google Scholar]
  14. Lu, H.; Kong, G.; Liu, H.; Wu, D.; Chen, Y. Influence of thermo-mechanical properties of clay on me-chanical properties of energy piles. J. Geotech. Eng. 2022, 44, 53–61. [Google Scholar]
  15. Du, T.; Li, Y.; Bao, X.; Tang, W.; Cui, H. Thermo-Mechanical Performance of a Phase Change Energy Pile in Saturated Sand. Symmetry 2020, 12, 1781. [Google Scholar] [CrossRef]
  16. Yang, W.; Zhang, L.J.; Zhang, H.; Wang, F.; Li, X. Numerical investigations of the effects of different factors on the displacement of energy pile under the thermo-mechanical loads. Case Stud. Therm. Eng. 2020, 21, 100711. [Google Scholar] [CrossRef]
  17. Huang, X.; Kong, G.-Q.; Liu, H.-L.; Wu, H.-W. Experimental research on thermomechanical characteristics of PCC energy pile under cyclic temperature. Rock Soil Mech. 2015, 36, 667–673. [Google Scholar]
  18. Fang, J.-C.; Kong, G.-Q.; Yang, Q. Group Performance of Energy Piles under Cyclic and Variable Thermal Loading. J. Geotech. Geoenvironmental Eng. 2022, 148, 04022060. [Google Scholar] [CrossRef]
  19. Wang, Z.-J. Analysis of an Energy Pile Enduring Cyclic Temperature Loads. Geotech. Res. 2019, 6, 227–233. [Google Scholar] [CrossRef]
  20. Chen, Z.; Yao, J.; Pan, P.; Xiao, H.; Ma, Q. Research on the heat exchange characteristics of the deeply buried pipe type of energy pile. Case Stud. Therm. Eng. 2021, 27, 101268. [Google Scholar] [CrossRef]
  21. Li, Q.; You, S.; Ji, H. Numerical Modelling of Structural Response Characteristics of Energy Piles under Long-term coupled Thermo-Mechanical Loads. In Proceedings of the ISRM Regional Symposium—11th Asian Rock Mechanics Symposium, Beijing, China, 21–25 October 2021; Volume 861. [Google Scholar]
  22. Casasso, A.; Sethi, R. Efficiency of closed loop geothermal heat pumps: A sensitivity analysis. Renew. Energy 2014, 62, 737–746. [Google Scholar] [CrossRef]
  23. Antelmi, M.; Turrin, F.; Zille, A.; Fedrizzi, R. A new type in TRNSYS 18 for simulation of Borehole Heat Exchangers affected by different groundwater flow velocities. Energies 2023, 16, 1288. [Google Scholar] [CrossRef]
  24. Vespasiano, G.; Cianflone, G.; Taussi, M.; De Rosa, R.; Dominici, R.; Apollaro, C. Shallow Geothermal Potential of the Sant’Eufemia Plain (South Italy) for Heating and Cooling Systems: An Effective Renewable Solution in a Climate-Changing Society. Geosciences 2023, 13, 110. [Google Scholar] [CrossRef]
  25. Alberti, L.; Angelotti, A.; Antelmi, M.; La Licata, I. Borehole Heat Exchangers in aquifers: Simulation of the grout material impact, Rendiconti Online Societa Geologica Italiana. Rend. Online Della Soc. Geol. Ital. 2016, 41, 268–271. [Google Scholar] [CrossRef]
  26. Di Dato, M.; D’angelo, C.; Casasso, A.; Zarlenga, A. The impact of porous medium heterogeneity on the thermal feedback of openloop shallow geothermal systems. J. Hydrol. 2021, 604, 127205. [Google Scholar] [CrossRef]
  27. Stewart, M.A.; McCartney, J.S. Centrifuge Modeling of Soil-Structure Interaction in Energy Foundations. J. Geotech. Geoenviron. Eng. 2013, 140, 04013044. [Google Scholar] [CrossRef]
  28. Bourne-Webb, P.J.; Amatya, B.; Soga, K.; Amis, T.; Davidson, C.; Payne, P. Energy pile test at Lambeth College, London: Ge-otechnical and thermodynamic aspects of pile response to heat cycles. Géotechnique 2009, 59, 237–248. [Google Scholar] [CrossRef]
  29. Gao, W. Study on Heat Transfer Performance of Double-Helix Energy Pile under the Mineralization of Carbon Fiber-Based Urease. Master’s Thesis, Qingdao University of Technology, Qingdao, China, 2021. [Google Scholar] [CrossRef]
  30. Gui, S.; Cheng, X. In-situ experimental study on structural response of energy piles during heat transfer. J. Geotech. Eng. 2014, 36, 1087–1094. [Google Scholar]
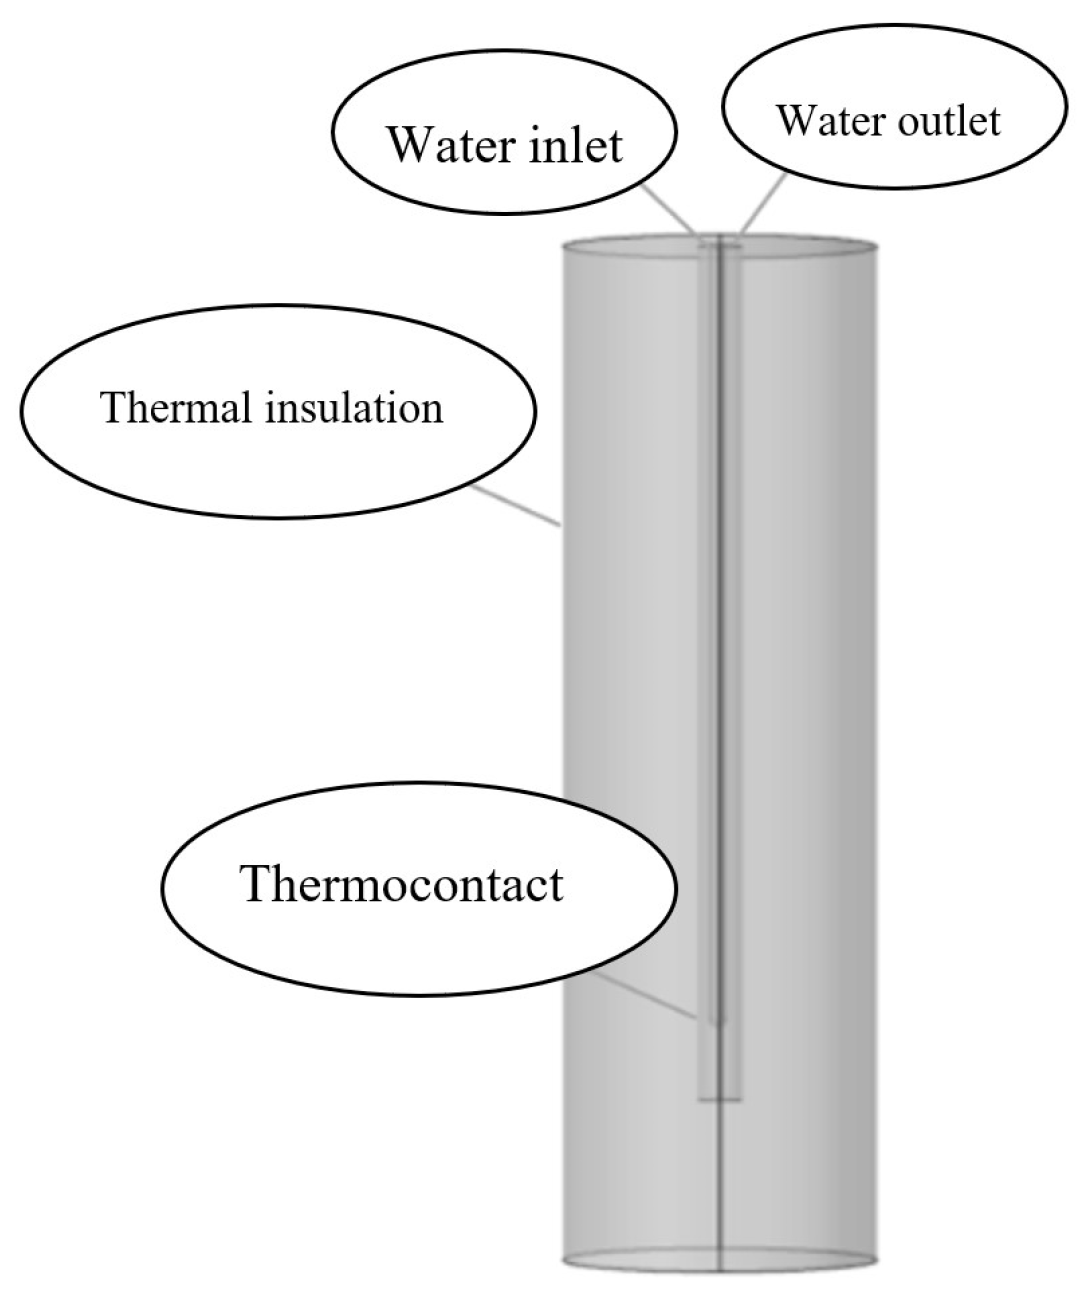
Figure 1. Heat transfer model of energy pile.
Buildings 14 01440 g001
Figure 2. Mechanics model of energy pile.
Buildings 14 01440 g002
Figure 3. Pile force balance.
Buildings 14 01440 g003
Figure 4. Position of TES materials in piles. (a) Reinforced concrete solid energy pile. (b) Energy pipe pile filled with TES material in reinforced concrete.
Buildings 14 01440 g004
Figure 5. Energy pile models under different conditions. (a) Model for solid reinforced concrete energy pile of buried U-pipe. (b) Model for hollow reinforced concrete energy pile of buried spiral pipe.
Buildings 14 01440 g005
Figure 6. Grid division in each part of energy pile. (a) Fluid grid. (b) Energy pipe pile wall grid. (c) Grid of filling materials in pipe piles. (d) Grid of pile and soil.
Buildings 14 01440 g006
Figure 7. Surface diagram of heat transfer liquid temperature under different conditions.
Buildings 14 01440 g007
Figure 8. Curve of water temperature of energy pile. (a) Buried U-pipe energy pile. (b) Buried spiral pipe energy pile.
Buildings 14 01440 g008
Figure 9. Temperature diagram of longitudinal section of various types of energy piles with buried U-pipes. (a) Thermal diagram of longitudinal section of solid reinforced concrete energy pile with buried U-pipe and undisturbed sandy soil around pile in summer. (b) Thermal diagram of longitudinal section of hollow reinforced concrete energy pile with buried U-pipe and undisturbed sandy soil around pile in summer. (c) Thermal diagram of longitudinal section of reinforced concrete energy pile with buried U-pipe filled with water for TES and undisturbed sandy soil around pile in summer. (d) Thermal diagram of longitudinal section of reinforced concrete energy pile with buried U-pipe filled with sand for TES and undisturbed sandy soil around pile in summer. (e) Thermal diagram of longitudinal section of reinforced concrete energy pile with buried U-pipe filled with mineralized sandy soil for TES and undisturbed sandy soil around pile in summer. (f) Thermal diagram of longitudinal section of reinforced concrete energy pile with buried U-pipe filled with mineralized sandy soil for TES and mineralized soil around pile in summer.
Buildings 14 01440 g009aBuildings 14 01440 g009b
Figure 10. Temperature diagram of longitudinal section of various types of energy piles with buried spiral pipes. (a) Thermal diagram of longitudinal section of solid reinforced concrete energy pile with buried spiral pipe and undisturbed sandy soil around pile in winter. (b) Thermal diagram of longitudinal section of hollow reinforced concrete energy pile with buried U-pipe and undisturbed sandy soil around pile in winter. (c) Thermal diagram of longitudinal section of reinforced concrete energy pile with buried spiral pipe filled with water for TES and undisturbed sandy soil around pile in winter. (d) Thermal diagram of longitudinal section of reinforced concrete energy pile with buried spiral pipe filled with sand for TES and undisturbed sandy soil around pile in winter. (e) Thermal diagram of longitudinal section of reinforced concrete energy pile with buried spiral pipe filled with mineralized sandy soil for TES and undisturbed sandy soil around pile in winter. (f) Thermal diagram of longitudinal section of reinforced concrete energy pile with buried spiral pipe filled with mineralized sandy soil for TES and mineralized soil around pile in winter.
Buildings 14 01440 g010aBuildings 14 01440 g010b
Figure 11. Temperature distribution of vertical section at different distances from longitudinal axis. (a) Longitudinal temperature distribution of solid pile with buried U-pipe in summer. (b) Longitudinal temperature distribution of solid pile with buried U-pipe in winter. (c) Longitudinal temperature distribution of precast pile with buried spiral pipe in summer. (d) Longitudinal temperature distribution of precast pile with buried spiral pipe in winter.
Buildings 14 01440 g011aBuildings 14 01440 g011b
Figure 12. Comparison of outlet temperature of energy piles with different buried pipes and the same pile foundation type in summer. (a) Solid reinforced concrete energy pile with undisturbed sandy soil around the pile. (b) Reinforced concrete energy pile with undisturbed sandy soil around the pile. (c) Reinforced concrete energy pile with undisturbed sandy soil around the pile and filled with water. (d) Reinforced concrete energy pile with undisturbed sandy soil around the pile and filled with undisturbed sandy soil. (e) Reinforced concrete energy pile with undisturbed sandy soil around the pile and filled with mineralized sandy soil. (f) Reinforced concrete energy pile with undisturbed sandy soil around the pile and filled with mineralized sandy soil.
Buildings 14 01440 g012
Figure 13. Surface stress distribution of energy pile under temperature after 36 h operation.
Buildings 14 01440 g013
Figure 14. Surface stress distribution of energy pile under upper load after 36 h operation.
Buildings 14 01440 g014
Figure 15. Axial stress of pile under upper load and temperature difference.
Buildings 14 01440 g015
Figure 16. Axial stress of pile body under temperature change.
Buildings 14 01440 g016
Figure 17. Surface displacement distribution of energy pile under temperature after 36 h operation.
Buildings 14 01440 g017
Figure 18. Surface displacement distribution of energy pile under upper load after 36 h operation.
Buildings 14 01440 g018
Figure 19. Vertical displacement of energy pile surface under temperature.
Buildings 14 01440 g019
Figure 20. Side friction of energy pile under upper load and temperature.
Buildings 14 01440 g020
Figure 21. Side friction of energy piles under temperature in different conditions.
Buildings 14 01440 g021
Table 1. Numerical model and specifications of energy pile.
#Outer Radius of Pile Foundation/mPile Length/mInner Radius of Pile Foundation/mShape of Buried PipeTES Material in PileSoil around Pile
10.3815.5N/A (solid pile)Buried U-pipeN/AIn-situ sandy soil
20.3815.50.35Buried U-pipeN/AIn-situ sandy soil
30.3815.50.35Buried U-pipeWaterIn-situ sandy soil
40.3815.50.35Buried U-pipeSandy soilIn-situ sandy soil
50.3815.50.35Buried U-pipeMineralized soilIn-situ sandy soil
60.3815.50.35Buried U-pipeMineralized soilMineralized soil
70.3815.5N/A (solid pile)Buried spiral pipeN/AIn-situ sandy soil
80.3815.50.35Buried spiral pipeN/AIn-situ sandy soil
90.3815.50.35Buried spiral pipeWaterIn-situ sandy soil
100.3815.50.35Buried spiral pipeSandy soilIn-situ sandy soil
110.3815.50.35Buried spiral pipeMineralized soilIn-situ sandy soil
120.3815.50.35Buried spiral pipeMineralized soilMineralized soil
Table 2. Outlet water temperature corresponding to the number of simulated 24 h grid cells.
Number of Grid CellsOutlet Water TemperatureCalculation Time
19,79729.3 °C0.5 h
88,43529.5 °C3 h
105,93029.9 °C5 h
780,09530.3 °C11 h
2,329,28730.7 °C23 h
Table 3. Double factor, equally repeatable outlet water temperature of energy piles (in °C).
Factor BBuried U-PipeBuried Spiral Pipe
Factor A
Solid pile31.92532.73331.84832.662
Hollow pipe pile34.67534.94034.87134.925
Pipe pile filled with water32.86533.14232.13732.114
Pipe pile filled with sandy soil34.72134.62134.21434.233
Pipe pile filled with mineralized soil33.32633.65633.18433.414
Disclaimer/Publisher’s Note: The statements, opinions and data contained in all publications are solely those of the individual author(s) and contributor(s) and not of MDPI and/or the editor(s). MDPI and/or the editor(s) disclaim responsibility for any injury to people or property resulting from any ideas, methods, instructions or products referred to in the content.