Abstract
This study investigated the influence and mechanism of the excavation width on excavation deformations in Shanghai soft clay. Based on three excavations that had different final excavation depths, dissimilar retaining structures and diverse geological conditions, 40 sets of two-dimensional numerical models with different excavation widths were employed to analyze the deformation rules affected by the excavation width. Moreover, a series of simplified models with different excavation widths were employed to analyze the effect of the excavation width on excavation deformations. The results show that under the same excavation depth, both the horizontal displacements of the retaining walls and ground surface settlements increase as the excavation width increases, but the increasing rate gradually decreases. Factors such as the unloading influence depth, the overlap degree of the passive zones, the stress state of the basal soils and the development of the relative shear stress have a significant influence on excavation deformations. With increasing excavation width, the unloading influence depth gradually deepens, the overlap area of the passive zones gradually decreases, the direction of the rotation of the major principal stress gradually reduces and the relative shear stress of the distant and deep soils gradually expands. Therefore, the constraint ability of the passive zones on excavation deformation gradually reduces and excavation deformations gradually increase.
1. Introduction
With the rapid development of cities and the advancement of underground space construction, excavation areas are gradually increasing day after day. The size of excavation areas has a significant influence on excavation deformation. Under the same excavation depth, both the ground settlement and the horizontal displacement of the retaining wall induced by excavation progressively increases with the increasing excavation area. This phenomenon has been confirmed by Wang et al. [1], Bolton et al. [2] and Tan et al. [3] through on-site statistical data.
Hitherto, the results from many researchers have verified this phenomenon by numerical calculation, field measurement data and theoretical analysis. Mana and Clough [4] investigated the relationship between excavation deformation and the excavation width via a two-dimensional finite element. The results show that when the excavation width increased from 0.8H (final excavation depth) to 3.2H, the maximum deflection of the retaining wall and surface ground settlement increased by 1.6 times and 1.9 times, respectively. Based on the field measurement data of a large-scale excavation in Shanghai soft clay, Jia and Xie [5] found that the ground settlements were 2 to 3 times larger than those of the narrow excavation, and the ground surface settlement trough increased simultaneously with increasing excavation area. When the diameter of the circular excavation was less than 90 m, Tan and Wang [6] concluded that the maximum deflection of the retaining wall increased linearly with the increasing diameter. Tan and Wang [7] also found that large-scale excavations with areas of 30,000~50,000 m2 experienced wall deflections and ground surface settlements three to five times as large as those of regular small-scale excavations with sizes no more than 6000 m2, and the corresponding influence zones behind the large-scale excavations were also much wider than small-scale excavations. On the basis of 92 case histories with different excavation widths, Xiao et al. [8] summarized that the lateral wall deflections, ground movements and basal heave are closely related to the excavation width. With the increase in the excavation width, the maximum lateral wall deflections and the maximum ground surface settlements increase firstly and then tend to stabilize. Through a theoretical analysis, Wang [9] concluded that under the same geological conditions, the smaller the excavation width, the more stable the excavation. Because of the close relationship between soil deformation and force, this means that the excavation width of the foundation pit has a significant influence on the excavation deformations. According to the field monitoring data, under a similar excavation depth and geological conditions, the deflection of the retaining walls and ground settlements caused by large-scale excavations [10,11,12,13,14,15] were greater than those caused by small-scale excavations [16,17,18,19,20].
Although the field monitoring data and theoretical analysis results have indicated that the excavation size significantly influences excavation deformations, the governed rules and intrinsic mechanism remain ambiguous. To address these issues, 40 sets of 2D numerical models with different excavation widths, final excavation depths, embedded depths and diverse geological conditions were carried out. The variation rules of the horizontal displacements of the retaining wall and the ground surface settlements with excavation widths were studied. Meanwhile, the mechanism of the influence of the excavation width on deformations was analyzed.
2. Numerical Model
With the gradual improvement of constitutive models, numerical analyses are widely used in the deformation and force analysis of geotechnical engineering [21,22,23,24,25,26,27]. In terms of parametric analyses, numerical analyses have some advantages that field tests and model tests do not.
2.1. Project Overview
Three excavations that have different final excavation depths, diverse geology conditions and dissimilar support parameters in Shanghai soft clay were used for the following analysis. The final excavation depths (H) of case I, case II and case III were 9.7 m, 15 m and 18.2 m, respectively. The strata of the three sites were mainly composed of saturated soft clay and silt sand. The basic parameters of the soils, such as the layer thickness (h), unit weight (γ), a compressive modulus of 100~200 kPa corresponding to the consolidation test (Es1–2), void ratio (e), effective cohesion (c′) and effective internal friction angle (φ′), are shown in Table 1. The groundwater level of case I, case II and case III were 0.5 m below ground level (GL −0.5 m).

Table 1.
Soil properties and HSS model input parameters.
Reinforced concrete struts were used in these excavations. The elevation and cross-sectional dimension of the reinforced concrete struts are shown in Figure 1. Cast-in situ bored piles, a 0.8 m thick diaphragm wall and a 1.2 m thick diaphragm wall were applied as retaining walls in case I, case II and case III, respectively. The insertion ratios of case I, case II and case III were 1.47, 0.91 and 1.09, respectively. Figure 1 presents the typical cross-section of case I, case II and case III. More details of case I and case II were reported by Zhang et al. [27] and Gu et al. [28], respectively.
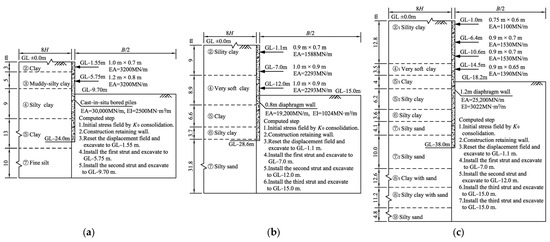
Figure 1.
Basic model employed in this study. (a) H = 9.7 m [27]; (b) H = 15 m [28]; (c) H = 18.2 m.
2.2. Numerical Analysis Models
Combined with the engineering geology conditions and support parameters of case I, case II and case III, a series of numerical models with different excavation widths were carried out by Plaxis. A plane strain condition was assumed for the numerical analyses in this study. Figure 1 presents the basic model employed in this study. Considering the geometrical symmetry of the models, only half of the models were conducted for the following analysis. To reduce the influence of boundary effects, the distance from the left boundary to the retaining wall was 8H, and the distance from the bottom of the model to the excavation’s bottom was 3H. The left and right sides of the boundary were constrained horizontally, and the bottom boundary was restrained by both horizontal and vertical displacements. For each case, the excavation width B was taken as 1H, 2H, 3H, 4H, 5H, 6H, 7H, 8H, 9H and 10H. In total, 30 numerical models were utilized. The analysis processes of case I, case II and case III are shown in Figure 1. The diaphragm walls were assumed to be linear elastic, and bar elements were used for the struts. The soil was modeled by 15-noded triangular elements. Meshing of the typical model is shown in Figure 2. The bottom of the model was constrained from moving both horizontally and vertically, the left and right sides of the model were constrained from horizontal displacement, and the top of the model is a free boundary. Plastic calculation was selected during the analysis, which do not need to take the change in pore pressure with time into account.
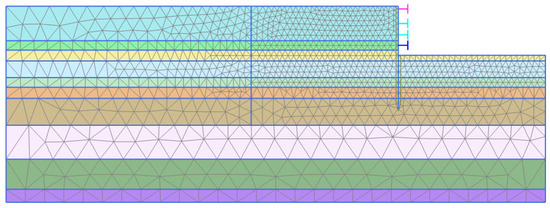
Figure 2.
Meshing of the typical model.
Since the retaining walls of case I, case II and case III were inserted into the clay layers (⑤, ⑤1, ⑤2 or ⑥) characterized by a small permeability coefficient, the groundwater connections inside and outside the excavation were cut off by the retaining walls. During excavation, dewatering was only conducted inside the pit. Hence, the influence of groundwater seepage around the excavation was not considered during calculations [29].
2.3. Constitutive Models and Input Parameters
The hardening soil small strain model (HSS model) that was further refined based on the HS model by Benz [30] was adopted to simulate the behavior of soils. Due to the sensitive urban environment, the design of deep excavation has changed from the traditional strength control design to the deformation control design. The deformation caused by excavation is small and the HSS model can simulate the small deformation characteristics of the soil well. The HSS model can consider shear hardening, compression hardening, unloading plastic deformation and the nonlinear relationship between the shear stiffness and shear strain of the soil. The input parameters of the HSS model such as c′, φ′, secant stiffness in standard drained triaxial test (E), tangent stiffness for primary oedometer loading (E), unloading/reloading stiffness for drained triaxial test (E), power for stress level dependency of stiffness (m), dilatancy angle (ψ), threshold shear strain (γ0.7), shear modulus specified at the reference mean stress (G), coefficient of lateral earth pressure at rest (K0), failure ratio (Rf), reference stress for stiffness (pref), Poisson’s ratio for unloading–reloading (vu), are listed in Table 1.
The Input parameters of case I were”obta’ned according to the method suggested by Wang et al. [31], and were based on laboratory tests and were validated by five typical excavations in Shanghai. The input parameters of case II are calculated according to the void ratio I suggested by Gu et al. [28], and were verified by four typical excavations. Based on the statistics of laboratory and field test data of Shanghai soft soils, Gu et al. [28] proposed the relationships between the input parameters and the void ratio. The input parameters of case III are given according to the method suggested by the Shanghai Technical Code for Excavation Engineering [32].
The retaining walls were modeled by linear elastic plate elements and the reinforced concrete struts were simulated by node-to-node anchors [33]. The input parameters of retaining walls and reinforced concrete struts are shown in Figure 1. The interaction between soil and structure were modeled by interface elements [34,35,36]. The interface strength reduction factor (Rint) between structure and soil are listed in Table 1.
2.4. Validation of the Model Parameters
Figure 3 plots the computed data and measured data of case I, II and III after the completion of the excavation. The computed data and the measured data of case I and II are from Zhang et al. [27] and Gu et al. [28], respectively. For case I, the computed retaining wall deflections and ground surface settlements are in accordance with the measured data. As for case II, most of the computed deflections are close to the measured data except for the locations below the final excavation depth. For case III, most of the computed deflections are well consistent with the measured data, and only the computed data beneath the excavation face are slightly larger than the measured value. The computed ground surface settlements are in agreement with the measured data. The good agreement of the computed data and the measured data indicates that the constitutive models, the numerical model and Input parameters for the soil and structures adopted in this study are reasonable.
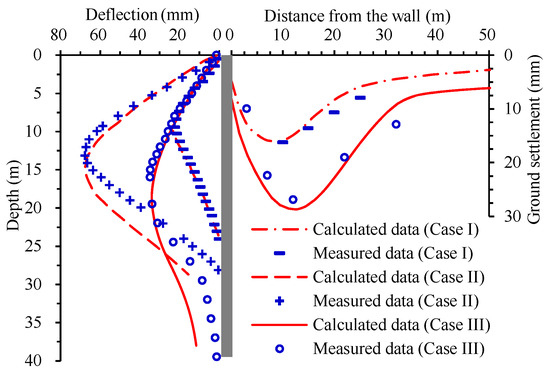
Figure 3.
Comparison of wall deflections and ground surface settlements.
3. Influence of Excavation Width on Deformations
3.1. Deflections of Retaining Wall
Figure 4 illustrates the development of the retaining wall deflections with excavation width (B) after reaching the final excavation depth (H). Figure 5 plots the relationship between the maximum wall deflection (δhm) and excavation widths. Generally, the deflections of the retaining wall gradually increase with the increasing excavation width. While B ≤ 4H, the deflections increase rapidly with the increasing excavation width. When 4H < B ≤ 8H, the deflections of the retaining wall still increase with increasing excavation width, but the increasing rate gradually decreases. While B > 8H, the increasing rate of the wall deflections further reduces. Taking case II as an example, the maximum deflections with widths of 2H, 3H, 4H, 5H, 6H, 7H, 8H, 9H and 10H are 1.26, 1.40, 1.49, 1.56, 1.61, 1.65, 1.69, 1.72 and 1.74 times than that of 1H, respectively. The deflection variation rules, described above, of case I and case III are consistent with that of case II. This phenomenon indicates that the effect of the excavation width on retaining wall deformation is gradually reduced with the increasing excavation width. The smaller the excavation width is, the greater the influences of the excavation width on the deflections are. For three excavations with different final excavation depths, a dissimilar retaining structure and diverse geological conditions, the impacts of the excavation width on the deflection of the retaining walls are comparable.
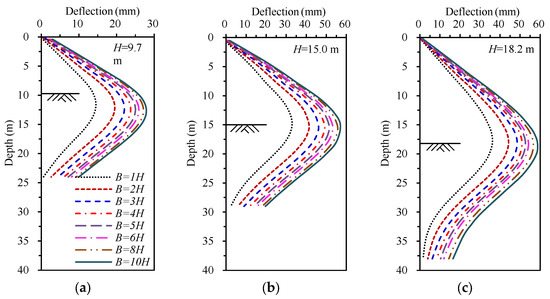
Figure 4.
Variation in retaining wall deflections with excavation widths. (a) Case I; (b) case II; (c) case III.
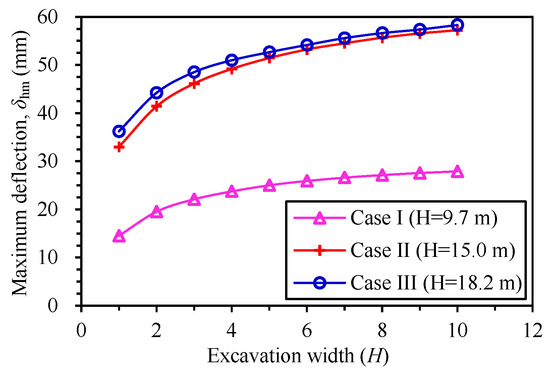
Figure 5.
Relationship between the maximum deflection of retaining wall and excavation width.
3.2. Ground Surface Settlements
Figure 6 plots the ground surface settlements with the excavation width (B) after reaching the final excavation depth. Figure 7 presents the relationship between the maximum ground surface settlements (δvm) and excavation widths. Generally, the excavation width has a significant influence on the ground settlement, and the variation in the ground surface settlements with the excavation width is similar to that of the deflections. When B ≤ 4H, the ground surface settlements increase rapidly with the increasing excavation width. When 4H < B ≤ 8H, the ground surface settlements still increase with the increasing excavation width, but the increasing rate gradually decreases. While B ≥ 8H, the increasing rate of the ground surface settlements further reduces. For case II, the maximum ground surface settlements with widths of 2H, 3H, 4H, 5H, 6H, 7H, 8H, 9H and 10H are 1.29, 1.46, 1.57, 1.66, 1.72, 1.77, 1.82, 1.85 and 1.88 times that of 1H, respectively. The variations in the ground surface settlements of case I and case III are consistent with those of case II. This phenomenon indicates that the ground surface settlements increase with the increasing excavation width, but the increasing rate decreases gradually. The smaller the excavation width is, the greater the influences of the excavation width on the ground surface settlements are. For three excavations with different final excavation depths, dissimilar retaining structures and diverse geological conditions, the impacts of the excavation width on the ground surface settlements are similar.
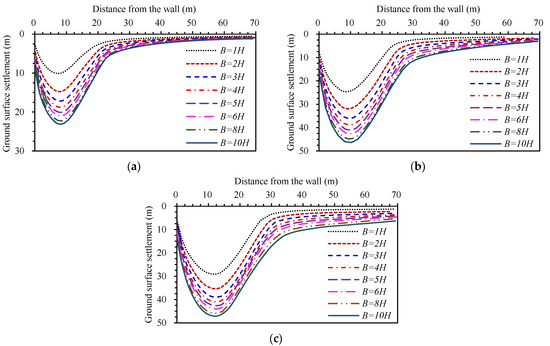
Figure 6.
Variation in ground surface settlements with excavation width. (a) Case I (H = 9.7 m); (b) case II (H = 15.0 m); (c) case III (H = 18.2 m).
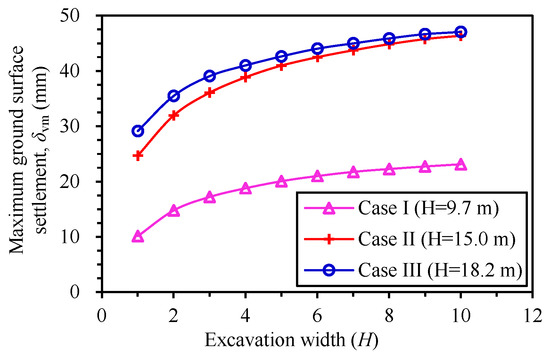
Figure 7.
Relationship between the maximum ground surface settlement and excavation width.
4. Influence Mechanism of Excavation Width on Deformation
4.1. Analysis Models
The shallow strata of Shanghai are mainly composed of the upper 30 m thick multilayer soft clay and underlying silty sand. To eliminate the influence of multilayer soil property differences on the results, series simplified models were established. Figure 8 plots the simplified analysis model employed in this section. The final excavation depth (H) of these simplified models was 15 m. The excavation widths (B) were taken as 1H, 2H, 3H, 4H, 5H, 6H, 7H, 8H, 9H and 10H, respectively. Due to the symmetry of the models, only half of the models were employed for the following analysis. The distance from the left boundary to the retaining wall was 120 m, and the distance from the bottom of the model to the excavation’s bottom was 75 m. The left and right boundaries were constrained horizontally, and the bottom boundary was restrained by both horizontal and vertical displacements. The thickness and depth of the retaining wall were 0.8 m and 30 m, respectively. The cross-section size and the input parameters of the concrete struts are shown in Figure 7. The hardening soil small strain model was adopted for the calculations. The parameters of ⑤2 and ⑦1 of case III listed in Table 1 were used as the input parameters of the soft clay and silty sand, respectively. The groundwater level was 0.5 m below the ground surface. During the calculation process, dewatering inside excavation was adopted. Hence, the influence of groundwater seepage on the deformation was not considered.
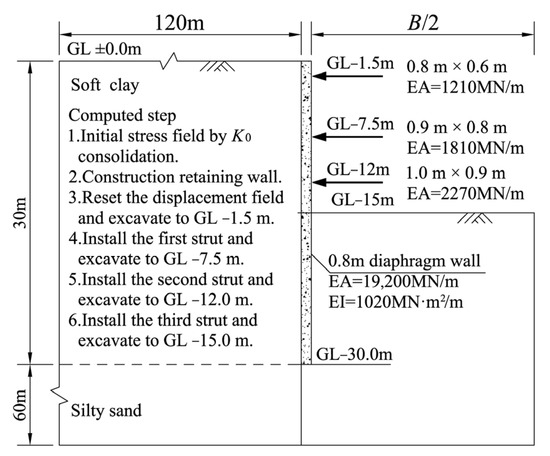
Figure 8.
Simplified analysis models.
Figure 9 summarizes the variations in the ground surface settlements with the excavation width. Figure 10 illustrates the variations in the retaining wall deflections with the excavation width. The variation rules of the ground surface settlements and the deflections of the retaining wall are in accordance with those of case I, II and III. This indicates that the simplified analysis models and input parameters for the soils and structures adopted in this section were reasonable.
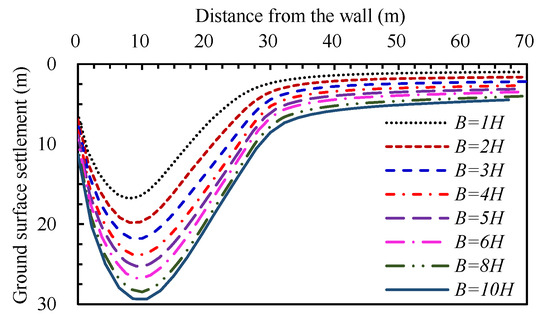
Figure 9.
Variations in the ground surface settlements with excavation width.
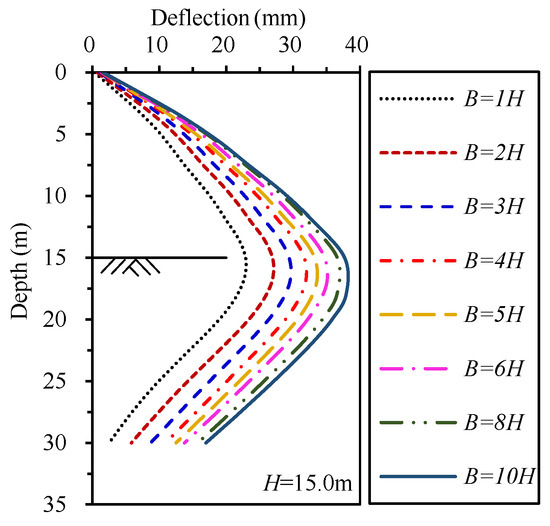
Figure 10.
Variations in retaining wall deflections with excavation width.
4.2. Development of the Total Ground Displacements
Figure 11 presents the contour of the total ground displacements under different excavation widths. With the increasing excavation width, the total ground displacements outside the excavation increase gradually. The larger the excavation width is, the greater the total ground displacements and the influence area are. After B ≥ 3H, the size of the triangular zone enclosed by the 12.5 mm contour, the ground surface and the retaining wall start to stabilize, although the whole influence area increases with the excavation width. Therefore, this triangular area can be defined as the strong influence zone during excavation.

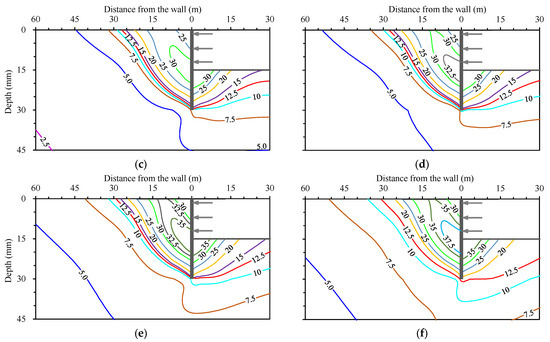
Figure 11.
Contour maps of the total displacements (unit in mm) under different excavation widths. (a) B = 1H; (b) B = 3H; (c) B = 4H; (d) B = 5H; (e) B = 7H; (f) B = 10H.
Figure 12 illustrates the development of a 5 mm total displacement contour with different excavation widths. It can be found that the 5 mm contour is gradually moved away from the excavation with an increasing rate first when B ≤ 6H and then with a decreasing rate when B > 6H. This phenomenon indicates that the influence of the excavation width on the deep and distant strata gradually increases with the increasing excavation width, and when B > 6H, the influence of the excavation width on the deep and distant strata gradually decreases and stabilizes. Correspondingly, the zone limited by the contours between 12.5 mm and 5 mm can be defined as the weak influence zone affected by excavation.
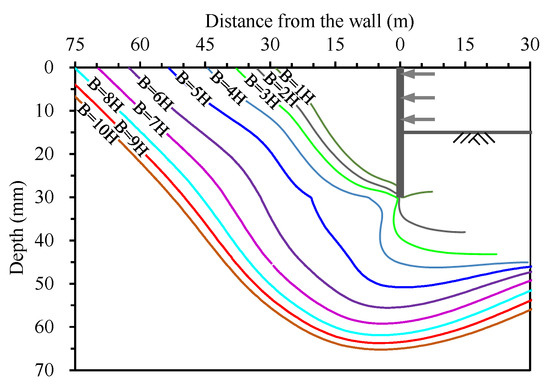
Figure 12.
Variation in the 5 mm total displacements contour with excavation width.
4.3. Basal Heaves
Figure 13 shows the variation in the basal heaves with the excavation width. The excavation width has a significant effect on the performance of the basal heaves. When the excavation width is small, the maximum basal heave is located in the middle of the excavation’s bottom. When the excavation width is large, the maximum basal heaves are on both sides of the excavation’s bottom near the retaining wall. This phenomenon is consistent with the conclusion of Xiao et al. [8]. For different width excavations, the maximum basal heaves are close. The maximum basal heaves of B = 1H, B = 3H and B = 7H are about 33 mm, 27 mm and 27 mm below the ground level, respectively. Moreover, the depths of the 9 mm heave contour for different widths of the excavation range from GL −25 to GL −30, which does not vary significantly with the excavation width. However, the maximum unloading influence depths attributable to the excavation are quite different. The maximum unloading influence depth can be reflected by the variation in the 3 mm contour. The depths of the 3 mm heave contour of B = 1H, B = 3H and B = 7H are 38.1 m, 55.3 m and 57.6 m below the ground level, respectively. With the increasing excavation width, the maximum unloading influence depth gradually deepens with a decreasing rate. This interesting phenomenon indicates that the variation in the excavation width has little influence on the strong heave zone, but has a greater impact on the weak heave zone.

Figure 13.
Basal heaves with different excavation widths. (a) B = H; (b) B = 3H; (c) B = 7H.
4.4. Overlap Degree of the Passive Zone Soil under Excavation Surface
After excavation, the soil below the excavation surface transforms from the state at rest to the passive state, and the soil outside the excavation transforms from the state at rest to the active state. Combined with the development of the total displacements, the influence depth of the basal heaves, and the stress state of the soil around the excavation, the soil around excavation can be divided into five zones. Figure 14 shows the simplified zones around a large excavation width, where hm is the maximum unloading influence depth. Zones I and III are Rankine passive zones, and zones II and IV are Rankine active zones. Zone V is the rebound zone below the excavation’s bottom. The deformation of soil in zones I and II induced by excavation are the largest, and can be regarded as the strong influence zones. Correspondingly, the zones III and IV are the weak influence zones with less deformation. Through a K0 laboratory test, numerical analysis and engineering practice, Jia and Xie [5] suggested that the maximum unloading influence depth (hm) of the Shanghai soils is about 2.5 times that of the final excavation depth.
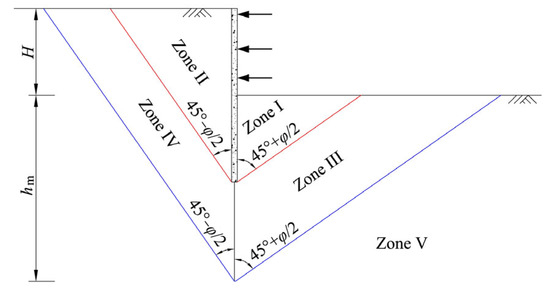
Figure 14.
The zones of stress state around large excavation width.
When the excavation width (B) is small, the passive zones on both sides of the bottom overlap with each other. Figure 15 shows that the overlap degree of the passive zone varies with different excavation widths, where hs is the distance from the bottom of zone I to the excavation’s bottom, hw is the unloading influence depth and D is the embedded depth of the retaining wall.
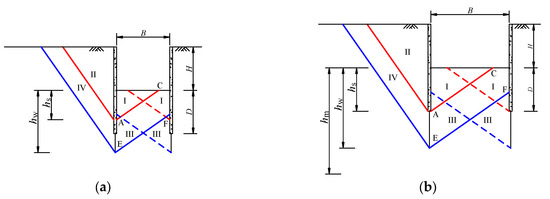

Figure 15.
Relationship between the passive zone overlap degree and excavation width. (a) B < Dtan(45° + φ/2); (b) Dtan(45° + φ/2) ≤ B < 2.5Htan(45° + φ/2); (c) 2.5Htan(45° + φ/2) ≤ B < 5Htan(45° + φ/2); (d) B ≥ 5Htan(45° + φ/2).
As shown in Figure 15a, when B < Dtan(45° + φ/2), zones I and III on both sides overlap with each other, and the potential sliding surface EF does not reach the excavation’s bottom. The value of hs is less than D, and the value of hw is much less than hm. In this instance, the soil of the passive zone has a strong restraining effect on the deformations of the retaining walls.
As shown in Figure 15b, when Dtan(45° + φ/2) ≤ B < 2.5Htan(45° + φ/2), the values of hs and hw gradually increase to D and hm, respectively. Meanwhile, the area of zones III and IV gradually increases. The potential sliding surface EF is still below the excavation’s bottom. Zones I and III on both sides overlap with each other, and the area of the overlap zones gradually decreases as the excavation width increases. The larger the overlap area of the passive zone is, the stronger the restraint effects on the deformations of the retaining walls are. As a result, the deformations and influence area due to excavation gradually increase with the increasing excavation width.
As shown in Figure 15c, when 2.5Htan(45° + φ/2) ≤ B < 5Htan(45° + φ/2), the potential sliding surface EF emerges from the excavation’s bottom. On both sides, zone I is separate, while zone III still overlaps. The area of the overlap zones gradually decreases with the increasing excavation width. The restrictive effect of zone III on the horizontal displacements of the retaining walls is significantly reduced.
As shown in Figure 15d, when B ≥ 5Htan(45° + φ/2), on both sides, zone III no longer overlaps. The restrictive effect of the passive zone on the horizontal displacements of the retaining walls is significantly reduced.
4.5. Stress State of the Basal Soils
The impact of passive zones on excavation deformation can be illustrated by changes in the principal stress directions. Figure 16 presents the direction rotation angle of the major principal stress (σ1) beneath the excavation’s bottom. The direction rotation angle is symmetrical about the center axis of the excavation. Hence, only the left part of the direction rotation angle contours is drawn. The left retaining wall is at the position of x = 0. When σ1 is vertical at the original state, the direction rotation angle (α) is zero. A positive value (α > 0) denotes that the principal stress direction rotates clockwise, whereas a negative value (α < 0) denotes the principal stress rotates counterclockwise. The rotation angle of σ1 can reflect the degree of the soils relative to the passive state. When α = 90° or α = −90°, the soil is in a completely passive state. The larger the absolute value of α (|α|), the closer the soil is to the passive state, and the constraint effect of the passive zone on the excavation deformations is stronger, and vice versa.

Figure 16.
Direction rotation angle contour of σ1 beneath the excavation’s bottom (shaded part). (a) B = H; (b) B = 3H; (c) B = 7H.
When B = H (Figure 16a), the |α| of most of the σ1 values beneath the excavation bottom is between 70° and 90°. The soil close to the center axis (d = 7.5 m) of the excavation has a large |α|. The soil beneath the excavation’s bottom is close to a completely passive state. The passive zone soil has a strong constraint effect on excavation deformations. When B = 3H (Figure 16b), the |α| within 7 m near the bottom is larger than 80°. As the depth and the distance from the retaining wall increases, |α| decreases gradually. In this case, the passive zone of the left and right sides is still overlapped. The constraint effect of the passive zone on excavation deformation is weaker than that of B = H. When B = 7H (Figure 16c), the rotation of σ1 mainly occurs within 45 m from the retaining wall. The direction rotation angle decreases rapidly with the depth and the distance from the retaining wall increases. When the distance between the soil and retaining wall is greater than 45 m, the |α| is close to zero. This indicates that the direction of σ1 is close to the vertical direction. In this case, the passive zone of the left and right sides beneath the excavation’s bottom no longer overlaps with the other. The constraint effect of the passive zone on excavation deformations is further reduced.
4.6. Relative Shear Stress
Figure 17 illustrates the variations in the soil relative shear stress (τrel) behind the retaining wall with different excavation widths. The τrel can reflect the proximity of the stress point to the failure envelope, and is defined by Equation (1) [33]:
where τmob is the maximum value of the shear stress at the current stress state (half the maximum principal stress difference), τmax is the maximum value of the shear stress for the case where the Mohr’s circle is expanded to touch the Coulomb failure envelope while keeping the center of Mohr’s circle constant.
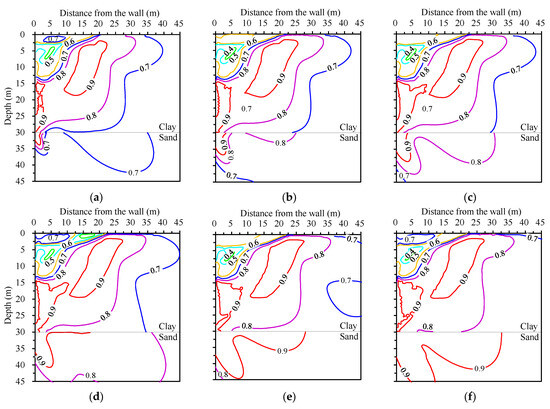
Figure 17.
The relative shear stress of the soil behind retaining wall under different excavation widths. (a) B = 1H; (b) B = 2H; (c) B = 3H; (d) B = 4H; (e) B = 6H; (f) B = 8H.
When B ≤ 3H, the region of τrel = 0.9 in the clay layer close to the retaining wall gradually increases with the excavation width. Meanwhile, the region of τrel = 0.9 in the sand layer is small, and τrel for most of the sand ranges from 0.7 to 0.9. When B ≥ 4H, the region of τrel = 0.9 and τrel = 0.8 of the clay gradually stabilizes, and the region of τrel = 0.7 of the clay and the region of τrel = 0.9 of the sand gradually expand.
The relative shear stress zone enclosed by the horizontal axes, the vertical axes, and the contour of τrel = 0.8 for clay varies less with the excavation width. Outside this zone, τrel changes significantly with the excavation width. This phenomenon indicates that the variation in the excavation width has less influence on the τrel of the soils that are near the excavation, but has a significant effect on the τrel of the soils that far away from the excavation. The gradual increase in the relative shear stress in the distant and deep soils makes excavation deformations increase slightly. This may be the reason why the deformations still slightly increase after the excavation width becomes larger than 7H.
5. Conclusions
Based on the results of 40 two-dimensional numerical models, the influence and mechanism of the excavation width on the horizontal displacements of the retaining walls, ground surface settlements and soil internal displacements were analyzed. The following conclusions may be drawn:
- (1)
- The variation in the excavation width significantly impacts excavation deformations. The horizontal displacements of the retaining walls, ground surface settlements and maximum unloading influence depth increase with the increasing excavation width, but the increasing rate gradually reduces. When B ≤ 4H, the excavation width significantly affects the excavation deformations. When B > 4H, the impact of the excavation width on the deformations gradually decreases. Smaller excavation widths correlate with greater influences on deformations.
- (2)
- The overlap of the passive zone beneath the excavation’s bottom gradually decreases as the excavation width increases. The larger the overlapped area of the passive zone, the stronger the restraint effect is on the retaining wall and the smaller the deformations induced by excavation are.
- (3)
- When the excavation width is small, the major principal stress direction of basal soils tends to be closer to horizontal, and the soil states are closer to the passive state. Hence, the constraint ability of the passive zone on excavation deformations strengthens. With increasing excavation width, the depth and direction rotation of the major principal stress gradually decrease. Consequently, the constraint ability of the passive zone on excavation deformations is further reduced.
- (4)
- As the excavation width increases, the relative shear stress of the soils near the excavation gradually stabilizes, and the relative shear stress of the distant and deep soils gradually expands. Therefore, the deformations attributed to excavation slowly increase, especially after an excavation width larger than 7H.
Author Contributions
Conceptualization, P.H.; methodology, P.H.; software, P.H. and H.S.; validation, K.D. and H.S.; formal analysis, K.D. and K.Y.; investigation, J.W.; writing—original draft preparation, P.H. and K.D.; writing—review and editing, P.H.; visualization, K.Y. and J.W.; supervision, P.H.; funding acquisition, P.H. All authors have read and agreed to the published version of the manuscript.
Funding
The author would like to acknowledge the financial support provided by the National Natural Science Foundation of China (Grant No. 51608042), and the Fundamental Research Funds for the Central Universities (Grant No. 300102281203 and 300102288103).
Data Availability Statement
The data reported in the present study are available on reasonable request from the corresponding author.
Conflicts of Interest
Author Haili Shi was employed by the company China United Northwest Institute for Engineering Design & Research Co., Ltd. Author Kun Yang was employed by the company Yunnan Real Estate Development & Management Group Co., Ltd. The remaining authors declare that the research was conducted in the absence of any commercial or financial relationships that could be construed as a potential conflict of interest.
Nomenclature
| H | The final excavation depth. |
| B | Excavation width. |
| h | Layer thickness. |
| γ | Unit weight. |
| Es1–2 | Compressive modulus of 100~200 kPa corresponding to consolidation test. |
| e | Void ratio. |
| c′ | Effective cohesion. |
| φ′ | Effective internal friction angle (φ′). |
| Secant stiffness in standard drained triaxial test. | |
| Tangent stiffness for primary oedometer loading. | |
| Unloading/reloading stiffness for drained triaxial test. | |
| m | Power for stress level dependency of stiffness. |
| ψ | Dilatancy angle. |
| γ0.7 | Threshold shear strain. |
| Shear modulus specified at the reference mean stress. | |
| K0 | Coefficient of lateral earth pressure at rest. |
| Rf | Failure ratio. |
| pref | Reference stress for stiffness. |
| vu | Poisson’s ratio for unloading-reloading. |
| δhm | The maximum wall deflection. |
| δvm | The maximum ground surface settlements. |
| α | The direction rotation angle of the major principal stress. |
| τrel | The variations in soil relative shear stress. |
| τmob | The maximum value of shear stress at the current stress state (half the maximum principal stress difference). |
| τmax | The maximum value of shear stress for the case where Mohr’s circle is expanded to touch the Coulomb failure envelope while keeping the center of Mohr’s circle constant. |
References
- Wang, J.H.; Xu, Z.H.; Wang, W.D. Wall and ground movements due to deep excavations in Shanghai soft soils. J. Geotech. Geoenviron. Eng. 2010, 136, 985–994. [Google Scholar] [CrossRef]
- Bolton, M.D.; Lam, S.Y.; Vardanega, P.J.; Ng, C.W.W.; Ma, X.F. Ground movements due to deep excavations in Shanghai: Design charts. Front. Struct. Civ. Eng. 2014, 8, 201–236. [Google Scholar] [CrossRef]
- Tan, Y.; Fan, D.; Lu, Y. Statistical analyses on a database of deep excavations in Shanghai soft clays in China from 1995–2018. Pr. Period. Struct. Des. Constr. 2022, 27, 04021067. [Google Scholar] [CrossRef]
- Mana, A.I.; Clough, G.W. Prediction of movements for braced cuts in clay. J. Geotech. Geoenviron. Eng. 1981, 107, 759–777. [Google Scholar] [CrossRef]
- Jia, J.; Xie, X.L. Unloading deformation mechanism of deep-large excavation in Shanghai clay area. J. Shanghai Jiaotong Univ. 2009, 43, 1005–1010. (In Chinese) [Google Scholar]
- Tan, Y.; Wang, D. Characteristics of a large-scale deep foundation pit excavated by the central-island technique in Shanghai soft clay. I: Bottom-up construction of the central cylindrical shaft. J. Geotech. Geoenviron. Eng. 2013, 139, 1875–1893. [Google Scholar] [CrossRef]
- Tan, Y.; Wang, D. Characteristics of a large-scale deep foundation pit excavated by central-island technique in shanghai soft clay. II: Top-down construction of the peripheral rectangular pit. J. Geotech. Geoenviron. Eng. 2013, 139, 1894–1910. [Google Scholar] [CrossRef]
- Xiao, H.; Zhou, S.; Sun, Y. Wall deflection and ground surface settlement due to excavation width and foundation pit classification. Ksce J. Civ. Eng. 2019, 23, 1537–1547. [Google Scholar] [CrossRef]
- Wang, H.X. Influence of excavation width on enclosure-structure stability of foundation pits. China Civ. Eng. J. 2011, 44, 120–126. (In Chinese) [Google Scholar]
- Cheng, K.; Xu, R.; Ying, H.; Gan, X.; Zhang, L.; Liu, S. Observed performance of a 30.2 m deep-large basement excavation in Hangzhou soft clay. Tunn. Undergr. Space Technol. 2021, 111, 103872. [Google Scholar] [CrossRef]
- Jia, J.; Zhai, J.Q.; Li, M.G.; Zhang, L.L.; Xie, X.L. Performance of large-diameter circular diaphragm walls in a deep excavation: Case study of Shanghai Tower. J. Aerosp. Eng. 2019, 32, 04019078. [Google Scholar] [CrossRef]
- Liu, G.; Guo, J.; Li, M.; Qin, T.; Huang, P. Measured behaviors of an oversized irregular basement excavation and its surrounding responses in thick soft clay. Arab. J. Geosci. 2020, 13, 3. [Google Scholar] [CrossRef]
- Liu, Y.; Xiang, B.; Fu, M. Observed performance of a large-scale deep triangular excavation in Shanghai soft clays. Geotech. Geol. Eng. 2019, 37, 2791–2809. [Google Scholar] [CrossRef]
- Tan, Y.; Lu, Y.; Wang, D. Deep excavation of the Gate of the Orient in Suzhou stiff clay: Composite earth retaining systems and dewatering plans. J. Geotech. Geoenviron. Eng. 2018, 144, 05017009. [Google Scholar] [CrossRef]
- Xu, G.; Zhang, J.; Liu, H.; Ren, C. Shanghai center project excavation induced ground surface movements and deformations. Front. Struct. Civ. Eng. 2018, 12, 26–43. [Google Scholar] [CrossRef]
- Ni, X.; Lu, J.; Wang, Y.; Shi, J.; Chen, W.; Tang, L. Field investigation of the influence of basement excavation and dewatering on ground and structure responses. Tunn. Undergr. Space Technol. 2021, 117, 104121. [Google Scholar] [CrossRef]
- Tan, Y.; Li, M. Measured performance of a 26 m deep top-down excavation in downtown Shanghai. Can. Geotech. J. 2011, 48, 704–719. [Google Scholar] [CrossRef]
- Tan, Y.; Wang, D.; Lu, Y.; Fang, T. Excavation of Middle Huai-Hai Road station of Shanghai metro line 13: Challenges, risks, countermeasures and performance assessment. Pract. Pr. Period. Struct. Des. Constr. 2017, 22, 05017003. [Google Scholar] [CrossRef]
- Tan, Y.; Wei, B.; Diao, Y.; Zhou, X. Spatial corner effects of long and narrow multipropped deep excavations in Shanghai soft clay. J. Perform. Constr. Facil. 2014, 28, 04014015. [Google Scholar] [CrossRef]
- Wang, Z.W.; Ng, C.W.W.; Liu, G.B. Characteristics of wall deflections and ground surface settlements in Shanghai. Can. Geotech. J. 2005, 42, 1243–1254. [Google Scholar] [CrossRef]
- Maleki, M.; Khezri, A.; Nosrati, M.; Majdeddin, M.M.H.S. Seismic amplification factor and dynamic response of soil-nailed walls. Model. Earth Syst. Environ. 2023, 9, 1181–1198. [Google Scholar] [CrossRef]
- Maleki, M.; Majdeddin, M.M.H.S. Assessment of the Pseudo-static seismic behavior in the soil nail walls using numerical analysis. Innov. Infrastruct. So. 2022, 7, 1–18. [Google Scholar] [CrossRef]
- Shi, J.; Wei, J.; Ng, C.W.W.; Lu, H.; Ma, S.; Shi, C.; Li, P. Effects of construction sequence of double basement excavations on an existing floating pile. Tunn. Undergr. Space Technol. 2022, 119, 104230. [Google Scholar] [CrossRef]
- Soomro, M.A.; Mangnejo, D.A.; Bhanbhro, R.; Memon, N.A.; Memon, M.A. 3D finite element analysis of pile responses to adjacent excavation in soft clay: Effects of different excavation depths systems relative to a floating pile. Tunn. Undergr. Space Technol. 2019, 86, 138–155. [Google Scholar] [CrossRef]
- Tan, Y.; Jiang, W.Z.; Rui, H.S.; Lu, Y.; Wang, D.L. Forensic geotechnical analyses on the 2009 building-overturning accident in Shanghai, China: Beyond common recognitions. J. Geotech. Geoenviron. Eng. 2020, 146, 05020005. [Google Scholar] [CrossRef]
- Zhang, R.; Goh, A.T.C.; Li, Y.; Hong, L.; Zhang, W. Assessment of apparent earth pressure for braced excavations in anisotropic clay. Acta Geotech. 2021, 16, 1615–1626. [Google Scholar] [CrossRef]
- Zhang, D.M.; Xie, X.C.; Li, Z.L.; Zhang, J. Simplified analysis method for predicting the influence of deep excavation on existing tunnels. Comput. Geotech. 2020, 121, 103477. [Google Scholar] [CrossRef]
- Gu, X.Q.; Wu, R.T.; Liang, F.Y.; Gao, G.Y. On HSS model parameters for Shanghai soils with engineering verification. Rock. Soil. Mech. 2021, 42, 833–845. (In Chinese) [Google Scholar]
- Lim, A.; Ou, C.Y.; Hsieh, P.G. A novel strut-free retaining wall system for deep excavation in soft clay: Numerical study. Acta Geotech. 2020, 15, 1557–1576. [Google Scholar] [CrossRef]
- Benz, T. Small-Strain Stiffness of Soils and Its Numerical Consequences. Ph.D. Thesis, Northwestern University, Evanston, IL, USA, 2007. [Google Scholar]
- Wang, W.D.; Wang, H.R.; Xu, Z.H. Study of parameters of HS-Small model used in numerical analysis of excavations in Shanghai area. Rock. Soil. Mech. 2013, 83, 413–419. (In Chinese) [Google Scholar]
- ECADI; SCG. Technical Code for Excavation Engineering; DG/TJ 08-61-2018; Tongji University Press: Shanghai, China, 2018. (In Chinese) [Google Scholar]
- Brinkgreve, R.B.J.; Kumarswamy, S.; Swolfs, W.M. PLAXIS 3D Tutorial Manual; Plaxis B.V.: Delft, The Netherlands, 2015. [Google Scholar]
- Harahap, S.E.; Ou, C.Y. Finite element analysis of time-dependent behavior in deep excavations. Comput. Geotech. 2020, 119, 103300. [Google Scholar] [CrossRef]
- Liu, S.; Li, H.; Tong, L. Simulation of pile cap contribution to the lateral pile performance due to adjacent excavation. Acta Geotech. 2021, 16, 1895–1907. [Google Scholar] [CrossRef]
- Zhang, W.; Li, Y.; Goh, A.T.C.; Zhang, R. Numerical study of the performance of jet grout piles for braced excavations in soft clay. Comput. Geotech 2020, 124, 103631. [Google Scholar] [CrossRef]
Disclaimer/Publisher’s Note: The statements, opinions and data contained in all publications are solely those of the individual author(s) and contributor(s) and not of MDPI and/or the editor(s). MDPI and/or the editor(s) disclaim responsibility for any injury to people or property resulting from any ideas, methods, instructions or products referred to in the content. |
© 2024 by the authors. Licensee MDPI, Basel, Switzerland. This article is an open access article distributed under the terms and conditions of the Creative Commons Attribution (CC BY) license (https://creativecommons.org/licenses/by/4.0/).