Abstract
To study the eccentric compression mechanical properties of ECC and UHPC filled-in double steel tubular (EUFDST) composite columns, 35 full-scale EUCFDST composite column specimens were designed by ABAQUS software with the slenderness ratio (λ), UHPC cylinder compressive strength (fcu), inner and outer steel tubular strength (fy1, fy2), inner and outer steel tubular thickness (t1, t2), inner and outer steel tubular diameter ratio (Ω), eccentricity (e), and fiber content (γ) as the main parameters. By comparison with the simulation of the existing test, the correctness of the finite element modeling is verified. The parameter analysis of 35 full-scale EUFDST composite columns was carried out to obtain the eccentric load-mid-span deflection curve of the specimens. The failure mechanism, ductility coefficient, and stiffness degradation of the composite columns under different parameters were analyzed, and the section of the composite column was verified to satisfy the plane section assumption. The variation trend of maximum load-bearing capacity and the ductility of composite columns under different parameter conditions was obtained. By introducing the eccentricity correction coefficient and slenderness ratio correction coefficient, the calculation equation of the eccentric maximum load-bearing capacity of EUCFDST composite columns is statistically regressed, which provides a basis for the practical use of these columns.
1. Introduction
With the ongoing advancement in modern building structures, concrete-filled steel tubular composite structures are now being extensively utilized to cater to the requirements of contemporary construction. This composite structure amalgamates the benefits of steel and concrete structures while addressing their respective shortcomings. Concurrently, with the continuous advancement in concrete materials, numerous novel materials have been implemented [1]. Recent concrete materials such as ultra-high-performance concrete [2] and high-ductility cement-based composite (ECC) have been progressively developed and utilized in contemporary building structures by scholars both domestically and internationally [3,4,5,6,7,8,9].
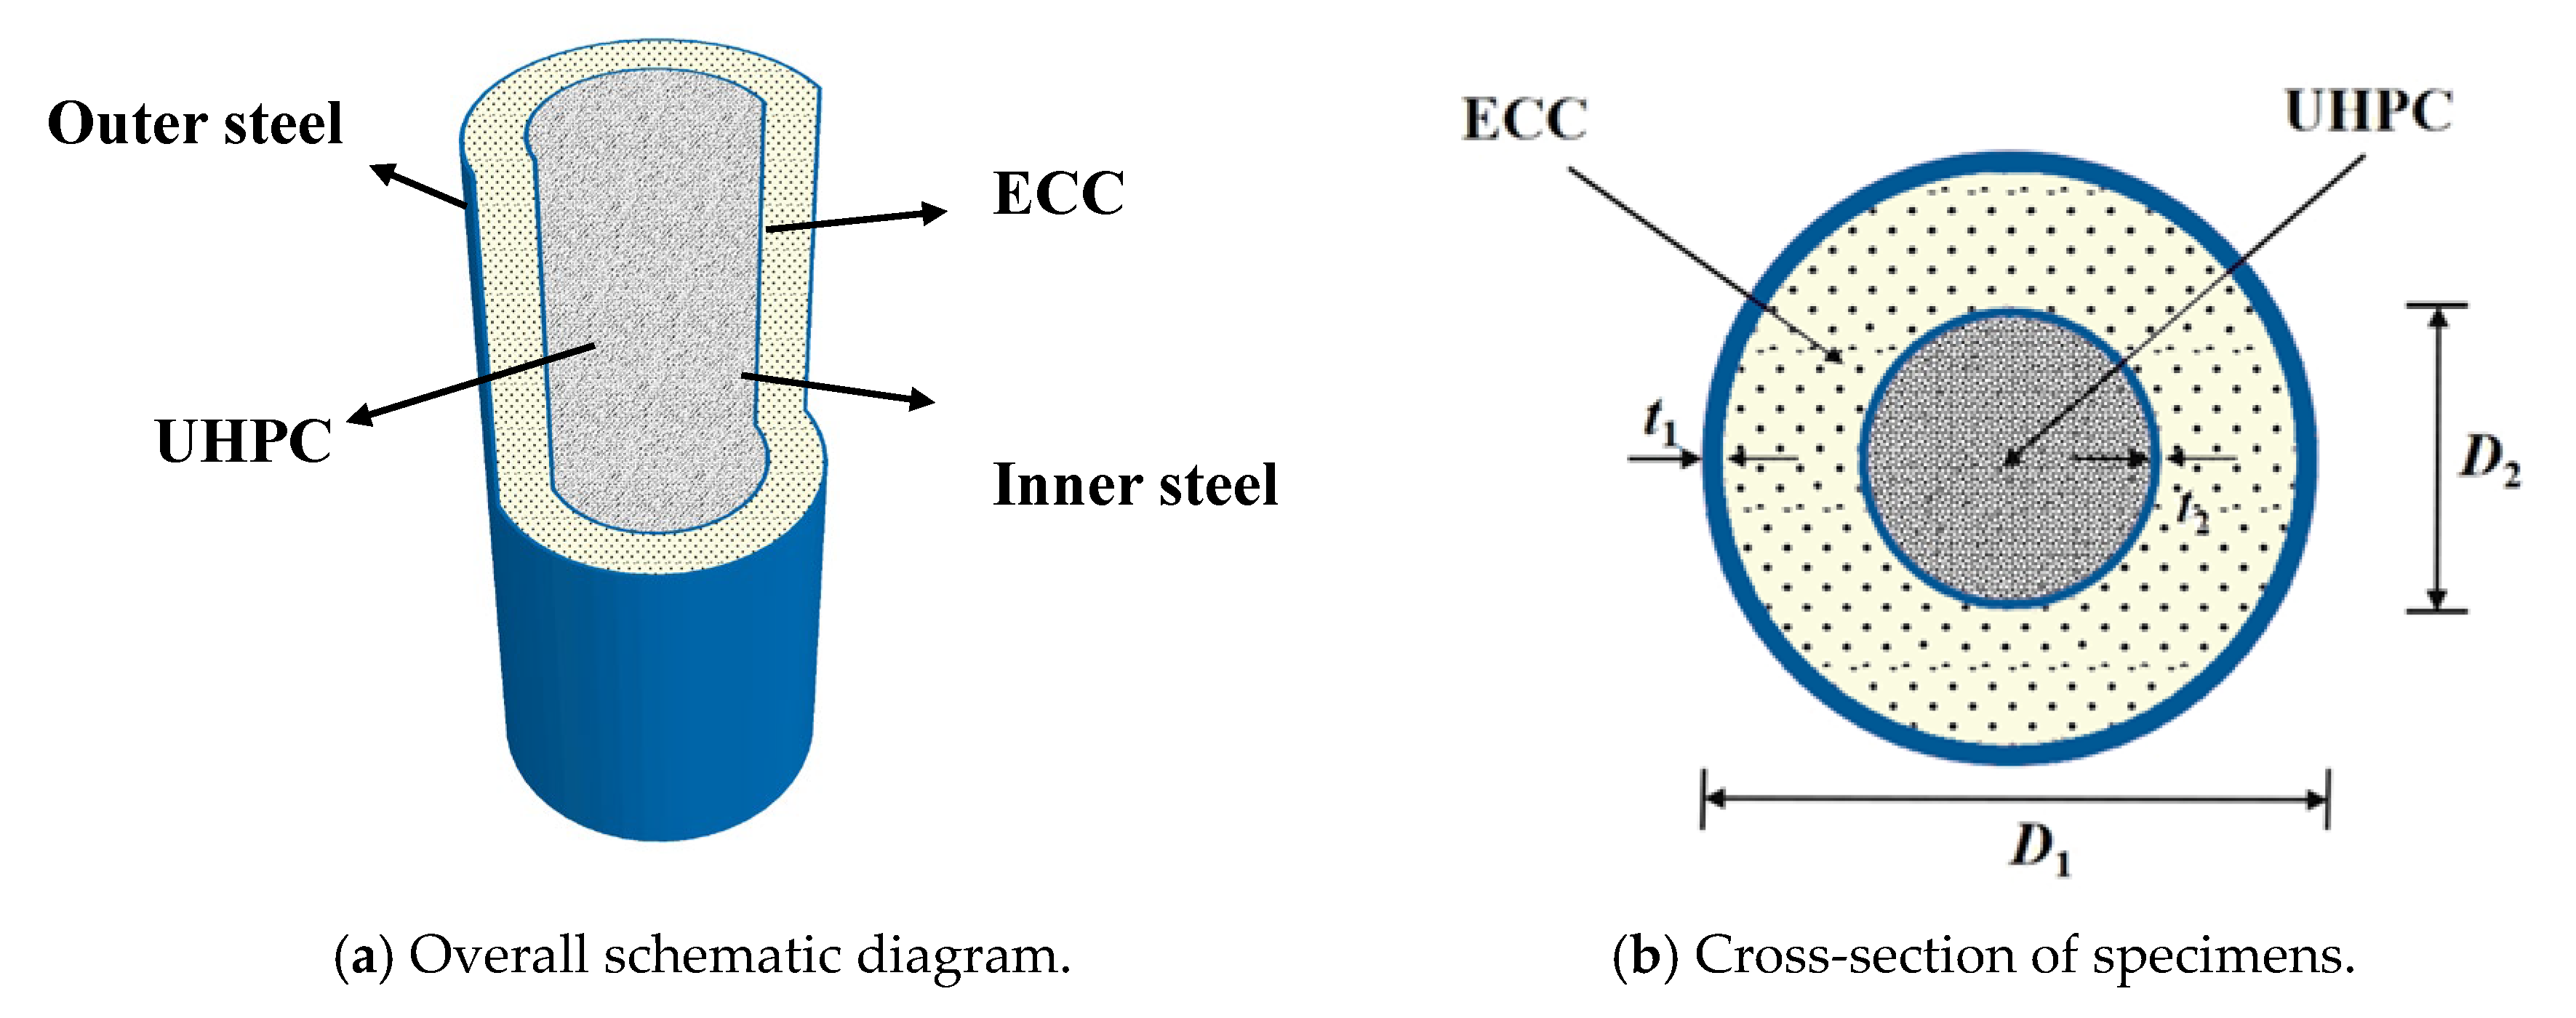
This paper introduces the concept of an ECC and UHPC filled-in double steel tubular (EUFDST) composite column based on the conventional concrete-filled double steel tubular composite structure. The EUFDST column consists of UHPC, ECC, and double steel tubes. The UHPC core enhances the bearing capacity of the column, while the inner steel tube, interlayer ECC, and outer steel tube collectively provide robust support to the UHPC, reducing the risk of rapid strength loss post maximum load-bearing capacity due to its brittleness. Moreover, the interlayer ECC benefits from constraints imposed by the inner and outer steel tubes, resulting in enhanced ultimate stress. The interlayer ECC contributes to the structural bearing capacity and significantly improves the structure’s bending and seismic resistance owing to its high ductility.
Scholars have extensively researched the mechanical properties of constrained concrete members. Ahmed et al. [10] studied concrete-filled double steel tubular short columns (CFDSTs); established a new confining pressure model; verified the influence of the diameter–thickness ratio of inner and outer steel tubes, steel strength, and concrete strength on CFDST columns; and deduced the bearing capacity equation of CFDST columns under axial compression load. The same year, Ahmed [11] studied the eccentric compression performance of square thin-walled CFDST columns. The actual ultimate strength and stress–strain curves were obtained by taking the section size, the diameter–thickness ratio of the inner and outer steel tubes, and the eccentricity as the investigation parameters. The constraint effect of the inner steel tube on the core concrete and the influence of the outer steel tube on the post-local buckling are clarified. Ci et al. [12] studied the axial compression performance of circular double concrete-filled steel tubular short columns. Taking the diameter and thickness of the inner and outer steel tubes, concrete strength, and diameter ratio as the investigation parameters, compared with traditional concrete-filled steel tubular columns, the new column has better structural performance. Hu et al. [13] conducted experimental and numerical studies on the compression performance of 16 UHPC-filled rectangular high-strength steel tubular (UFHST) short columns under eccentric load. The results indicated that using high-strength steel tubes and steel fiber-free UHPC significantly improved the bearing capacity of concrete-filled steel tubular columns. However, fiber-free UHPC was found to reduce ductility and increase brittleness. On the other hand, including steel fiber in UHPC during casting enhanced the ductility of the composite column and provided additional bearing capacity. Cai et al. [14] conducted a finite element study on the eccentric compression mechanical properties of reinforced ECC concrete composite columns, investigating the impact of various parameters on these properties and failure mechanisms. The findings highlighted that eccentricity significantly affected the maximum load-bearing capacity of the composite column, with higher eccentricity leading to a lower maximum load-bearing capacity. Based on the finite element results, an equation for the bearing capacity of this type of composite column was proposed. Chai et al. [15] conducted an experimental study on the tensile mechanical properties of hybrid fiber cement-based composites. The results indicate that the tensile properties of composites doped with both steel fiber and PVA fiber are significantly enhanced compared to those doped with PVA fiber alone. Including steel fiber materials notably improves the composites’ peak tensile and cracking stress.
There is a lack of research on the mechanical properties of full-scale EUFDST composite columns. To address this lack, finite element models of the EUFDST composite columns are developed by ABAQUS, considering ECC and UHPC constitutive models, along with a simplified bilinear constitutive model of steel. The eccentric compression behavior of the composite columns has been systematically analyzed. The load–displacement curves and failure modes of the specimens subjected to eccentric compression have been determined. Ultimately, a statistical regression method has been utilized to derive an eccentric compression capacity formula for the ECC and UHPC filled-in double steel tubular composite columns.
2. Analysis Process of the Paper
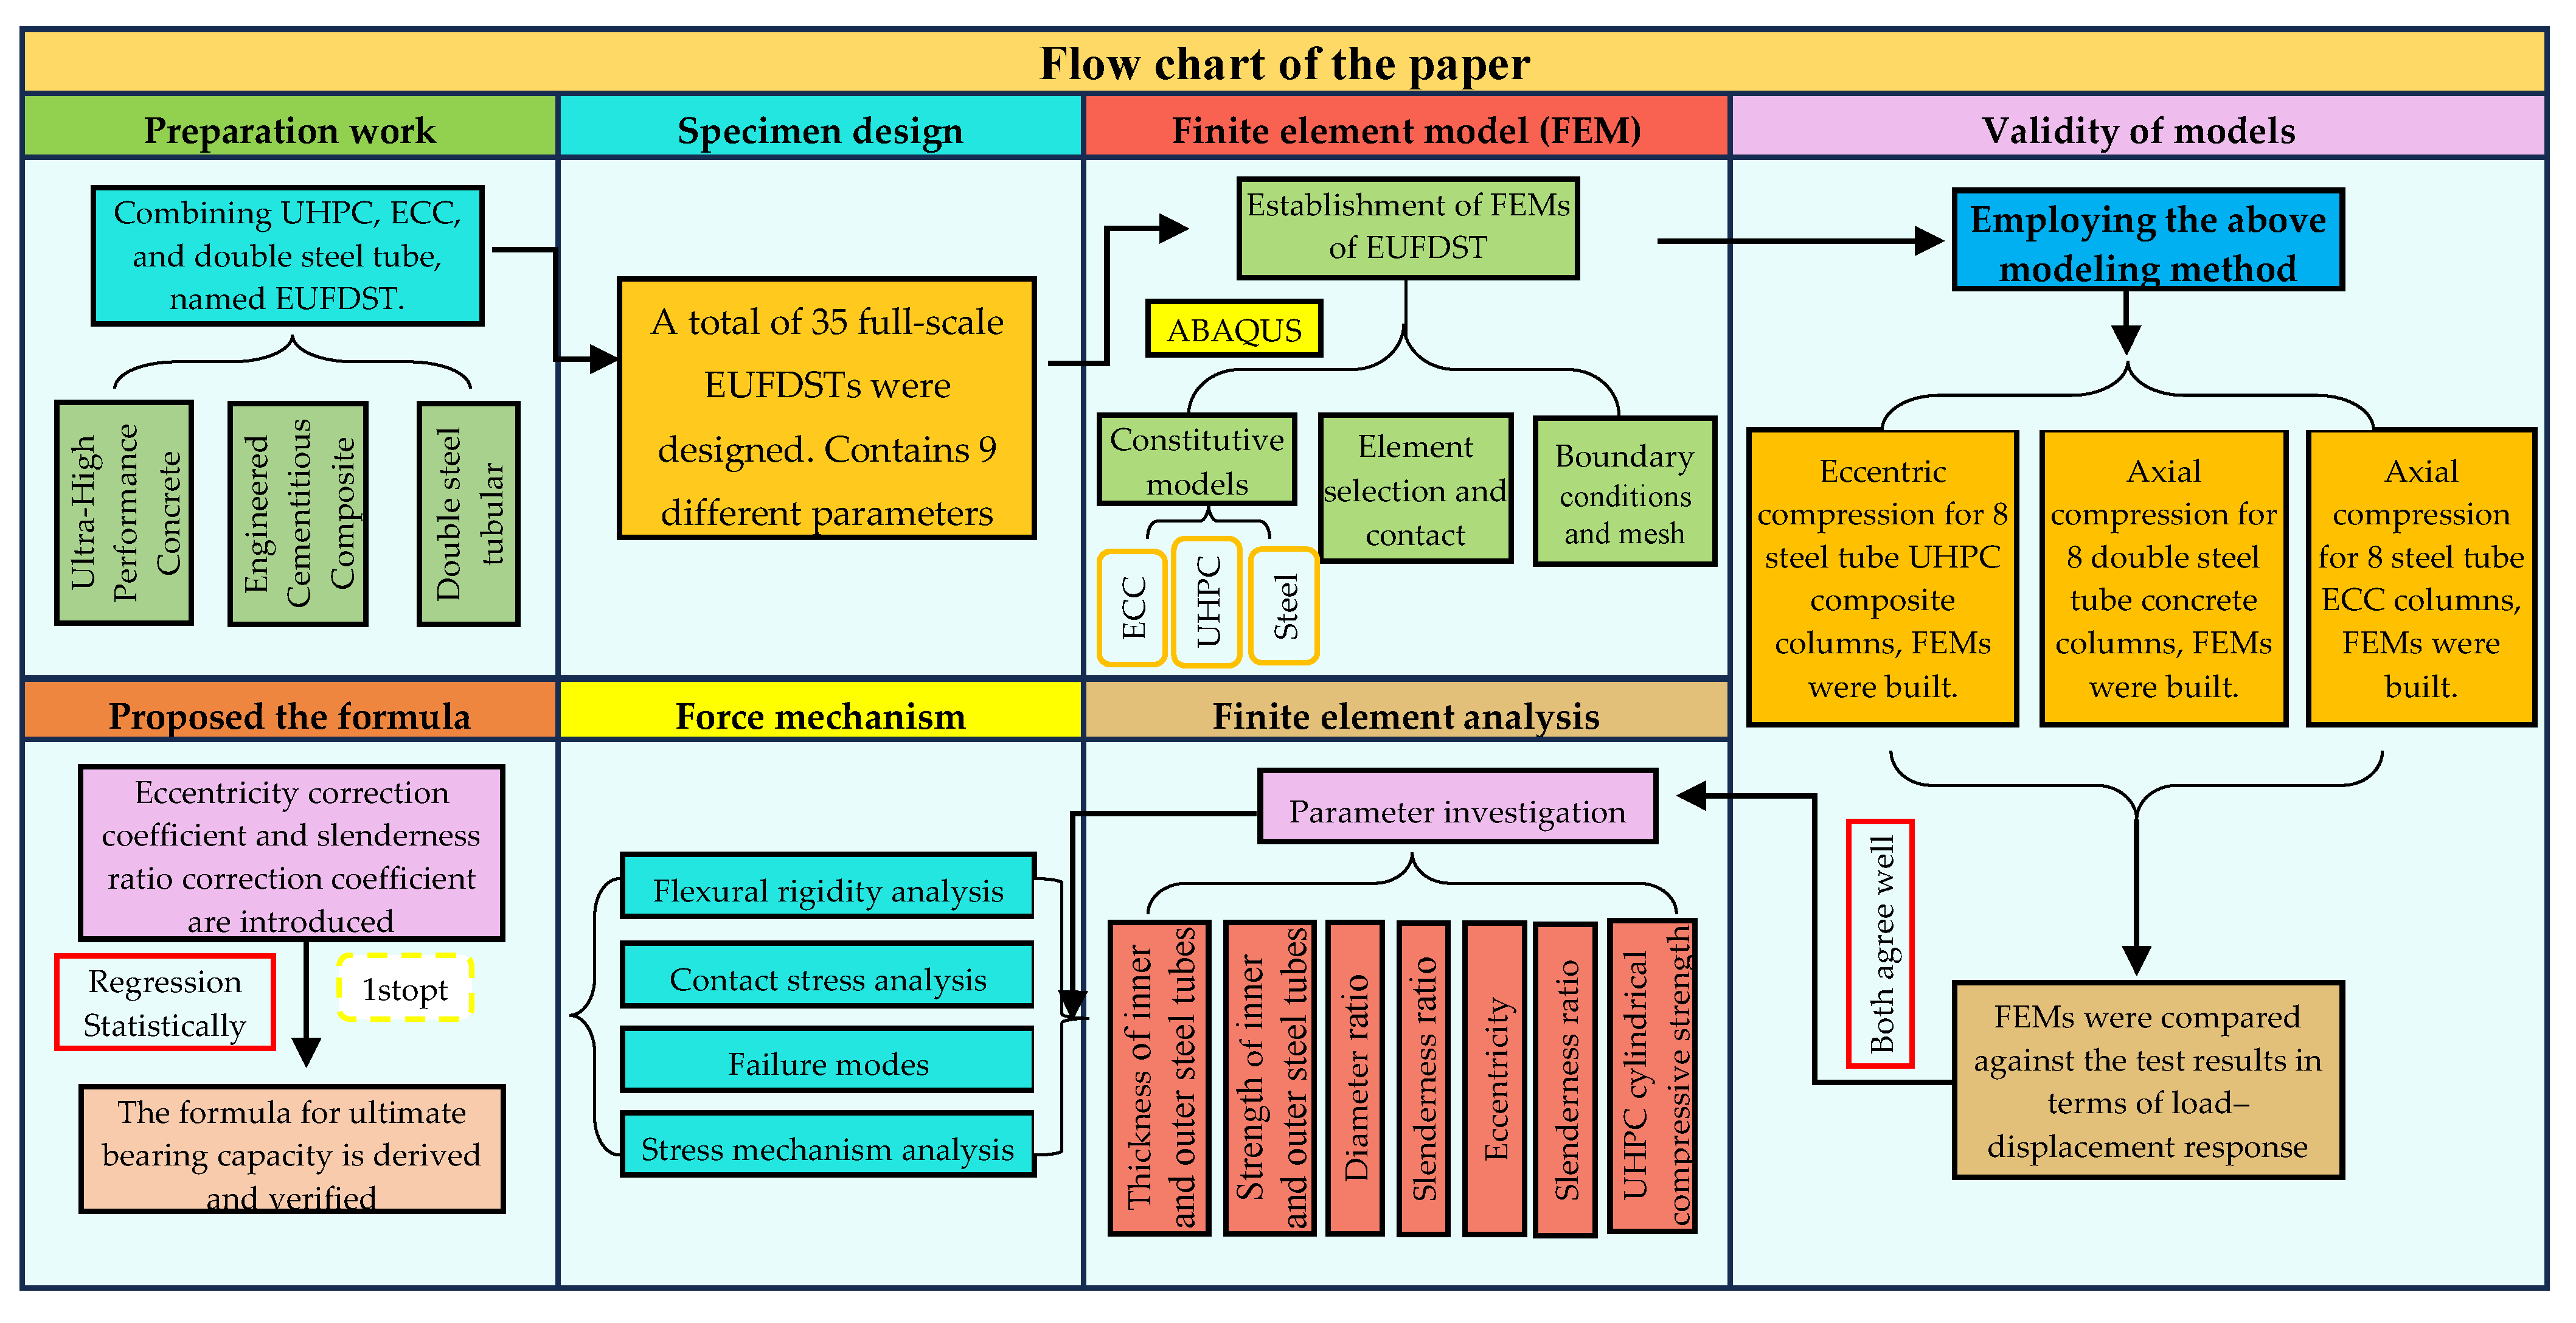
The analysis process of this paper mainly includes the design of the specimen, the establishment of the FEM, the rationality verification of the FEM, the analysis of the extended parameters, the analysis of the stress mechanism, and the establishment of the calculation equation of the maximum load-bearing capacity of the eccentric compression. The detailed flow chart of the paper is depicted in Figure 1.
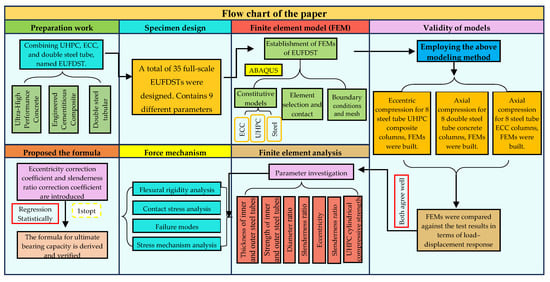
Figure 1.
The flow chart of the paper.
3. Specimen Design
To study the mechanical properties of EUFDST composite columns under eccentric compression, this paper refers to the research on concrete-filled double steel tubular columns by Ci et al. [16]. The research shows that the thickness of the steel tubes, the strength of the concrete, and the strength of the steel affect the performance of concrete-filled double steel tubular columns. At the same time, the ultimate strength of concrete-filled double steel tubular short columns is also affected by load eccentricity. When the slenderness ratio is limited to 4, the influence of overall buckling can be prevented.
In this paper, a total of 35 EUFDST composite columns were designed, taking the strength of the inner and outer steel tubes (fy1, fy2), thickness of the inner and outer steel tubes (t1, t2), compressive strength of the UHPC cylinders (fcu), content of PVA (γ), diameter ratio of the inner and outer steel tubes (Ω), slenderness ratio (λ), and eccentricity (e) as the main parameters. The specific parameters of the specimens are depicted in Table 1, and the cross-section diagram of the specimens is depicted in Figure 2, among λ = L/D1.

Table 1.
The specific sizes and main variables of the EUFDST composite columns.
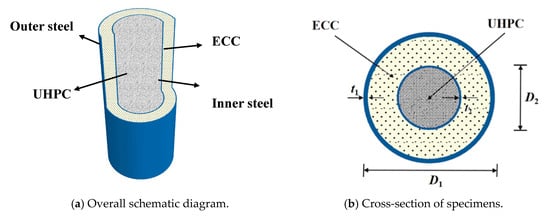
Figure 2.
The sketch of the EUFDST composite columns.
4. Finite Element Model (FEM)
4.1. Constitutive Model of Materials
4.1.1. Concrete and Steel Tubes
The steel constitutive model adopts the double-line elastic-plastic constitutive model, which takes stress hardening into consideration.
There are many constitutive models of constrained concrete, such as L.H. Han [17], Z. Tao [18], J.G. Teng [19], J.B. Mander [20], M. Pagoulatou [21], etc. Different constitutive models of constrained concrete are given.
Despite the considerable variations in the constitutive models for different types of confined concrete, the strength variation of confined concrete subjected to an eccentric compression load is minimal [22]. Moreover, these diverse constitutive models have a negligible impact on the behavior of concrete-filled steel tubular (CFST) columns under eccentric compression loads [23]. In this paper, the constitutive model of confined concrete given by Tao Zhong [18] is selected as the constitutive model of the core concrete of composite columns. The concrete damage plasticity model is selected in the ABAQUS finite element analysis process.
4.1.2. Constrained ECC Constitutive Model
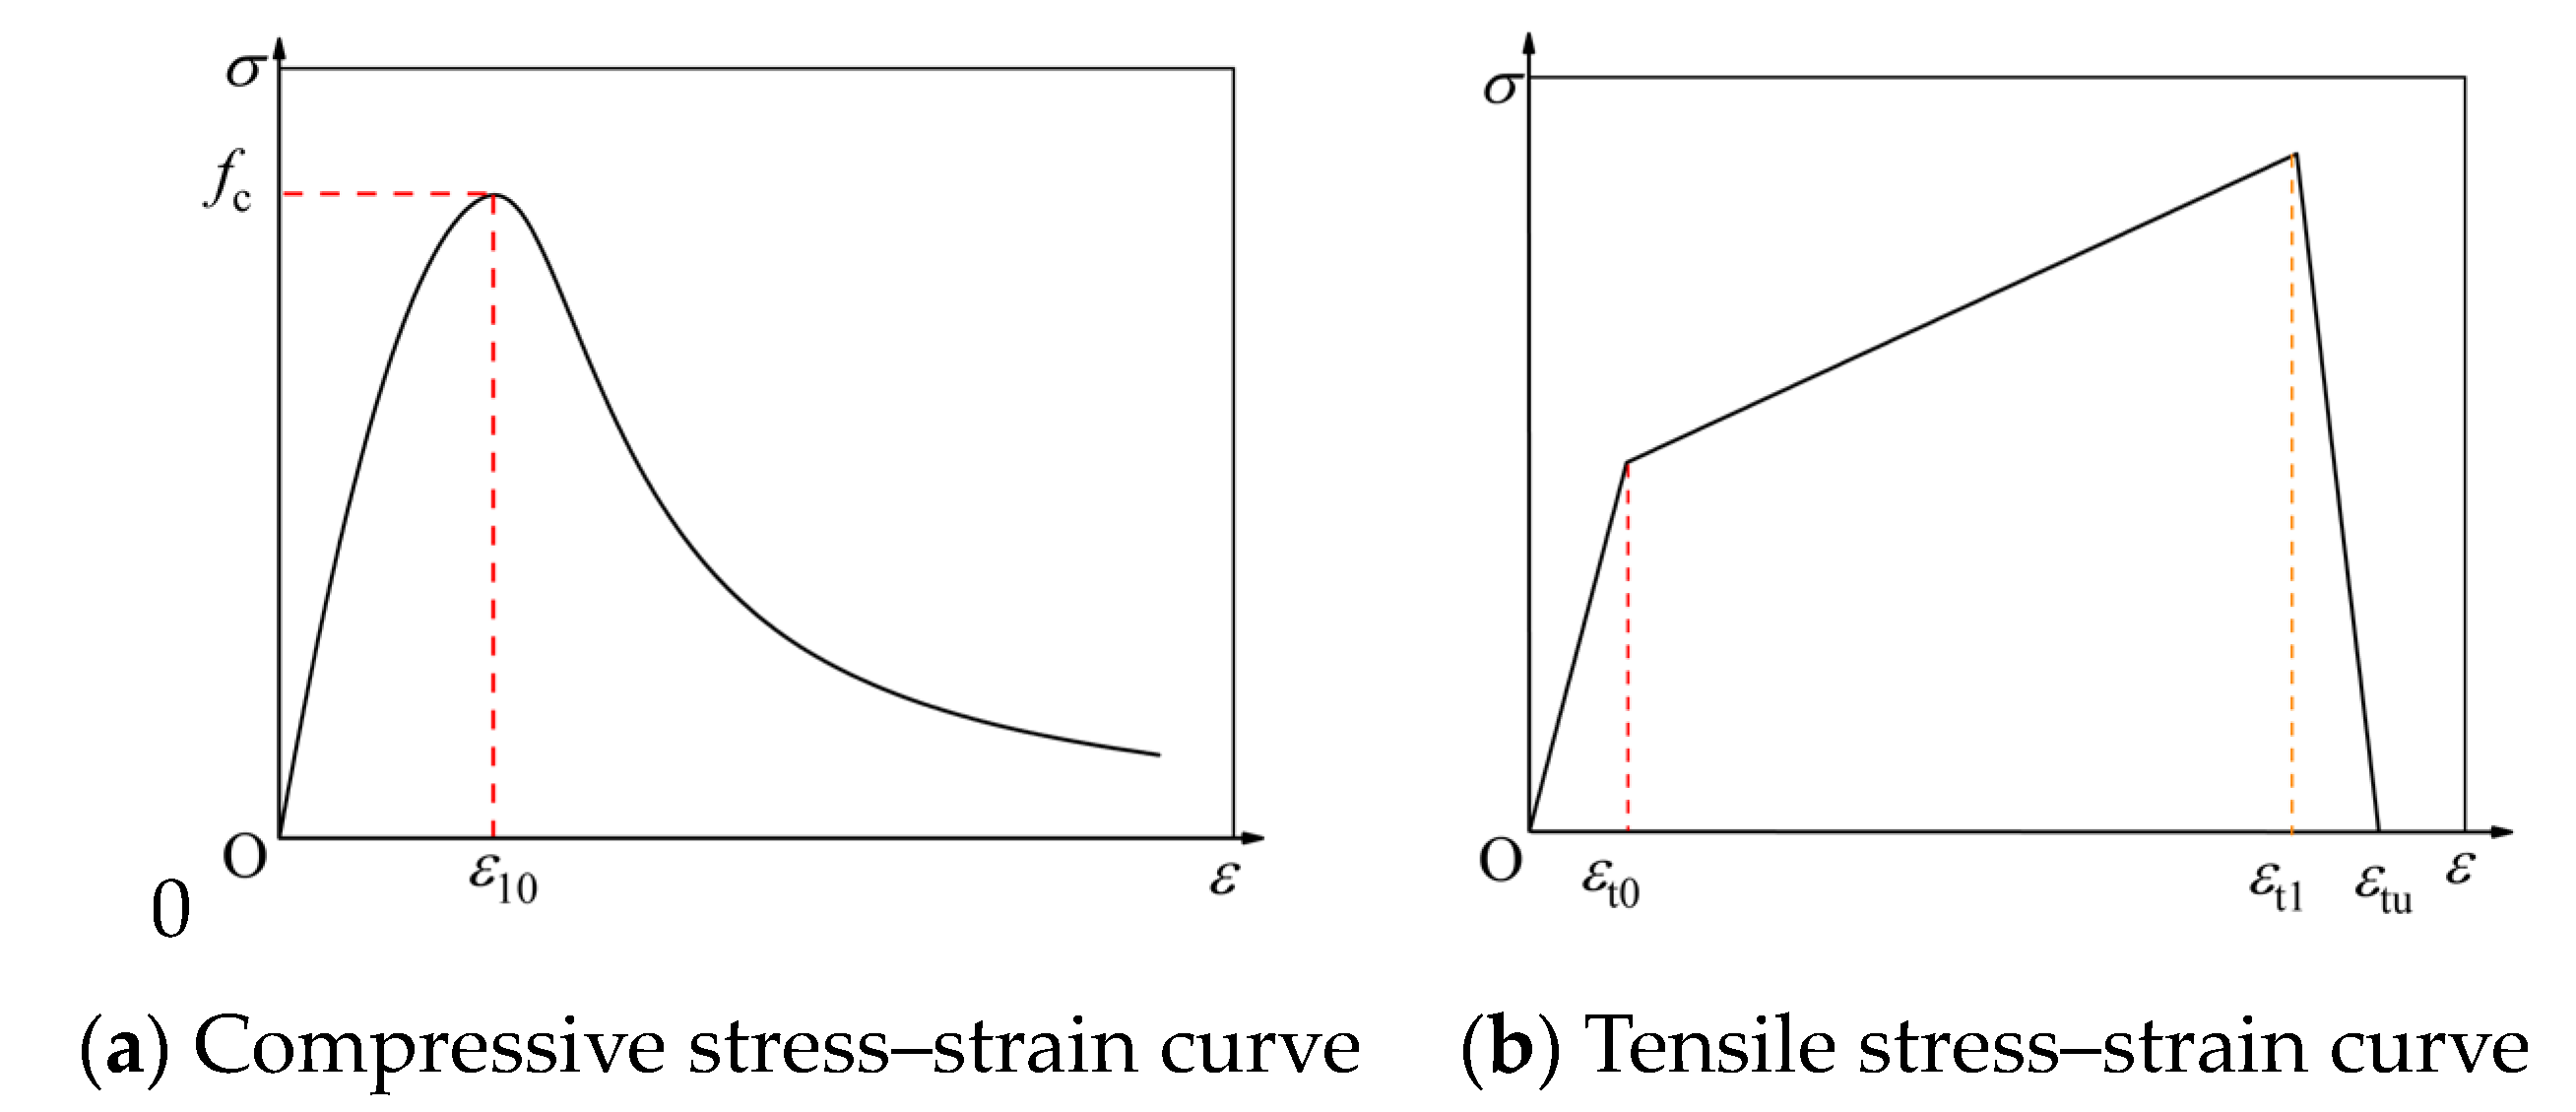
There is no relational literature to propose the constitutive model of steel tubular-constrained ECC, according to the triaxial compression, and the lateral pressure of concrete restricts the lateral deformation of concrete after compression and inhibits the generation and development of vertical cracks in concrete, which is similar to the constraint law of concrete-filled steel tubes, so the constitutive model of ECC under triaxial confining pressure proposed by Y. Li [24] is adopted in this paper. The confining pressure stress in the model is transformed by the strength of the steel tube, the thickness of the steel tube, and the diameter of the steel tube. The constitutive model of the steel tubular-constrained ECC is obtained. The expression is depicted in Equation (1), and the constitutive model curve is depicted in Figure 3a:
where,,,,,.
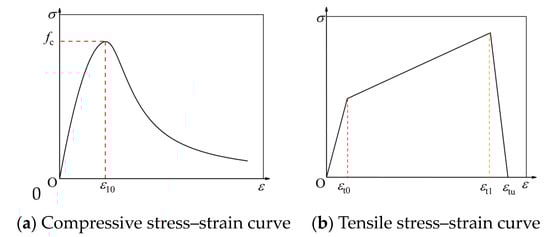
Figure 3.
ECC constitutive model.
Among them, E0 is the initial tangent modulus of constrained ECC, EC is the secant modulus of constrained ECC at the peak stress point, ε0 is the peak compressive strain of ECC concrete under peak compressive stress without constraints, t is the thickness of the steel tube, fy is the yield strength of the steel tube, and fc is the design value of ECC axial compressive strength.
The above constitutive model can only provide the strength and deformation characteristics of concrete under compression, but the steel tubular constraint has little effect on the tensile stress–strain relationship of concrete. Y.K. Wang [25] proposed a three-fold constitutive model, which is adopted as the ECC tensile constitutive model in this paper. The expression is depicted in Equation (2), and Figure 3b shows the constitutive model curve.
4.2. Establishment of the Finite Element Model
4.2.1. Boundary Conditions and Contact Definitions
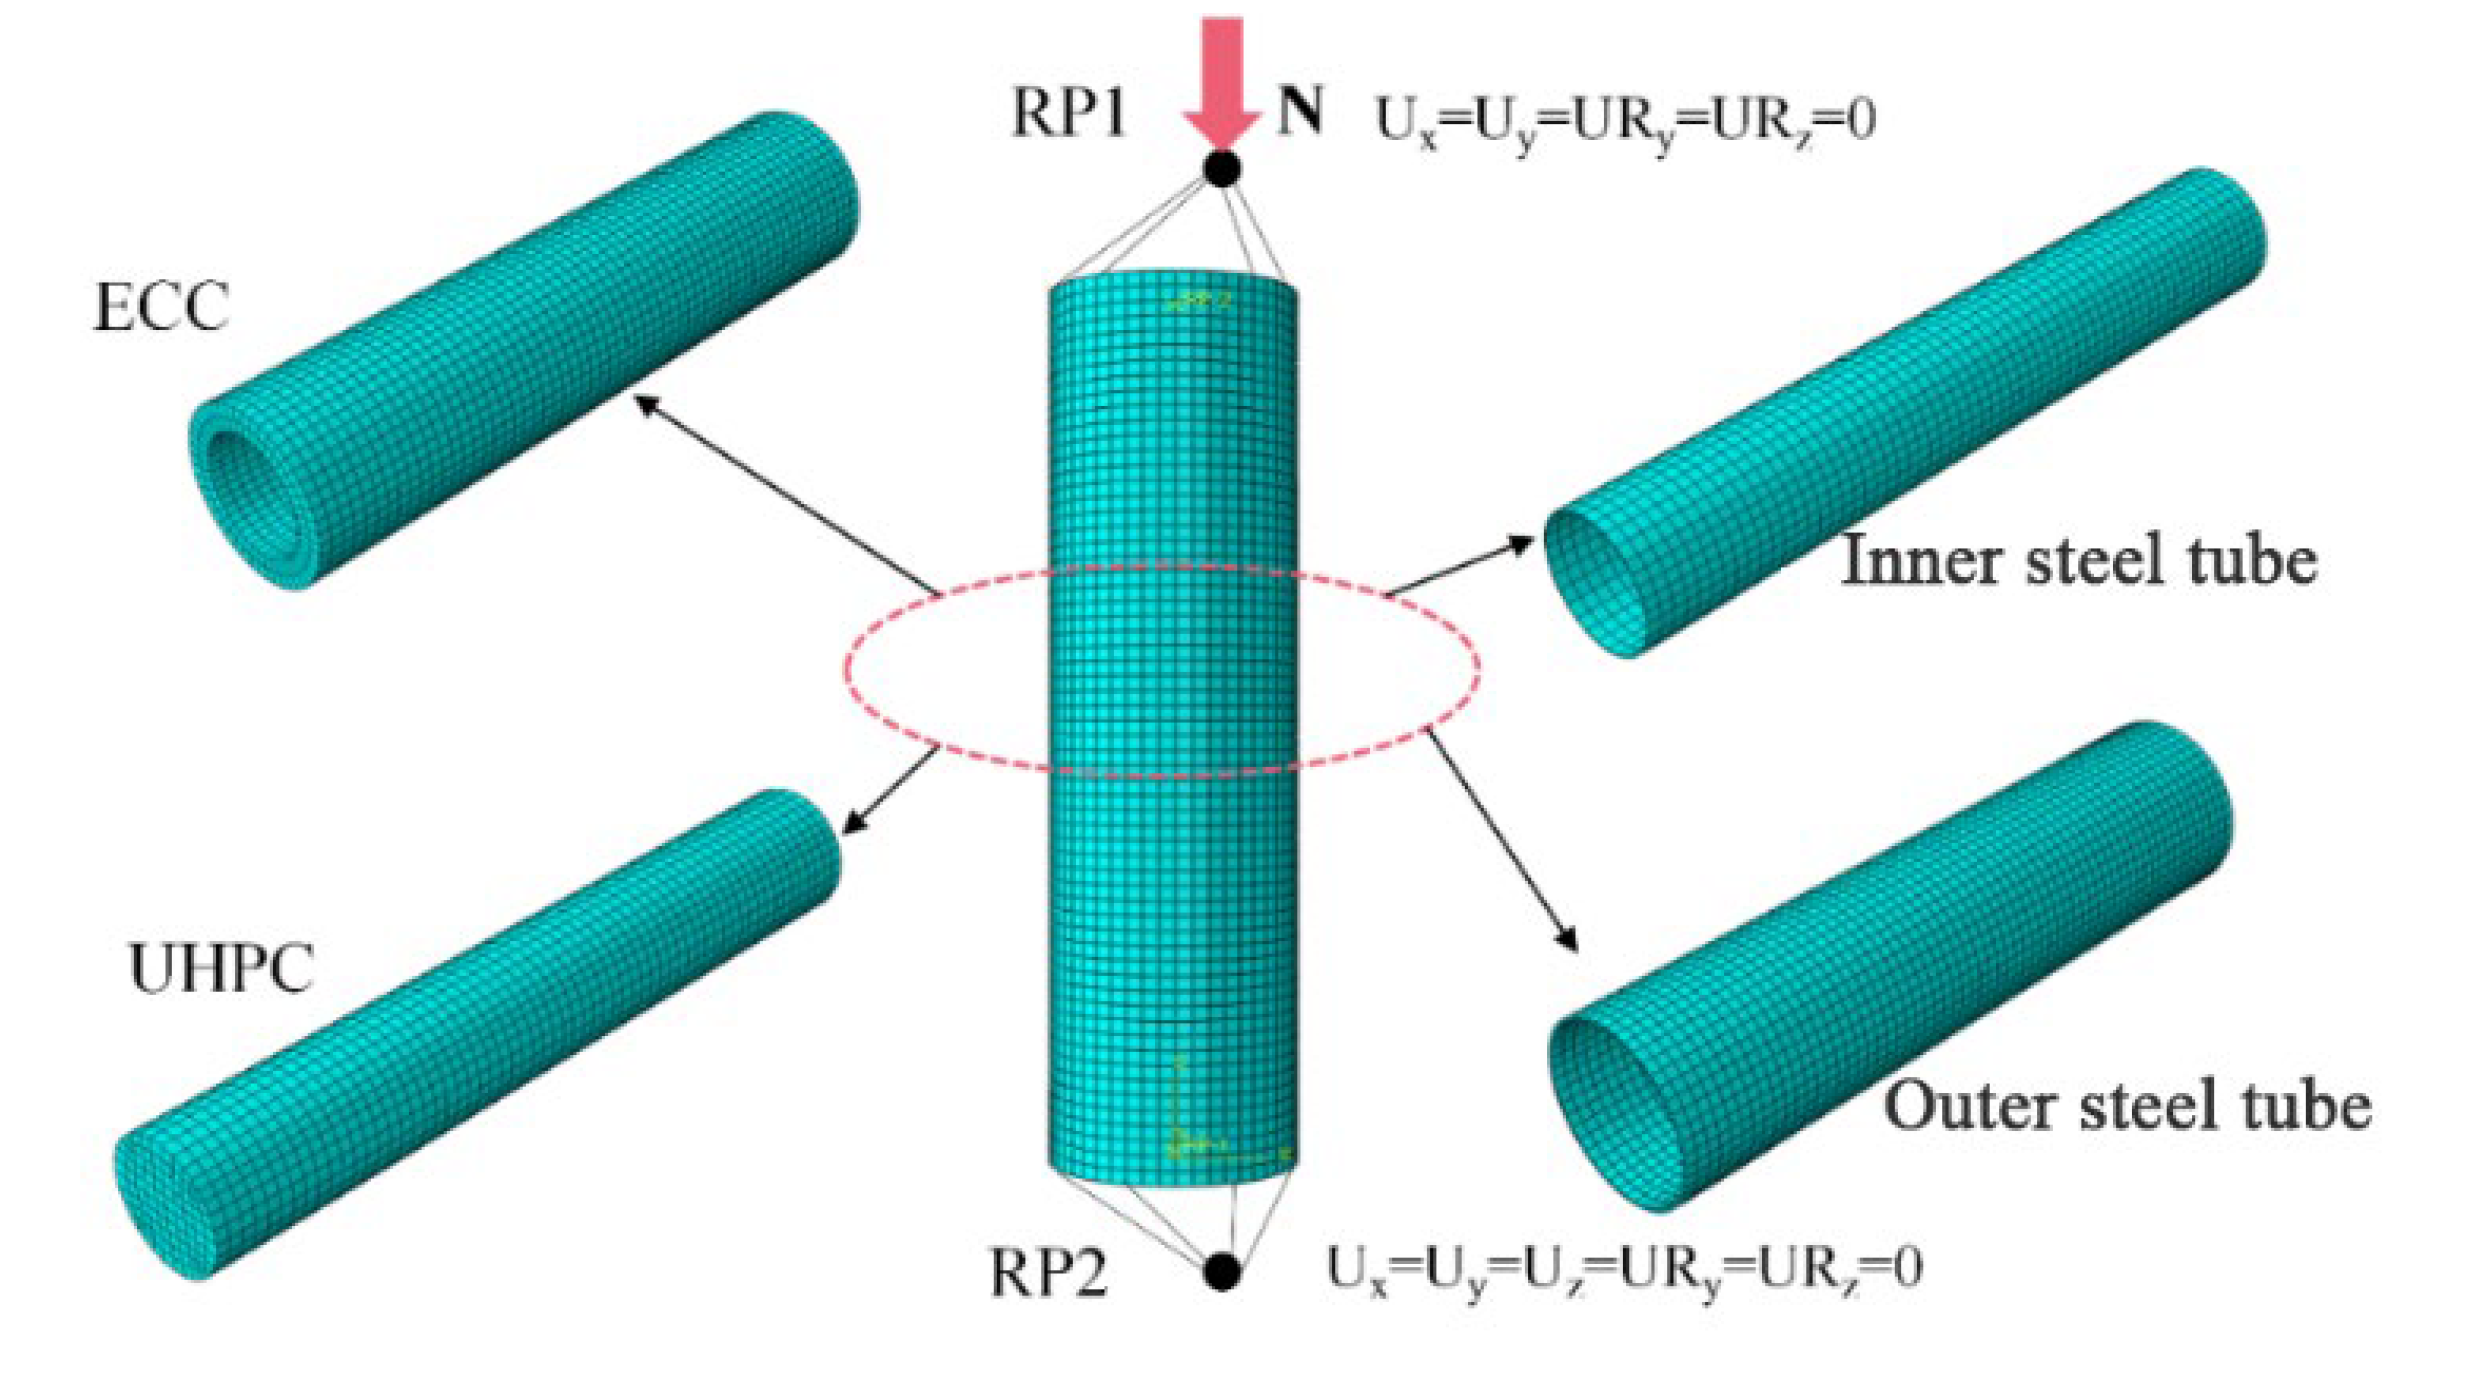
This paper uses the finite element analysis software ABAQUS to establish the finite element model of full-scale EUFDST composite columns under eccentric load. Each component of the EUFDST composite column adopts an eight-node three-dimensional solid element (C3D8R). The reference points RP-1 and RP-2 are set at the specimen’s upper and lower ends, and the two points are coupled with the upper and lower ends of the specimen, respectively. The displacement load is set at RP-1, Ux = Uy = URy = URz = 0 is used to constrain the degree of freedom of RP-1, and Ux = Uy = Uz = URy = URz = 0 is used to constrain the degree of freedom of RP-2. The same rotational displacement constraint is set at two points to simulate the hinged situation at both ends. Hexahedral elements are used to mesh the finite element model in this paper, and the grid and boundary conditions are depicted in Figure 4. The contact between the steel tube and the concrete is defined as the hard contact in the normal direction, and the tangent direction is defined as the penalty function, taking 0.6.

Figure 4.
The FE models for the 35 EUFDST composite columns under eccentric load.
4.2.2. Mesh Subdivision
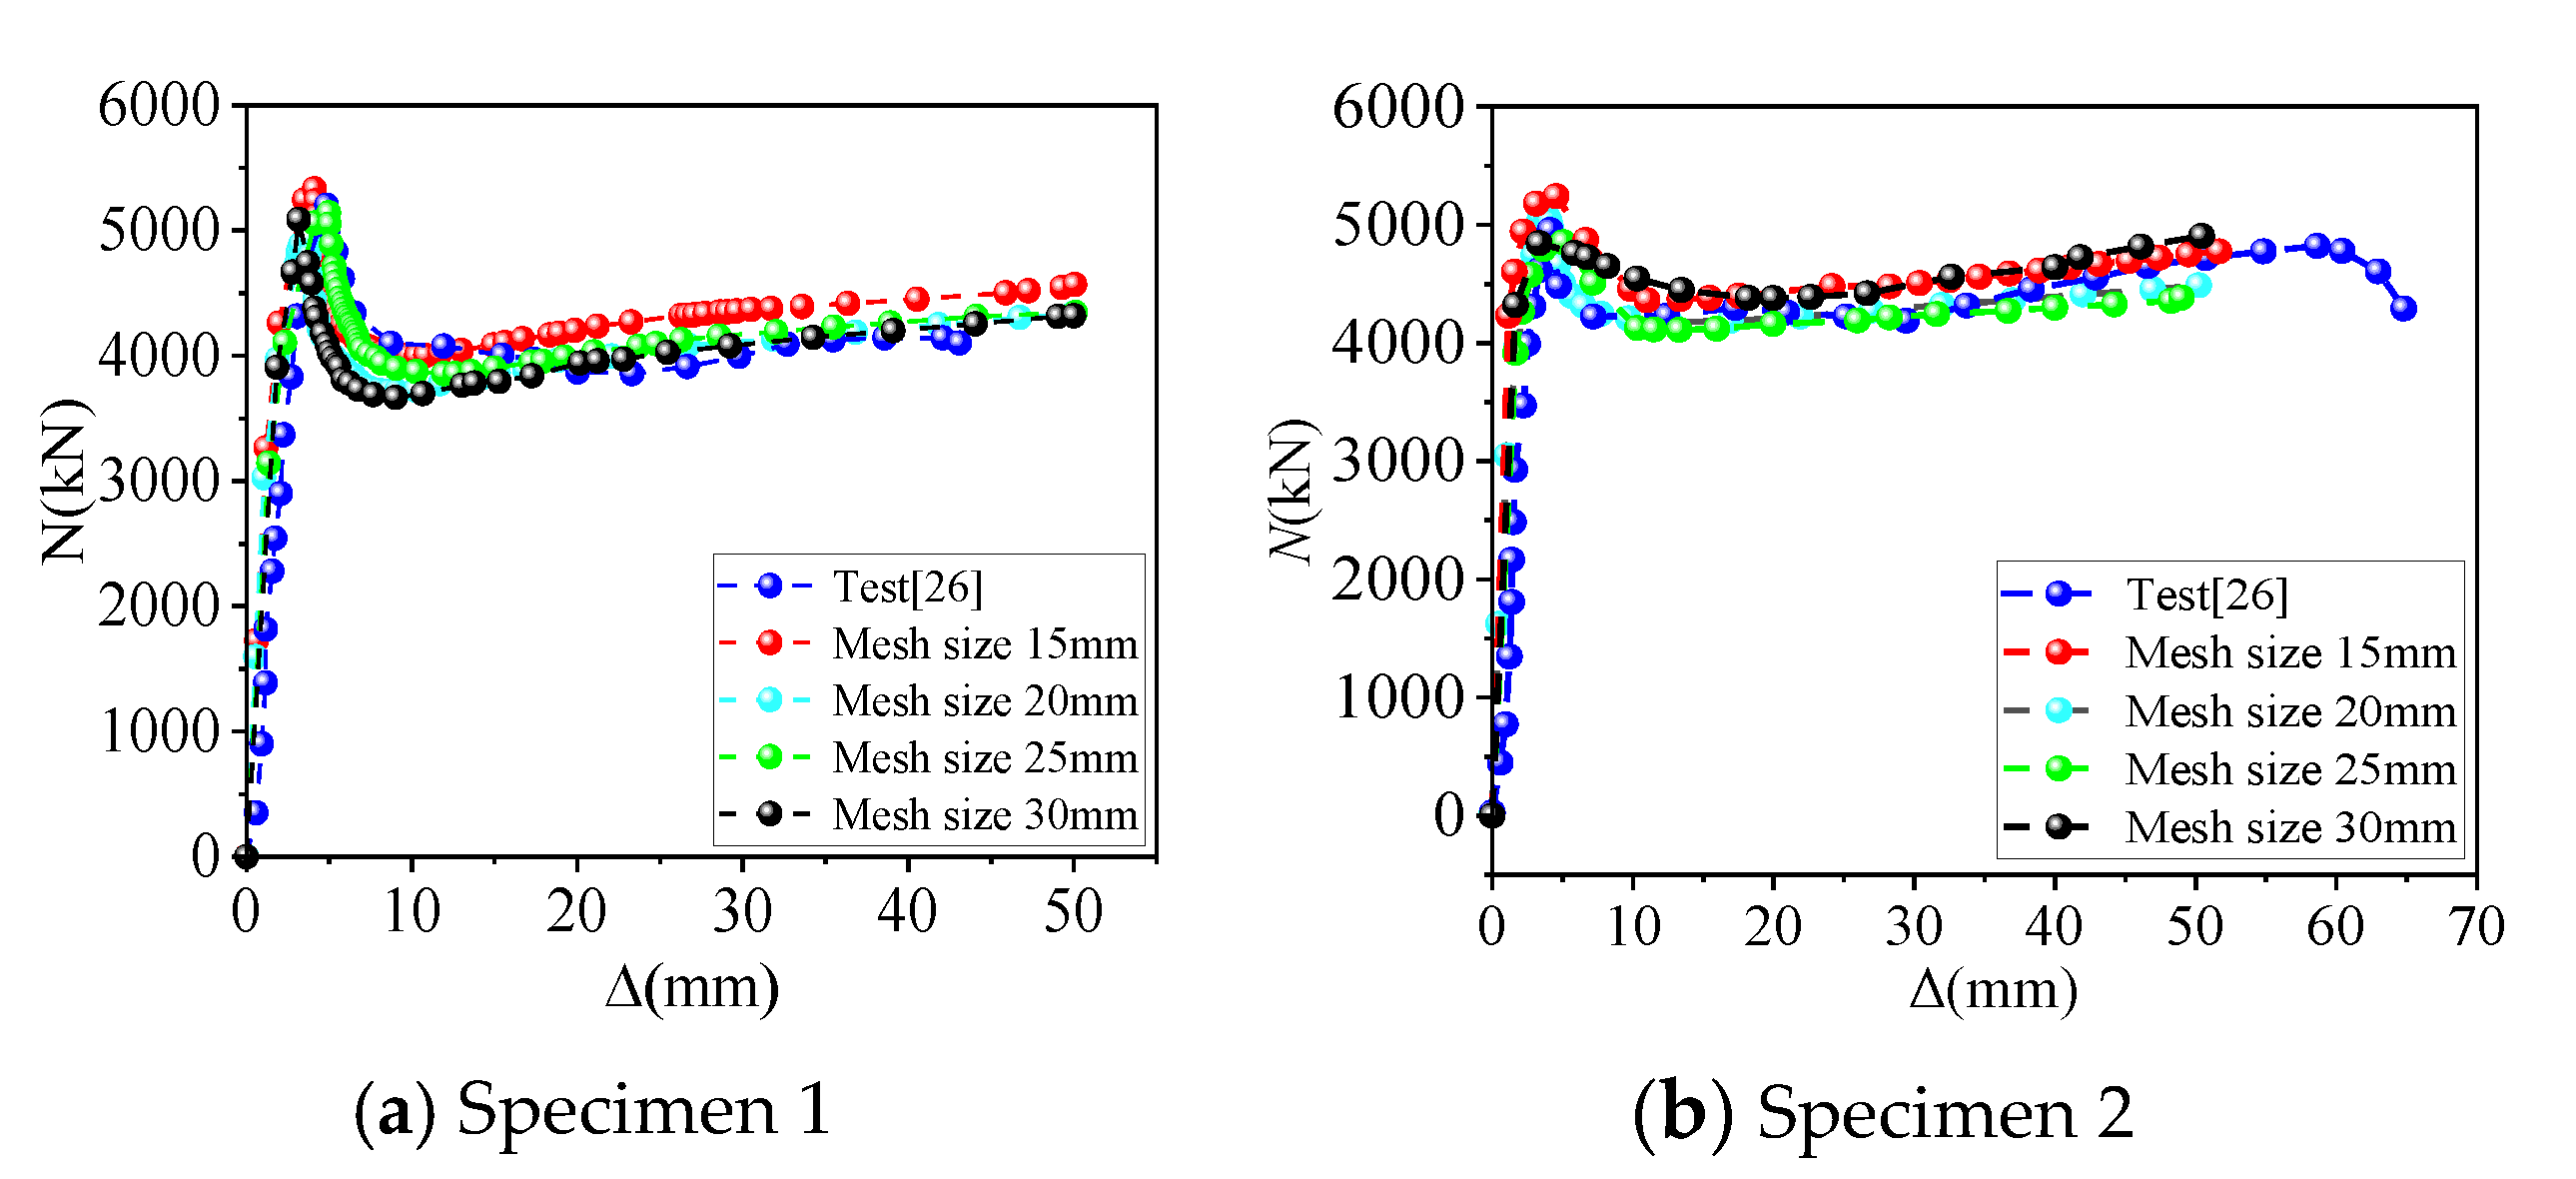
In this paper, the mapping method is used to realize the element decomposition of the model through the grid. The mesh shape is mainly a hexahedron. To ensure the calculation accuracy and improve the calculation speed, it is necessary to find the appropriate mesh size. Therefore, based on the above finite element modeling method, this paper determines the mesh size by comparing the calculation results of different mesh sizes. However, there is currently little test data on full-scale double steel tubular composite columns. Therefore, this paper selects a set of scale specimens in Reference [26] and determines the mesh size of the full-scale specimens in this paper by determining the proportional relationship between the mesh size and the size of the test specimens. The specific parameters of the selected test specimens are depicted in Table 2. The comparisons of different mesh sizes are depicted in Figure 5. It is more reasonable to choose the mesh size of 20 mm by comparison. It shows that when the ratio of grid size and specimen size is about 0.1, the calculation speed is faster, and the calculation accuracy can be maintained. Therefore, the grid size selected in this paper is determined to be 50 mm.
Table 2.
The specific parameters of two test specimens.
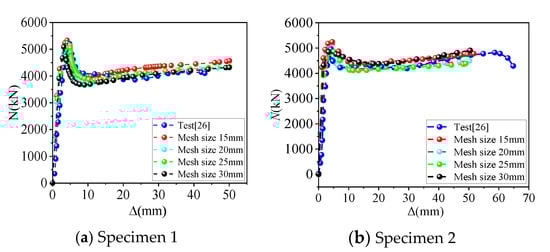
Figure 5.
Comparison of load–displacement curves for different mesh sizes.
4.3. Experimental Verification of Finite Element Model
4.3.1. Verification of Nonlinear Constitutive Model Test of Constrained UHPC
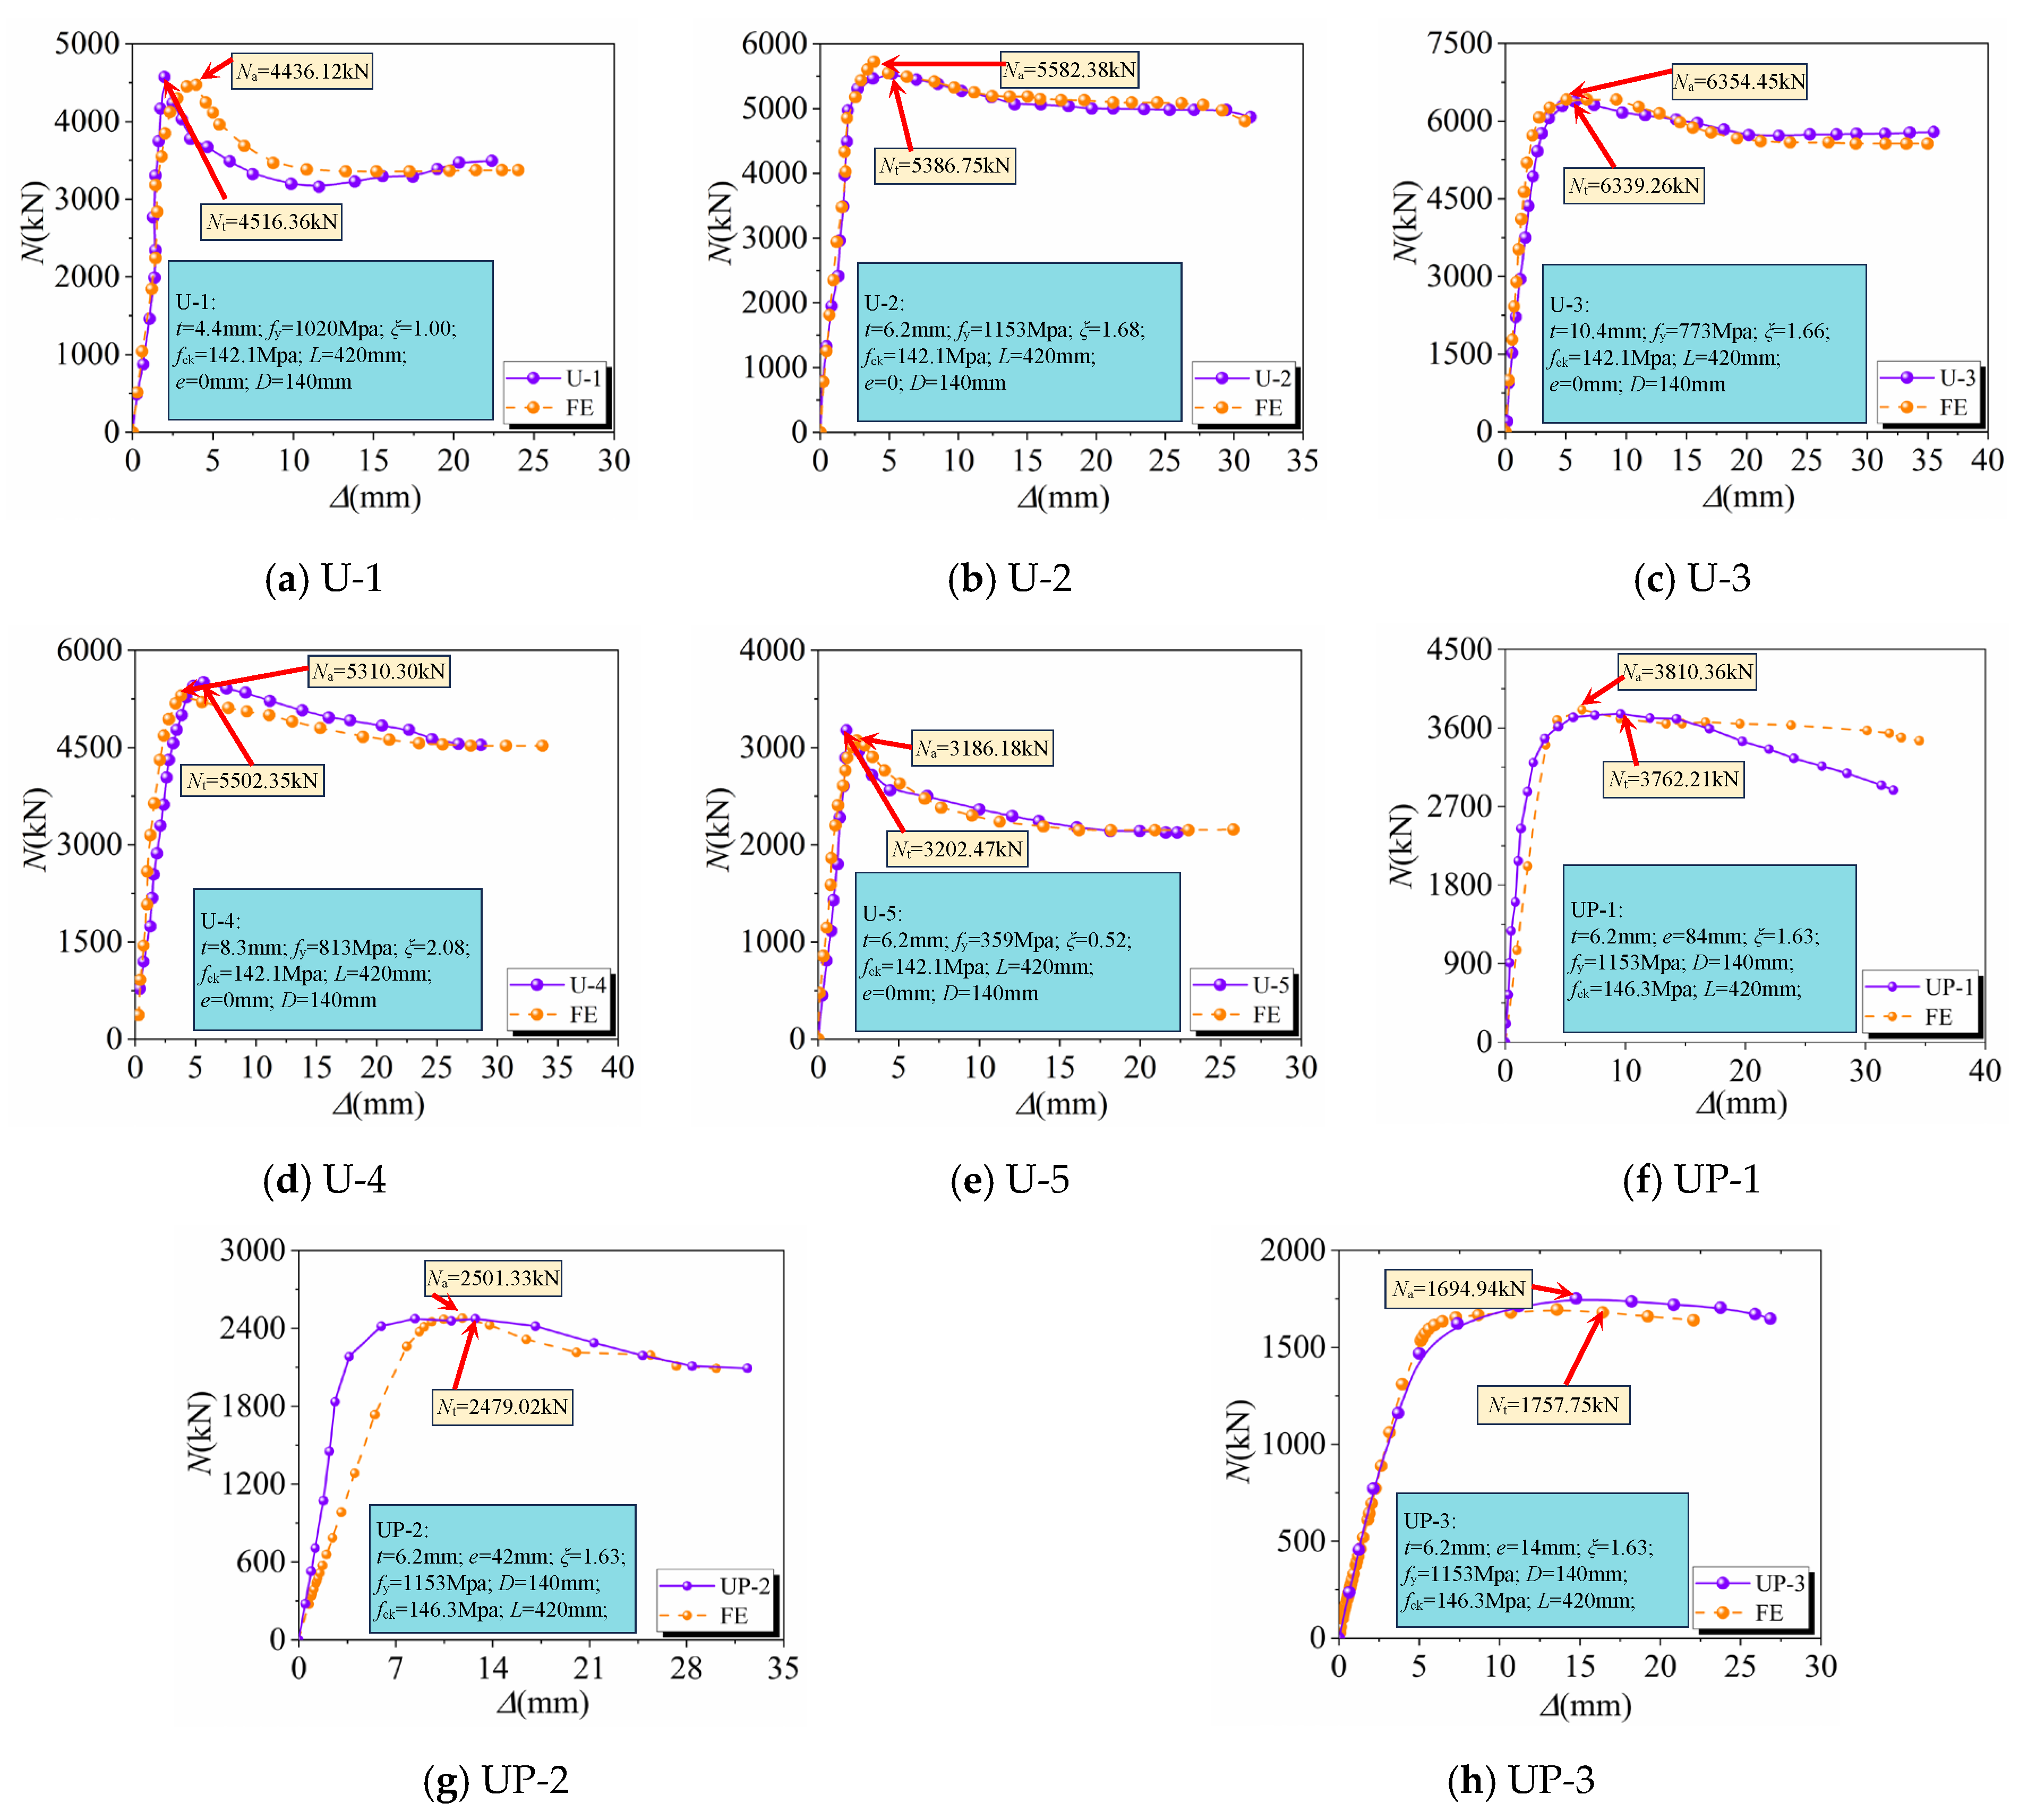
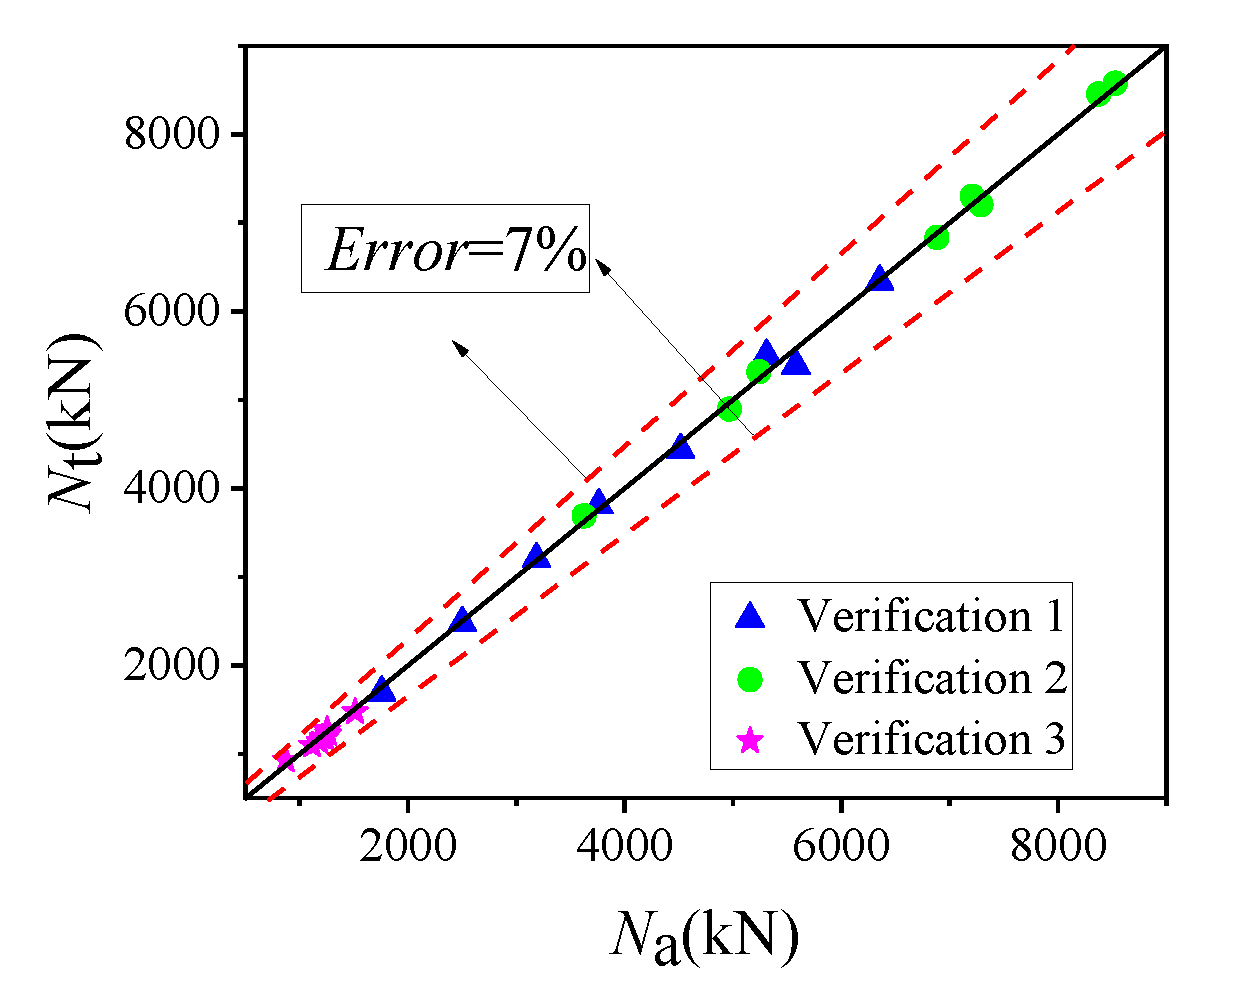
Eight UHPC-filled steel tubular composite column test specimens [27,28] were analyzed using finite element analysis, and the resulting load–displacement curves for axial and eccentric compression are presented in Figure 6. The comparison and error of the maximum load-bearing capacity values of the eight groups of specimens are depicted in Table 3, and the error scatter plot is depicted in Figure 7. It is evident that the simulation results of specimens are in good agreement with the load–displacement curves of the test, the failure modes of all specimens were largely consistent with those observed in the experiments, as depicted in Figure 8, and the maximum error was 4.73%, which was within 7% of the error line and met the engineering accuracy requirements.
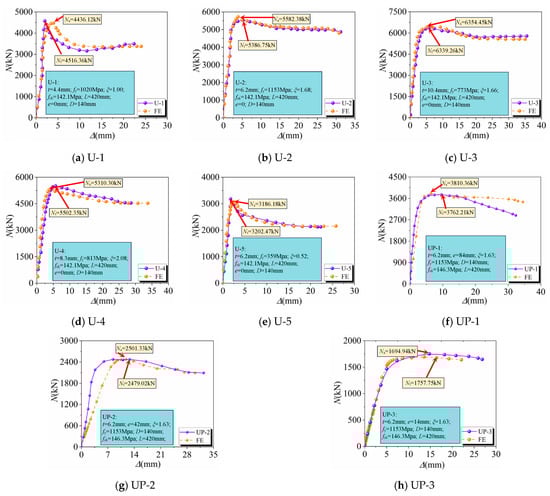
Figure 6.
Comparison of test and simulated load–displacement curves for Verification 1.
Table 3.
The specific parameters of 8 groups of UHPC-filled steel tubular composite columns.
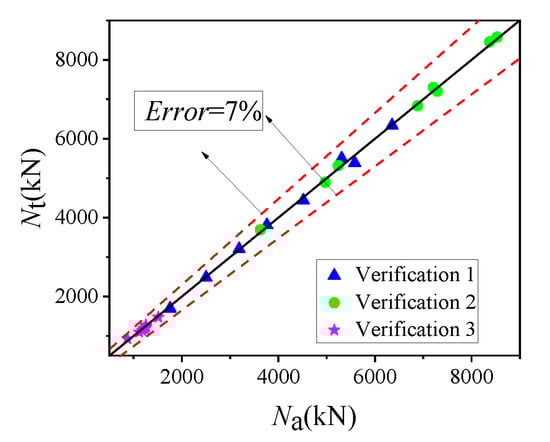
Figure 7.
Comparison between Na and Nt.
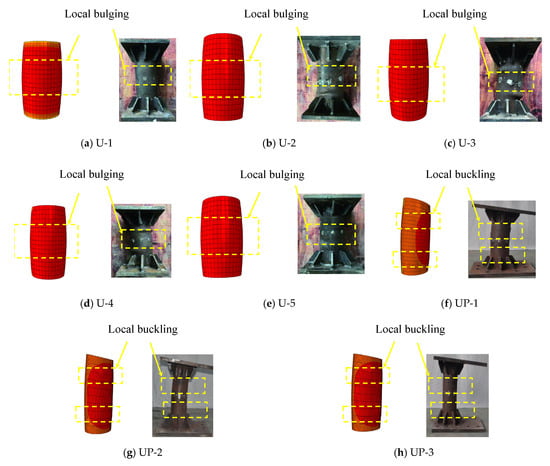
Figure 8.
Comparison of composite column test and simulated failure mode for Verification 1.
4.3.2. Verification of FEM of Concrete-Filled Double Steel Tubular Composite Columns
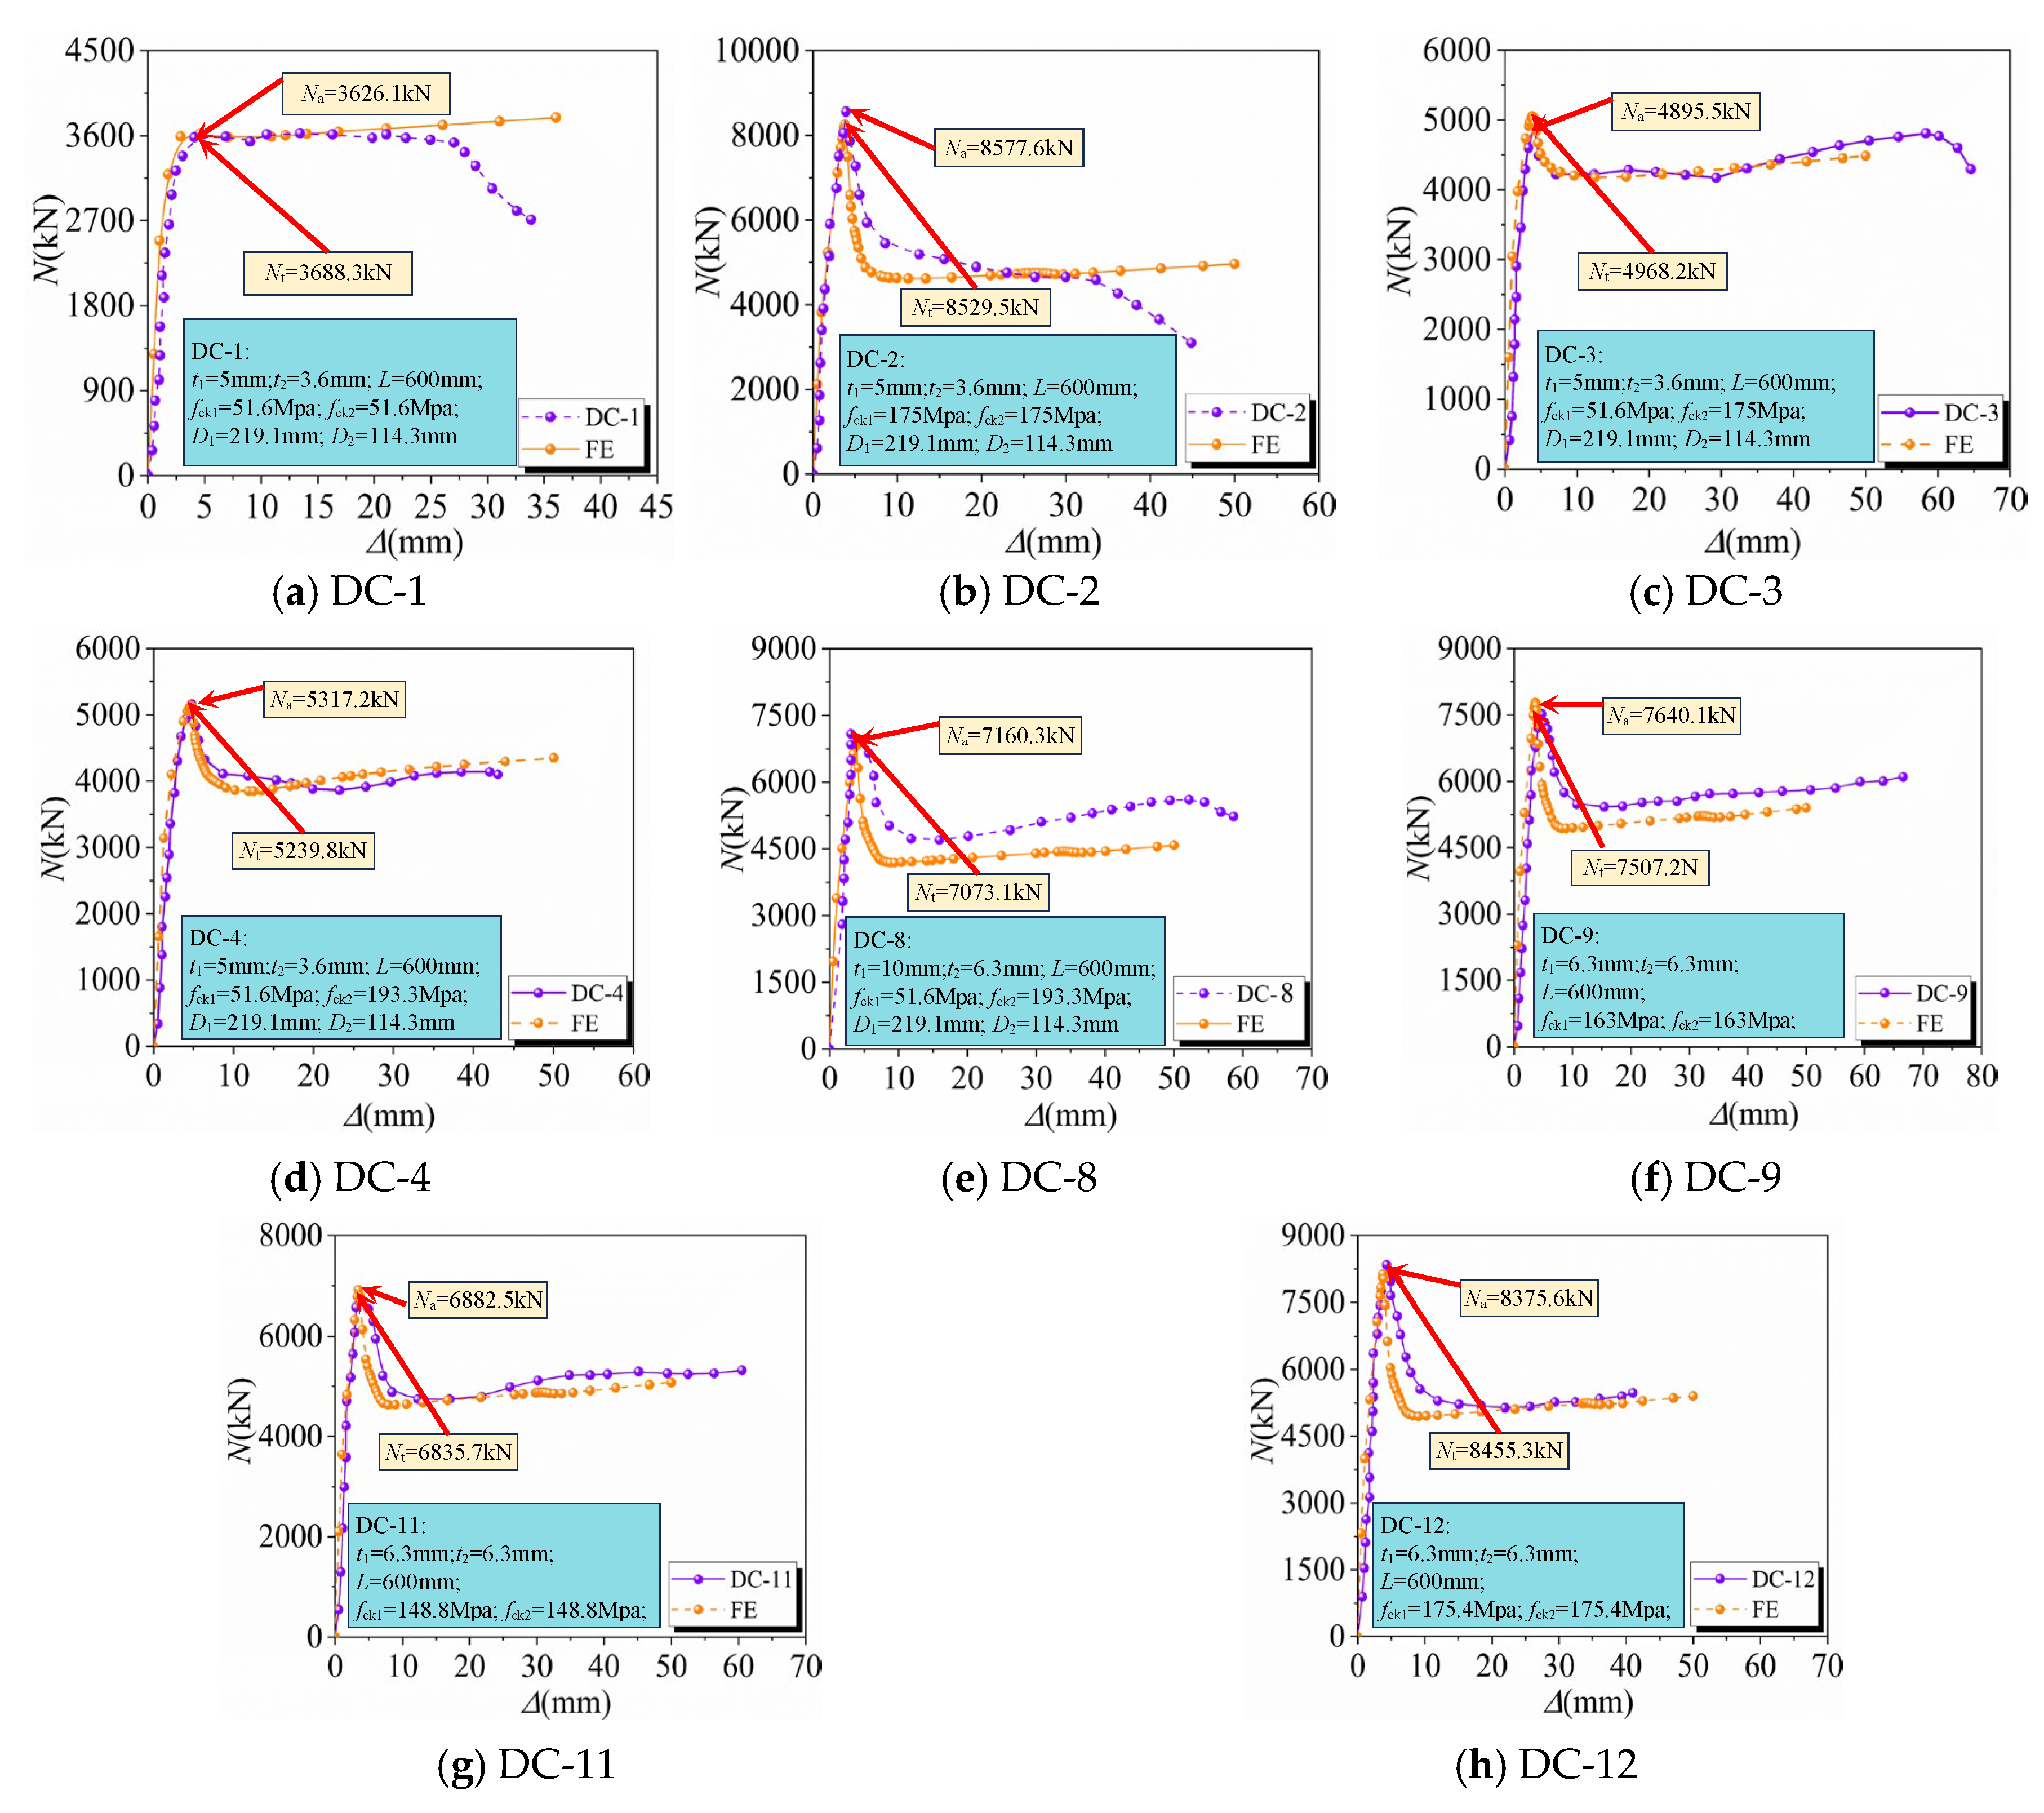
Eight concrete-filled double steel tubular composite column test specimens [26] were analyzed using finite element analysis, and the resulting load–displacement curves for axial compression are presented in Figure 9. The comparison and error of the maximum load-bearing capacity of the eight groups of specimens are depicted in Table 4, and the error scatter diagram is depicted in Figure 7. It is evident that the simulation results of specimens are in good agreement with the load–displacement curves of the test, the failure modes of all specimens were largely consistent with those observed in the experiments, as depicted in Figure 10, and the maximum error is 1.77%, which is within 7% of the error line and meets the engineering accuracy requirements.
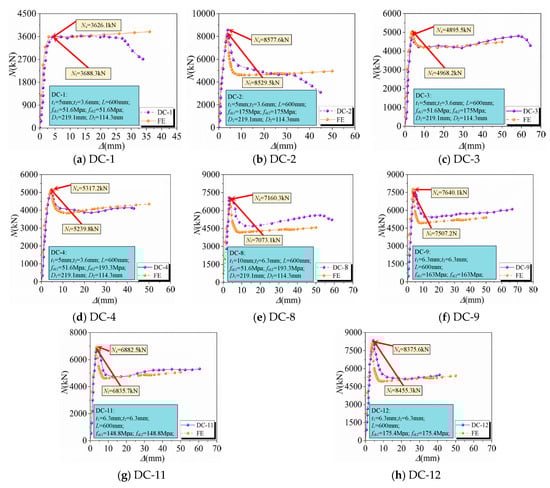
Figure 9.
Comparison of test and simulated load–displacement curves for Verification 2.
Table 4.
The specific parameters of 8 groups of double steel tubular concrete composite columns.
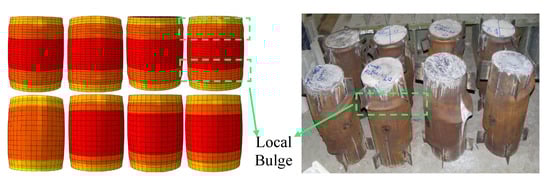
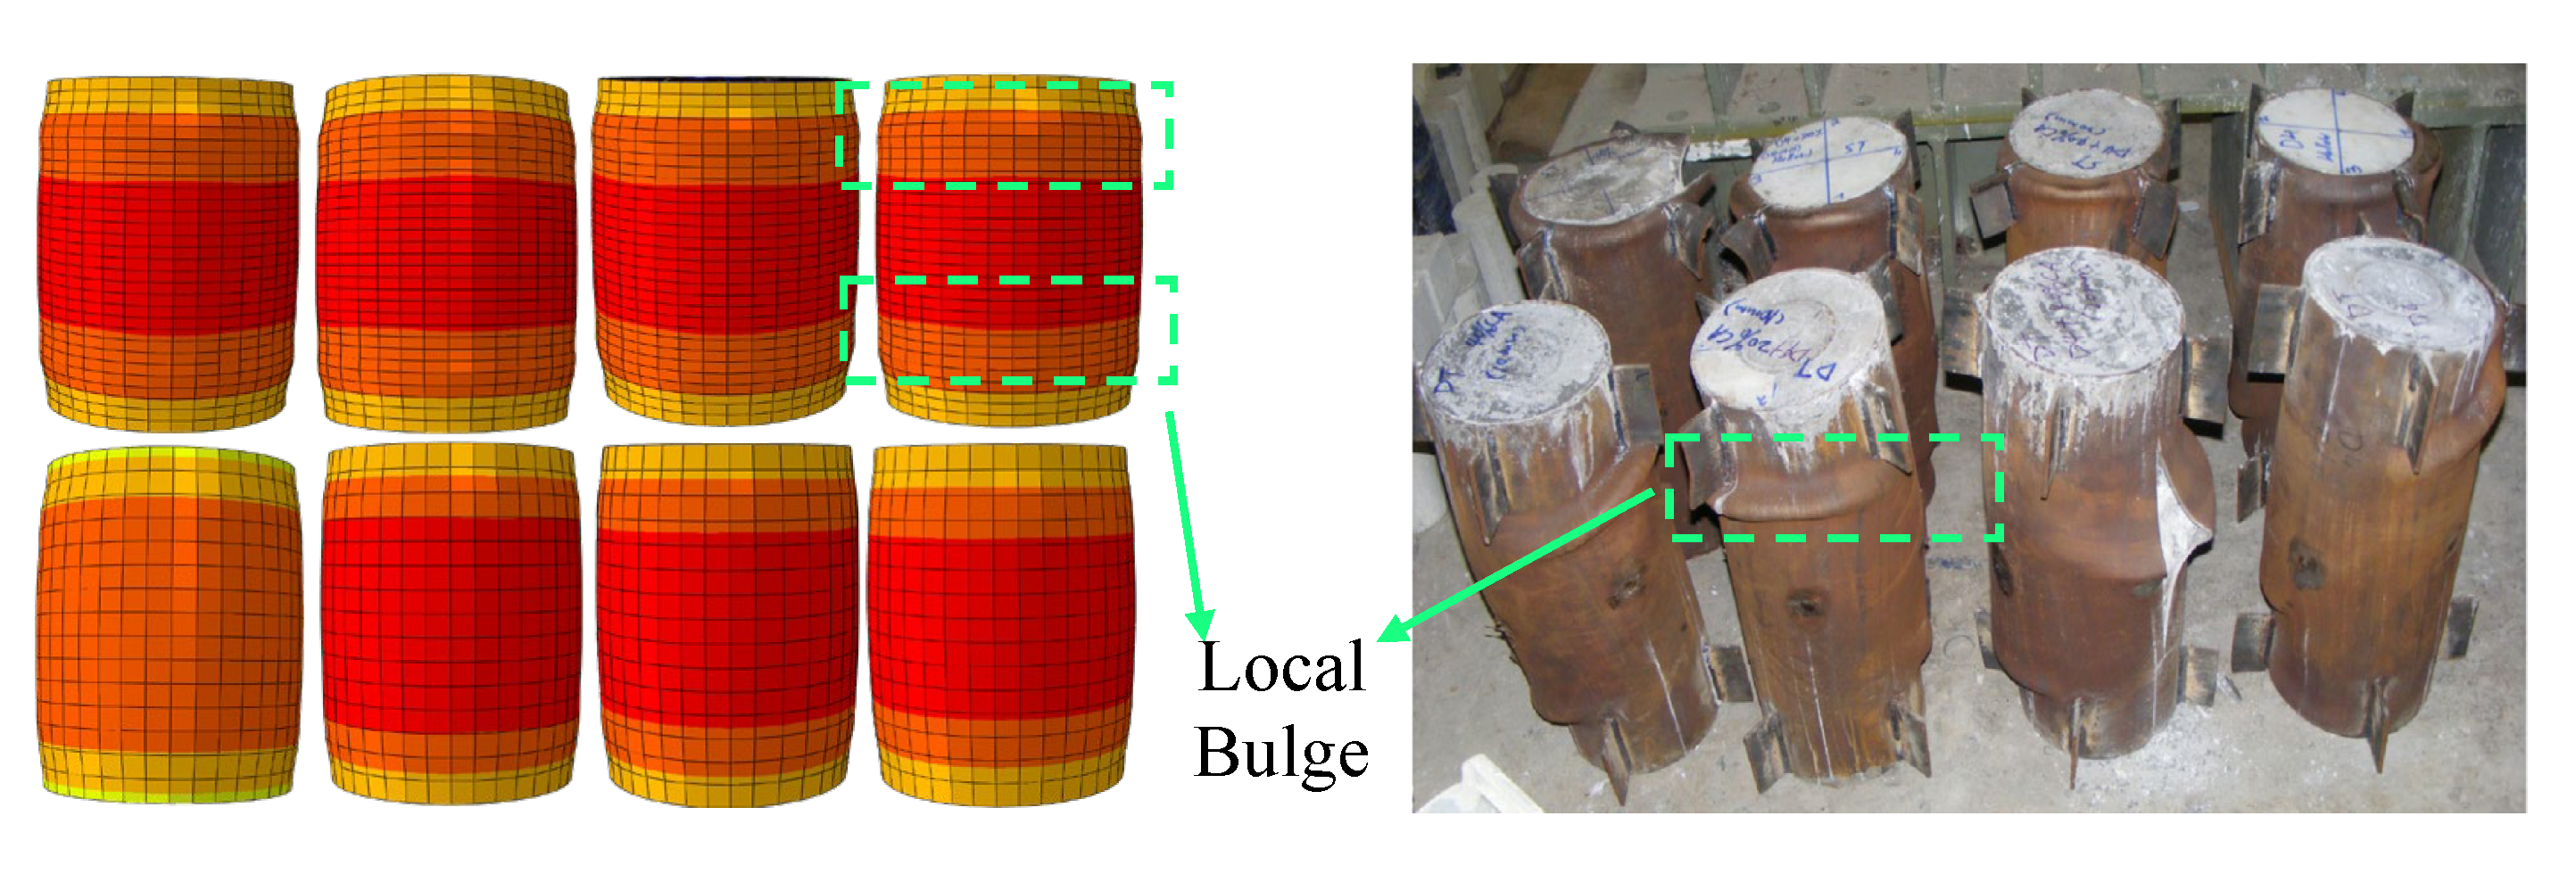
Figure 10.
Comparison of composite column test and simulated failure mode.
4.3.3. Verification of Finite Element Model of Constrained ECC Composite Columns
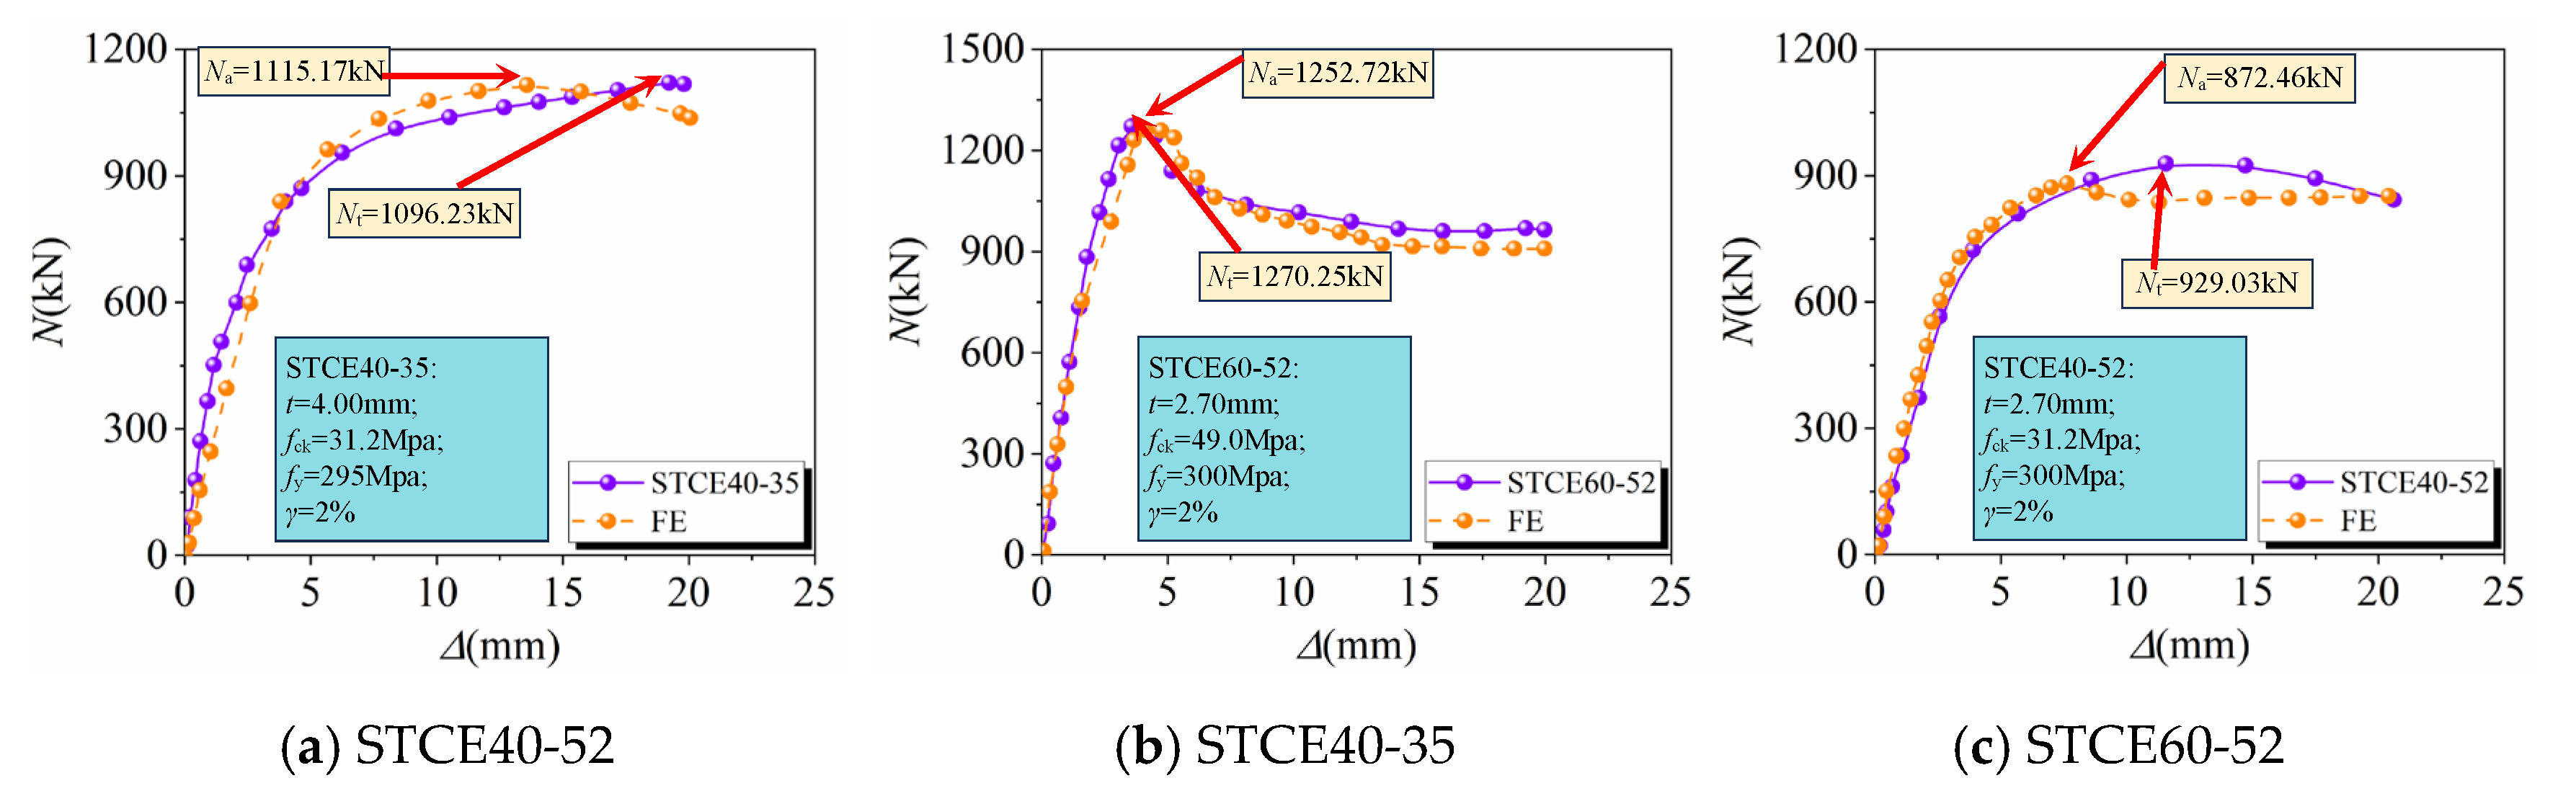
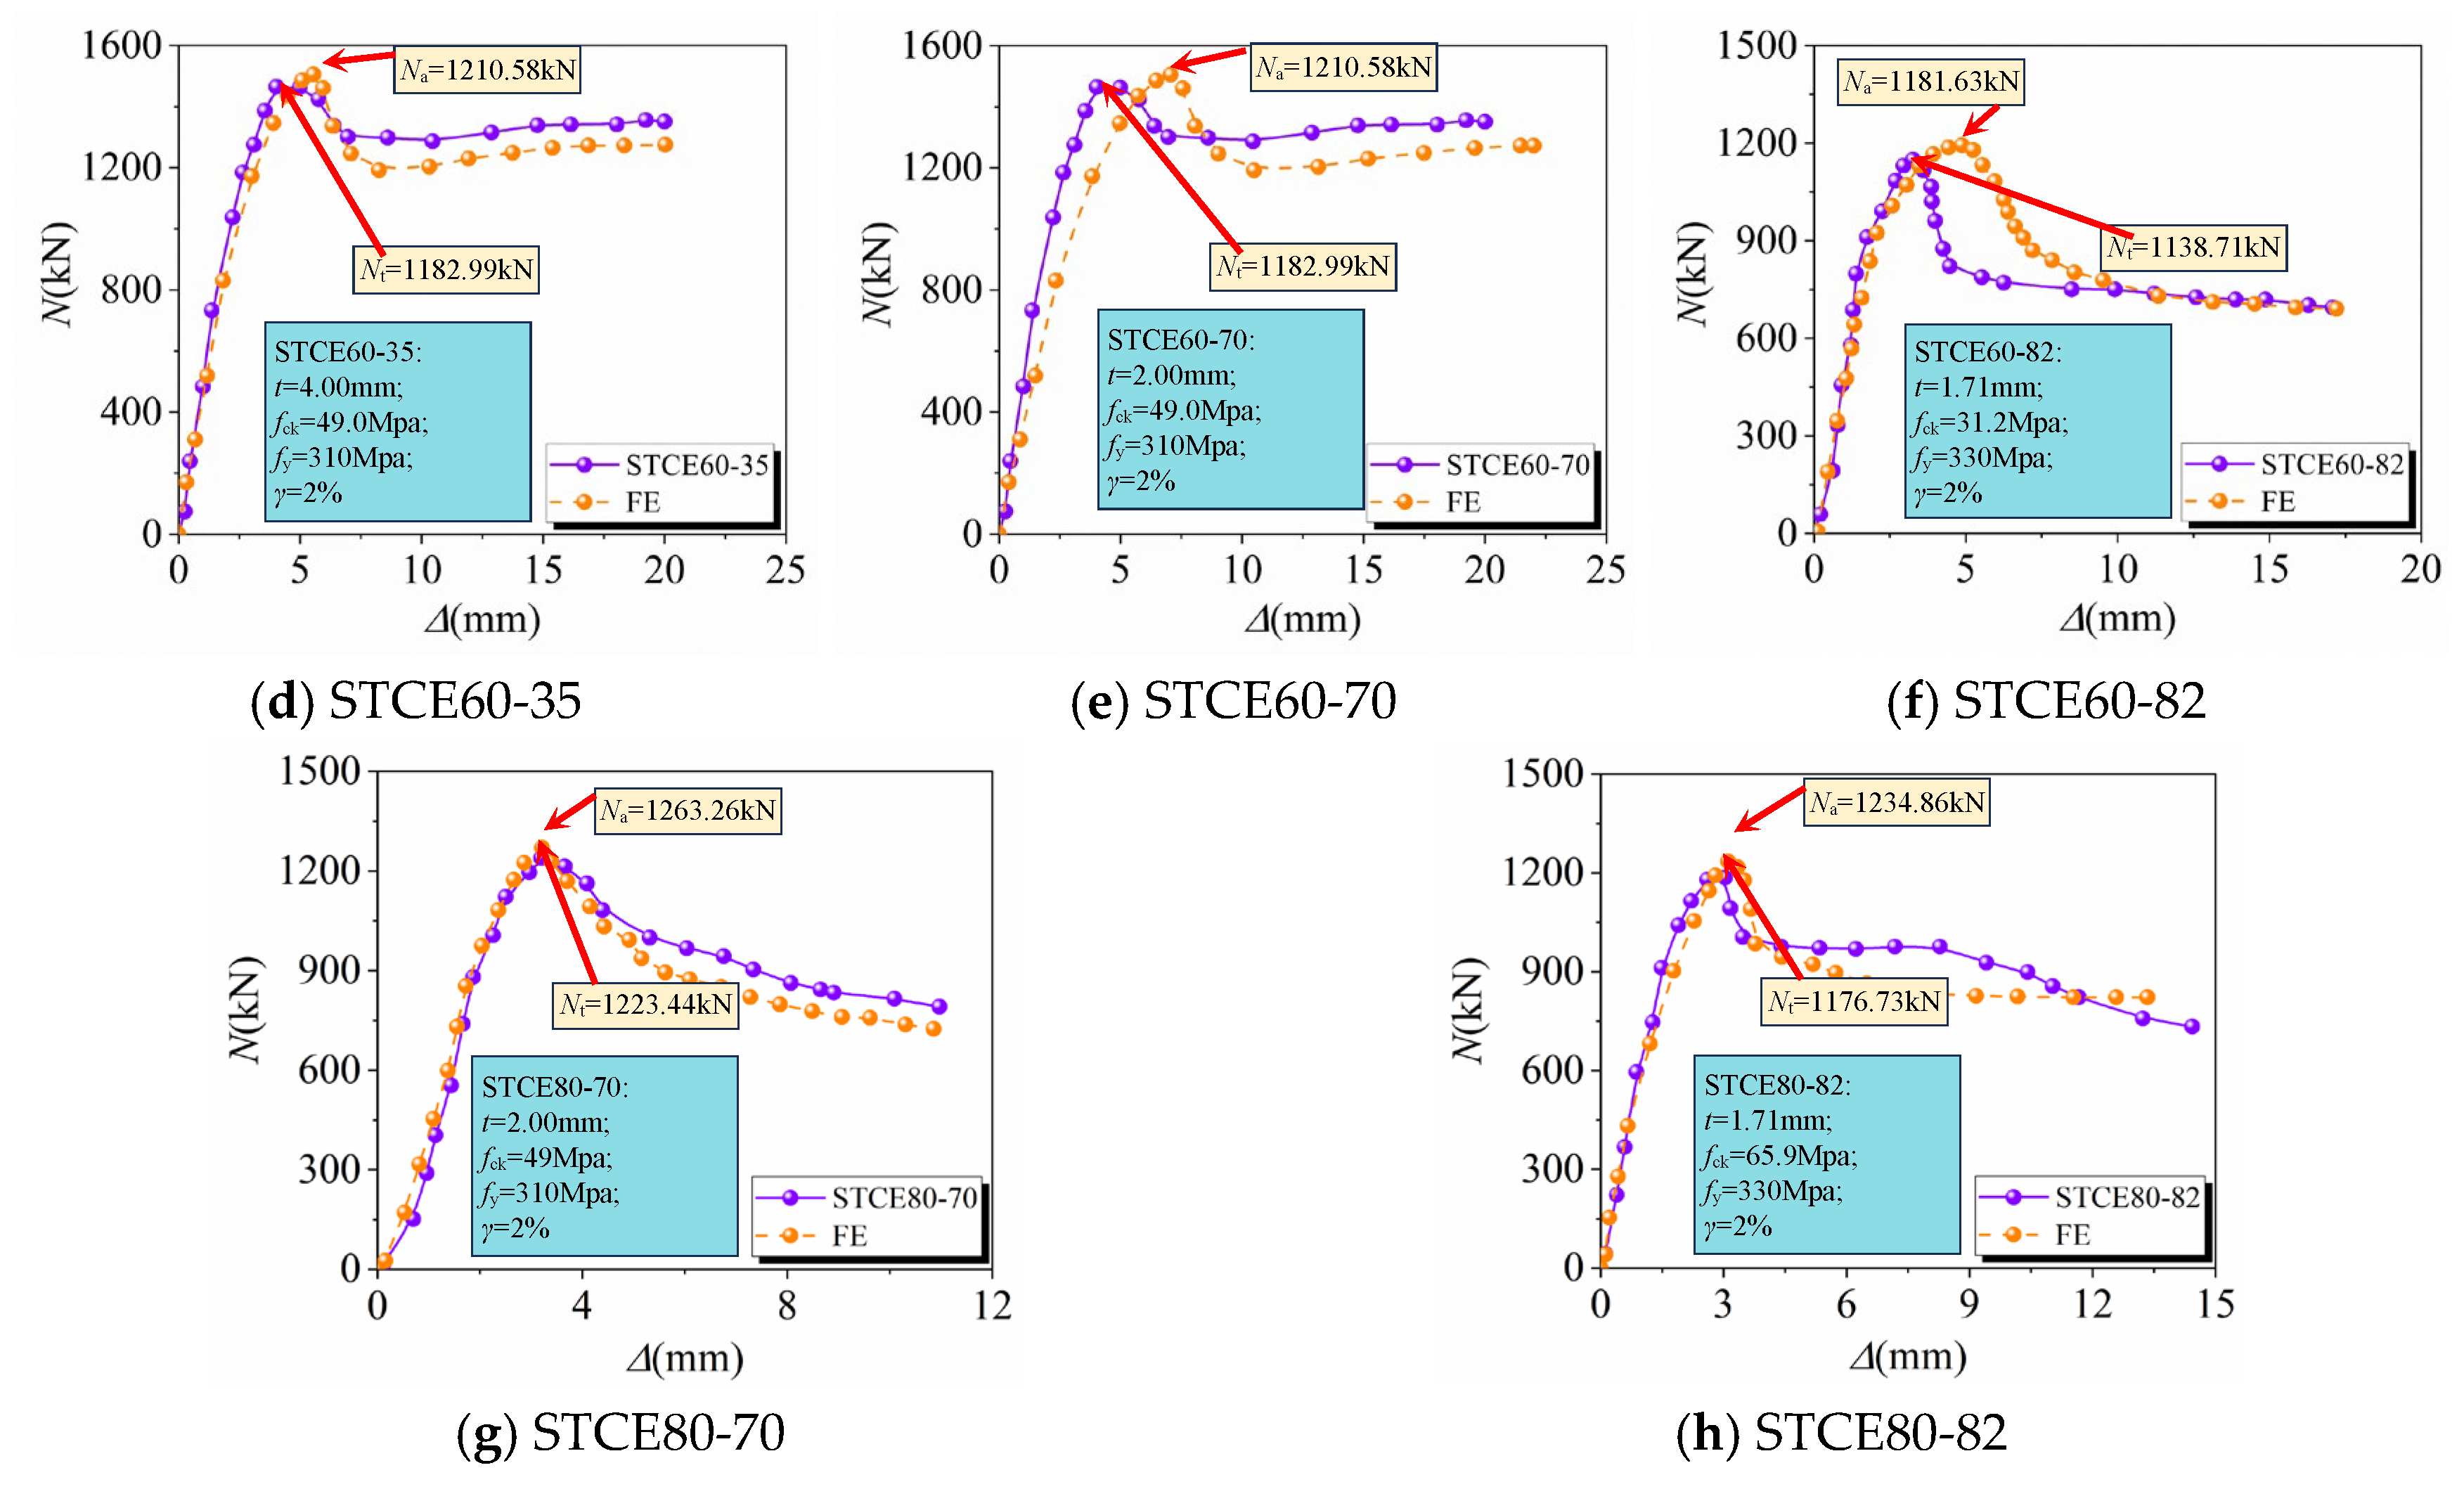
Eight constrained ECC composite column test specimens [29,30] were analyzed using finite element analysis, and the resulting load–displacement curves for axial compression are presented in Figure 11. The test and finite element axial compression maximum load-bearing capacity values of specimens are depicted in Table 5, and the error scatter diagram of the test and finite element is depicted in Figure 7. It is evident that the simulation results of specimens are in good agreement with the load–displacement curves of the test, the failure modes of all specimens were largely consistent with those observed in the experiments, as depicted in Figure 12, and the maximum error is 6.09%, which is within 7% of the error line and meets the engineering accuracy requirements.
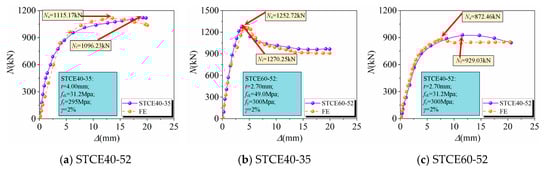
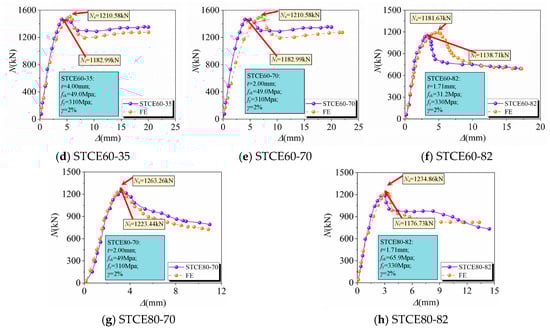
Figure 11.
Comparison of test and simulated load–displacement curves for verification 3.
Table 5.
Specific parameters of 8 groups of constrained ECC composite columns.

Figure 12.
Comparison of composite column test and simulated failure mode for verification 3.
5. Parameter Analysis
5.1. Load–Mid-Span Deflection (N-μm) Curve and Ductility Coefficient Curve
Thirty-five specimens were analyzed using finite element analysis under eccentric compression using ABAQUS software. The effects of various parameters on the N-μm curve were examined. The primary parameters investigated in this study are as follows: (1) strength of outer and inner steel tubes; (2) thickness of outer and inner steel tubes; (3) eccentricity; (4) diameter ratio of outer and inner steel tubes; (5) slenderness ratio; (6) compressive strength of UHPC cylinder; (7) PVA fiber content.
The structural deformation capacity under different parameters is difficult to judge directly by analyzing the load–displacement curve and the deformation cloud diagram. Therefore, it is necessary to analyze the data of the load–displacement curve and extract the ductility coefficient that reflects the overall deformation capacity of the structure. The larger the ductility coefficient, the better the deformation capacity of the structure. The ductility coefficient mainly includes the displacement, curvature, and corner ductility coefficient. In this paper, the displacement ductility μ coefficient is used to analyze the ductility of the component. The expression of the displacement ductility coefficient is depicted in Equation (3):
In this paper, the energy equivalent approach is utilized to ascertain the yield displacement of the component, as illustrated in Figure 13.
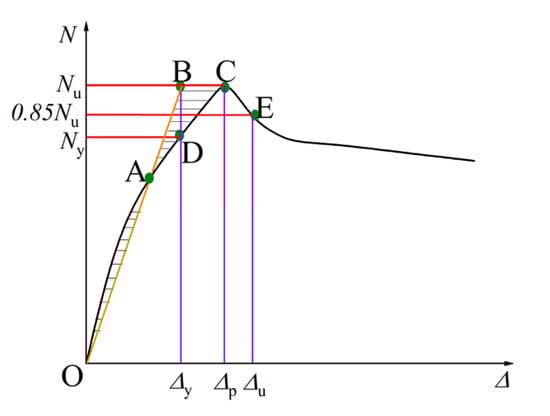
Figure 13.
The equivalent elastoplastic energy method.
5.1.1. Strength of the Outer and Inner Steel Tubes (fy1, fy2)
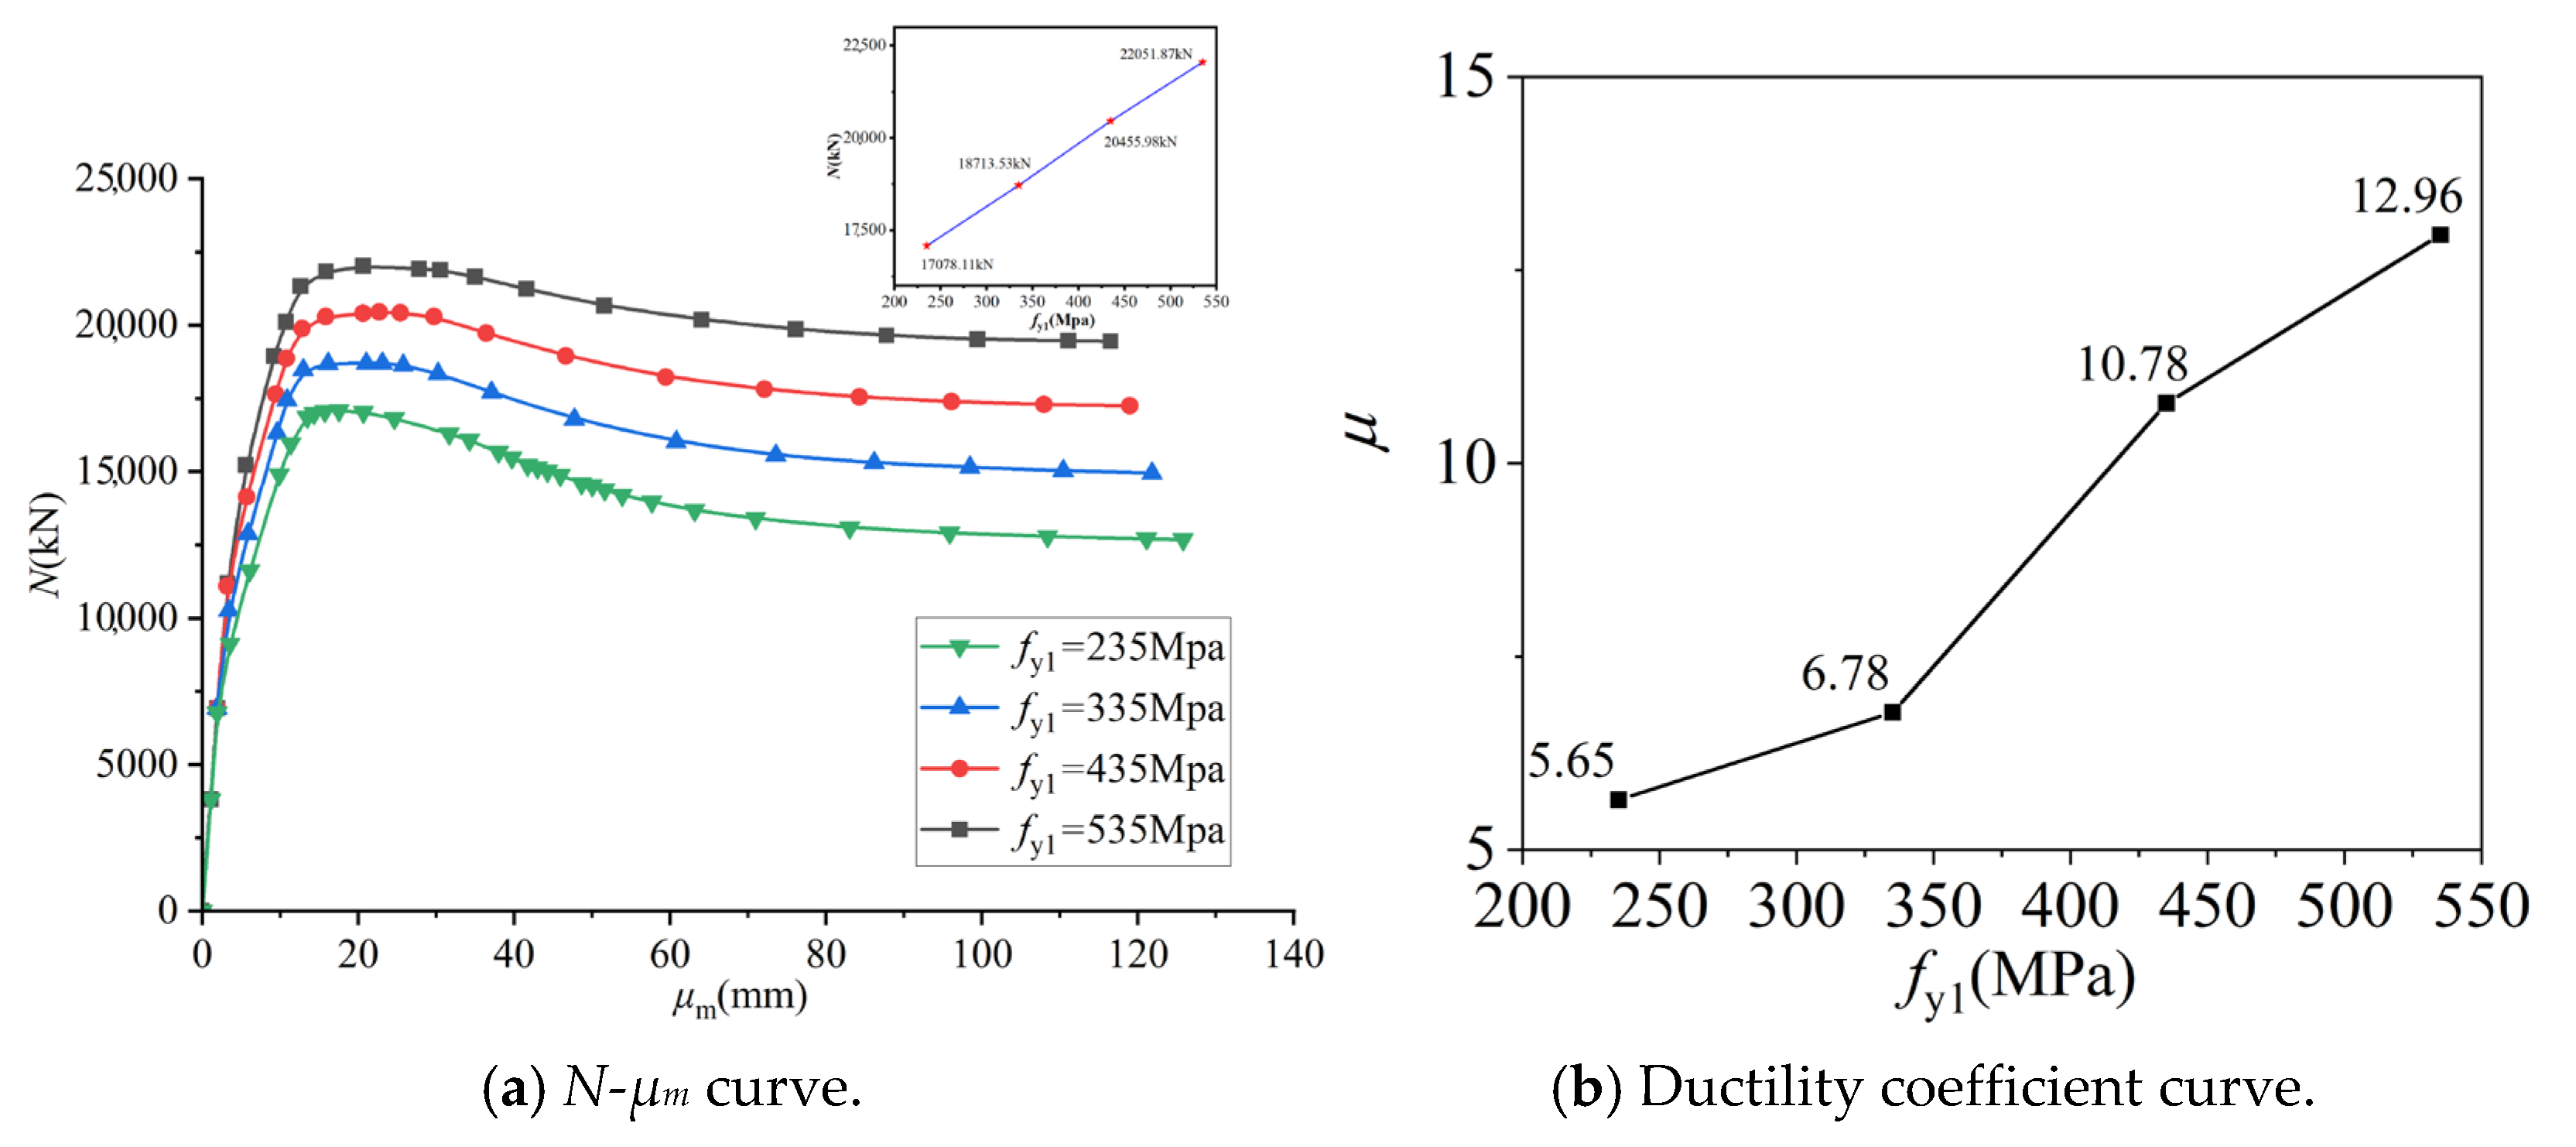
The N-μm curves and ductility coefficient curves for specimens with varying fy1 and fy2 are depicted in Figure 14 and Figure 15. As fy1 (Mpa) increases from 235 to 335, 435, and 535, the maximum load-bearing capacity (kN) of the specimens sequentially rises to 18,713.53, 20,455.98, and 22,051.87, representing increments of 8.8%, 16.6%, and 22.6%, respectively. Conversely, μm (mm) diminished from 125.67 to 121.96, 119.07, and 116.43, decreasing by 3.0%, 4.8%, and 7.2%, respectively. With the incremental increase in fy1, the maximum load-bearing capacity of the EUFDST composite columns subjected to eccentric compression progressively increases, μm gradually declines, the post-peak load curve’s descent rate mitigates, and the bearing capacity steadily amplifies. Concurrently, the ductility coefficient of the EUFDST composite columns escalates from 5.65 to 6.78, 10.78, and 12.96, increasing by 16.7%, 38.4%, and 56.5%, respectively. This indicates that as fy1 gradually elevates, the deformation capacity of the composite column is significantly augmented, with a marked improvement in the ductility coefficient.
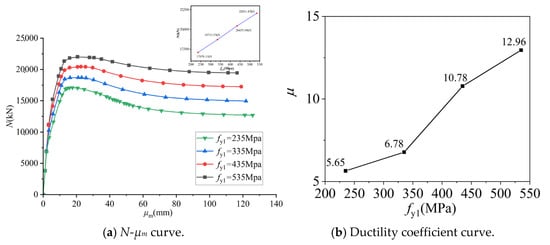
Figure 14.
Comparison of N-μm curves and ductility coefficient curve with different fy1.
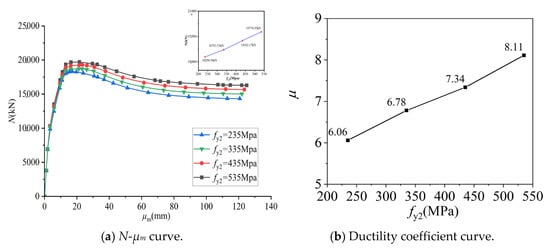
Figure 15.
Comparison of N-μm curves and ductility coefficient curve with different fy2.
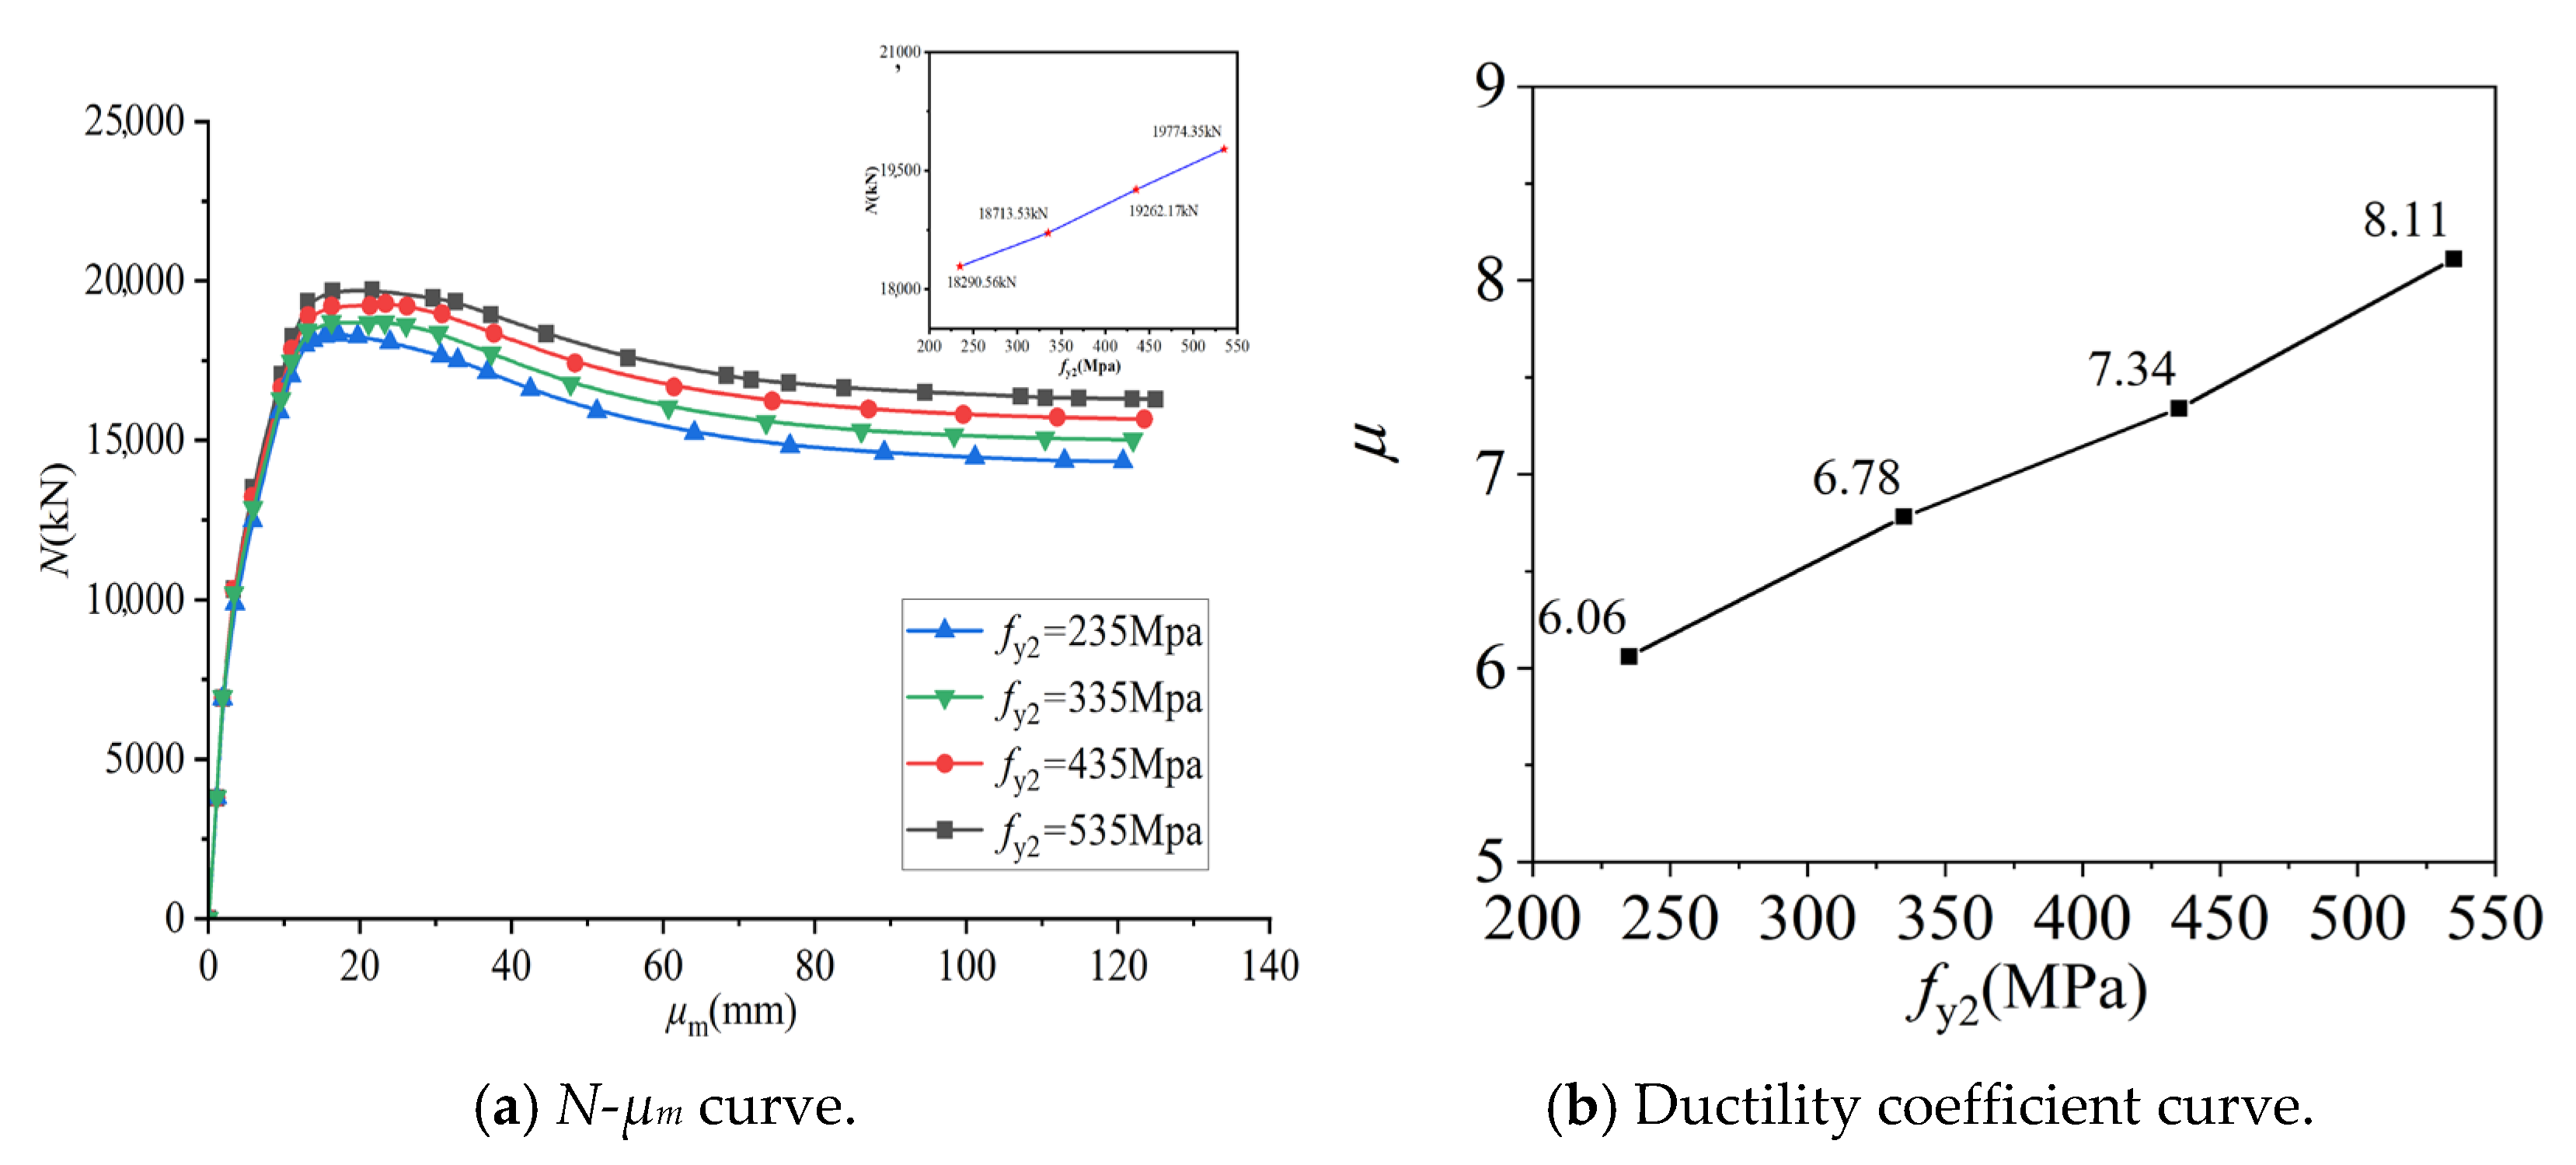
As illustrated in the figure, when fy2 (Mpa) escalates from 235 to 335, 435, and 535, the maximum load-bearing capacity (kN) of the specimens sequentially augments to 18,713.53, 19,262.17, and 19,774.35, representing increments of 2.3%, 5.1%, and 7.6%, respectively. The μm sequentially expanded from 120.61 mm to 121.90 mm, 123.47 mm, and 124.79 mm, increasing by 1.1%, 2.4%, and 3.4%, respectively. With the progressive increment of fy2, the maximum load-bearing capacity of the EUFDST composite columns subjected to eccentric compression progressively increases, μm progressively amplifies, and the post-peak load curve’s descent rate alleviates. However, in comparison with the influence of fy1, the variation in fy2 exerts no pronounced effect on the strength and deflection alterations of the EUFDST composite columns. With the amplification of fy2, the ductility coefficient of the EUFDST composite columns sequentially increased from 6.06 to 6.78, 7.34, and 8.11, escalating by 10.1%, 17.5%, and 25.3%, respectively. This observation indicates that as fy2 incrementally elevates, the deformation capacity of the composite column progressively intensifies, with a gradual increment in the ductility coefficient.
5.1.2. Thickness of Outer and Inner Steel Tubes (t1, t2)
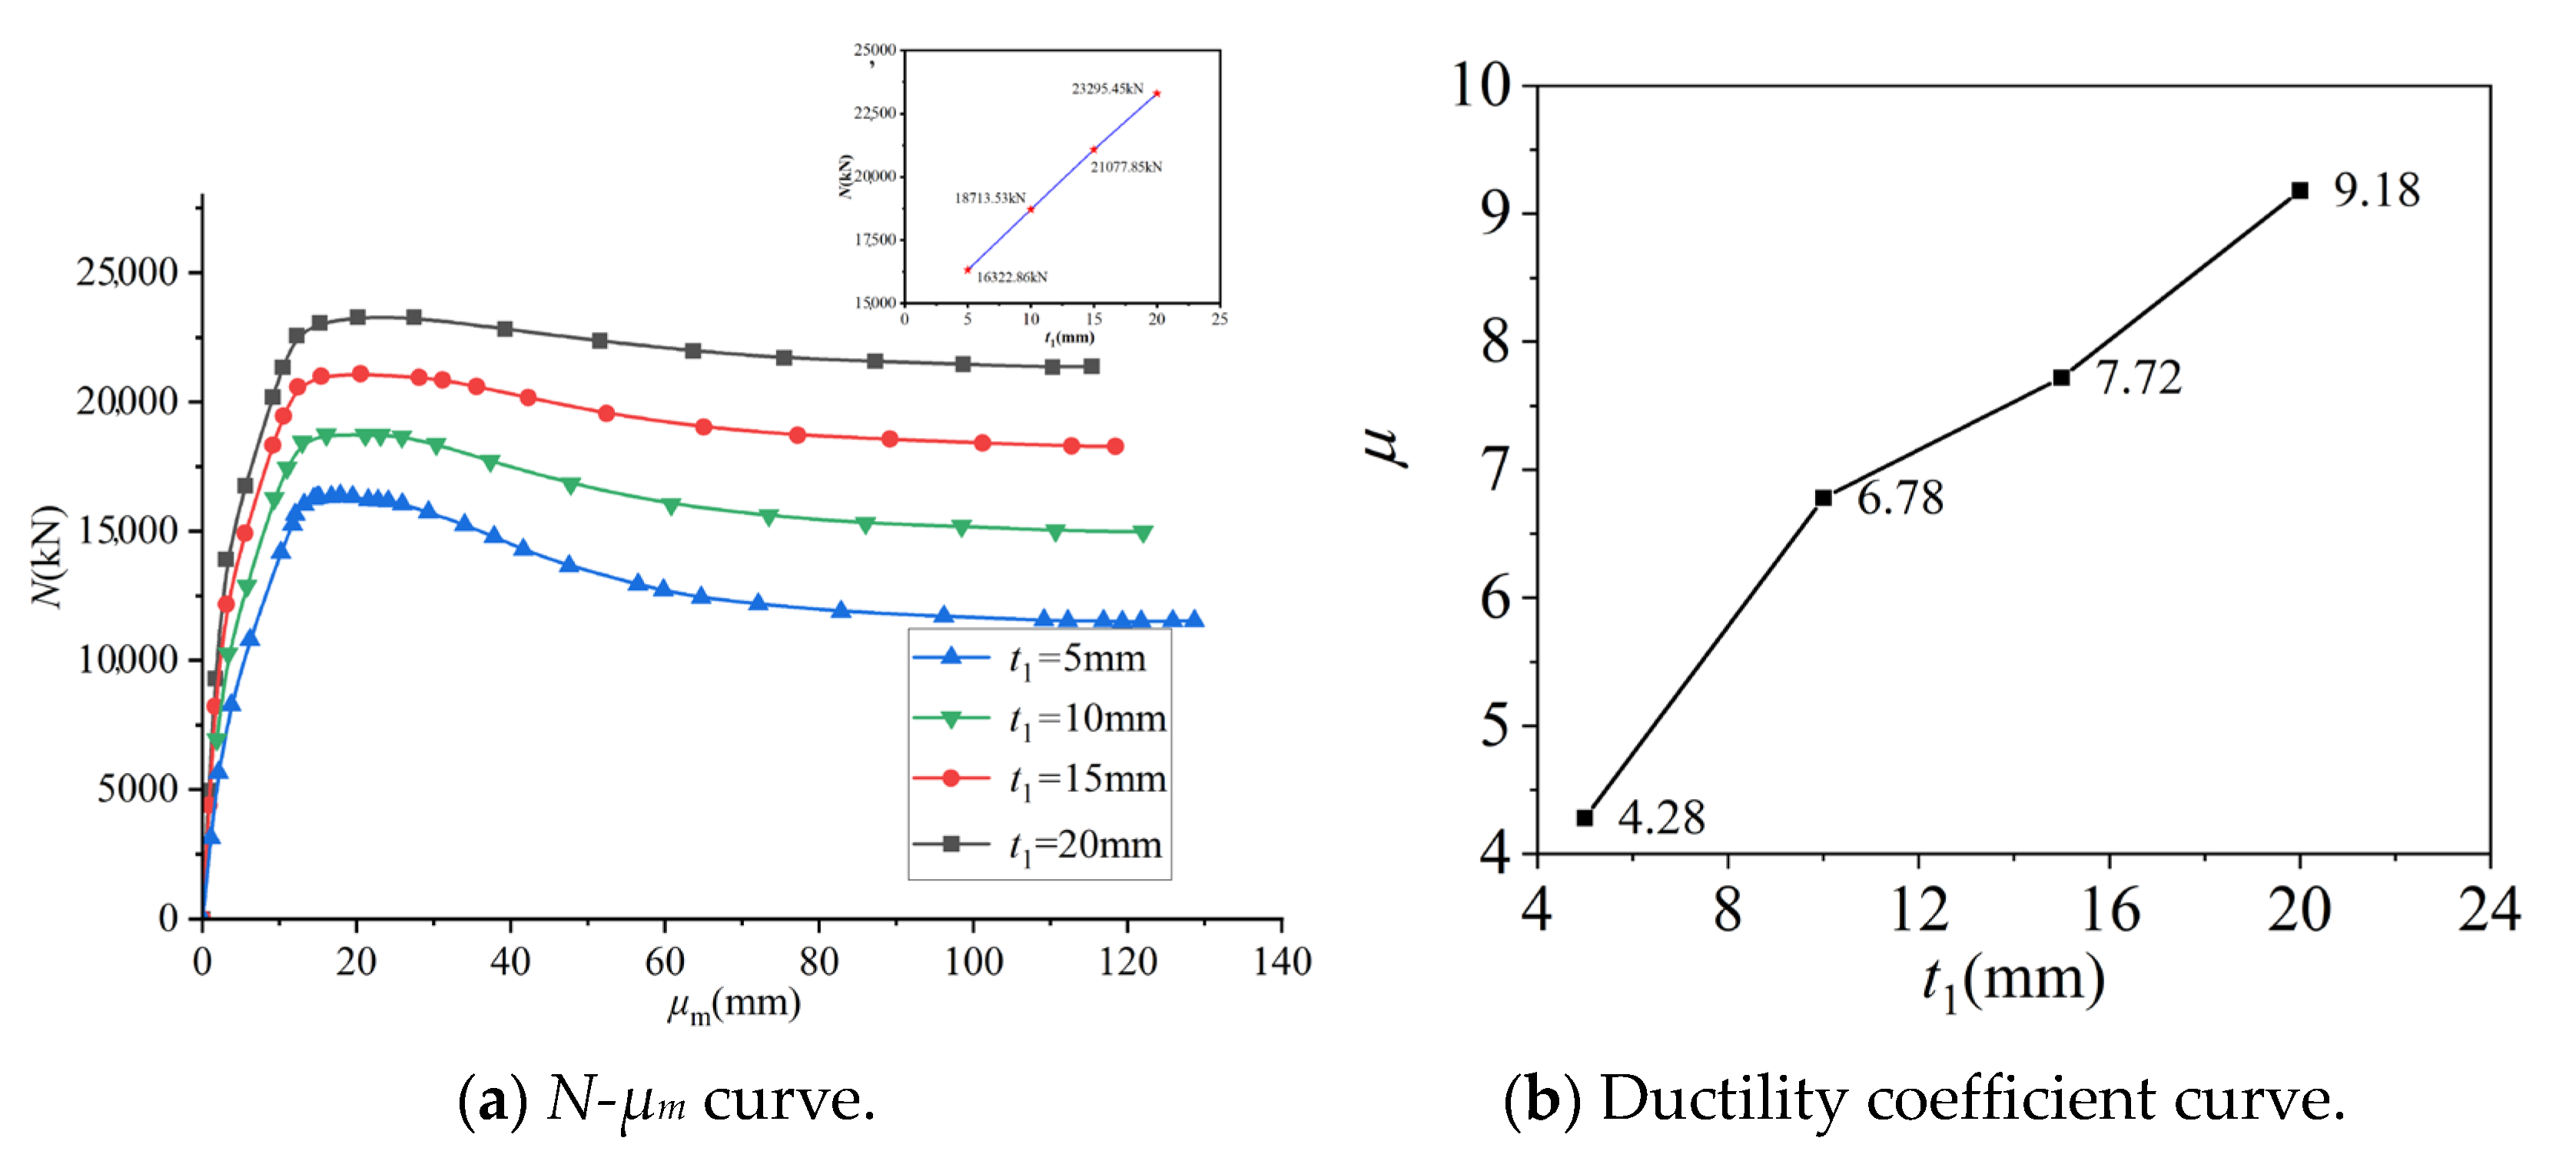
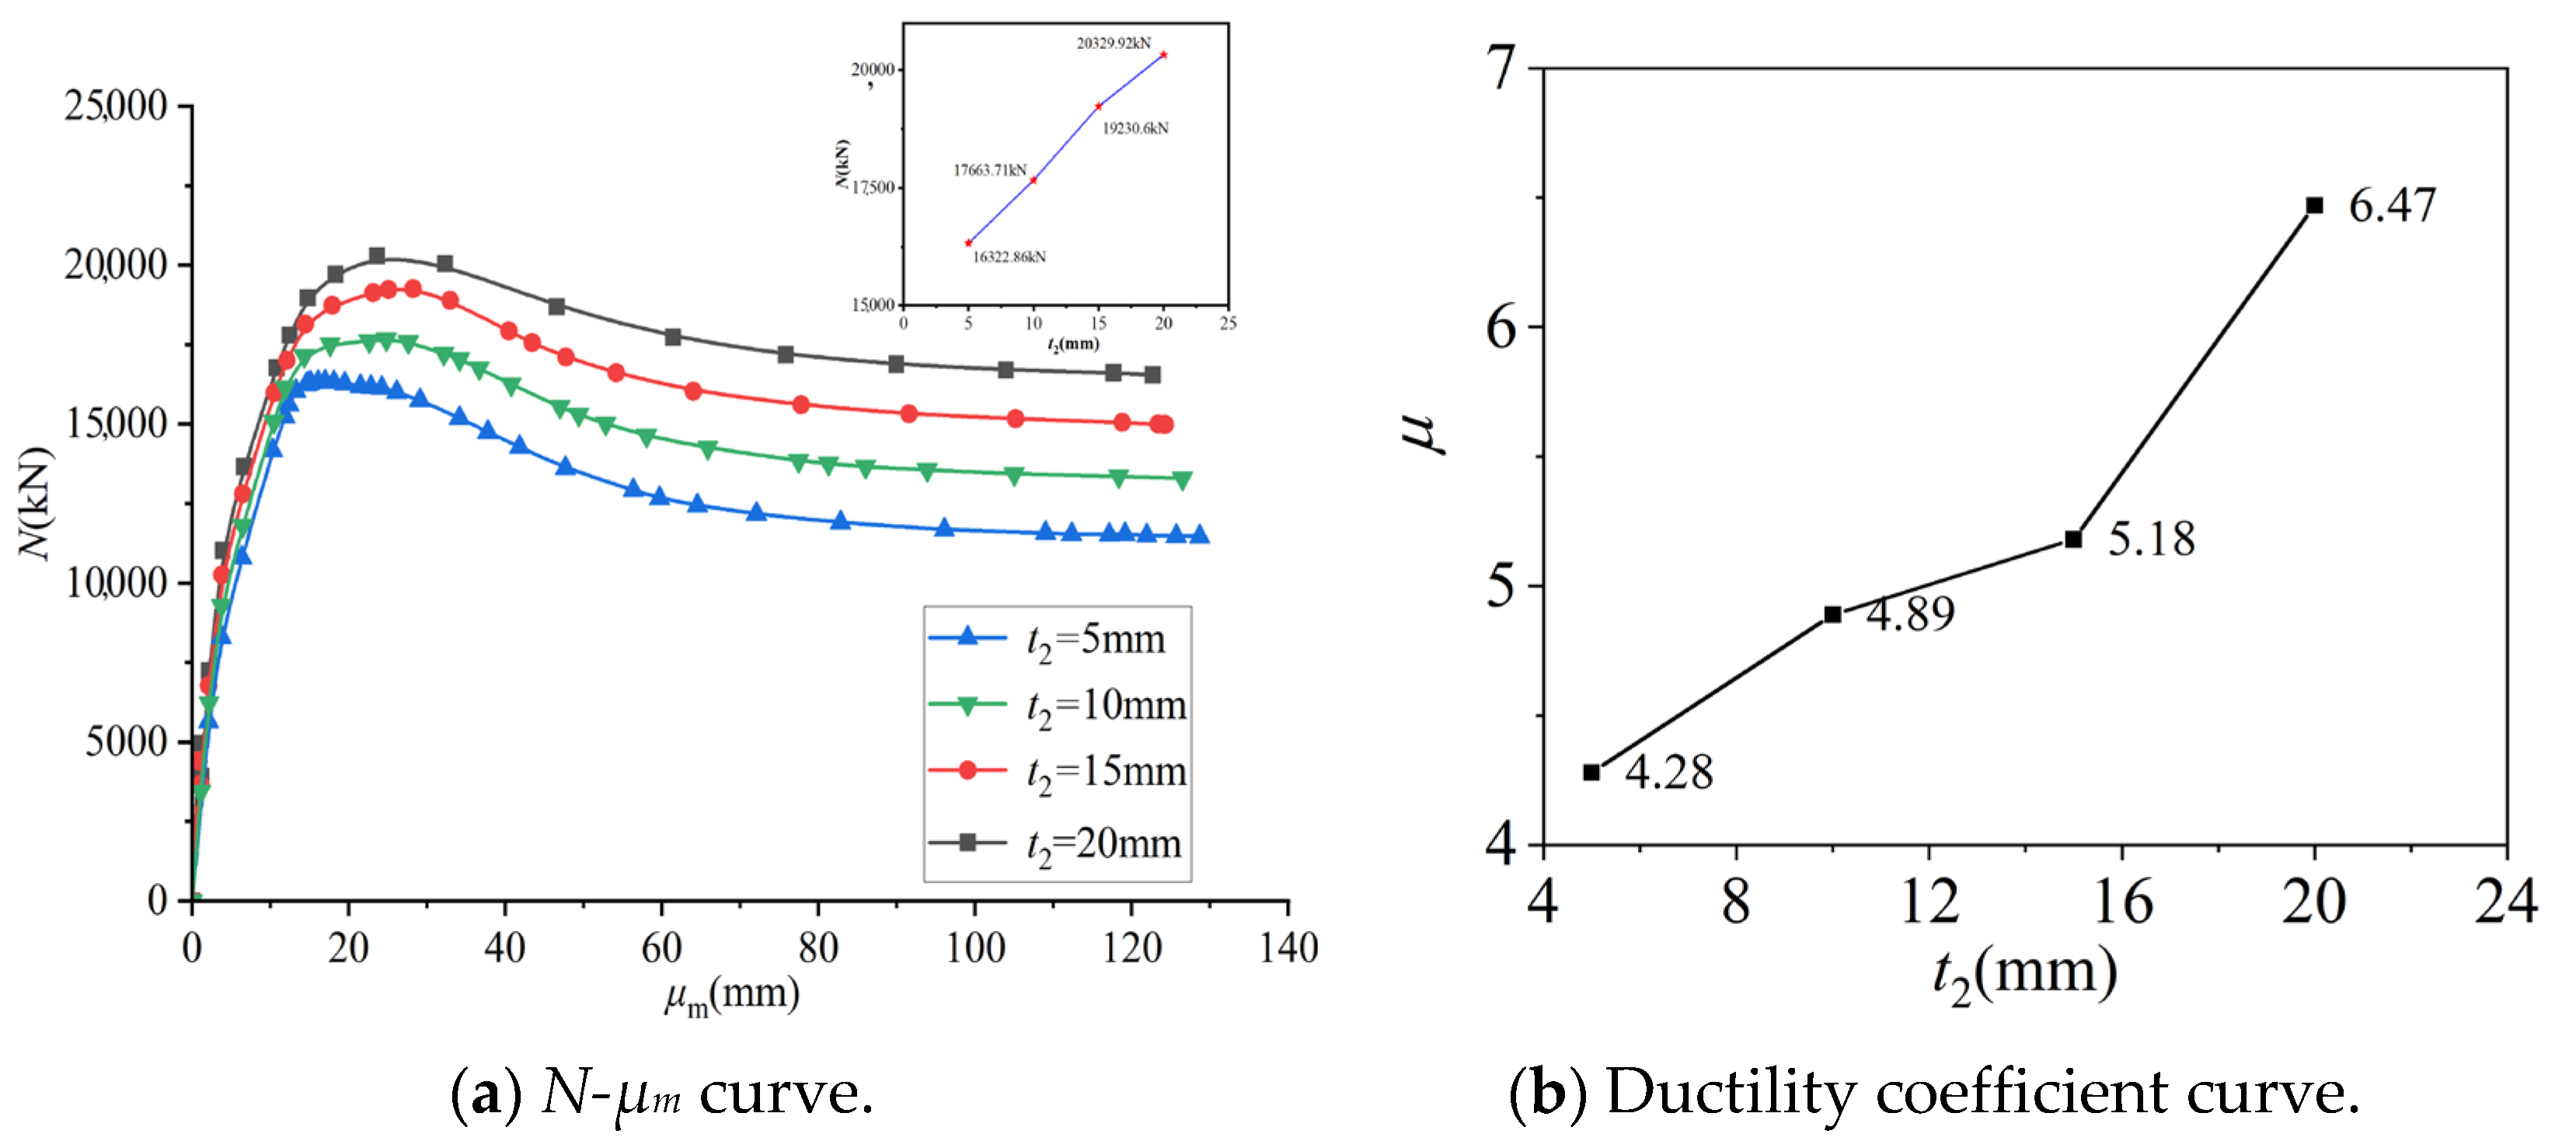
The N-μm curves and ductility coefficient curves for specimens with varying t1 and t2 dimensions are presented in Figure 16 and Figure 17. With the increment of t1 (mm) from 5 to 10, 15, and 20, the maximum load-bearing capacity (kN) of the specimens correspondingly elevates to 18,713.53, 21,077.85, and 23,295.45, marking increments of 12.5%, 22.6%, and 30.0%, respectively. Conversely, μm reduces from 128.58 to 121.90, 118.29, and 115.15, respectively, by 5.2%, 8.6%, and 10.9%. Upon increasing t2 (mm) from 5 to 10, 15, and 20, the maximum load-bearing capacity (kN) of the specimens sequentially rises to 17,663.71, 19,230.63, and 20,329.92, reflecting increases of 7.6%, 15.2%, and 19.8%, respectively. Concurrently, μm diminishes from 128.58 to 126.41, 122.65, and 121.11, respectively, by 1.7%, 4.7%, and 5.9%. As t1 and t2 gradually increase, the maximum load-bearing capacity of the EUFDST composite columns under eccentric compression is significantly enhanced, μm is progressively reduced, and the post-peak load curve’s descent rate is alleviated, thereby substantially boosting the bearing capacity. This suggests that augmenting t1 and t2 effectively amplifies the confining effect on the core concrete and improves the steel content of the EUFDST composite columns, leading to a marked enhancement in the maximum load-bearing capacity under eccentric compression.
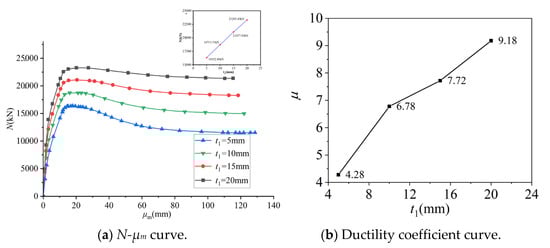
Figure 16.
Comparison of N-μm curves and ductility coefficient curve with different t1.
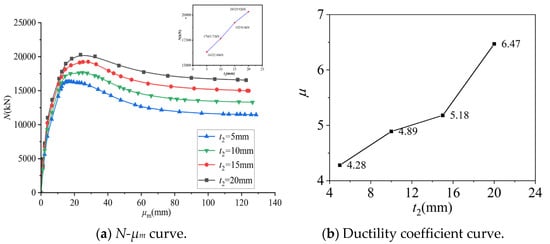
Figure 17.
Comparison of N-μm curves and ductility coefficient curve with different t2.
With the escalation of t1, the ductility coefficient of the EUFDST composite columns ascends from 4.28 to 6.78, 7.72, and 9.18, exhibiting increases of 36.9%, 45.6%, and 53.4%, respectively. Similarly, with the upsurge of t2, the ductility coefficient of the EUFDST composite columns increases from 4.28 to 4.89, 5.18, and 6.47, signifying increments of 12.5%, 17.4%, and 33.9%, respectively. It is evident that the gradual increase in t1 and t2 progressively enhances the deformation capacity of the composite column, with a significant amplification in the ductility coefficient. The impact of elevating t1 and t2 on the composite column’s maximum load-bearing capacity and deformation capacity is more pronounced than that of fy1 and fy2.
5.1.3. Eccentricity (e)
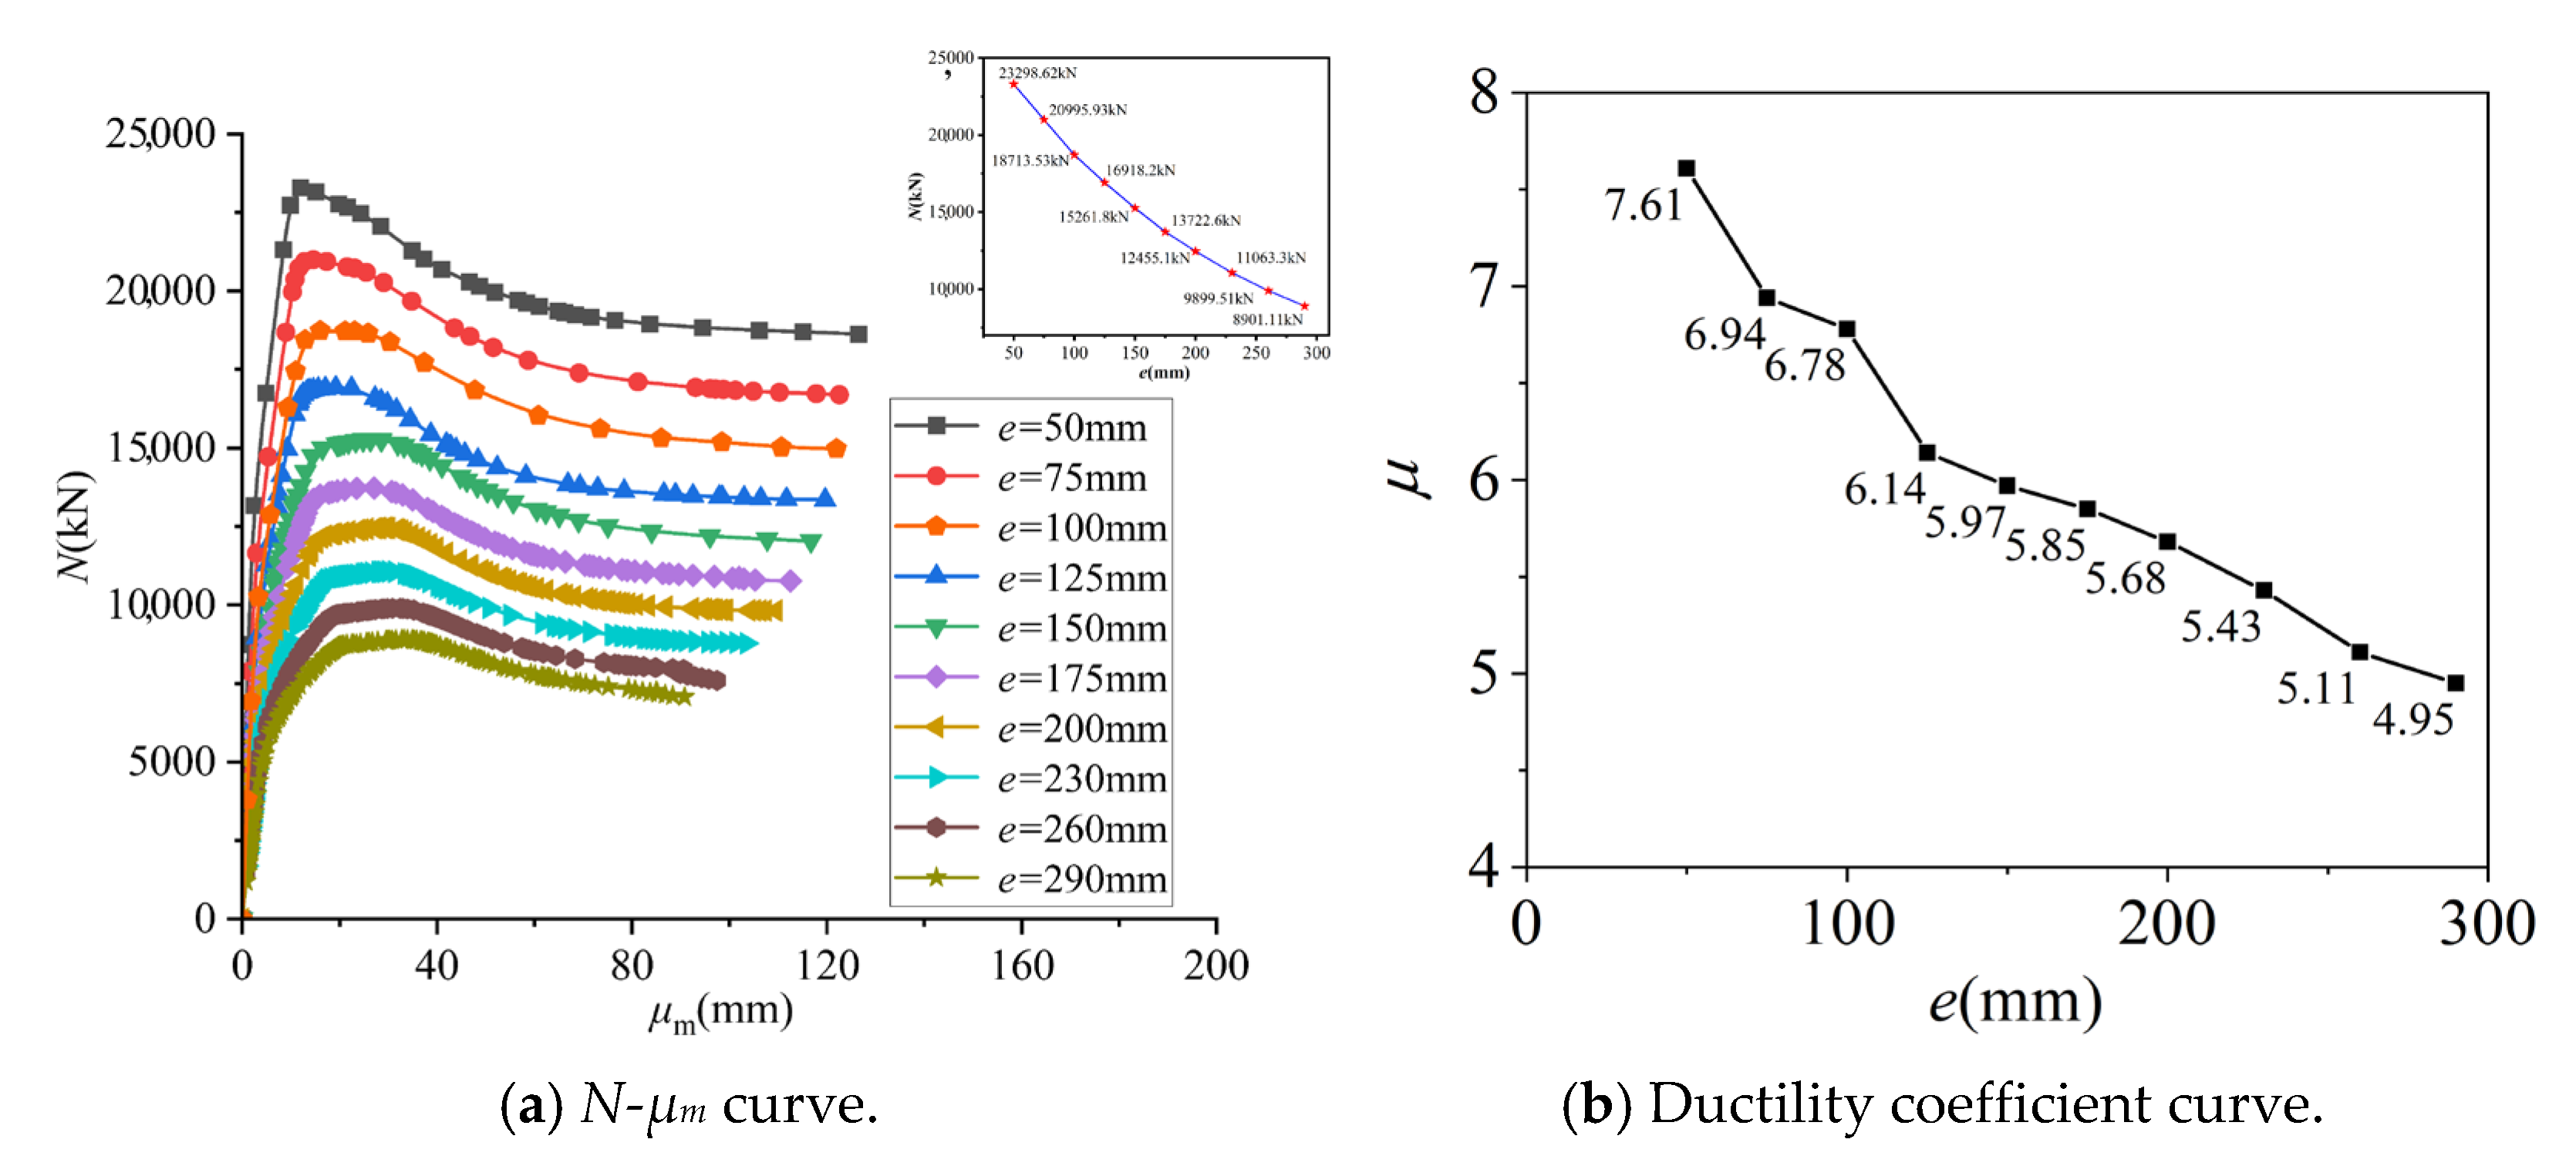
The N-μm curves and ductility coefficient curves for specimens with varying e are presented in Figure 18. With the increment of e (mm) from 50 to 75, 100, 125, 150, 175, 200, 230, 260, 290, the maximum load-bearing capacity (kN) of the specimens decreases from 23,298.62 to 20,995.93, 18,713.53, 16,918.25, 15,261.86, 13,722.65, 12,455.19, 11,063.38, 9899.51, and 8901.11, by 9.88%, 19.68%, 27.39%, 34.49%, 41.10%, 46.54%, 52.52%, 57.51%, and 61.80%, respectively. Conversely, μm reduces from 126.56 to 122.57, 121.90, 119.64, 116.49, 112.53, 109.55, 103.48, 97.45, and 90.78, by 3.15%, 3.68%, 5.47%, 7.96%, 11.09%, 13.44%, 18.24%, 23.00%, and 28.27%, respectively. As e increases, the maximum load-bearing capacity of the EUFDST composite columns under eccentric compression progressively declines, as does μm, and the post-peak load curve’s rate of descent is mitigated. The ductility coefficient of the EUFDST composite columns correspondingly decreases from 7.61 to 6.94, 6.78, 6.14, 5.97, 5.85, 5.68, 5.43, 5.11, 4.95, by 8.8%, 10.91%, 19.32%, 21.55%, 23.12%, 25.36%, 28.65%, 32.85%, and 34.95%. It is evident that with the gradual increase in e, the deformation ability and ductility coefficient of the composite column decrease gradually.
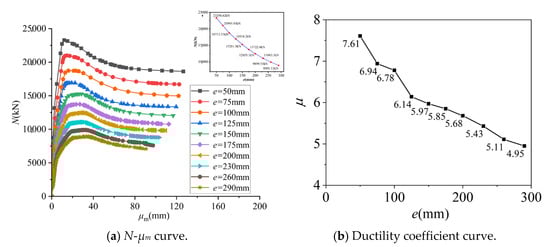
Figure 18.
Comparison of N-μm curves and ductility coefficient curve with different e.
5.1.4. Diameter Ratio of Outer and Inner Steel Tubes (Ω)
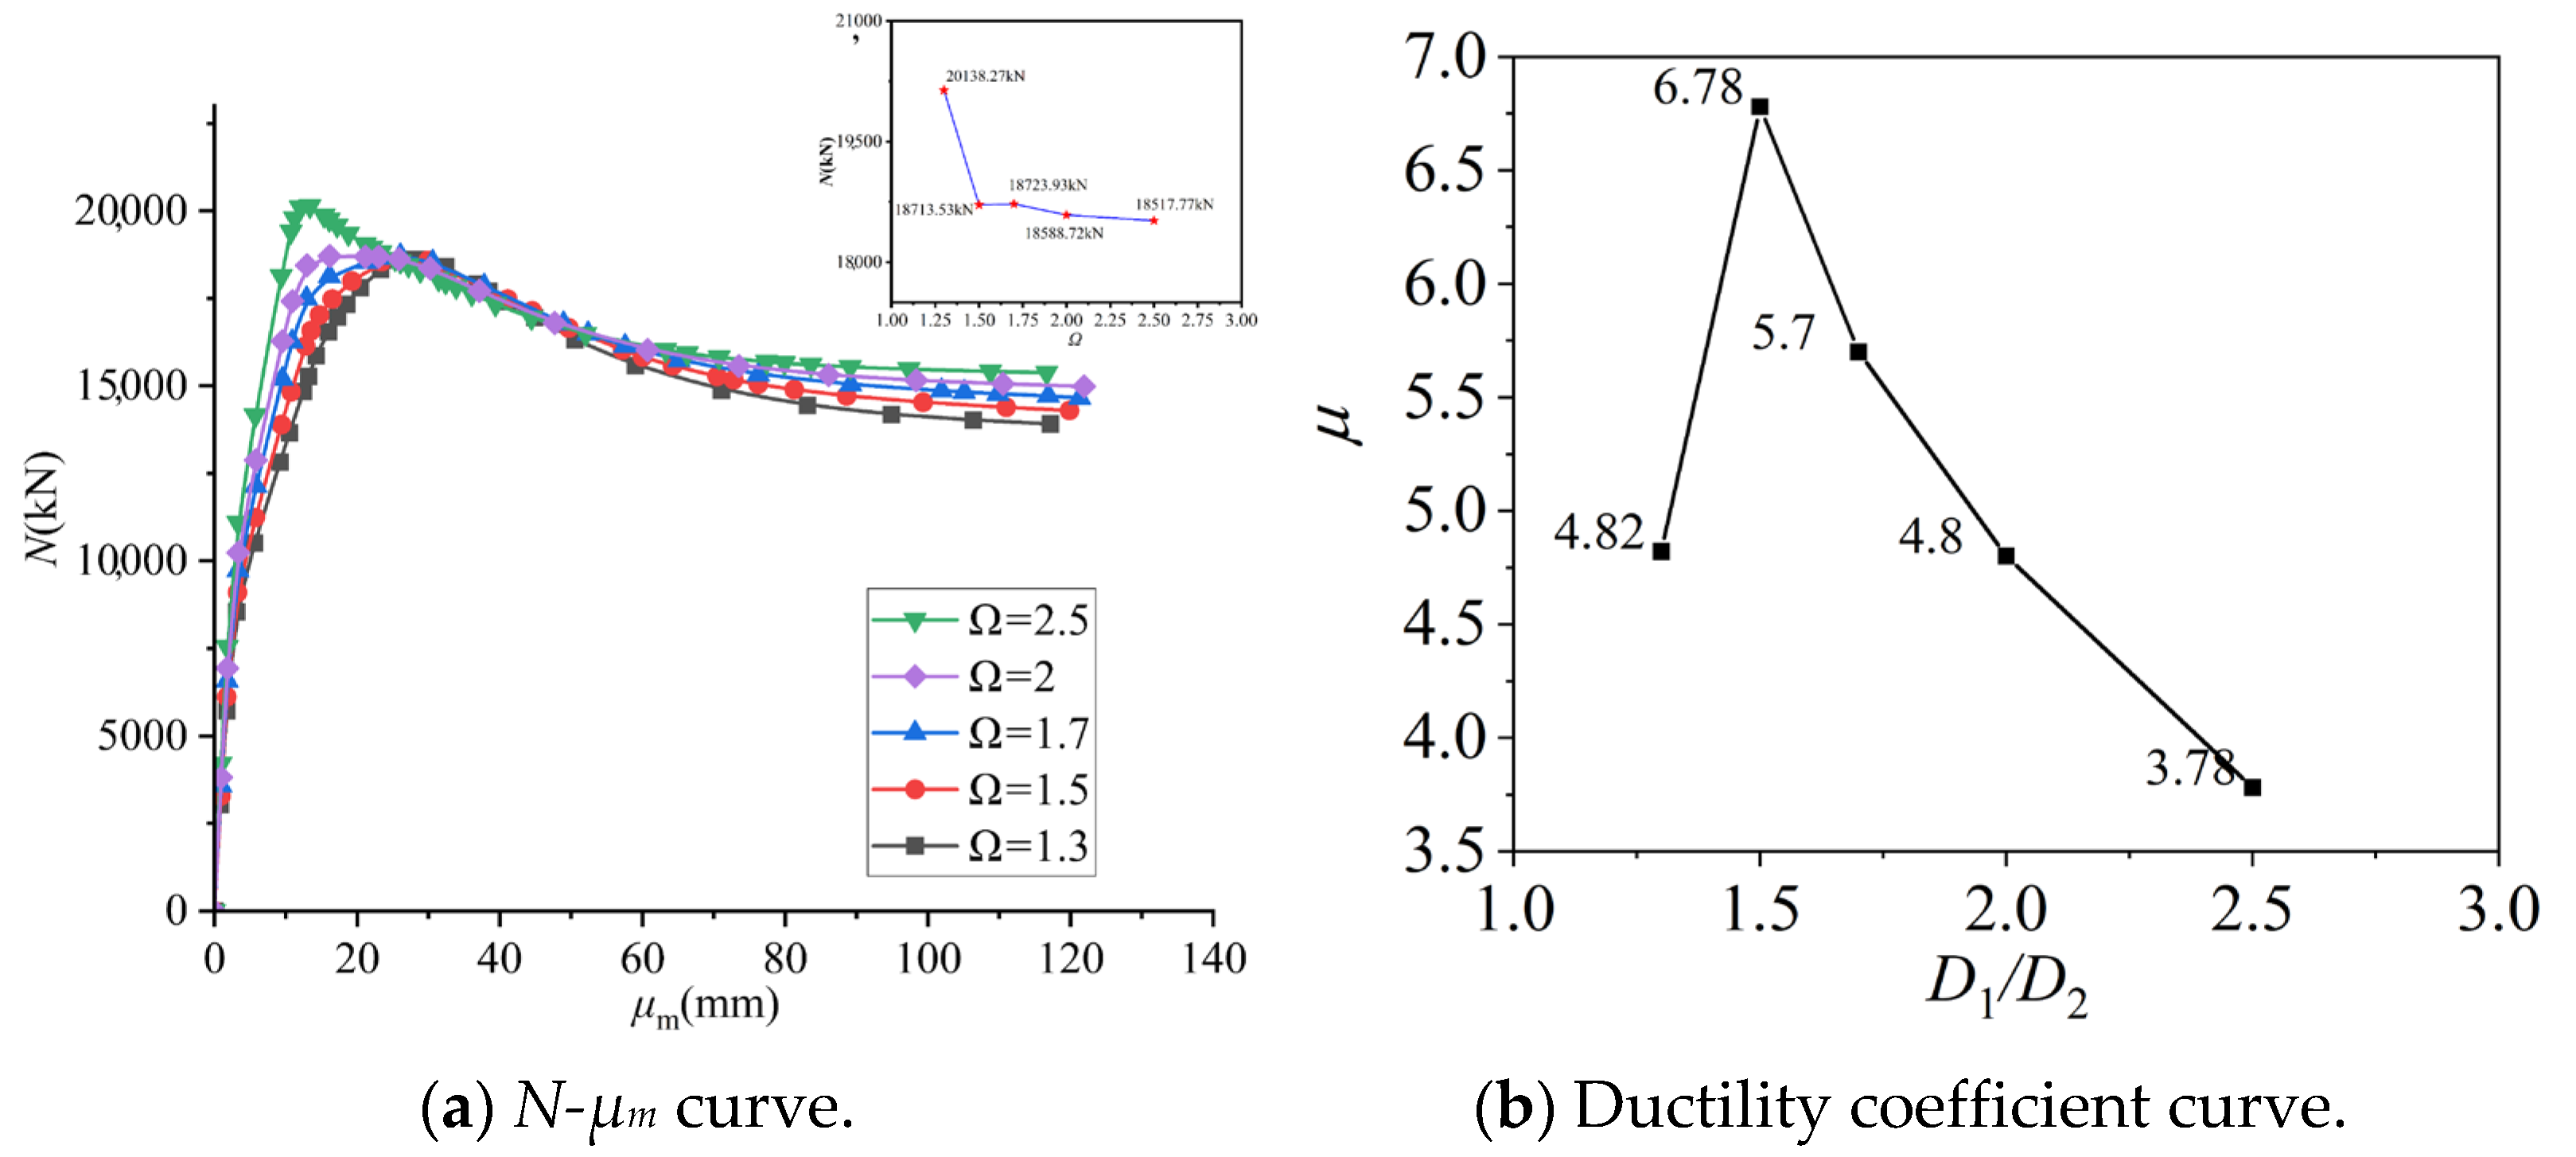
The N-μm curves and ductility coefficient curves for specimens with varying Ω are presented in Figure 19. With the decrement of Ω from 2.5 to 2, 1.7, 1.5, and 1.3, the maximum load-bearing capacity (kN) of the specimens increases from 18,517.77 to 18,588.72, 18,732.93, 18,713.53, and 20,138.27, by 0.38%, 1.11%, 1.33%, and 8.75%, respectively. The μm increased from 117.16 mm to 119.85 mm, 121.31 mm, 121.90 mm, and 122.35 mm, which increased by 2.30%, 2.54%, 4.05%, and 4.43%, respectively. With the decrease in Ω, the maximum load-bearing capacity of the composite columns increases gradually, and the μm of the composite columns increases gradually. When Ω decreases from 1.5 to 1.3, the maximum load-bearing capacity of the composite columns undergoes significant changes. When Ω changes in the range of 2.5 to 1.5, the maximum load-bearing capacity of the composite column changes slightly. It is found that when Ω decreases from 2.5 to 2, 1.7, and 1.5, the ductility coefficient of the EUFDST composite columns increases from 3.78 to 4.8, 5.7, and 6.78, which increases by 21.25%, 33.68%, and 44.25%, respectively. However, when Ω decreases from 1.5 to 1.3, the ductility coefficient of the composite column under eccentric load decreases from 6.78 to 4.82, which decreases by 29.0%. It is evident that when Ω decreases from 2.5 to 1.5, the ductility coefficient of the composite column under eccentric load increases gradually. Therefore, it is suggested that the composite column Ω should be kept above 1.5 to improve the deformation capacity of the composite column under eccentric load.
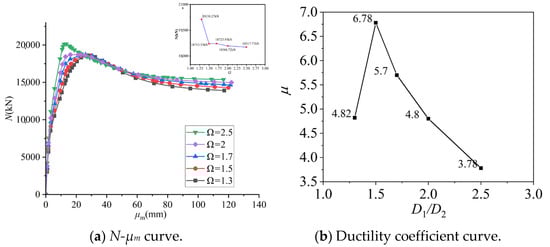
Figure 19.
Comparison of N-μm curves and ductility coefficient curve with different Ω.
5.1.5. Slenderness Ratio (λ)
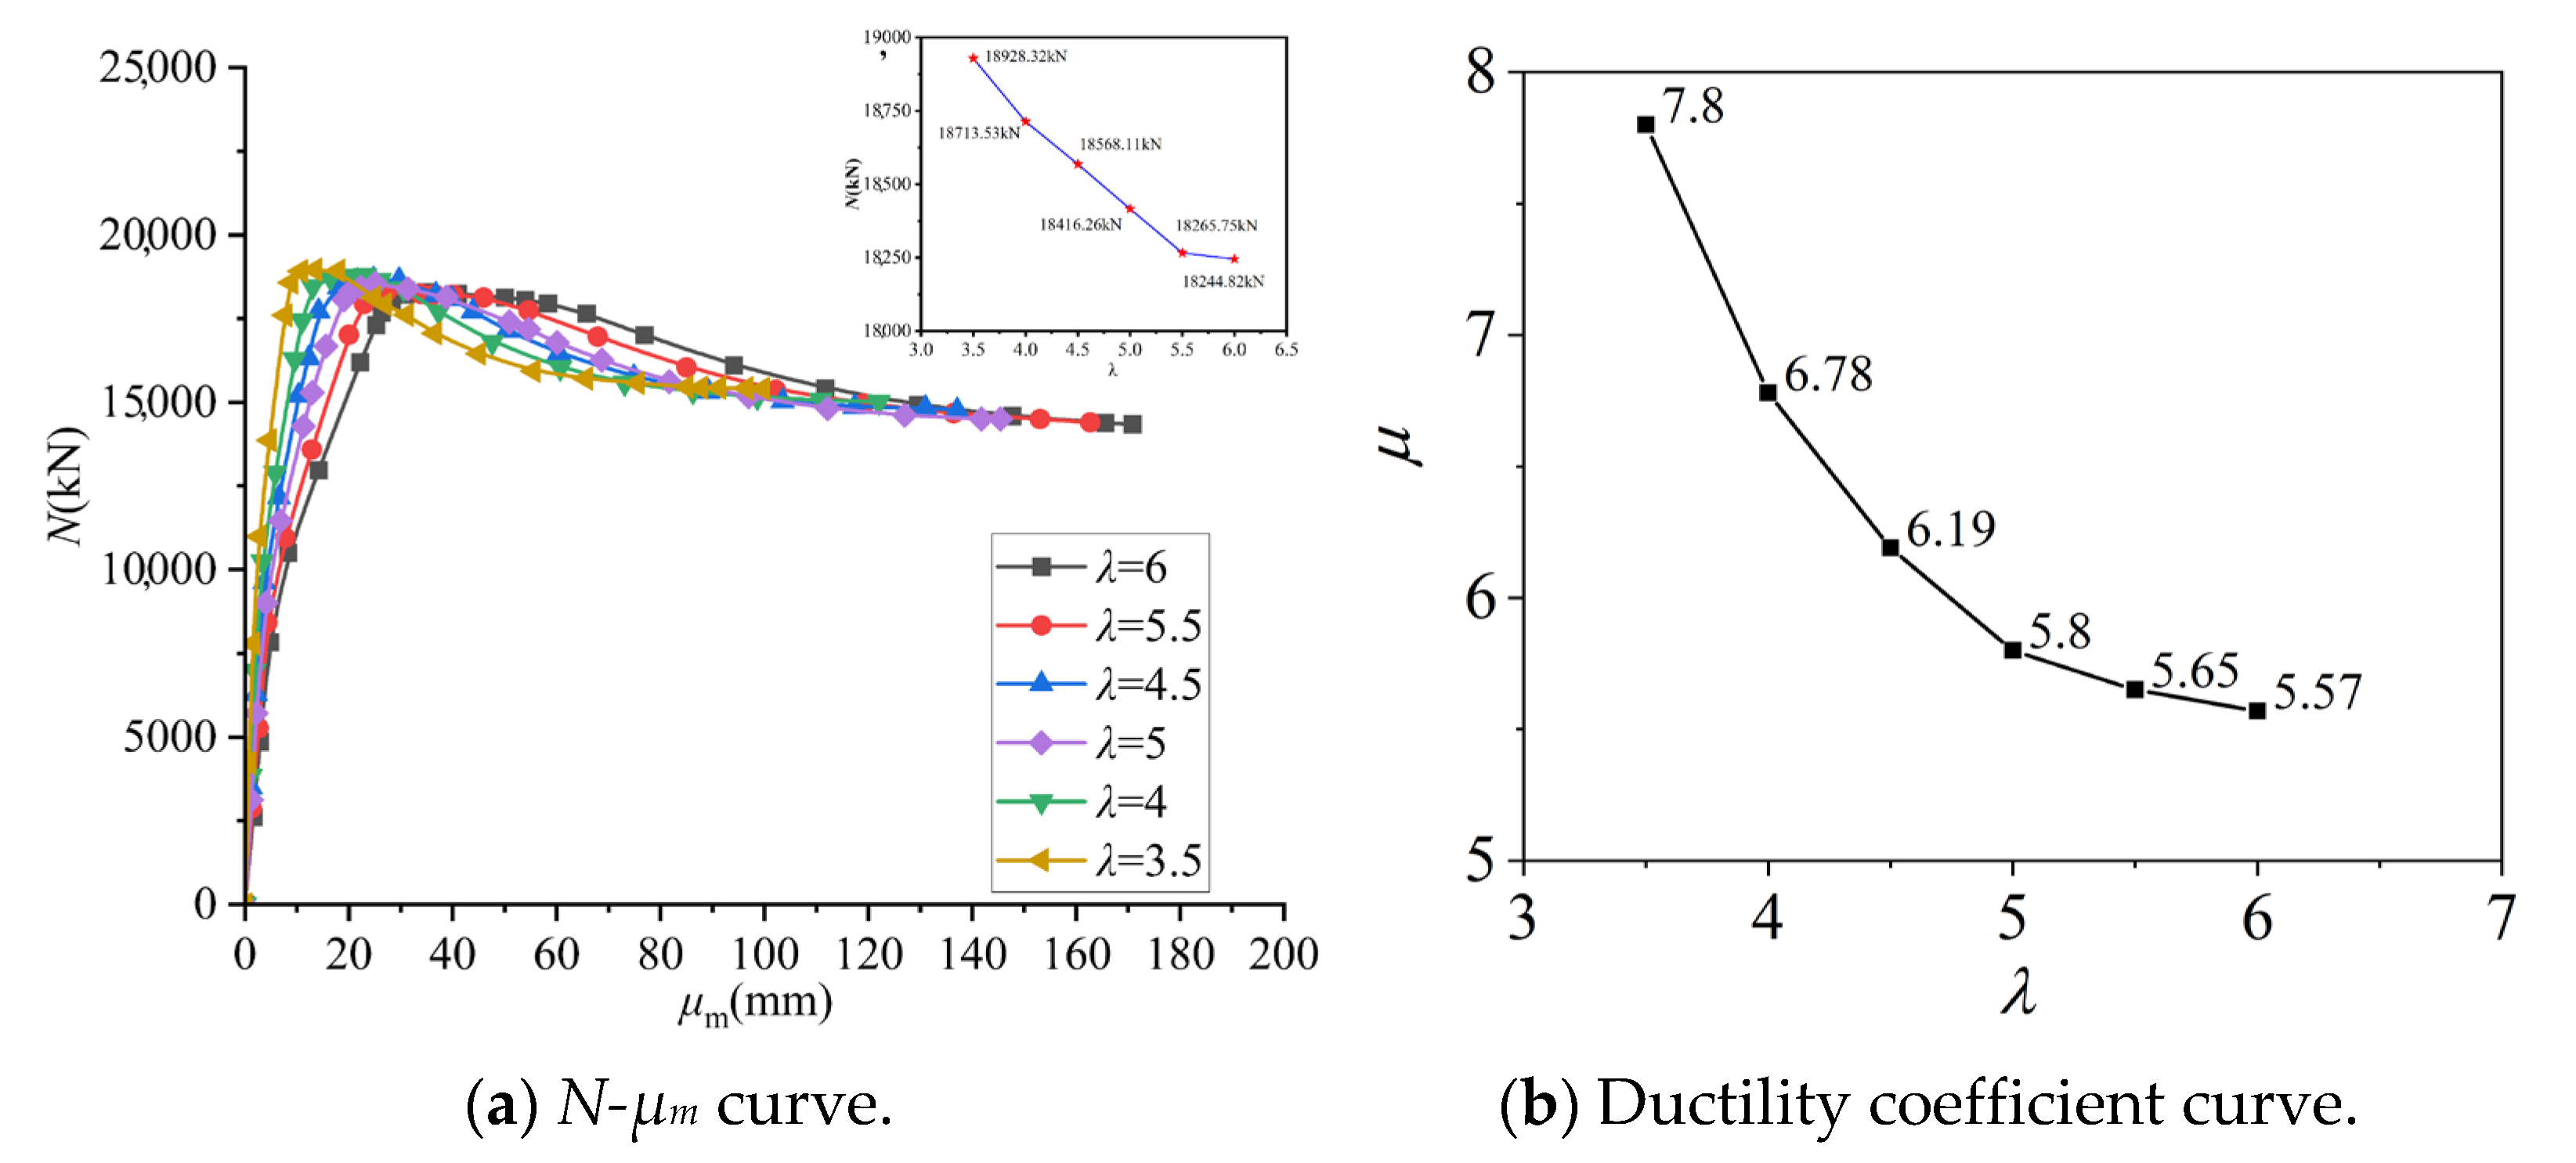
The N-μm curves and ductility coefficient curves for specimens with varying λ are presented in Figure 20. With the decrement of λ from 3.5 to 4, 4.5, 5, 5.5, and 6, the maximum load-bearing capacity (kN) of the specimens decreased from 18,928.32 to 18,713.53, 18,568.11, 18,416.26, 18,265.75, and 18,244.82, which decrease by 1.04%, 1.90%, 2.71%, 3.50%, and 3.77%, respectively. The μm increased from 99.32 mm to 121.9 mm, 136.88 mm, 145.36 mm, 162.61 mm, and 170.56 mm, which increases by 18.52%, 27.44%, 31.67%, 38.92%, and 41.77%, respectively. With the increase in λ, the maximum load-bearing capacity of the composite column decreases gradually, and the μm of the composite column increases gradually. When λ increases from 3.5 to 4, 4.5, 5, 5.5, and 6, the ductility coefficient of the EUFDST composite columns decreases from 7.8 to 6.78, 6.19, 5.8, 5.65, and 5.57, which decrease by 13.08%, 20.64%, 25.64%, 27.56%, and 28.59%, respectively. It is evident that with the increase in composite column λ, the deformation capacity of the composite column under eccentric load decreases gradually, and the ductility coefficient decreases gradually.
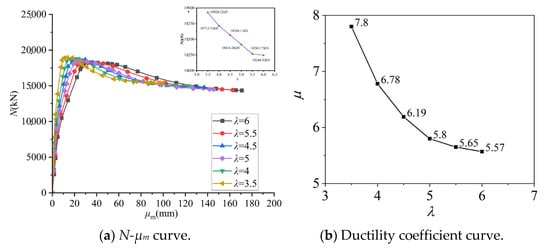
Figure 20.
Comparison of N-μm curves and ductility coefficient curve with different λ.
5.1.6. Compressive Strength of UHPC Cylinder (fcu)
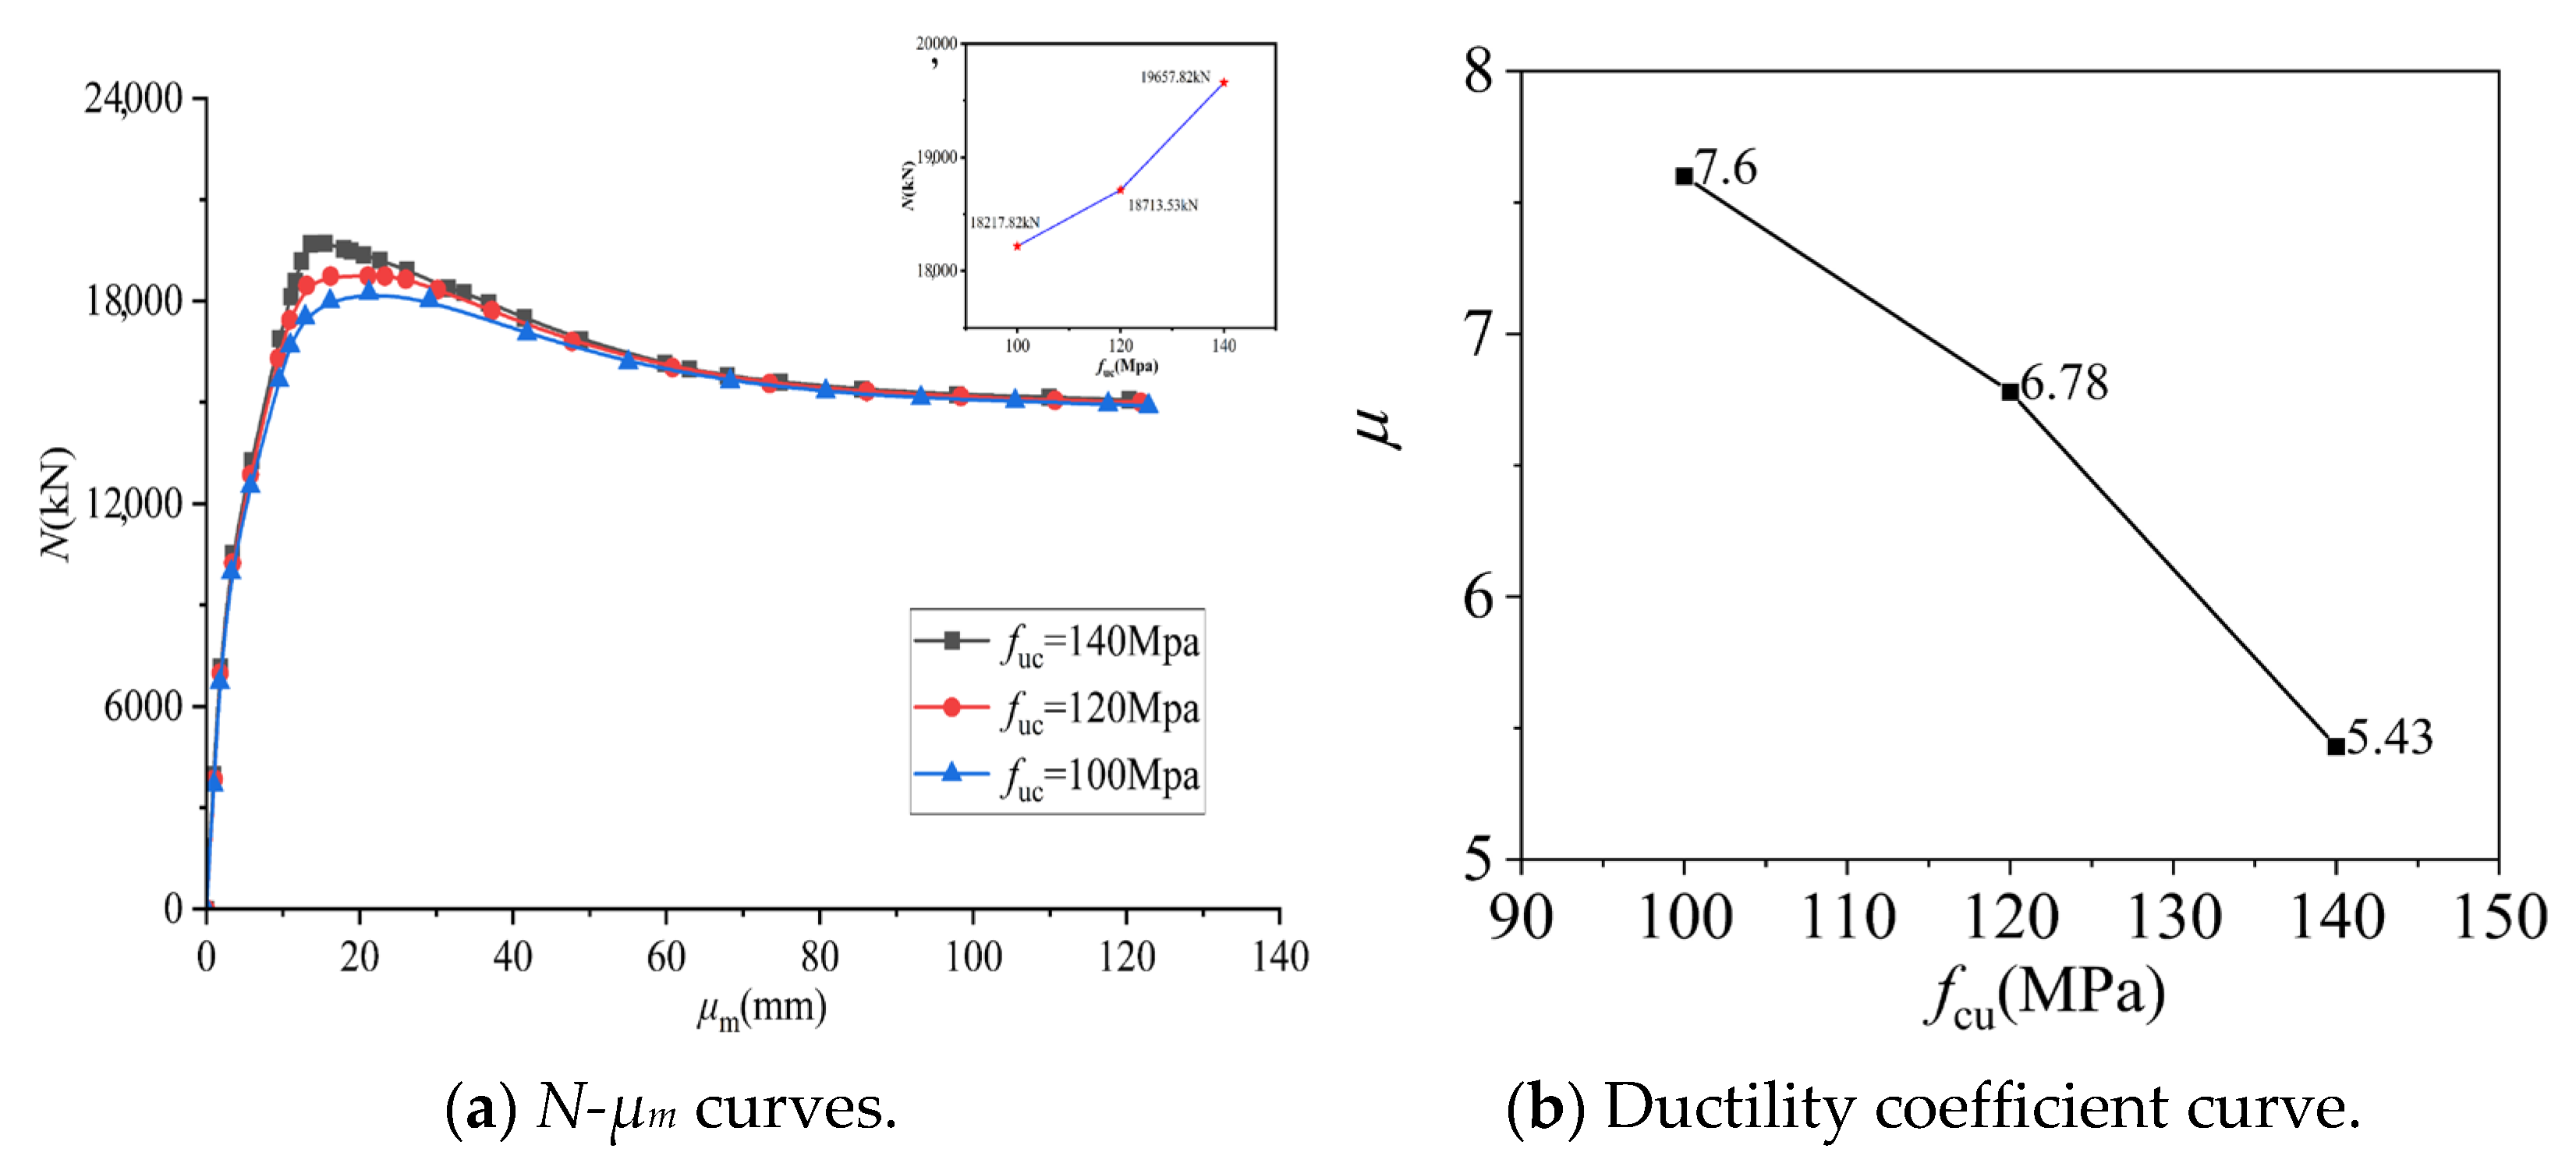
The N-μm curves and ductility coefficient curves for specimens with varying fcu are presented in Figure 21. With the increment of fcu (Mpa) from 100 to 120 and 140, the maximum load-bearing capacity (kN) of the EUFDST composite columns increased from 18,271.82 to 18,713.53 and 19,657.82, which increased by 2.72% and 7.90%, respectively. At the same time, μm decreases from 121.01 mm to 121.90 mm and 120.38 mm, which decreases by 0.9% and 2.14%, respectively. It is evident that with the gradual increase in fcu, the maximum load-bearing capacity of the EUFDST composite columns under eccentric compression increases gradually, and their μm decreases gradually. However, the decreasing rate of the N-μm curve after peak load increases with the gradual increase in fcu. When fcu (Mpa) increases from 100 to 120 and 140, the ductility of the EUFDST composite columns decreases from 7.6 to 6.78 and 5.43, which decreases by 4.5% and 26.9%, respectively. It is evident that with the increase in fcu, the ductility of the composite column decreases gradually.
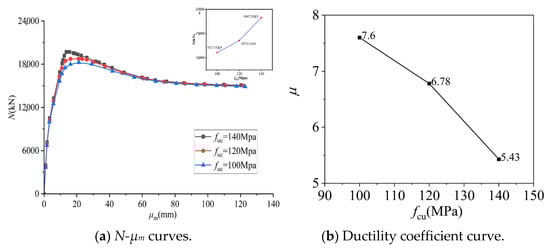
Figure 21.
Comparison of N-μm curves and ductility coefficient curve with different fcu.
5.1.7. PVA Fiber Content (γ)
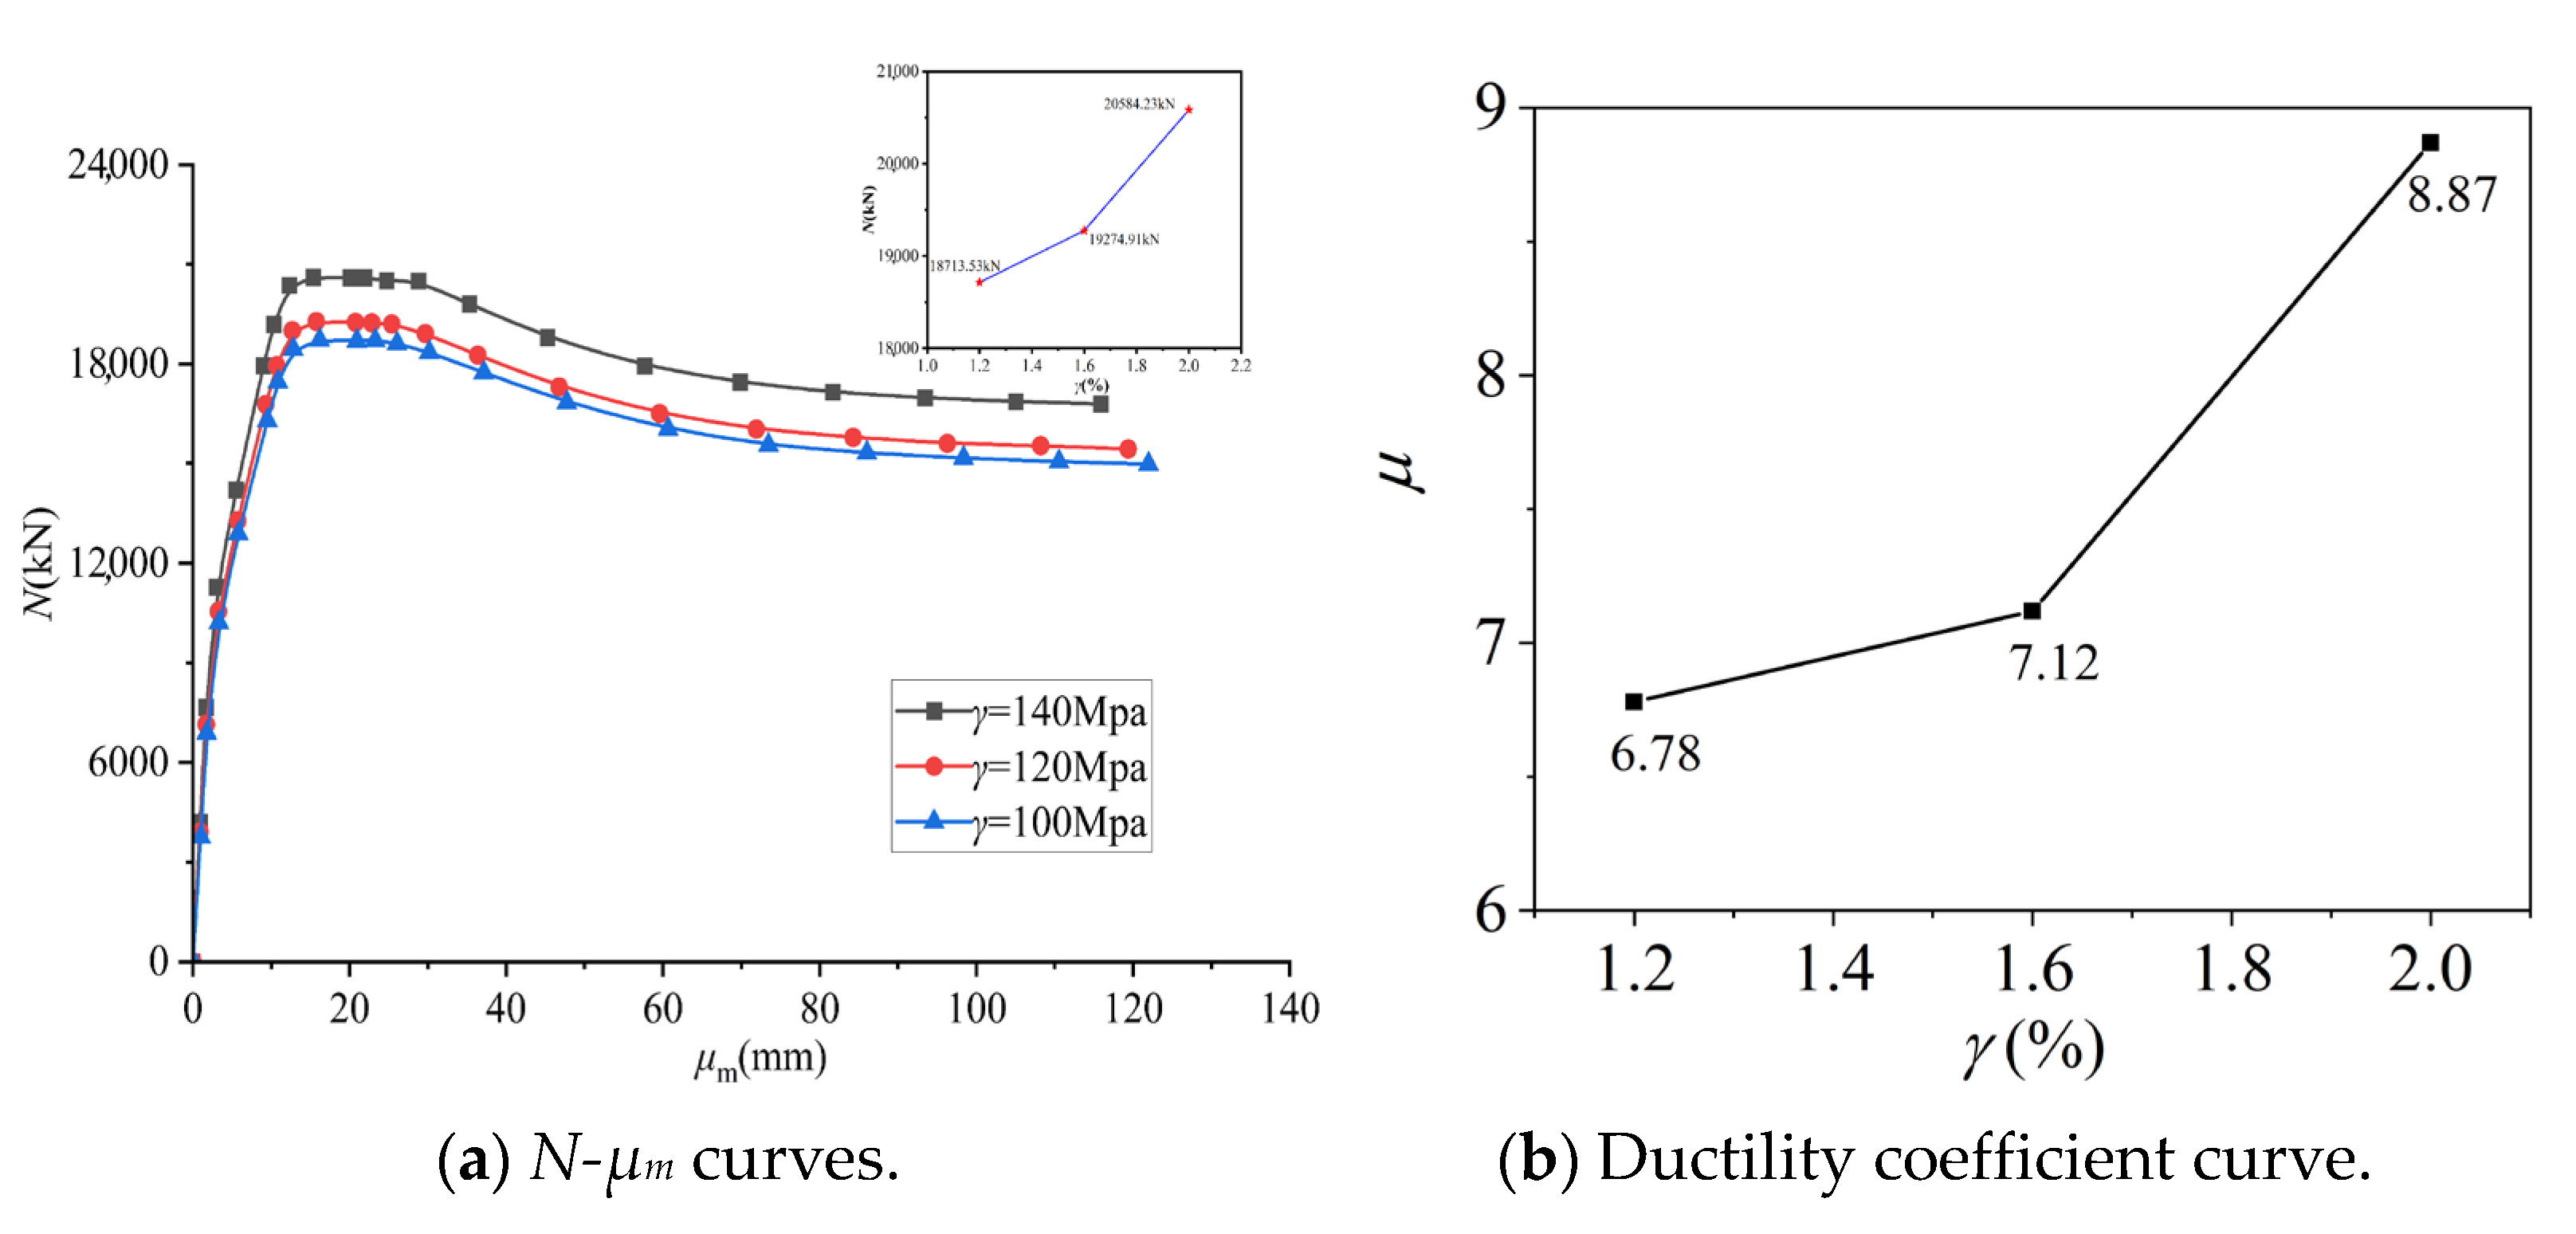
The N-μm curves and ductility coefficient curves for specimens with varying γ are presented in Figure 22. When γ is 1.2%, 1.6%, and 2%, the maximum load-bearing capacity (kN) of the EUFDST composite columns under eccentric compression increases from 18,713.53 to 192,743.91 and 20,584.23, which increase by 3.00% and 10.00% respectively, while μm decreases from 121.90 mm to 119.40 mm and 115.80 mm, which decrease by 2.05% and 5.00%, respectively. It is evident that with the increase in γ, the maximum load-bearing capacity of the EUFDST composite column increases gradually, and the deflection in the column decreases gradually at the end of loading. When γ increases from 1.2% to 1.6, 2%. The ductility of the EUFDST composite columns rose from 6.78 to 7.12 and 8.87, which increased by 5.01% and 30.8%, respectively. It is evident that with the increase in γ, the ductility of the composite column gradually increases.

Figure 22.
Comparison of N-μm curves and ductility coefficient curve with different γ.
5.2. Analysis of Deformation Law of Full-Scale EUFDST Composite Columns under Eccentric Load
5.2.1. Lateral Deflection Curves
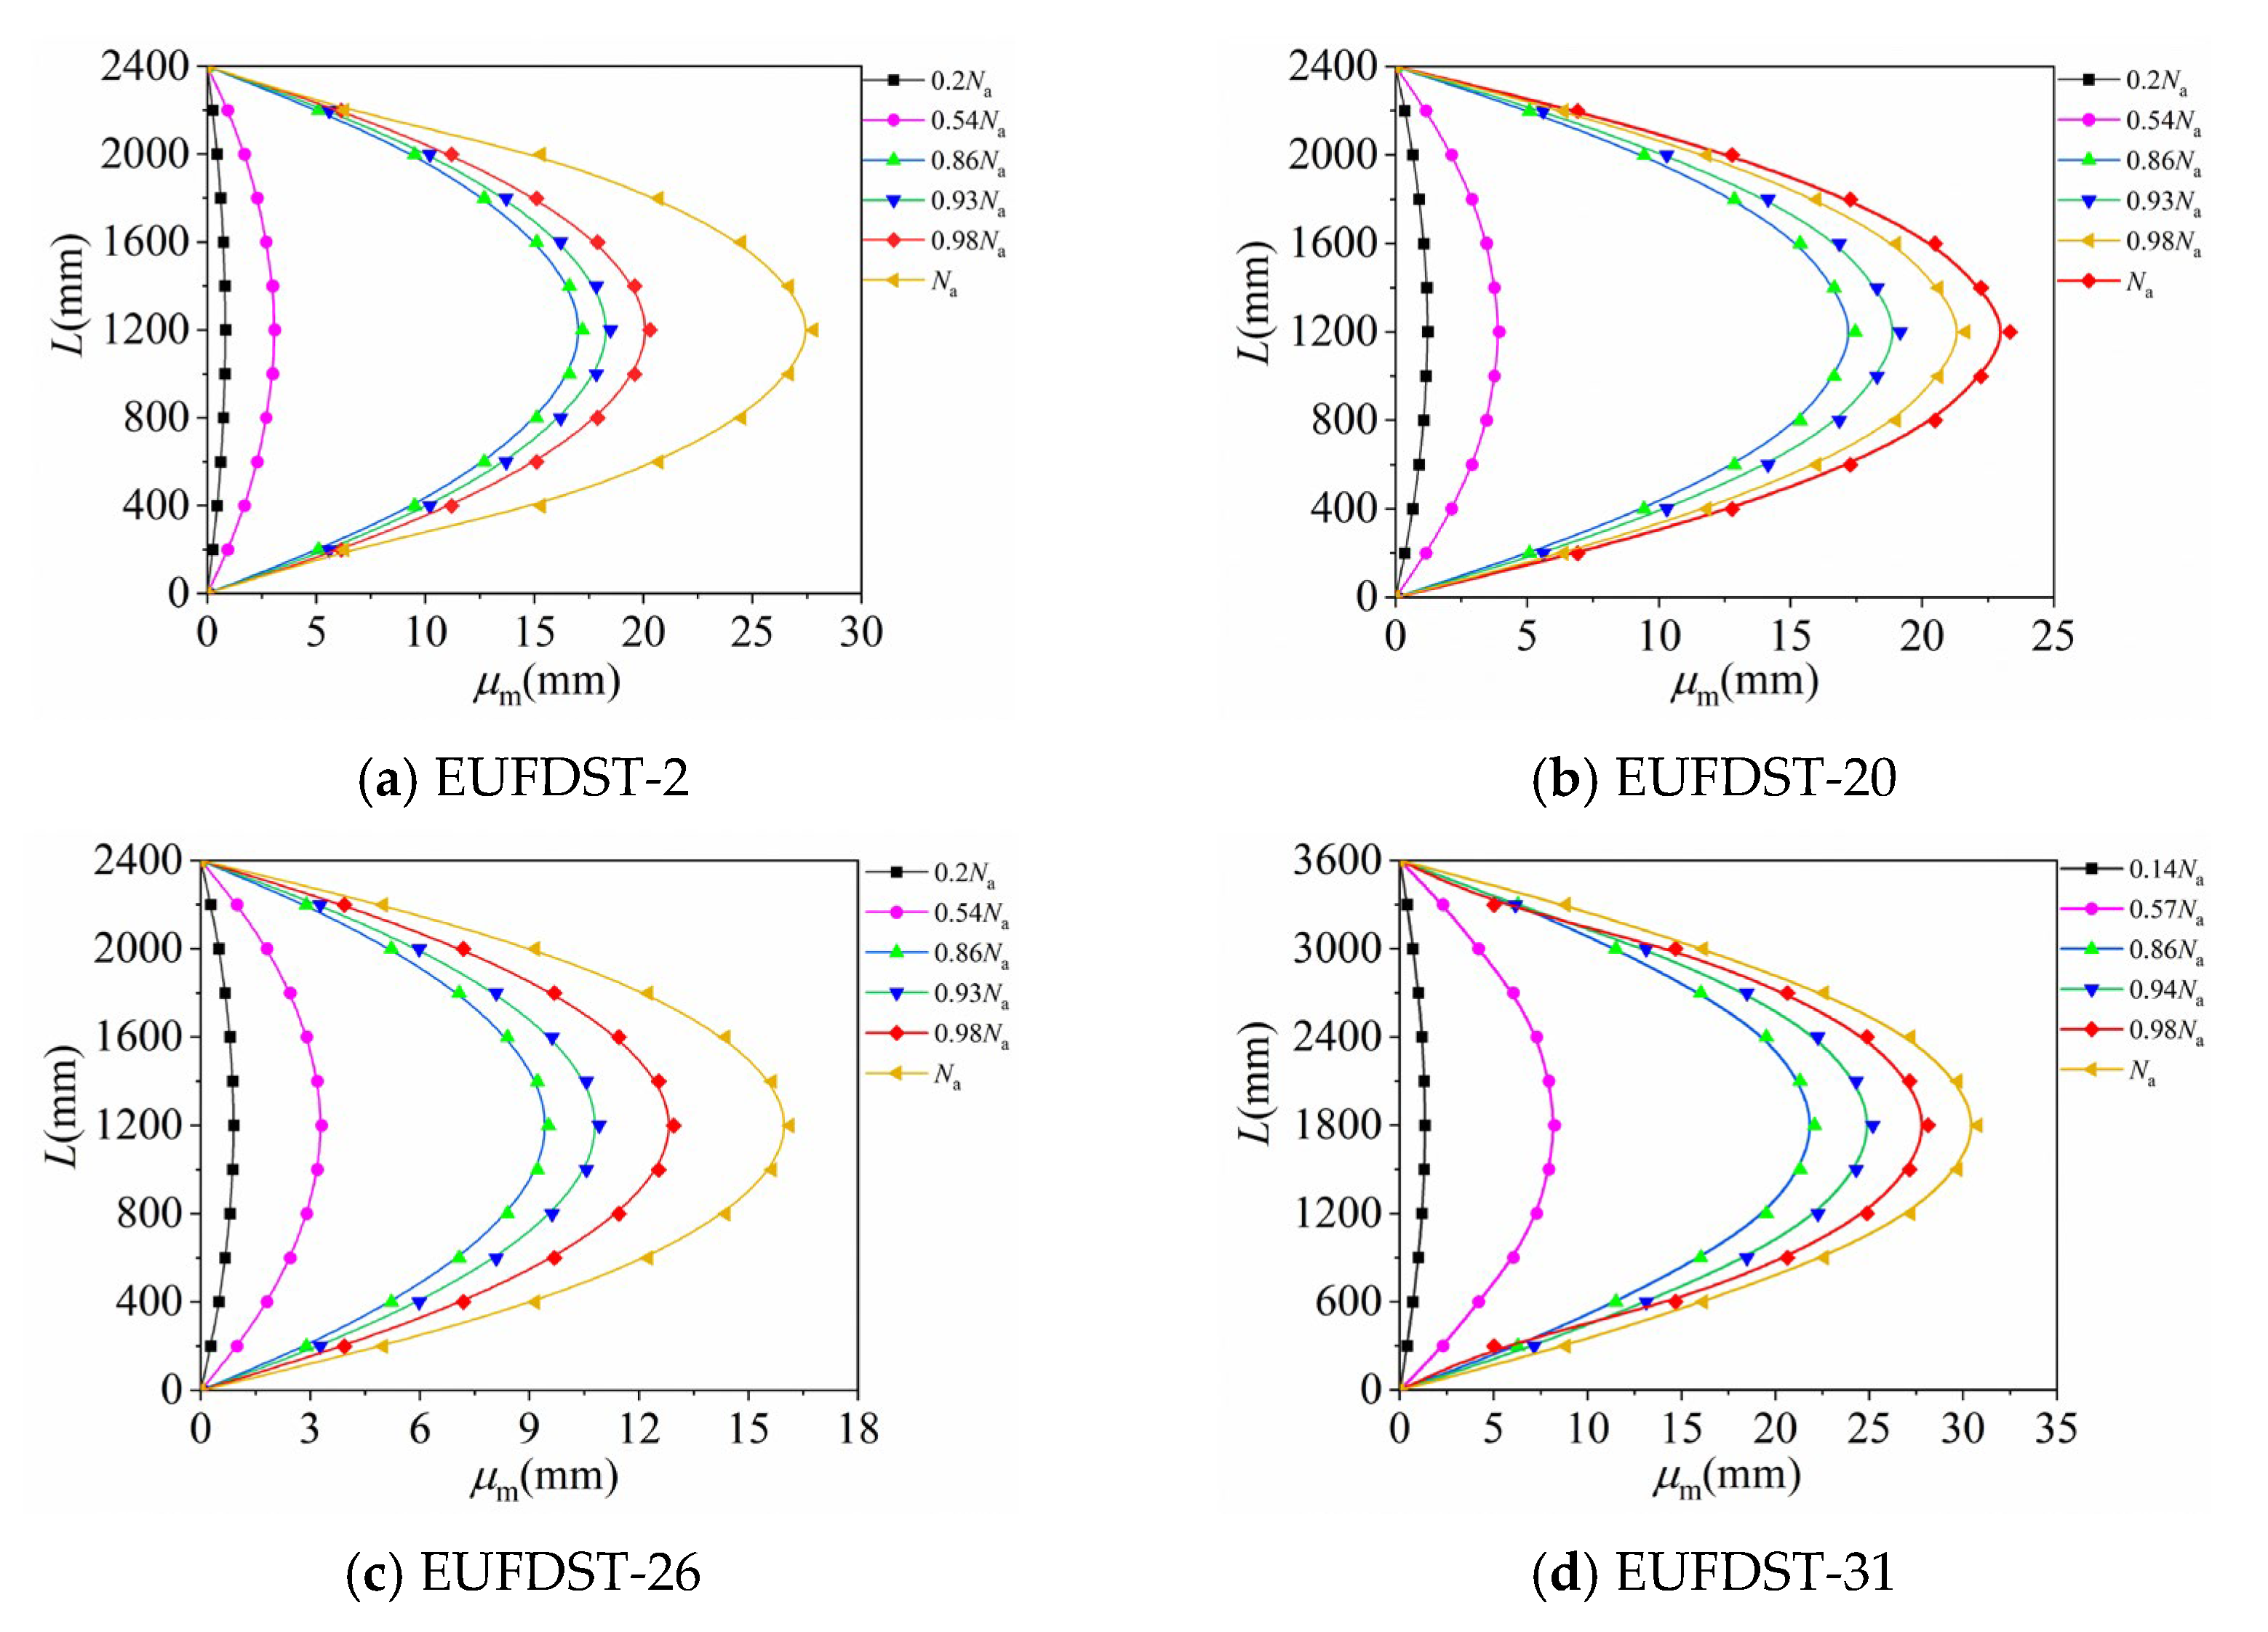
To study the deformation capacity of EUFDST composite columns under eccentric load, the column height–lateral deflection (H-μm) curves of typical specimens EUFDST-2, EUFDST-26, EUFDST-20, and EUFDST-31 are drawn, as depicted in Figure 23. In the early loading stage, the H-μm curve of the EUFDST composite column under eccentric load is basically a linear distribution. When the load gradually increases to 0.54 Nu, the deflection changes little with height. When the load increases to 0.54–0.57 Nu, the H-μm curve shows a nonlinear distribution. When the load increases from 0.54 Nu to 0.86 Nu, the deflection increases significantly with height. When the load increases from 0.86 Nu to the peak load, the deflection change begins to stabilize, and the gradual increase is significantly greater than the initial loading. Under the action of loads at all levels, the deflection changes along the section height are basically symmetrically distributed, which is approximately a sinusoidal function curve [31]. The column height–lateral deflection curve is similar to that of ordinary concrete-filled steel tubular columns. The deflection relationship between each point can be expressed by Equation (4) [32]:
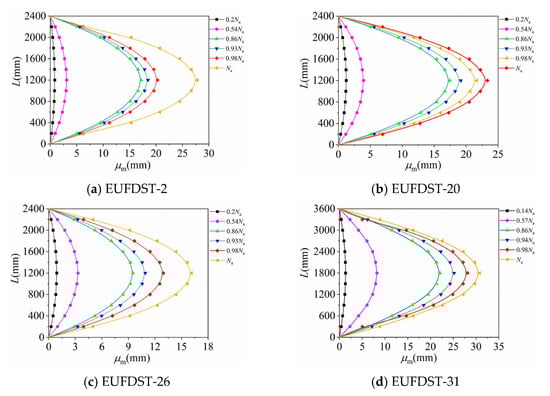
Figure 23.
Column height–lateral deflection curves of typical specimens.
In the equation, μm represents the deflection of the column under various loads. Z denotes the distance from each point on the specimen to the mid-span position. H signifies the height of the column.
5.2.2. Longitudinal Strain Distribution Law of Mid-Span Section
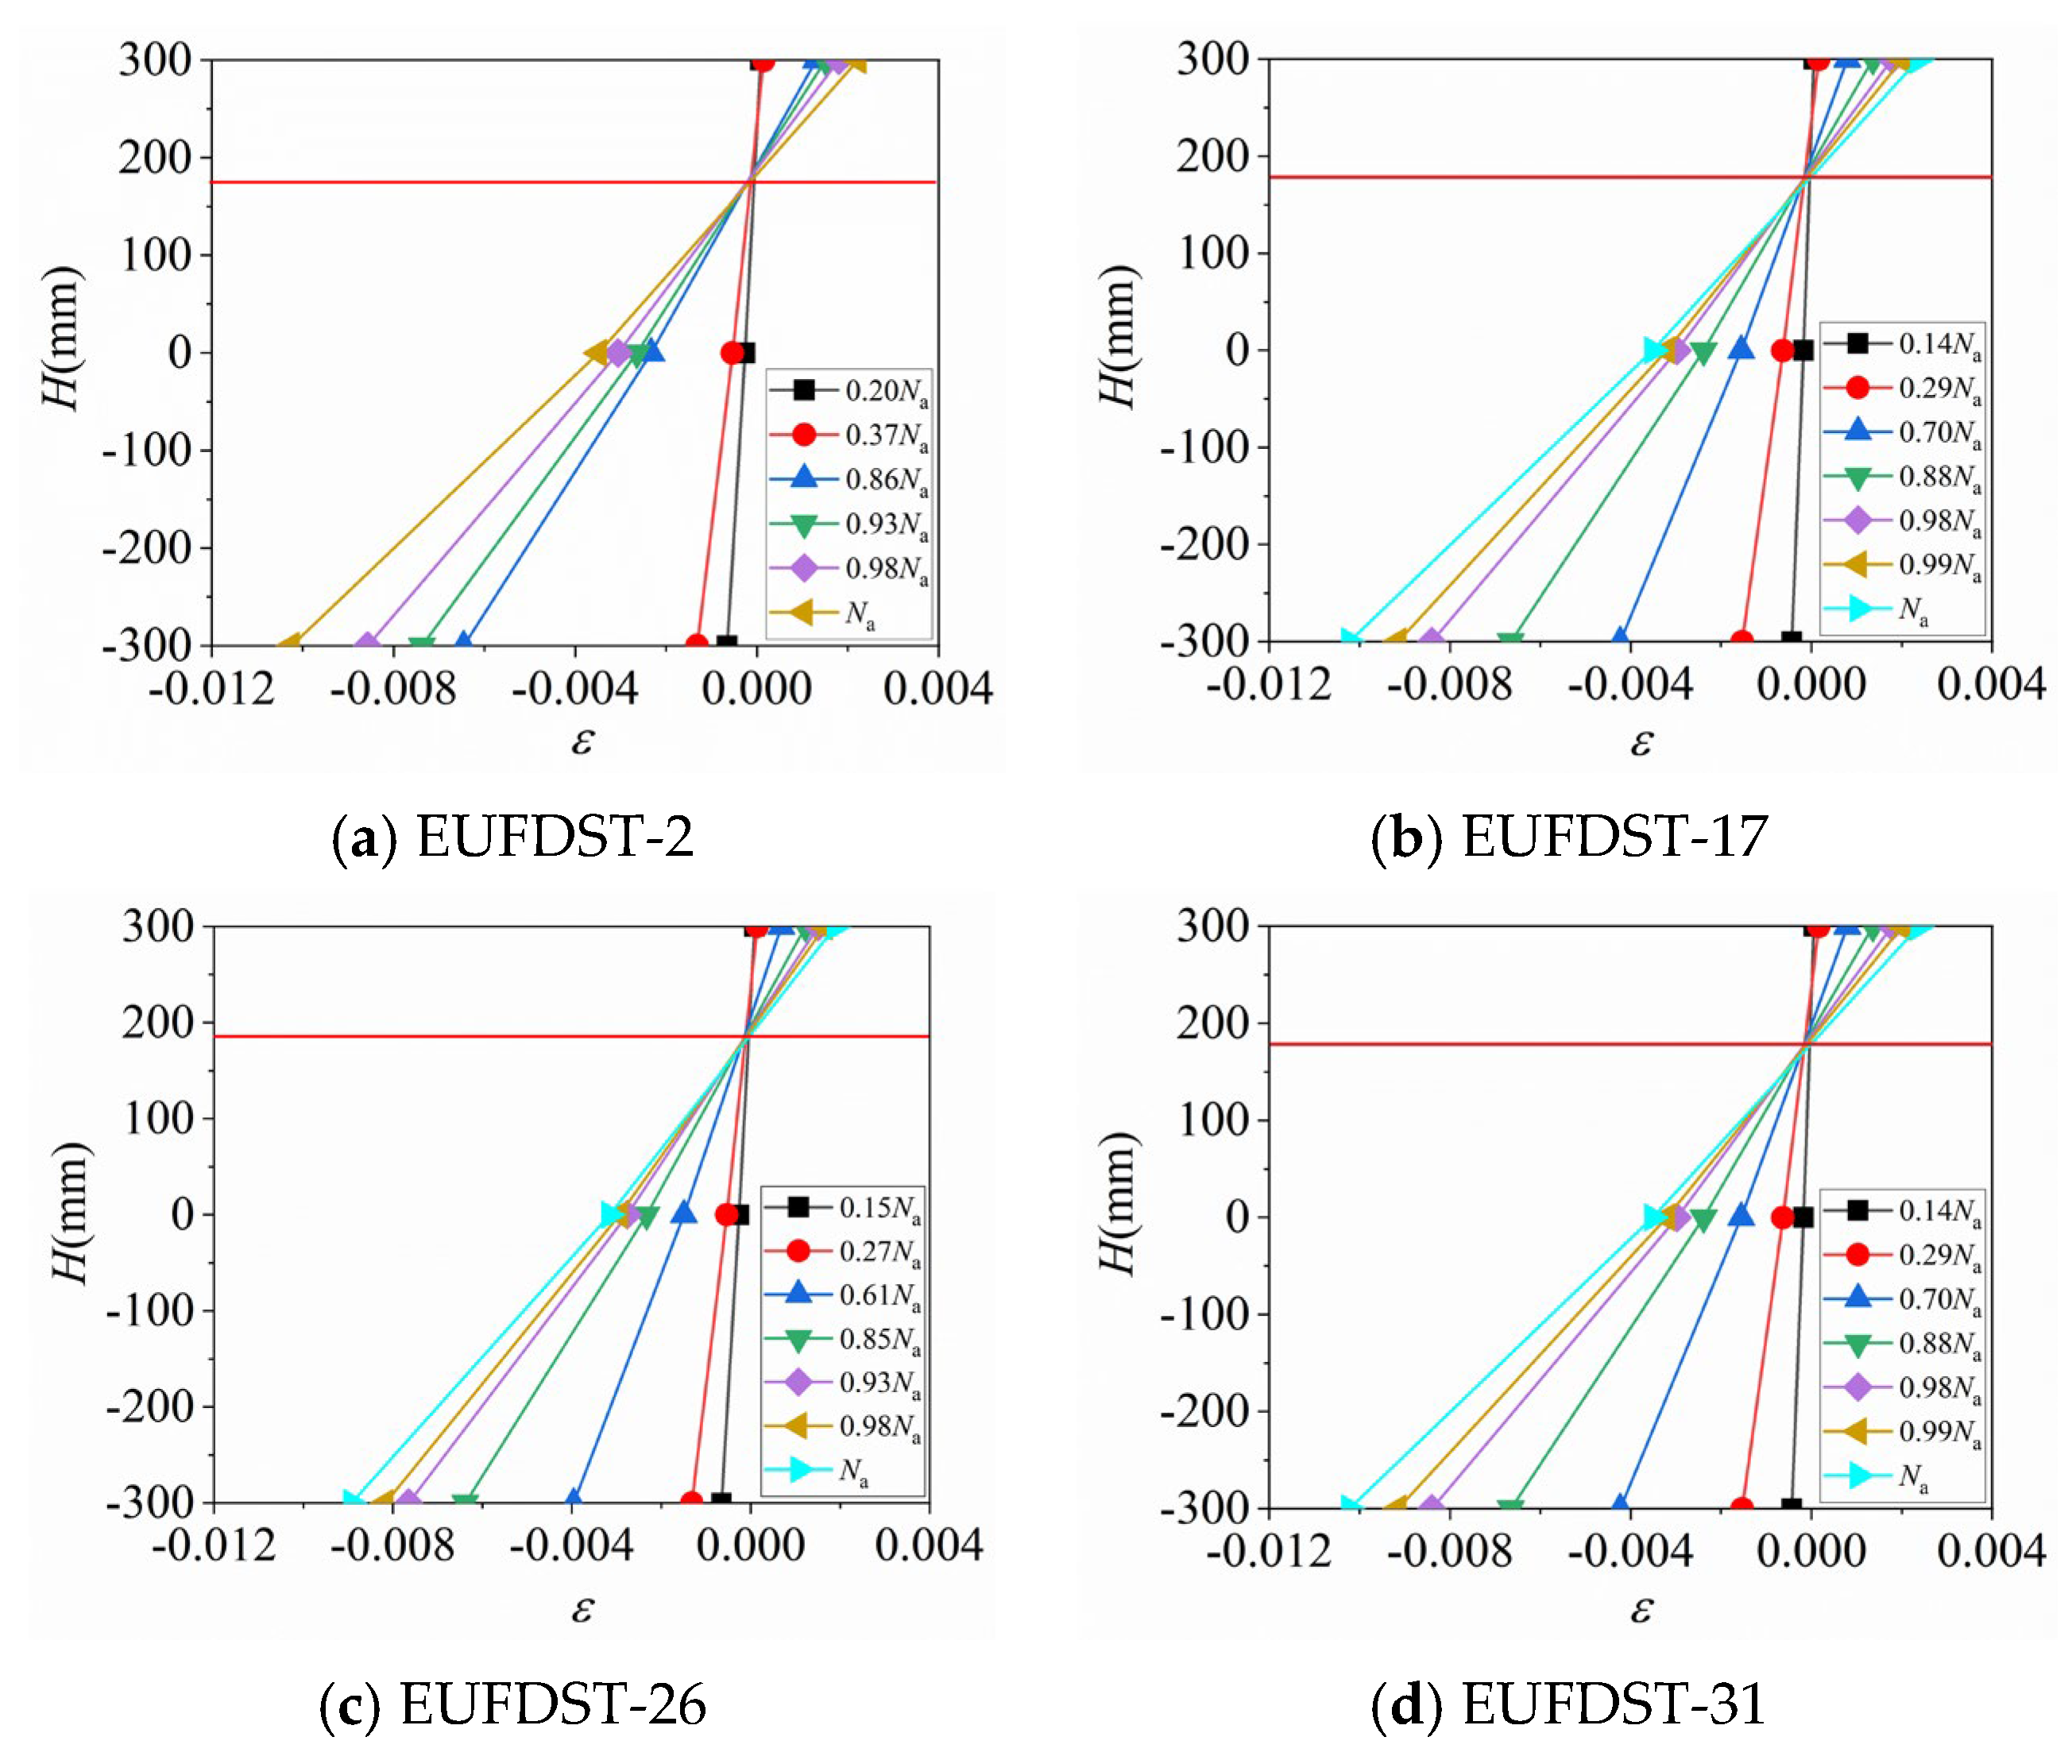
Given that the maximum deflection of a full-size EUFDST composite column is located at the mid-span section under eccentric load, it is necessary to study whether this composite column satisfies the plane section assumption. To this end, four typical specimens were selected from 35 EUFDST composite columns, and the longitudinal strain distribution curve of the mid-span section was drawn. As shown in Figure 24, the three selected measuring points are located at the end points of the compression side, tension side, and midpoint of the mid-span section. As the load gradually increases, the longitudinal strain curves of the mid-span section show smaller differences, and the strain changes linearly along the section height. This result shows that the mid-span section does comply with the plane section assumption when subjected to stress. This analysis shows that even under eccentric loading conditions, the mid-span section of the EUFDST composite column can better maintain structural integrity and consistency, indicating that the materials and structural layout used in the design can effectively transmit and distribute the load. This uniform distribution of longitudinal strain provides an experimental basis for the further verification and optimization of composite column design, helping to improve the prediction accuracy and reliability of the structure. These observations also provide important reference information for similar structural design, especially in performing eccentric loading analysis and assessing structural integrity.
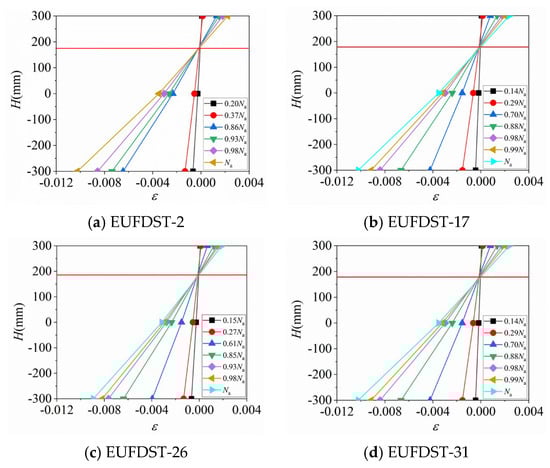
Figure 24.
Longitudinal strain distribution curves of mid-span sections.
5.2.3. Load–Strain Curve Analysis of Steel Tubes
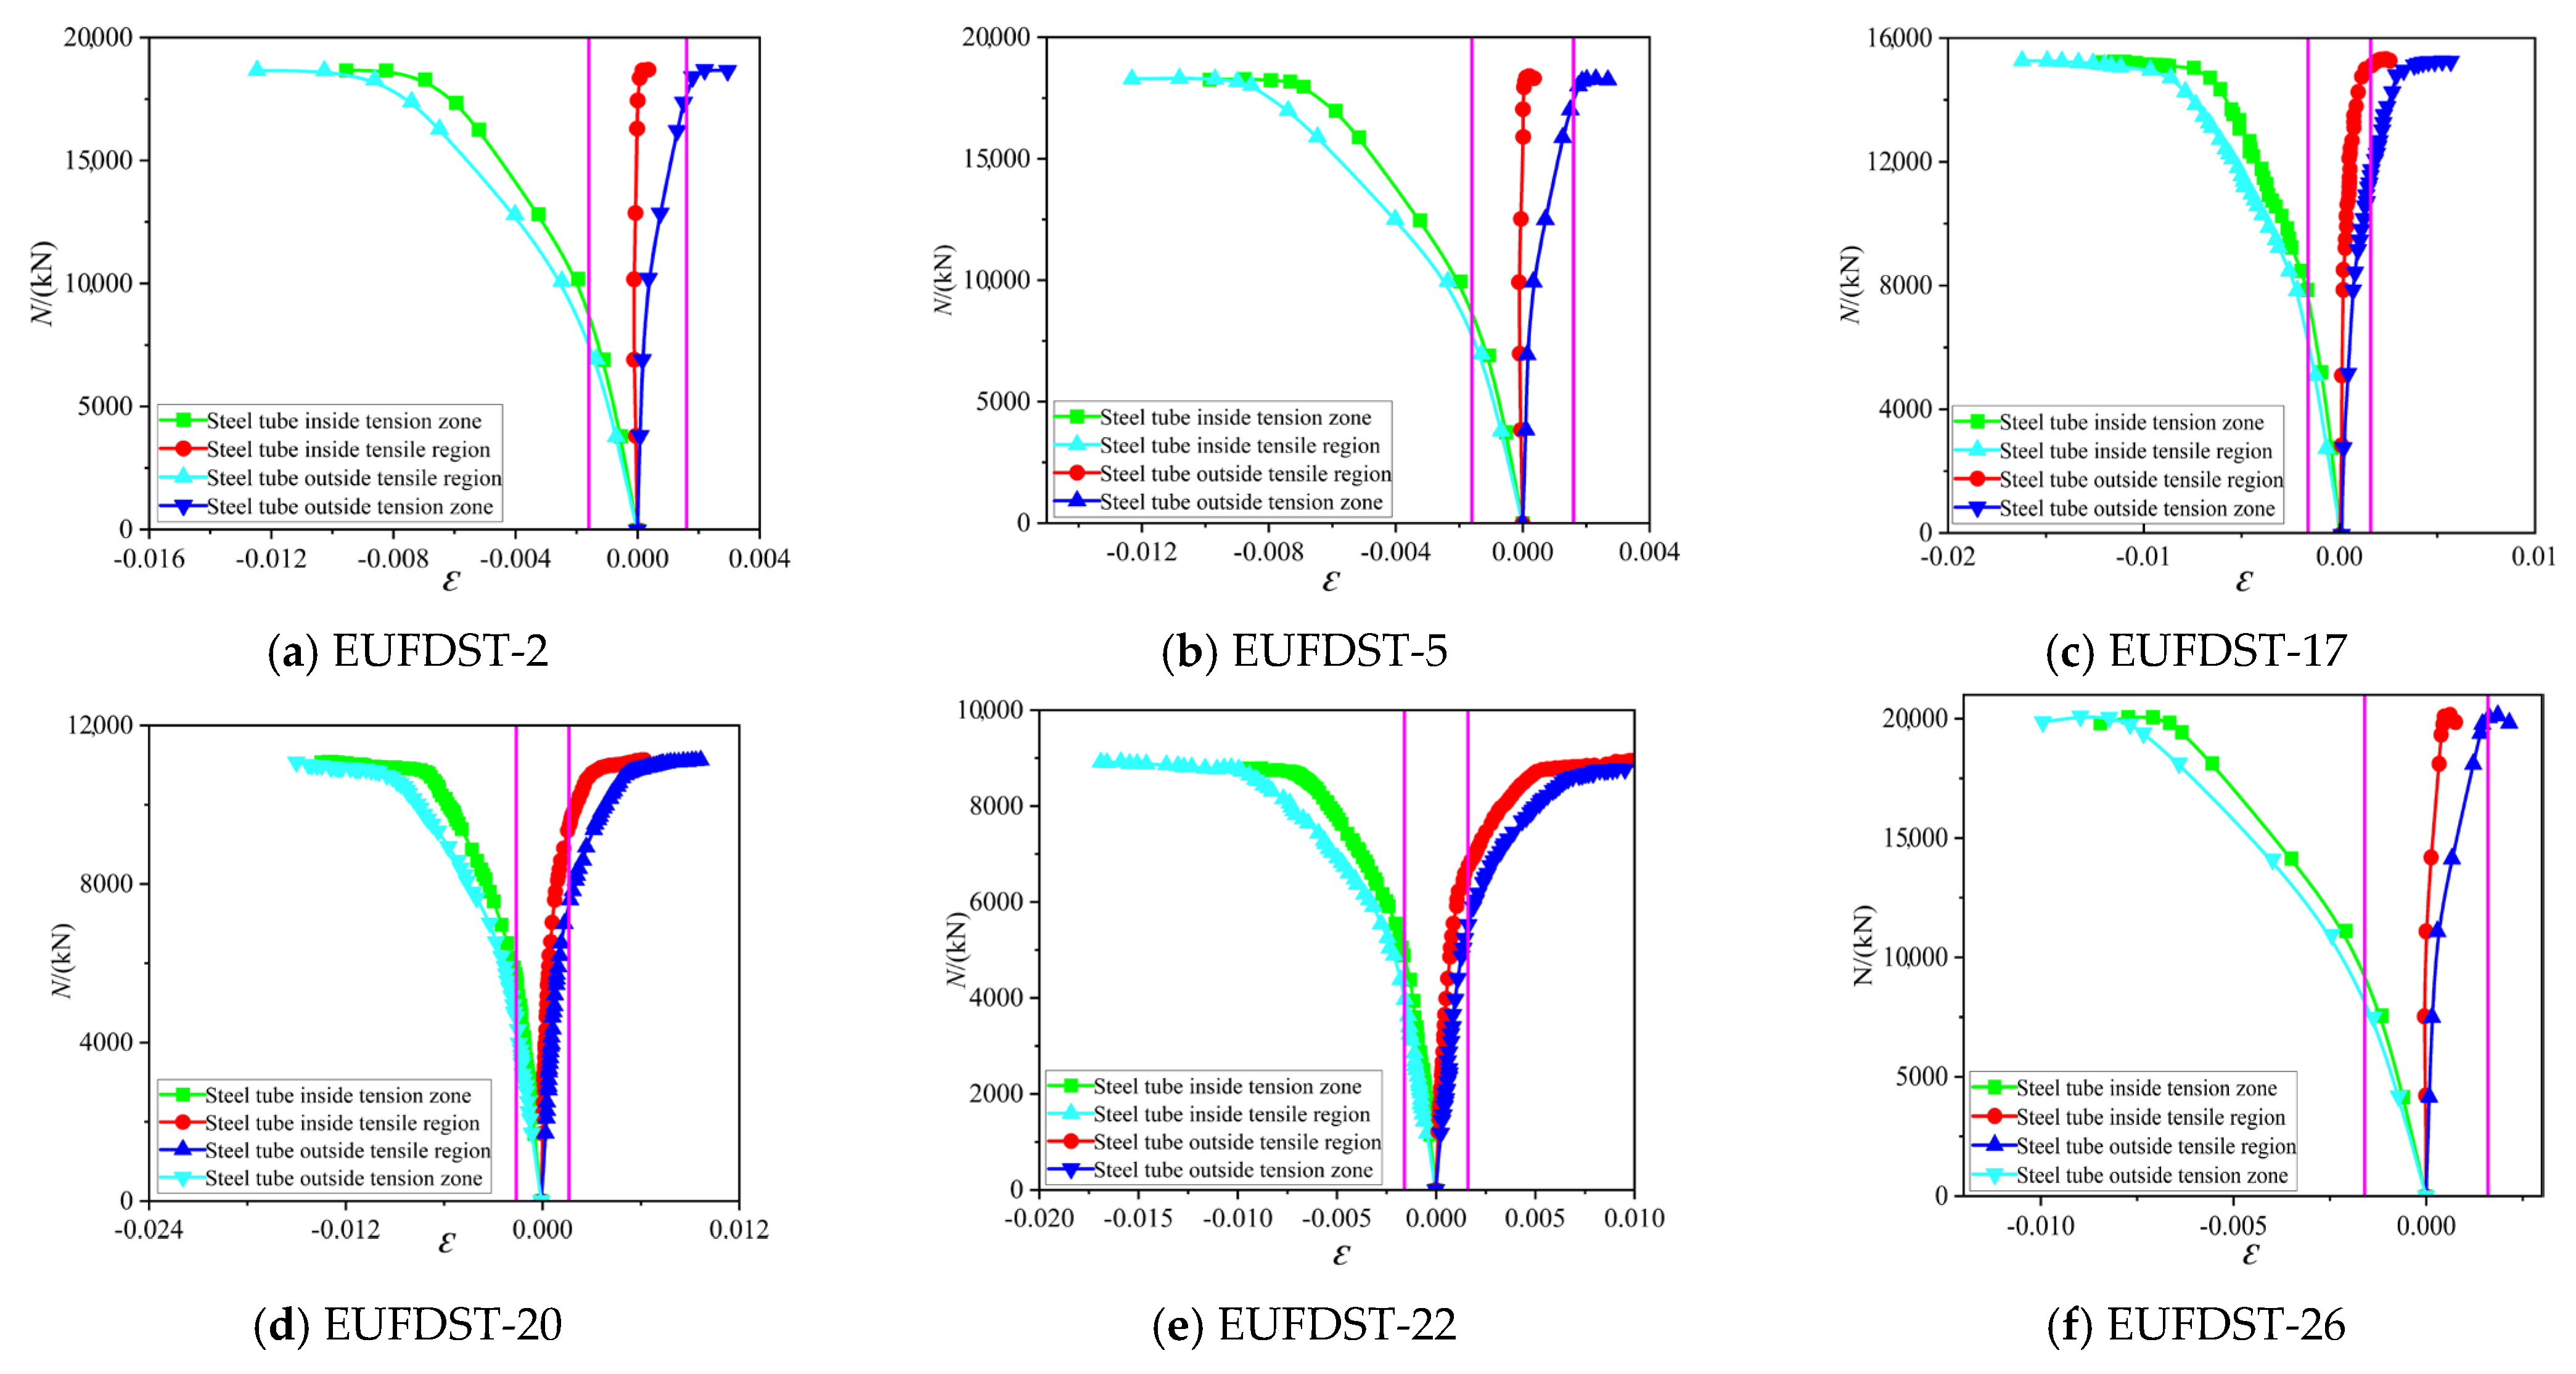
When eccentric loads were applied to full-size EUFDST composite columns, six typical specimens were selected to study the stress–strain curves in the compression zone of the steel tubes and concrete in the mid-span section. The load–strain curve for the mid-span section is shown in Figure 25. It was observed that when the eccentricity was 100 mm, the outer steel tube in the tension and compression zone and the inner steel tube in the compression zone reached the yield strength before the composite column reached the peak load, while the inner steel tube in the tensile zone had not yet reached the yield strength and the compression zone. The strain degree of the steel tube is significantly higher than that of the steel tube in the tensile zone. When the eccentricity increases to 150 mm, both the inner and outer steel tubes in the tensile zone and compression zone reach the yield strength before reaching the peak load, which shows that when the eccentricity of the EUFDST composite column is larger, the steel tubes in each area can effectively perform their strength effect. This finding is crucial for understanding the structural behavior of composite columns under different eccentric loads. The data show that even under high eccentric loads, the yield behavior of the steel tubes provides the necessary structural support for the composite columns, helping to maintain overall stability and safety. By analyzing the strain distribution in detail, the configuration and design of steel tubes and concrete can be further optimized to improve the performance and durability of the structure in real-world applications. This detailed stress and strain analysis provides valuable reference information for future structural design, especially when considering the safety and functionality of the structure under extreme conditions.
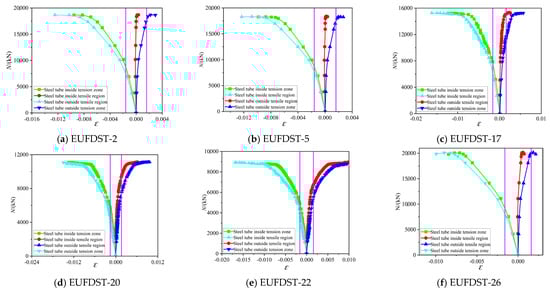
Figure 25.
Load–strain curves of steel tubes at mid-span sections.
6. Bending Stiffness Analysis
The preceding analysis reveals that the lateral deflection profile of the EUFDST composite column subjected to an eccentric load adheres to a distribution pattern resembling a sinusoidal half-wave, so its stiffness can be expressed as Equation (5) [32]:
In the equation, EI is the secant flexural rigidity, unit kN·mm2; N is the bias load, unit KN; e is the eccentricity, unit mm; H is the specimen height, unit mm; and μm is the specimen mid-span deflection, unit mm.
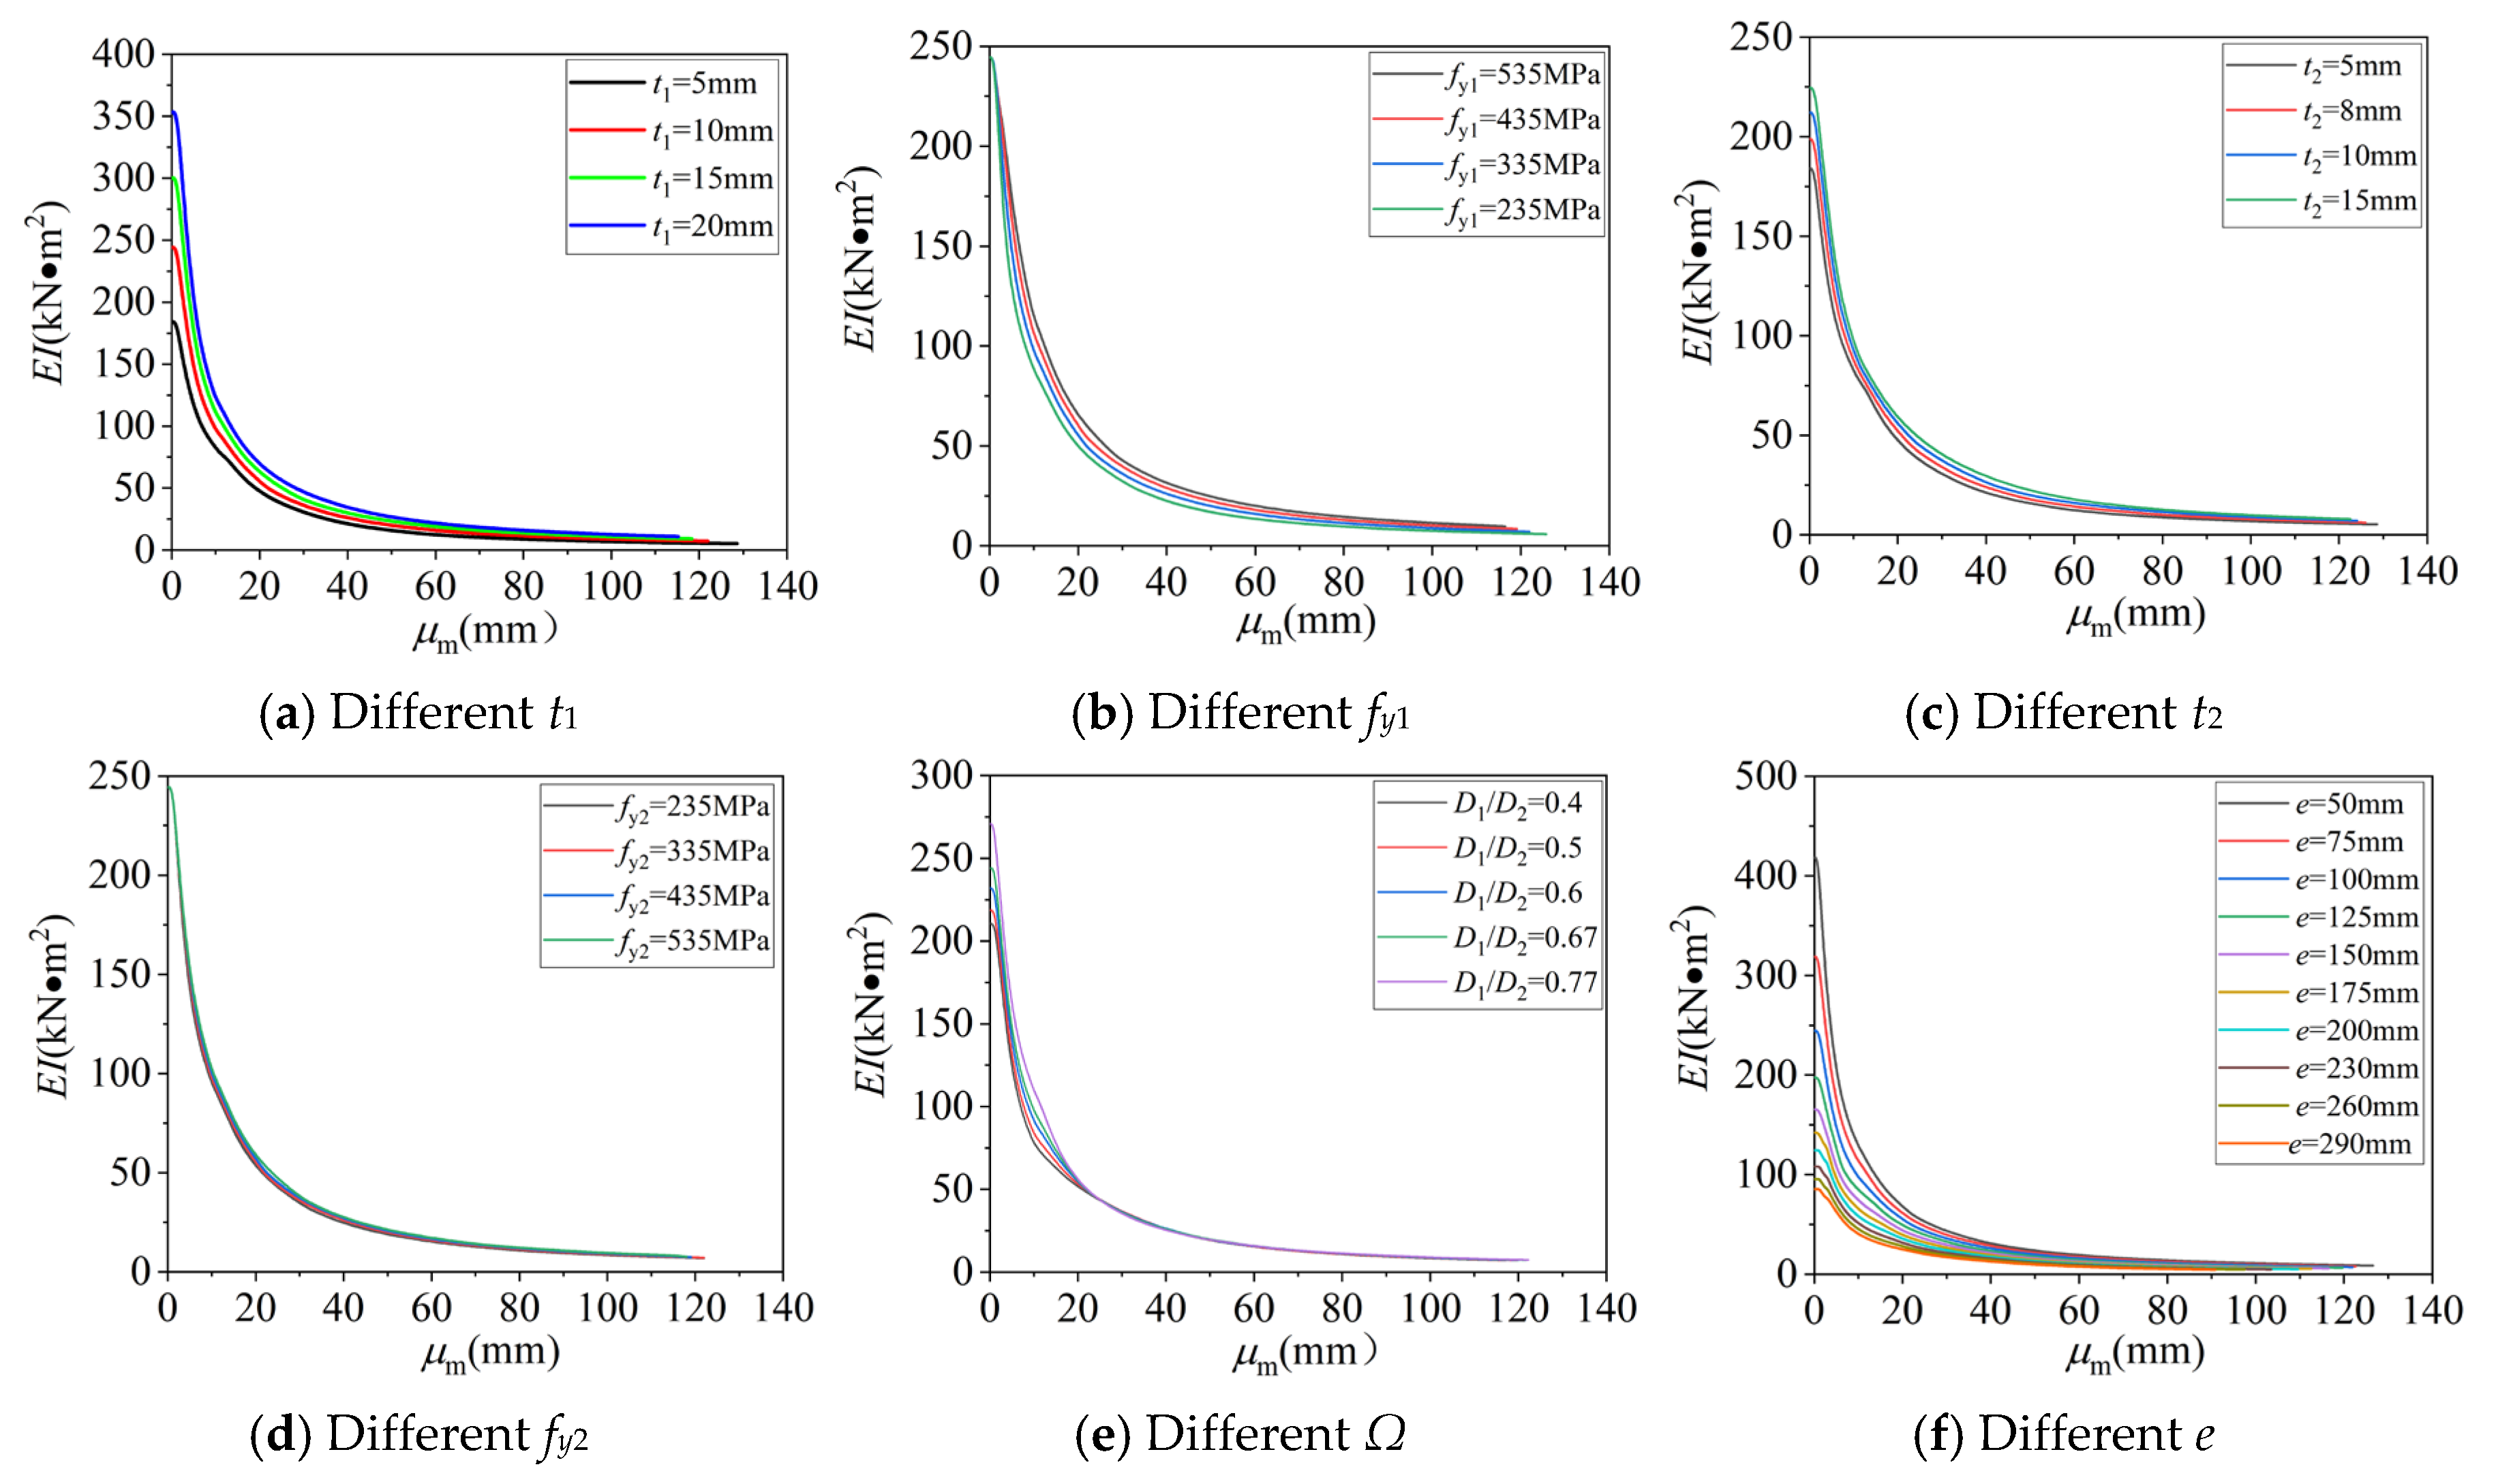
In the process of bearing eccentric load, the stiffness of the concrete-filled steel tubular composite column does not remain unchanged with the continuous advancement of the loading process. Because the destruction of the material accompanies the concrete-filled steel tubular composite column during the loading process, the effective stress area of the composite column’s cross-section and the material’s comprehensive deformation modulus gradually decrease. Therefore, the flexural stiffness of the composite column cannot remain unchanged but gradually decreases with the increase in lateral deflection. Figure 26 shows that the component is in the elastic stage at the initial loading stage, and the stiffness does not change. With the gradual increase in load, the specimen enters the elastic-plastic stage. At this time, the stiffness begins to decrease with the increase in deflection. At the initial stage of the elastic-plastic stage, the stiffness decreases rapidly, and the later decline rate gradually slows down. The stiffness degradation curves of full-scale EUFDST composite columns under different t1 and t2 are depicted in Figure 26a,c. It is evident that with the increase in t1 and t2, the initial stiffness of the composite column gradually increases. With the gradual increase in load, the stiffness of the composite column gradually increases with the increase in t1 and t2, and the stiffness of the composite column begins to stabilize at the later stage of loading, indicating that the composite column has been completely destroyed. The degree of influence of t1 and t2 on the overall stiffness is reduced, and the stiffness degradation rate gradually decreases with the increase in t1 and t2. The stiffness degradation curves of full-scale EUFDST composite columns under fy1 and fy2 are depicted in Figure 26b,d. It is evident that when fy1 and fy2 increase in the range of 235 MPa to 535 MPa, the initial rigidity of the composite column is identical.
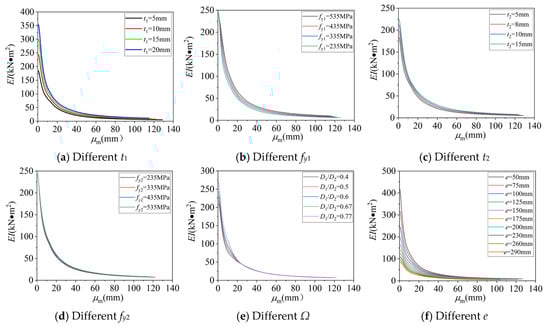
Figure 26.
Stiffness degradation curves.
However, with the gradual advancement of the loading process, the flexural stiffness of the composite column begins to increase with the increase in fy1 and fy2, and the decrease rate of flexural stiffness gradually decreases with the increase in fy1 and fy2, but fy2 has little effect on the flexural stiffness of the EUFDST composite column. The flexural stiffness degradation curves of the EUFDST composite columns under different Ω are depicted in Figure 26e. It is evident that the initial flexural stiffness of the EUFDST composite columns decreases gradually with the decrease in Ω. When μm is in the range of 0–23 mm, the flexural stiffness of the EUFDST composite columns decreases with the decrease in Ω. When μm is greater than 23 mm, the flexural stiffness of the EUFDST composite columns with different diameter ratios is approximately the same. The bending stiffness degradation curve of the EUFDST composite column under different e is depicted in Figure 26f. It is clear that as the value of e increases progressively, the bending rigidity of the EUFDST composite column diminishes progressively. With the gradual increase in load, the bending stiffness gap between composite columns of different e decreases.
7. Contact Stress Analysis
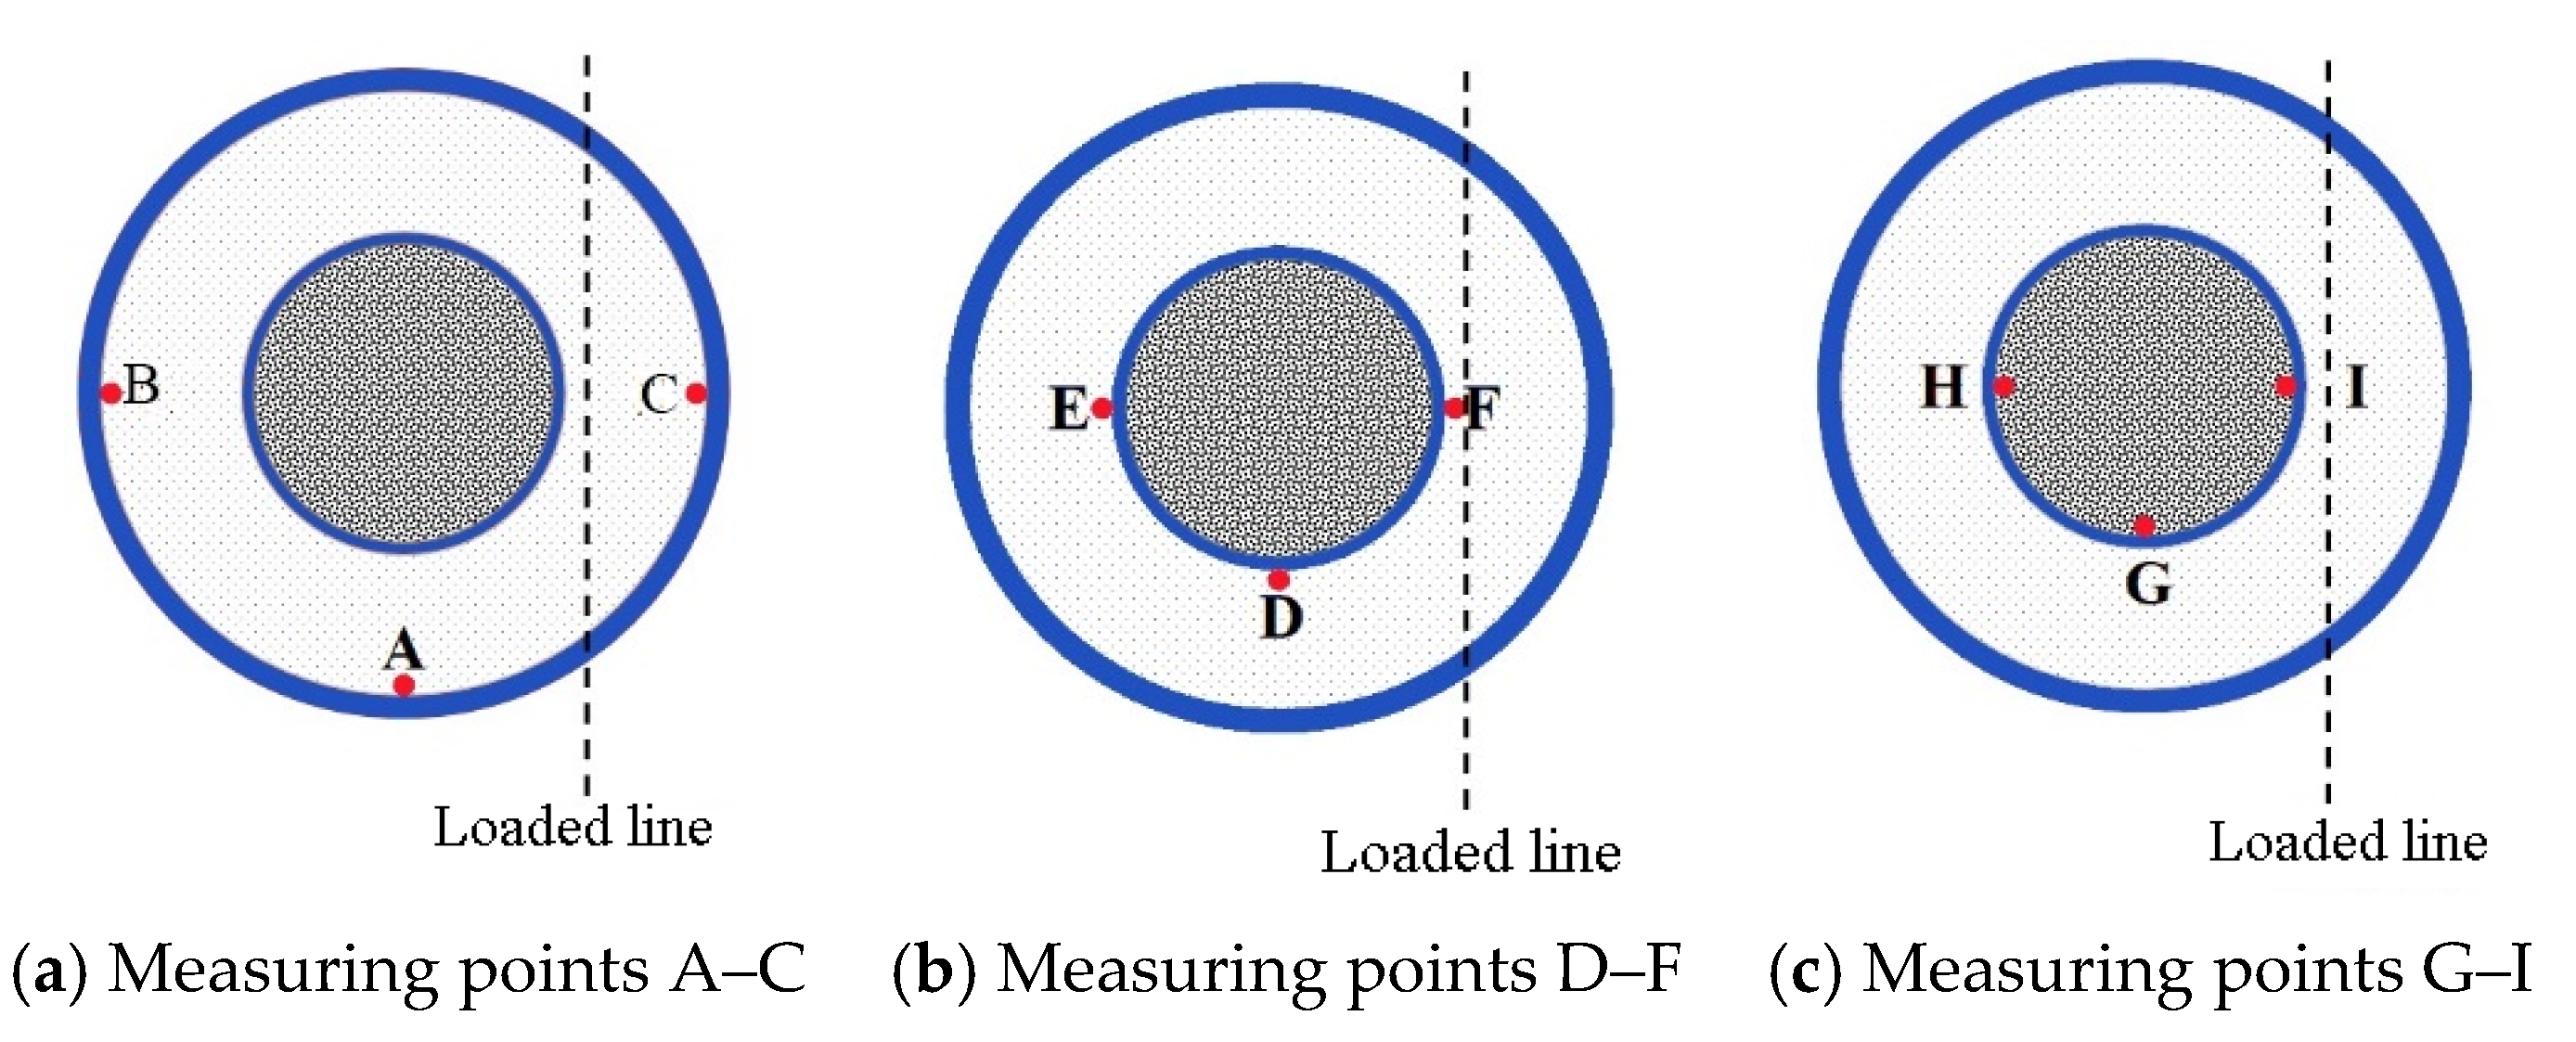
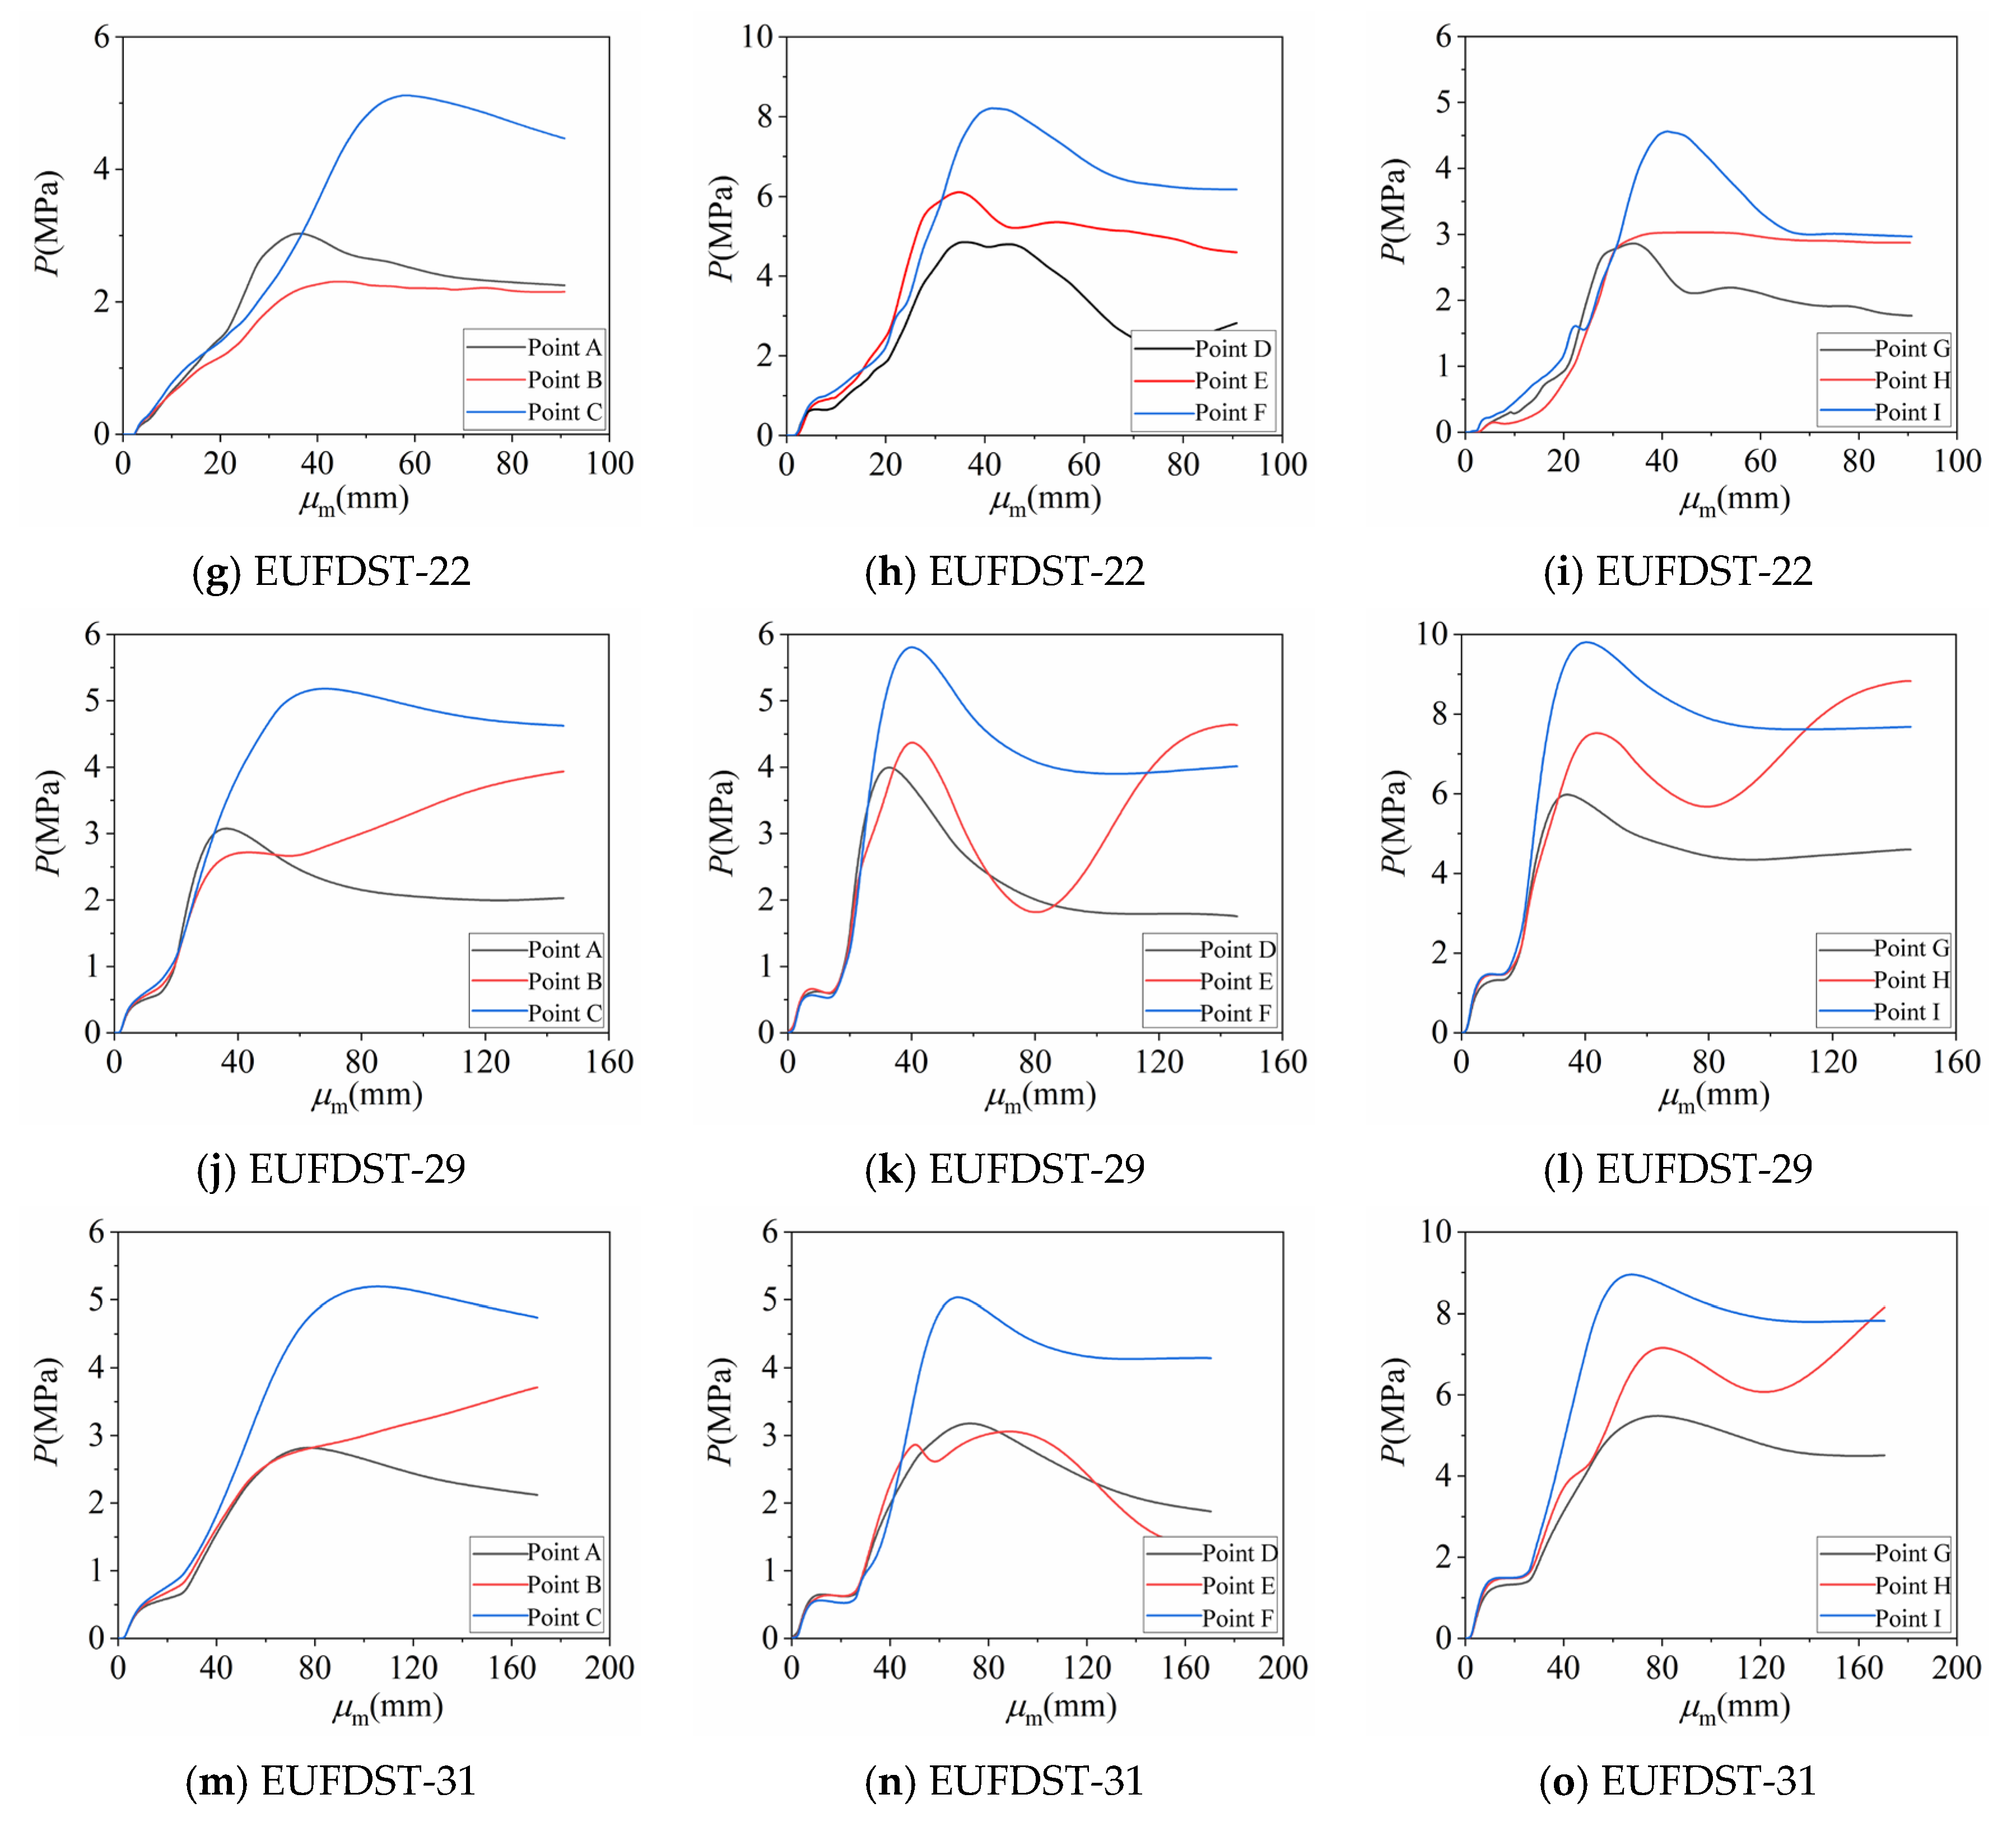
In the process of bearing eccentric load, the coordinated deformation between the steel tubes and concrete on the tension side of the compression side is different. Therefore, in order to study the coordinated deformation trend after contact between the steel tubes and concrete in a full-scale EUFDST composite column, the contact stress between the steel tubes and concrete in the composite column is analyzed. Five groups of typical specimens were selected to extract three points, A, B, and C, inside the outer steel tube of the mid-span section. The distribution of the three points is depicted in Figure 27a. The distribution of three points, D, E, and F, outside the inner steel tube of the mid-span section is depicted in Figure 27b. The distribution of three points, G, H, and I, inside the inner steel tube of the mid-span section is depicted in Figure 27c.
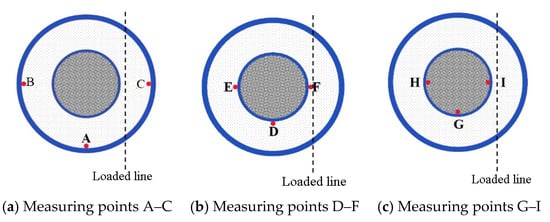
Figure 27.
Distribution map of measuring point positions.
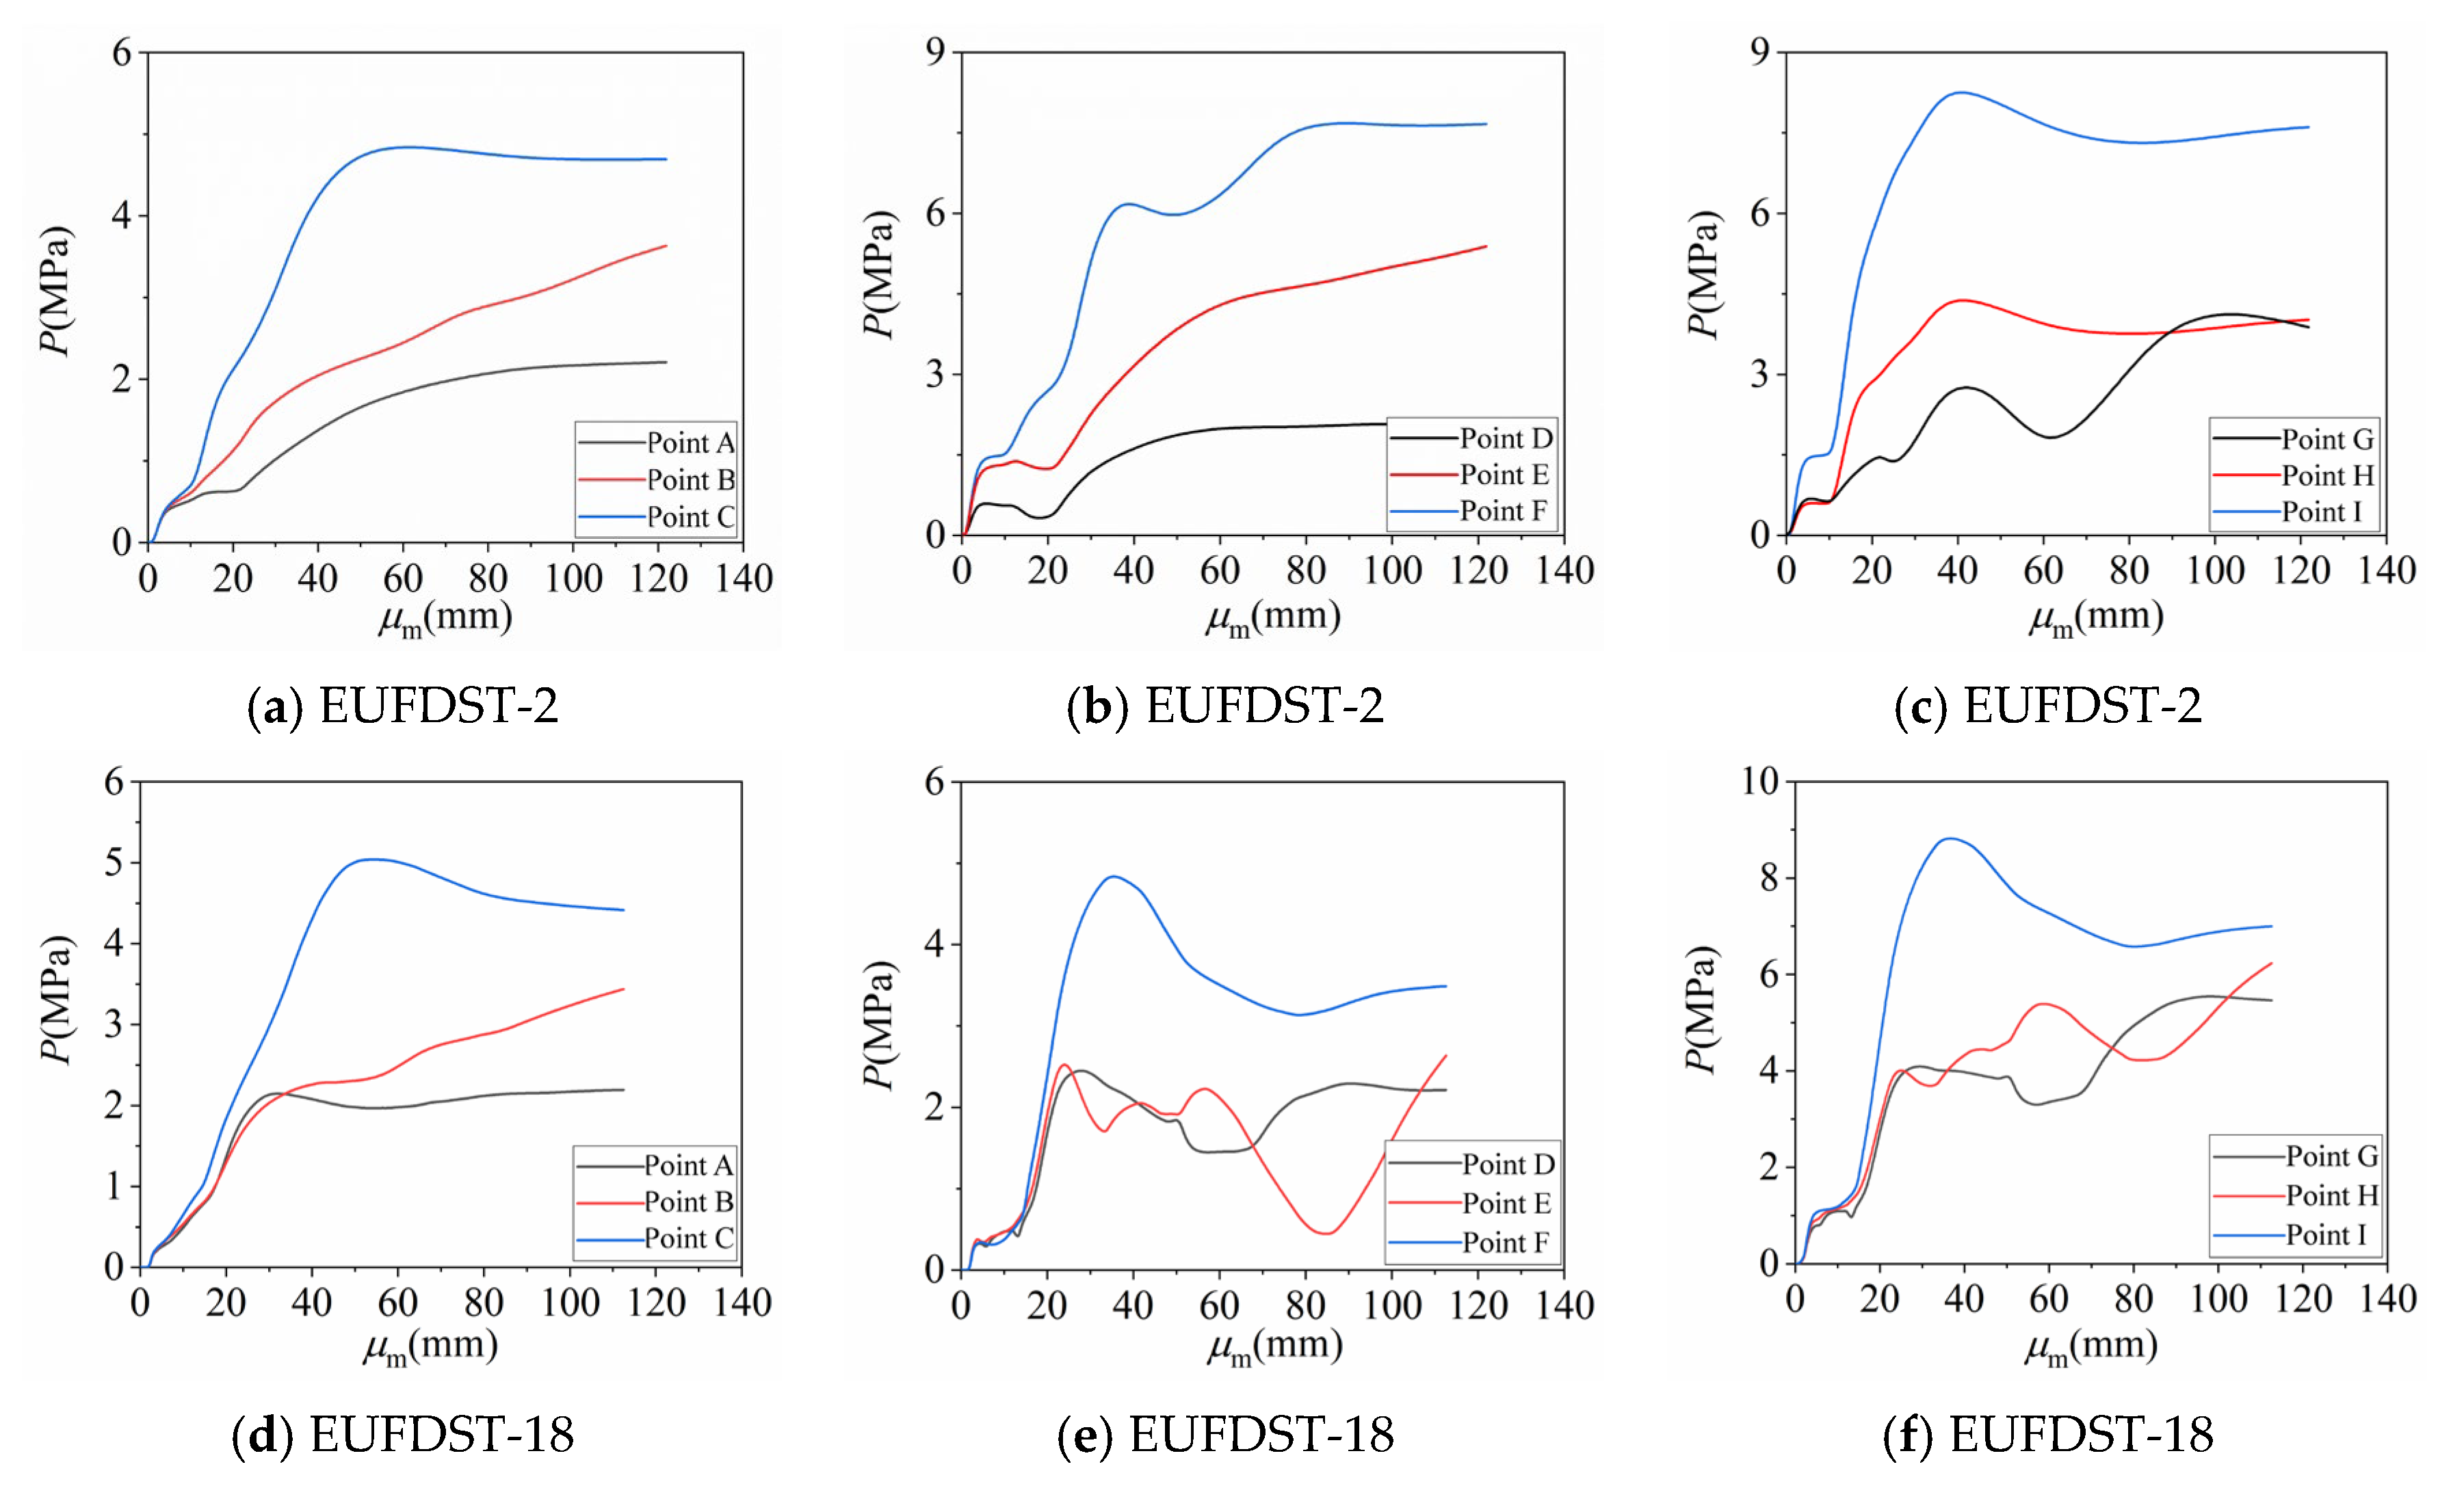
The contact stress–mid-span deflection curve between the steel tubes and the concrete of the five groups of typical specimens is depicted in Figure 28. It is apparent from Figure 28 that the contact stress between the five groups of typical specimens from point A to point I and the concrete is maintained at 0 at the initial stage of loading, indicating that the specimens are in the elastic stage at the initial stage of loading. Currently, the inner and outer steel tubes are in an independent working state with the interlayer ECC and the core UHPC, and there is no contact between the steel tubes and the concrete. With the gradual increase in displacement load, the specimen enters the elastic-plastic stage, and the concrete and steel tubes begin to deform. At this time, the contact stress gradually increases with the increase in deflection. Among them, the contact stress of points C, F, and I on the compression side rises the fastest, followed by the rising rates of points B, E, and H on the tension side, and the rising rates of points A, D, and G in the middle are the slowest. The contact stress of point C of the EUFDST-2 outer steel tube of the specimen decreases slowly after reaching the peak value. With the increase in the eccentricity and slenderness ratio, the contact stress of point C decreases more significantly after the peak value. This is because with the increased eccentricity and slenderness ratio, the concrete on the compression side is crushed, so the contact stress between the steel tube and the concrete gradually decreases. The contact stress of point B increases with the gradual increase in mid-span deflection from the initial stage of loading to the later stage of loading, and the increased rate of contact stress of point B after the specimen enters the plastic stage is smaller than that of the initial stage of loading, which indicates that the concrete on the tensile side is better constrained by the steel tube on the tensile side in the process of outward expansion. The contact stress at point A of the mid-span section is the minimum contact stress at the three measuring points selected for the outer steel tube. Except that the EUFDST-2 contact stress rises, the contact stress has a downward trend after reaching the peak. The overall trend of the contact stress at point F outside the compression zone of the inner steel tube is similar to that of point B. With the increase in eccentricity and slenderness ratio, the decrease rate of the contact stress at point F increases after the peak value. The contact stress at point E outside the tensile zone of the inner steel tube gradually increases with the mid-span deflection increase at the initial loading stage. However, with the gradual increase in the displacement load, the contact stress at point E begins to fluctuate nonlinearly. This is due to the gradual increase in the load between the inner steel tube and the interlayer concrete in the mid-span section, and the deformation coordination between the two is reduced. The contact stress at point D is the minimum at the three measuring points selected on the outer side of the inner steel tube. Except that the contact stress of EUFDST-2 keeps rising, the contact stress decreases after reaching the peak value. The overall trend of contact stress at point I on the inner side of the inner steel tubular compression zone is similar to that of point B. With the eccentricity and slenderness ratio increase, the contact stress at point I decreases after the peak value. The overall trend of the contact stress at point H in the tension zone of the inner steel tube is similar to that of point E. However, the contact stress is obviously larger than that of point E in the later loading stage, and the contact stress of some specimens is larger than that of the compression side after the end of loading. This is because the inner steel tube is constrained by the interlayer ECC and the outer steel tube, and the degree of outward buckling is small. Therefore, the contact between the inner steel tube and the concrete is more sufficient, resulting in the overall contact stress of point H being larger. The contact stress at point G is the minimum at the three measuring points selected on the inner steel tube’s inner side. Except that the contact stress of EUFDST-2 keeps rising, the contact stress decreases after reaching the peak value.
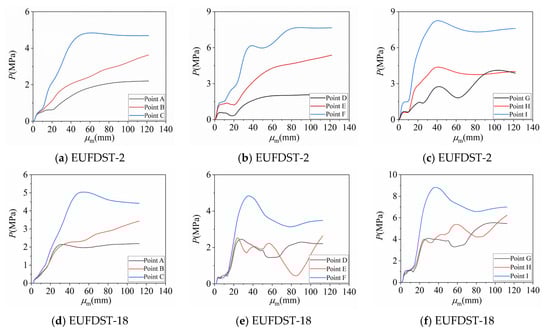
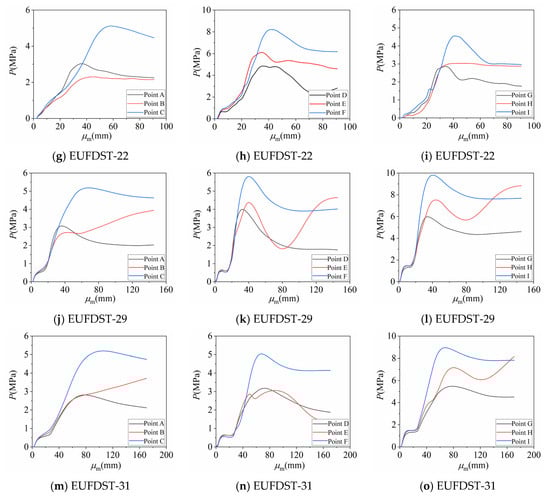
Figure 28.
Comparison of contact stress between steel tubes and concrete.
When analyzing contact stress behavior, interface properties and bonding conditions have a decisive influence on the interaction between steel tubes and concrete. It can be observed from Figure 28 that the response of contact stress is significantly different at different loading stages, which reveals the important role of interface bonding performance in force transmission and stress distribution. The bonding conditions not only affect the peak stress but also have an important impact on the shape of the stress–displacement curve. Under perfect bonding conditions, the stress between the steel tubes and concrete is more evenly distributed, thereby improving the overall load-bearing capacity and stiffness of the component. However, when bonding conditions are insufficient or slippage exists, the contact stress curve shows greater dispersion and the peak stress decreases, indicating that poor bonding leads to discontinuous transmission of force, thereby affecting the overall performance of the structure. In practical applications, optimization of interface bonding conditions is the key to improving the performance of composite components. For example, the bond quality between steel tubes and concrete can be significantly improved by increasing the roughness of the steel tubes’ surface or using bonding promoters. Improvements in interfacial properties, such as through surface treatments or material modifications, can further enhance this bonding, thereby playing an important role in reducing slip and increasing interfacial load-bearing capacity. It can be seen from the contact stress curve in Figure 28 that the difference in stress response at different measuring points indicates the non-uniformity of the bonding conditions. This phenomenon requires special attention during the design and construction process to ensure that the composite components meet the expected performance standards.
8. The Whole Process Analysis of Full-Scale EUFDST Composite Columns under Eccentric Compression
8.1. Failure Modes
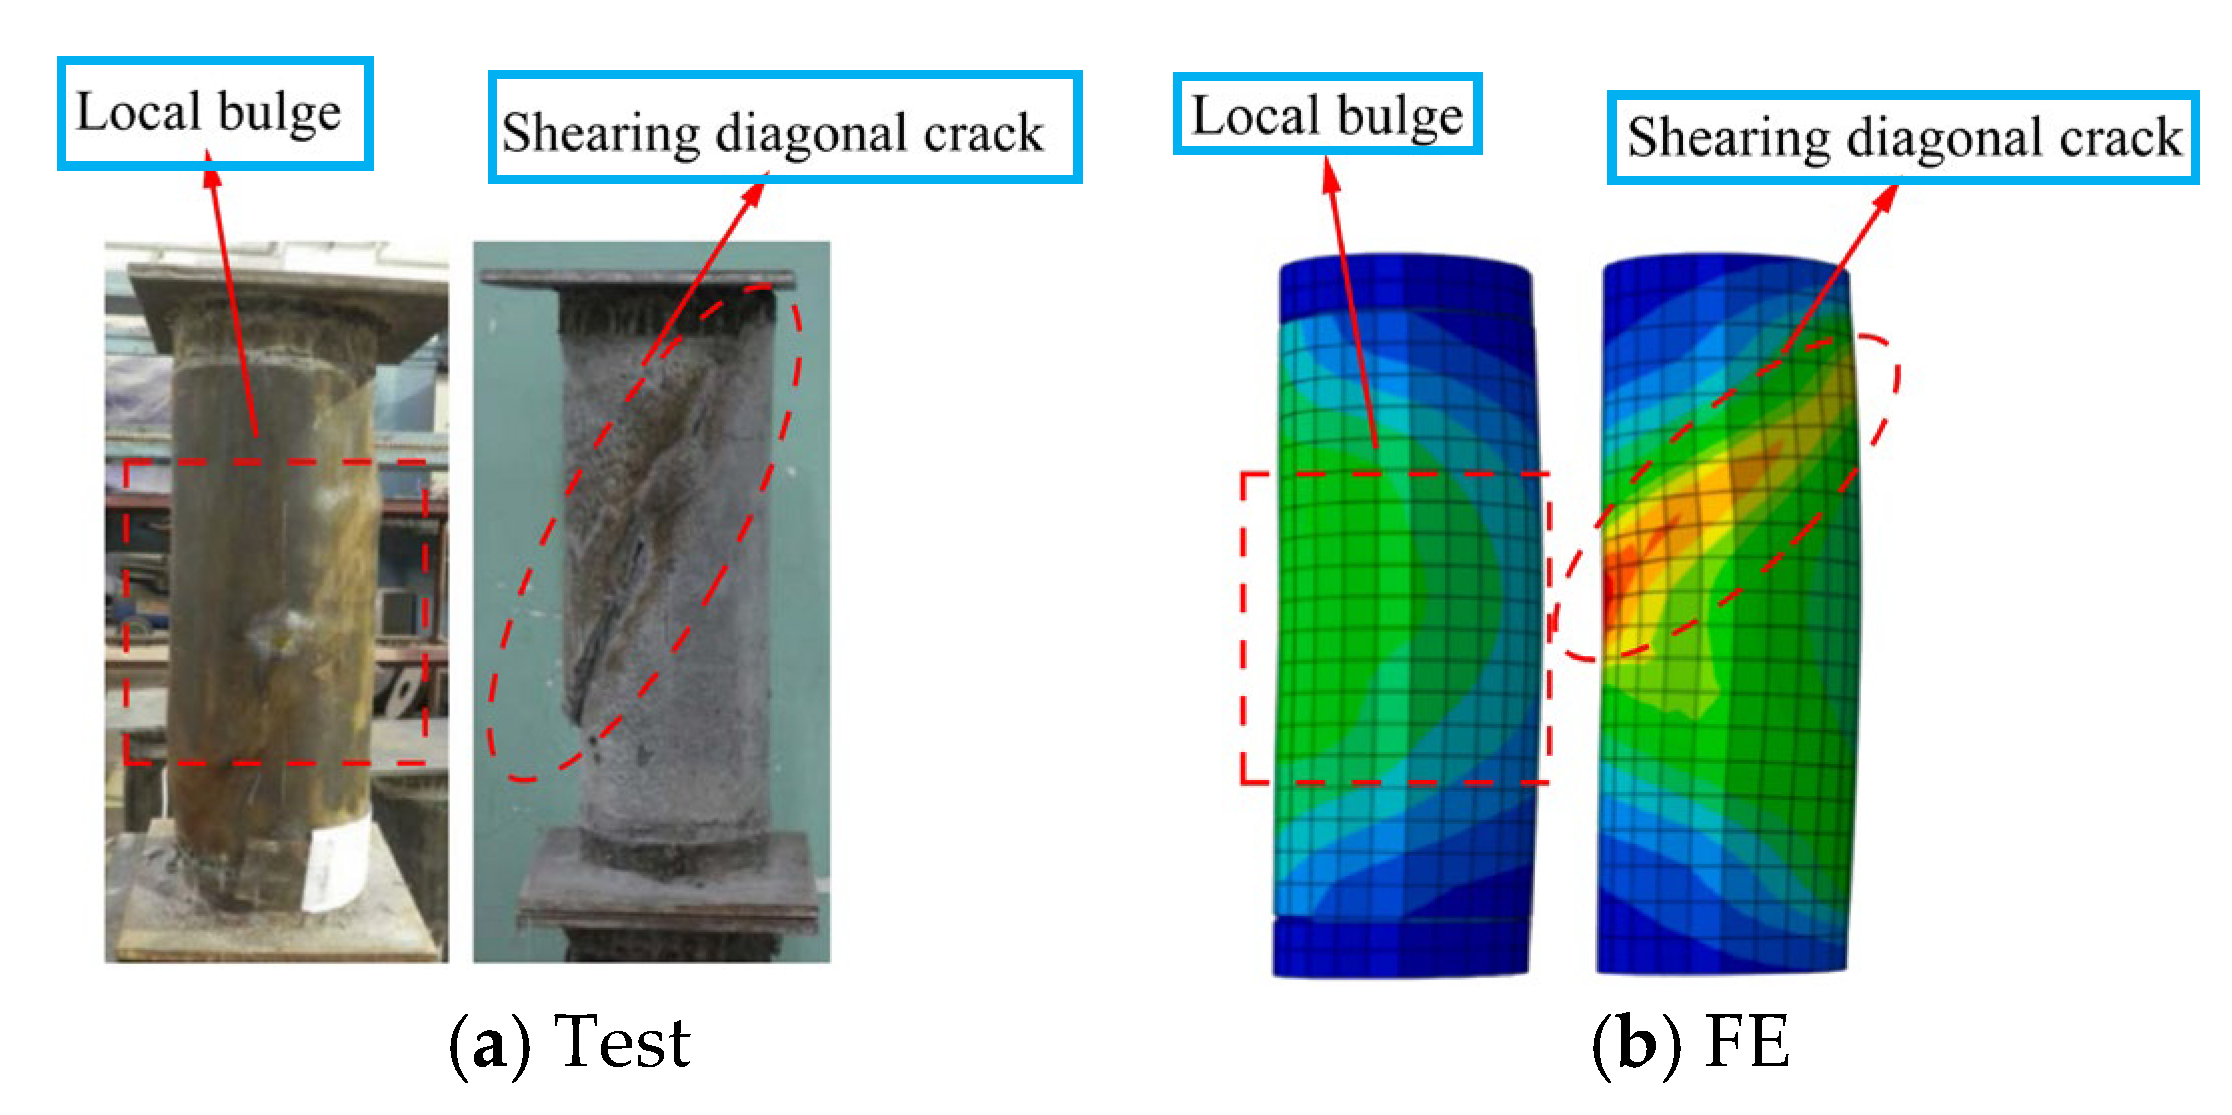
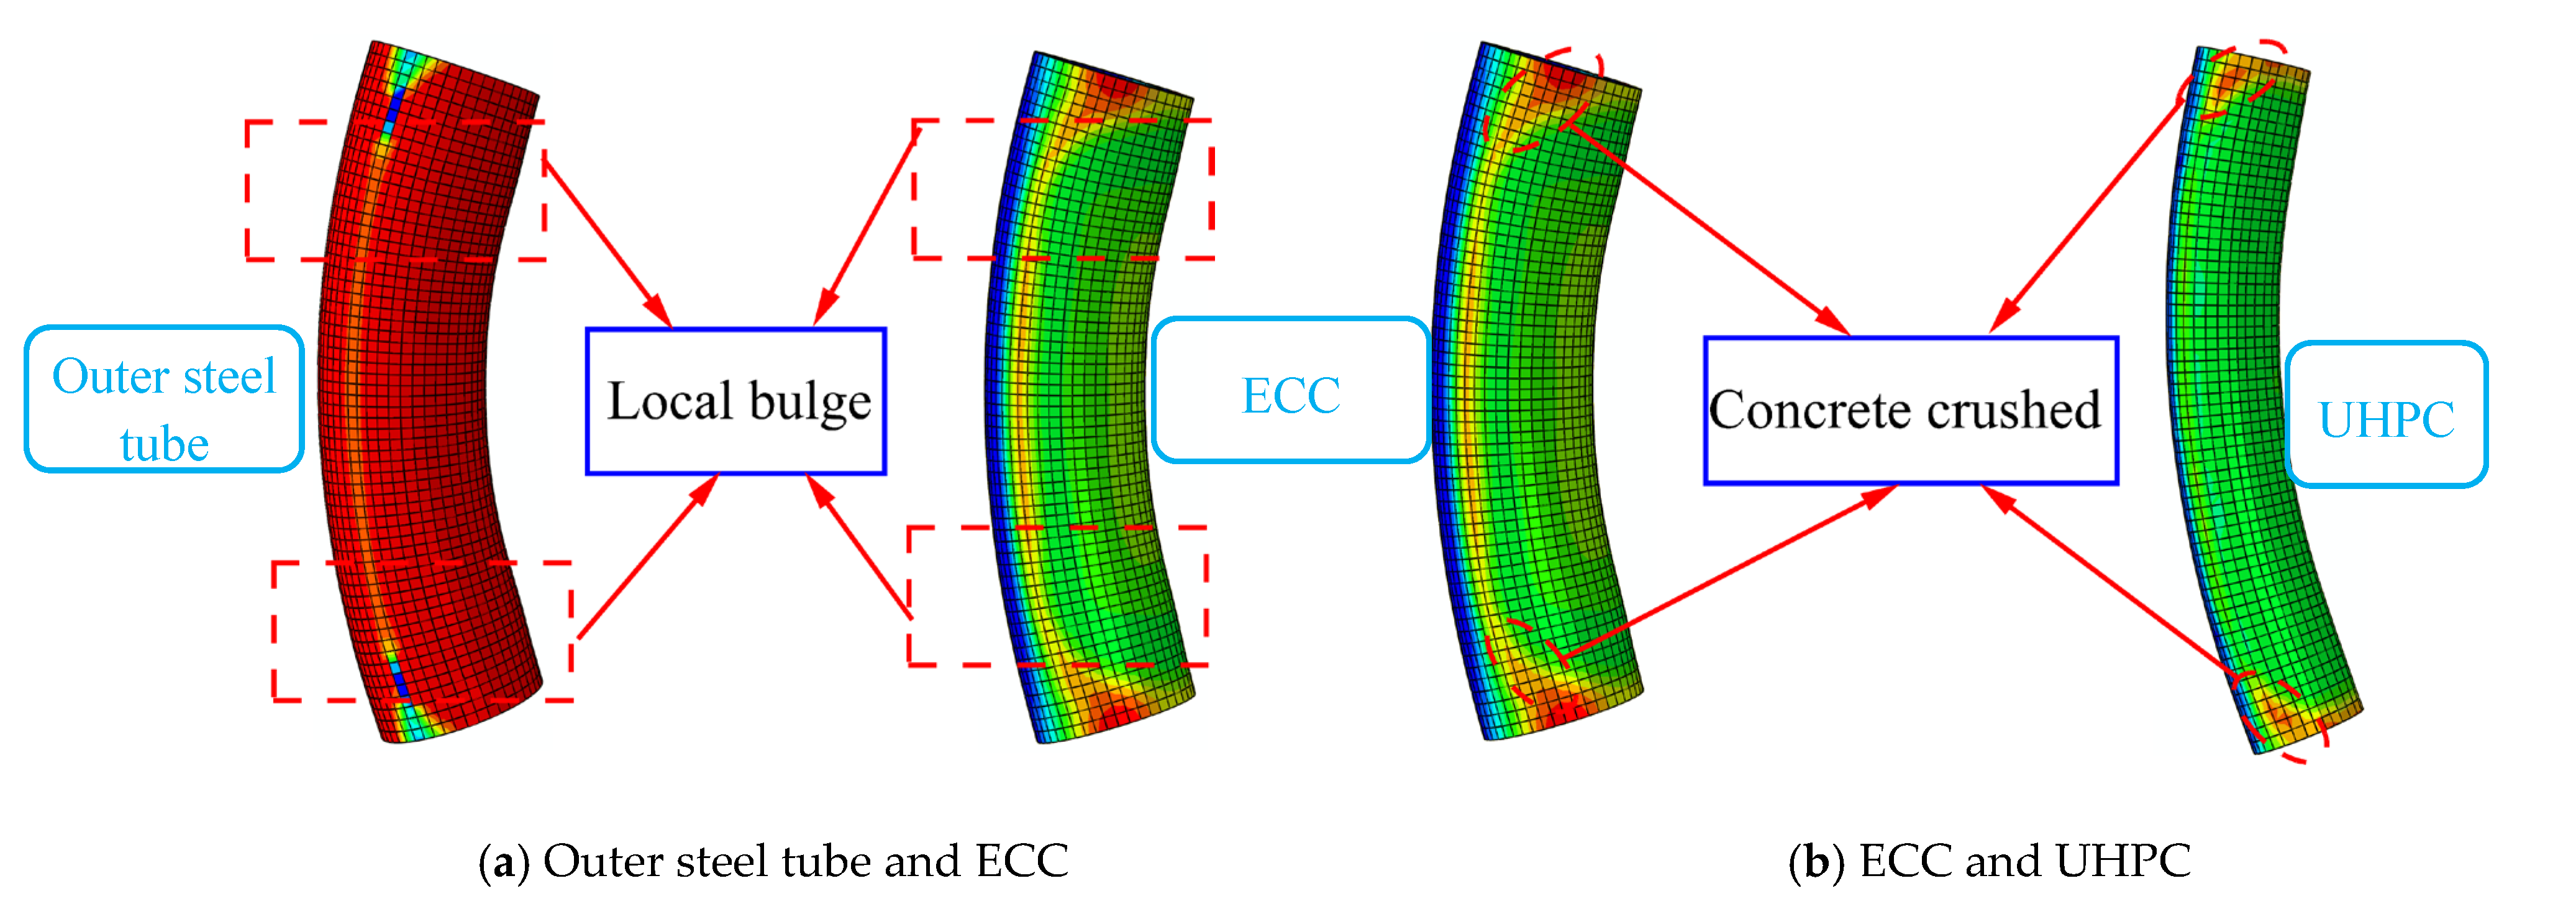
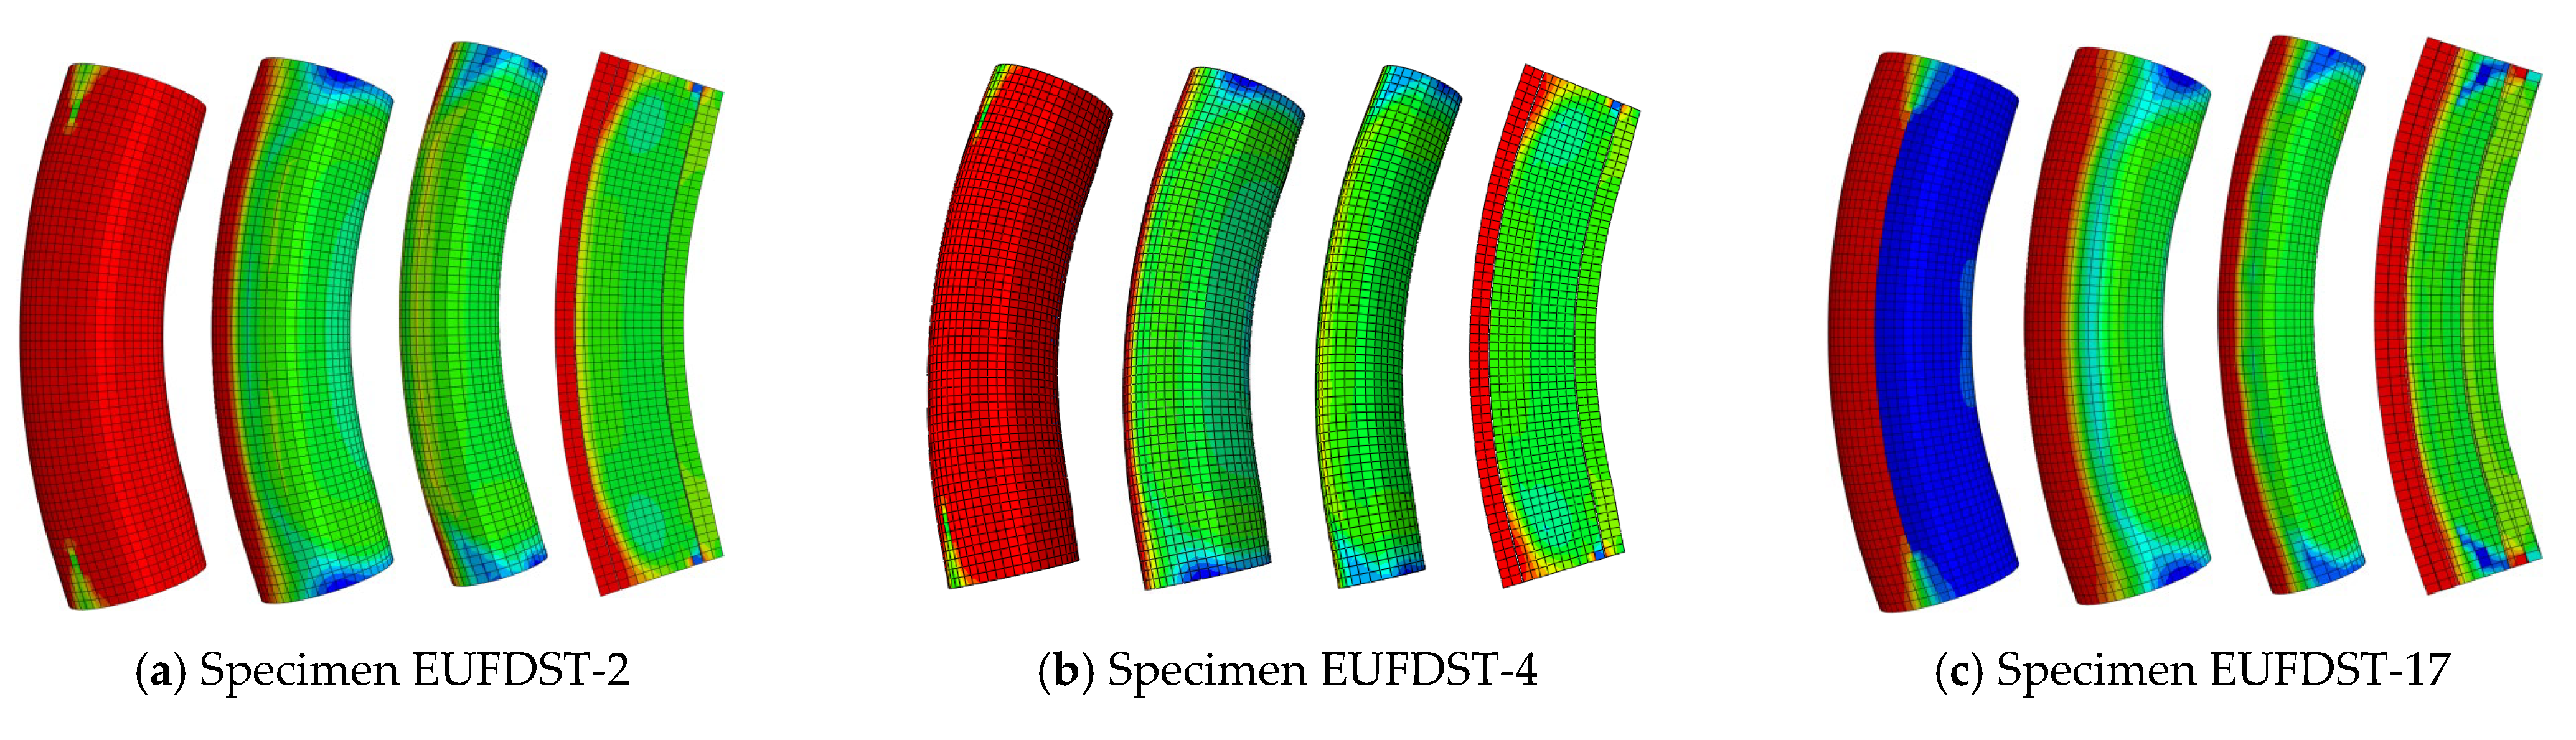
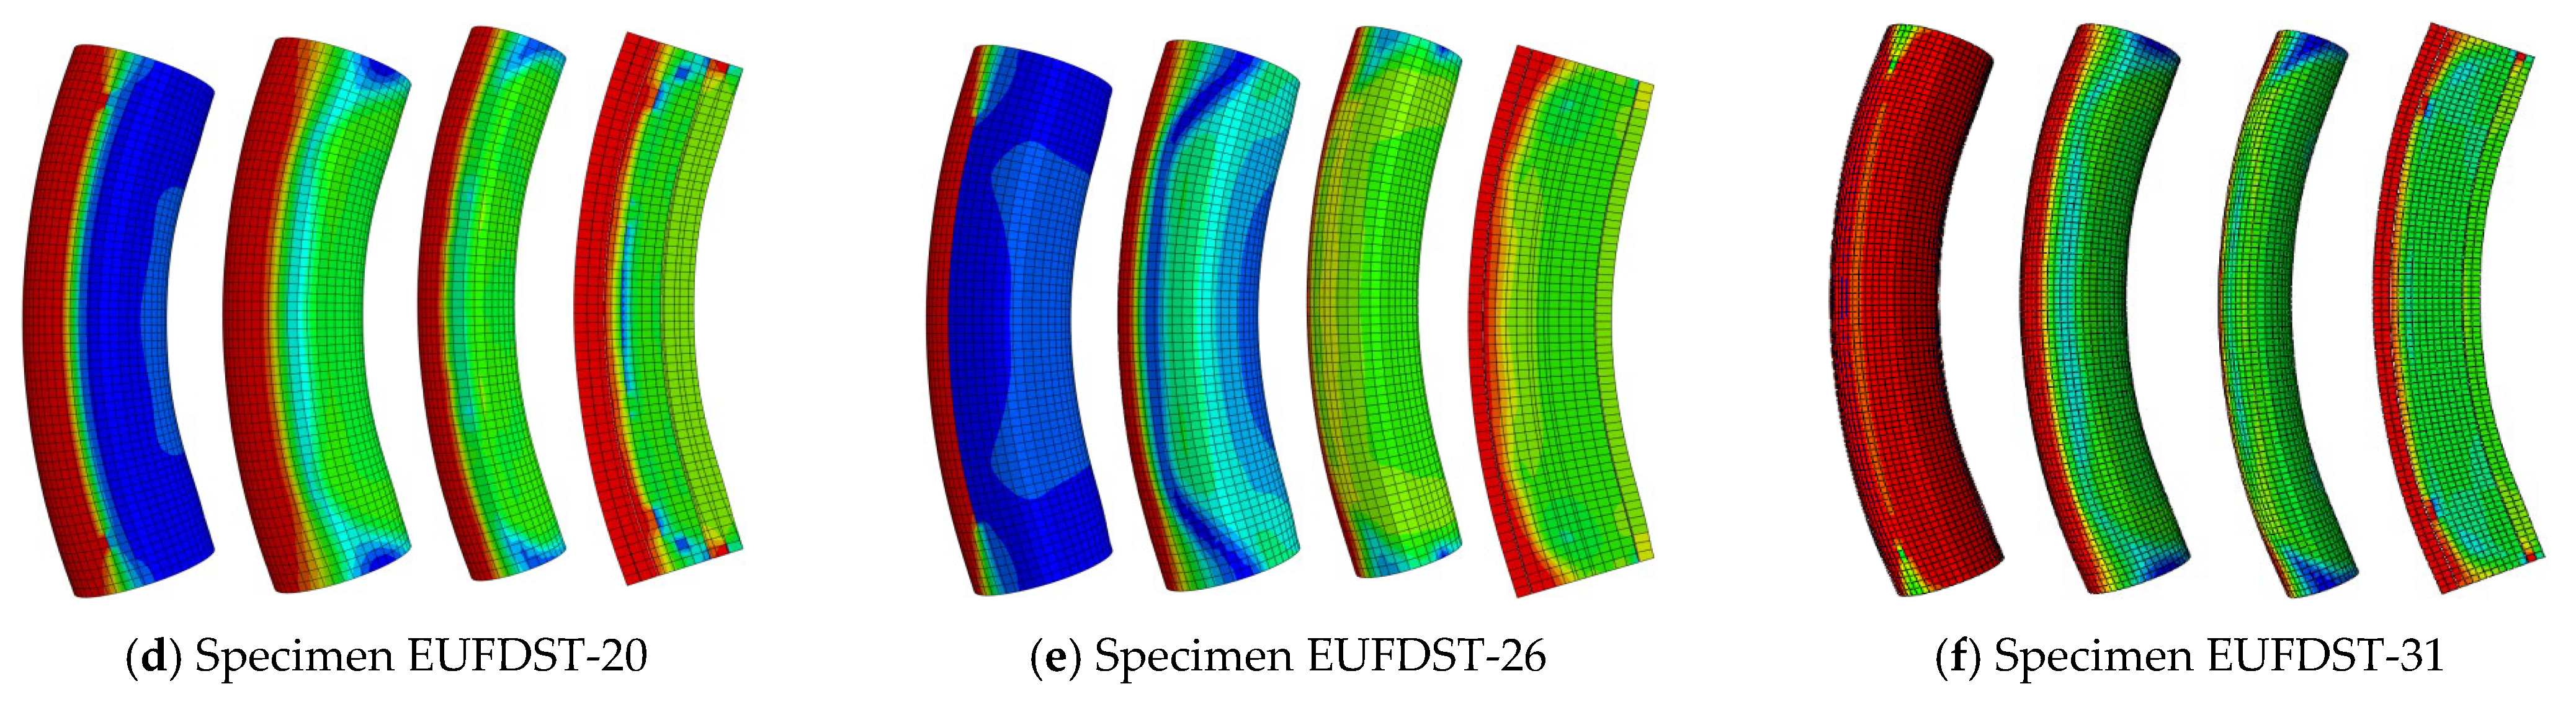
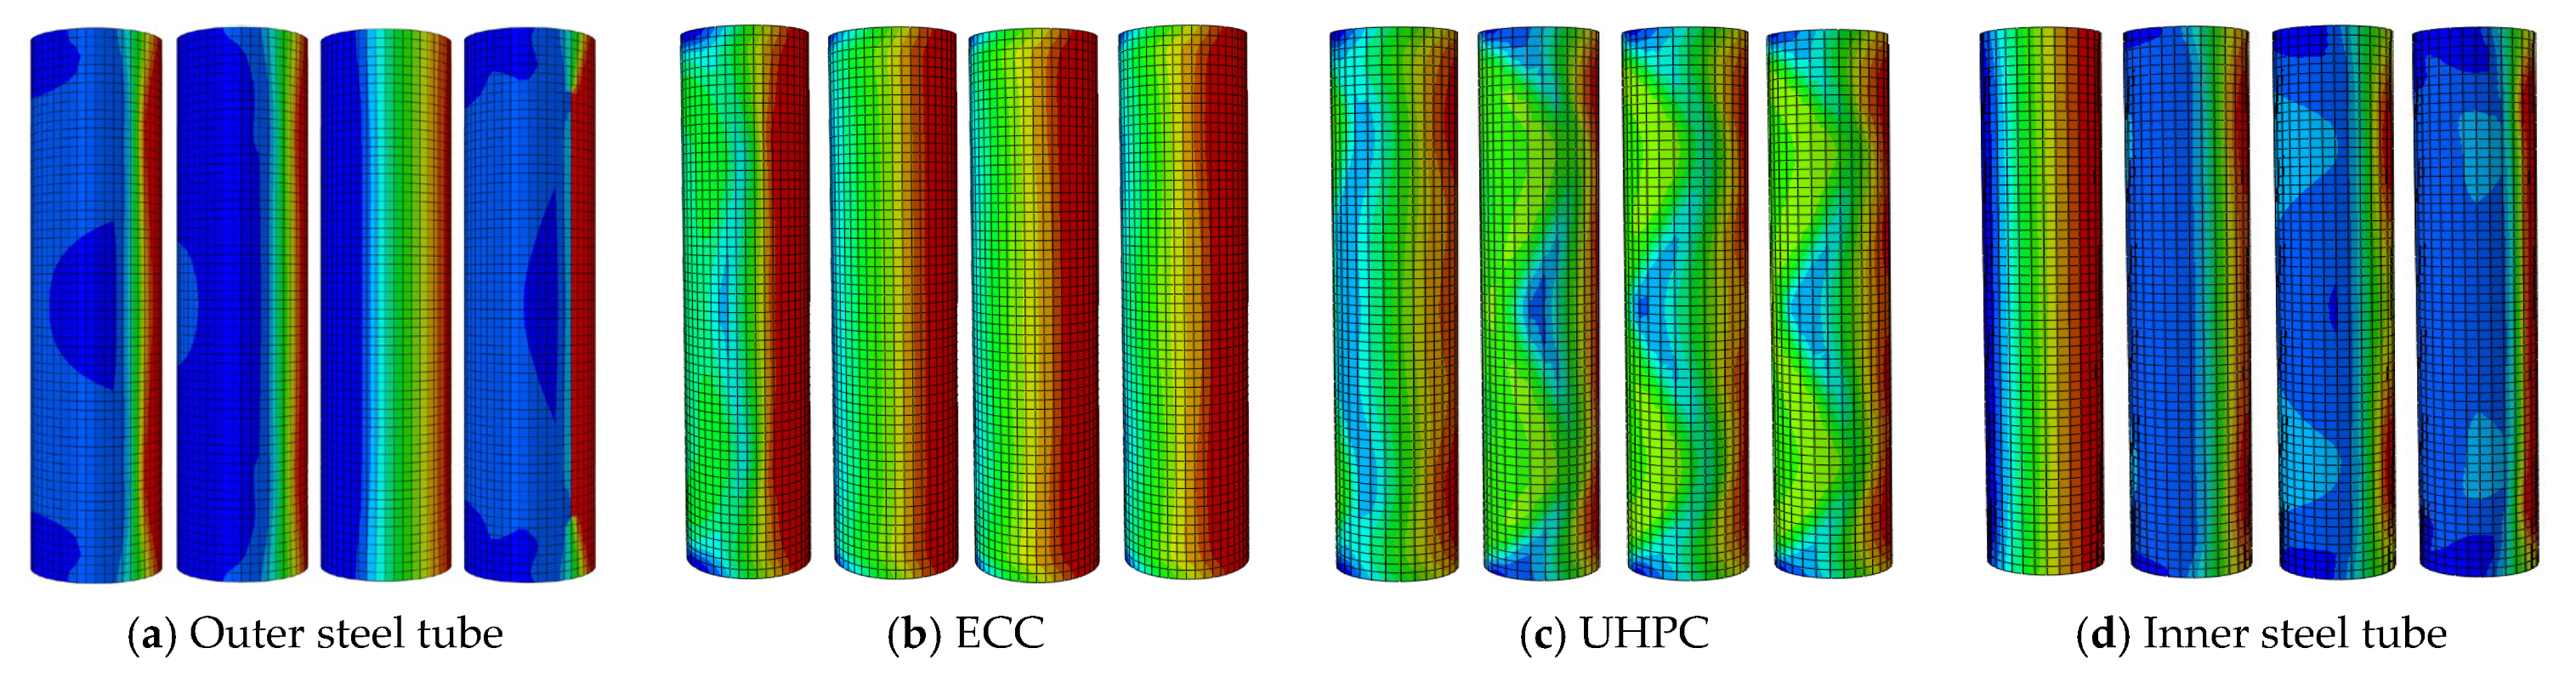
To investigate the failure mode of EUFDST composite columns under eccentric load, a group of typical specimens was selected. Take the EUFDST-20 as an example, and its failure mode is depicted in Figure 29. It is evident that the outer steel tube at the end of the compression zone and the ECC at the end of the compression zone bulge outward, and the inner and outer steel tubes at the mid-span are subjected to yield failure. The concrete in the mid-span of the compression zone is crushed, and the concrete in the tension zone is cracked. Due to the special cross-section form of double steel tubes, the concrete in the tensile zone is mainly interlayer ECC, while the core UHPC mainly bears the axial pressure, and the tensile part is less. Therefore, it can be seen in Figure 30 that the full-scale EUFDST composite column shows excellent eccentric bearing capacity, and both ECC and UHPC play their own characteristics. With the increase in eccentricity, the area of concrete in the tension zone gradually increases. However, most of the tension zone is still concentrated at the edge of the outer steel tube to the inner 100 mm of the tension zone. Therefore, it is suggested that for the full-scale EUFDST composite column subjected to eccentric load, it is reasonable to keep the radius of the inner steel tube at 190 mm to 210 mm. This diameter ratio can not only improve the overall bearing capacity of the composite column but also gradually improve the ductility of the composite column.
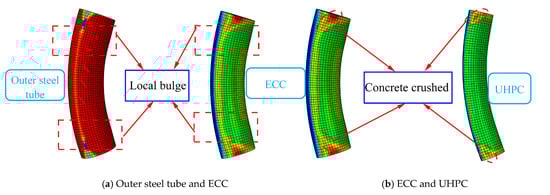
Figure 29.
The failure mode of specimen EUFDST-20.
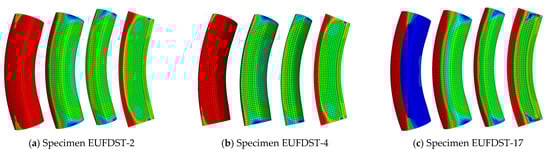

Figure 30.
Failure modes of typical specimens (from left to right, in sequence: outer steel tube, ECC, inner steel tube, UHPC).
Failure modes of EUFDST columns typically involve localized bulging of the ex-ternal steel tube and failure of the engineered cementitious composite (ECC) and ultra-high-performance concrete (UHPC). As shown in Figure 29, the outer steel tube shows an obvious local bulging phenomenon under the influence of eccentric loading. This bulge usually occurs on the compression side of the steel tube and is caused by the radial expansion force of the internal concrete exceeding the local buckling strength of the steel tube. At the maximum load point, the maximum radial displacement of the local bulge was measured to be 15 mm. This quantitative description helps to accurately understand the degree of deformation of the structure at its load-bearing limit. For the middle ECC layer and the inner layer of the UHPC, the failure is manifested by crushing and crack development. The ECC layer is designed to provide high ductility and crack resistance, but under extreme loading conditions, micro-cracks and crushing may still occur. Experimental data show that when the ECC layer reaches its ultimate state, the surface crack width can reach 0.5 mm, and the depth of the compression zone can reach 20 mm. Similarly, although the inner UHPC has high compressive strength, it will also experience crushing after exceeding its compressive capacity. The crushing depth of the UHPC was measured in experiments to be 25 mm, and these data are critical for evaluating the material’s behavior under high stress and its impact on the overall structural safety.
Through an in-depth analysis of the EUFDST column failure modes, it can be seen that the local bulge of the external steel tube, the crack development of the ECC, and the crushing of the UHPC jointly led to the overall failure of the structure. These quantitative measurements not only provide an in-depth understanding of material behavior but also help in the design process to consider how to prevent such failures by improving material formulations, adjusting structural details, or enhancing the design of local stress-bearing areas.
8.2. Force Mechanism and Force Analysis of the Whole Process
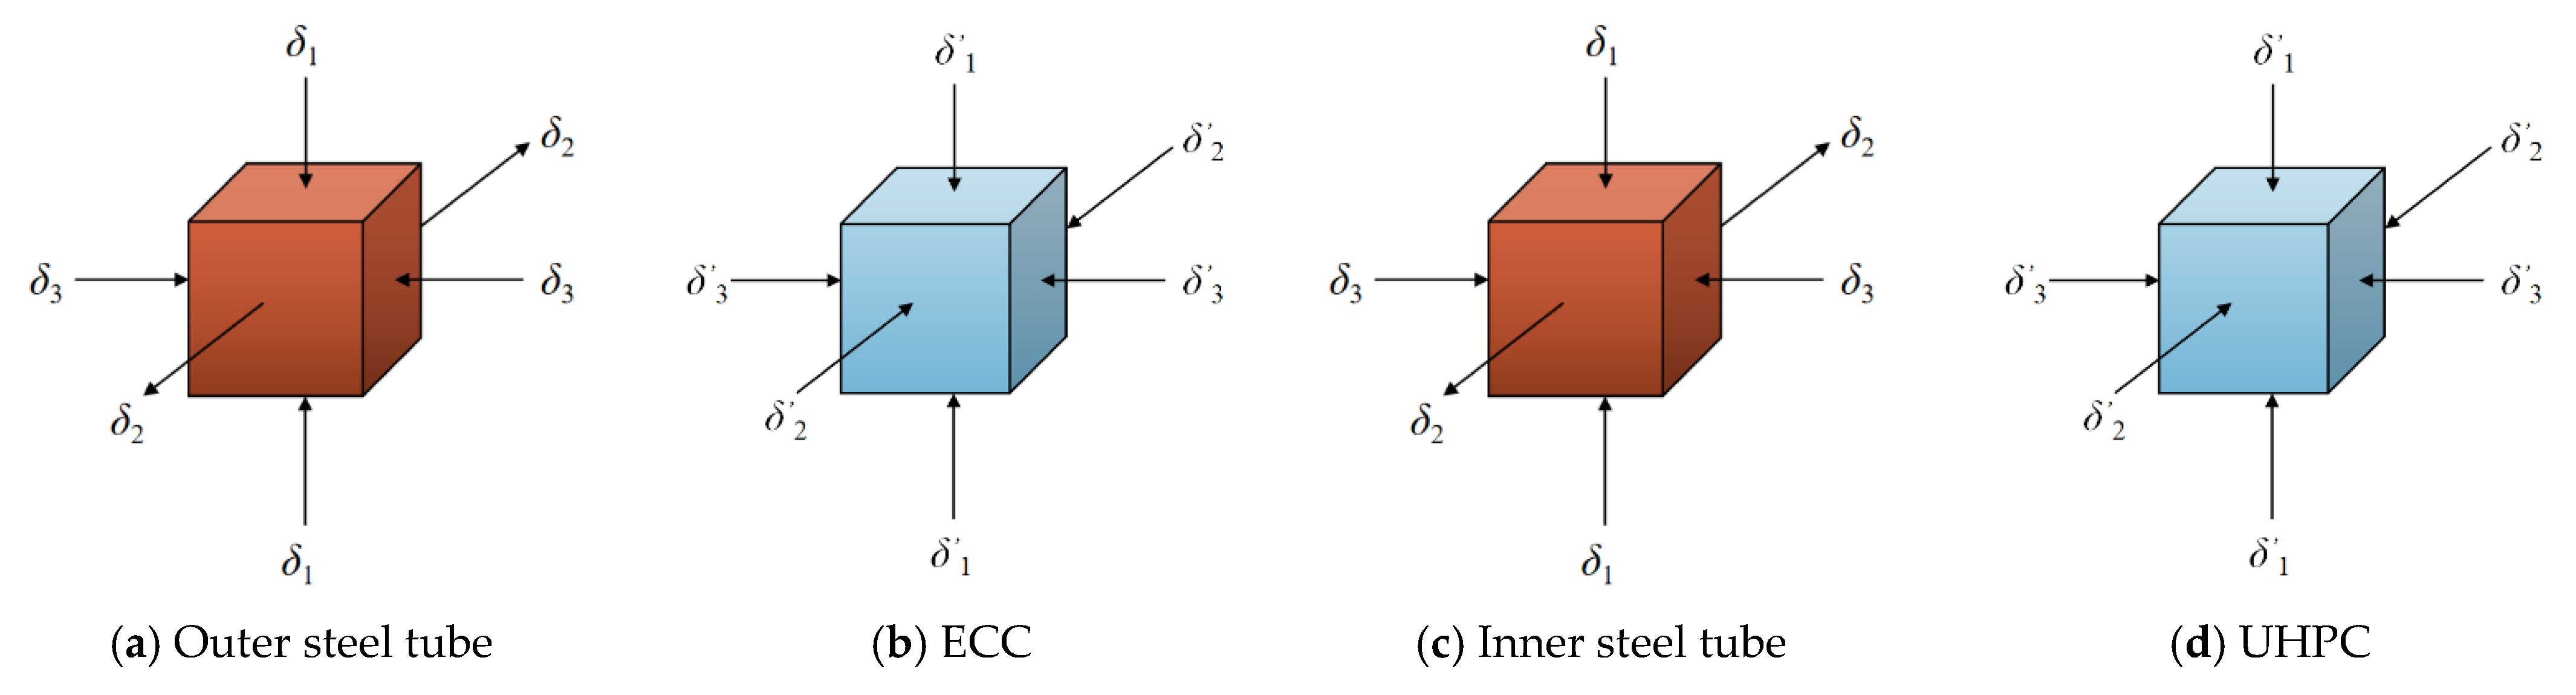
The components of the EUFDST composite column will produce longitudinal strain (ε1) with a gradual increase in eccentric load, and the components will produce radial strain (εs) with the longitudinal strain. The relationship between ε1 and εs is depicted in Equation (6) [33].
In the equation, ε‘Os is the radial strain of the outer steel tube, ε‘Is is the radial strain of the inner steel tube, ε‘ECCs is the radial strain of the ECC, ε‘UHPCs is the radial strain of the UHPC, μs is the Poisson’s ratio of steel, μUHPC is the Poisson’s ratio of the UHPC, and μECC is the Poisson’s ratio of the ECC.
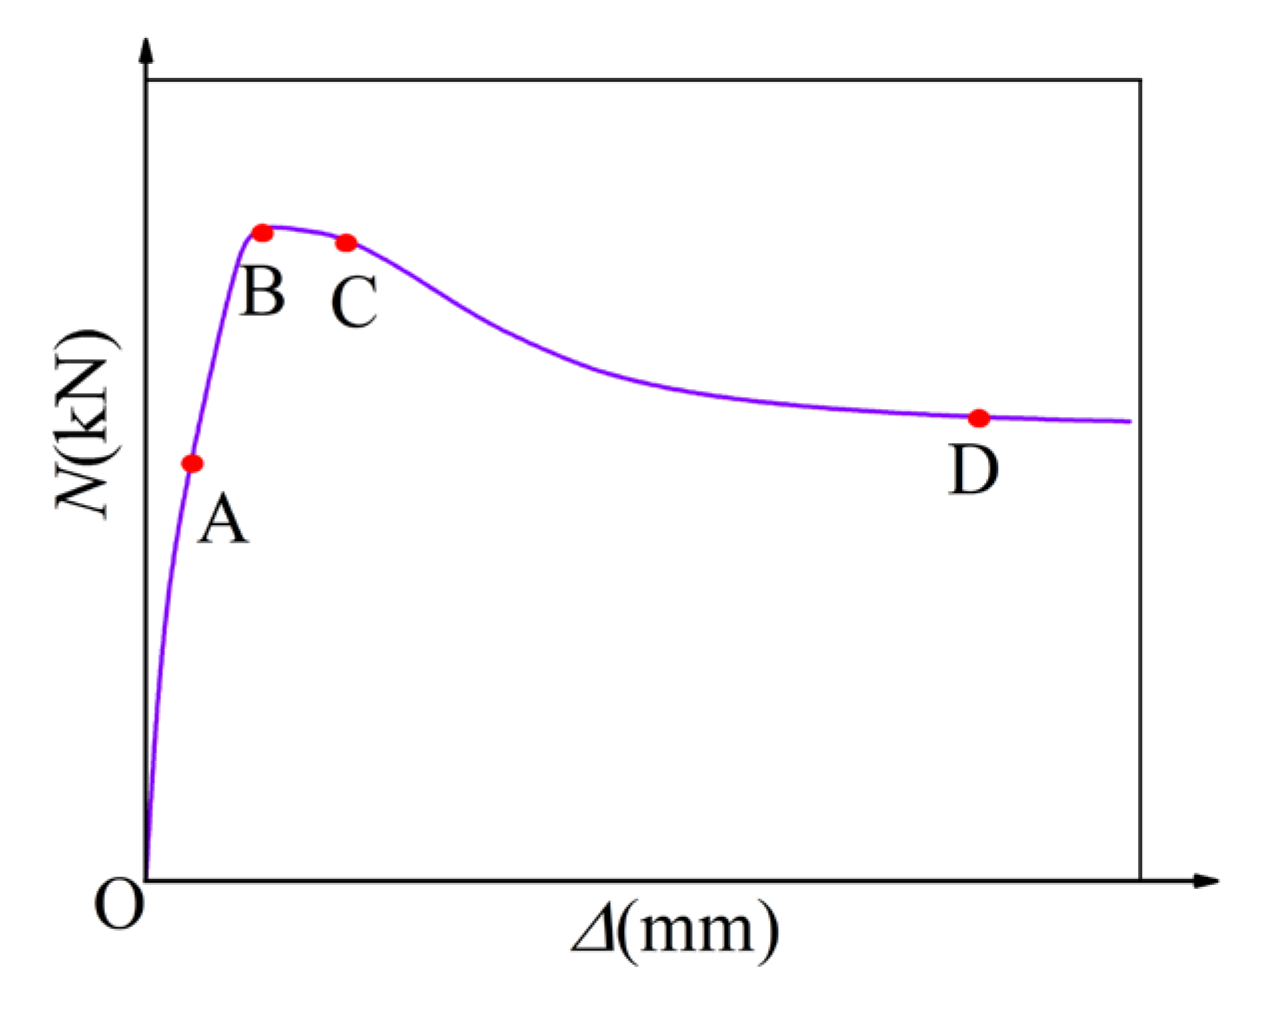
According to the finite element analysis, the stress progression of the EUFDST composite column under eccentric load can be categorized into four distinct phases: elastic stage OA, elastic-plastic stage AB, load stability stage BC, and failure stage CD. The load-mid-span deflection curve of typical specimens is depicted in Figure 31. The longitudinal stress distribution of each component at different stages is depicted in Figure 32, and the micro-stress diagram of each component unit is depicted in Figure 33. The whole process and mechanism of the ECUFDST composite column under eccentric load are analyzed by combining Equation (6) and Figure 31, Figure 32 and Figure 33.
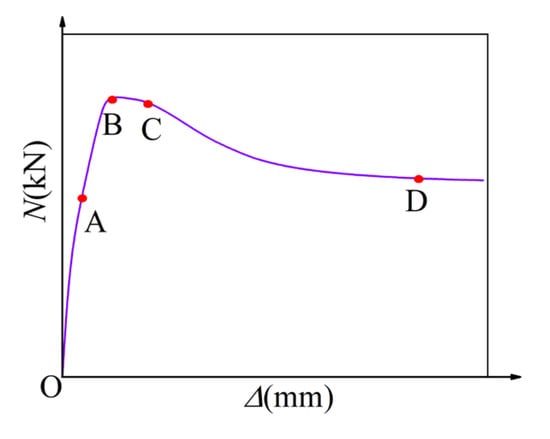
Figure 31.
N-μm curves of specimen EUFDST-2.
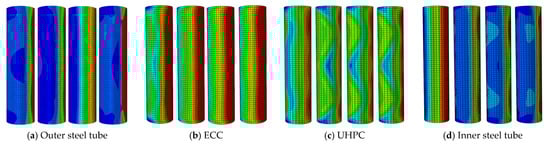
Figure 32.
Longitudinal stress distribution of each component at different stages.
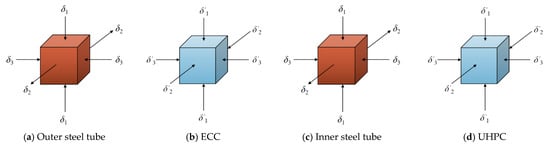
Figure 33.
Micro-stress diagram of each component unit.
The composite column is in the elastic stage in the initial OA loading stage. At this time, the Poisson’s ratio of concrete is less than that of steel, the contact between the steel tubes and concrete is less, the internal and external concrete and the internal and external steel tubes are in an independent working state, and the longitudinal stress is vertically evenly distributed. The stress on the compression side of the external steel tube is higher than that on the tension side. The composite column is in a state of compression as a whole. The internal and external steel tubes do not exert a restraining effect on the concrete.
As the load gradually increases, the outer steel tube and the steel tube in the compression zone reach the proportional limit. The Poisson’s ratio of steel and concrete is approximately equal to the radial strain. At this time, the specimen enters the elastoplastic stage, μECC > μs, μUHPC > μs. The radial strain of the interlayer ECC and the core UHPC is greater than that of the outer steel tube in the compression zone. As the concrete in the tension zone gradually expands outward, the steel tube in the compression zone buckles inward, and the inner and outer steel tubes begin to come into contact with the concrete. At this time, the steel tube begins to constrain the core concrete. The stress distribution of the individual micro-units within each component is illustrated in Figure 33. The inner and outer steel tubes and concrete are in a three-dimensional stress state. In this stage, the load gradually decreases with the increased rate of deflection. The outer steel tube in the compression zone reaches the yield strength before the inner steel tube, and then both the compression zone reaches the yield strength and some concrete in the compression zone reaches the strength limit. With the load increase, the composite column’s bearing capacity reaches the limit value.
From then, it enters the BC section of the load-holding stage. The longitudinal stress distribution of each component in this stage is similar to that in the elastic-plastic stage. The main reason for the load–displacement curve to maintain a certain stability is that the ECC in the compression zone does not reach its compressive strength limit value, and due to the special tensile characteristics of ECC, its tensile stress is still in the rising section. Therefore, the load in this stage maintains a certain stable value. With the gradual increase in displacement load, the ECC in the compression zone reaches its compressive strength limit value, and the ECC in the tension zone reaches its secondary rise limit value.
At this time, the specimen enters the final stage, and the plastic stage fails. At this time, all parts of the inner steel tube reach the ultimate strength. The ECC in the tension zone is cracked, the tensile stress gradually decreases, and the ECC and UHPC in the compression zone are crushed. At this stage, the deformation of the composite column increases significantly, the maximum load-bearing capacity decreases rapidly, and it finally tends to be stable. At this time, the composite column has been completely destroyed.
9. Maximum Load-Bearing Capacity Equation of Eccentrically Loaded Composite Long Columns
Based on the maximum load-bearing capacity equation of axial compression of double concrete-filled steel tubular composite columns [0], referring to the “Technical Code for Concrete Filled Steel Tubular Structures” GB-50936-2014 [34], the eccentricity correction coefficient and the slenderness ratio correction coefficient are introduced, and the maximum load-bearing capacity formula of EUFDST composite columns under eccentric load is statistically regressed:
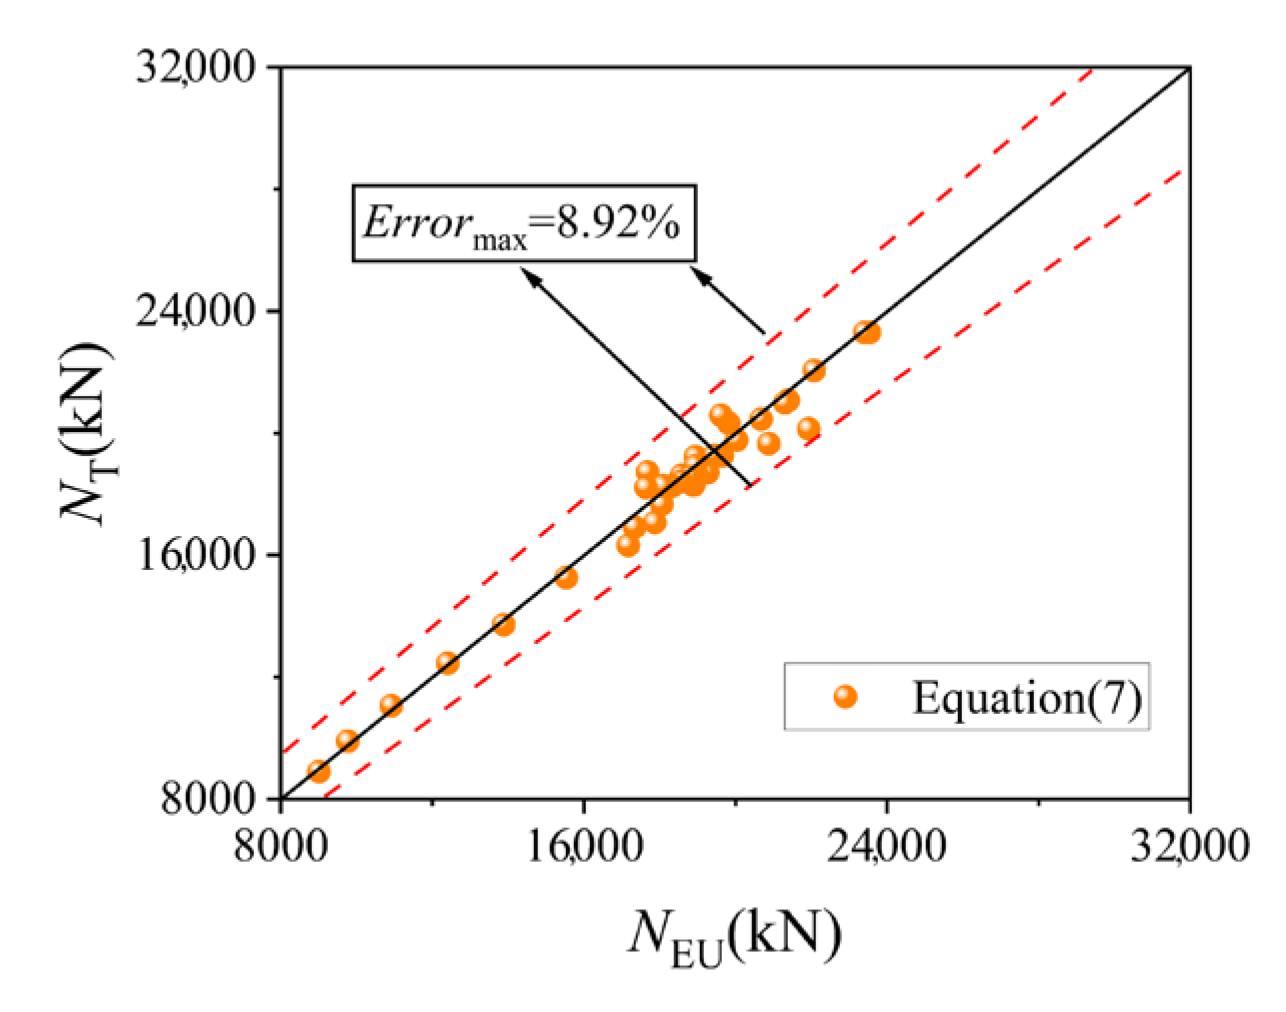
In the equation, ρλ is the slenderness ratio correction coefficient, ρe is the eccentricity correction coefficient, is the slenderness ratio, and e is the eccentricity distance. The maximum load-bearing capacity of eccentric compression calculated according to Equation (7) is depicted in Table 6. Other coefficients are illustrated in Equations (8)–(12). The scatter plot of the calculated value and the simulated value of the maximum load-bearing capacity of eccentric compression is depicted in Figure 34. Table 6 and Figure 34 indicate that the maximum discrepancy between the calculated and simulated results is 8.92%, which meets the requirements of engineering accuracy.
Table 6.
Comparison of simulation and calculated bearing capacity for 35 specimens.
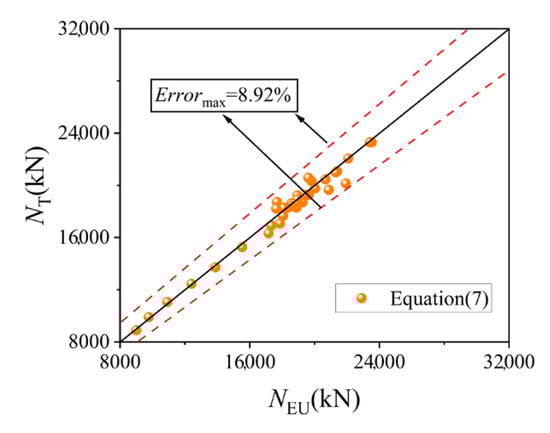
Figure 34.
Comparison of simulation and calculation of bearing capacity error for specimens.
10. Conclusions
Based on the strength of the inner and outer steel tubes (fy1, fy2), the thickness of the inner and outer steel tubes (t1, t2), the compressive strength of the UHPC cylinder (fcu), the content of PVA (γ), the diameter ratio of inner and outer steel tubes (Ω), and the slenderness ratio (λ) as the main parameters, 35 full-scale EUFDST eccentric compression long column models were established. The mechanical properties of the EUFDST composite columns under eccentric load were analyzed, and the following conclusions were drawn:
- (1)
- The maximum load-bearing capacity of the EUFDST composite columns under eccentric compression increases with the increase in the strength of inner and outer steel tubes (fy1, fy2), the thickness of inner and outer steel tubes (t1, t2), the compressive strength of the UHPC cylinder (fcu), the content of PVA (γ), and the diameter ratio of inner and outer steel tubes (Ω). With the slenderness ratio’s (λ) increase, the maximum load-bearing capacity of the EUFDST composite columns under eccentric compression decreases gradually. The initial stiffness of the EUFDST composite column gradually increases with the increase in the thickness of the inner and outer steel tubes (t1, t2), the compressive strength of the UHPC cylinder (fcu), the PVA content (γ), and the diameter ratio of the inner and outer steel tubes (Ω). However, as the slenderness ratio (λ) increases, the initial stiffness of the EUFDST composite column gradually decreases. When the strength of the inner and outer steel tubes varies from 235 MPa to 535 MPa, the initial stiffness of the EUFDST composite column remains unchanged. The ductility coefficient of the EUFDST composite column under eccentric load increases with the increase in the strength of the inner and outer steel tubes (fy1, fy2), the thickness of inner and outer steel tubes (t1, t2), and the content of PVA (γ). At the same time, with the increase in the compressive strength (fcu) and slenderness ratio (λ) of the UHPC cylinder, the ductility coefficient of the composite column decreases gradually. When the diameter ratio of the inner and outer steel tubes (Ω) changes in the range of 1.3–2, the ductility of the composite column increases with the increase in the diameter ratio. When the diameter ratio changes in the range of 2–2.5, the ductility of the composite column decreases.
- (2)
- The failure modes of all full-scale ECUFDST composite column specimens under eccentric load are similar, manifested as the outward buckling of the outer steel tube at the end of the compression zone and the ECC at the end of the compression zone. The inner and outer steel tubes in the mid-span are all subjected to yield failure. The concrete in the mid-span of the compression zone is crushed, and the concrete in the tension zone is cracked. Due to the special cross-section form of double steel tubes, the concrete in the tensile zone is mainly interlayer ECC, while the core UHPC mainly bears axial pressure, and the tensile part is less.
- (3)
- The EUFDST composite column is mainly divided into four stages under eccentric load: the elastic stage, elastic-plastic stage, stable stage, and failure stage. By introducing the slenderness ratio correction coefficient and the eccentricity correction coefficient, the calculation equation of the axial compression maximum load-bearing capacity of the full-scale EUFDST composite column is statistically regressed, and the finite element results are compared. The maximum error is 8.92%, which meets the engineering accuracy requirements.
- (4)
- For the EUFDST composite column, it is recommended to control the UHPC strength at 120 Mpa, which can maintain good ductility; the PVA fiber content is recommended to be controlled at 2%, which can effectively improve the bearing capacity and ductility. The thickness of the outer steel tube is recommended to be controlled at 15 mm, and the thickness of the inner steel tube is controlled at 20 mm. When the strength of the outer steel tube increases to 435 Mpa, the ductility increases significantly. It is recommended to control it at 435 Mpa. When the inner steel tube increases, the ductility coefficient increases linearly and can be controlled according to the actual situation. When the diameter ratio is about 1.5, the bearing capacity and ductility of the composite column can be improved with less material cost. For the composite column with large eccentricity, the diameter of the inner steel tube can be appropriately reduced. Taking the specimen in this paper as an example, the variation range can be controlled within 20 mm. For the composite column with a large slenderness ratio, there is no need to change the diameter ratio.
- (5)
- Compared to traditional steel tubular concrete columns, the bending resistance of EUFDST composite columns has been greatly improved. UHPC provides high load-bearing capacity, while the outer steel tube and ECC provide strong constraints. At the same time, the presence of ECC improves the ductility of the structure. In practical applications, combining the two reduces the impact of the high brittleness of UHPC and the low compressive strength of ECC. Inevitably, due to the high production costs of UHPC and ECC, the economic benefits of the EUFDST combination are relatively low, making it difficult to utilize widely.
Author Contributions
Conceptualization, L.J.; Software, L.J., Y.H., J.J., Y.L., X.C. and G.M.; Formal analysis, Y.H.; Validation, J.J.; Investigation, Y.H. and Z.Z.; writing—original draft, L.J. and Y.H.; writing—review and editing, Y.H., J.J., Y.L., Z.Z., X.C. and G.M. All authors have read and agreed to the published version of the manuscript.
Funding
This research was funded by the General Project of the National Natural Science Foundation of China (52178143), Joint Guidance Project of Natural Science Foundation of Heilongjiang Province (No. LH2020E018), Scientific Research Fund of Institute of Engineering Mechanics of China Earthquake Administration (No. 2020D07), and the China-Pakistan Belt and Road Joint Laboratory on Smart Disaster Prevention of Major Infrastructures (No. 2022CPBRJL-05).
Data Availability Statement
The data supporting this study’s findings are included in the article.
Conflicts of Interest
The authors declare no conflicts of interest.
References
- Ahmad, J.; Majdi, A.; Babeker Elhag, A.; Deifalla, A.F.; Soomro, M.; Isleem, H.F.; Qaidi, S. A Step towards Sustainable Concrete with Substitution of Plastic Waste in Concrete: Overview on Mechanical, Durability and Microstructure Analysis. Crystals 2022, 12, 944. [Google Scholar] [CrossRef]
- Ji, J.; Wang, W.; Jiang, L.; Ren, H.; Wang, Q.; Xuan, W.; Liu, Y. Bearing capacity of uhpc-filled high-strength elliptical steel tube composite columns with encased high-strength h-shape steel subjected to eccentrical load. Buildings 2022, 12, 1272. [Google Scholar] [CrossRef]
- Li, V.C. A simplified micromechanical model of compressive strength of fiber-reinforced cementitious composites. Cement. Concrete Comp. 1992, 14, 131–141. [Google Scholar] [CrossRef]
- Fischer, G.; Li, V.C. Effect of matrix ductility on deformation behavior of steel-reinforced ECC flexural members under reversed cyclic loading conditions. Aci Struct. J. 2002, 99, 781–790. [Google Scholar]
- Maalej, M.; Li, V.C. Flexural strength of fiber cementitious composites. J. Mater. Civil Eng. 1994, 6, 390–406. [Google Scholar] [CrossRef]
- Ji, J.; He, L.J.; Jiang, L.Q.; Zhang, Y.F.; Liu, Y.C.; Li, Y.H.; Zhang, Z.B. Numerical study on the axial compression behavior of composite columns with steel tube SHCC flanges and honeycombed steel web. Eng. Struct. 2023, 283, 115883. [Google Scholar] [CrossRef]
- Xu, S.L.; Li, H.D. Research progress and engineering application of ultra-high toughness cementitious composites. China Civil Eng. J. 2008, 6, 45–60. [Google Scholar]
- Jaf, D.K.I.; Abdulrahman, P.I.; Mohammed, A.S.; Kurda, R.; Qaidi, S.M.A.; Asteris, P.G. Machine learning techniques and multi-scale models to evaluate the impact of silicon dioxide (SiO2) and calcium oxide (CaO) in fly ash on the compressive strength of green concrete. Constr. Build. Mater. 2023, 400, 132604. [Google Scholar]
- Ji, J.; Zhang, Z.; Lin, M.; Li, L.; Jiang, L.; Ding, Y.; Yu, K. Structural Application of Engineered Cementitious Composites (ECC): A State-of-the-Art Review. Constr. Build. Mater. 2023, 406, 133289. [Google Scholar] [CrossRef]
- Ahmed, M.; Liang, Q.Q.; Patel, V.I.; Hadi, M.N. Numerical analysis of axially loaded circular high strength concrete-filled double steel tubular short columns. Thin Walled Struct. 2019, 138, 105–116. [Google Scholar] [CrossRef]
- Ahmed, M.; Liang, Q.Q.; Patel, V.I.; Hadi, M.N. Experimental and numerical studies of square concrete-filled double steel tubular short columns under eccentric loading. Eng. Struct. 2019, 197, 109419. [Google Scholar] [CrossRef]
- Ci, J.; Mizan, M.A.; Tran, V.-L.; Jia, H.; Chen, S. Axial compressive behavior of circular concrete-filled double steel tubular short columns. Adv. Struct. Eng. 2022, 25, 259–276. [Google Scholar] [CrossRef]
- Hu, J.; Huang, Y.; Li, W.; Zhang, S.; Rao, S. Compressive behavior of UHPC-filled square high-strength steel tube stub columns under eccentric loading. J. Constr. Steel Res. 2022, 198, 107558. [Google Scholar] [CrossRef]
- Cai, J.; Pan, J.; Tan, J.; Vandevyvere, B.; Li, X. Behavior of ECC-encased CFST columns under eccentric loading. J. Build. Eng. 2020, 30, 101188. [Google Scholar] [CrossRef]
- Chai, X.W.; Xie, Q.; Wang, X. Experimental study on tensile properties of hybrid fiber high toughness cementitious composites. J. Build. Struct. 2022, 43, 353–361. [Google Scholar]
- Ci, J.C.; Mizan, A.; Liang, Q.Q.; Chen, S.C.; Chen, W.S.; Sennah, K.; Hamoda, A. Experimental and numerical investigations into the behavior of circular concrete-filled double steel tubular slender columns. Eng. Struct. 2022, 267, 114644. [Google Scholar] [CrossRef]
- Liu, W.; Han, L.H. Study on the working mechanism of concrete filled steel tube under axial local compression load. China Civil Eng. J. 2006, 39, 19–27. [Google Scholar]
- Tao, Z.; Wang, Z.B.; Yu, Q. Finite element modeling of concrete-filled steel stub columns under axial compression. J. Constr. Steel Res. 2013, 89, 121–131. [Google Scholar] [CrossRef]
- Lam, L.; Teng, J.G. Design-Oriented Stress-Strain Model for FRP-Confined Concrete. Constr. Build. Mater. 2003, 17, 471–489. [Google Scholar] [CrossRef]
- Mander, J.B.; Priestley, M.J.N.; Park, R. Theoretical Stress-strain Model for Confined Concrete. J. Struct. Eng. 1988, 114, 1804–1826. [Google Scholar] [CrossRef]
- Pagoulatou, M.; Sheehan, T.; Dai, X.H. Finite element analysis on the capacity of circular concrete-filled double-skin steel tubular (CFDST) stub columns. Eng. Struct. 2014, 72, 102–112. [Google Scholar] [CrossRef]
- Montuori, R.; Piluso, V.; Tisi, A. Comparative analysis and critical issues of the main constitutive laws for concrete elements confined with FRP. Compos. Part B-Eng. 2012, 43, 3219–3230. [Google Scholar] [CrossRef]
- Montuori, R.; Piluso, V.; Tisi, A. Ultimate behaviour of FRP wrapped sections under axial force and bending: Influence of stress-strain confinement model. Compos. Part B-Eng. 2013, 54, 85–96. [Google Scholar] [CrossRef]
- Li, Y.; Liang, X.W.; Deng, M.K. Constitutive Model of High-Performance PVA Fiber Reinforced Cementitious Composites under Conventional Triaxial Compression. Eng. Mech. 2012, 29, 106–113. [Google Scholar]
- Wang, Y.K. Research on Seismic Performance of ECC Bridge Piers. Master’s Thesis, Shandong University, Jinan, China, 2021. [Google Scholar]
- Xiong, M.X.; Xiong, D.X.; Liew, J.Y.R. Axial performance of short concrete filled steel tubes with high- and ultra-high-strength materials. Eng. Struct. 2017, 136, 494–510. [Google Scholar] [CrossRef]
- Luo, X.; Wei, J.G. Experimental study on eccentric compression performance of ultra-high strength concrete filled high strength steel tube. J. Build. Struct. 2021, 42, 271–277. [Google Scholar]
- Wei, J.G.; Luo, X.; Ou, Z.J.; Chen, B.C. Experimental study on axial compression behavior of ultra-high performance concrete filled circular high strength steel tube short columns. J. Build. Struct. 2020, 41, 16–28. [Google Scholar]
- Zhang, Y.X.; Deng, M.; Li, R.Z. Axial behavior of engineered cementitious composites confined by circular steel tubes. Eng. Struct. 2020, 224, 112216. [Google Scholar] [CrossRef]
- Zhang, Z.; Wu, X.; Hu, G.; Sun, Q. Numerical study on triaxial compressive behavior of engineered cementitious composites confined by circular steel tubes. Constr. Build. Mater. 2022, 345, 128285. [Google Scholar] [CrossRef]
- Mao, M.; Tong, K.T.; Zhang, J.L.; Liu, T.; Li, Y. Experimental study on the mechanical performance of steel-bamboo composite I-section columns under eccentric loading. J. Build. Struct. 2021, 42, 126–135. [Google Scholar]
- Jiang, L.; Wang, W.; Ji, J.; Ren, H.; Wang, Q.; Sun, R.; Yu, C.; Zhang, H.; Luo, G. Bearing behavior of high-performance concrete-filled high-strength steel tube composite columns subjected to eccentrical load. Front. Mater. 2022, 9, 972811. [Google Scholar] [CrossRef]
- Ji, J.; Yu, D.Y.; Jiang, L.Q. Study on axial compression bearing capacity of solid-web double steel tube reinforced concrete composite short column. Build. Struct. 2020, 50, 120–129. [Google Scholar]
- GB 50936-2014; Technical Code for Concrete-Filled Steel Tubular Structures. China Architecture & Building Press: Beijing, China, 2014.


Disclaimer/Publisher’s Note: The statements, opinions and data contained in all publications are solely those of the individual author(s) and contributor(s) and not of MDPI and/or the editor(s). MDPI and/or the editor(s) disclaim responsibility for any injury to people or property resulting from any ideas, methods, instructions or products referred to in the content. |
© 2024 by the authors. Licensee MDPI, Basel, Switzerland. This article is an open access article distributed under the terms and conditions of the Creative Commons Attribution (CC BY) license (https://creativecommons.org/licenses/by/4.0/).