Article

Effects of Remolding Water Content and Compaction Degree on the Dynamic Behavior of Compacted Clay Soils

1
School of Civil and Transportation Engineering, Beijing University of Civil Engineering and Architecture, Beijing 102616, China
2
Engineering Technology Innovation Center of Construction and Demolition Waste Recycling, Beijing 102616, China
3
Beijing Capital Highway Development Corporation Ltd., Beijing 100161, China
*
Author to whom correspondence should be addressed.
Buildings 2024, 14(8), 2258; https://doi.org/10.3390/buildings14082258
Submission received: 9 May 2024 / Revised: 30 June 2024 / Accepted: 11 July 2024 / Published: 23 July 2024
(This article belongs to the Section Building Materials, and Repair & Renovation)

Abstract

:
The stable and safe operation of highway/railway lines is largely dependent on the dynamic behavior of subgrade fillings. Clay soils are widely used in subgrade construction and are compacted at different remolding water contents and compaction degrees, depending on the field conditions. As a result, their dynamic behaviors may vary, which have not been fully investigated until now. To clarify this aspect, a series of cyclic triaxial tests were carried out in this study with three typical remolding water contents (w = 19%, 24%, and 29%), corresponding to the optimum water content as well as its dry and wet sides, and two compaction degrees (Dc = 0.8 and 0.9), which were selected according to the field-testing data. Scanning electron microscopy (SEM) and mercury intrusion porosimetry (MIP) tests were also conducted on typical samples to investigate the corresponding soil fabric variations. The findings indicate the following: (a) The soil fabric at the optimum remolding water content and its dry side was characterized by a clay aggregate assembly with a bimodal pore size distribution. In contrast, the soil fabric on the wet side of the optimum water content consisted of dispersed clay particles with a unimodal pore size distribution. (b) As the compaction degree increased, to ensure the optimum water content and its dry side, large pores were compressed to make them smaller, while small pores remained unchanged. Comparatively, all the pores on the wet side were compressed to make them smaller. (c) For each compaction degree, as the remolding water content increased, a non-monotonic changing pattern was identified for both the permanent strain and resilient modulus; the permanent strain first decreased and then increased, while, for the resilient modulus, an initial increasing trend and then a decreasing trend were identified. In addition, a larger changing rate of the permanent strain (resilient modulus) was observed on the dry side, indicating a larger effect of the remolding water content. (d) For each remolding water content, as the compaction degree increased, the permanent strain exhibited a decreasing trend, but an increasing trend was identified for the resilient modulus. Moreover, the rate of change in the permanent strain (resilient modulus) on the dry side of the optimum water content was larger than that on the wet side. In contrast, the minimum rate of change was identified at the optimum water content. The obtained results allowed for the effects of the remolding water content and compaction degree on the dynamic behavior to be analyzed, and they helped guide the construction and maintenance of the subgrade.

1. Introduction

In China, clay soils are widely distributed in alluvial plains, deltas, and coastland zones [1,2]. When constructing railways and highways in these regions, local clay materials are often employed as subgrade fillings due to a lack of coarse-grained materials and the increased construction costs of transporting them from far away. The subgrade is a key structural element of a road structure system, playing a role in carrying the cyclic traffic loads transmitted from the upper part (for example, the wheel–rail–sleeper system in the railway). A poor dynamic response of the subgrade (permanent deformation and resilient modulus) could lead to numerous problems, such as rutting, cracking, and uneven settlement [3,4,5,6,7], creating risks for the stable and safe operation of highway/railway lines. Thus, from a practical paradigm, investigating the dynamic behavior of compacted clay soils is important.
During road subgrade construction, the filling materials are usually compacted to a certain compaction degree (the ratio of the dry density to the maximum dry density) at the optimum water content [8,9,10]. However, due to variations in construction techniques and complex site conditions, the remolding water content is not always precisely controlled in the optimum state, and the compaction degree might vary from site to site. Previous studies have demonstrated that the microstructure of compacted clay shows a strong dependency on the remolding water content and compaction degree, and the mechanical properties may vary accordingly [9,11,12,13,14,15]. Therefore, it is necessary to study the impacts of the remolding water content and compaction degree on the dynamic behavior of compacted clay.
Numerous studies have been carried out regarding the effect of the remolding water content on the dynamic performance of subgrade fillings. It has been shown that the results of pure coarse grains are relatively simple: The increase in the water content enlarges the permanent strain but decreases the resilient modulus. This could be attributed to the matric suction (or bonding effect) reduction induced by the water content increment [7,16,17]. When pure coarse grains are mixed with clay soils, the situation becomes complex. Doung et al. [18] found that, at high clay contents, the resilient modulus decreased with the increase in the water content. However, at low clay contents, the resilient modulus was observed to decrease first but then increase as the water content increased. Chen et al. [19] and Lekarp et al. [20] also observed a non-monotonic relationship between the resilient modulus of a gravel–clay mixture and the water content. In the case of pure clay soils, the situation is even more complicated since, under this circumstance, both the soil fabric and matric suction vary significantly with the change in the water content [14,21]. Existing studies have primarily focused on the optimum moisture content and its wet side [12,22,23,24], indicating that, as the water content increases, the permanent strain increases, while the resilient modulus decreases. However, since the remolding water content corresponding to the dry side of the optimum water content has not been considered, it is still unclear how clay subgrade fillings under cyclic loading behave when the remolding water content changes from an optimum state to its dry side. In addition, since no comprehensive microstructure observations were carried out in previous studies, the microscopic mechanism for the dynamic behavior variation within the whole range of remolding water conditions remains unclear.
Regarding the compaction degree effect, relevant studies are quite limited. Feng et al. [25] studied the mechanical behavior of biopolymer-modified, fine-grained soils with different compaction degrees at the optimum water content. They found that the unconfined compressive strength and split tensile strength were significantly improved by an increment in the compaction degree. Liu and Xiao [22] studied the effect of the compaction degree on the dynamic behavior of fine-grained soils at the optimum remolding water content and its wet side and found that the increment in the compaction degree favored the dynamic response. However, these studies did not consider the dry side of the optimum water content and, thus, did not enable the assessment of the compaction degree effect in this case. In addition, the fundamental mechanism for the compaction degree effect is still unclear, as no comprehensive microstructure investigations have been performed.
In summary, the studies concerning the effects of the remolding water content and compaction degree have focused on the optimum water content and its wet side. The dry side of the optimum water content, where soil fabric and matric suction vary in a more complex manner, has not been considered, and thus, there has been no assessment of the effects of the remolding water content and compaction degree in this case. In addition, the microscopic mechanism underlying the variation in dynamic behavior within the whole remolding water content range remains unclear, and no comprehensive microstructure observations were conducted in previous studies. In this study, the dynamic behavior (permanent strain and resilient modulus) of compacted clay soils was studied by carrying out cyclic triaxial tests. Three remolding water contents, at 19%, 24%, and 29% (covering the optimum water content and its dry and wet sides), and two compaction degrees (0.8 and 0.9) were considered. Additionally, SEM and MIP tests were carried out on typical samples to identify their soil fabric. The results allowed for the analysis of the effects of the remolding water content and compaction degree on the dynamic behavior of compacted clay soils.

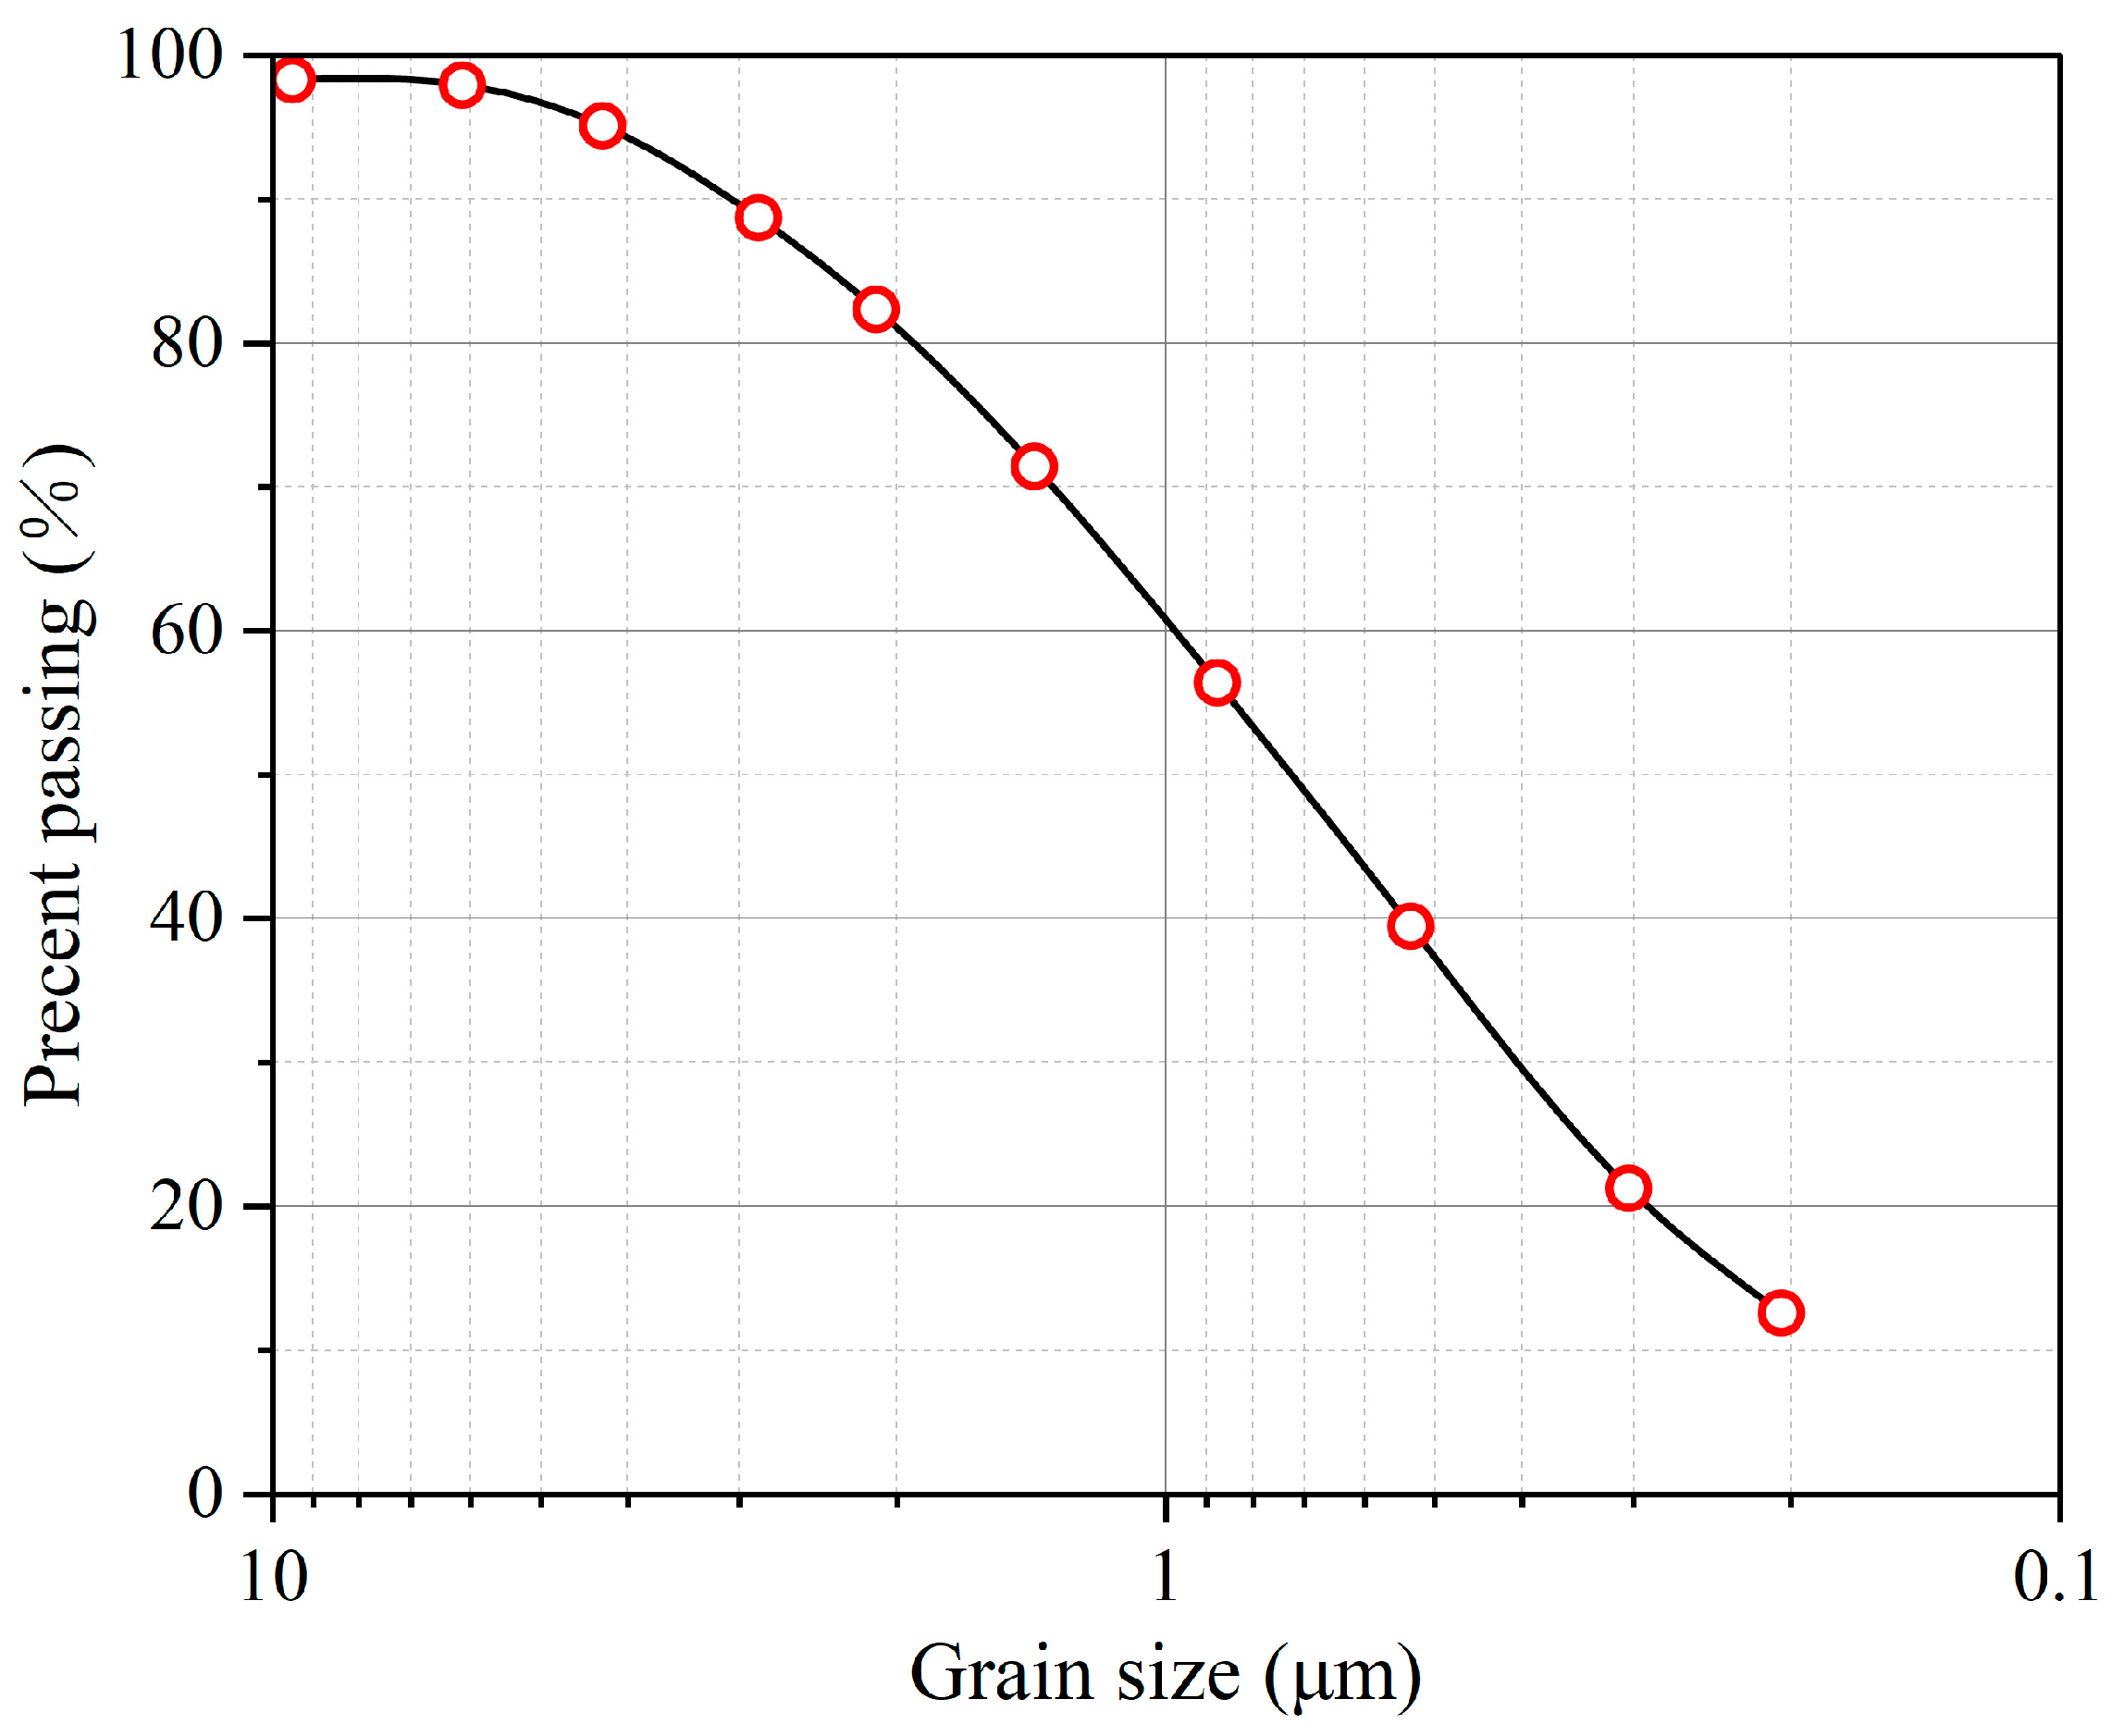
2. Testing Materials

The clay soil used in this study was commercial soil provided by IMERYS Minerals Ltd. Company (Paris, France). The determined grain size distribution is shown in Figure 1. The liquid limit wL and the plastic limit wP were determined as 63% and 37%, respectively. According to the Unified Soil Classification System (ASTM 2007) [26], this soil is classified as highly plastic silt (MH). A standard compaction curve was obtained from ASTM D698-12 [27], and the obtained compaction curve is shown in Figure 2. The optimum water content (wopt) and maximum dry density (ρd-max) were identified as 24% and 1.57 Mg/m3, respectively. The basic properties of the tested clay soils are summarized in Table 1.

3. Experimental Methods

3.1. Preparation of Specimens

Cylindrical samples with 39.1 mm in diameter and 80 mm in height were prepared for the cyclic triaxial tests. Since the maximum grain size of the clay soils was 0.01 mm, a diameter size of 39.1 mm was considered large enough to eliminate the grain-size effect.
Before the sample compaction procedure, the weights of water and dry clay soils were calculated based on the target remolding water content and compaction degree. Then, water with a predetermined mass was sprayed on the dry clay soils to attain the target water content. Finally, the wetted clay soils were placed in a tight container for 24 h to ensure water homogenization. Sample compaction was carried out in 5 layers, with an equal mass and height for each layer. It is important to note that, when finishing the compaction of a certain layer, its surface was scraped to a depth of approximately 0.5 mm to ensure good interlocking between adjacent layers. The prepared samples were wrapped using plastic film for water homogenization for at least 24 h before being subjected to cyclic loading.

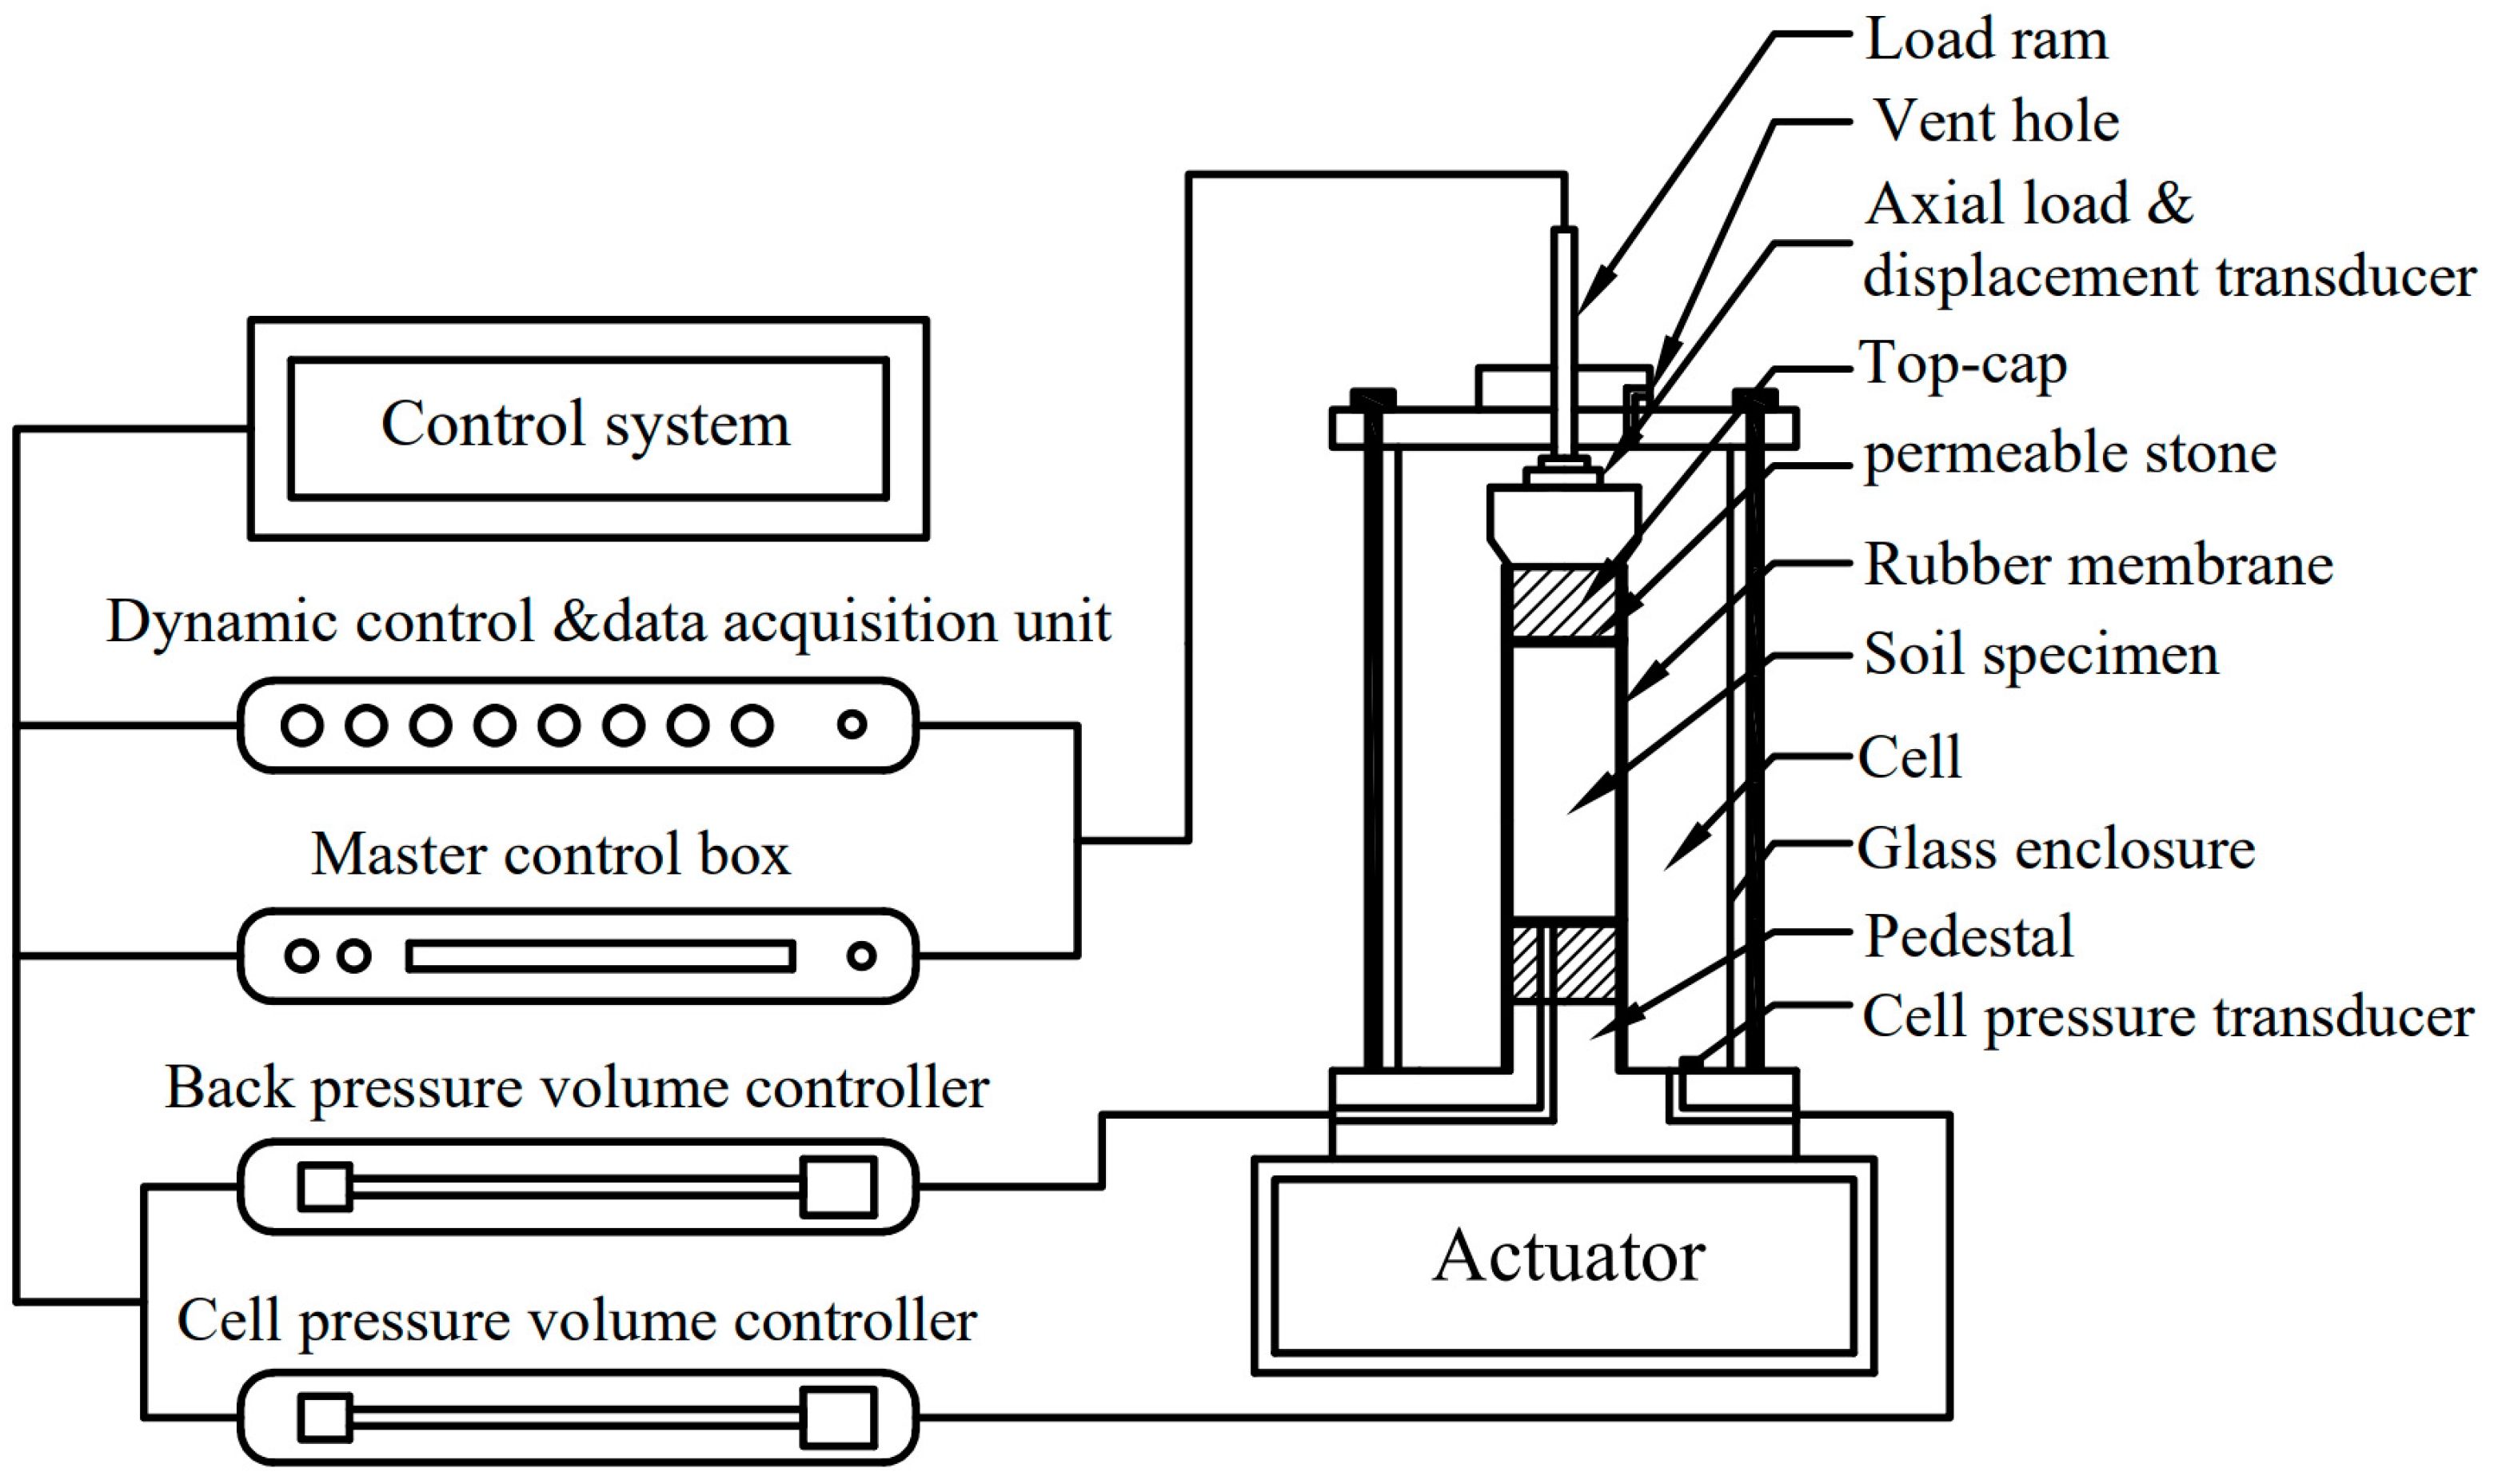
3.2. Testing Apparatus

Cyclic triaxial tests were performed using an electromechanical cyclic triaxial testing system (DYNTTS) designed and manufactured by GDS Instruments. The main components of the testing system are presented in Figure 3, which include a triaxial pressure chamber, a confining pressure controller, a back pressure controller, an axial drive device, a digital control system, and a DCS dynamic data acquisition system. The entire loading process was completely controlled by the digital system. The maximum applied axial loading could reach 20 kN, and the maximum confining pressure was 2 MPa. During the loading process, experimental data, such as axial deformation and force, were collected through the data acquisition system.

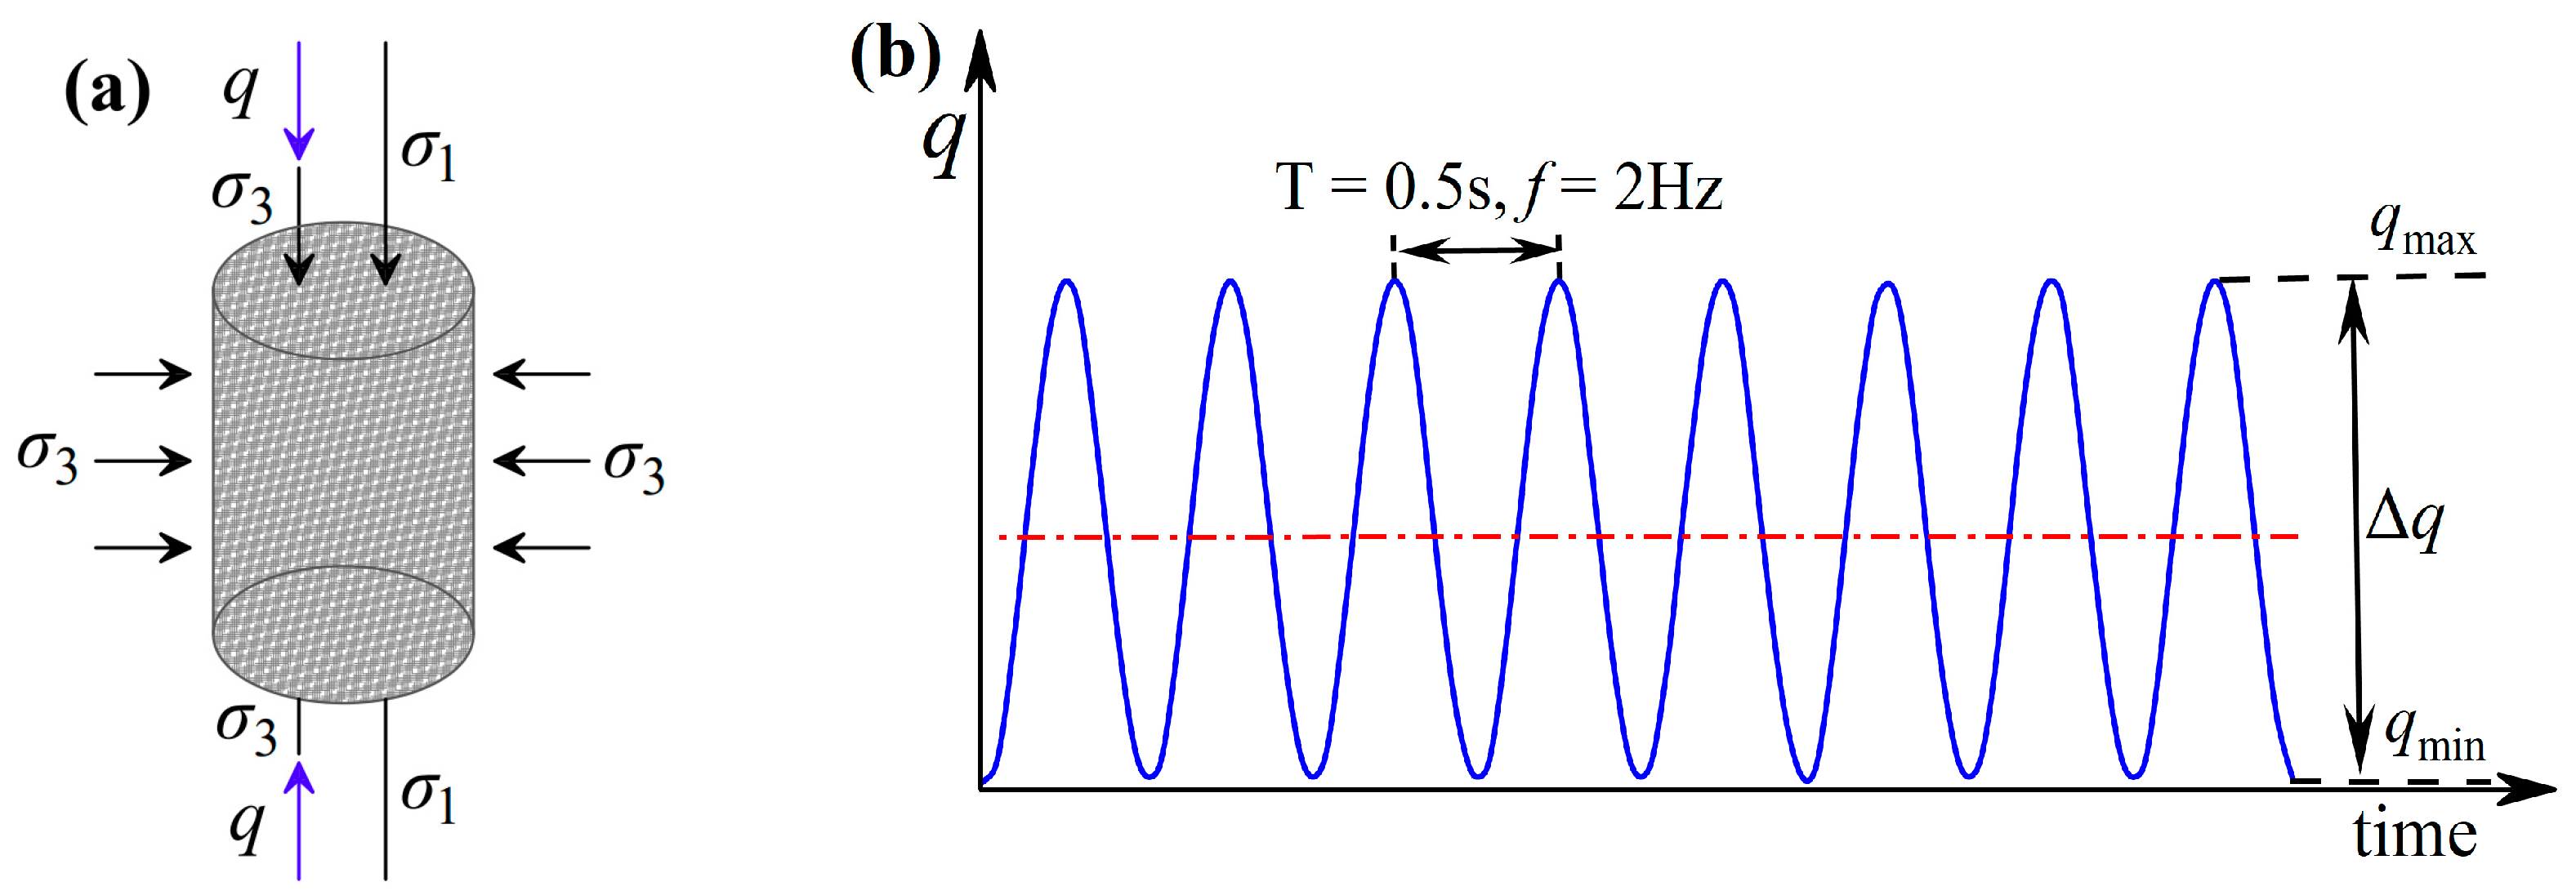
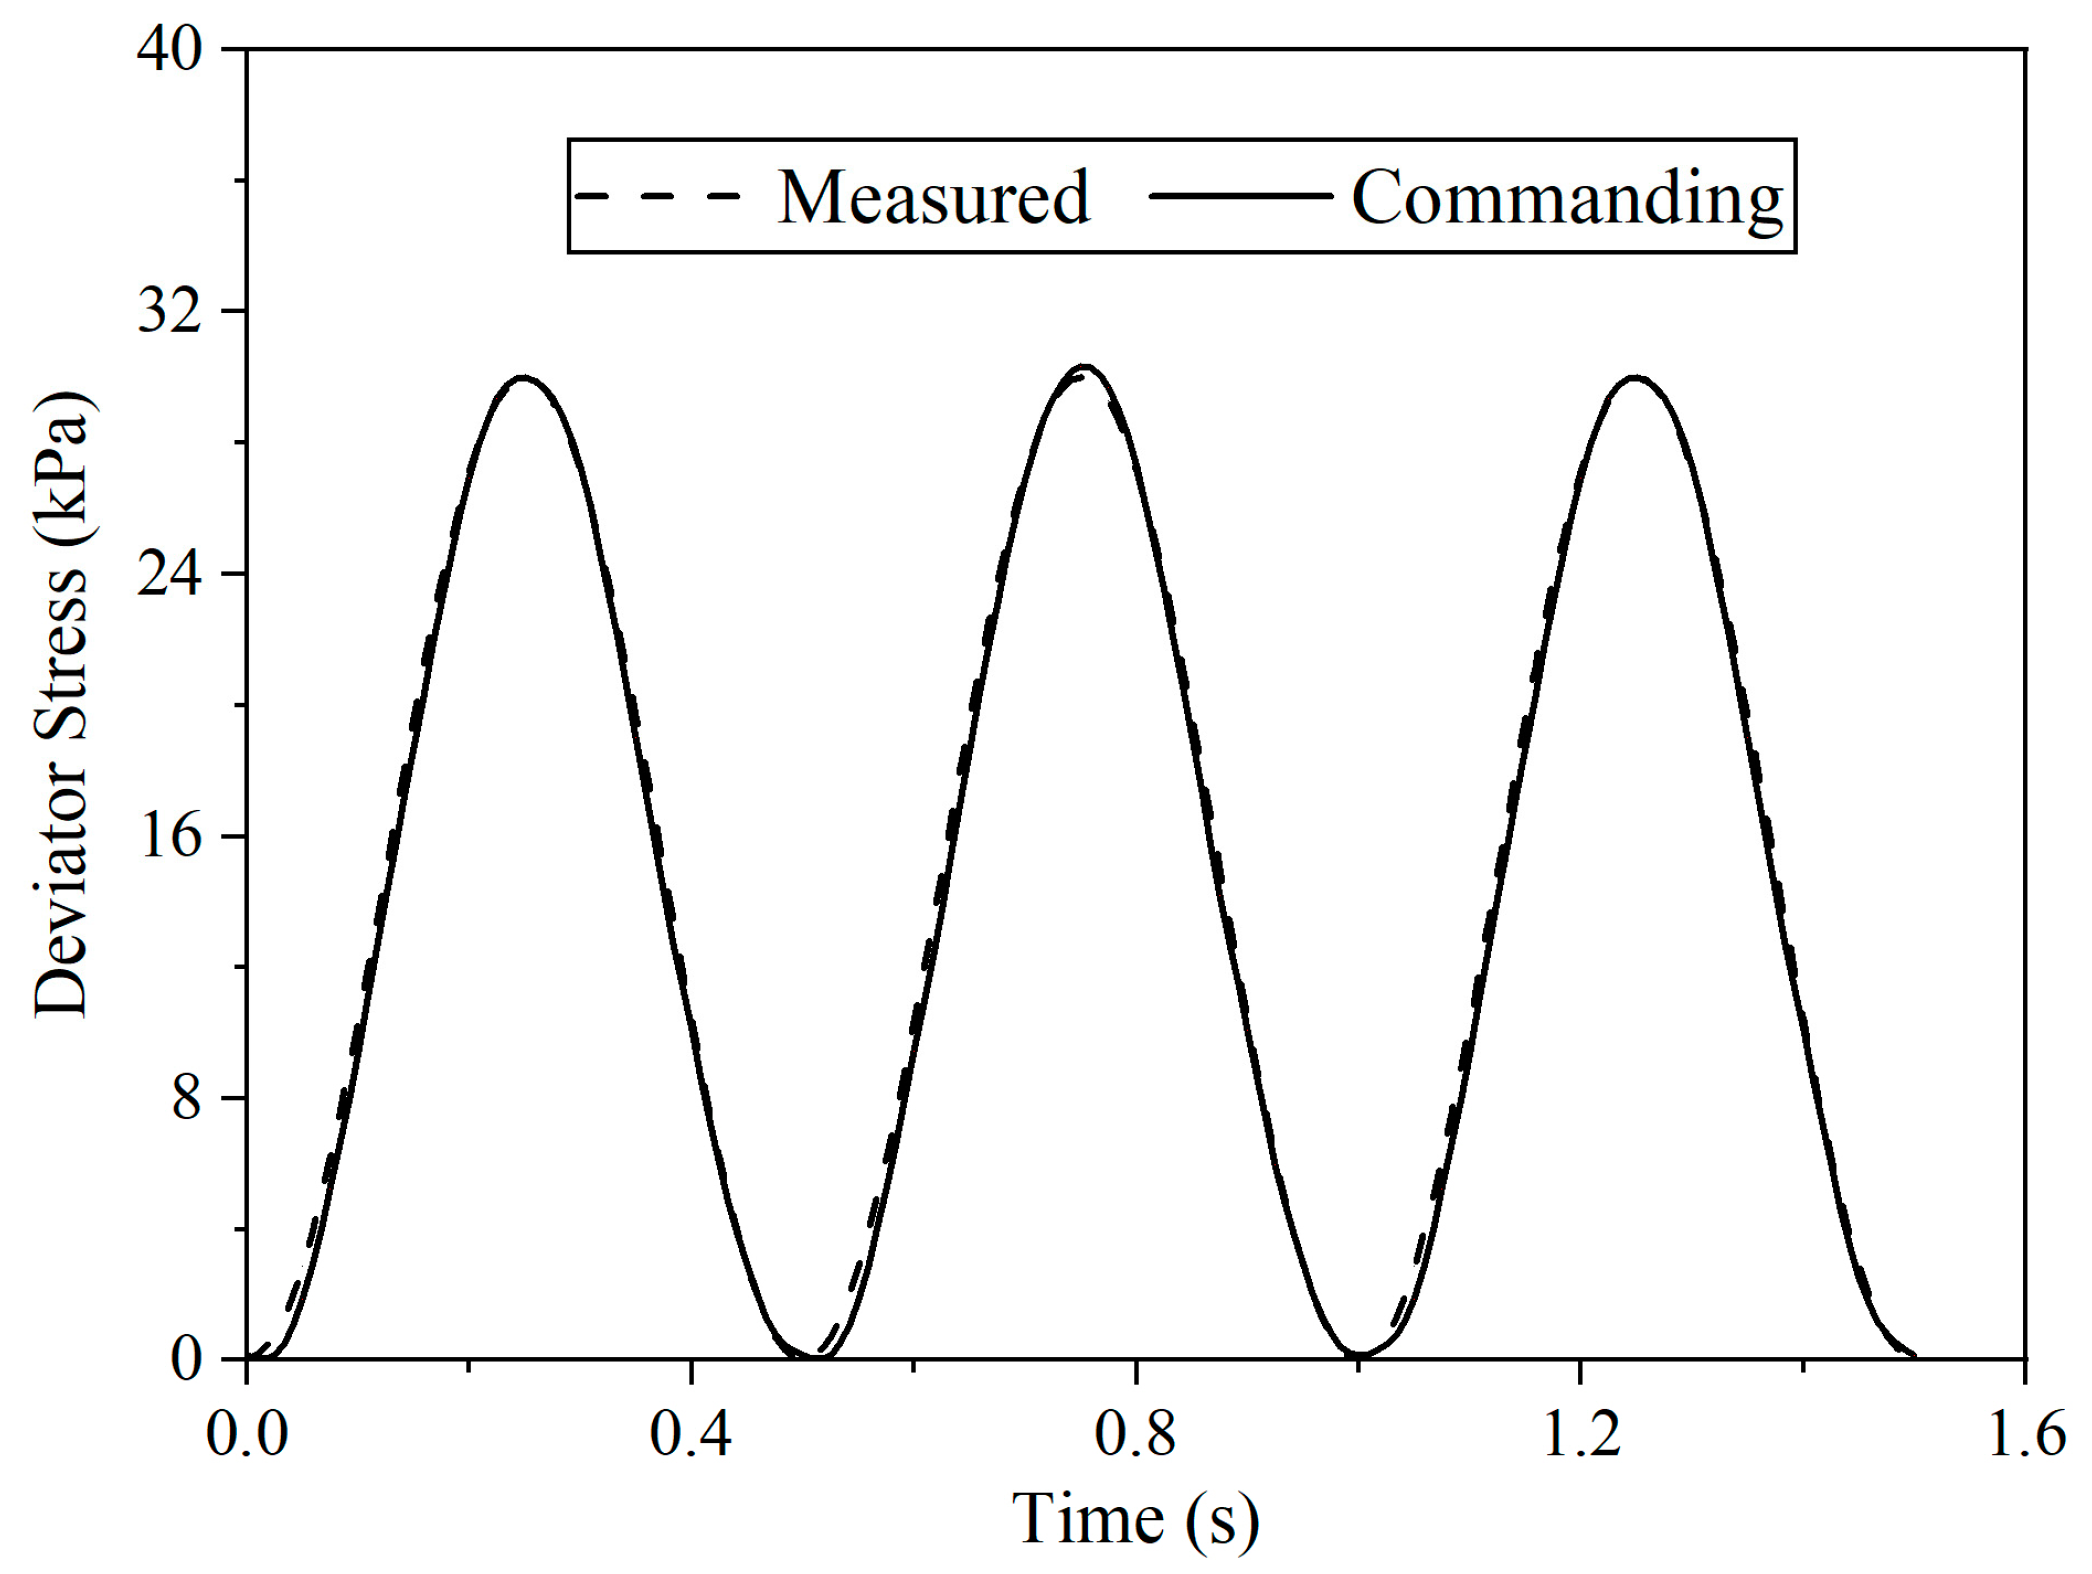
3.3. Cyclic Triaxial Tests

In the cyclic triaxial tests, three remolding water contents (w = 19%, 24%, and 29%) and two compaction degrees (Dc = 0.8 and 0.9) were considered. It is important to note that these three water contents were the optimum water content (w = 24%) as well as its dry side (w = 19%) and wet side (w = 29%), which corresponded to three typical soil fabrics formed during compaction (aggregate–dispersed structure, aggregate structure, and dispersed structure) according to previous studies [14,21]. The two Dc values were considered based on a thorough field investigation of subgrade soils along the Beijing–Qinhuangdao and Beijing–Kowloon railroads [22], which revealed that the compaction degree ranged from 0.79 to 0.96, with an average value of 0.89. Dc = 0.80 and 0.90 were considered to approximately represent the minimum and average Dc values in the field. Detailed information about the tested samples is presented in Table 2. In this study, the cyclic triaxial tests were carried out following ASTM D3999-11 [28]. It is important to note that no saturation process was applied to the sample, and during loading, all the samples were kept unsaturated.
The schematic view of the stress applied to the sample is presented in Figure 4. The samples were subjected to a confining pressure σ3 and a deviator stress q, simulating the stress condition in the field. For the confining pressure σ3, the average horizontal stress of subgrade soil in the field was estimated as 30 kPa, considering the effects of the vehicle load, Poisson’s ratio, and depth [18,29]. Further, field measurement found that σ3 values of subgrade soils were pretty low, ranging from 20 to 60 kPa [30]. Since the soil behavior at a low confining pressure range hardly depended on the confining pressure [22,31], the confining pressure σ3 was kept at 30 kPa in this study.
The applied cyclic loading followed a sine-shaped signal with a frequency of 2 Hz (see Figure 4b). This frequency was consistent with the value generated between two bogies at a train speed of approximately 60 km/h [32]. The in situ testing results from the Jinan–Qingdao railway [22] showed that the vertical stress amplitude varied from 15 kPa to 30 kPa. Similarly, vertical stress amplitudes of 15 kPa and 25 kPa were obtained from the in situ testing of the French railway at the Vierzon site [32,33]. Thus, a deviator stress amplitude of 30 kPa was considered. The cyclic deviator stress q was applied following the procedure proposed by Wang et al. [29]. Before the loading application, the parameters defining q used in this study (sine-shaped wave, 2 Hz frequency, and 30 kPa amplitude) were set in the digital control system of the triaxial cyclic apparatus. Based on these parameters, a sine-shaped signal was generated, namely, a commanding signal, which was used for commanding the loading process of q. Under the driving of this commanding signal, q was applied to the sample. The applied q was measured by a force sensor, defining the measured signal transmitted back to the digital system. A comparison between the commanding and measured signals showed a satisfactory consistency (see Figure 5) and verified the loading accuracy. According to previous research [34,35,36,37], 10,000 loading cycles were enough for the specimens to reach a relatively stable state in most cases. To better guarantee the achievement of this stable state, the total loading cycles applied were chosen as 20,000 in this study.

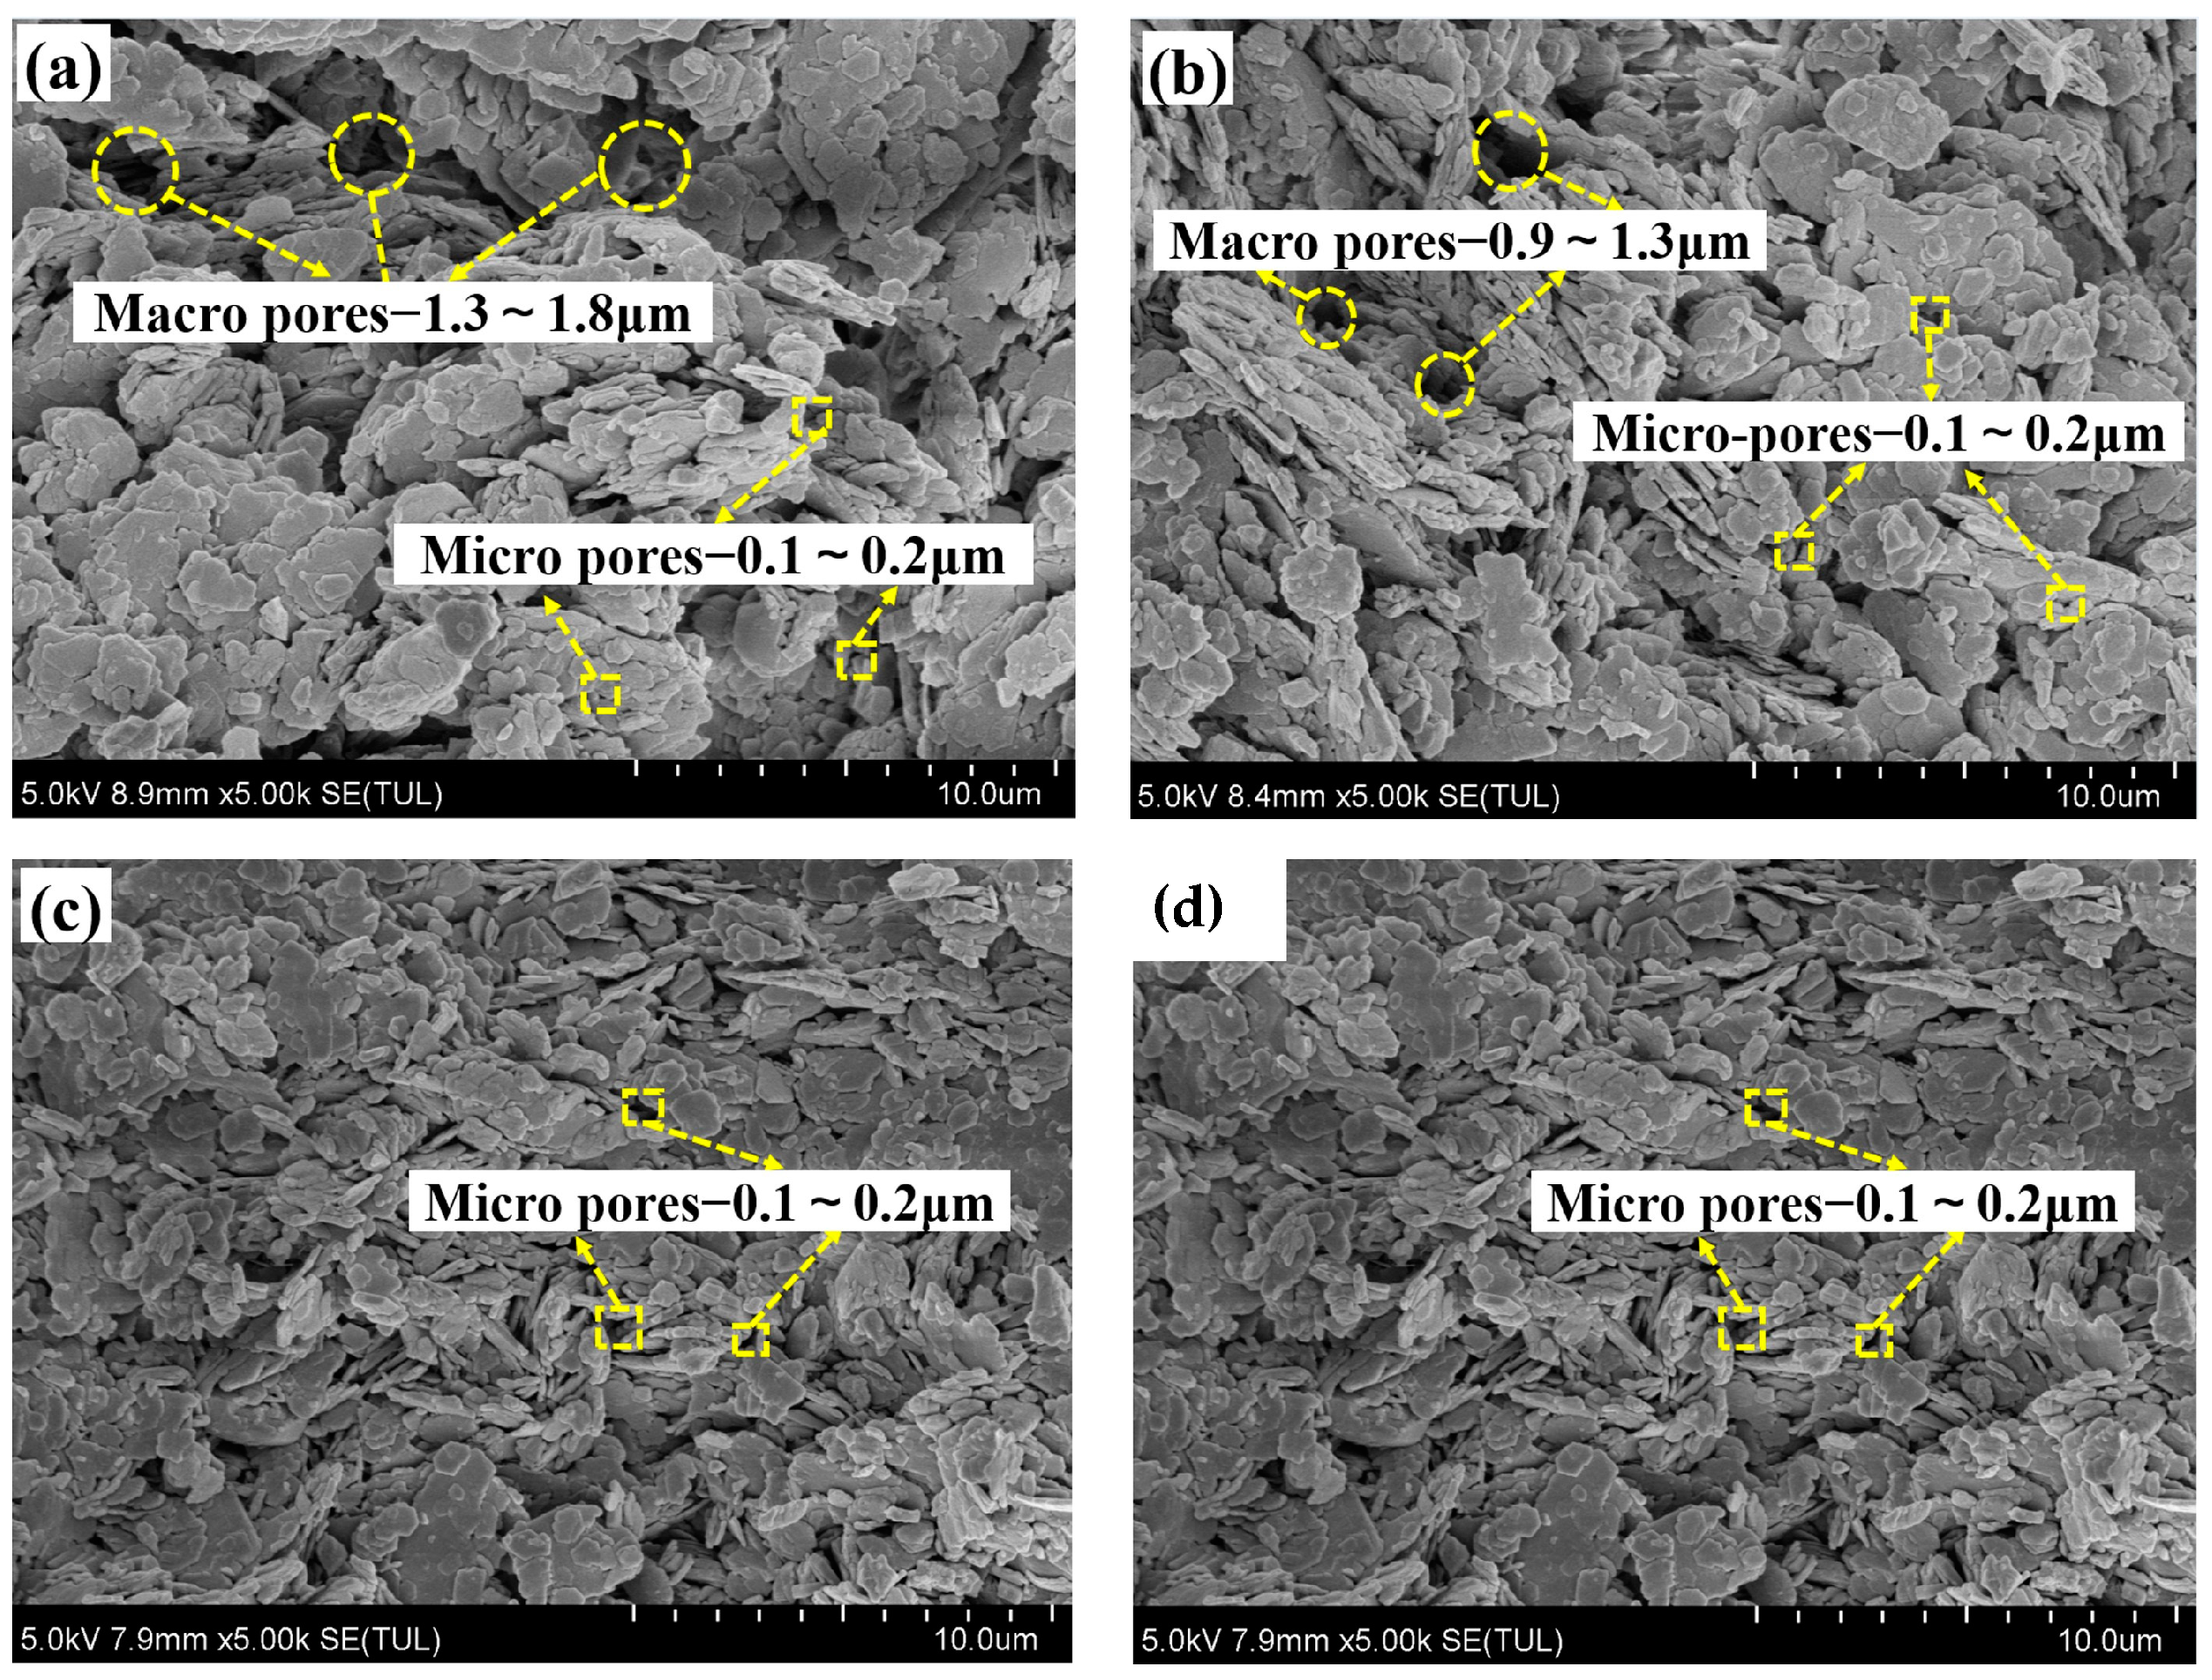
3.4. Microstructure Tests

According to the previous studies, the macroscopic behavior of the soils was highly related to the soil fabric [4,5,12,13]. To obtain the soil fabric variations with different remolding water contents and compaction degrees, scanning electron microscopy (SEM) and mercury intrusion porosimetry (MIP) tests were conducted. Two remolding water contents (w = 19% and 29%) and two compaction degrees (0.8 and 0.9) were considered. It is important to note that the case of w = 24% was not considered due to a lack of tested soils.
Before SEM and MIP testing, samples with a mass of 2 g were quickly frozen using liquid nitrogen and then subjected to sublimation under a significant vacuum to eliminate water. This procedure eliminated the water inside the samples without damaging the soil fabric. For SEM testing, each dried sample was placed under a microscope, and by adjusting the magnification and focus, the morphology of the sample surface was recorded. As for MIP testing, the dried soil samples were placed in a dilatometer. Then, the mercury pressure was increased step-by-step to make the mercury infiltrate into the pores inside the sample. During this process, the mercury at lower pressures infiltrated into the larger pores, and as the pressure increased, the smaller pores were successively filled. For a given pressure, the volume of the intruded mercury was recorded by a digital system, and the corresponding pore diameter was calculated using the equation d = 4σcosγ/p (where σ is the mercury–solid interfacial tension, γ is the mercury–solid contact angle, and p is the intruded pressure). Based on these data, the differential pore volume for each pore diameter could be obtained. More calculation details can be found in the studies by Delage et al. [38] and Zhang et al. [39].

4. Results and Discussion

4.1. Microstructure Testing Results

The SEM images of the samples compacted on the dry side (w = 19%) and wet side (w = 29%) of the optimum moisture content are presented in Figure 6. At both compaction degrees of 0.8 and 0.9, the sample on the dry side had two kinds of pore groups (see Figure 6a,b), namely, macro-pores between the aggregate (inter-aggregate pores) and micro-pores inside the aggregate (intra-aggregate pores). In contrast, in the sample on the wet side (see Figure 6c,d), the pores were pretty uniform, and only micro-pores were identified. When the compaction degree increased, for the sample on the dry side, it appeared that the inter-aggregate pores were compressed, with the pore diameter changing from d = 1.3–1.8 μm to d = 0.9–1.3 μm, while the intra-aggregate pores remained relatively unchanged (d = 0.1–0.2 μm). In contrast, for the sample on the wet side, the whole pores seemed to be compressed smaller (from d = 0.1–0.2 μm to d = 0.07–0.17 μm). However, visualization of the SEM figures could only give a qualitative description of the pore structure. MIP tests were also conducted to clarify the pore structure evolution quantitatively.
Figure 7 shows the MIP testing results for the samples on the dry side and wet side of the optimum water content at the two compaction degrees of 0.8 and 0.9, plotted by the variation in the differential pore volume versus pore diameter. As can be observed, the pore structure of the sample on the dry side exhibited a clear bimodal pattern. A characteristic diameter dcha = 0.25 μm could be identified, separating two pore groups of inter-aggregate pores (d > 0.25 μm) and intra-aggregate pores (d ≤ 0.25 μm). In comparison, the sample on the wet side was characterized by a unimodal pore size distribution, indicating that, in this case, the pores were distributed uniformly. Furthermore, as the compaction degree increased to 0.9, in the samples compacted to be on the dry side of the optimum water content, the inter-aggregate pores were affected significantly, and the corresponding differential pore volume became smaller. At the same time, no obvious change was observed for the intra-aggregate pores. The volume decrease rate (defined as the ratio between the volume decrement and the initial volume) of inter-aggregate pores was 34.8%. Regarding the samples compacted to be on the wet side of the optimum water content, the compaction degree curve of 0.9 was lower, suggesting that fewer pores were contained at a larger compaction degree. In this case, the volume decrease rate was calculated as 35.6%. It is important to note that the microstructure evolution at the optimum water content was not investigated here due to the lack of available tested clay soils. However, previous studies on fine soils by Delage et al. [14] and Li et al. [40] suggested that a bimodal porosity structure also existed at the optimum water content. Moreover, similar to the case of the dry side, the compaction increment would decrease the inter-aggregate pores while hardly affecting the intra-aggregate pores [40]. These microstructure variations could be explained as follows.
When compacted to an optimum water content and its dry side, clay aggregates were formed by clay particles due to the high matric suction, which constituted the samples’ microstructure (see Figure 6a,b). Correspondingly, the pores of this kind of microstructure could be categorized into two groups, namely, inter-aggregate pores between aggregates and intra-aggregate pores inside aggregate. Thus, a bimodal pore size distribution could be obtained. On the wet side of the optimum water content (see Figure 6c,d), the clay aggregates could not be maintained by the low matric suction and were, therefore, destroyed. In this case, dispersed clay particles with a relatively uniform distribution dominated the sample microstructure. Consequently, the pore size distribution presented a unimodal pattern. As the compaction degree increased, for the samples at the optimum water content and its dry side, the clay aggregates with high internal matric suction or cohesion were not compressed. Still, the distance between adjacent aggregates became closer. As a result, the large pores between the aggregates exhibited a decreasing tendency, while the small pores inside the aggregate did not change much. When it came to the case of the wet side, the pores were distributed following a uniform pattern in the uniformly distributed clay particles. The compaction degree increment decreased the distance between adjacent particles; therefore, the pores were compressed overall.

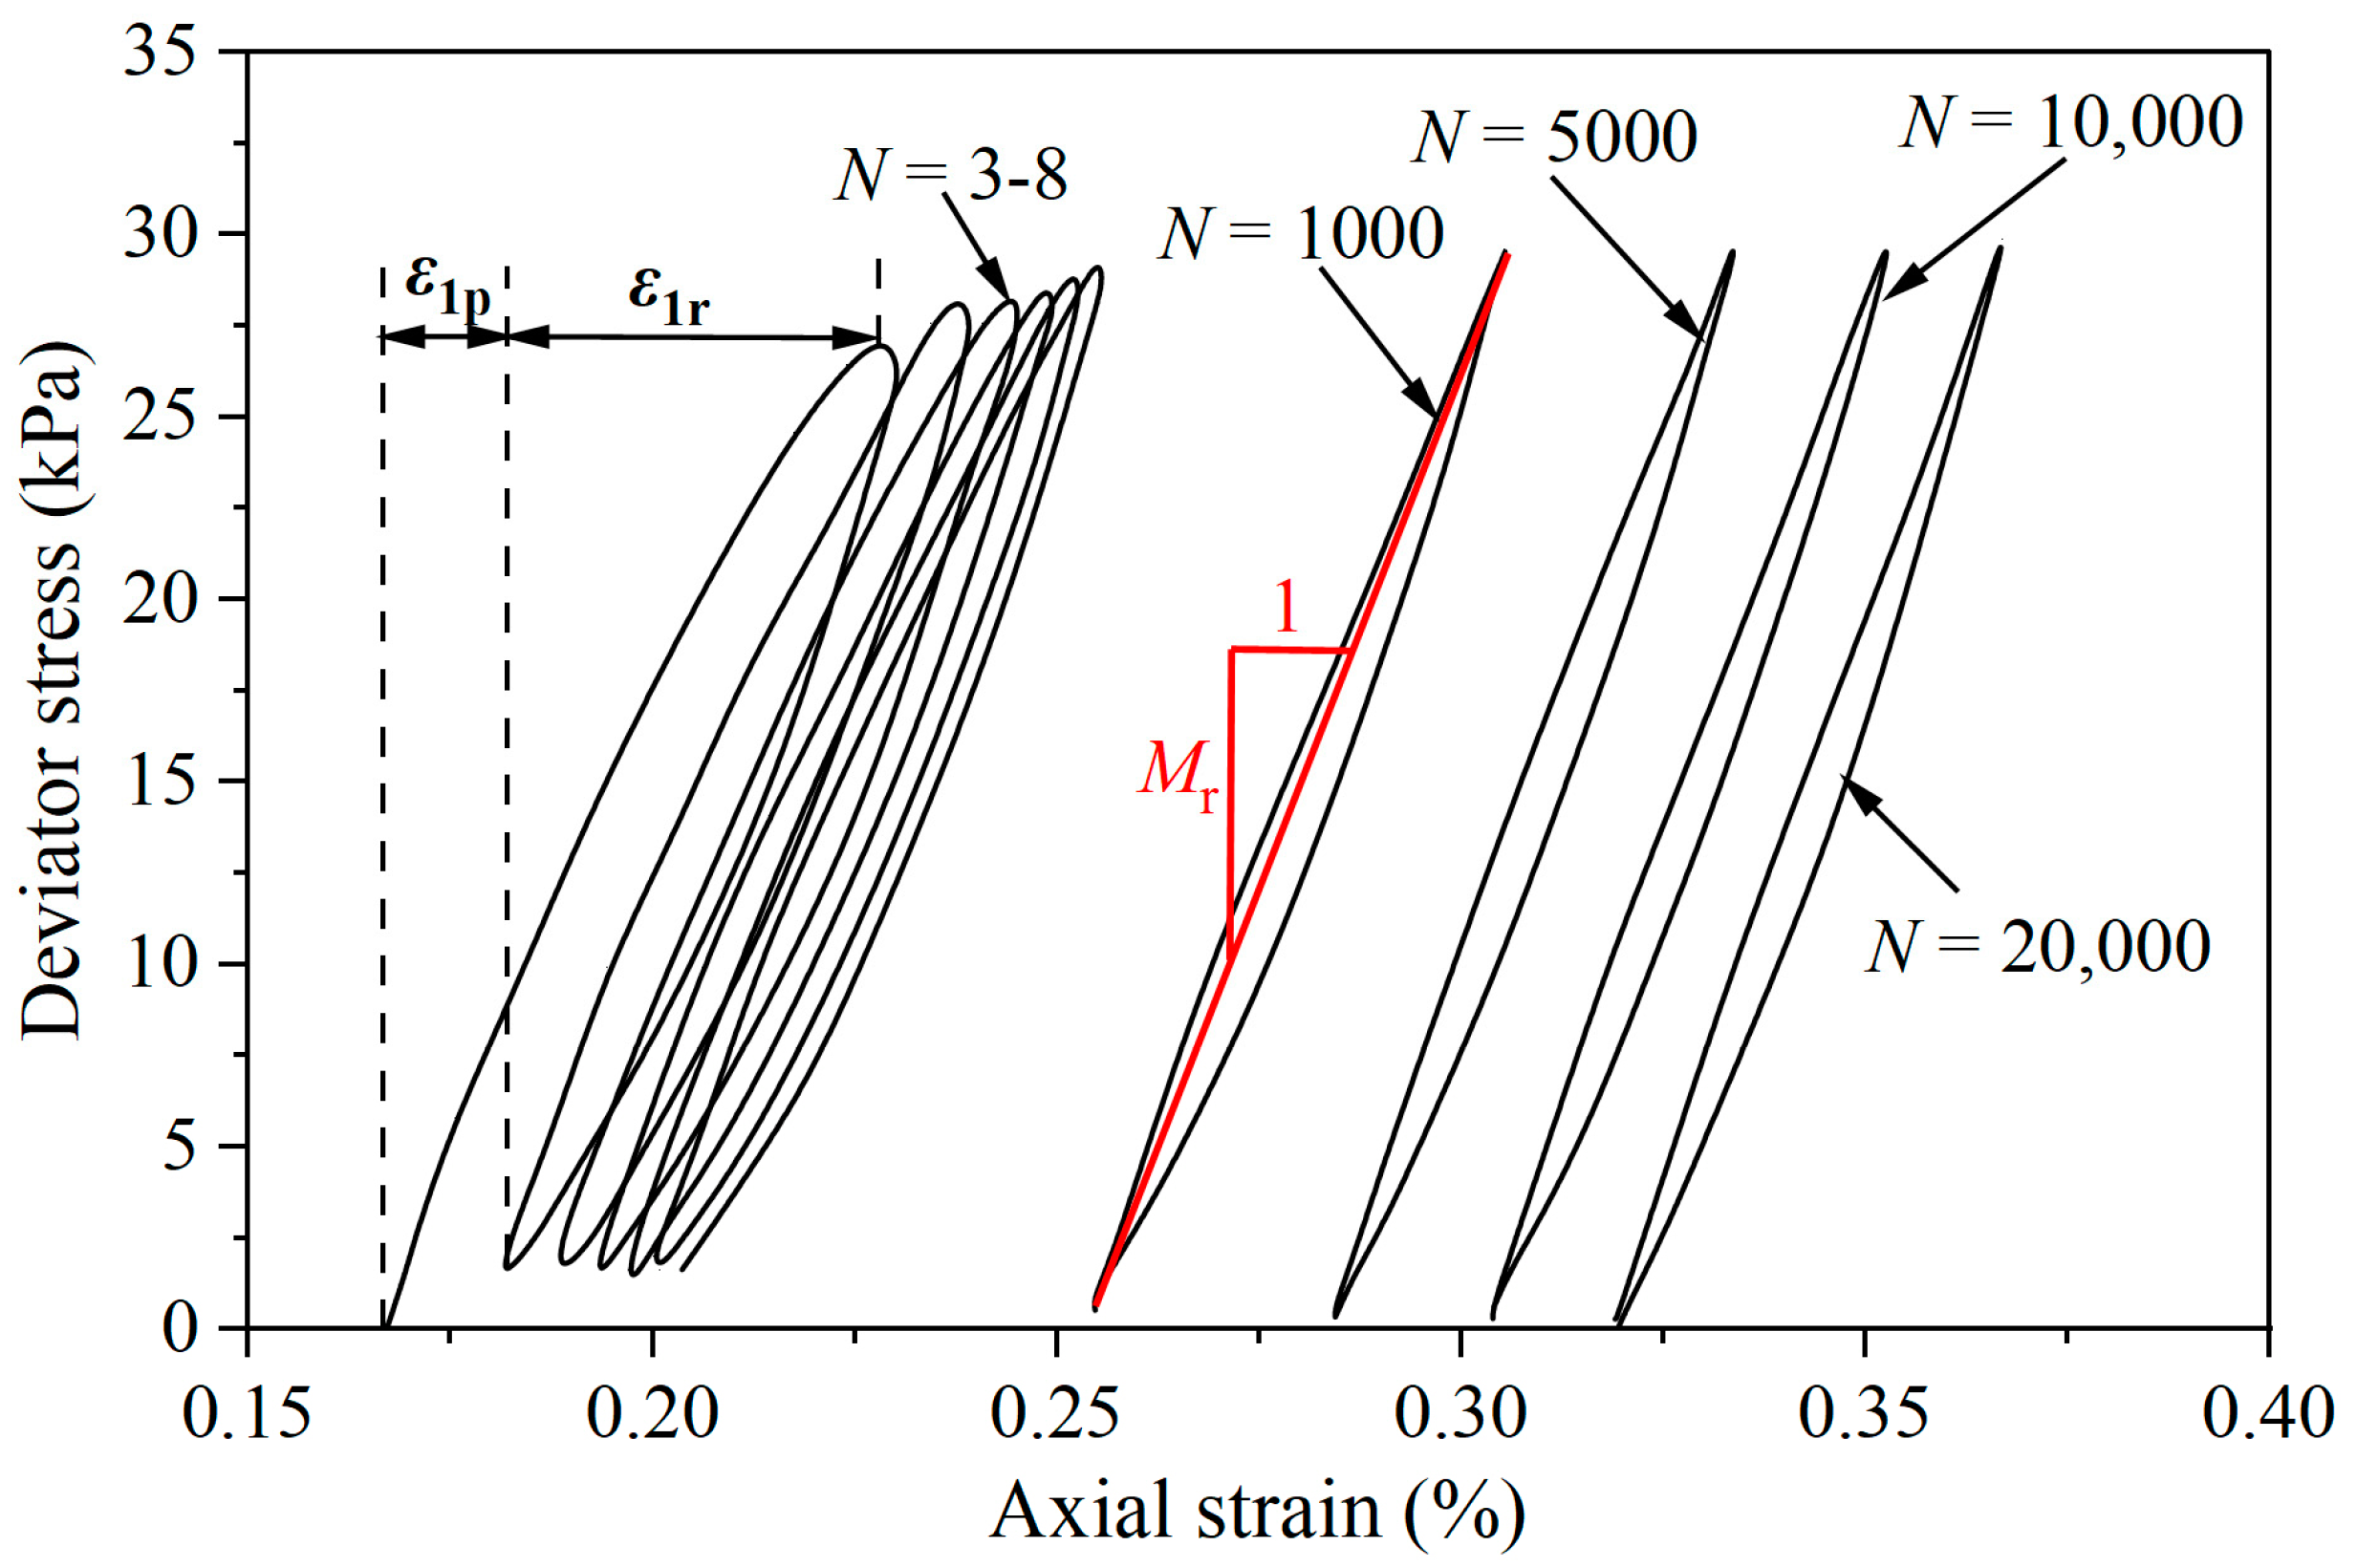
4.2. Typical Relationship between Deviator Stress and Axial Strain

Figure 8 depicts the typical curve of deviator stress versus axial strain for a sample with a 0.9 compaction degree and 29% remolding water content. The axial strain consisted of two parts, namely, the unrecoverable part (permanent strain ε1p) and the recoverable part (resilient strain ε1r). At the initial loading phase, the permanent strain was large, and the hysteresis loop formed by the loading and unloading paths did not close. As the loading proceeded, the permanent strain diminished, and the hysteresis loop became smaller. At the end of the loading process, the deformation response became almost purely elastic, with no further permanent strain developing. This phenomenon was fairly related to the sample fabric evolution during the loading process. Initially, the sample contained large quantities of pores, which provided enough space for soil grain movement under external loading, giving rise to a large permanent strain. Over the loading process, the soil grain movement was increasingly limited due to the pore decrement. As a result, the permanent strain development decreased, and an elastic behavior was obtained in the end. It is important to note that the definition of the resilient modulus Mr discussed in the following section was also illustrated through the 1000 cycles, which was defined as the ratio between the deviator stress amplitude Δq and the resilient axial strain ε1r.

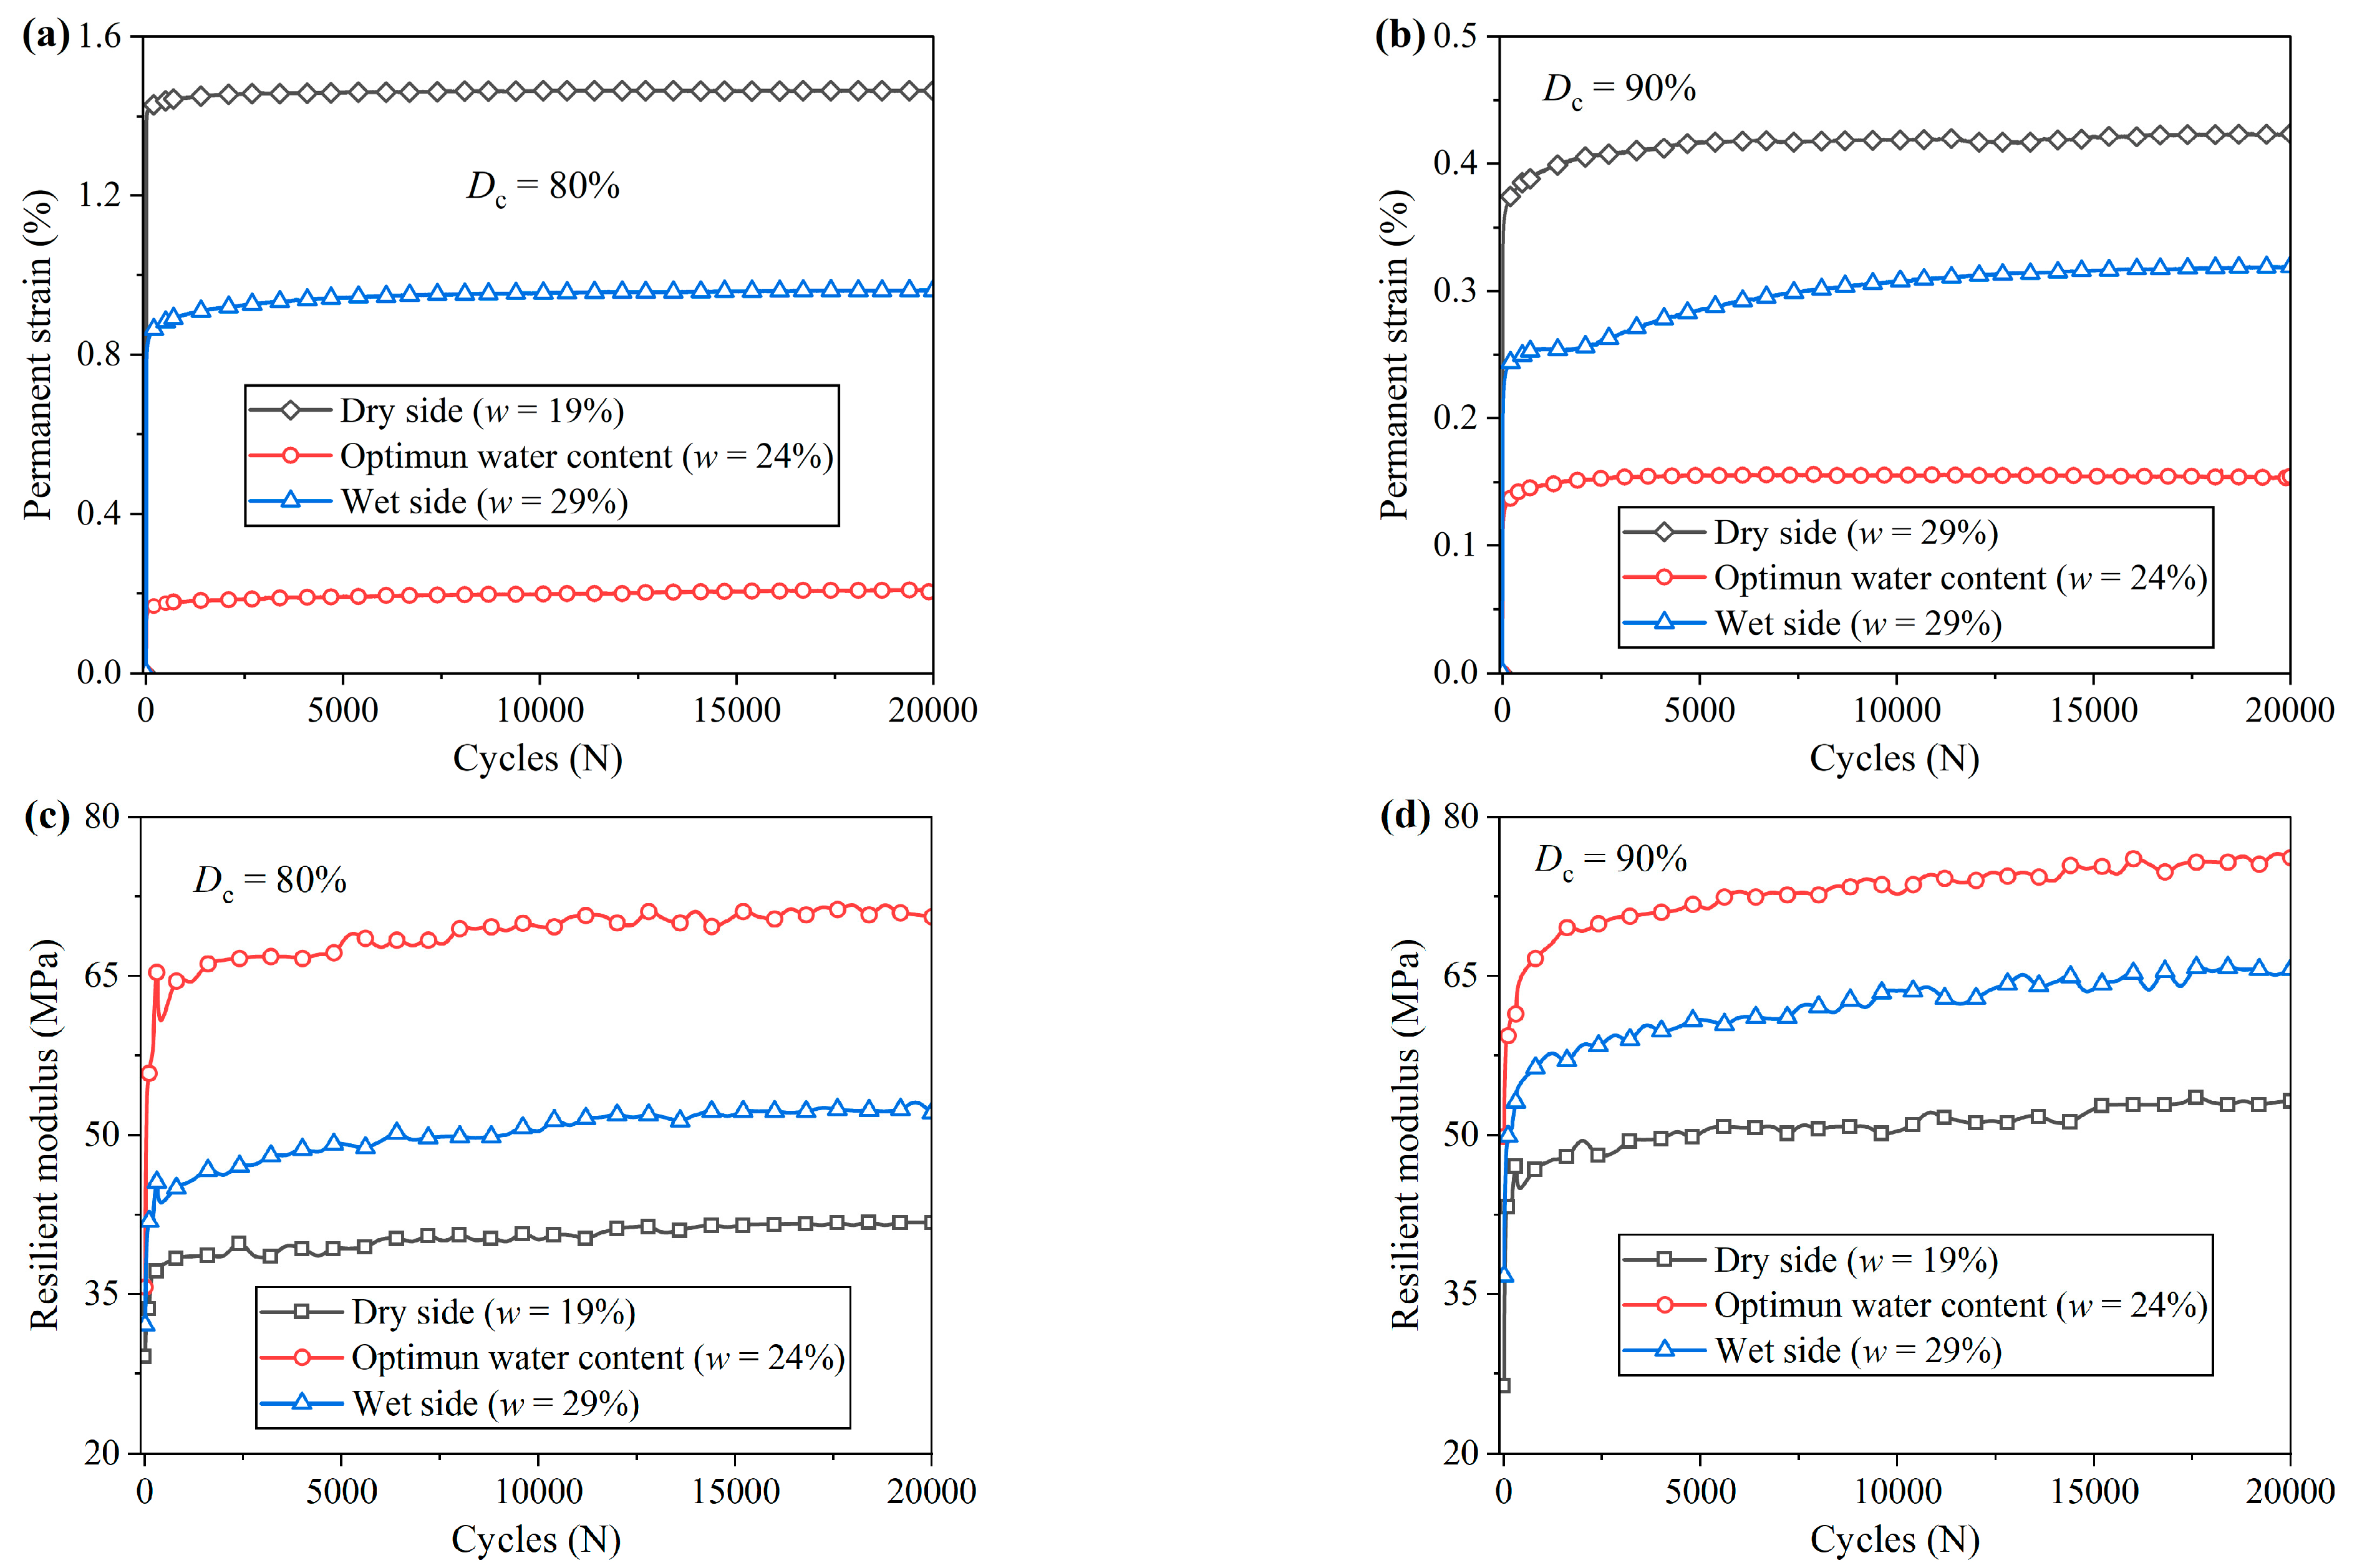
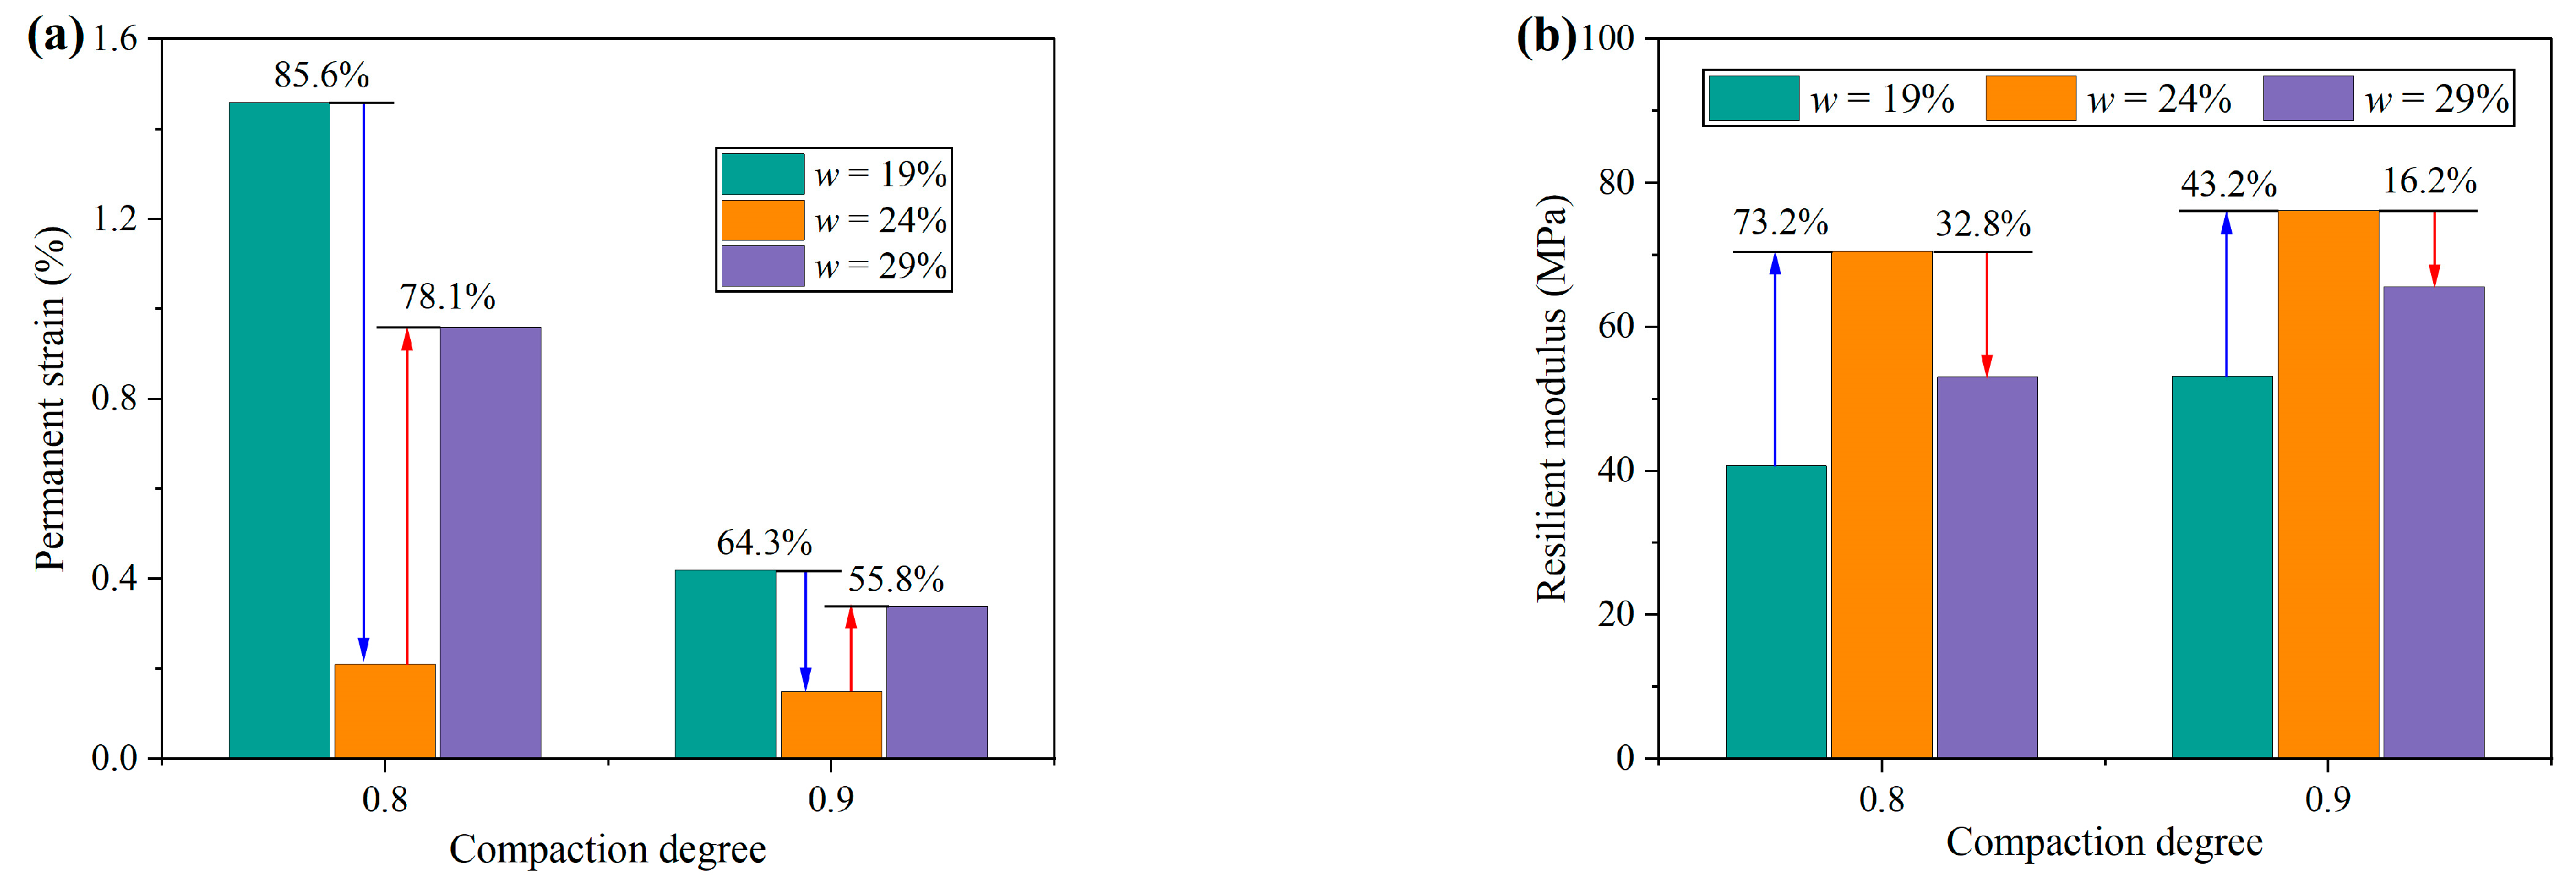
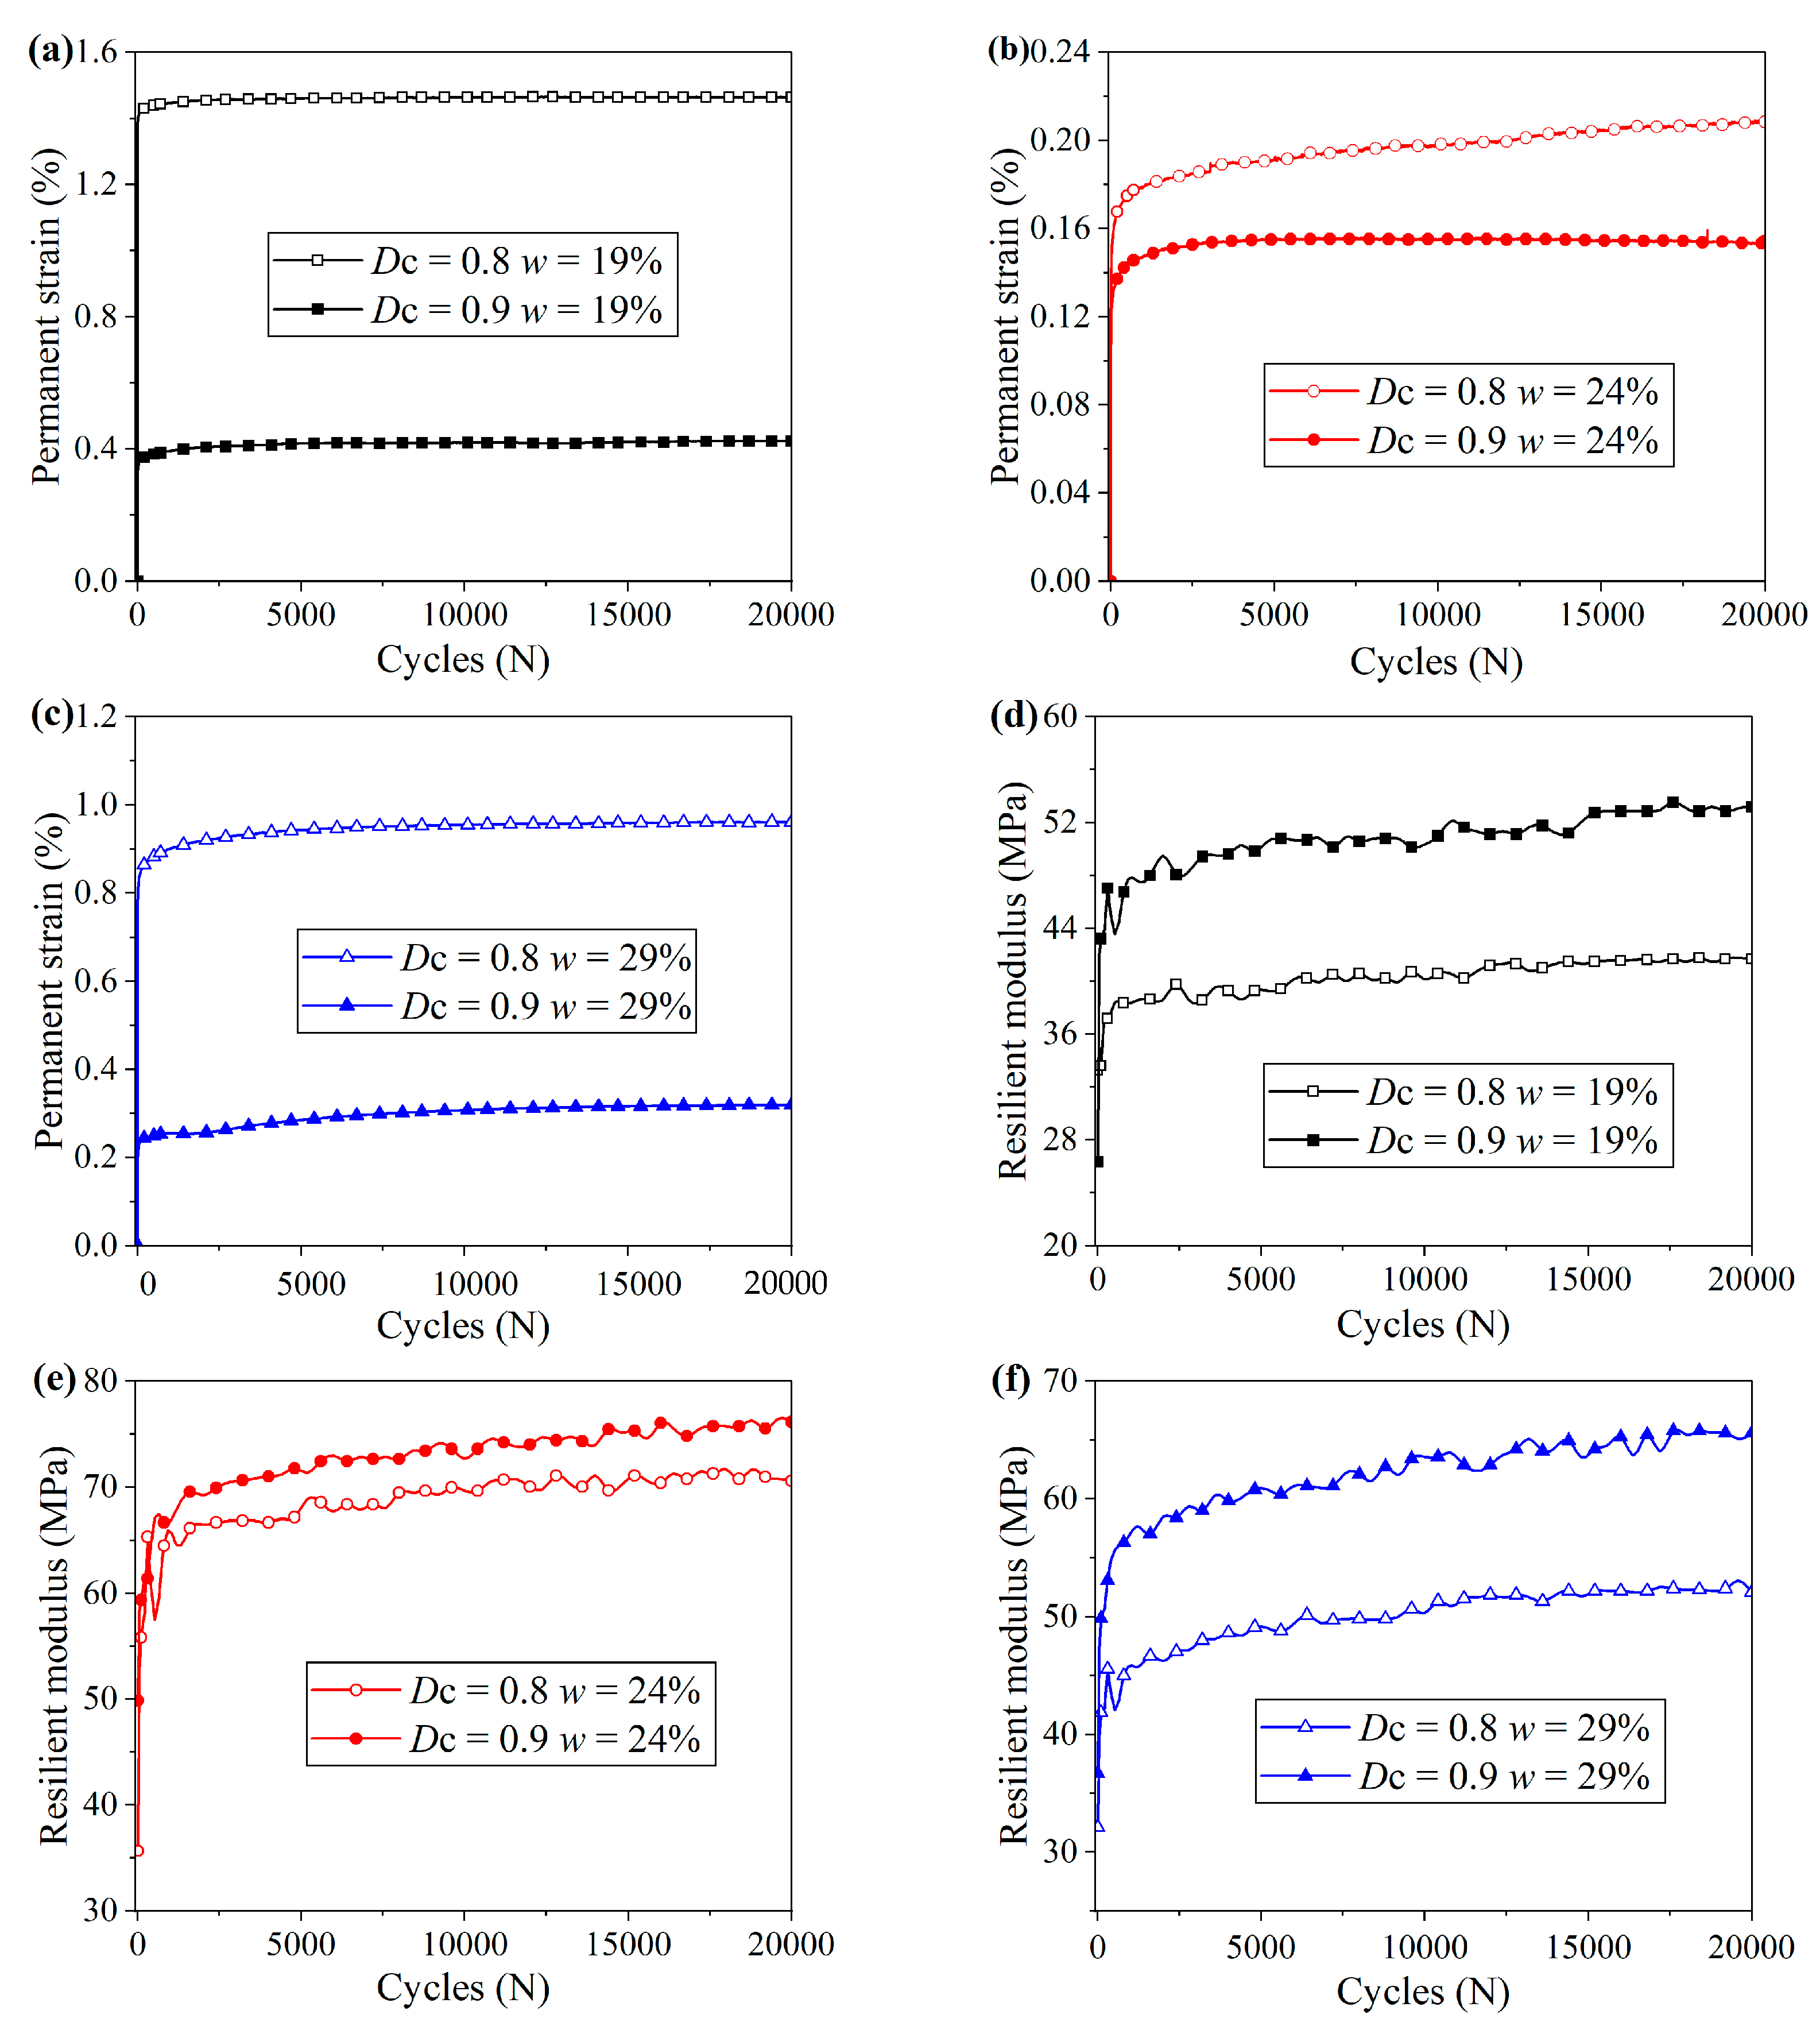
4.3. Change in Dynamic Behavior with Remolding Water Content

The permanent strain evolution with a loading cycle at different remolding water contents is plotted in Figure 9a,b for the two compaction degrees of 0.8 and 0.9. All the samples exhibited a similar evolutionary trend: The axial strain increased rapidly at the first stage and then tended to stabilize with an increase in the loading cycle. In addition, at each compaction degree, the permanent strain strongly depended on the remolding water content. The permanent strain decreased when the remolding water content increased from dry of optimum (w = 19%) to an optimum state (w = 24%). In contrast, as the remolding water content further increased to the wet side of the optimum water content (w = 29%), an increase in permanent strain was observed. As for the resilient modulus evolution at different remolding water contents, the results of the 0.8 and 0.9 compaction degrees are plotted in Figure 9c,d, respectively. Similar to the case of permanent strain, the resilient modulus increased rapidly at the onset of loading and eventually tended to stabilize. Further, the remolding water content had a significant influence on the resilient modulus for both compaction degrees. As the remolding water content increased from 19% (dry side of optimum) to 24% (optimum water content) and then to 29% (wet side of optimum), the variation in the resilient modulus was not monotonic. A first increasing and then decreasing trend was identified, which was opposite to the variation in the permanent strain.
To better understand the effect of remolding water content, the stabilized permanent strain (average permanent strain of the last 10 loading cycles) and stabilized resilient modulus (average resilient modulus of the last 10 loading cycles) at different remolding water contents are depicted in Figure 10a,b. The change rate of the permanent strain or resilient modulus as the remolding water content was varied is also labeled in Figure 10. In Figure 10a, the value of 85.6% is the rate of decrease in the permanent strain when the remolding water content increased from 19% to 24%, which was calculated according to the equation (ε1–19%ε1–24%)/ε1–19% (where ε1–24% represents the permanent strain of w = 24% and ε1–19% represents the permanent strain of w = 19%).
Regarding the permanent strain variation (Figure 10a), at each compaction degree, the change rate of the permanent strain as the remolding water content increased from the dry side (w = 19%) to an optimum water content (w = 24%) was larger than the change rate as the remolding water content increased from an optimum water content (w = 24%) to the wet side (w = 29%), indicating that the effect of the remolding water content was more pronounced on the dry side. In addition, the increasing or decreasing rate of permanent strain at a higher compaction degree was identified to be smaller. For a 0.8 compaction degree, the rates of increase and decrease were identified as 85.6% and 78.1%, respectively. For a 0.9 compaction degree, the corresponding change rates were 64.3% and 55.8%, respectively. Regarding the resilient modulus, similarly, the change rate on the dry side was greater than on the wet side, indicating a more significant effect of the remolding water content on the dry side. Moreover, as the compaction degree increased, the change rates of the resilient modulus were observed to decrease. The change rates of 73.2% and 32.8% were identified for a 0.8 compaction degree. In contrast, for a 0.9 compaction degree, the change rates decreased to 43.2% and 16.2%. A possible explanation is presented below.
As discussed in the previous section, the soil fabric on the dry side of the optimum water content was composed of clay aggregates (Figure 6a). These aggregates could not be easily broken down due to the high matric suction or cohesion [41] and, to some extent, could be regarded as coarse grain. Under this circumstance, most of the water was contained inside the aggregates, and some resided at the contacts between the aggregates with the water bridge formed [42]. This water bridge applies a normal force between adjacent aggregates through matric suction and, thus, further bonds them together. When the remolding water content increased, a greater number of water bridges were formed, and an increasing number of adjacent aggregates were bonded together. In addition, the clay aggregates became more deformable as the remolding water content increased, giving rise to an increase in the contact area between adjacent aggregates [43,44]. Therefore, the increment in the remolding water content on the dry side induced a decrease in the permanent strain and an increase in the resilient modulus. When the optimum water content was increased, the water bridge quantity and the contact area between adjacent aggregates attained their maximum level [21,39]. In this case, the permanent strain and resilient modulus reached their minimum and maximum values, respectively. When the water content was increased beyond the optimum water content, the clay aggregates started to be successively destroyed into clay particles due to the decrease in matric suction inside the aggregates (see Figure 6c). In addition, in this case, matric suction would apply a bonding effect on the adjacent clay particles, which were newly formed from clay aggregate. As the remolding water content increased, this bonding effect diminished progressively due to the decreased matric suction [45]. As a result, an increase in permanent strain and a decrease in resilient modulus were observed when the water content increased on the wet side.
Given the above explanation, the variations in the permanent strain and resilient modulus at different remolding water contents could be attributed to the variations in the soil fabric (whether controlled by clay aggregates or clay particles) and bonding effect controlled by matric suction, which influenced the movements of clay aggregates or clay particles into the adjacent pores. When the compaction degree increased, the pores were compressed to be smaller. In other words, the pore space used for accommodating the movements of clay aggregates or clay particles became limited. As a result, the effect of the remolding water content was smaller at a higher compaction degree.
From a practical point of view, during subgrade construction, the remolding water content should be controlled at the optimum level, especially in the case of a relatively lower compaction degree.

4.4. Change in Dynamic Behavior with Compaction Degree

To understand the effect of the compaction degree on dynamic behavior, a comparison of permanent strain evolution at two compaction degrees is presented in Figure 11a–c for three remolding water contents. In addition, the results of the resilient modulus are presented in Figure 11d–f. It can be clearly observed that, at each remolding water content, the compaction degree had a significant influence on both the permanent strain and resilient modulus. The increment in compaction degree led to a decrease in the permanent strain and an increase in the resilient modulus.
To clarify this compaction degree effect more clearly, the stabilized permanent strain and resilient modulus at different compaction degrees are depicted in Figure 12a,b, respectively. Further, the decreasing or increasing rate of the permanent strain or resilient modulus is labeled in Figure 12. The effect of the compaction degree was greatest on the dry side of the optimum water content: A decreasing rate of 71.1% and an increasing rate of 23.5% were identified for the permanent strain and resilient modulus, respectively. When the water content was on the wet side of the optimum value, this effect of the compaction degree became smaller: The change rates of the permanent strain and resilient modulus became 64.7% and 19.1%, respectively. It is important to note that the minimum compaction degree effect was found at the optimum water content, at which the change rates of the permanent strain and resilient modulus were identified to be 25.9% and 7.3%, respectively. These phenomena are explained below.
As mentioned previously, the soil fabric on the dry side of the optimum water content consisted of clay aggregates and large pores between them. When the compaction degree increased, the large pores experienced an obvious volume decrease, while the small pores remained unchanged (see the MIP results in Figure 7), decreasing the pore space accommodating the clay aggregate movement. Moreover, the increment in the compaction degree might lead to an increase in the contact area between adjacent aggregates. Under the effect of these factors, the permanent strain and resilient modulus varied at high rates. Regarding the wet side of the optimum water content, dispersed clay particles with uniformly distributed small pores comprised the soil fabric. When the compaction degree increased, the compression of the overall small pores decreased the pore space, accommodating the clay particle movement. It is important to note that, compared to the difficulty added to the clay aggregate movement due to the increment in the compaction degree on the dry side of the optimum water content, the difficulty added to the clay particle movement on the wet side was smaller. This is because, on the dry side, the volume decrease induced by the increment in the compaction degree occurred on the part of large pores. Thus, the change rates of the permanent strain and resilient modulus were smaller on the wet side. Regarding the case of optimum water content, since the maximum water bridge quantity and the maximum contact area between adjacent aggregates played a dominant role in enhancing the soil fabric, the effect of the increment in the compaction degree might be negligible. As a result, the changes in the permanent strain and resilient modulus were minimal.
Based on the findings in this section, in engineering applications, the compaction degree should be large, especially when the remolding water content deviates from the optimum water content.

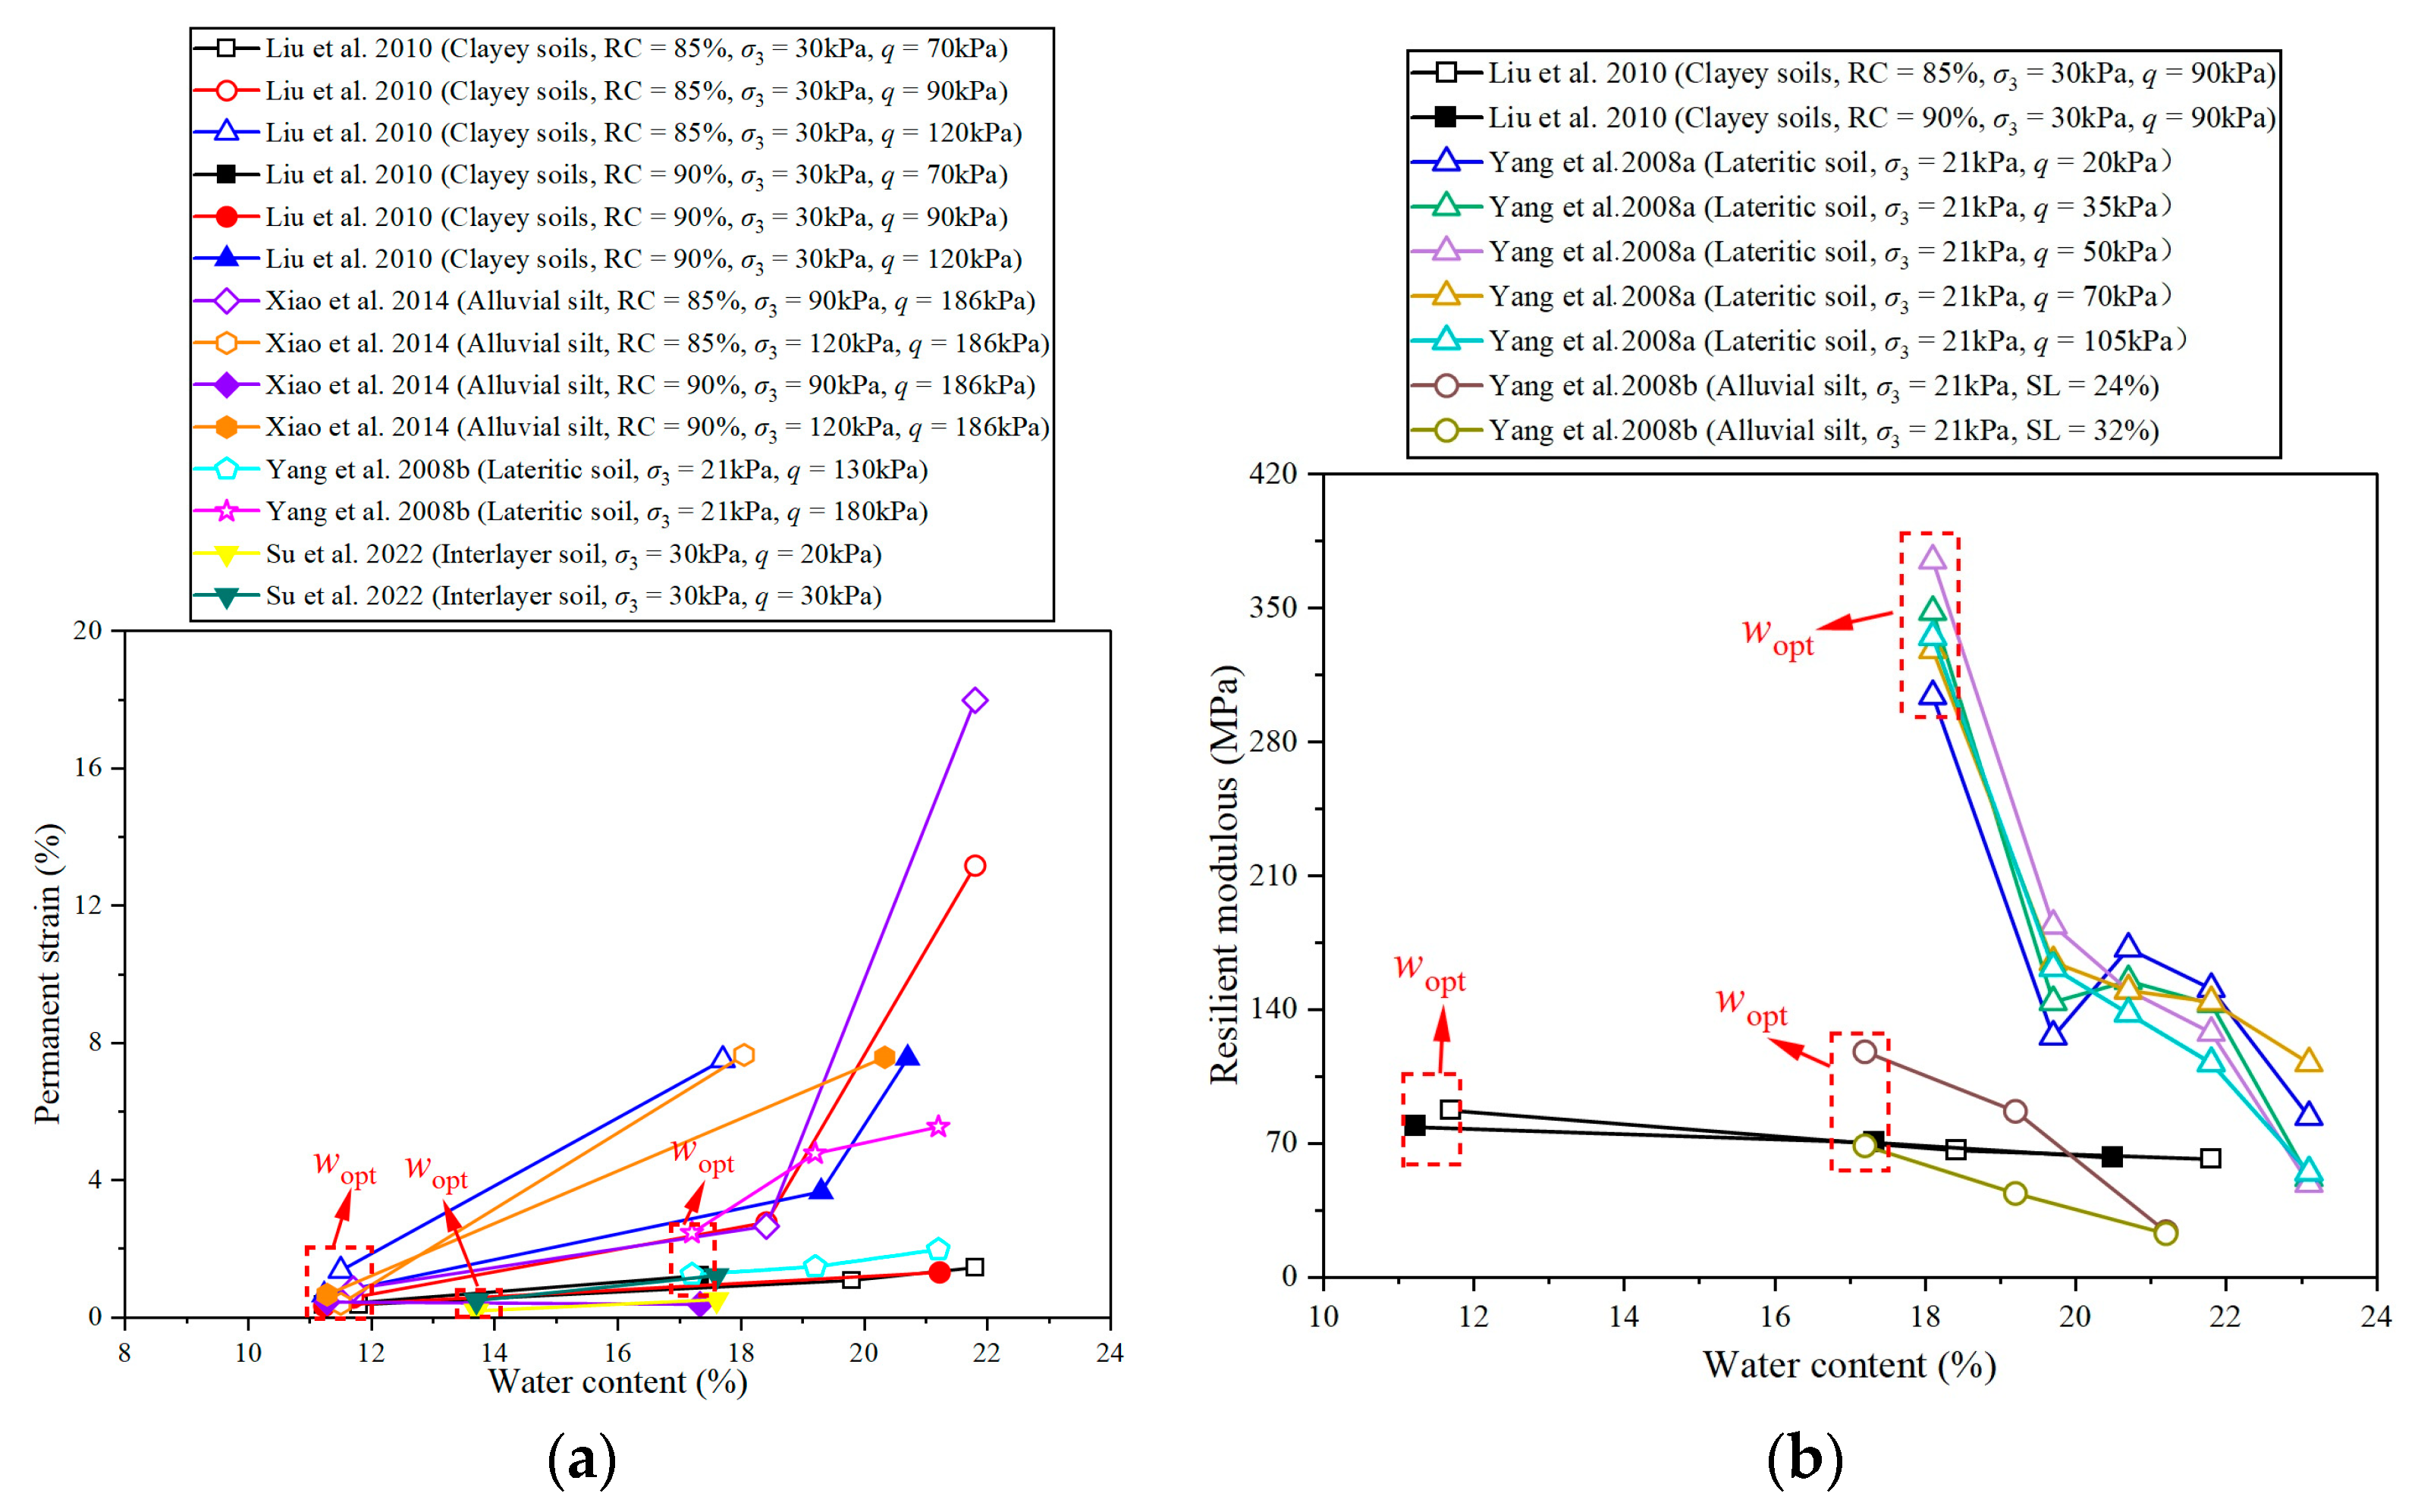
4.5. Comparison with Previous Studies

The relevant data from the literature were extracted and plotted in Figure 13. All the previous studies focused on the optimum water content (wopt) and its wet side. The basic properties of the soils used for comparison are summarized in Table 3.
Figure 13 shows that, regarding the w effect, the increment in w on the wet side of wopt increases the permanent strain and decreases the resilient modulus, which is consistent with the testing results of this study. Regarding the effect of the compaction degree Dc, investigations of the permanent strain conducted by Liu et al. [22] with clayey soils and Xiao et al. [24] with alluvial silt indicated that the Dc increment at wopt had a trivial effect on the permanent strain. In contrast, the Dc increment on the wet side of wopt significantly decreased the permanent strain. This observation was also consistent with the findings in this study. In the case of the resilient modulus, there are few relevant studies. Only Liu et al. [22] reported that the Dc effect did not influence the resilient modulus at wopt and its wet side. However, in this study, though the resilient modulus was independent of Dc at wopt, it was enlarged on the wet side of wopt when Dc increased. To cl arify this aspect, more studies are needed.

5. Conclusions

This study systematically investigated the effects of the remolding water content and compaction degree on the dynamic properties of compacted clay soils used as subgrade fillings. Dynamic triaxial tests were conducted using three remolding water contents (19%, 24%, and 29%) and two compaction degrees (0.8 and 0.9). The soil fabric was studied qualitatively and quantitatively via scanning electron microscopy (SEM) and mercury intrusion porosimetry (MIP) to reveal the microscopic mechanism underlying the variation in dynamic property. The main conclusions are as follows.
The SEM and MIP results showed that, at the optimum water content and its dry side, the soil fabric consisted of clay aggregates with a bimodal pore size distribution (large pores between aggregates and small pores inside the aggregate). Meanwhile, on the wet side of the optimum water content, the soil fabric was characterized by dispersed clay particles with a unimodal pore size distribution. When the compaction degree increased, at the optimum water content and its dry side, large pores were compressed to be smaller, and small pores remained unchanged, while on the wet side of the optimum water content, the whole pores were compressed to be smaller.
At each compaction degree, when the remolding water content increased, both the permanent strain and resilient modulus exhibited a non-monotonic changing pattern: The permanent strain first decreased and then increased. At the same time, the resilient modulus exhibited a first increasing and then decreasing trend. The optimum water content corresponded to the minimum and maximum values of the permanent strain and resilient modulus, since both the water bridge quantity and the contact area between adjacent aggregates reached their maximum levels. In addition, the change rate of the permanent strain (resilient modulus) on the dry side was larger than the rate on the wet side, indicating that the remolding water content effect was greater on the dry side.
For a given remolding water content, the increment in the compaction degree decreased the permanent strain but increased the resilient modulus. The change rate of the permanent strain (resilient modulus) on the dry side of the optimum water content was larger than the rate on the wet side, while the rate at the optimum water content was minimal. This was because the increment in the compaction degree led to the compression of the pores adjacent to the clay aggregates (dry side of the optimum water content) or clay particles (wet side of the optimum water content), creating difficulty in clay aggregate (particle) movement. Compared to the case on the dry side of the optimum water content, the difficulty added to the wet side was smaller, leading to a lower change rate of the permanent strain (resilient modulus). Regarding the case at an optimum water content, the effect of the compaction degree seemed to be negligible. Thus, the change rates of the two parameters were identified to be minimal.

Author Contributions

Conceptualization, S.Q.; methodology, S.Q., X.Z. and W.M.; validation, J.W., X.H. and Z.W.; investigation, S.Q., W.M. and J.L.; data curation, W.M. and J.W.; writing—S.Q. and W.M.; writing—review and editing, S.Q. and W.M.; supervision, S.Q., X.Z. and X.H.; project administration, S.Q.; funding acquisition, S.Q. and X.Z. All authors have read and agreed to the published version of the manuscript.

Funding

This research was funded by Grant 52108295 from the National Natural Science Foundation of China for the research project H21099 “Research on key environmental construction technologies of extra-long underground road in Beijing” from the Beijing Capital Highway Development Corporation Ltd., and Grant JDYC20220811 from the Pyramid Talent Training Project of Beijing University of Civil Engineering and Architecture, for which the authors are grateful.

Data Availability Statement

The data presented in this study are available from the corresponding author upon request.

Conflicts of Interest

Authors Xingbo Hu, Zengzhi Wei are employed by the Beijing Capital Highway Development Corporation Ltd. The remaining authors declare that the research was conducted in the absence of any commercial or financial relationships that could be construed as a potential conflict of interest.

Abbreviations

The following symbols are used in this paper:
dpore diameter.
Dccompaction degree.
dchacharacteristic pore diameter.
floading frequency.
Gsspecific gravity.
Ipplasticity index.
Mrresilient modulus.
mclaymass of dry clay.
mwatermass of water.
Nloading cycle number.
qdeviator stress.
qmaxmaximum deviator stress.
qminminimum deviator stress.
Srsaturation degree.
wwater content.
wLliquid limit.
woptoptimum water content.
wPplastic limit.
Tloading cycle.
Δqamplitude of cyclic deviator stress.
σ1axial stress.
σ3confining pressure.
ρddry density.
ρd-maxmaximum dry density.
ε1axial strain.
ε1ppermanent axial strain.
ε1rresilient axial strain.

References

  1. Gu, C.; Gu, Z.Q.; Cai, Y.Q.; Wang, J.; Dong, Q.Y. Effects of cyclic intermediate principal stress on the deformation of saturated clay. J. Geotech. Geoenviron. Eng. 2018, 144, 04018052. [Google Scholar] [CrossRef]
  2. Ding, Y.; Jia, Y.; Wang, X.; Zhang, J.S.; Luo, H.; Zhang, Y.; Chen, X.B. The influence of geotextile on the characteristics of railway subgrade mud pumping under cyclic loading. Transp. Geotech. 2022, 37, 100831. [Google Scholar] [CrossRef]
  3. Chen, W.B.; Feng, W.Q.; Yin, J.H.; Borana, L.; Chen, R.P. Characterization of permanent axial strain of granular materials subjected to cyclic loading based on shakedown theory. Construct. Build. Mater. 2019, 198, 751–761. [Google Scholar] [CrossRef]
  4. Yuan, B.X.; Liang, J.K.; Zhang, B.F.; Chen, W.J.; Huang, X.L.; Huang, Q.Y.; Li, Y.; Yuan, P. Optimized reinforcement of granite residual soil using a cement and alkaline solution: A coupling effect. J. Rock Mech. Geotech. 2024, 2, 1–9. [Google Scholar] [CrossRef]
  5. Yuan, B.X.; Chen, W.J.; Li, Z.H.; Zhao, J.; Luo, Q.Z.; Chen, W.W.; Chen, T.Y. Sustainability of the polymer SH reinforced recycled granite residual soil: Properties, physicochemical mechanism, and applications. J. Soil. Sediment. 2023, 23, 246–262. [Google Scholar] [CrossRef]
  6. Inam, A.; Ishikawa, T.; Miura, S. Effect of principal stress axis rotation on cyclic plastic deformation characteristics of unsaturated base course material. Soils Found. 2012, 52, 65–80. [Google Scholar] [CrossRef]
  7. Werkmeister, S.; Dawson, A.R.; Wellner, F. Permanent deformation behavior of granular materials and the shakedown concept. Transp. Res. Rec. 2001, 1757, 75–81. [Google Scholar] [CrossRef]
  8. JTG D30-2015; Specifications for Design of Highway Subgrade. Ministry of Communications, People’s Republic of China: Beijing, China, 2015.
  9. Chen, R.P.; Wang, H.L.; Hong, P.Y.; Cui, Y.J.; Qi, S.; Cheng, W. Effects of degree of compaction and fines content of the subgrade bottom layer on moisture migration in the substructure of high-speed railways. Proc. Inst. Mech. Eng. Part F. J. Rail Rapid Transit 2018, 232, 1197–1210. [Google Scholar] [CrossRef]
  10. TB10621; Code for Design of High Speed Railway. Ministry of Railways: Beijing, China, 2009.
  11. Gens, A.; Alonso, E.E.; Suriol, J. Effect of structure on the volumetric behaviour of a compacted soil. In Proceedings of the First International Conference, UNSAT’95, Paris, France, 6–8 September 1995; pp. 83–88. Available online: http://worldcat.org/isbn/9054105836 (accessed on 1 October 1995).
  12. Lloret, A.; Villar, M.V.; Sanchez, M.; Gens, A. Mechanical behaviour of heavily compacted bentonite under high suction changes. Géotechnique 2003, 53, 27–40. [Google Scholar] [CrossRef]
  13. Romero, E.; Gens, A.; Lloret, A. Suction effects on a compacted clay under non-isothermal conditions. Géotechnique 2003, 53, 65–81. [Google Scholar] [CrossRef]
  14. Delage, P.; Audiguier, M.; Cui, Y.J.; Howat, M.D. Microstructure of a compacted silt. Can. Geotech. J. 1996, 33, 150–158. [Google Scholar] [CrossRef]
  15. Chen, R.P.; Qi, S.; Wang, H.L.; Cui, Y.J. Microstructure and Hydraulic Properties of Coarse-Grained Subgrade Soil Used in High-Speed Railway at Various Compaction Degrees. J. Mater. Civ. Eng. 2019, 31, 04019301. [Google Scholar] [CrossRef]
  16. Craciun, O.; Lo, S.C.R. Matric suction measurement in stress path cyclic triaxial testing of unbound granular base materials. Geotech. Test. J. 2009, 33, 33–44. [Google Scholar] [CrossRef]
  17. Gu, C.; Zhan, Y.; Wang, J.; Cai, Y.Q.; Cao, Z.G.; Zhang, Q. Resilient and permanent deformation of unsaturated unbound granular materials under cyclic loading by the large-scale triaxial tests. Acta Geotech. 2020, 15, 3343–3356. [Google Scholar] [CrossRef]
  18. Duong, T.V.; Cui, Y.J.; Tang, A.M.; Dupla, J.C.; Canou, J.; Calon, N.; Robinet, A. Effects of water and fines contents on the resilient modulus of the interlayer soil of railway substructure. Acta Geotech. 2016, 11, 51–59. [Google Scholar] [CrossRef]
  19. Chen, W.B.; Feng, W.Q.; Yin, J.H. Effects of water content on resilient modulus of a granular material with high fines content. Construct. Build. Mater. 2020, 236, 117542. [Google Scholar] [CrossRef]
  20. Lekarp, F.; Isacsson, U.; Dawson, A. State of the art. I: Resilient response of unbound aggregates. J. Transpor. Eng. 2000, 126, 66–75. [Google Scholar] [CrossRef]
  21. Tang, C.S.; Pei, X.J.; Wang, D.Y.; Shi, B.; Li, J. Tensile Strength of Compacted Clayey Soil. J. Geotech. Geoenviron. Eng. 2015, 141, 04014122. [Google Scholar] [CrossRef]
  22. Liu, J.K.; Xiao, J.H. Experimental study on the stability of railroad silt subgrade with increasing train speed. J. Geotech. Geoenviron. Eng. 2010, 136, 833–841. [Google Scholar] [CrossRef]
  23. Yang, S.R.; Lin, H.D.; Kung, J.H.S.; Huang, W.H. Suction-Controlled Laboratory Test on Resilient Modulus of Unsaturated Compacted Subgrade Soils. J. Geotech. Geoenviron. Eng. 2008, 134, 1375–1384. [Google Scholar] [CrossRef]
  24. Xiao, J.H.; Juang, C.H.; Xu, C.J.; Li, X.W.; Wang, L. Strength and deformation characteristics of compacted silt from the lower reaches of the Yellow River of China under monotonic and repeated loading. Eng. Geol. 2014, 178, 49–57. [Google Scholar] [CrossRef]
  25. Feng, D.Z.; Liang, B.; Sun, W.J.; He, X.X.; Yi, F.; Wan, Y. Mechanical properties of solidified dredged soils considering the effects of compaction degree and residual moisture content. Dev. Built. Environ. 2023, 16, 100235. [Google Scholar] [CrossRef]
  26. ASTM D422-63; Standard Test Method for Particle-Size Analysis of Soils. ASTM: West Conshohocken, PA, USA, 2007.
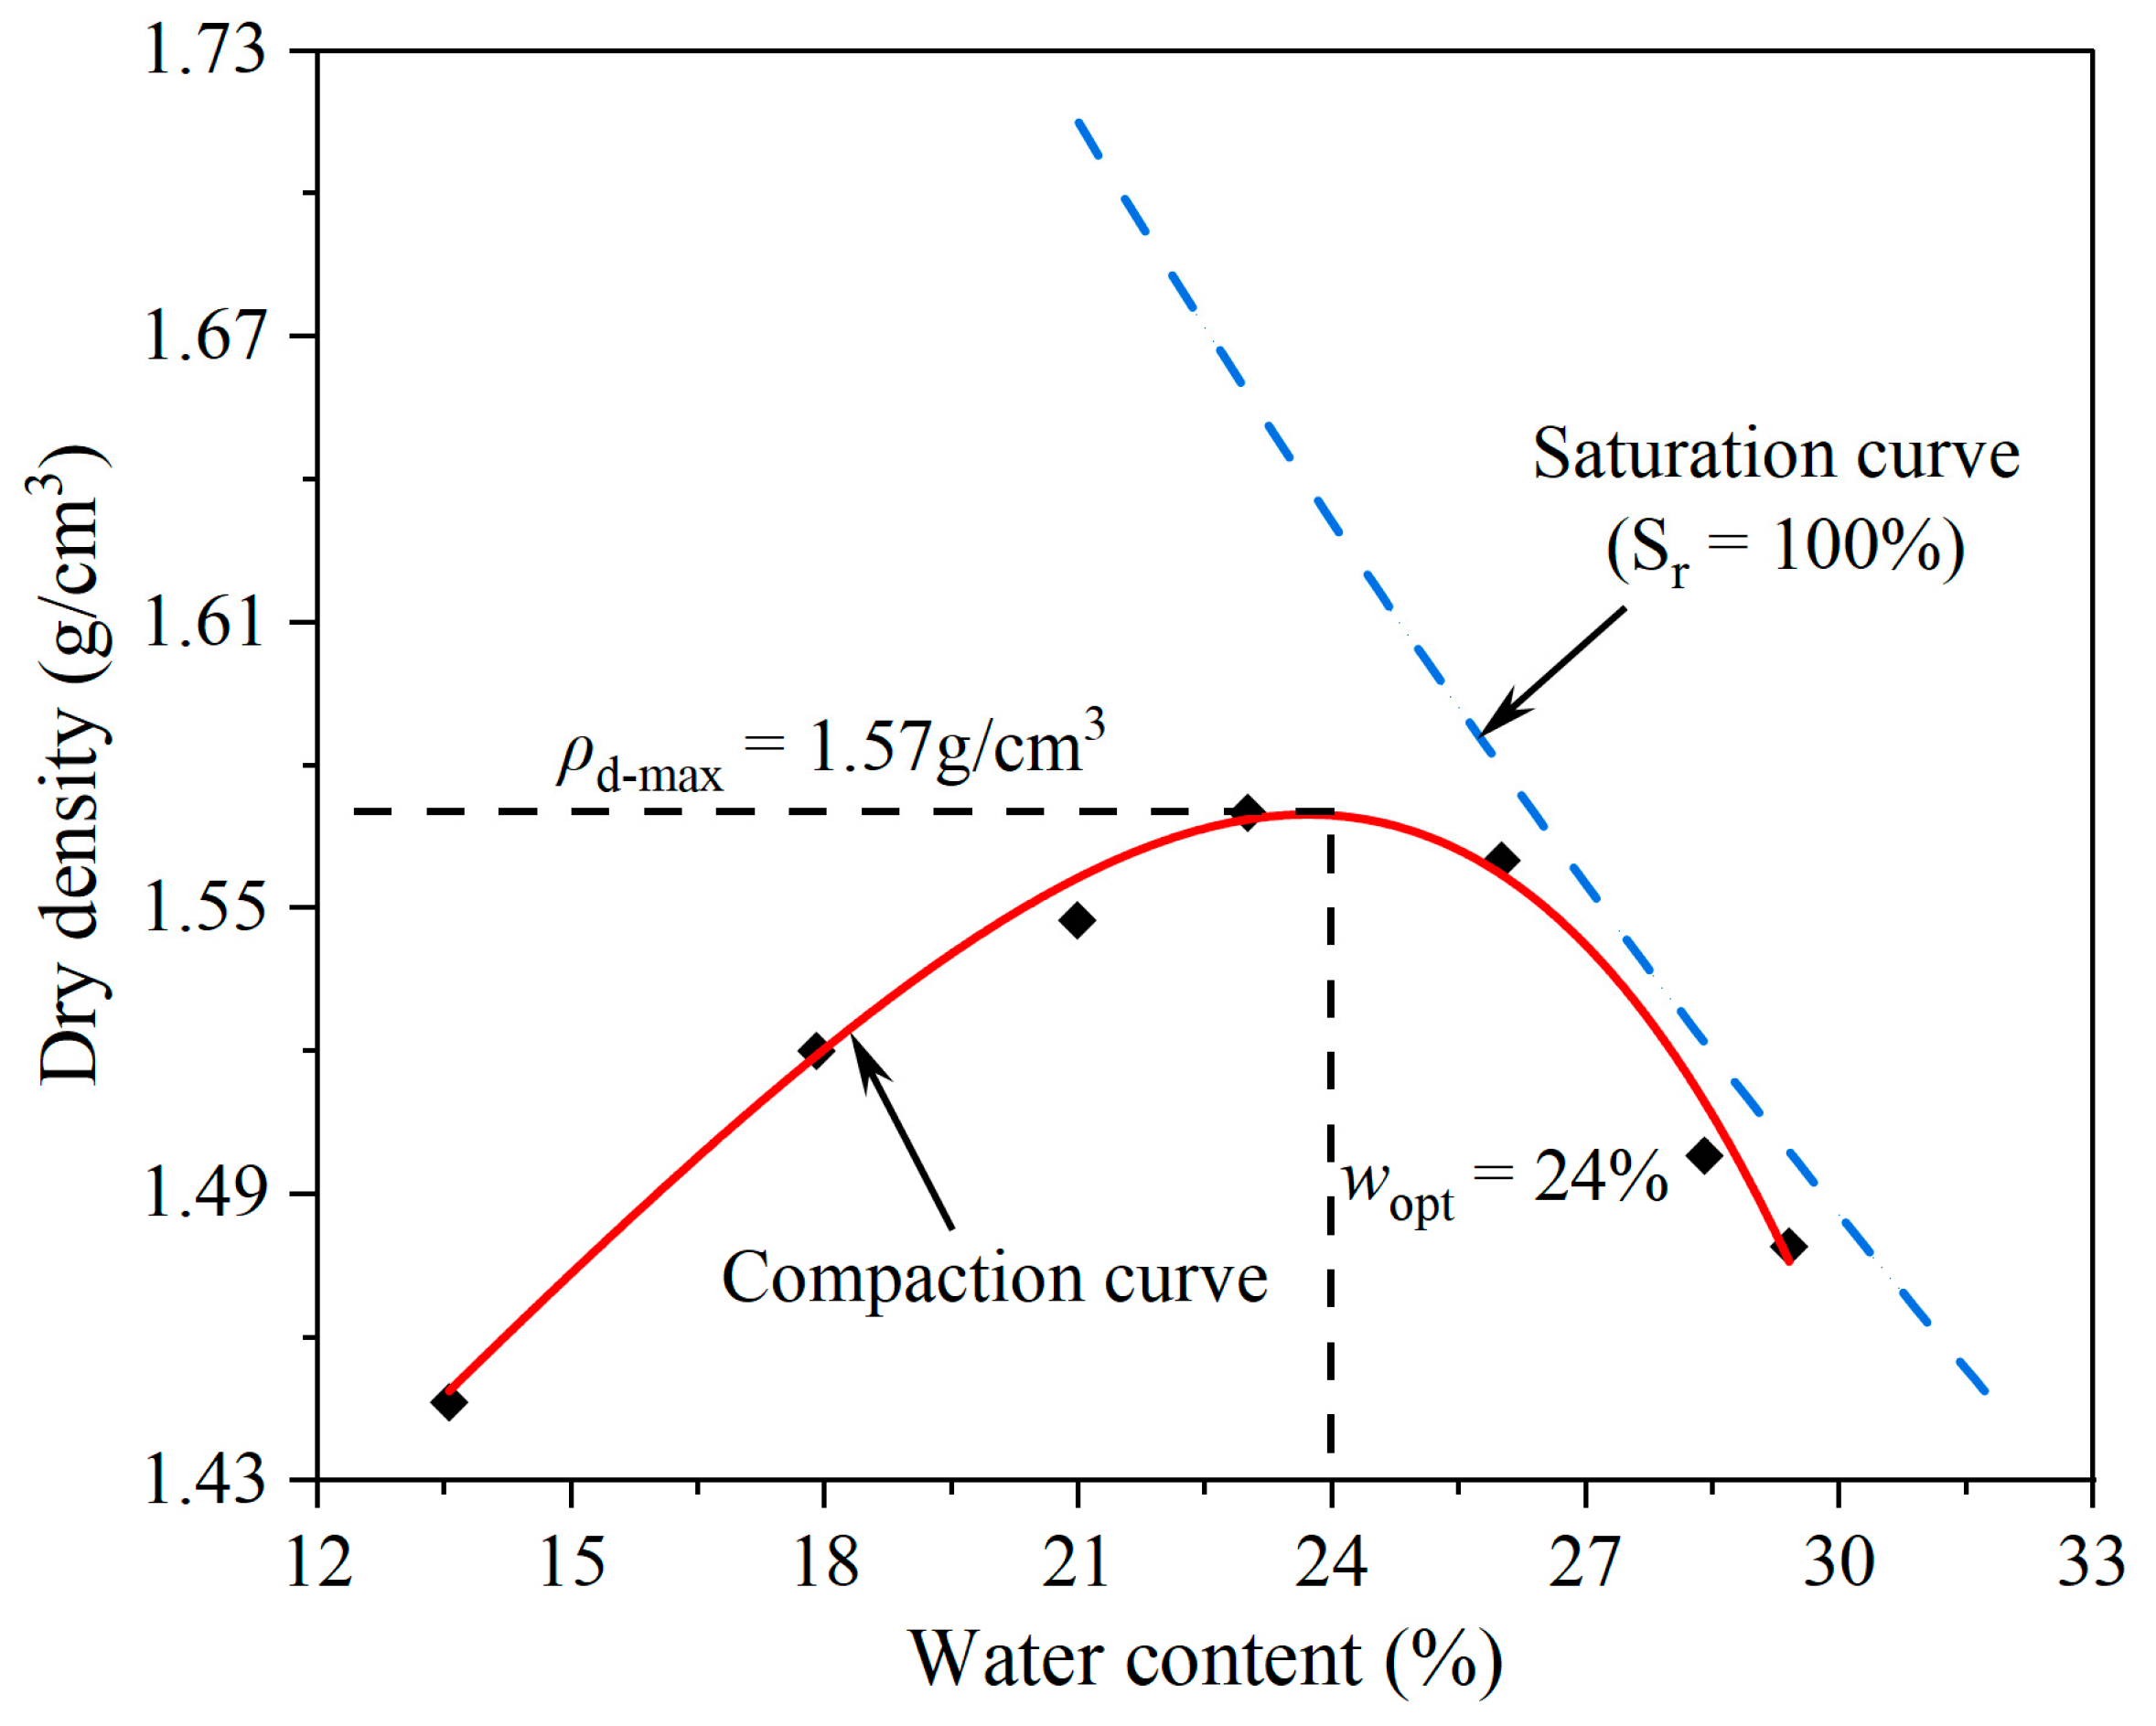
  27. ASTM D698-12; Standard Test Methods for Laboratory Compaction Characteristics of Soil Using Standard Effort. ASTM: West Conshohocken, PA, USA, 2012.
  28. ASTM D3999-11; Standard Test Methods for the Determination of the Modulus and Damping Properties of Soils Using the Cyclic Triaxial Apparatus. ASTM: West Conshohocken, PA, USA, 2012.
  29. Wang, H.L.; Cui, Y.J.; Lamas-Lopez, F.; Dupla, J.C.; Canou, J.; Calon, N.; Saussine, G.; Aimedieu, P.; Chen, R.P. Effects of inclusion contents on the resilient modulus and damping ratio of unsaturated track-bed materials. Can. Geotech. J. 2017, 54, 1672–1681. [Google Scholar] [CrossRef]
  30. Liu, J.K. Subgrade Engineering; The Architecture and Building Industry Publishing House of China: Beijing, China, 2006. [Google Scholar]
  31. Mohammad, L.N.; Titi, H.H.; Herath, A. Effect of Moisture Content and Dry Unit Weight on the Resilient Modulus of Subgrade Soils Predicted by Cone Penetration Test; Louisiana Transportation Research Center Rep. No. FHWA/LA-00/355; Federal Highway Ad-ministration, Texas A&M Univ.: College Station, TX, USA, 2002. [Google Scholar]
  32. Lamas-Lopez, F.; Cui, Y.J.; Costa D’Aguiar, S.; Calon, N.; Robinet, A.; Tang, A.M.; Dupla, J.C.; Canou, J. In-situ investigation of the behaviour of a French conventional railway platform. In Proceedings of the Transportation Research Board TRB 2015, Washington, DC, USA, 11–15 January 2015. [Google Scholar]
  33. Lamas-Lopez, F. Field and Laboratory Investigation on the Dyanmic Behavior of Conventional Railway Track-Bed Materials in the Context of Traffic Upgrade. Ph.D. Thesis, Paris Est, École Doctorale Sciences, Ingénierie et Environnement, Champs-sur-Marne, France, 2016. [Google Scholar]
  34. Cao, Z.G.; Chen, J.Y.; Cai, Y.Q.; Gu, C.; Wang, J. Effects of moisture content on the cyclic behavior of crushed tuff aggregates by large-scale tri-axial test. Soil Dyn. Earthq. Eng. 2017, 95, 1–8. [Google Scholar] [CrossRef]
  35. Xiong, H.; Cai, Y.Q.; Yang, Z.X.; Chai, J.C. Effect of drained static shear on cyclic deformation behavior of K0-consolidated sand. Soils Found. 2017, 57, 720–732. [Google Scholar] [CrossRef]
  36. Cai, Y.Q.; Gu, C.; Wang, J.; Juang, C.H.; Xu, C.J.; Hu, X.Q. One-way cyclic triaxial behavior of saturated clay: Comparison between constant and variable confining pressure. J. Geotech. Geoenviron. 2013, 139, 797–809. [Google Scholar] [CrossRef]
  37. Li, Y.F.; Nie, R.S.; Yue, Z.R.; Leng, W.M.; Guo, Y.P. Dynamic behaviors of fine-grained subgrade soil under single-stage and multi-stage intermittent cyclic loading: Permanent deformation and its prediction model. Soil Dyn. Earthq. Eng. 2021, 142, 106548. [Google Scholar] [CrossRef]
  38. Delage, P.; Marcial, D.; Cui, Y.J.; Ruiz, X. Ageing effects in a compacted bentonite: A microstructure approach. Géotechnique 2006, 56, 291–304. [Google Scholar] [CrossRef]
  39. Zhang, T.W.; Cui, Y.J.; Francisco, L.L.; Calon, N.; D’Aguiaret, N.S.C. Compacted soil behaviour through changes of density, suction, and stiffness of soils with remoulding water content. Can. Geotech. J. 2017, 55, 182–190. [Google Scholar] [CrossRef]
  40. Li, X.; Zhang, L.M. Characterization of dual-structure pore-size distribution of soil. Can. Geotech. J. 2009, 46, 129–141. [Google Scholar] [CrossRef]
  41. Schubert, H. Capillarity in Porous Solid Material Systems; Springer: Berlin, Germany, 1982. [Google Scholar]
  42. Romero, E.; Gens, A.; Lloret, A. Water permeability, water retention and microstructure of unsaturated compacted Boom clay. Eng. Geol. 1999, 54, 117–127. [Google Scholar] [CrossRef]
  43. Vanapalli, S.K.; Fredlund, D.G.; Pufahl, D.E.; Clifton, A.W. Model for the Prediction of Shear Strength with Respect to Soil Suction. Can. Geotech. J. 1996, 33, 379–392. [Google Scholar] [CrossRef]
  44. Vanapalli, S.K.; Fredlund, D.G.; Pufahl, D.E. The Relationship between the Soil-Water Characteristic Curve and the Unsaturated Shear Strength of a Compacted Glacial Till. Geotech. Test. J. 1996, 19, 259–268. [Google Scholar] [CrossRef]
  45. Mancuso, C.; Vassallo, R.; Onofrio, A. Small strain behavior of a silty sand in controlled-suction resonant column—Torsional shear tests. Can. Geotech. J. 2002, 31, 22–31. [Google Scholar] [CrossRef]
  46. Yang, S.R.; Huang, W.H.; Liao, C.C. Correlation between Resilient Modulus and Plastic Deformation for Cohesive Subgrade Soil under Repeated Loading. Trans. Res. Rec. 2008, 2053, 72–79. [Google Scholar] [CrossRef]
  47. Su, Y.; Cui, Y.-J.; Dupla, J.-C.; Canou, J. Effect of water content on permanent deformation of fine/coarse soil mixtures with varying coarse grain contents and subjected to multi-stage cyclic loading. Acta Geobalcanica 2022, 17, 3259–3268. [Google Scholar] [CrossRef]
Figure 1. Grain size distribution of clay soils.
Buildings 14 02258 g001
Figure 2. Compaction curve of clay soils.
Buildings 14 02258 g002
Figure 3. A schematic view of the cyclic triaxial apparatus.
Buildings 14 02258 g003
Figure 4. Schematic view of (a) stress applied on the sample and (b) sine-shaped cycle.
Buildings 14 02258 g004
Figure 5. Comparison between commanding and measured signals of deviator stress.
Buildings 14 02258 g005
Figure 6. SEM testing results for compacted clay soils: (a) w = 19%, Dc = 0.8; (b) w = 19%, Dc = 0.9; (c) w = 29%, Dc = 0.8; (d) w = 29%, Dc = 0.9.
Buildings 14 02258 g006
Figure 7. MIP testing results for compacted clay soils.
Buildings 14 02258 g007
Figure 8. Axial strain variation within the first 10 cycles for the sample with w = 29% and Dc = 90% under Δq = 30 kPa.
Buildings 14 02258 g008
Figure 9. Evolution of the permanent strain (a,b) and resilient modulus (c,d) with the cycle number at different remolding water contents during the whole test.
Buildings 14 02258 g009
Figure 10. Variations in (a) the stabilized permanent strain and (b) stabilized resilient modulus with the remolding water content at different compaction degrees.
Buildings 14 02258 g010
Figure 11. A comparison of the dynamic parameter evolution curve at different compaction degrees: (a) plot of ε1p-N for w = 19%; (b) plot of ε1p-N for w = 24%; (c) plot of ε1p-N for w = 29%; (d) plot of Mr-N for w = 19%; (e) plot of Mr-N for w = 24%; (f) plot of Mr-N for w = 29%.
Buildings 14 02258 g011
Figure 12. Variations in (a) the stabilized permanent strain and (b) stabilized resilient modulus with the compaction degree at different remolding water contents.
Buildings 14 02258 g012
Figure 13. Testing results of (a) the permanent strain and (b) resilient modulus from previous studies [22,23,24,46,47].
Buildings 14 02258 g013
Table 1. Index properties of the tested clay soils.
Index PropertyValue
Specific gravity, Gs2.65
Liquid limit, wL63
Plastic limit, wP37
Plasticity index, Ip26
USUC a classificationMH
Optimum water content, wopt24%
Maximum dry density, ρd-max1.57 Mg/m3
a Unified Soil Classification System.
Table 2. Summary of the cyclic triaxial tests.
Samplew (%)Dcρd (g/cm3)Sr (%)mclay (g)mwater (g)σ3 (kPa)Δq (kPa)
A1190.81.2645.37120.5822.913030
A2240.81.2657.30120.5828.943030
A3290.81.2669.24120.5834.973030
B1190.91.4157.51135.6525.773030
B2240.91.4172.65135.6532.563030
B3290.91.4187.78135.6539.343030
Note: w = remolding water content; Dc = compaction degree; ρd = dry density; Sr = saturation degree; mclay = mass of dry clay; mwater = mass of water; σ3 = confining pressure; Δq = deviator stress amplitude.
Table 3. Basic properties of soils reported in previous studies.
Liu et al. (2010) [22]Yang et al. (2008a) [23]Yang et al. (2008b) [46]Xiao et al. (2014) [24]Su et al. (2022) [47]
SiteBeijing–Kowloon Railway, ChinaNorthern Taiwan, ChinaNorthern Taiwan, ChinaLiaocheng area, ChinaTGV Railway, Senissiat, France
Soil typeClayey soilLateritic soilLateritic soilAlluvial siltLean clay
Gs2.662.672.712.662.68
Liquid limit 24465430.432
Plasticity index131920920
Disclaimer/Publisher’s Note: The statements, opinions and data contained in all publications are solely those of the individual author(s) and contributor(s) and not of MDPI and/or the editor(s). MDPI and/or the editor(s) disclaim responsibility for any injury to people or property resulting from any ideas, methods, instructions or products referred to in the content.

