Article

Experimental Study on Mechanic Behavior of Flange Joint for Steel Tube Under Axial Tension

1
Beijing Municipal Engineering Research Institute, Beijing 100037, China
2
School of Civil Engineering, Beijing Jiaotong University, Beijing 100044, China
3
CCCC Highway Bridges National Engineering Research Center Co., Ltd., Beijing 100120, China
*
Author to whom correspondence should be addressed.
Buildings 2024, 14(8), 2282; https://doi.org/10.3390/buildings14082282
Submission received: 4 June 2024 / Revised: 29 June 2024 / Accepted: 18 July 2024 / Published: 24 July 2024
(This article belongs to the Section Building Structures)

Abstract

:
The flange joint is an important connection in steel tube structures. In this paper, 11 groups of flange joint tests were conducted to investigate the influences of tube diameter, flange plate thickness, the distance from the bolt to the tube centroid, bolt numbers and material strength on the mechanical behavior. One of two failure modes in tests is that the excessive plastic deformation on the flange plate makes the flange plate lose the bearing capacity; the other is that the steel tube yield makes the joints fail. The results show that the calculating method for flange joint in Chinese design code is so safe that amplifying the calculating results of the code by 1.2 times would be closer to the bearing capacity of specimens. For a flange joint with different tube diameters, thickening the flange plate of thinner tube or thinning the flange plate of another tube are effective to ensure the deformations on both sides of the flange plates are equivalent. The ratio of the bearing capacity of the steel tube to that of flange plate should be greater than 1.7. And the thickness of the flange plate should be thicker than 14mm to reduce the deformation caused by cutting, drilling and welding during manufacturing.

1. Introduction

Steel tube structure has the advantages of a large radius of gyration of cross-section and a small wind resistance coefficient [1]. It is used by designers in large-span structures such as ultra-high-voltage transmission towers and terminal buildings. The flange joint is one of the most commonly used connection types for steel tube structures. The flange joint has the advantages of explicit mechanical properties, simple construction, less maintenance, and easy installation and demolition. Steel tube flange joints can be divided into two types: flexible flange and rigid flange [2]. Compared to a joint with a flexible flange, the joint with a rigid flange has a circle of ribs welded at the connection of the flange plate and tube end, lending the joint more rigidity and strength, as shown in Figure 1. The two flanges are connected through the bolt. In a steel tube transmission tower, the steel consumption of the flange joints is so high that it needs to be carefully designed to reduce the costs of the overall structure. However, the current calculation theories and design methods of the flange joint are imperfect, making the effects of some design parameters on mechanical behavior unclear. Therefore, it is significant for the safety and cost reduction of steel tube structures to investigate the mechanical performance and propose more reasonable design methods.
Many scholars have conducted research on the flange joint. Kato and Hirose [3,4] carried out axial tensile tests on flexible flanges of tube and square steel tubes to investigate the effect of plate thickness on the mechanical performance of the flanges. Tao et al. [5] analyzed different welding methods for flange joints, discussed the effects of welding detailing, and proposed the formula for calculating the yield moment of the joints manufactured by the recommended welding methods. Most of the welding between vertical members of steel structures requires full weld-through, leading to environmental pollution, high costs and inconvenient construction. Therefore, flange joints with a bolt connection have become a popular research direction for researchers. Cao et al. [6] proposed a simplified mechanical calculation model for the bolts and flange plates in the joint. Zong et al. [7] and Cao et al. [8] studied the design methods of flange joints, conducting research on the selection of the flange joint design method. Kim and Madugula [9] investigated the changes in the gap between flange plates and bolt tension of flange joints under axial loads, and analyzed the prying force of the bolt. Van-Long et al. [10] conducted static-load and low-cycle-load tests on steel tube flange joints to investigate the stiffness, ultimate load-bearing capacity, failure mode and stress development of the joints. Reza et al. [11] designed two new flange joints and investigated their mechanical behavior. Luan et al. [12] studied the static mechanical performance of bolted flange joints and proposed a simplified nonlinear dynamic model for tube structures with bolted flange joints, overcoming the disadvantage that a simple linear beam cannot simultaneously consider the joints with different axial tension and compression characteristics.
In addition to the research on steel circular tube flange joints, many scholars have also carried out research on steel tubes with different cross-sections. Maël et al. [13,14] investigated the mechanical behavior of circular steel tube flanges under the combined action of bending moments and axial forces, as well as the rectangular and square steel tubes under tensile forces. Willibald et al. [15] and Van-Long et al. [10] experimentally studied the influence of bolt scheme design and flange plate thickness on the bearing capacity of square and circular steel tube flange joints, and summarized the failure modes of square steel tube flange joints. Hou et al. [16] designed special-shaped rigid flanges with 45°, 60° and 75° connection angles to reduce the connection area under special conditions, developed a nonlinear finite element model to investigate the bearing capacity and stress distribution mechanism, and proposed design methods for special-shaped rigid flanges under axial tensile load. Li et al. [17] proposed a new type of joint with an inner and outer double-ringed (IODR) flange that can fully utilize the space of the circular tube to reduce the size of the flange plate, experimentally studied the failure modes and force transfer mechanisms of five groups of IODR flanges with different flange plate sizes, and proposed a theoretical design method for this flange through numerical analysis. Zhang et al. [18] proposed design guidelines for a prefabricated prestressed vertical steel strand core tube flange column connection joint to reduce the deformation at the flange joint. The tests show that the vertical strand not only improved the hysteresis and ductility of the joint but also enhanced the synergistic performance.
It can be seen that much research on flange joints is based on tests. However, studies focused on the flange joints with two different steel tubes are rare. However, the tubes in steel structures are not all the same, making the structure light and efficient. And the matching of bearing capacities of flange plate and steel tube in a joint are ignored by researchers, which is significant in the design of steel tube structures.
In this paper, an experimental study on the mechanical behavior of steel tube flange joints under axial tensile load was conducted, in which 11 groups of ribbed tube flanges joint specimens were manufactured. The influences of the design parameters and the failure modes were investigated in the tests. Special situations, such as joints with two different tubes, were focused on, which could help to reduce steel consumption. The results of this paper are valuable for designers and engineers to build flange joints in steel tube structures with low costs and more safety.

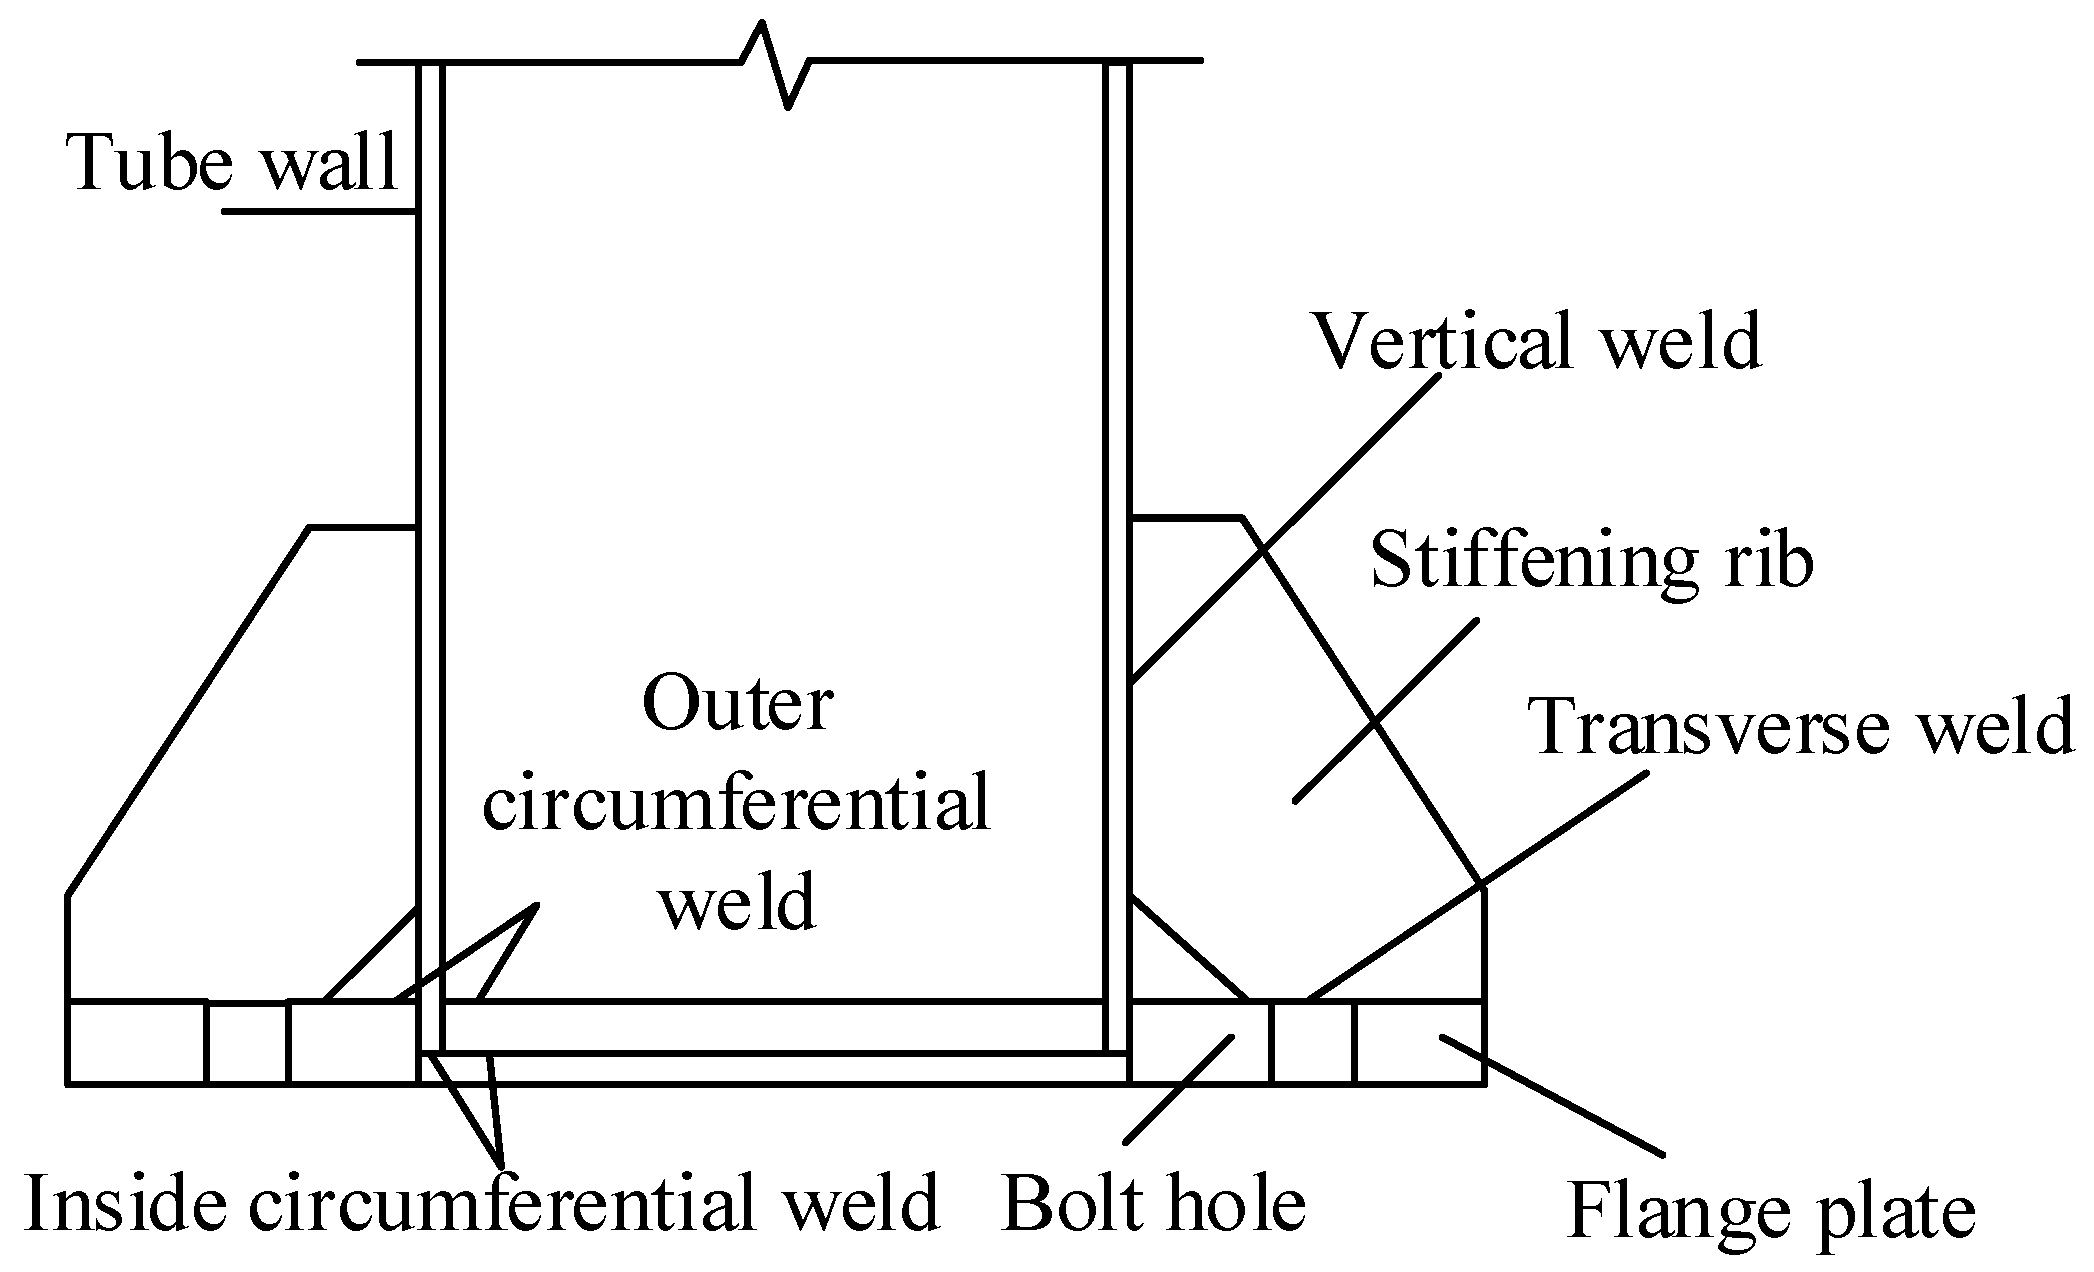
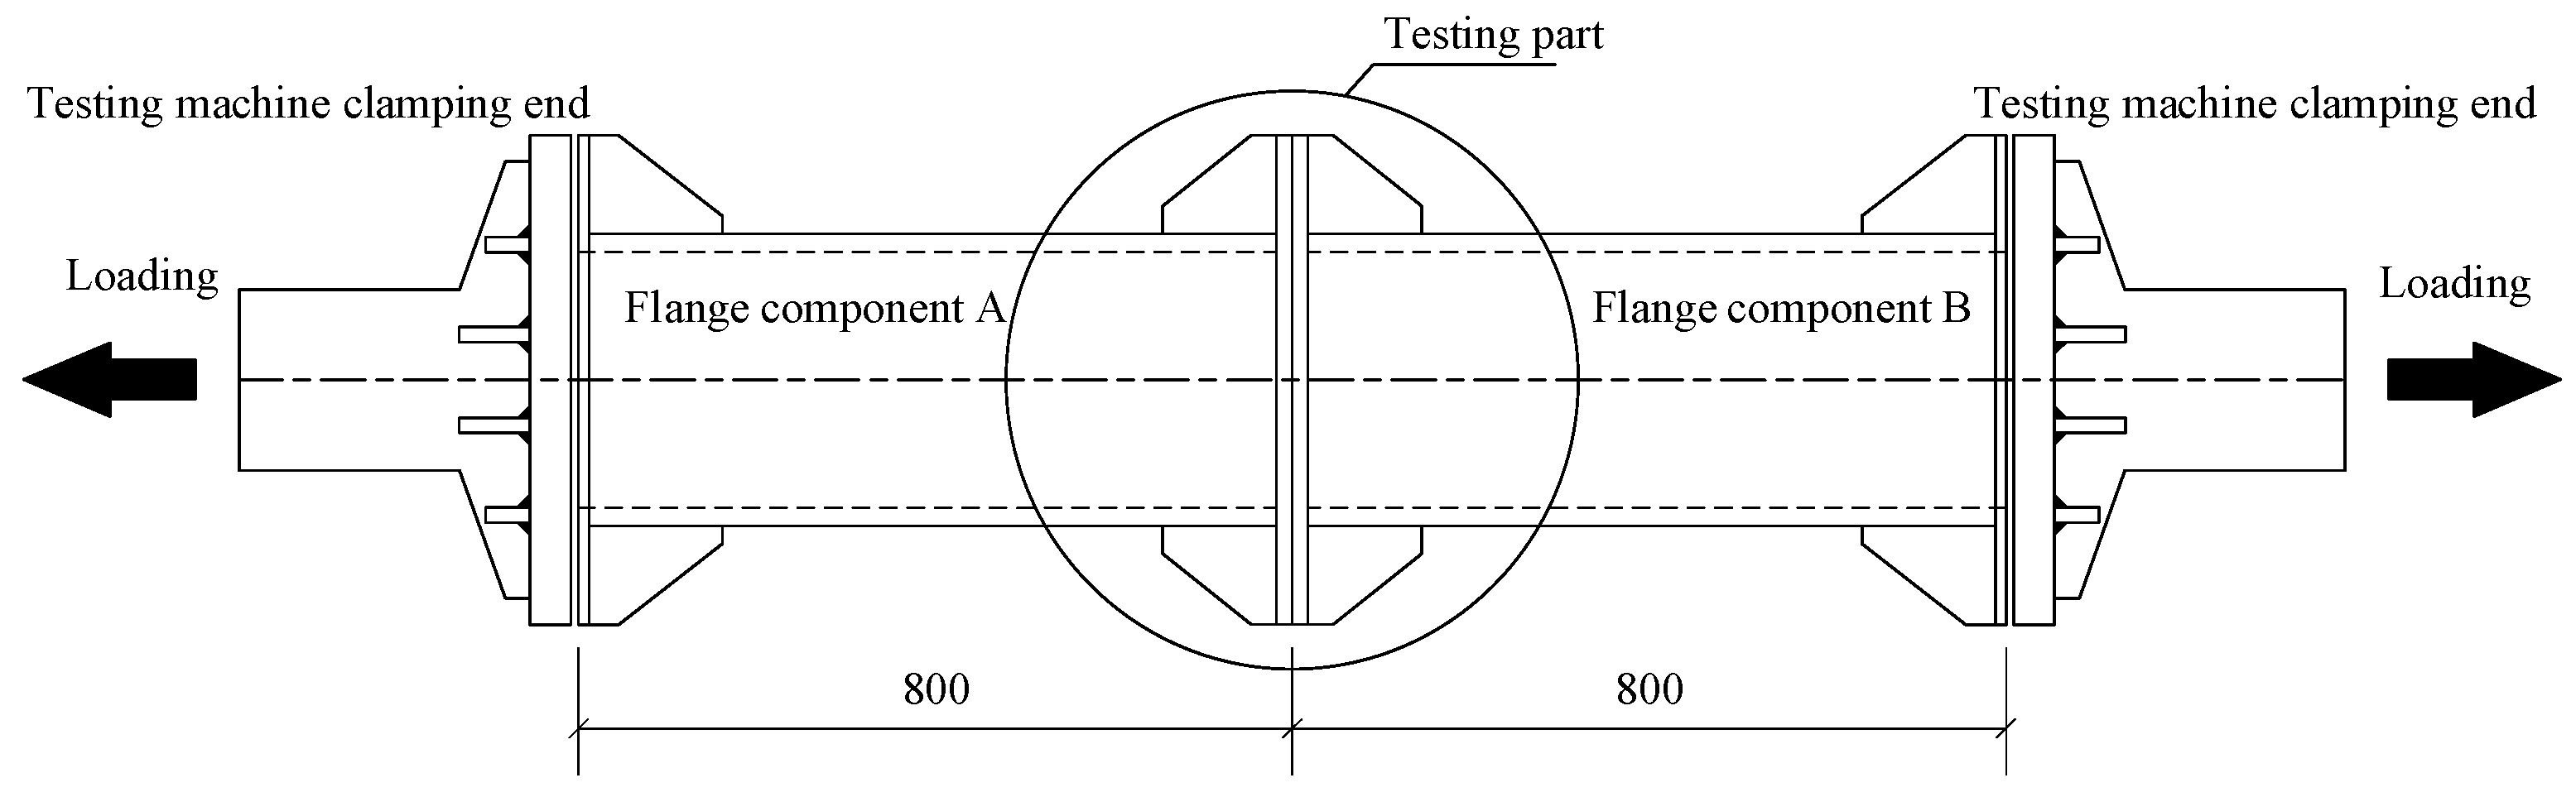
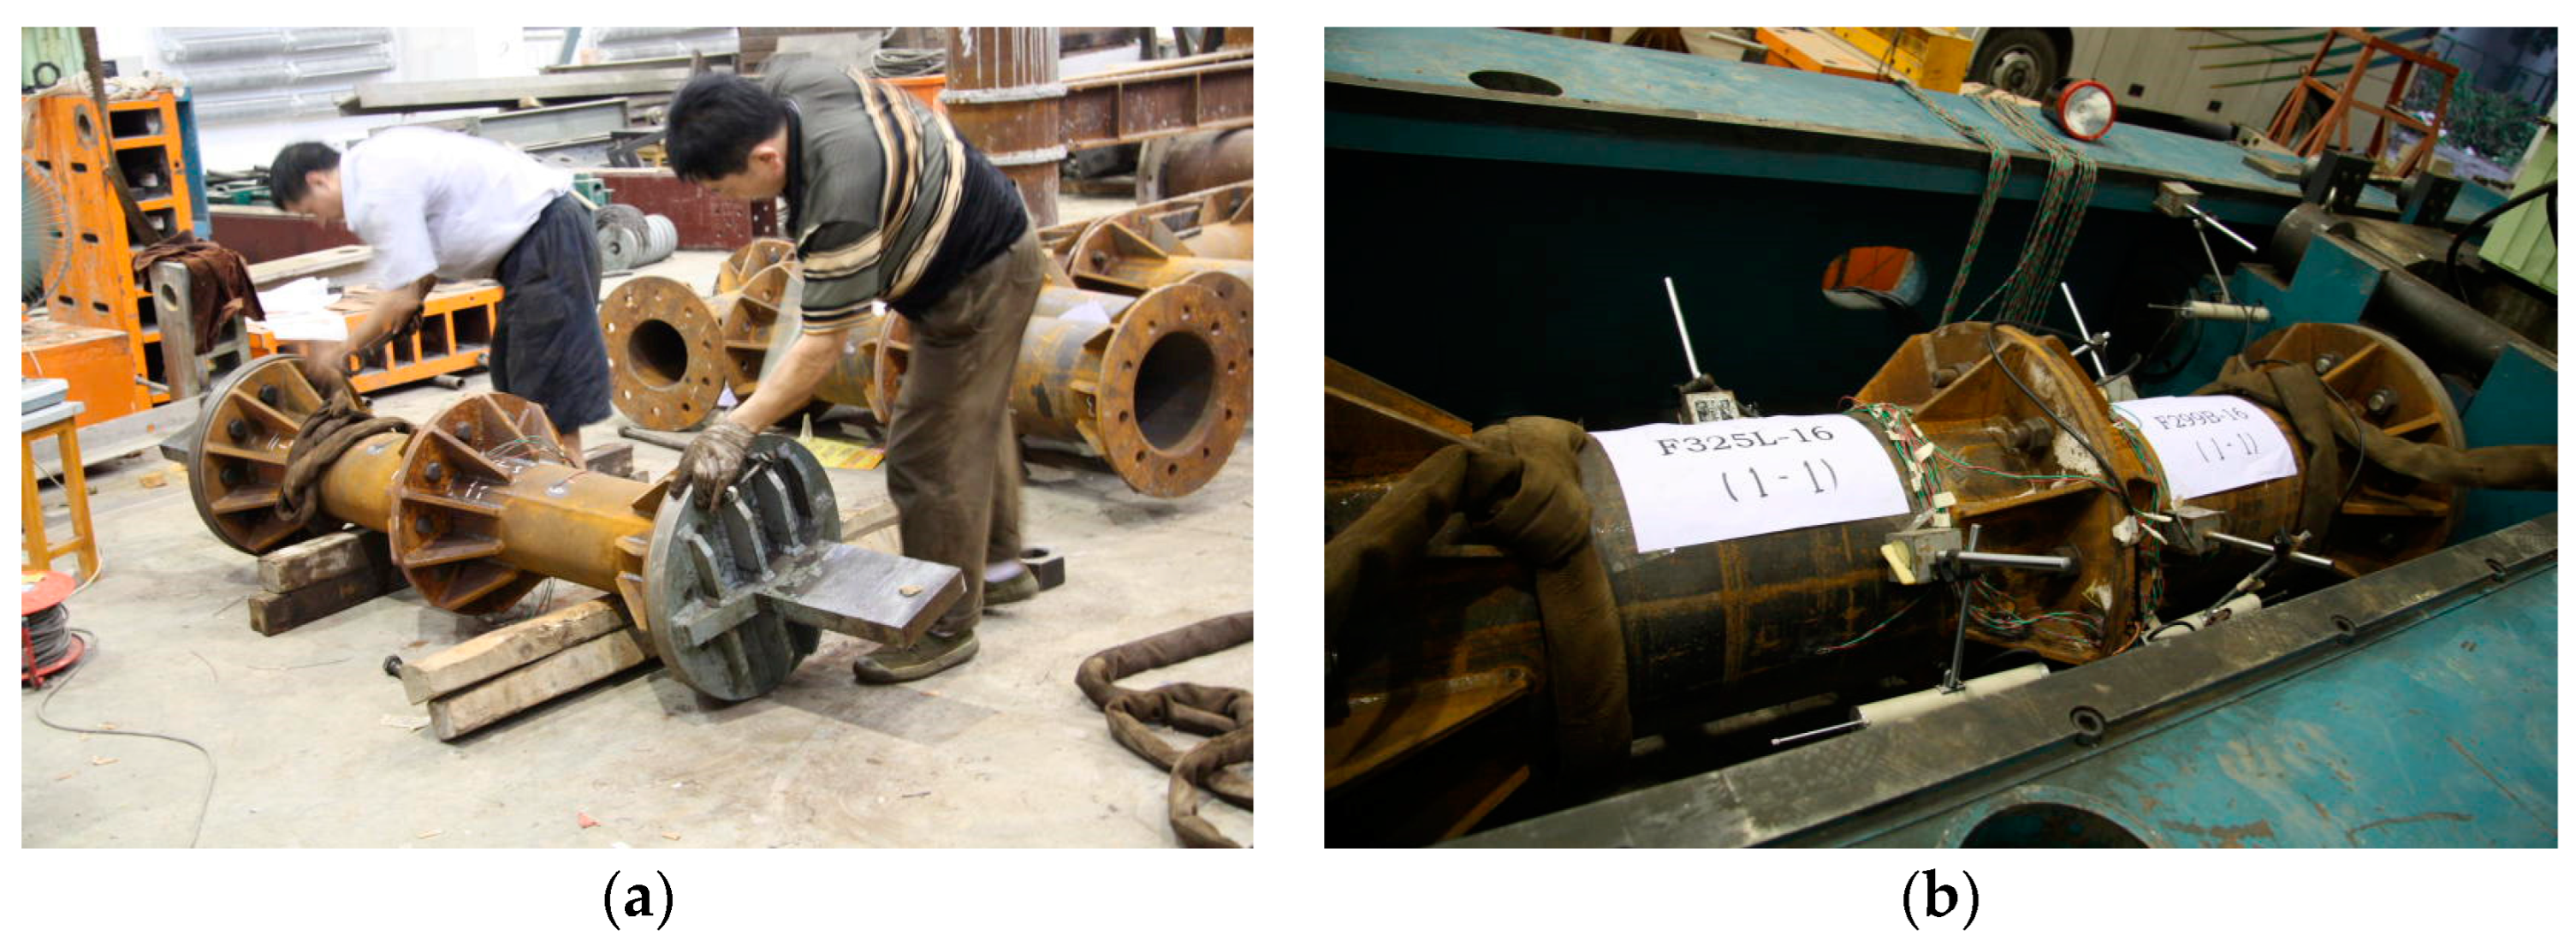
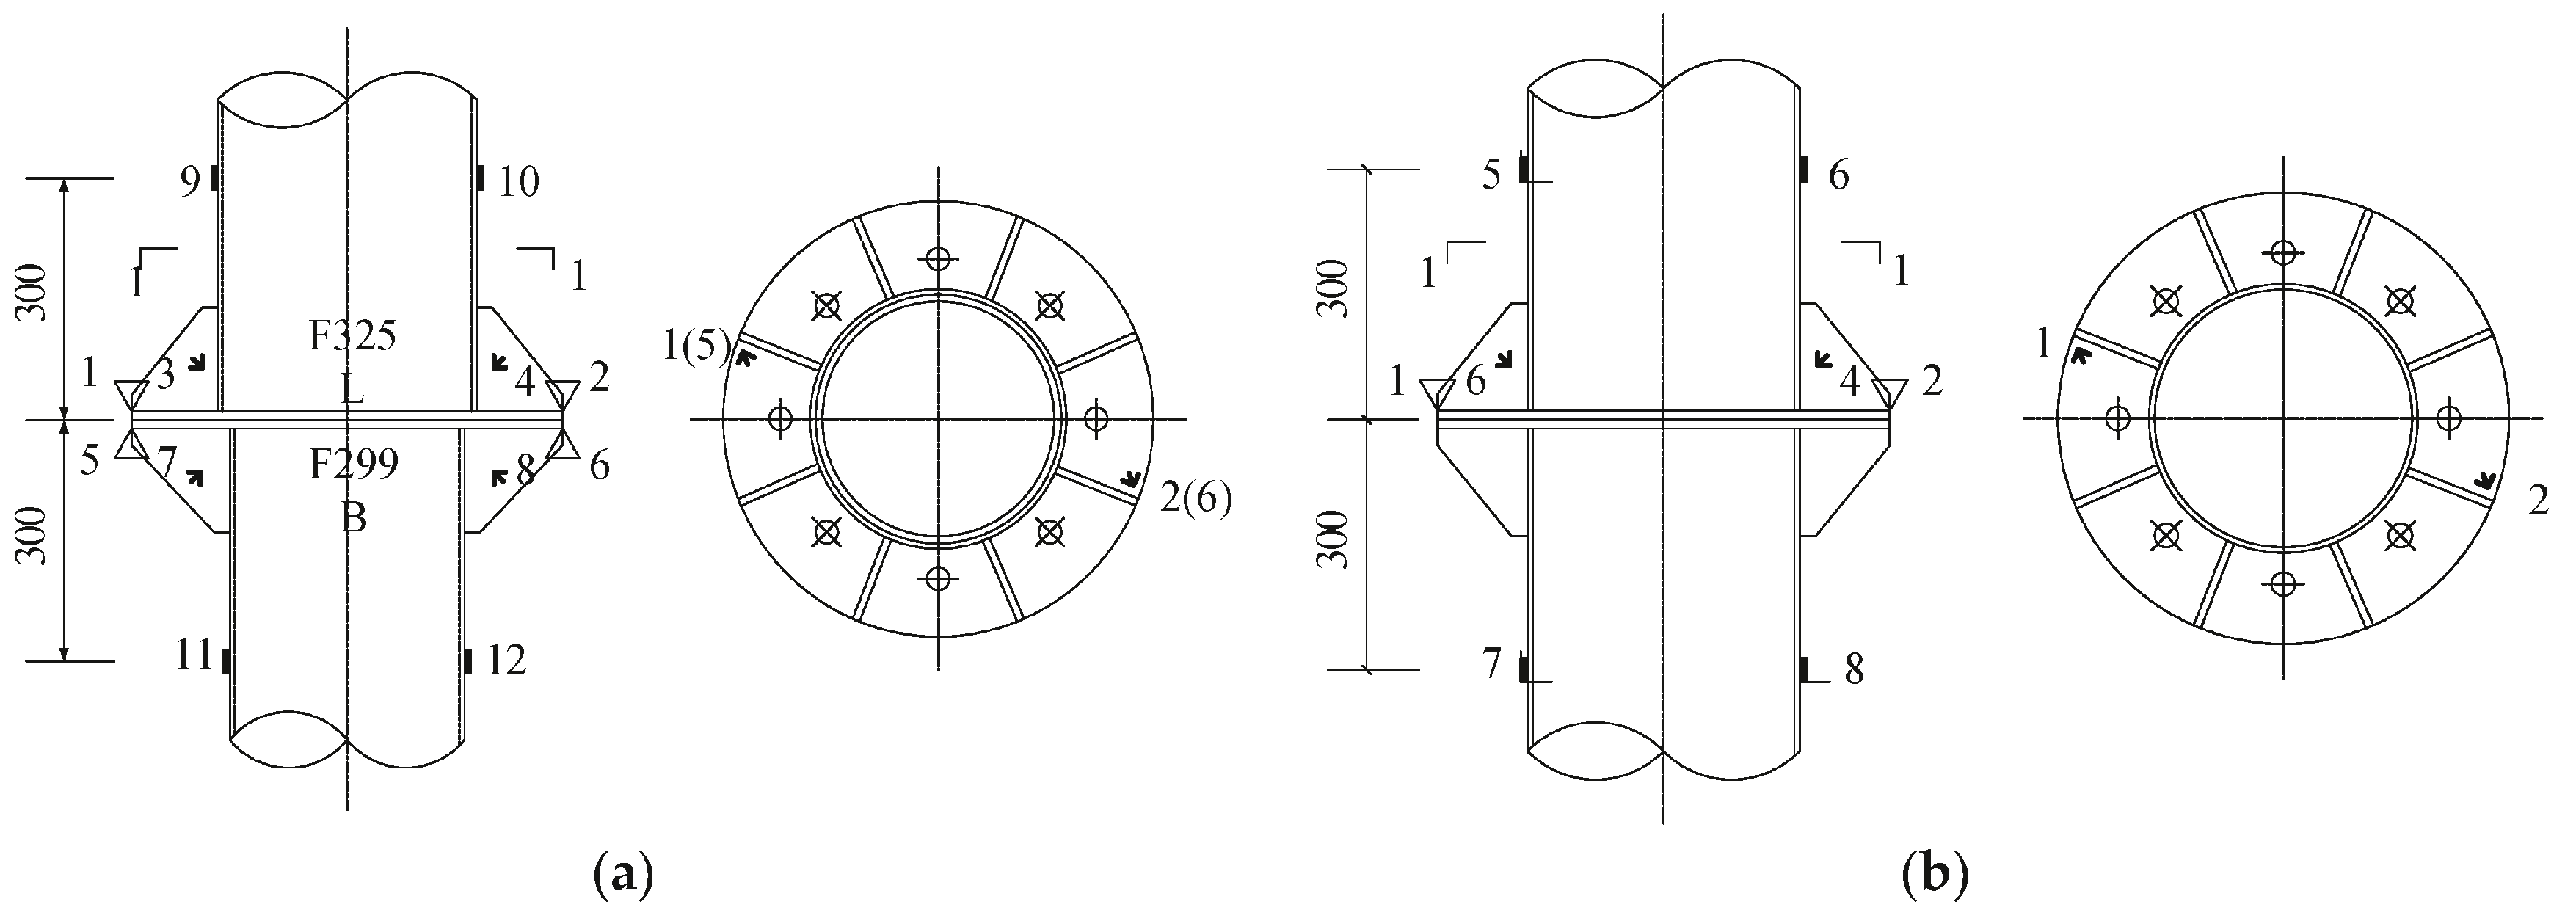
2. Test for Flange Joints

2.1. Specimen Sets

In this paper, 11 groups of flange joint specimens are tested, with three identical samples in each group. As shown in Figure 2, the testing part of each flange joint specimen is formed by flange component A and flange component B. The length of the specimen is 1600 mm. The experiment was conducted in the structural testing laboratory at Beijing Jiaotong University. The flange specimens were installed in the laboratory (Figure 3a), and then placed onto a horizontal tensile testing machine for loading (Figure 3b).
The 11 groups of specimens were named FL1~FL11, and the three identical flange samples in each group were numbered FLx-1, FLx-2 and FLx-3. The information of each group of flange joint specimens is listed in Table 1. The detailed geometries of flange components are listed in Table 2. For example, F299B-16 is a flange component with a tube diameter of 299 mm, tube thickness of 10 mm, flange plate thickness of 16 mm, bolt number of 8, bolt hole diameter of 26 mm, and rib plate thickness of 12. The strength test results of the steel used in the specimens are listed in Table 3. The strain corresponding to the yield point of steel (yield strain) εy is calculated according to the following formula:
ε y = f y E
where fy is the yield stress; and E is the elastic modulus, taking 200 GPa.
The influences of tube diameter, flange plate thickness, distance from the bolt to the tube centroid, bolt numbers and material strength on the mechanical behavior of flange joint are studied through tests. The 11 groups of specimens are set to achieve the objectives as follows:
(a)
FL1~FL3 are flange joints composed of F325L and F299B, which are the flange components with different tube diameters. The flange plate thickness of the three groups of specimen changes, being 16 mm, 14 mm, and 12 mm. The objective of these specimens is to study the mechanical performance of flange joints with two different steel tubes.
(b)
FL4~FL6 are flange joints composed of F245Bs. The flange plate thickness of the three groups of specimen changes, being 16 mm, 14 mm, and 12 mm. The objective of these specimens is to study the influence of flange plate thickness on the flange joint’s bearing capacity.
(c)
The FL7 specimens are composed of two identical F245B-R186s, with a distance from the bolt to the tube centroid of 186 mm, while the FL8 specimens are composed of F245B-R170s, with a distance from the bolt to the tube centroid of 170 mm. The objective of these specimens is to study the influence of the distance from the bolt to the tube centroid on the flange joint’s bearing capacity.
(d)
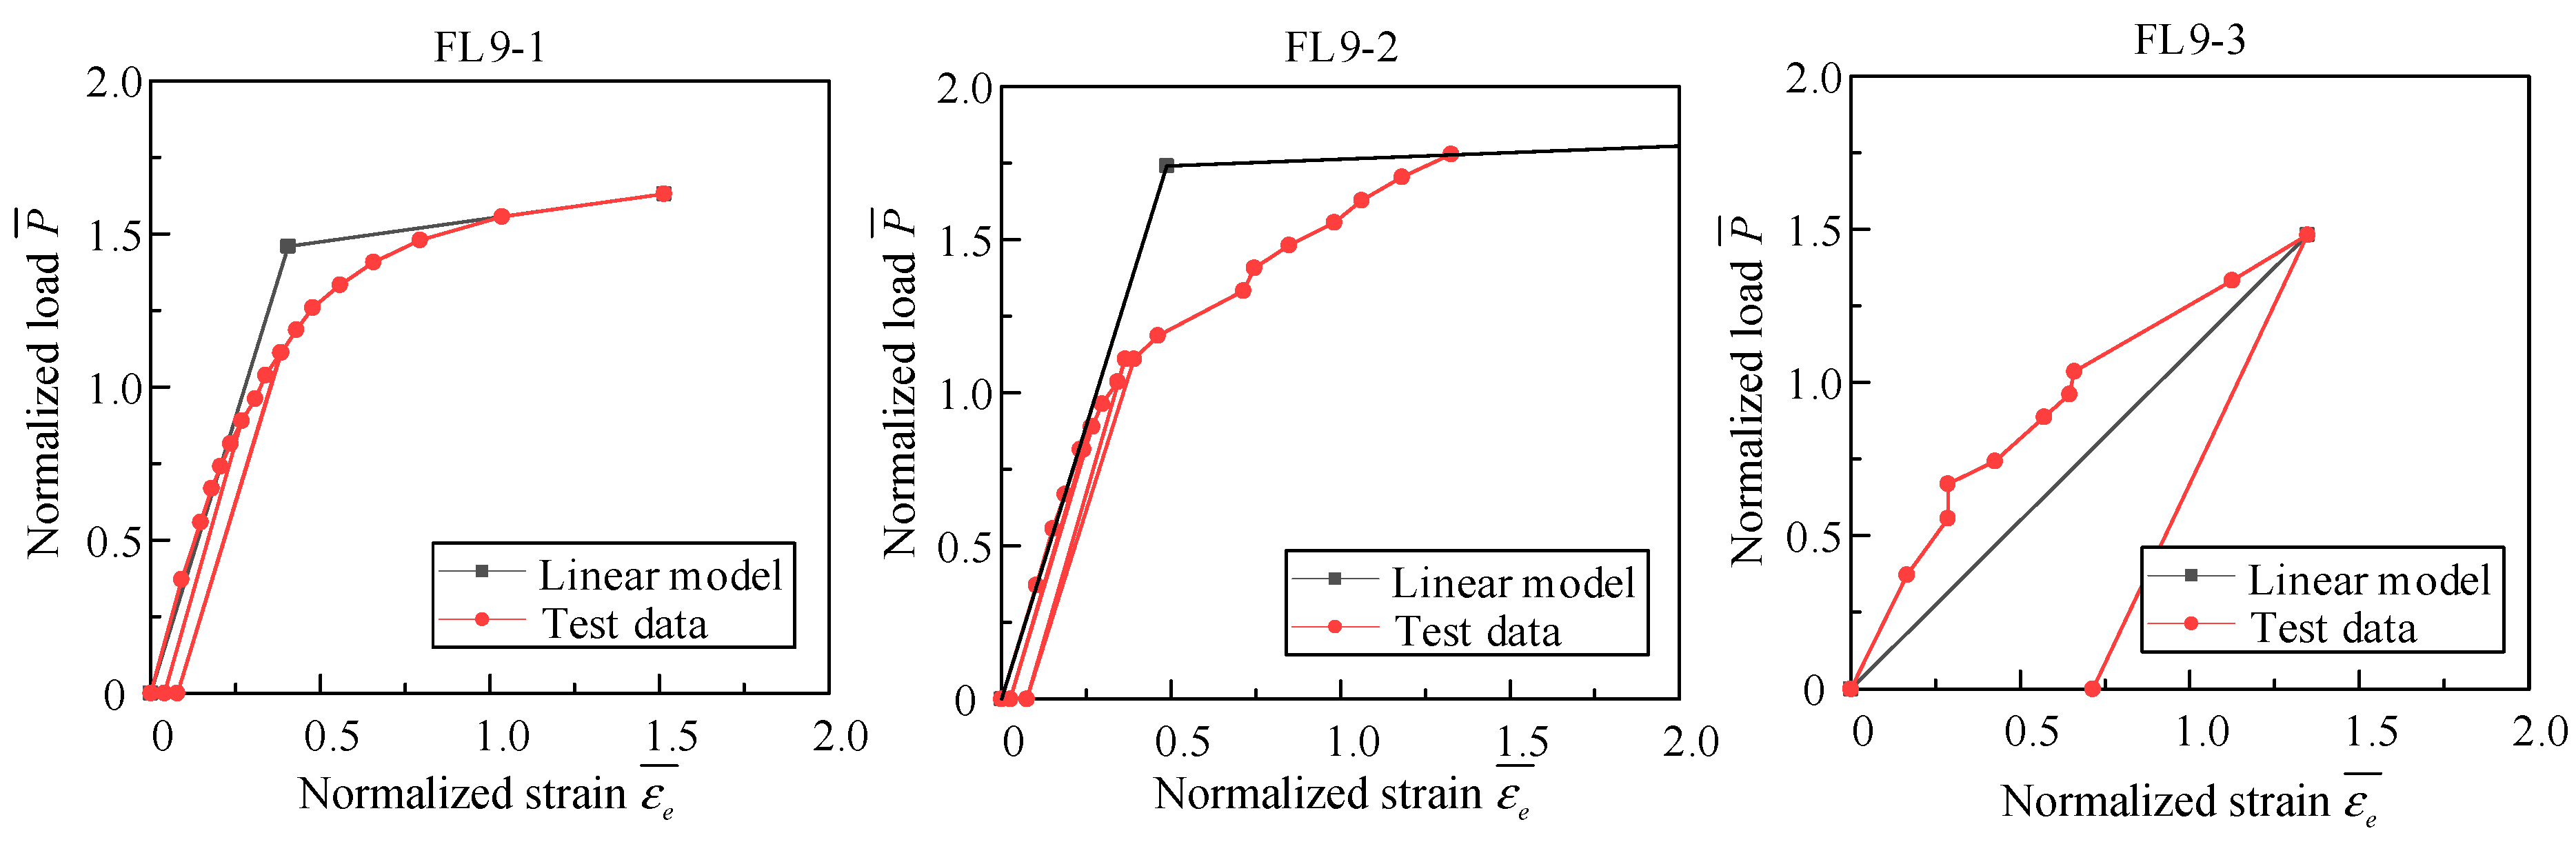
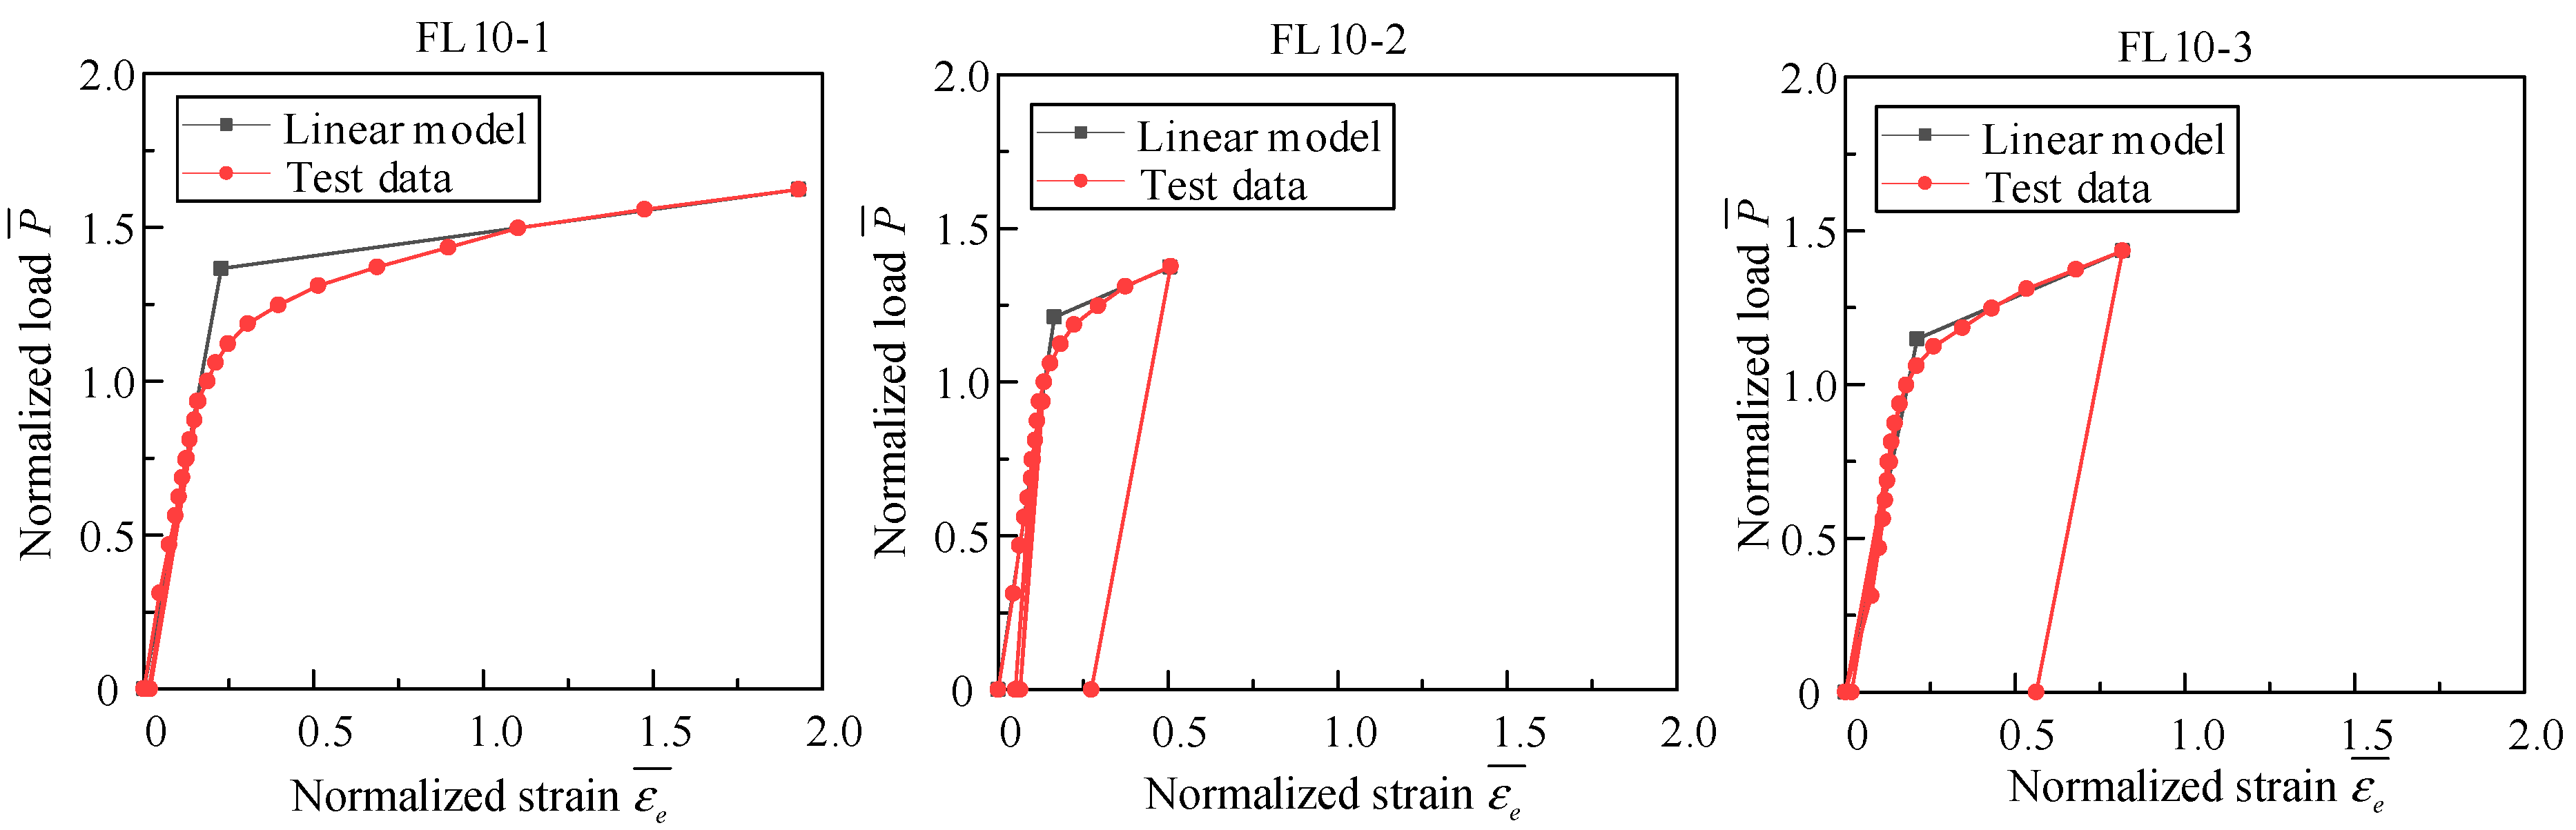
FL9 specimens are composed of two identical F325E-8Ms, connected by eight bolts, while FL10 specimens are composed of two identical F325E-10Ms, connected by 10 bolts. The objective of these specimens is to study the influence of the bolt number on the flange joint’s bearing capacity.
(e)
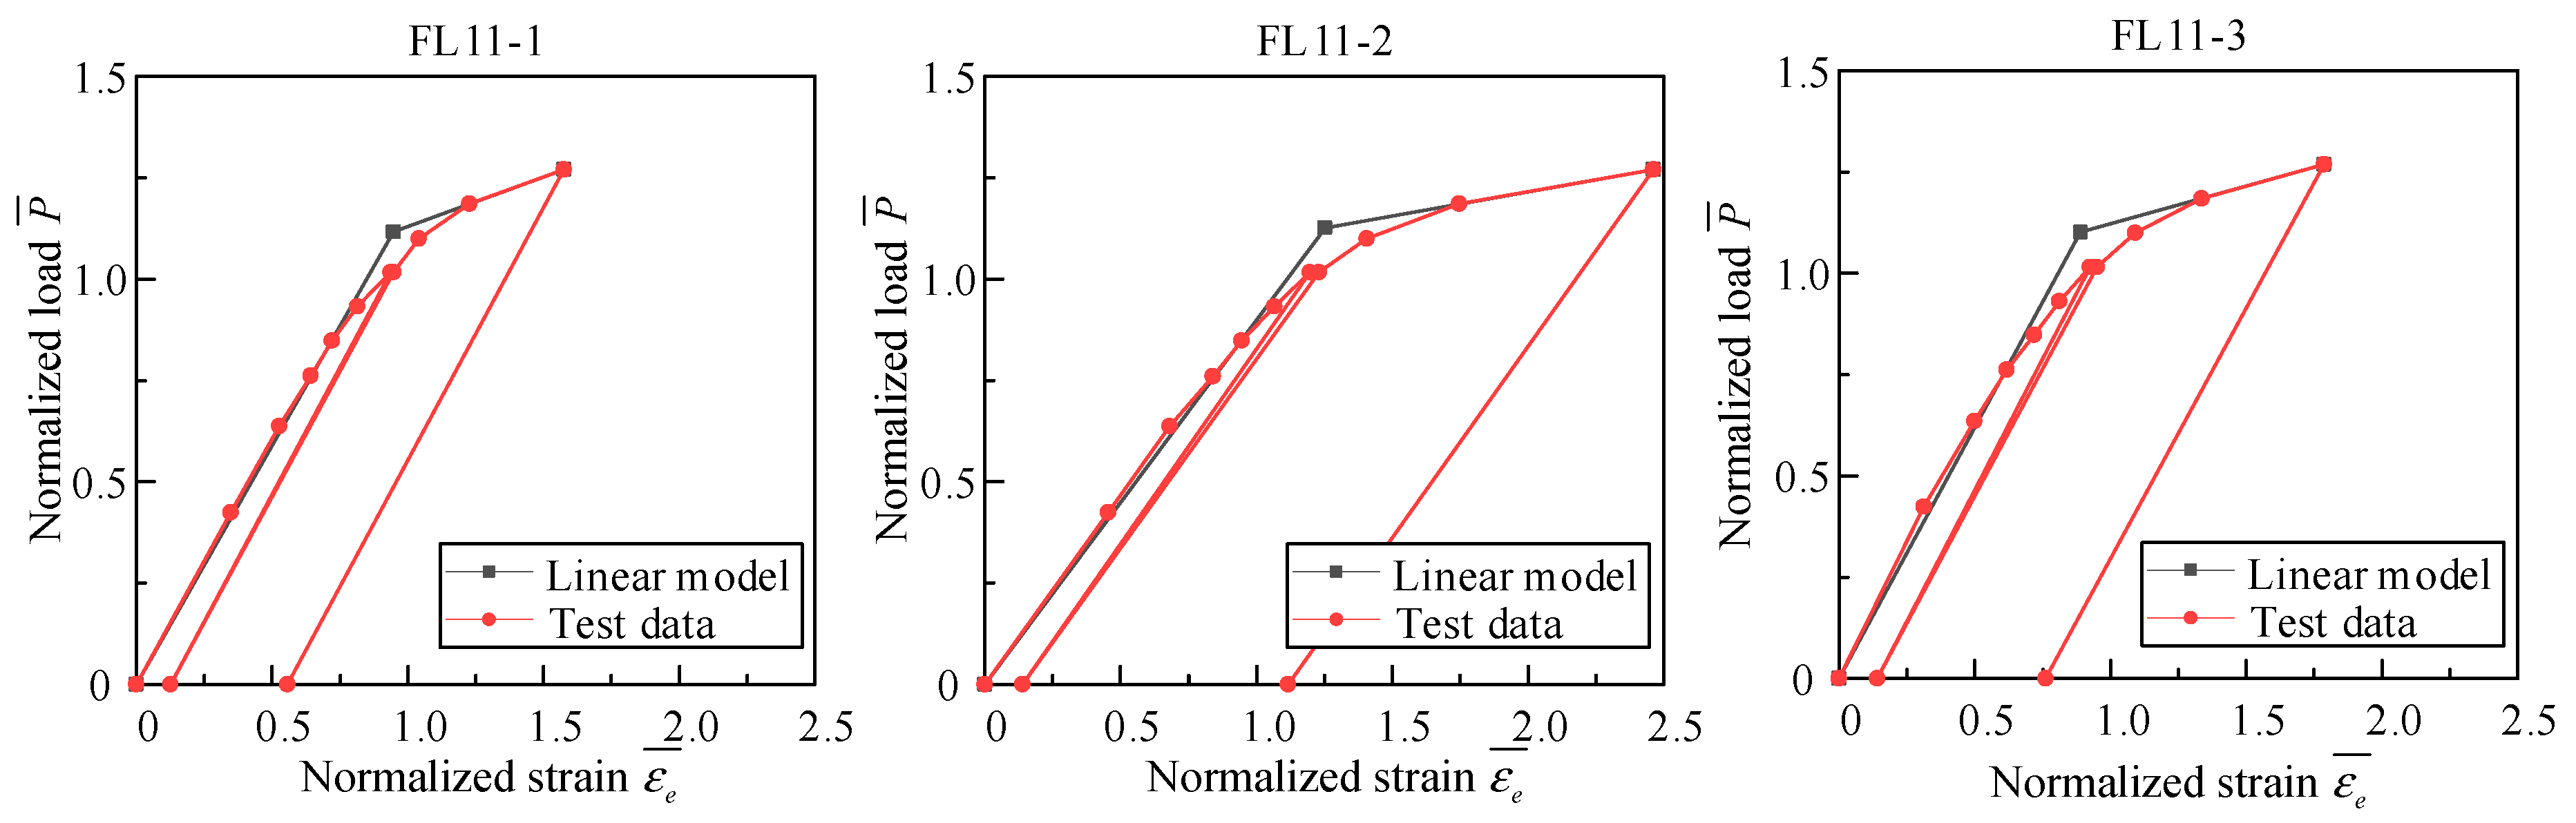
FL11 are completely identical to FL4, except for the steel material. FL4 is made of Q345B, while FL11 is made of Q420B. The objective of these specimens is to study the mechanical performance of flange joints with different materials.

2.2. Loading Program

The theoretical bearing capacity of each group of specimens was calculated according to the method in the Technical Regulation of design for tower and pole structures of overhead transmission line (DL/T 5154-2002) [19]. The bearing capacity of the bolts, steel tubes, flange plates, and stiffening rib was calculated. The minimum among them was adjusted to a standard value that is easy to control in tests, called loading control value in this paper. The loading control values of flange joints in each group are listed in Table 4. In order to observe the deformation recovery after bearing loads, the specimens would unload after loading to the certain value, and then reloaded to the certain value. During the loading process, the specimens were subjected to specific multiples of the loading control values listed in Table 4. The specimens were loaded in a sequence of 0%, 50%, 75%, 90%, 100%, 110%, 120%, 0%, 120%, 130%, 140%, 150%, 0%, 150%, and increasing 10% in subsequent steps until the specimens failed to bear load.

2.3. Measurement Setup

The strain-measuring points are set in the middle section of the steel tube, flange plate and stiffener rib. The deformation-measuring points are set in the flange plate. The strain and deformation characteristics of the flange can be observed by measuring.
Figure 4a (left), is applied to FL1 to FL3. It consists of 12 strain measuring points arranged in symmetrical positions on the specimen to observe tubes with different diameters. Due to the complex stress of the flange and the installation of strain gauges being blocked by the ribs and bolts, the strain-measuring points are arranged on the outer edge of the flange plate near the weld of the ribs (points 1, 2, 5, 6). The strain-gauge-measuring points on the stiffening rib (points 3, 4, 7, 8) are arranged at the height of 1/2 of the stiffening rib plate near the steel tube. Two pairs of measuring points (points 9, 10, 11, 12) are symmetrically arranged in the middle of the flange steel tube to measure the stress characteristics of the steel tube. Figure 4b (left), is applied from FL4 to FL11, which are composed of the same flange components. There are eight measuring points in Figure 4b. As shown in Figure 5, the measuring points on the flange plate and stiffening rib plate are only arranged on one side of the flange.
Flange plate deformation is measured by four displacement sensors near the weld at the outer edge of the flange plate, as shown in Figure 6 and Figure 7. Due to the unavoidable eccentric loading during the testing, taking the average value of the two pairs of displacement sensors on both sides of the centerline can effectively eliminate errors.

2.4. Failure Mode of Specimens

The failure of the flange joints can be divided into two modes. One of the modes is that the excessive plastic deformation on flange plate makes the flange plate no longer have the bearing capacity. In this case, plastic deformation occurs on the flange plate, leading to the failure of the joint. Another mode is that the steel tube yields first, making the joint fail to bear the load. In this case, the deformation of the flange joint is so small that the strength of the flange plate is not fully utilized. Therefore, in the design of the flange joint, the strength of the steel tube and the flange plate should be chosen rationally. The failure mode of each group is as follows.
In group FL1 (shown in Figure 8a), FL1-2 did not reach the complete failure stage due to the malfunction of the loading machine, making the deformation not obvious. FL1-1 and FL1-3 showed the first failure mode. The flange plate deformation of the thinner tube (F299B) was more significant than that of the other tube (F325L).
In group FL2 (shown in Figure 8b), the thickness of the flange plate of the specimen is 14 mm, which is smaller than the thickness of the flange plate in FL1. After testing, the deformation of the flange plate in FL2 is more obvious than the deformation of the flange plate in FL1, and the deformation of the flange plate connecting the small diameter (F299B) is also significantly larger than that of the flange plate connecting the F325L.
In group FL3 (shown in Figure 8c), the flange plates are thinner than those in FL2, making the deformation of the flange plates large. The deformation of the flange plate of F299B is significantly larger than that of the F325L.
In group FL4 (shown in Figure 8d), the theoretical values of the bearing capacity of the flange plate and the steel tube are 1510kN and 1791kN, respectively. The specimens showed the second failure mode, resulting in a small deformation of the flange plate.
In group FL5 (shown in Figure 8e), the flange plate is thinner than that in FL4. The specimens of FL5 showed the first failure mode, in which the obvious deformation of the flange plate was observed.
In group FL6 (shown in Figure 8f), the flange plate is thinner and deformed more significantly than in FL5.
In group FL7-8 (shown in Figure 8g,h), the theoretical bearing capacity of the flange plates and steel tubes is very close. The specimens showed the second failure mode, in which the flange plates deform slightly.
In group FL9 (shown in Figure 8i), the specimens showed the first failure mode, in which the flange plates deform significantly.
In group FL10 (shown in Figure 8j), there are two more bolts in the specimens than in the specimens of FL9. The specimens in FL10 showed the second failure mode. The bolt of specimen FL10-1 failed due to severe eccentric loading, leading to the termination of the test.
The only difference between FL11 (shown in Figure 8k) and FL4 is the steel material. Similar to FL4, the bearing capacities of the flange plate and steel tube are close. The specimens in FL11 showed the second failure mode, in which the flange plates deform slightly.

3. Results Analysis for Tests

3.1. Correction for Design Value of Flange Bearing Capacity

The calculation method for the flange plate with stiffening ribs in the (DL/T 5154-2002) [19] indicates that the flange bearing capacity is directly influenced by the steel strength. However, the steel strength recommended in the code is lower than in the actual situation. The theoretical value of the flange bearing capacity in the code should be corrected, as shown in Table 5. The calculation formula is as follows:
N t = N f y f
where Nt is the corrected value of the bearing capacity; N is the theoretical bearing capacity in code; f is the steel yield strength in code; and fy is the measured yield strength of steel.

3.2. Method of Flange Bearing Capacity

For the two different damage modes in 2.4, two different methods are used in this study to determine the bearing capacity. For the flange joint with the first failure mode, the bearing capacity can be determined by the way explored in this section. For a flange joint that shows the second failure mode, the bearing capacity of the flange joint can be determined directly by the strain of tube wall.
There is no relevant code for the allowable deformation (displacement, strain) of the flange plate. The bearing capacity of the specimens can be determined according to the relationship between the load and the flange plate deformation near the ribs (P-Δ curve). The P-Δ curve of the flange can be divided into three stages: (1) Pre-yield stage. When the load is small, the P-Δ curve shows linearity; (2) Yielding stage. With the increase in load, the specimen enters into the plastic stage, but shows no obvious yield; (3) Post-yield stage. After the yielding stage, the P-Δ curve shows a new linearity with a smaller slope than in the pre-yield stage. Straight lines can be fit to each of the curves in the pre-yield stage and post-yield stage, of which the intersection is the yield point.
However, the deformation is small in the beginning of loading, making the measurement error large. The P-Δ curve indirectly reflects the plastic development of the flange, especially for specimens with the second failure mode. For a specimen with the first failure mode, the Mises strain at the outer edge of flange plate shows plasticity directly. The relationship curve between the load and this strain was used to determine the flange bearing capacity.
The method of determining the bearing capacity of specimens with the first failure mode is described below. The Mises strain at the measurement point is normalized:
ε ¯ e = ε e ε y
where ε ¯ e is the normalized Mises strain; εe is the Mises strain of the steel; and εy is the yield strain of the steel. When ε ¯ e > 1 , it can be concluded that the specimen yields. Similarly, the test load P is normalized:
P ¯ = P N t
where P ¯ is the normalized load. When P ¯ > 1 , it can be concluded that the load has exceeded the corrected value of bearing capacity.
Taking the specimens of FL5 group as an example, firstly, the average value of the measurement results at strain measuring points 1 and 2 is taken as the Mises strain of the outer edge of the flange plate. Then, it is specified to obtain the ε ¯ e , while P is specified to obtain the P ¯ .
The P ¯ - ε ¯ e relationship curve is plotted, as shown in Figure 9. It can be seen that the curve can be divided into three stages:
(1)
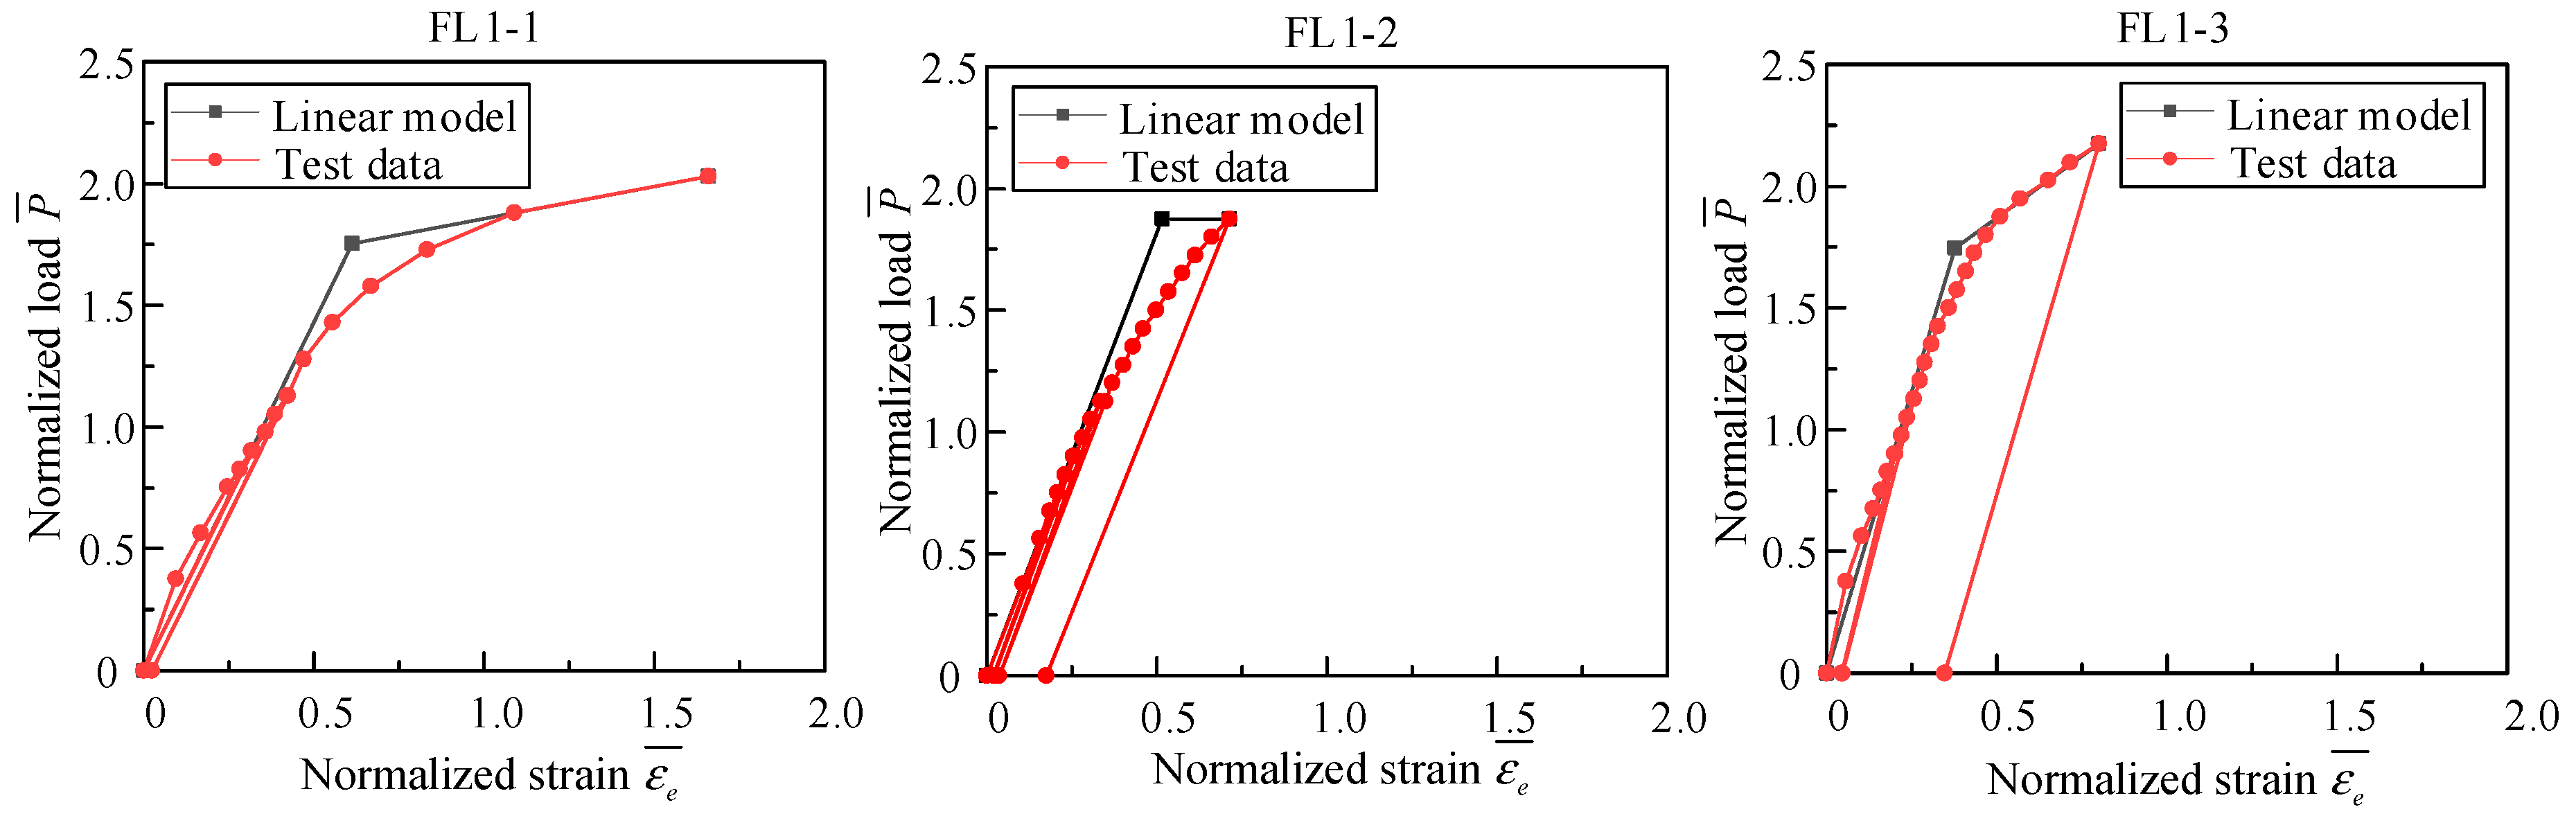
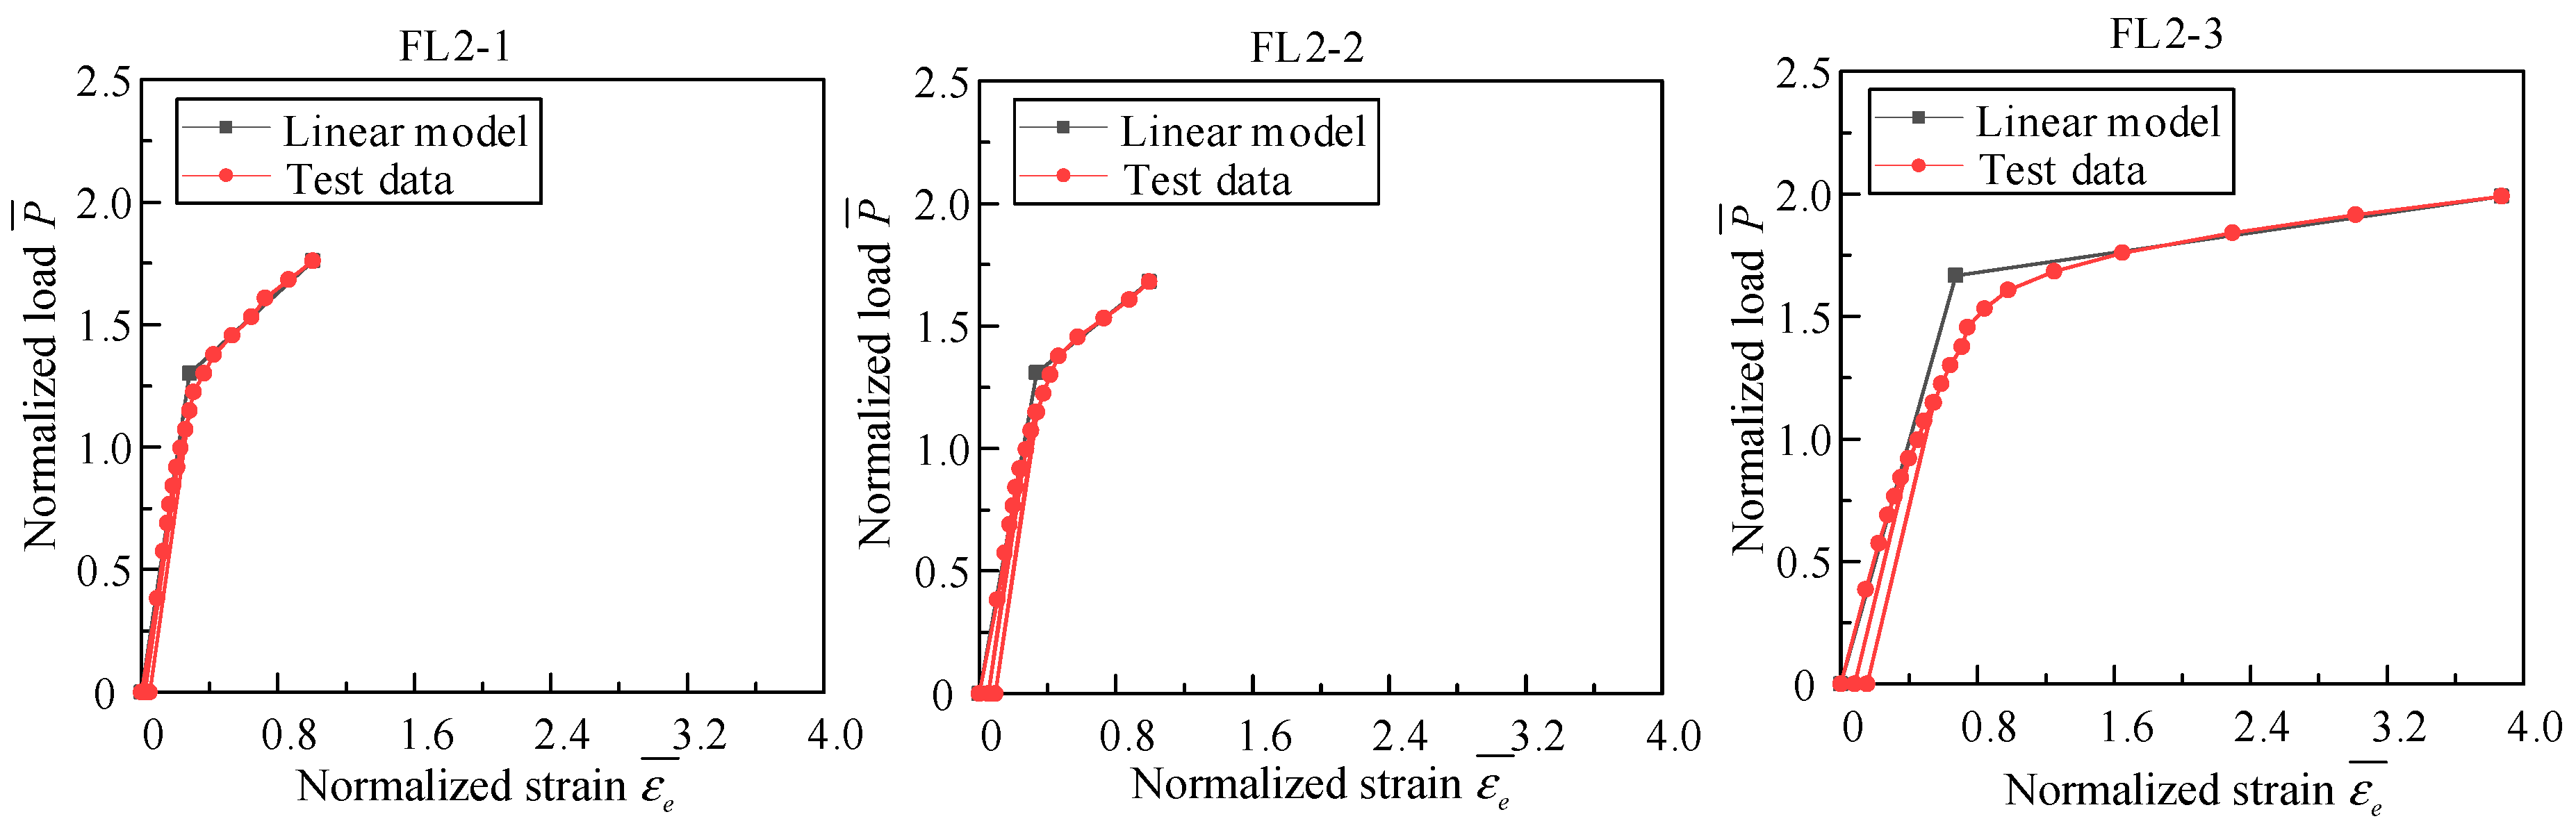
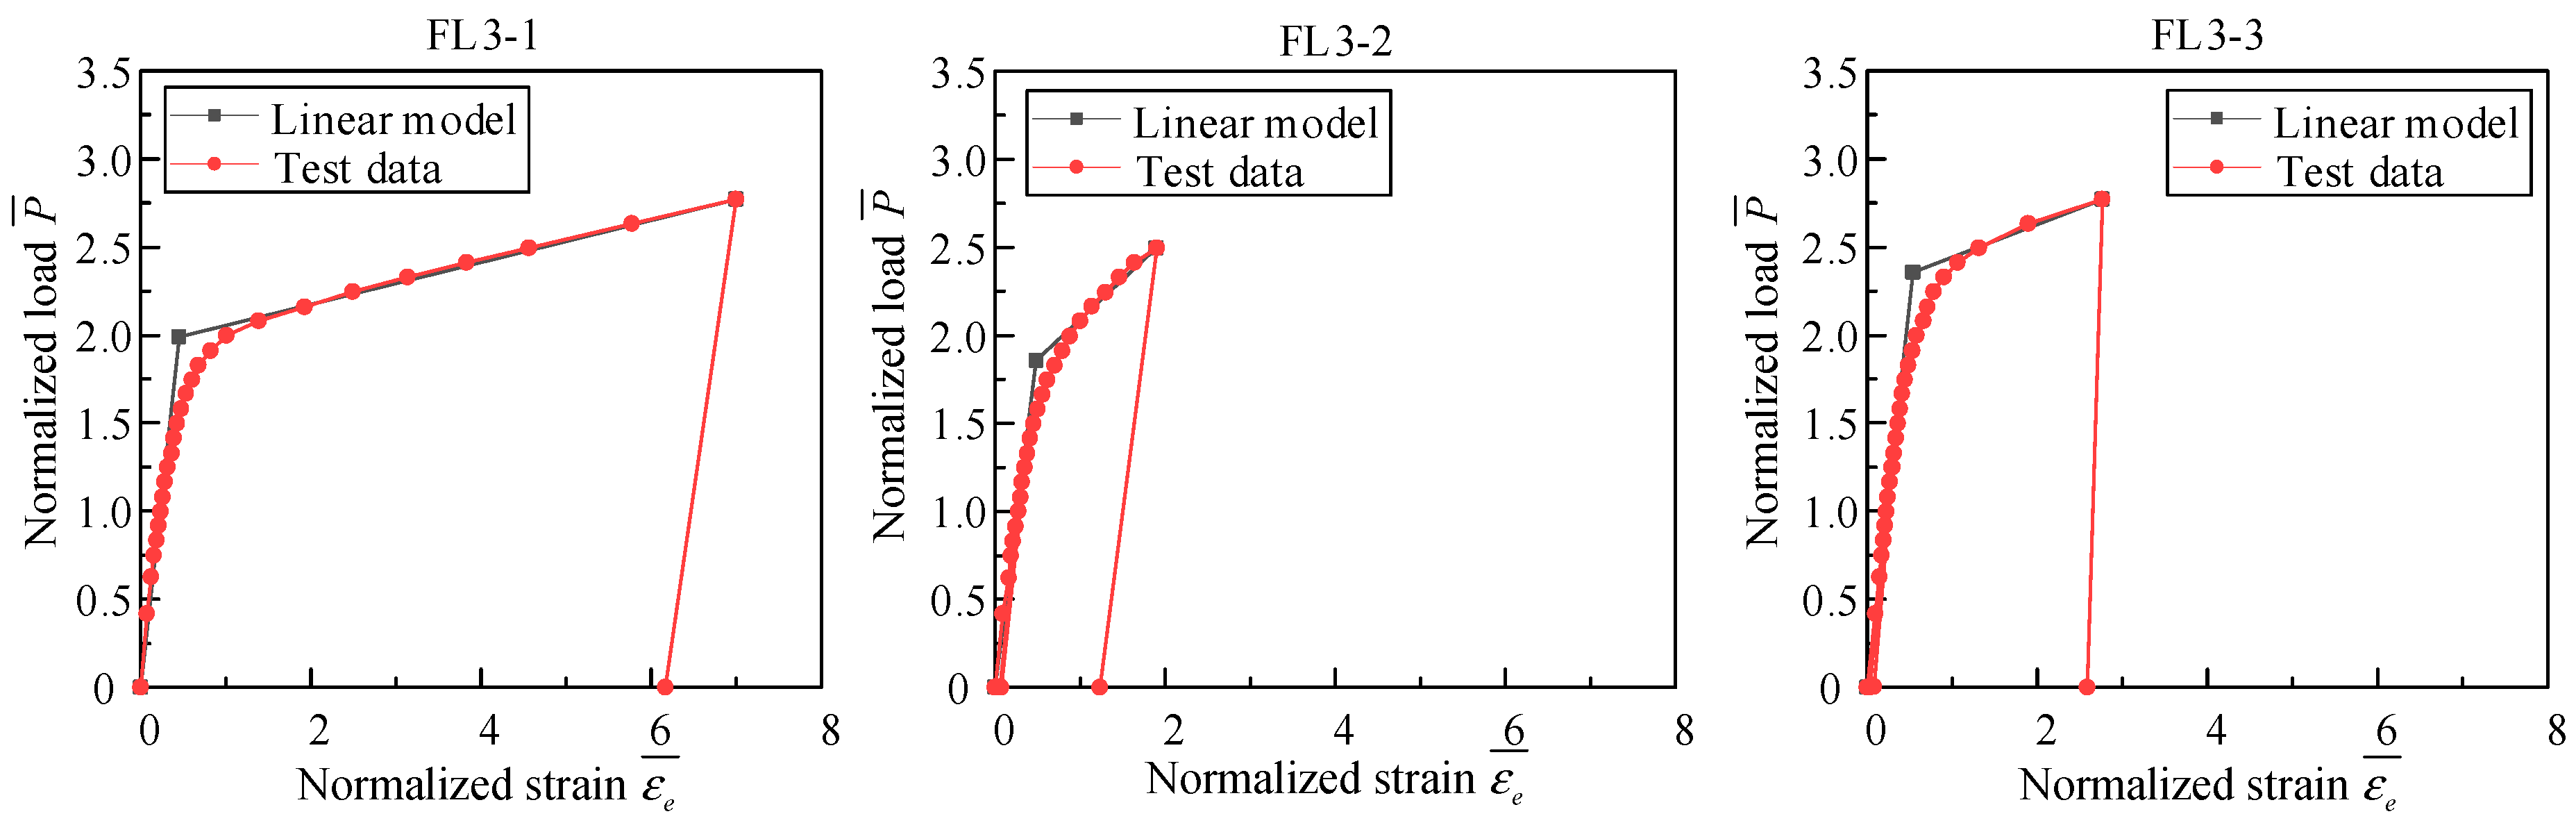
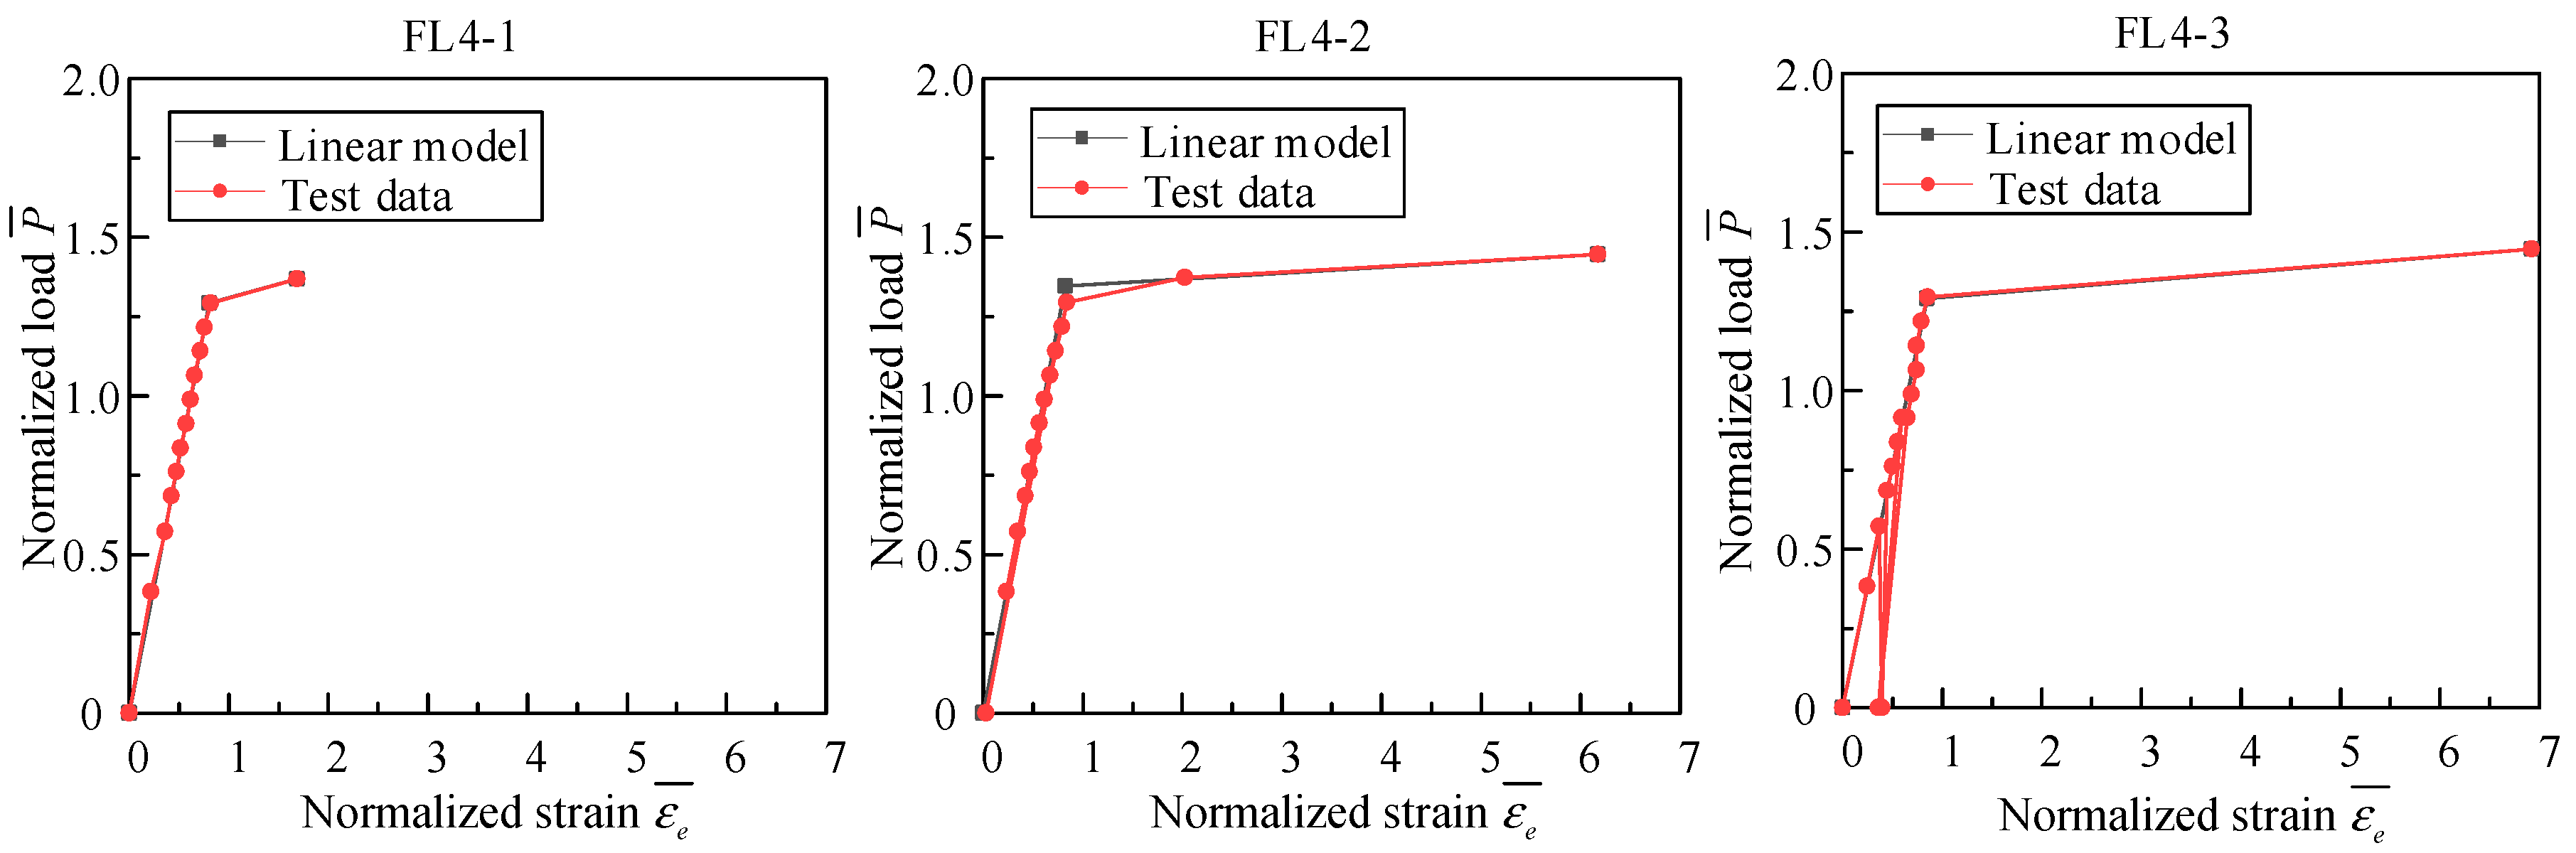
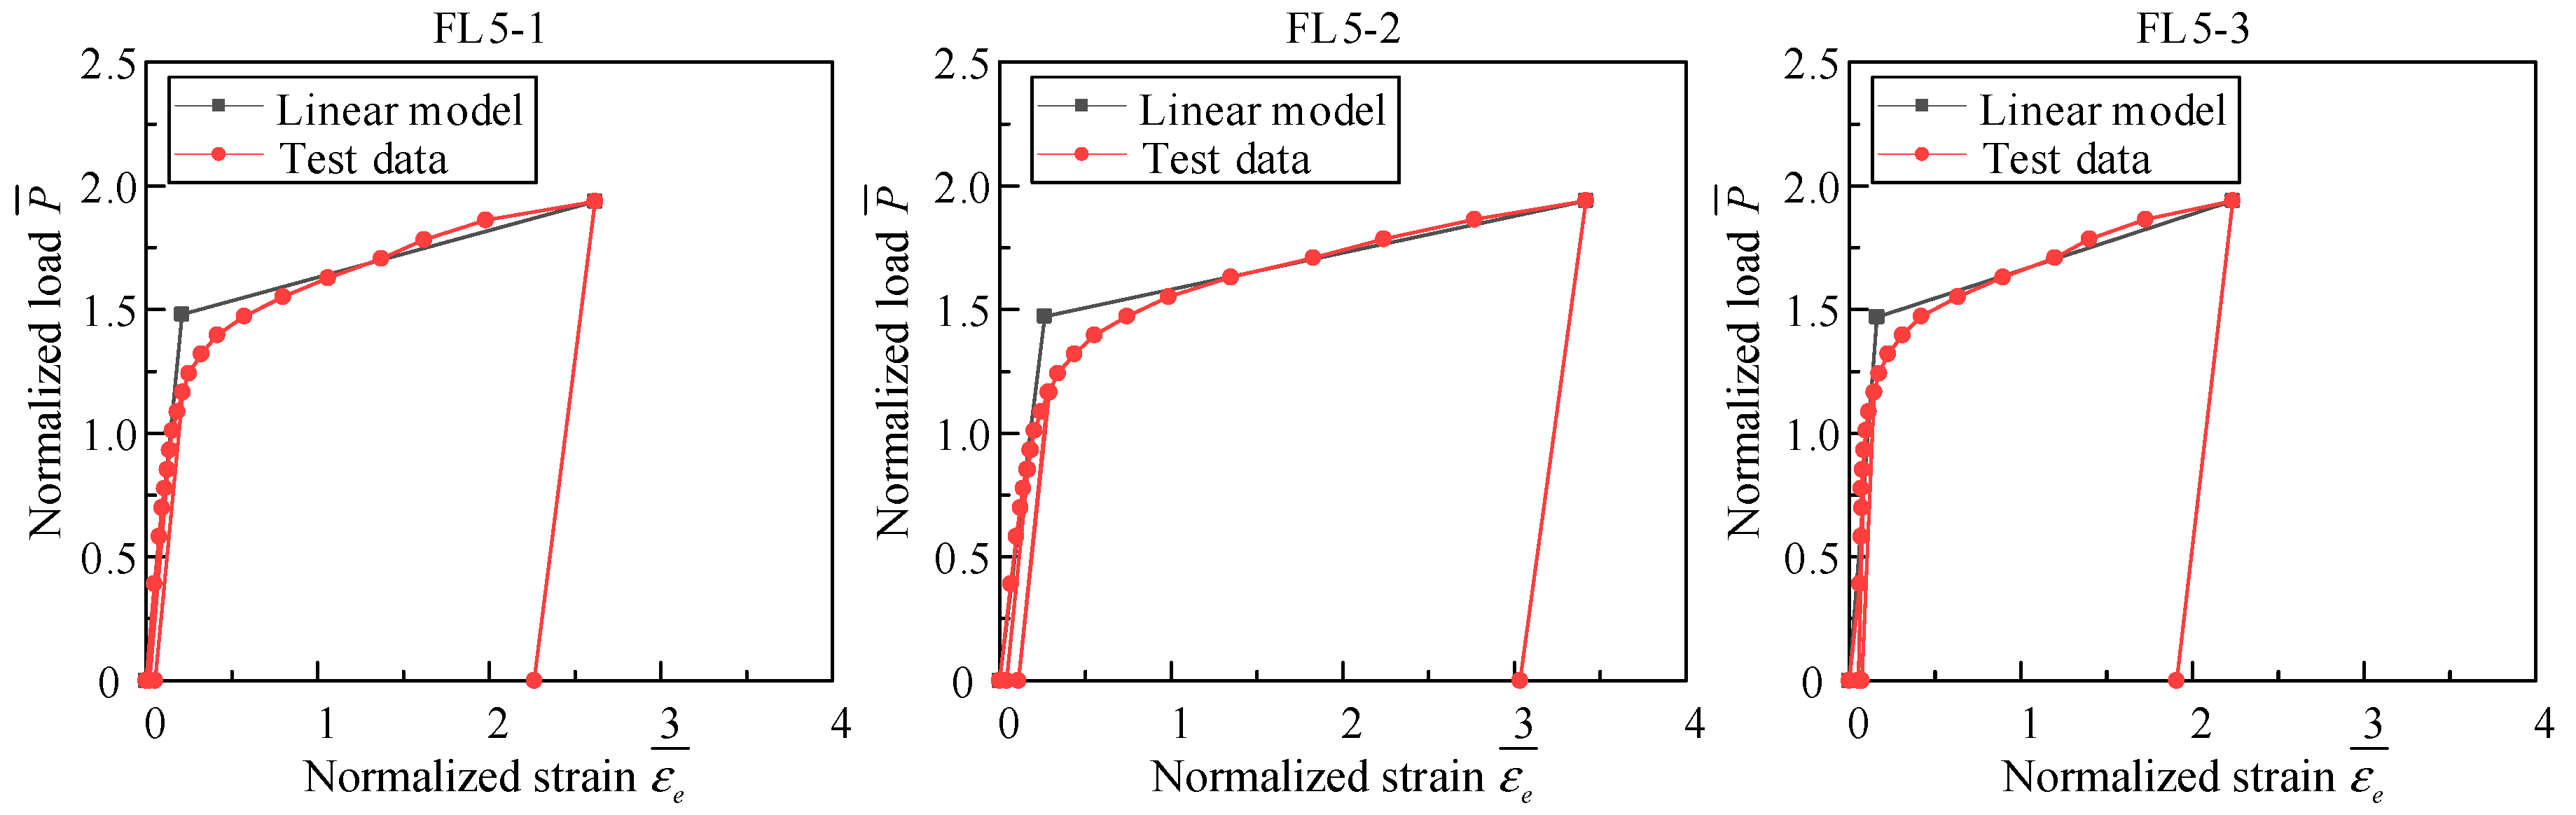
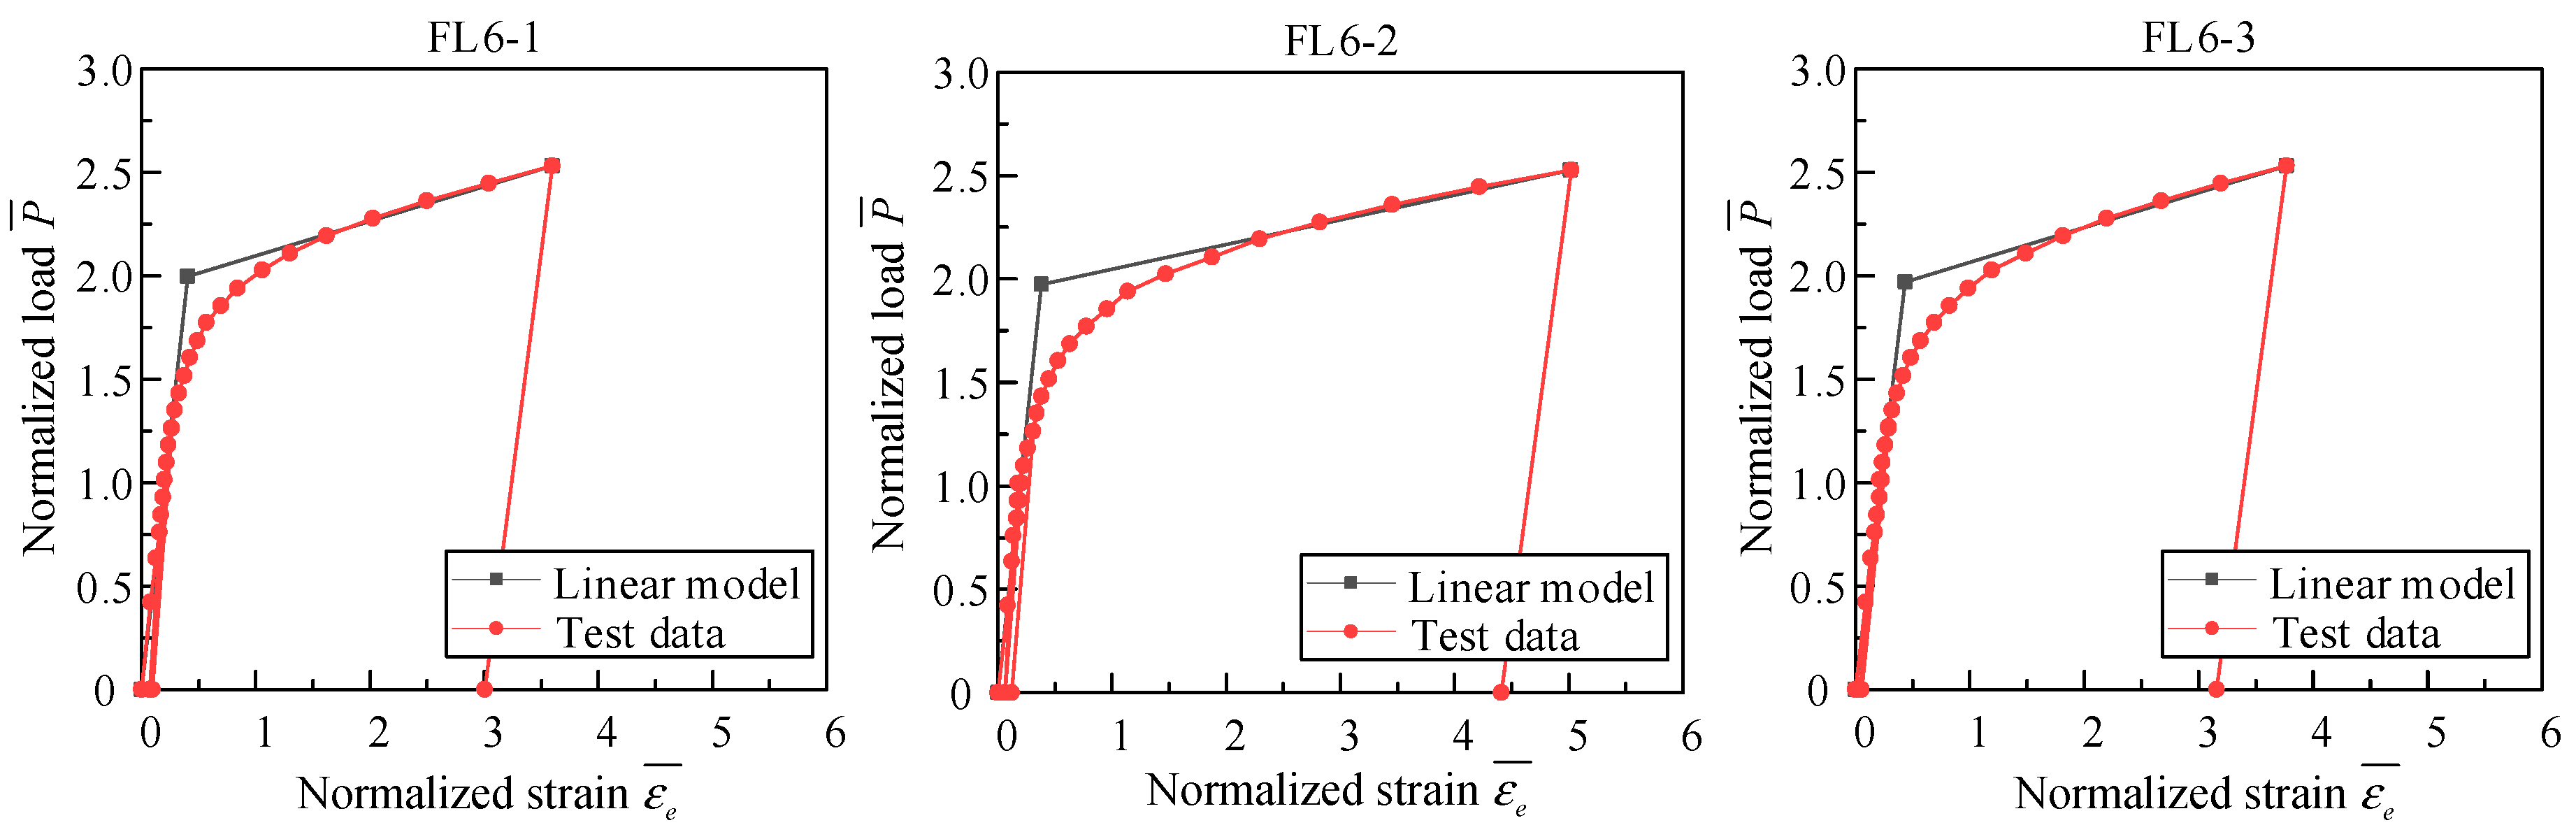
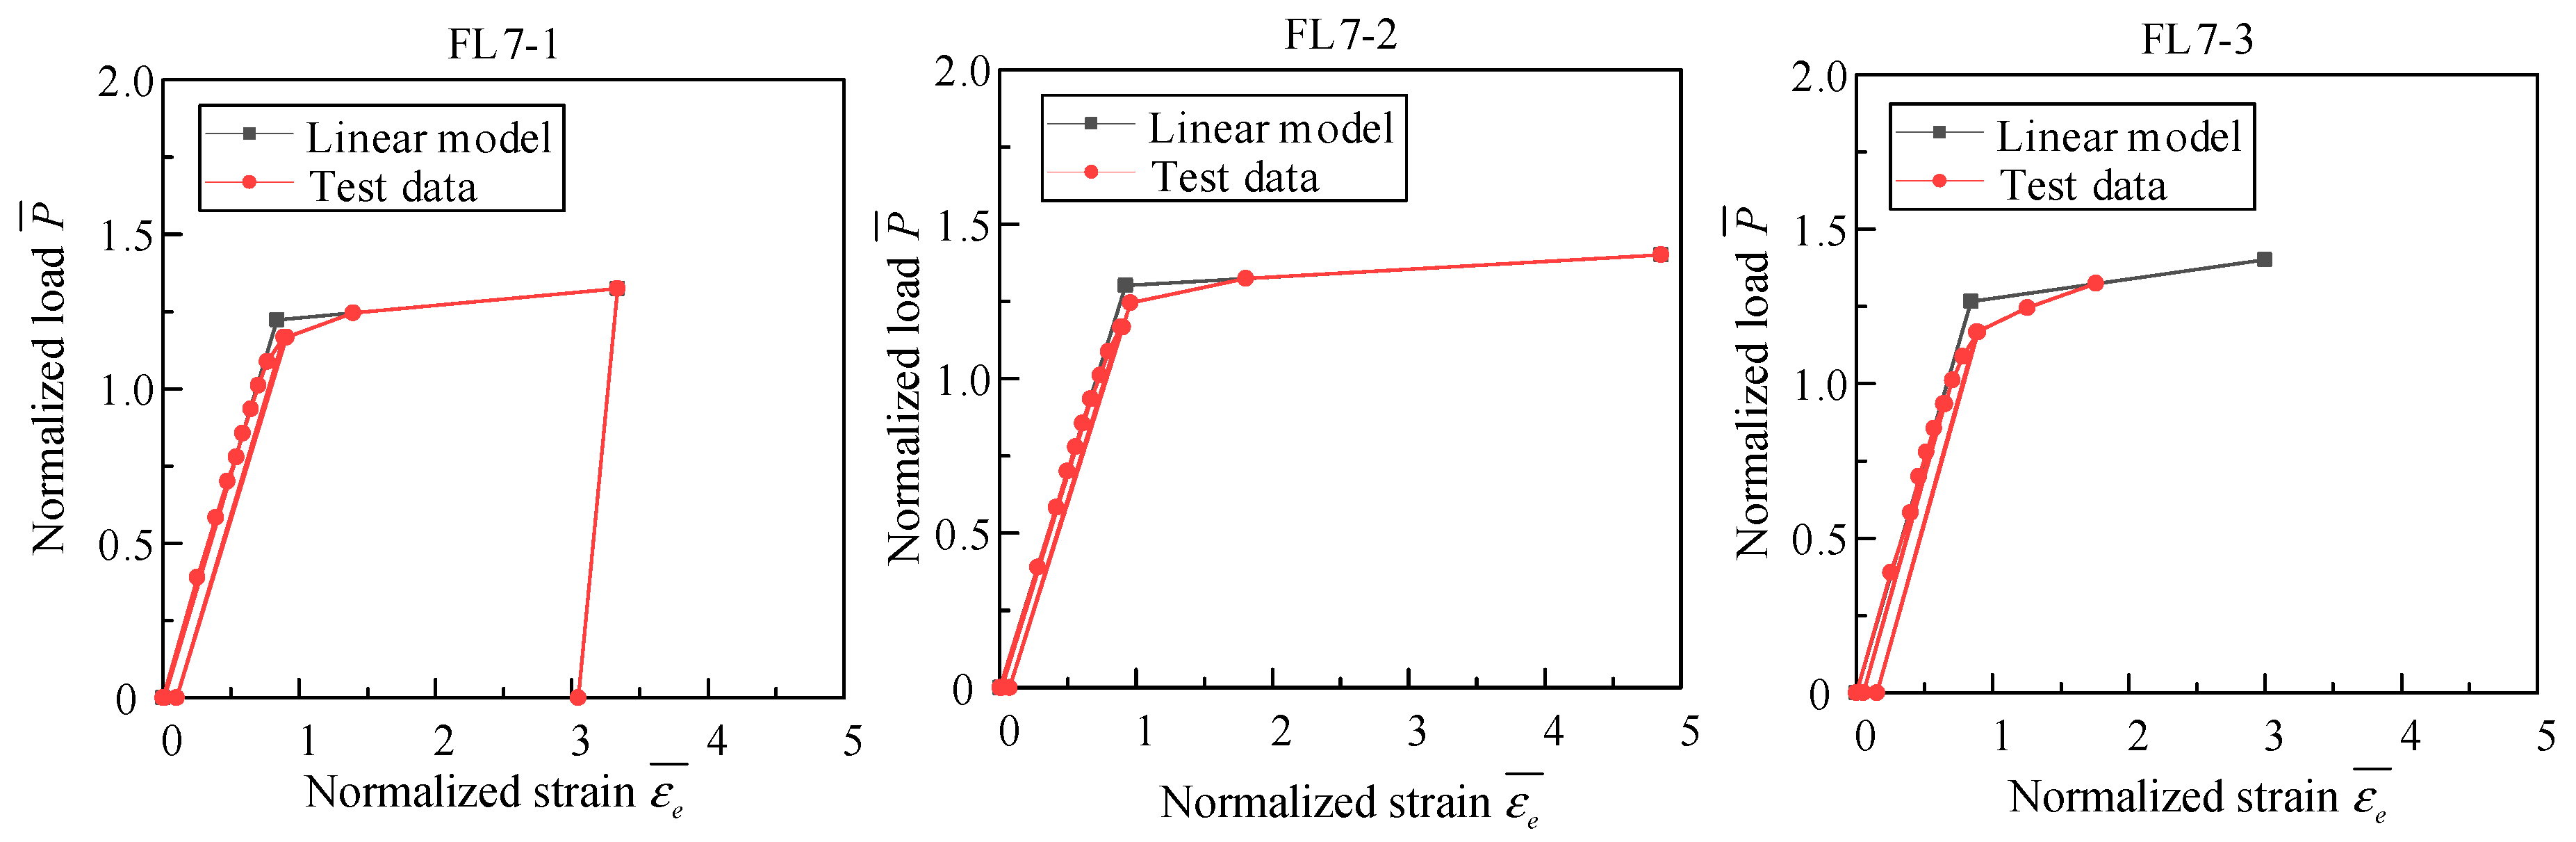
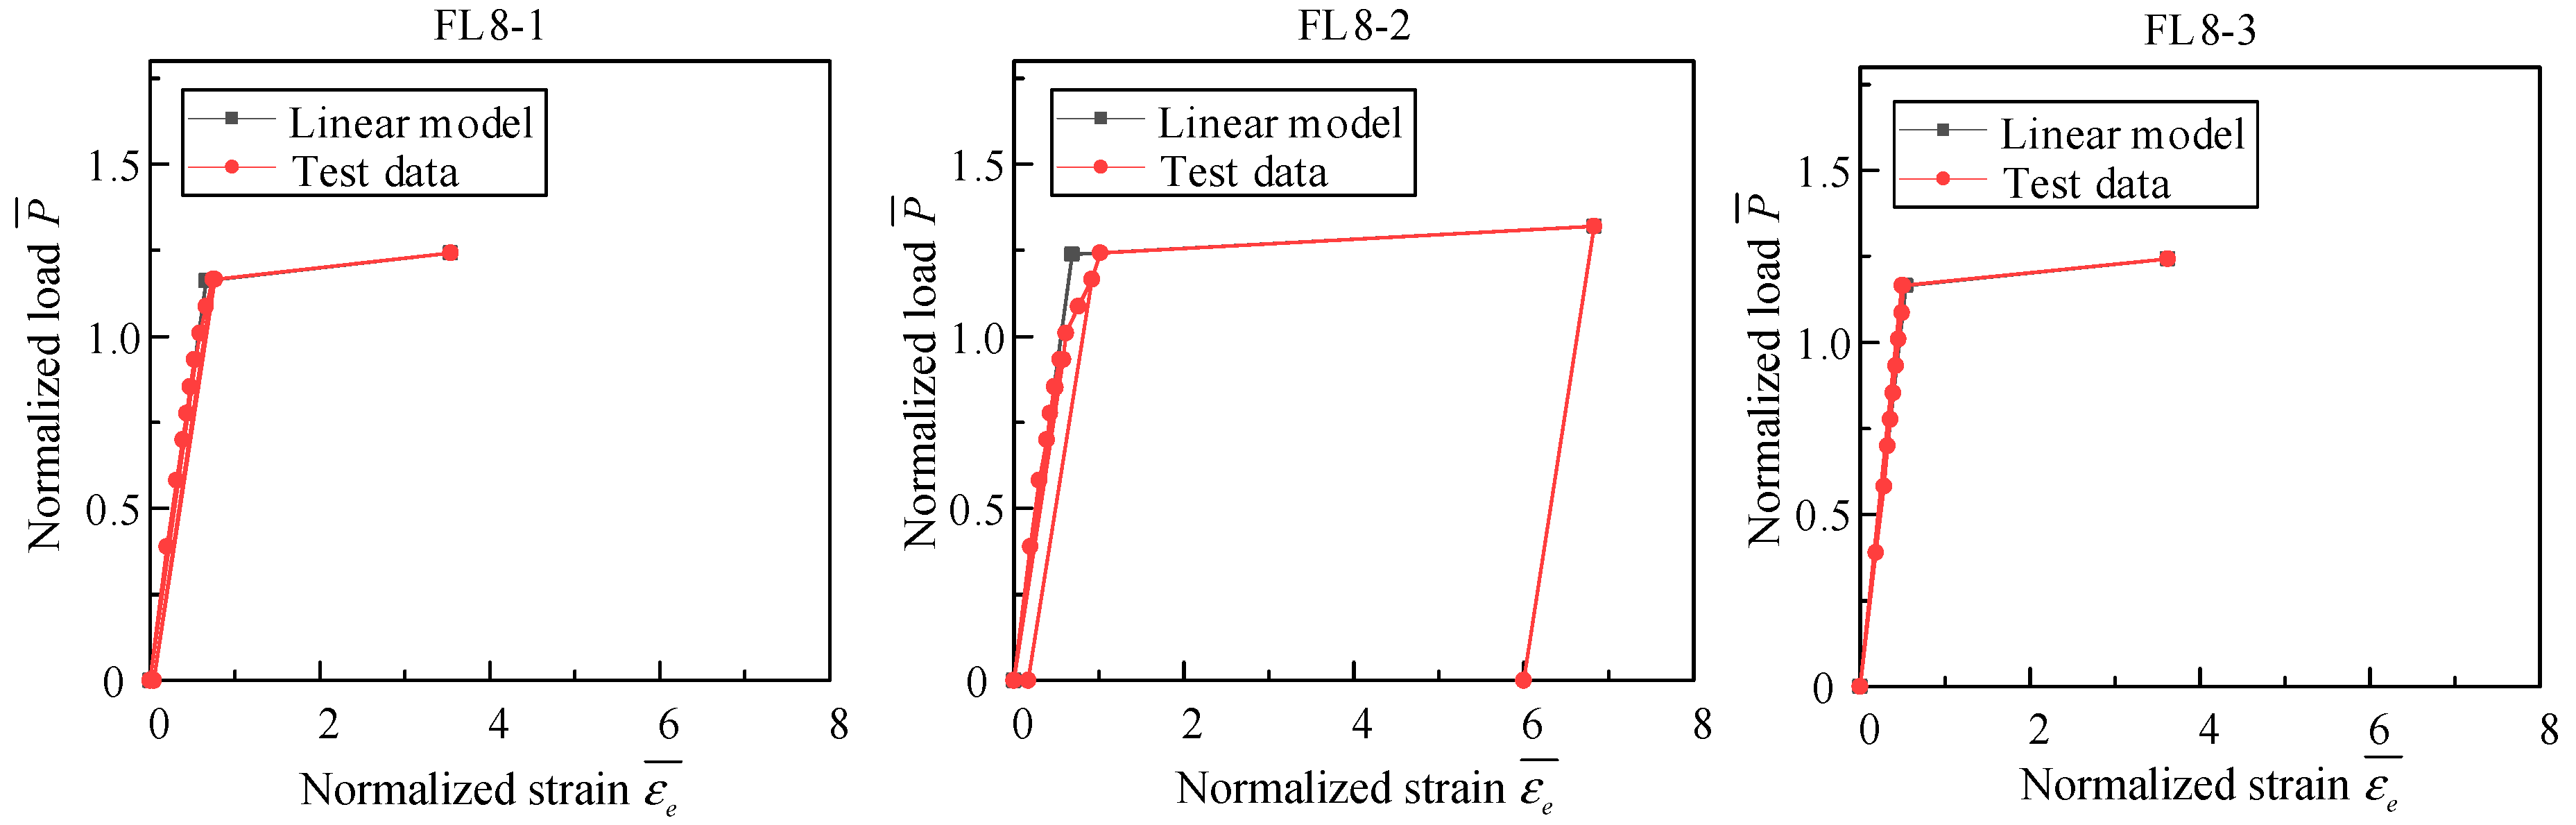
Pre-yield stage (1 to 7 load steps). Before the first unloading, P ¯ and ε ¯ e have a good linear relationship, meaning the specimen is in the elastic stage. Step 8 shows that the residual strain of the flange plate is 0.04 εy.
(2)
Yielding stage (9–18 load steps). As the load increases, the slope of the curve decreases, indicating that plastic deformation occurs on the specimen. The ε ¯ e in the 9th load step is still smaller than 1, showing that the first yield position on the specimen is not at the measuring point. At the 18th load step, the measuring point yields.
(3)
Post-yield stage (19–24 load steps). As the load increases, ε ¯ e > 1 at the measuring point. P ¯ and ε ¯ e show an approximate linear relationship, but the slope is significantly smaller than that in the pre-yield stage. The 25th load step shows that the residual strain of the measuring point is large.

3.3. The Bilinear Model for Loading Process

The bearing capacity of the flange is determined by the method mentioned in 3.2, and the P ¯ - ε ¯ e curve is simplified into a bilinear model as shown in Figure 9. The coordinates of the two key points on the bilinear model are yield point Y (0.21, 1.48) and ultimate point U (1.94, 2.62). In this study, the ordinate of yield point Y is defined as the bearing capacity of the specimens, which is 1.48 times the corrected bearing capacity.
A straight line is drawn parallel to the X axis from point Y, and the intersection Y0 with the actual loading curve is defined as the actual yield point. Then, straight lines are drawn parallel to the Y coordinate axis and O-Y, and the yield strain ε ¯ e and residual strain ε ¯ r e are obtained, which are 0.59 and 0.38, respectively. In this way, the bilinear model curves of each specimen can be obtained, as shown in Figure 10, Figure 11, Figure 12, Figure 13, Figure 14, Figure 15, Figure 16, Figure 17, Figure 18, Figure 19 and Figure 20. The actual bearing capacity of each specimen is listed in Table 6.

4. Discussion for Design

It can be seen from Table 6 that the actual bearing capacity of each specimen is higher than the corrected bearing capacity determined by the design code [19,20]. Although the flange plate thickness of FL3 (12 mm) is lower than that specified in the code (16 mm), the bearing capacity is 2.07 times the value calculated by the code. The bearing capacity calculated by code is so conservative that it can be magnified in the actual design. In addition, in case the steel tube yields first, the flange plate cannot utilize the full strength. Therefore, based on the test results, the calculation methods of flange joint in the codes (DT/T5154-2002) [19] and Code for Design of High-rising Structures (GB50135-2006) [20] are evaluated. The suggestions on the codes are mainly based on the aspects explored below.

4.1. Minimum Thickness for Flange Plate

The calculation methods for flange plate thickness in the two codes, (DT/T5154-2002) [19] and (GB50135-2006) [20], are the same. The flange plate’s bending moment calculation method in the codes is based on a three-sided supported rectangular plate model with uniformly distributed loads, as shown in Figure 21. The specific calculation method is as follows.
Let the tension force on the flange be N and the number of bolts on the flange plate be n. The tension force on a single bolt is as follows:
N t b = N / n
The flange plate is divided into n equal parts by the ribs. Each part can be approximately regarded as a rectangular plate with three sides simply supported and one side free, with a size of Lx × Ly. Assuming that the tension borne by the bolt is evenly distributed to the rectangular plate, the uniformly distributed load on the rectangular plate can be calculated according to the following formula:
q = N t b L x L y
The maximum bending moment per unit plate width is as follows:
M o x = β q L x 2
where β is the bending moment coefficient. The relationship between β and Lx/Ly is shown in Figure 22.
The thickness of the flange plate recommended by the codes is as follows:
t 5 M o x f
FL1, FL2, FL3 and FL6 show the first failure mode in which the flange plate yields first. These groups are selected to evaluate the flange plate’s calculating formula in the code. The ratio of measured bearing capacity in the tests to that in the code is between 1.4 and 2.07. The strain at the measured point on the flange plate is 0.66 to 1.11 times the yield strain, and the residual strain is 0.17 to 0.70 times the yield strain. The flange plate’s bearing capacity calculation formula in the codes is so conservative that enlarging it by 1.2 times is reasonable, as shown in Formula (9).
t 1 1.2 5 M o x f
There are two main reasons for controlling the thickness of the flange plate. The first reason is to control the deformation of the flange plate in manufacturing. The thinner the flange plate, the smaller the rigidity, making it easier to deform in manufacturing such as cutting, drilling, and welding. In this paper, the thickness of the thinnest flange plate is 12mm. When welding the stiffening ribs, a pair of flanges are fixed with pins and then welded, which effectively controls the welding deformation. The flange plate meets the requirement that the curvature does not exceed 1/1000. The second reason is to control the deformation of the flange under loads. In many situations, the greater the thickness of the flange plate, the greater the bearing capacity of it, and the smaller the deformation of it under the same load.
The flange plate thickness of the three groups (FL2, FL3, FL6) is less than 16mm. The measured bearing capacity of the three groups is larger than that in codes, and flange deformation is in the acceptable range during testing. For groups with a thinner tube (FL4, FL5, FL7, FL8), the bearing capacity of the flange plate is larger than the bearing capacity of the steel tube, making the tube walls yield first. The bearing capacity of the flange plate cannot be fully utilized. Therefore, it is recommended to enlarge the minimum ribbed flange plate thickness in codes to 14 mm.

4.2. Joint with Different Tubes

FL1–FL3 are flange joints with flange components of F325L and F299B. The outer edges of two flange plates of tubes overlap. Therefore, the area of the flange plate in a F299B thinner tube is large, making the carrying capacity of flange plate strong in theory. The results show that the deformation of F299B is greater than that of F325L. Therefore, in actual engineering design, the deformation of the flange plate on both sides should be equal by increasing the flange plate thickness of thinner tube, or reducing the flange plate thickness of thicker tube. In this way, the performances of the flange plates on both sides will be utilized.

4.3. Bearing Capacity Matching for Tube and Flange

In order to utilize to the plastic deformation capacity of the flange plate and protect the structure, a reasonable steel tube and flange plate bearing capacity ratio should be established. The bearing capacity of flange plate should be matching with that of the steel tube to ensure that the strength of both is fully utilized. The design bearing capacities of the steel tube and flange plate in this test are listed in Table 7. The bearing capacity ratio of the steel tube and flange plate where the tube wall yields first is between 1.18 and 1.31. The flange plates of FL5 yield first, and the tube wall yields when it reaches 1.6 times the design load. It can be regarded as the critical state of the two failure modes. The bearing capacity ratio of the steel tube and flange is 1.71. Therefore, it is recommended that the bearing capacity ratio of the steel tube and flange should be greater than 1.7.

5. Conclusions

In this paper, 11 groups of flange joint specimens were manufactured, which were tested to investigate the influence of five parameters on mechanical behaviors under axial tensile loading. The failure modes and the bearing capacity of specimens were recorded in tests. The calculation method for the flange joint in the design code was evaluated according to an analysis of the testing results. Practical suggestions in flange joint design were proposed. Detailed studies for flange joints with different tubes need to be conducted, including, for example, a study on different rib arrangements on two sides for special flange joints. This study’s conclusions are as follows:
(1)
There are two main failure modes of flange joint specimens. One mode is that the flange plates deform significantly while the steel tube does not yield, making the bearing capacity of the flange joint ultimately lost. Another mode is that the steel tube yields while the deformation of the flange joint is small, resulting in structural softening and load-bearing capacity loss.
(2)
The calculation method for the bearing capacity of flange joint in the Chinese design code is conservative. The testing result is about 1.2 times that of the calculation method in code.
(3)
The minimum thickness of the flange plate should be taken to 14mm. For a flange joint with a different tube, the flange plate of the thinner tube should be thickened to make the deformation of the flange plates on both sides equal. And thinning the flange plate of the thick tube also works.
(4)
In order to fully utilize the bearing capacity of the flange plate and steel tube, their parameters should be chosen more rationally in the design. The ratio of the bearing capacity of the steel tube to the flange plate should be greater than 1.7.

Author Contributions

Conceptualization, J.S. and W.L.; methodology, Y.Z.; software, L.Z.; validation, J.H. and C.Z.; formal analysis, J.S.; investigation, W.L.; resources, G.Z.; data curation, Y.Z.; writing—original draft preparation, J.S.; writing—review and editing, W.L.; visualization, J.H.; supervision, G.Z.; project administration, L.Z.; funding acquisition, L.Z. All authors have read and agreed to the published version of the manuscript.

Funding

The research was financially supported by the Eighth National “Ten Thousand Talents Plan for Top Young Talents” and the National Natural Science Foundation of China (52378120).

Data Availability Statement

The data provided in this study could be released upon reasonable request. The authors state that all data, models and code generated or used during this study are available from the corresponding author by request. The responsibility for scientific accuracy and content remains entirely with the authors.

Acknowledgments

The authors express thanks to the people who helped with this work, and acknowledge the valuable suggestions from the peer reviewers.

Conflicts of Interest

Author Yaoyu Zhu was employed by the company CCCC Highway Bridges National Engineering Research Center Co., Ltd. The remaining authors declare that the research was conducted in the absence of any commercial or financial relationships that could be construed as a potential conflict of interest.

References

  1. Huang, F.; Zhang, D.; Hong, W.; Li, B. Mechanism and calculation theory of prying force for flexible flange connection. J. Constr. Steel Res. 2017, 132, 97–107. [Google Scholar] [CrossRef]
  2. Wang, Y.; Zong, L.; Shi, Y. Bending behavior and design model of bolted flange plate connection. J. Constr. Steel Res. 2013, 84, 1–16. [Google Scholar] [CrossRef]
  3. Kato, B.; Hirose, R. Bolted tension flanges joining circular hollow section members. J. Constr. Steel Res. 1985, 5, 79–101. [Google Scholar] [CrossRef]
  4. Kato, B.; Mukai, A. Bolted tension flanges joining square hollow section members. J. Constr. Steel Res. 1985, 5, 163–177. [Google Scholar] [CrossRef]
  5. Tao, Y.; Liu, X.; Chen, X.; Cui, W.; Guo, L. Analysis and design of column splicing flange joints with different weld types. J. Constr. Steel Res. 2024, 212, 108324. [Google Scholar] [CrossRef]
  6. Cao, J.; Bell, A. Determination of bolt forces in a circular flange joint under tension force. Int. J. Press. Vessel. Pip. 1996, 68, 63–71. [Google Scholar] [CrossRef]
  7. Wang, Y.; Zong, L.; Shi, Y. Comparative study on existing design methods for flange-plate connections of steel tubular structures. Sichuan Build. Sci. 2012, 38, 18–22. (In Chinese) [Google Scholar]
  8. Cao, L.; Chen, P. Design standard development and design method analysis of flange in USA and EU. Pipeline Technol. Equip. 2019, 2, 36–40. (In Chinese) [Google Scholar]
  9. Kim, Y.; Madugula, M. Behavior of bolted circular flange connections subject to tensile loading. Int. J. Steel Struct. 2010, 10, 65–71. [Google Scholar] [CrossRef]
  10. Van-Long, H.; Jean-Pierre, J.; Jean-François, D. Behaviour of bolted flange joints in tubular structures under monotonic, repeated and fatigue loadings I: Experimental tests. J. Constr. Steel Res. 2013, 85, 1–11. [Google Scholar] [CrossRef]
  11. Reza, M.; Bursi, O.; Paolacci, F.; Kumar, A. Enhanced seismic performance of non-standard bolted flange joints for petrochemical piping systems. J. Loss Prev. Process Ind. 2014, 30, 124–136. [Google Scholar] [CrossRef]
  12. Luan, Y.; Guan, Z.; Cheng, G.; Cheng, G.; Liu, S. A simplified nonlinear dynamic model for the analysis of pipe structures with bolted flange joints. J. Sound Vib. 2012, 331, 325–344. [Google Scholar] [CrossRef]
  13. Couchaux, M.; Hjiaj, M.; Ryan, I.; Bureau, A. Bolted circular flange connections under static bending moment and axial force. J. Constr. Steel Res. 2019, 157, 314–336. [Google Scholar] [CrossRef]
  14. Couchaux, M.; D’Aniello, M.; Falciano, L.; Faggiano, B.; Hjiaj, M.; Landolfo, R. Finite Element Simulations on the Tensile Resistance of Bolted End-Plate Connections with Tubular Members. Open Constr. Build. Technol. J. 2018, 12, 177–186. [Google Scholar] [CrossRef]
  15. Willibald, S.; Puthli, R.; Packer, J.; Packer, J. Experimental Study of Bolted Flange, Plate Connections For Square Hollow Section Tension Members. In Proceedings of the the Ninth International Offshore and Polar Engineering Conference, Brest, France, 30 May–4 June 1999. [Google Scholar]
  16. Hou, K.; Zhang, D.; Xu, J.; Wang, J.; Xu, J. Axial tensile test and design method of special-shaped rigid flange. J. Constr. Steel Res. 2022, 197, 107490. [Google Scholar] [CrossRef]
  17. Li, Q.; Xu, C.; Luo, Z.; Huang, F.; An, Y.; Zhang, D.; Liu, P. Experiment and design methodology of an IODR flange connection under bending load. J. Constr. Steel Res. 2023, 201, 107744. [Google Scholar] [CrossRef]
  18. Zhang, Y.; Huang, Z.; Li, Y.; Jin, B.; Cheng, X.; Cheng, M. Experimental and numerical investigation of prefabricated prestressed vertical steel strand core tube flange column connection joint. J. Constr. Steel Res. 2022, 190, 107124. [Google Scholar]
  19. DL/T 5154-2002; Technical Regulation of Design for Tower and Pole Structures of Overhead Transmission Line. China Electric Power Publisher: Beijing, China, 2002. (In Chinese)
  20. GB50135-2006; Code for Design of High-Rising Structures. China Planning Press: Beijing, China, 2007. (In Chinese)
Figure 1. Geometric diagram of rigid flange.
Buildings 14 02282 g001
Figure 2. Installation of flange specimen.
Buildings 14 02282 g002
Figure 3. Installation and arrangement of flange. (a) On-site installation of flange specimen; (b) flange in place on the testing machine.
Buildings 14 02282 g003
Figure 4. Layout diagram of strain measuring point. (a) Arrangement of strain-measuring points for flange with different diameters; (b) arrangement of strain-measuring points for flange with the same diameter.
Buildings 14 02282 g004
Figure 5. Strain-measuring points on flange plate and rib.
Buildings 14 02282 g005
Figure 6. Arrangement of deformation-measuring point.
Buildings 14 02282 g006
Figure 7. Installation photo of deformation-measuring point.
Buildings 14 02282 g007
Figure 8. Deformation states of each group.
Buildings 14 02282 g008aBuildings 14 02282 g008b
Figure 9. P ¯ - ε ¯ e relationship curve.
Buildings 14 02282 g009
Figure 10. Normalized load–normalized strain curve of FL1.
Buildings 14 02282 g010
Figure 11. Normalized load–normalized strain curve of FL2.
Buildings 14 02282 g011
Figure 12. Normalized load–normalized strain curve of FL3.
Buildings 14 02282 g012
Figure 13. Normalized load–normalized strain curve of FL4.
Buildings 14 02282 g013
Figure 14. Normalized load–normalized strain curve of FL5.
Buildings 14 02282 g014
Figure 15. Normalized load–normalized strain curve of FL6.
Buildings 14 02282 g015
Figure 16. Normalized load–normalized strain curve of FL7.
Buildings 14 02282 g016
Figure 17. Normalized load–normalized strain curve of FL8.
Buildings 14 02282 g017
Figure 18. Normalized load–normalized strain curve of FL9.
Buildings 14 02282 g018
Figure 19. Normalized load–normalized strain curve of FL10.
Buildings 14 02282 g019
Figure 20. Normalized load–normalized strain curve of FL11.
Buildings 14 02282 g020
Figure 21. Calculation diagram of rigid flange.
Buildings 14 02282 g021
Figure 22. Calculation curve of bending moment coefficient.
Buildings 14 02282 g022
Table 1. Flange joints information.
GroupNumberMaterialFlange Component AFlange Component BObjectives
FL13Q345BF325L-16F299B-16(a)
FL23Q345BF325L-14F299B-14
FL33Q345BF325L-12F299B-12
FL43Q345BF245B-16F245B-16(b,e)
FL53Q345BF245B-14F245B-14(b)
FL63Q345BF245B-12F245B-12
FL73Q345BF245B-R186F245B-R186(c)
FL83Q345BF245B-R170F245B-R170
FL93Q345BF325E-8MF325E-8M(d)
FL103Q345BF325E-10MF325E-10M
FL113Q420BQ420-F245BQ420-F245B(e)
Table 2. Flange geometry.
Flange ComponentTube Diameter (mm)Flange Plate Thickness (mm)Bolt Hole (mm)Rib Plate Thickness (mm)
F299B-16Φ299 × 10168Φ2612
F299B-14Φ299 × 10148Φ2612
F299B-12Φ299 × 10128Φ2612
F325L-16Φ325 × 10168Φ2610
F325L-14Φ325 × 10148Φ2610
F325L-12Φ325 × 10128Φ2610
F245B-16Φ245 × 81610Φ2614
F245B-14Φ245 × 81410Φ2614
F245B-12Φ245 × 81210Φ2614
F245B-R186Φ245 × 81610Φ2614
F245B-R170Φ245 × 81610Φ2614
F325E-8MΦ325 × 10168Φ2614
F325E-10MΦ325 × 101610Φ2614
Q420-F245BΦ245 × 81610Φ2614
Table 3. The measured strength values of the steel used in the specimen.
MaterialMaterial BehaviorSize (mm)Yield Strength (MPa)Tensile Strength (MPa)Elongation (%)
Steel tubeQ345BΦ245 × 840054530
Φ299 × 1039054029
Φ323 × 1240552027
Φ323 × 1042555029
Steel plateQ345B639553528
1042053528
1239054027
1441553828
1640550527
1842057530
Q420B845559529
1445860229
1646159328
Table 4. Theoretical bearing capacity of flange.
GroupFlange ComponentTheoretical Bearing Capacity (kN)Loading Control Values (kN)
BoltSteel TubeFlange PlateRib Shearing StressRib Principal StressMinimum Value
FL1F325L-169024326310201872229710201000
F299B-1690243009103927303002
FL2F325L-149024326378118722297781800
F299B-149024300979527303002
FL3F325L-129024326357418722297574600
F299B-129024300979527303002
FL4F245B-1614,100197115104586375815101500
FL5F245B-1414,100197111564586375811561200
FL6F245B-1214,100197184945863758849900
FL7F245B-R18614,100197115754586452815751600
FL8F245B-R17014,100197116774586605316771700
FL9F325E-8M11,761326310344032444410341000
FL10F325E-10M14,100326313864536450013861400
FL11Q420-F245B14,100241618515351460718511900
Table 5. Correction value of flange theoretical bearing capacity.
GroupDesign Value of Strength f (MPa)
Bearing Capacity of Joint N (kN)
Measured Value of Strength fy (MPa)
Corrected Value of Bearing Capacity Nt (kN)
④ = ② × ③/①
FL131010204051333
FL23107814151046
FL3310574390722
FL431015104051973
FL531011564151548
FL63108493901068
FL731015754052058
FL831016774052191
FL931010344051351
FL1031013864051811
FL1138018514612246
Table 6. Bearing capacity of specimens.
Specimen NumberTheoretical Bearing Capacity
Nt (kN)
Yield Strength
fy (MPa)
Bearing Capacity Mean ValueAddition
P ¯ ε ¯ e ε ¯ r e
FL1-113334051.790.670.17/
FL1-2No failure
FL1-3
FL2-110464151.420.660.23/
FL2-2/
FL2-3/
FL3-17223902.070.900.40/
FL3-2/
FL3-3/
FL4-119734051.311.120.29Tube wall yielded before the flange plate
FL4-2
FL4-3
FL5-115484151.470.580.37Tube wall yielded after the flange
FL5-2
FL5-3
FL6-110684051.981.110.70/
FL6-2/
FL6-3/
FL7-120584051.261.400.53Tube wall yielded before the flange plate
FL7-2
FL7-3
FL8-121914051.190.770.14Tube wall yielded before the flange plate
FL8-2
FL8-3
FL9-113514051.561.120.61/
FL9-2Bolt fracture
FL9-3No failure
FL10-118114051.240.410.21/
FL10-2No failure
FL10-3No failure
FL11-122464611.121.130.18Tube wall yielded before the flange plate
FL11-2
FL11-3
Table 7. Design bearing capacity of steel tube and flange plate.
GroupFlange ComponentSteel Tube Bearing Capacity (kN)Flange Plate Bearing Capacity (kN)Ratio
FL1F325L-16326310203.20
F299B-16300910392.90
FL2F325L-1432637814.18
F299B-1430097953.78
FL3F325L-1232635745.68
F299B-1230097953.78
FL4F245B-16197115101.31
FL5F245B-14197111561.71
FL6F245B-1219718492.32
FL7F245B-R186197115751.25
FL8F245B-R170197116771.18
FL9F325E-8M326310343.16
FL10F325E-10M326313862.35
FL11Q420-F245B241618511.31
Disclaimer/Publisher’s Note: The statements, opinions and data contained in all publications are solely those of the individual author(s) and contributor(s) and not of MDPI and/or the editor(s). MDPI and/or the editor(s) disclaim responsibility for any injury to people or property resulting from any ideas, methods, instructions or products referred to in the content.

