
Unveiling the Impact of Transportation Infrastructure Construction on Rurality: A Case Study from Guangdong, China


Abstract
1. Introduction
1.1. Background
1.2. Literature Review
1.2.1. Evaluation of Rurality and Its Influence Mechanism
1.2.2. Impact of Transportation Infrastructure on Rurality
1.3. Aim and Question
2. Materials and Methods
2.1. Research Area
2.2. Research Methods
2.2.1. The County Rurality Index
2.2.2. Transport Accessibility
2.2.3. Exploratory Spatial Data Analysis
2.2.4. Geographically Weighted Regression
2.3. Data Sources
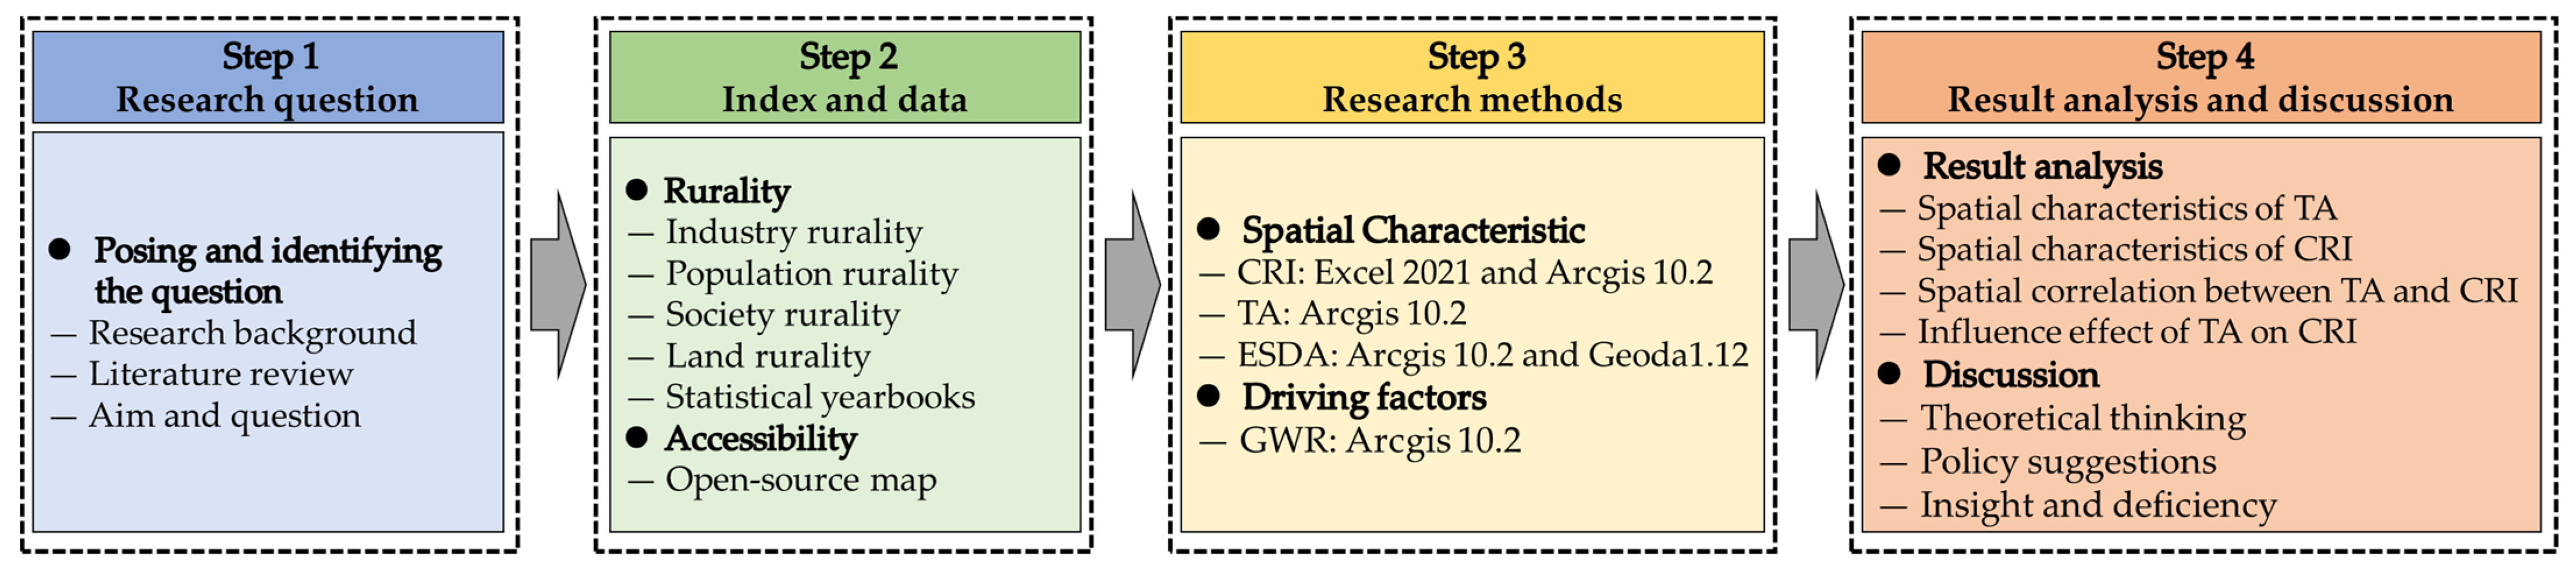
2.4. Research Steps
3. Results and Analysis
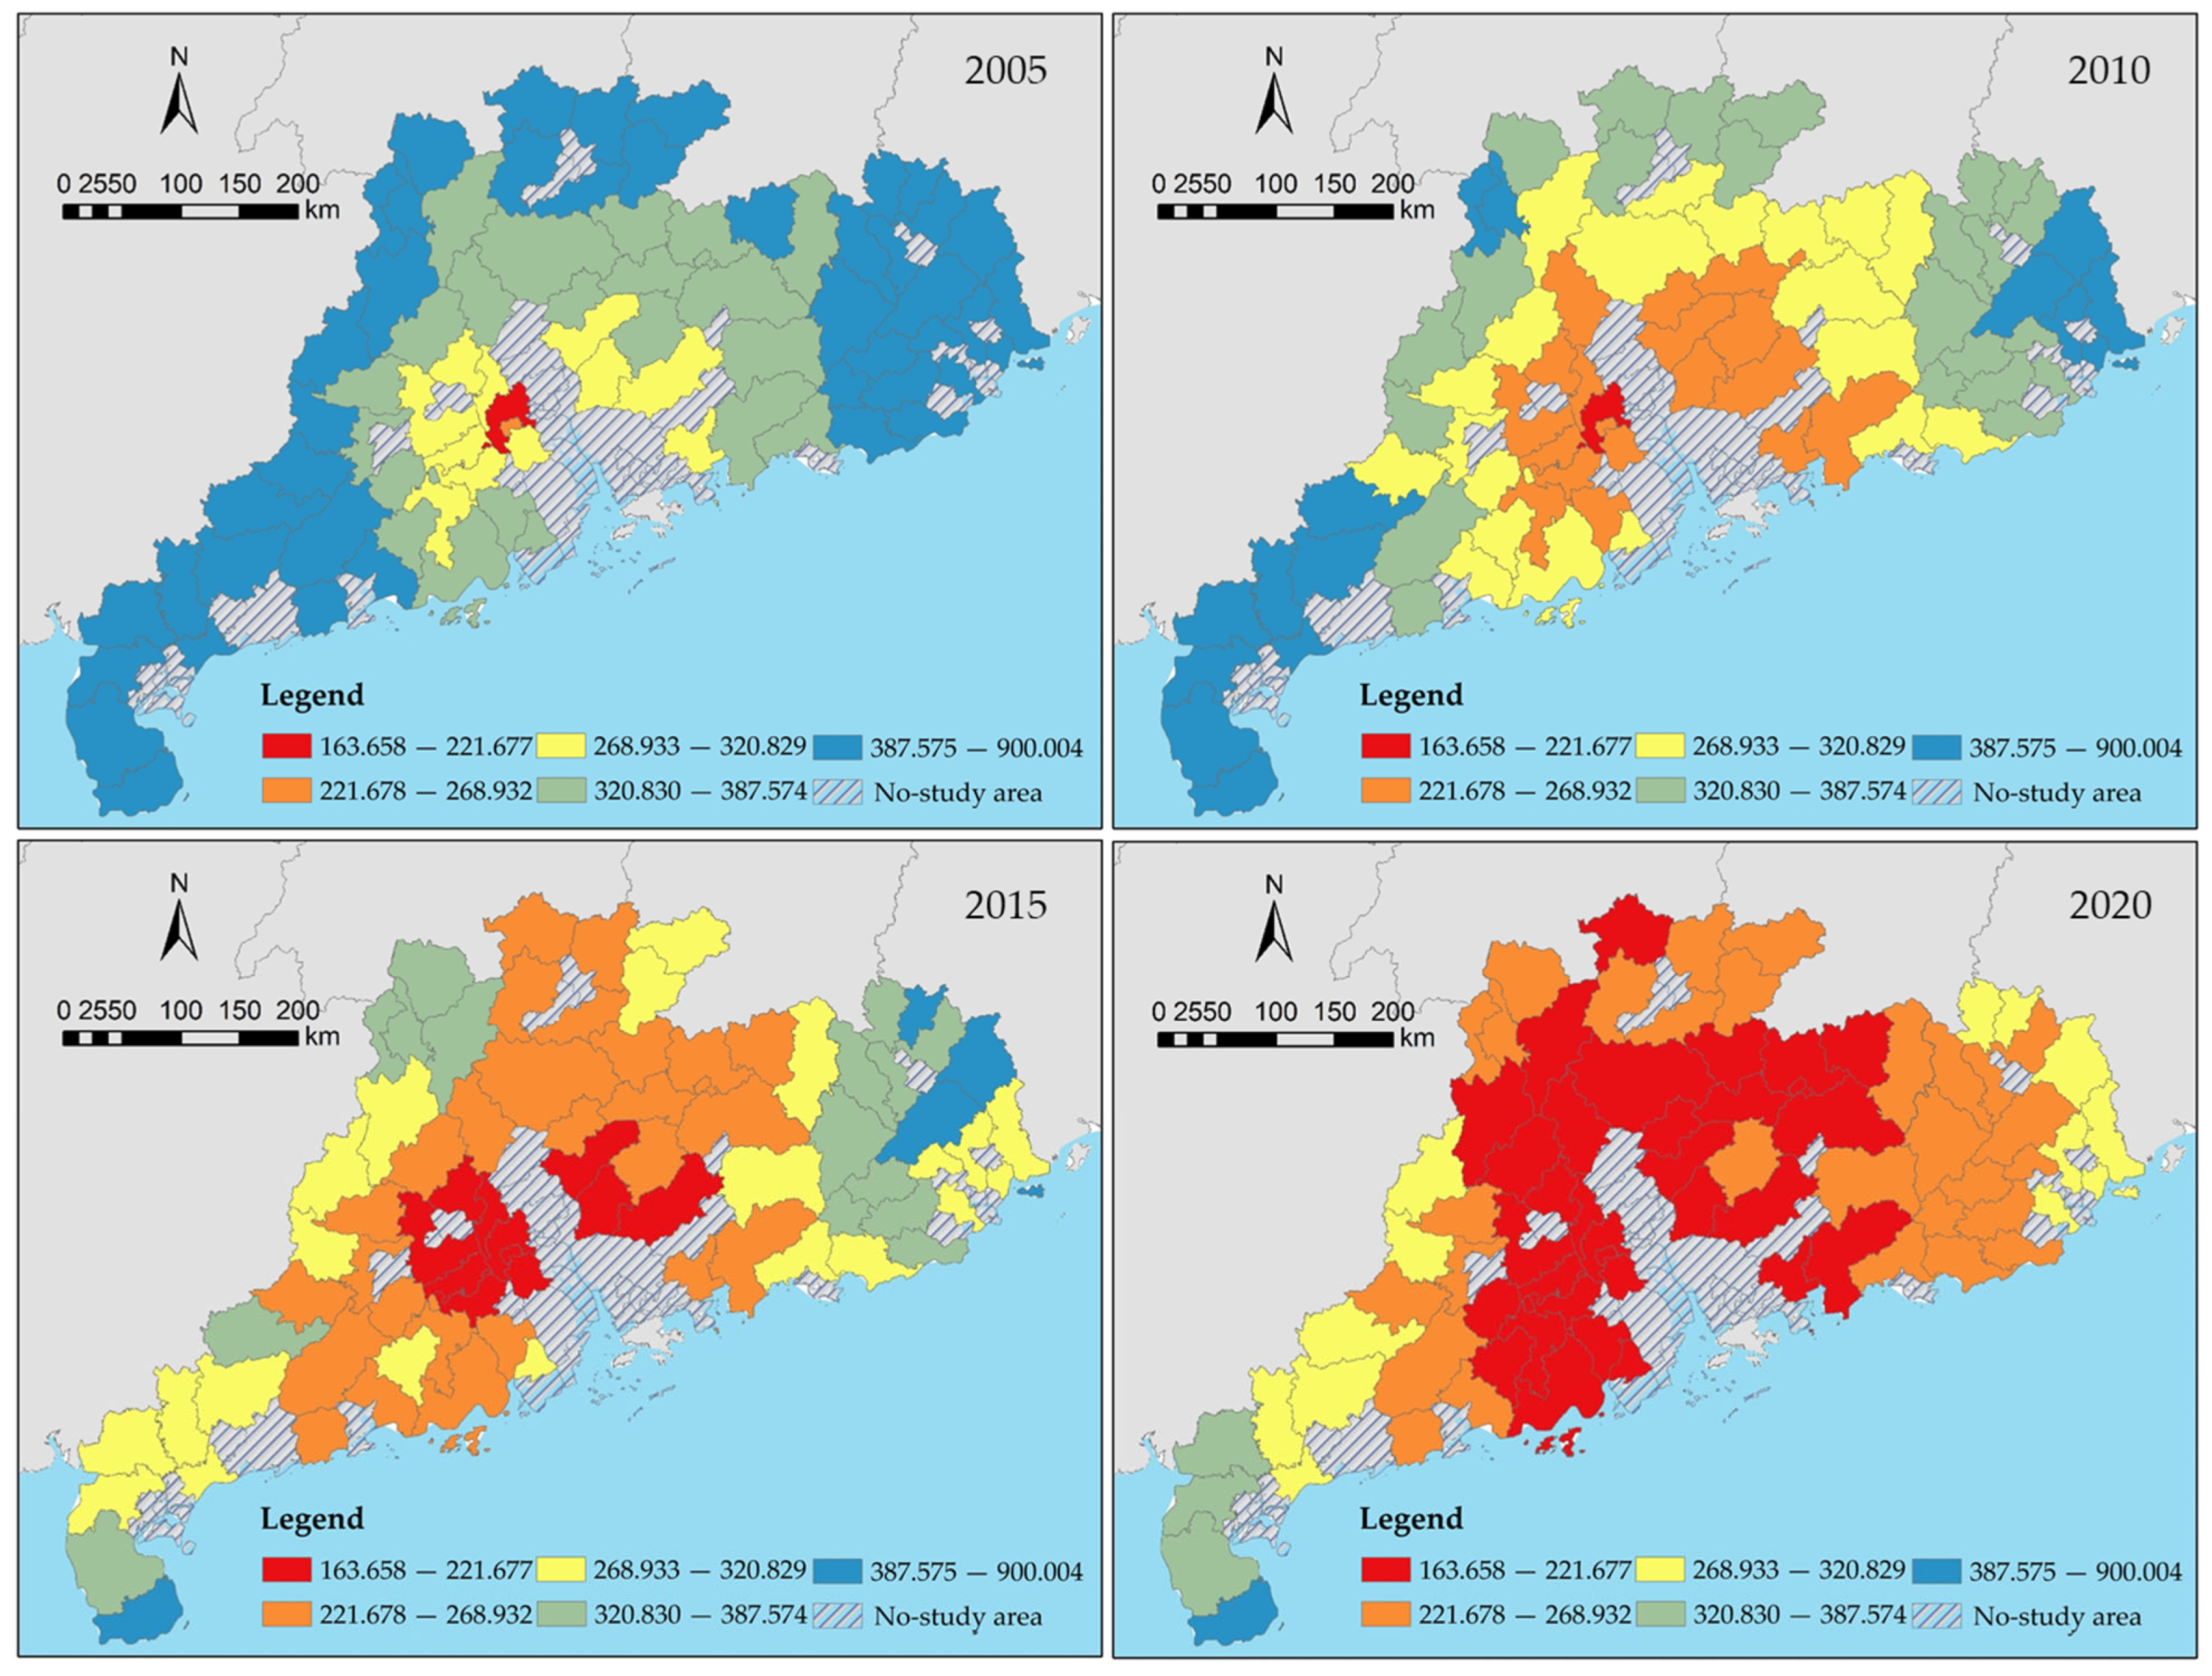
3.1. Spatial Characteristics of the County Rurality Index
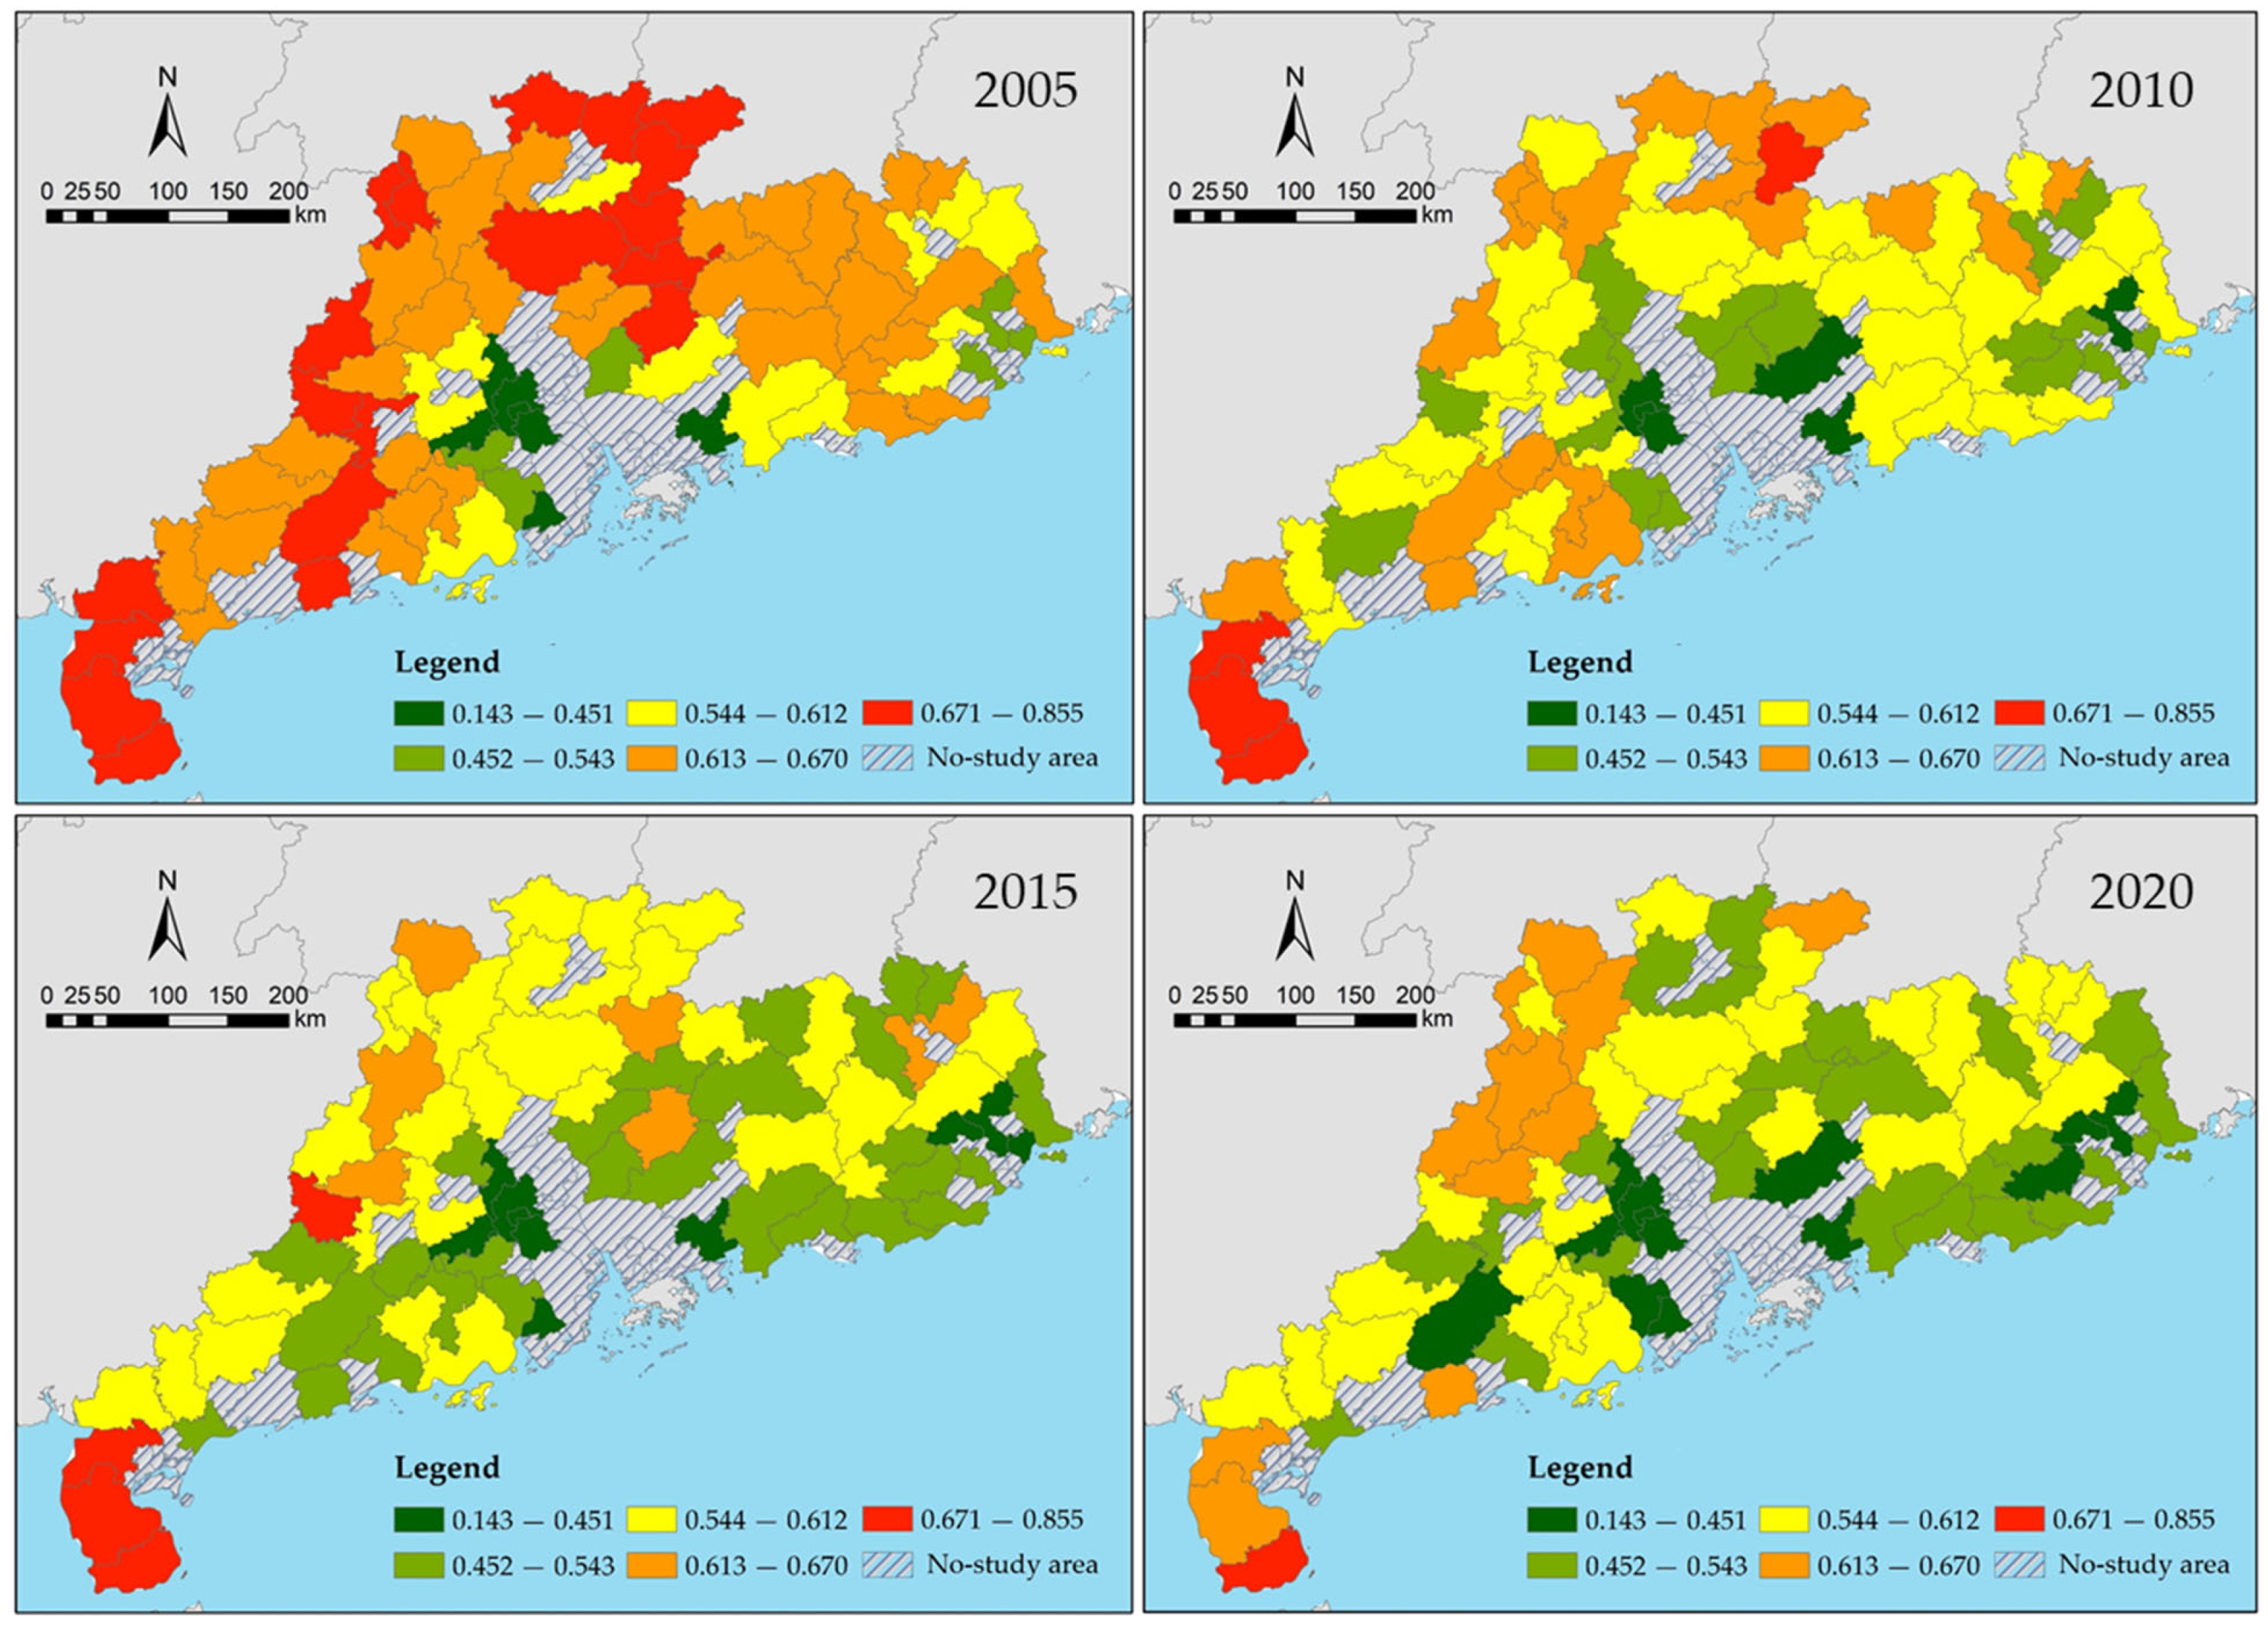
3.1.1. The Spatial Pattern of the County Rurality Index
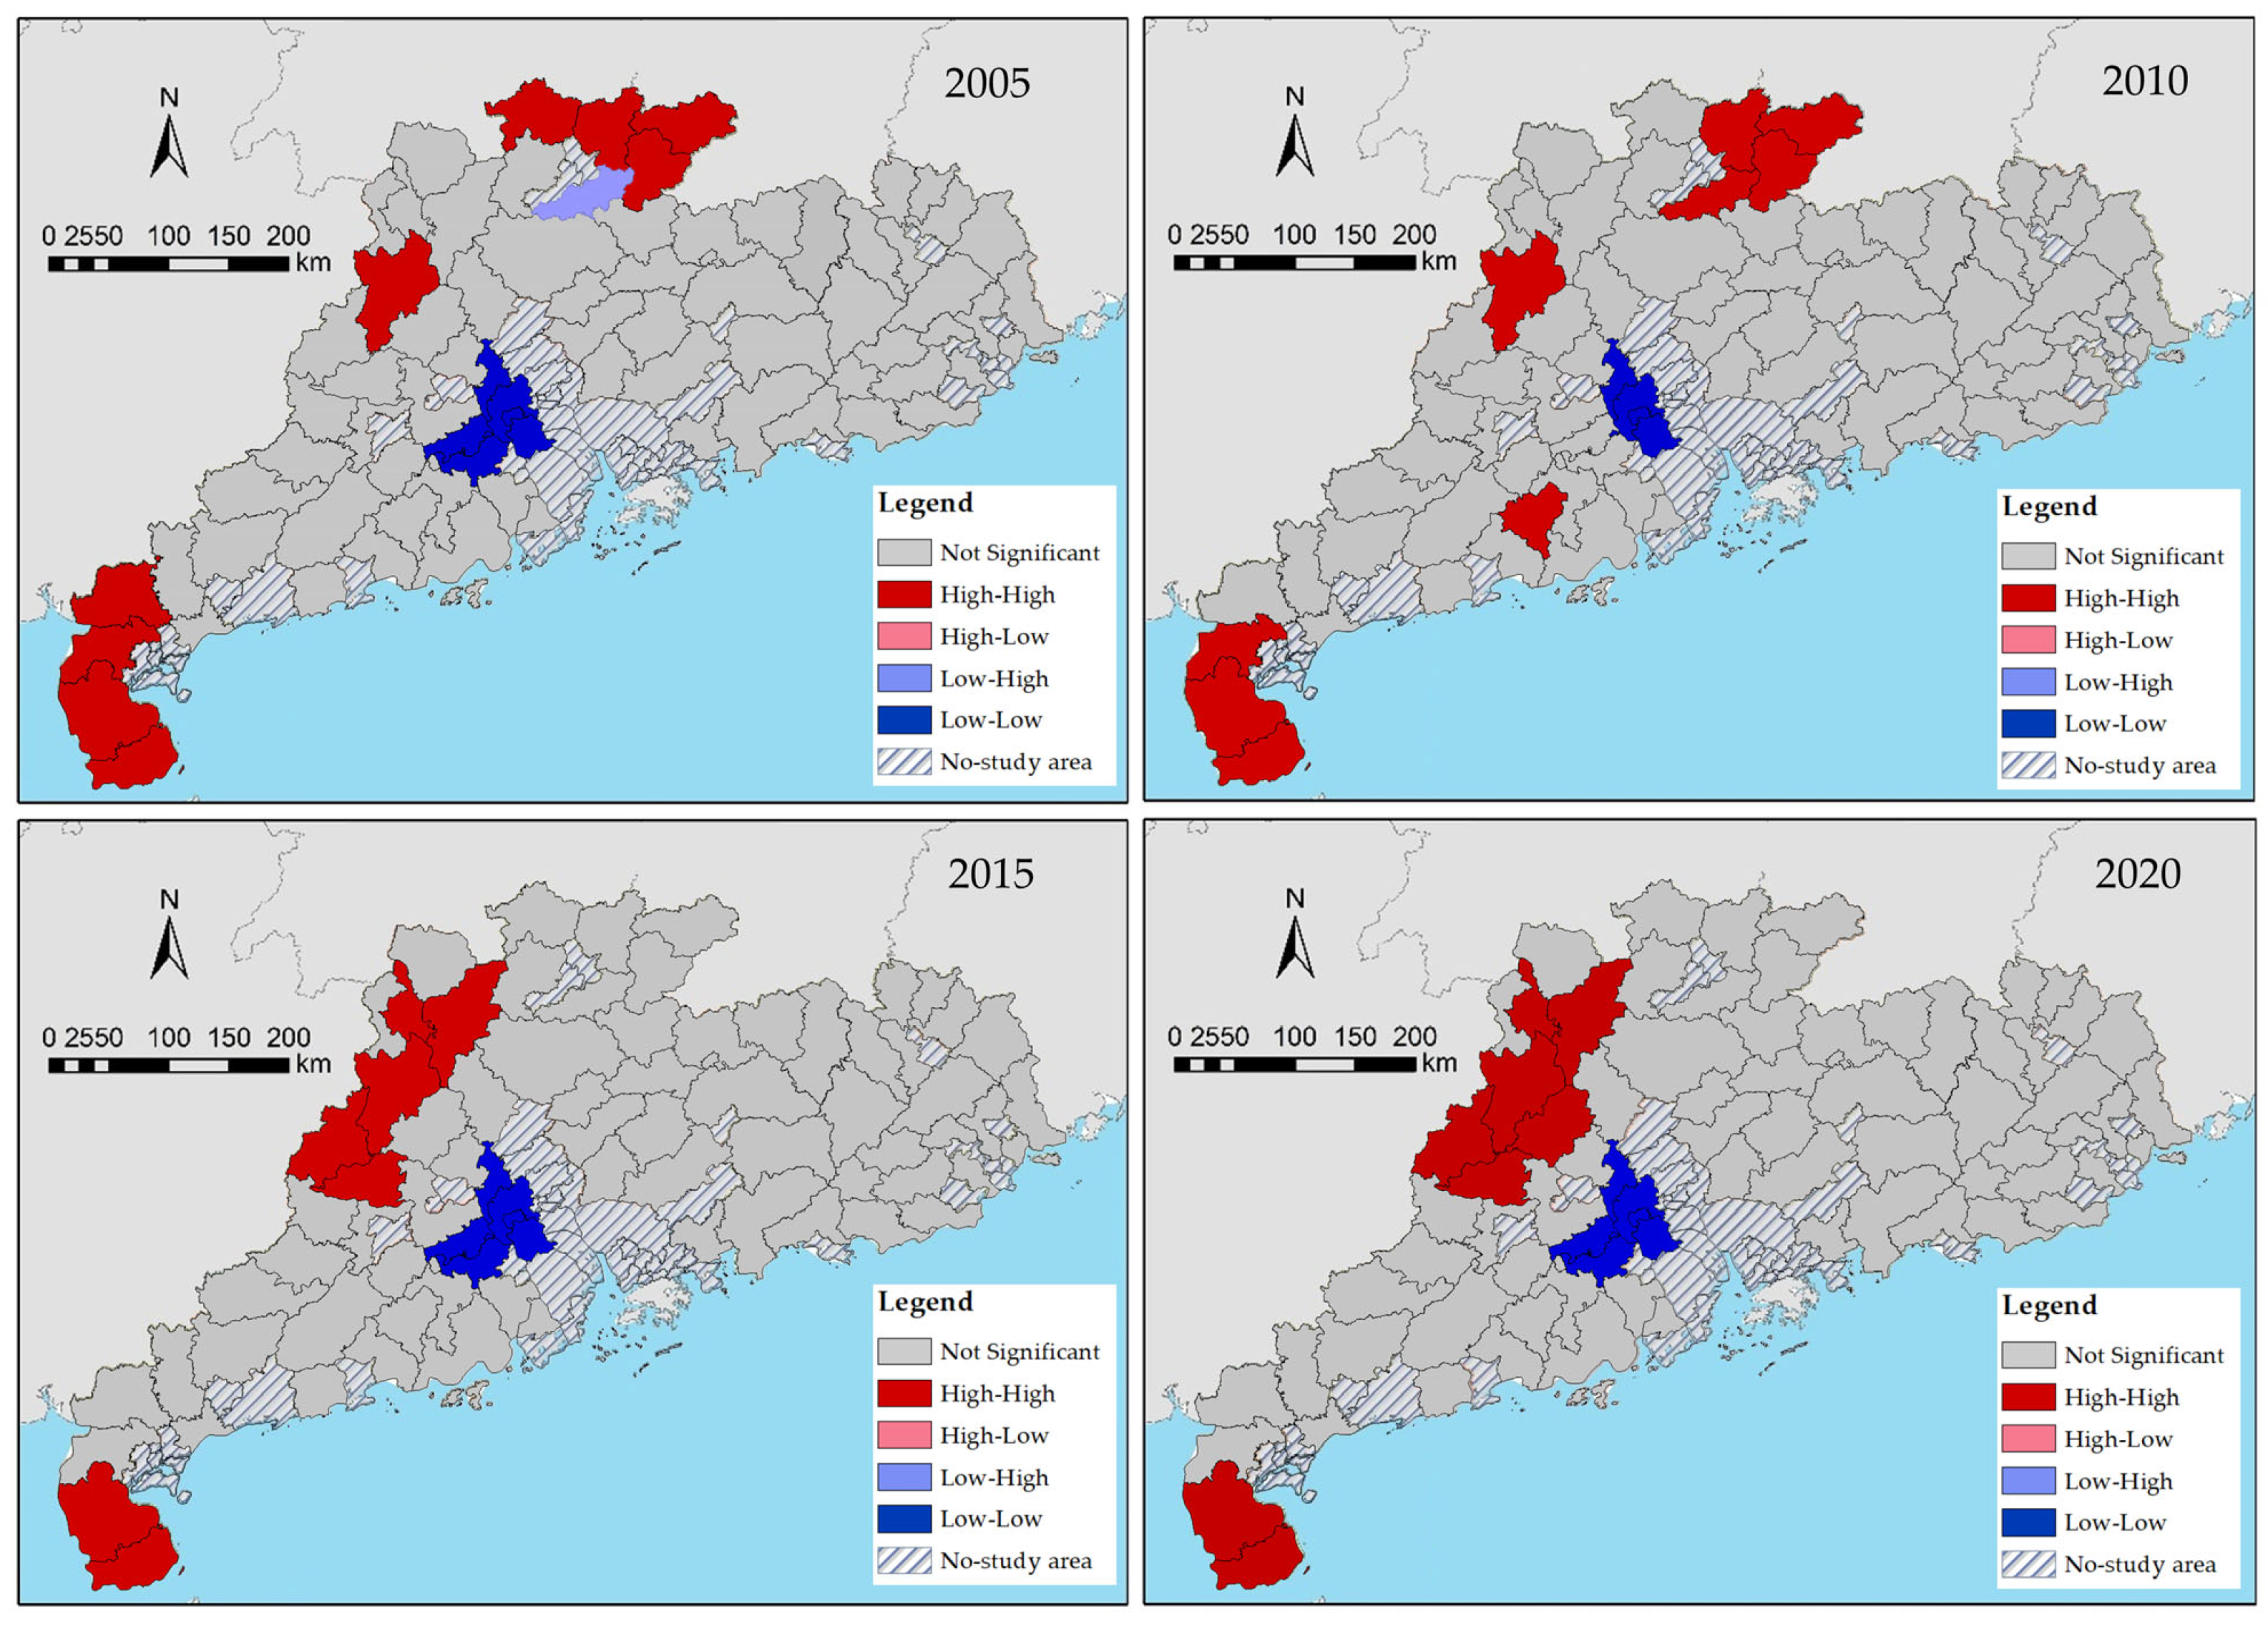
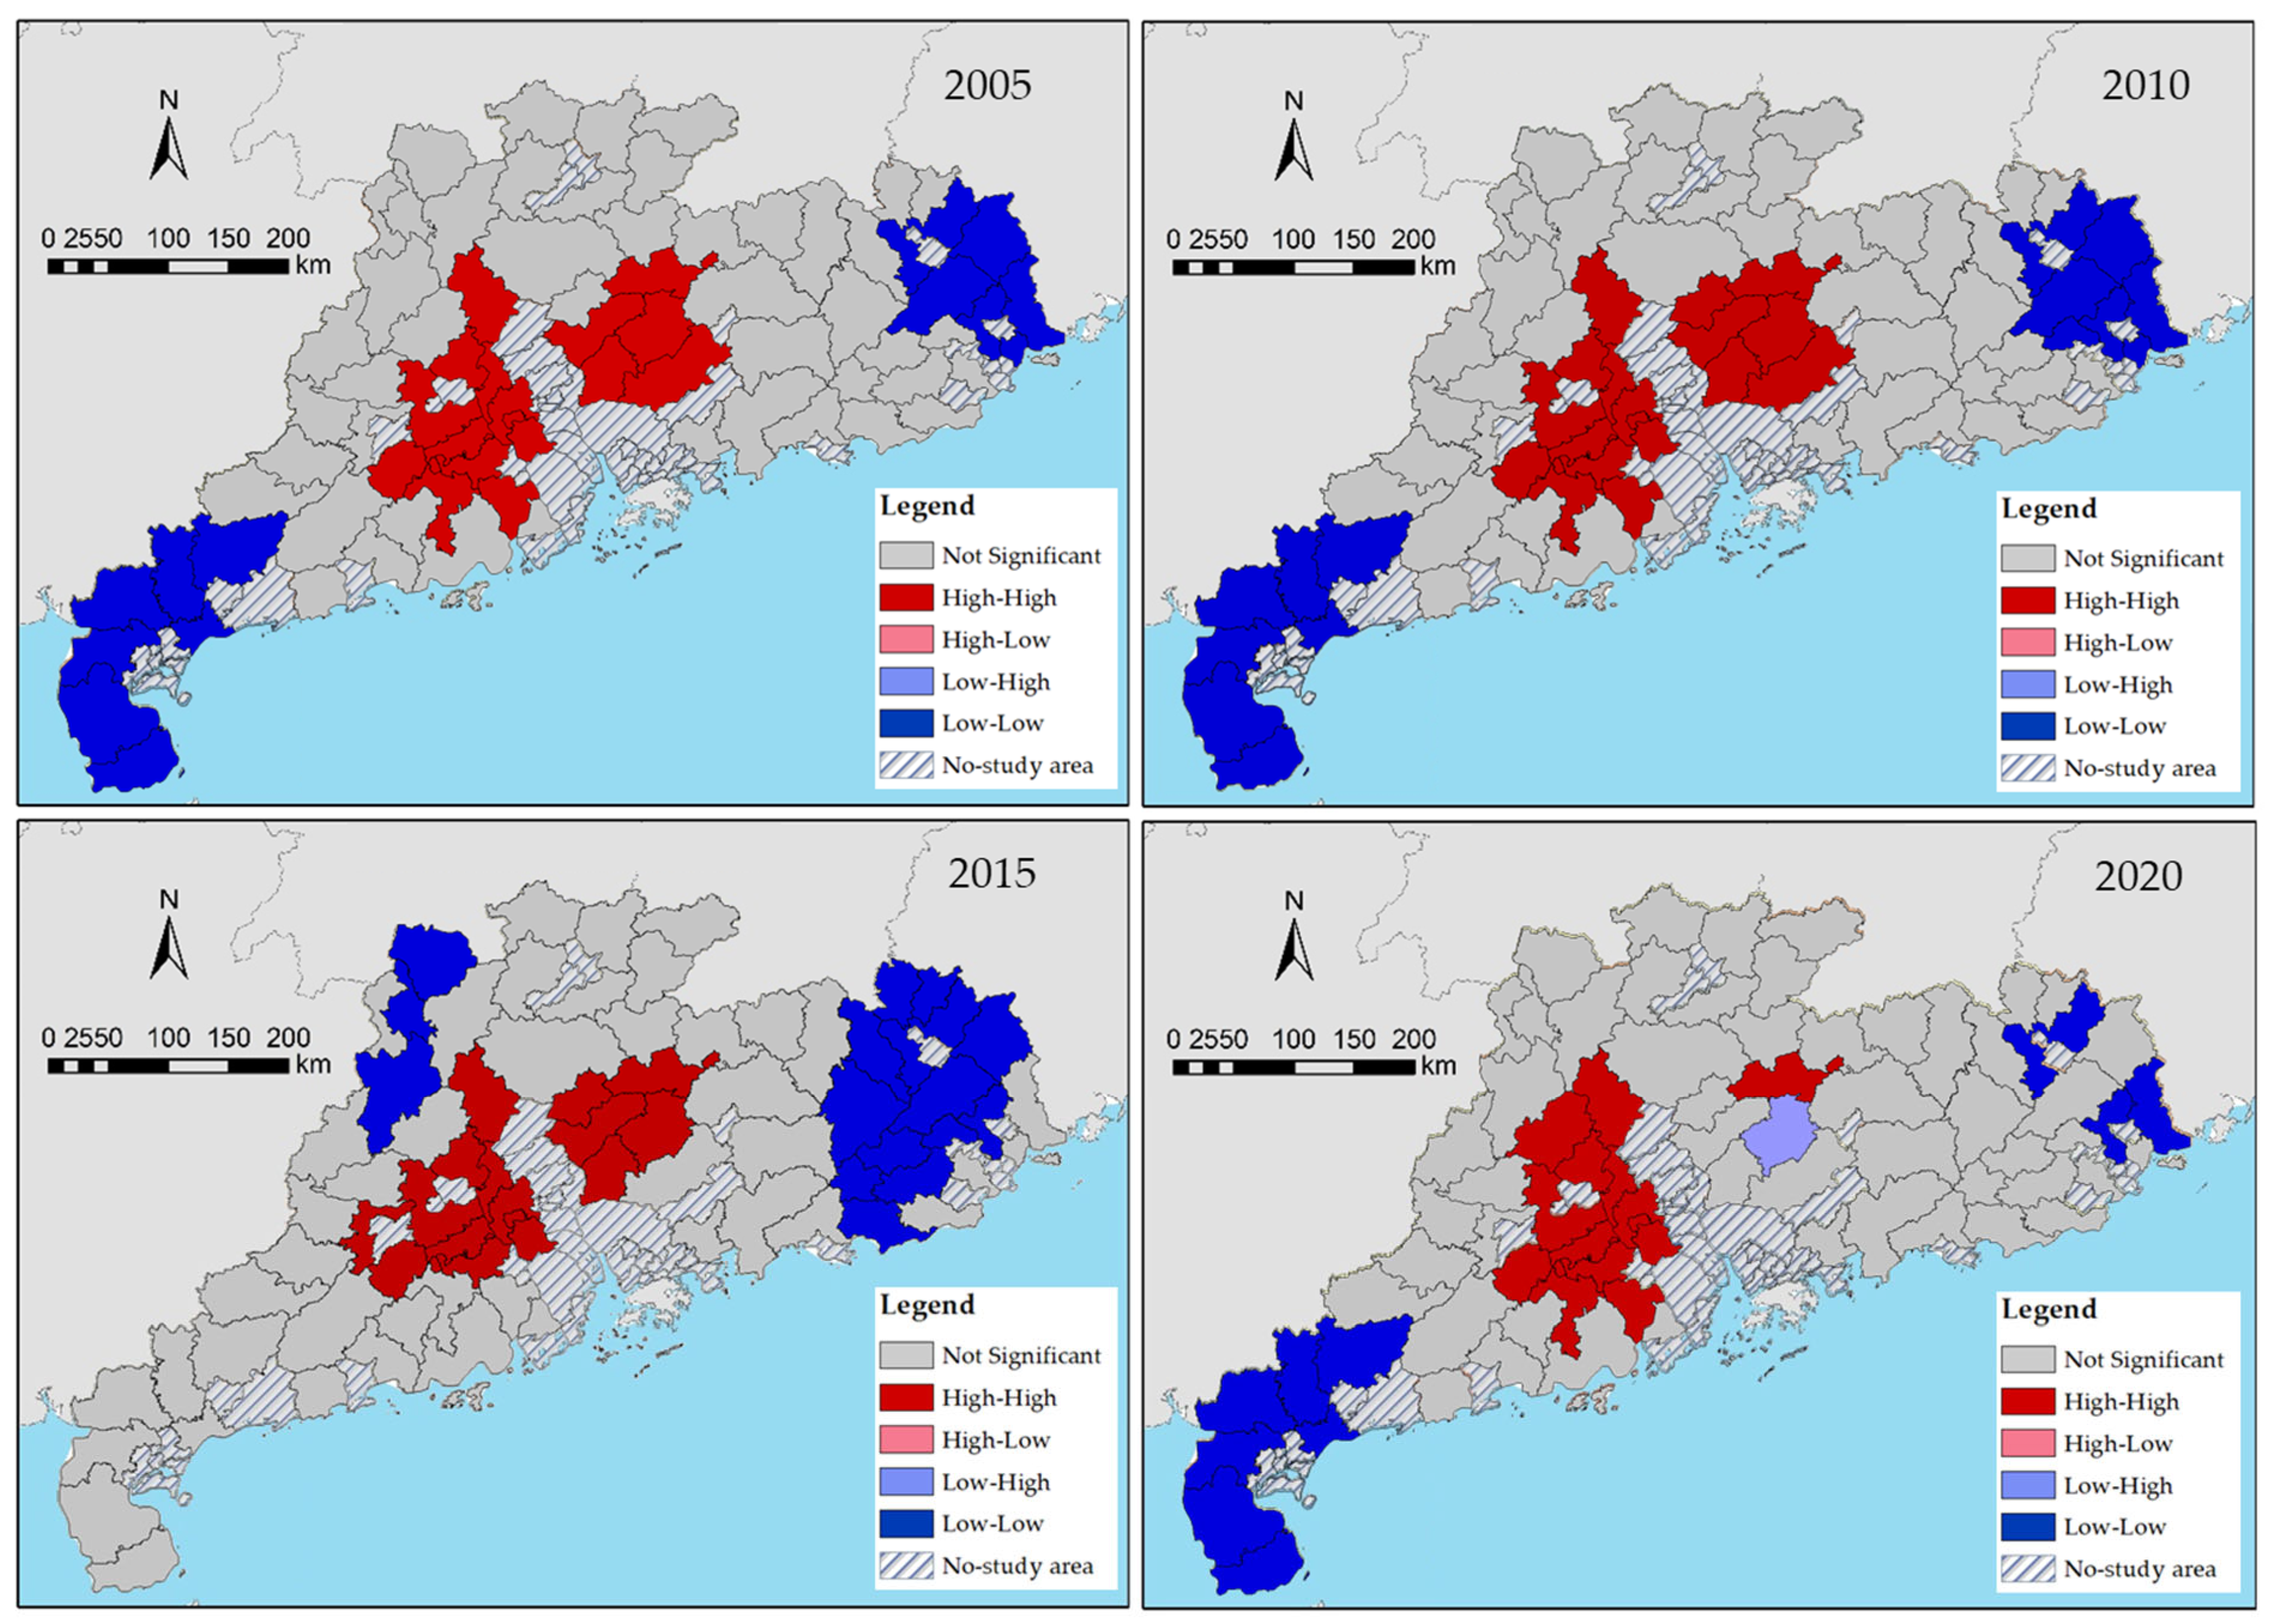
3.1.2. Spatial Aggregation of the County Rurality Index
3.2. Spatial Characteristics of Transport Accessibility
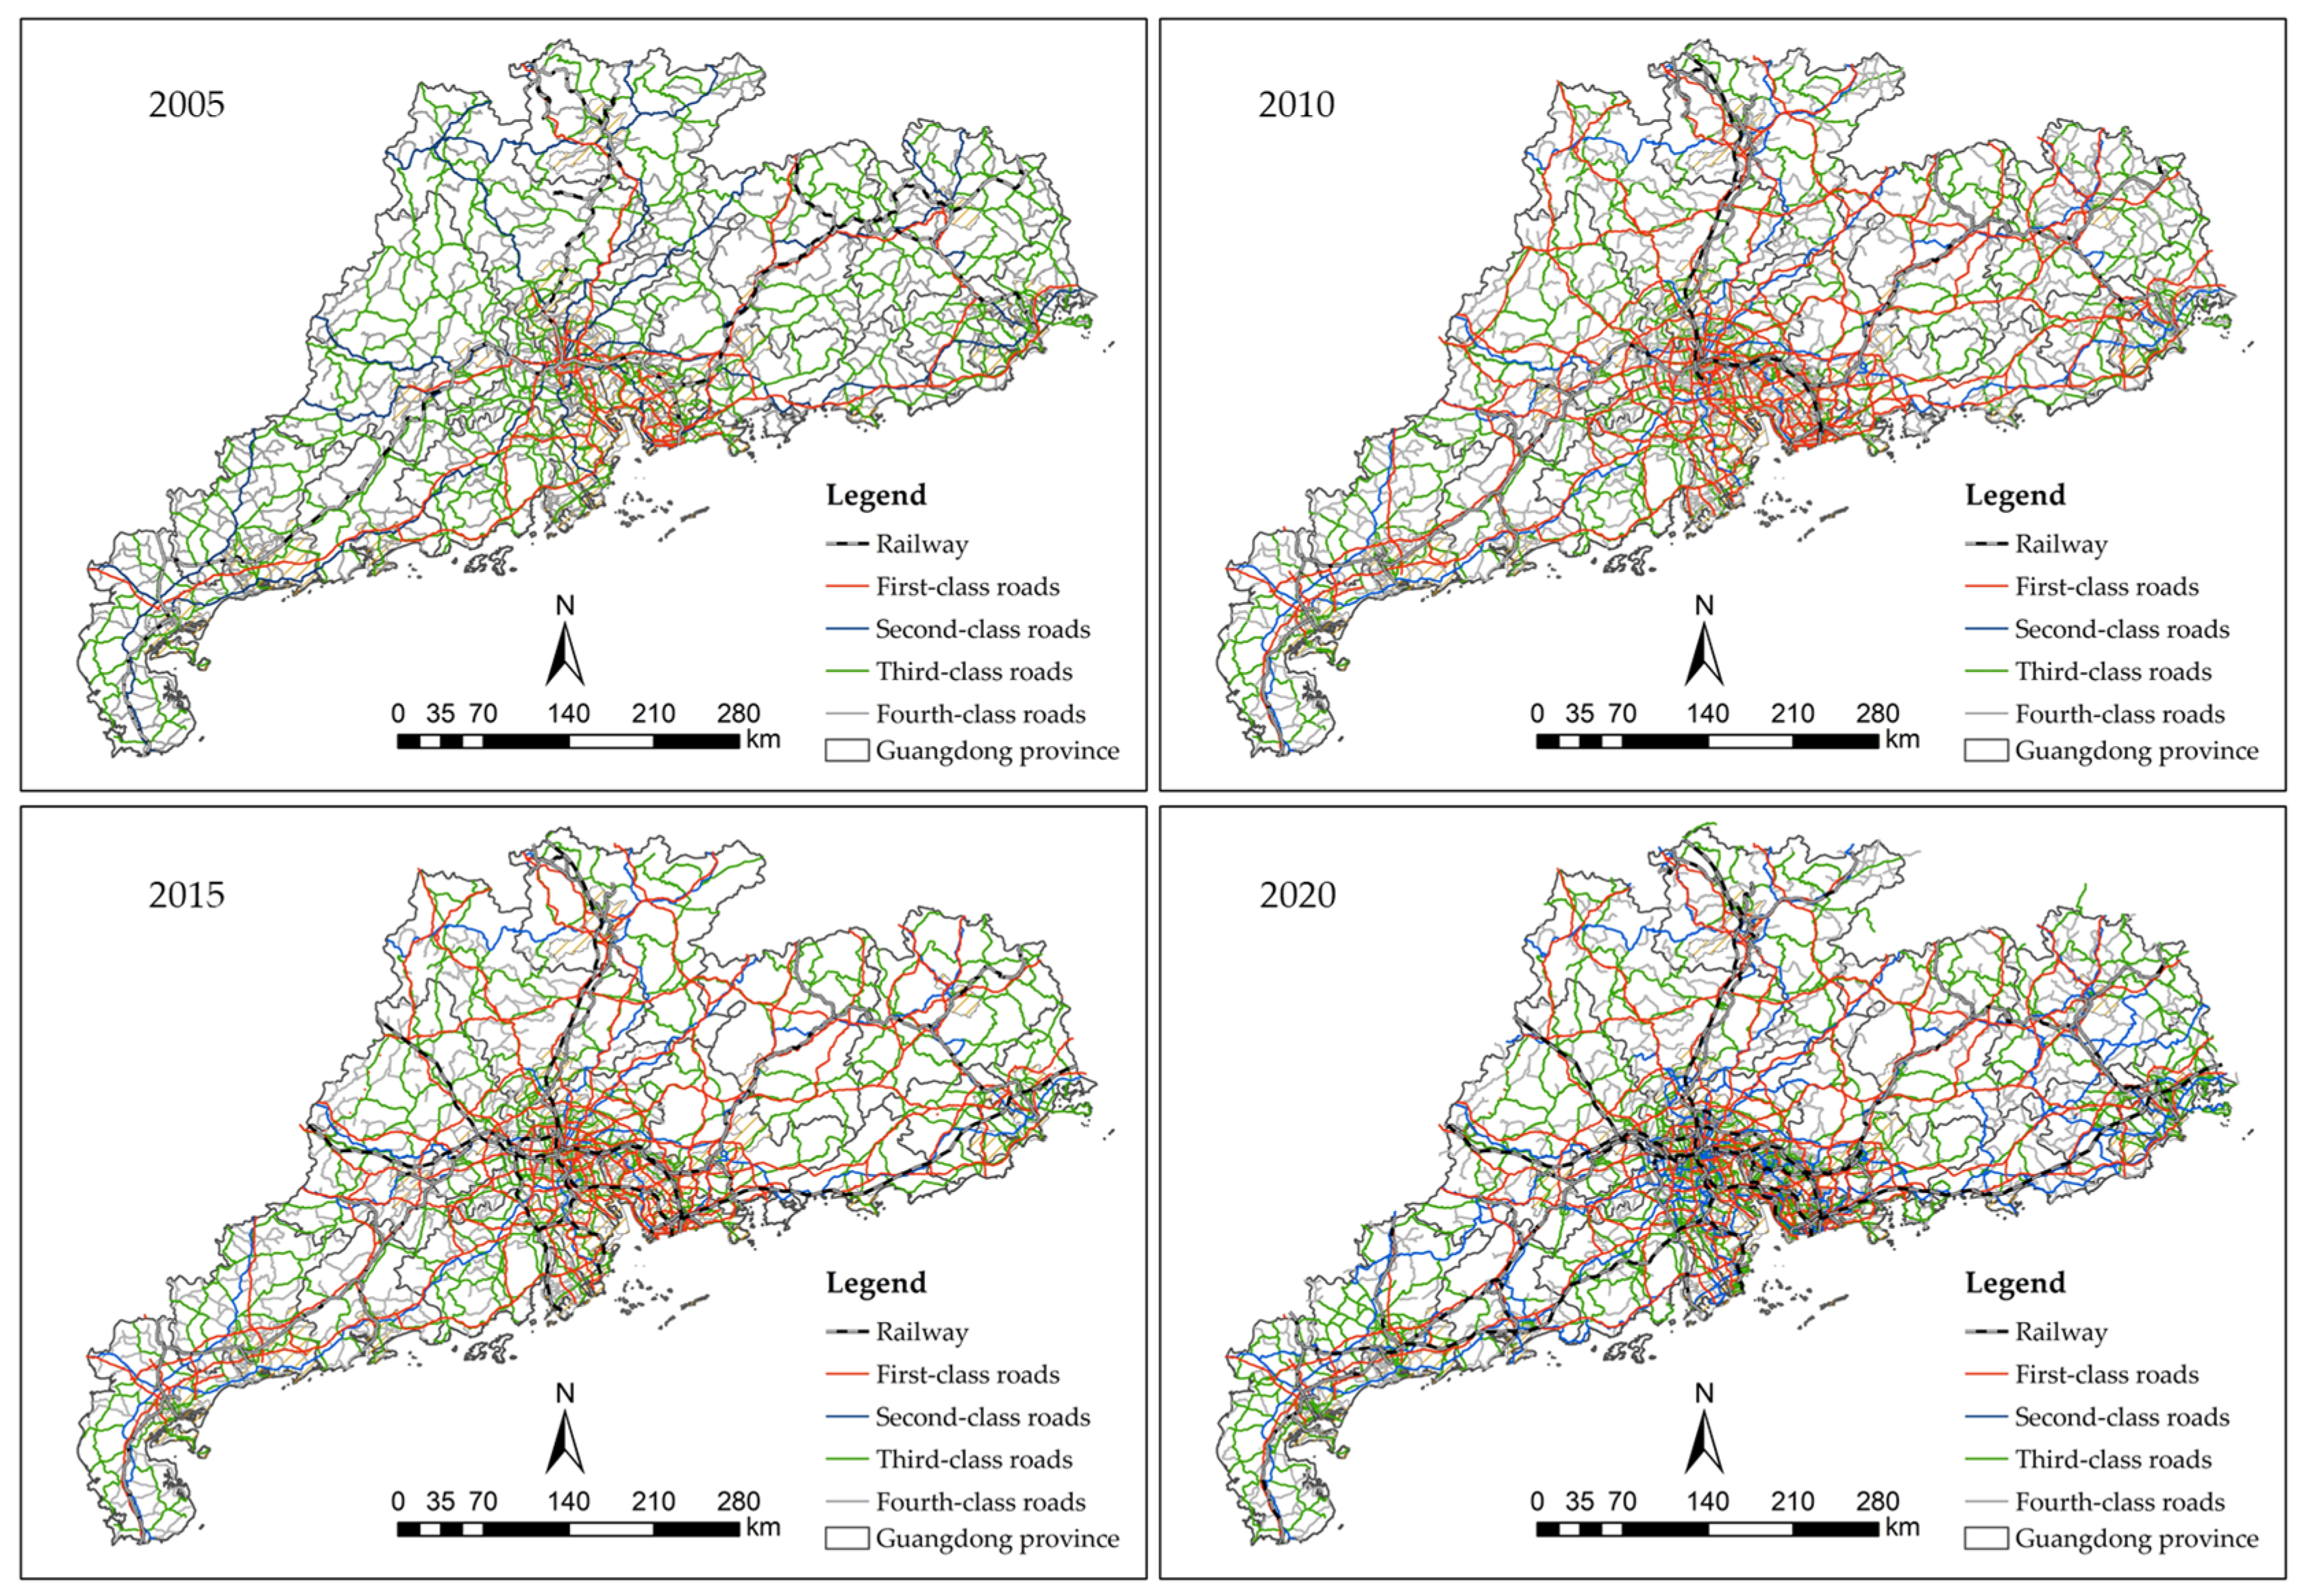
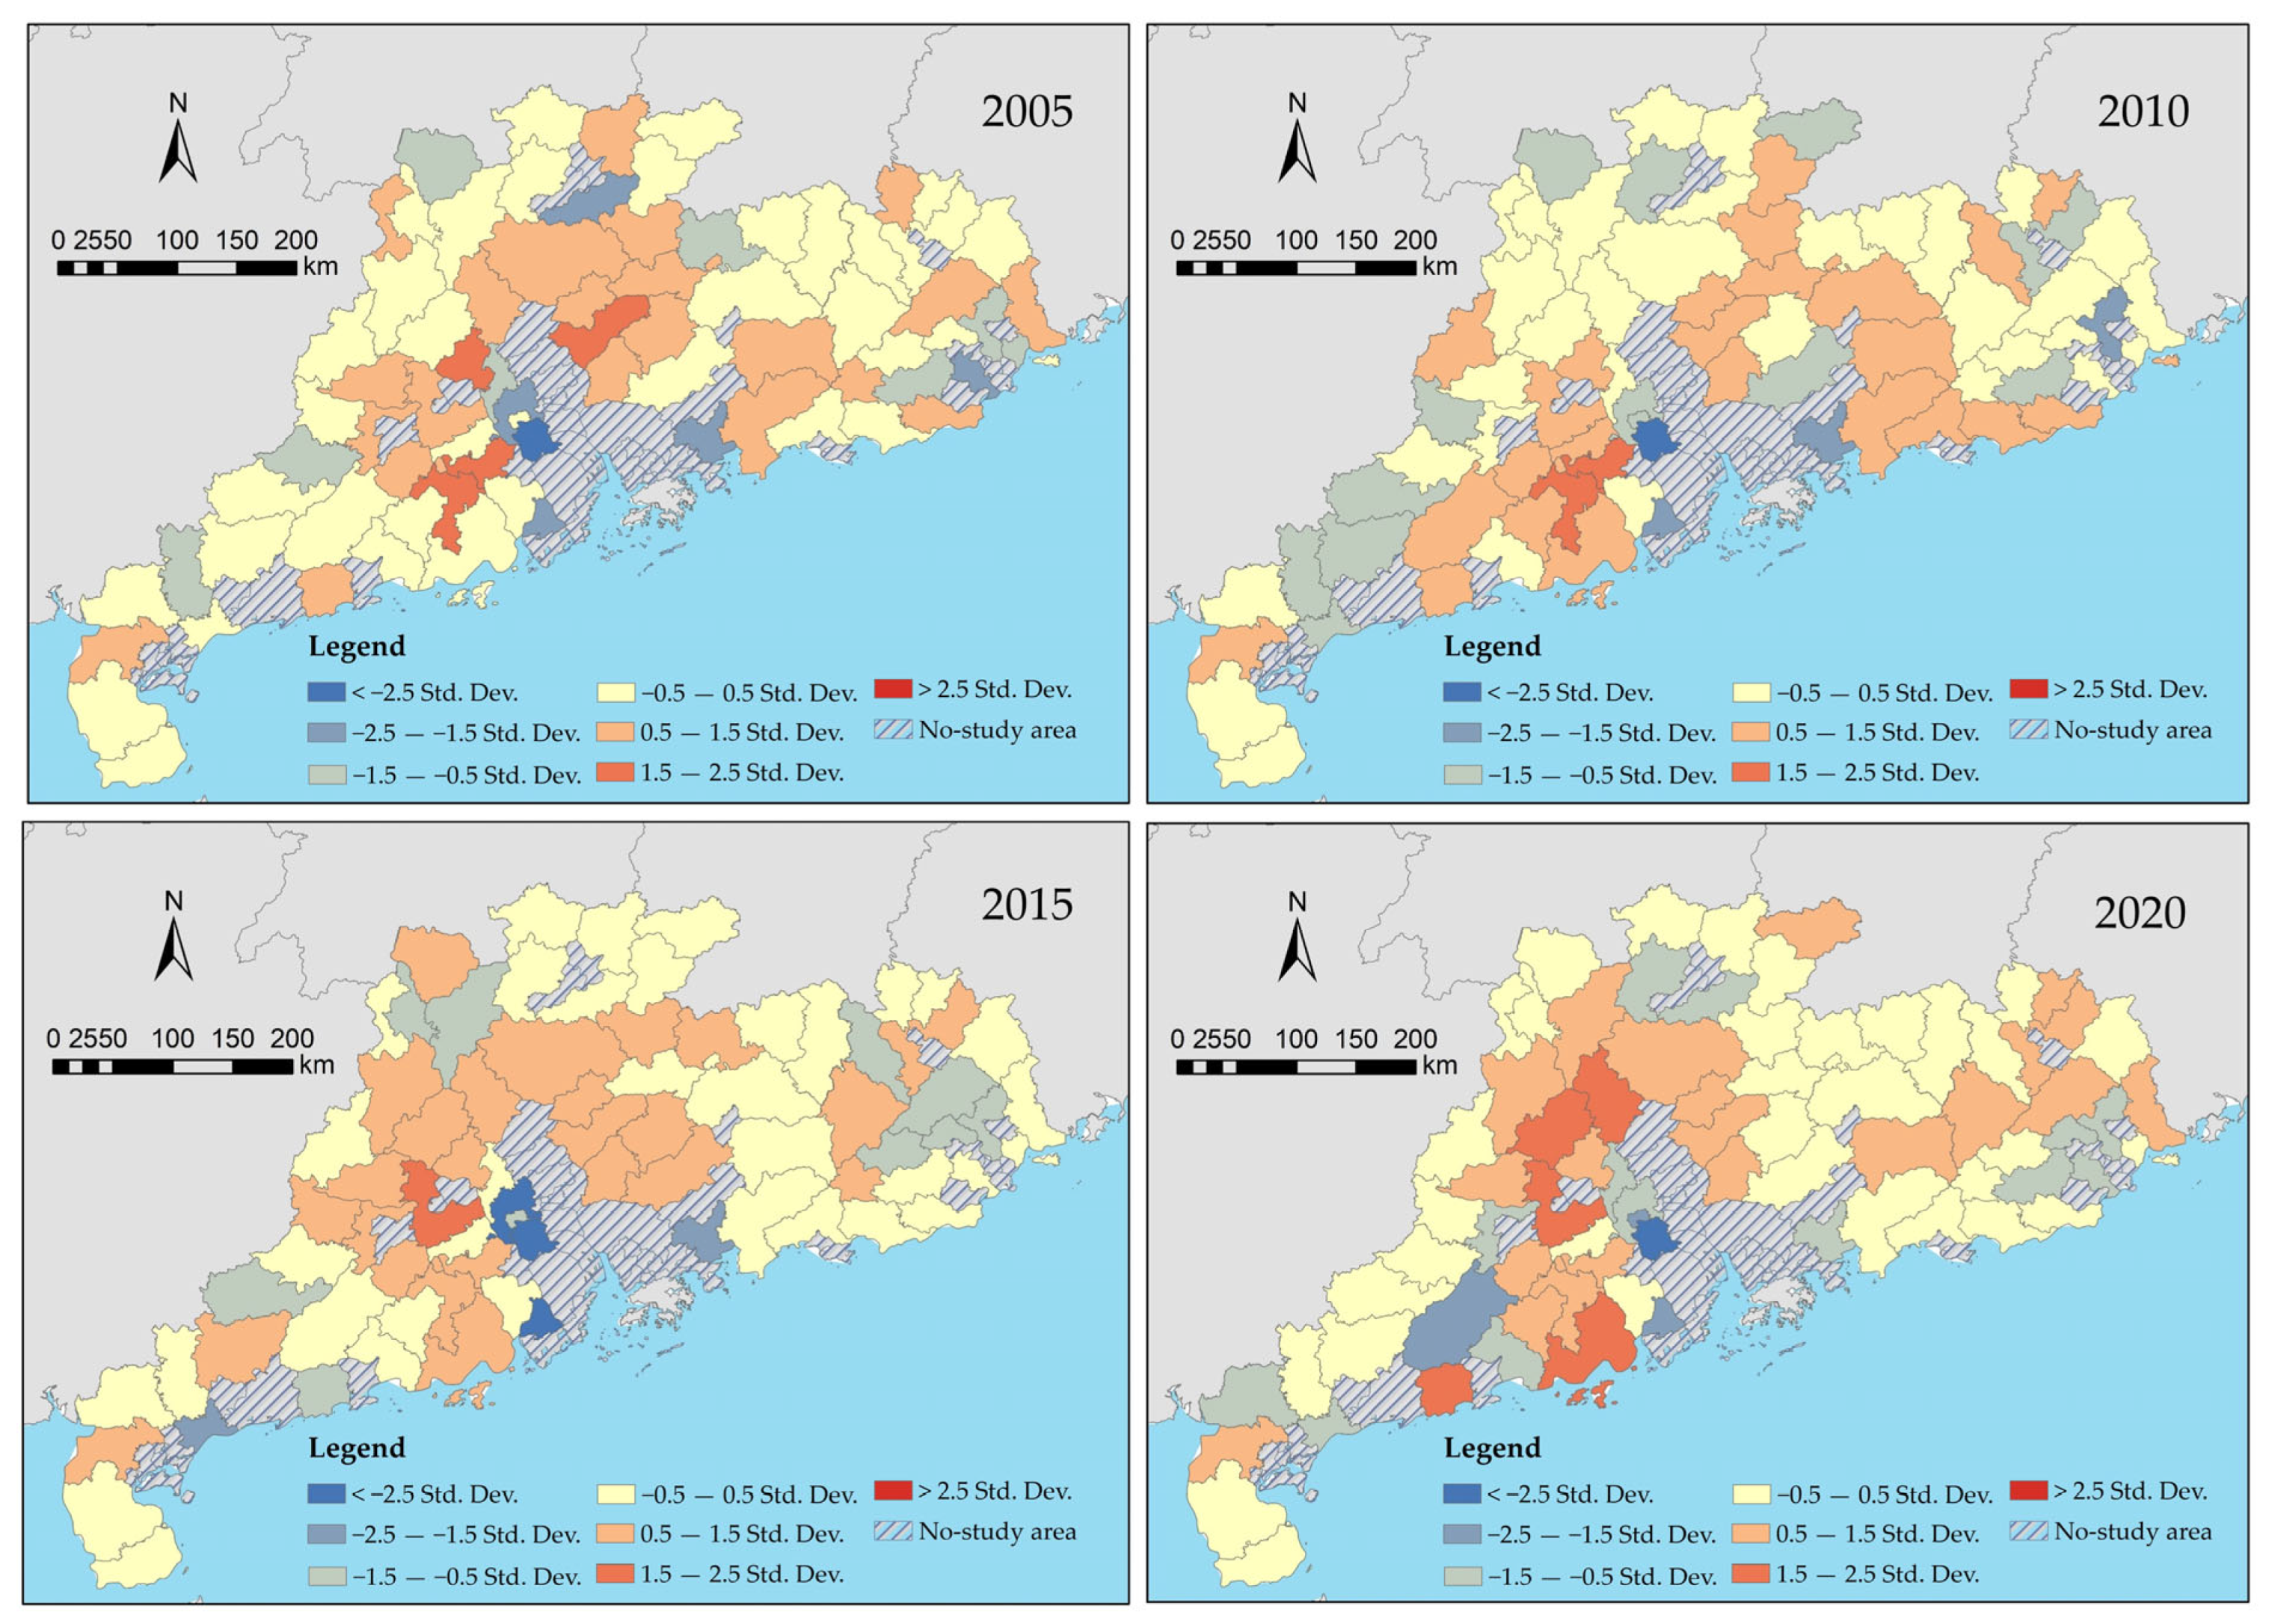
3.2.1. The Spatial Pattern of Transport Accessibility
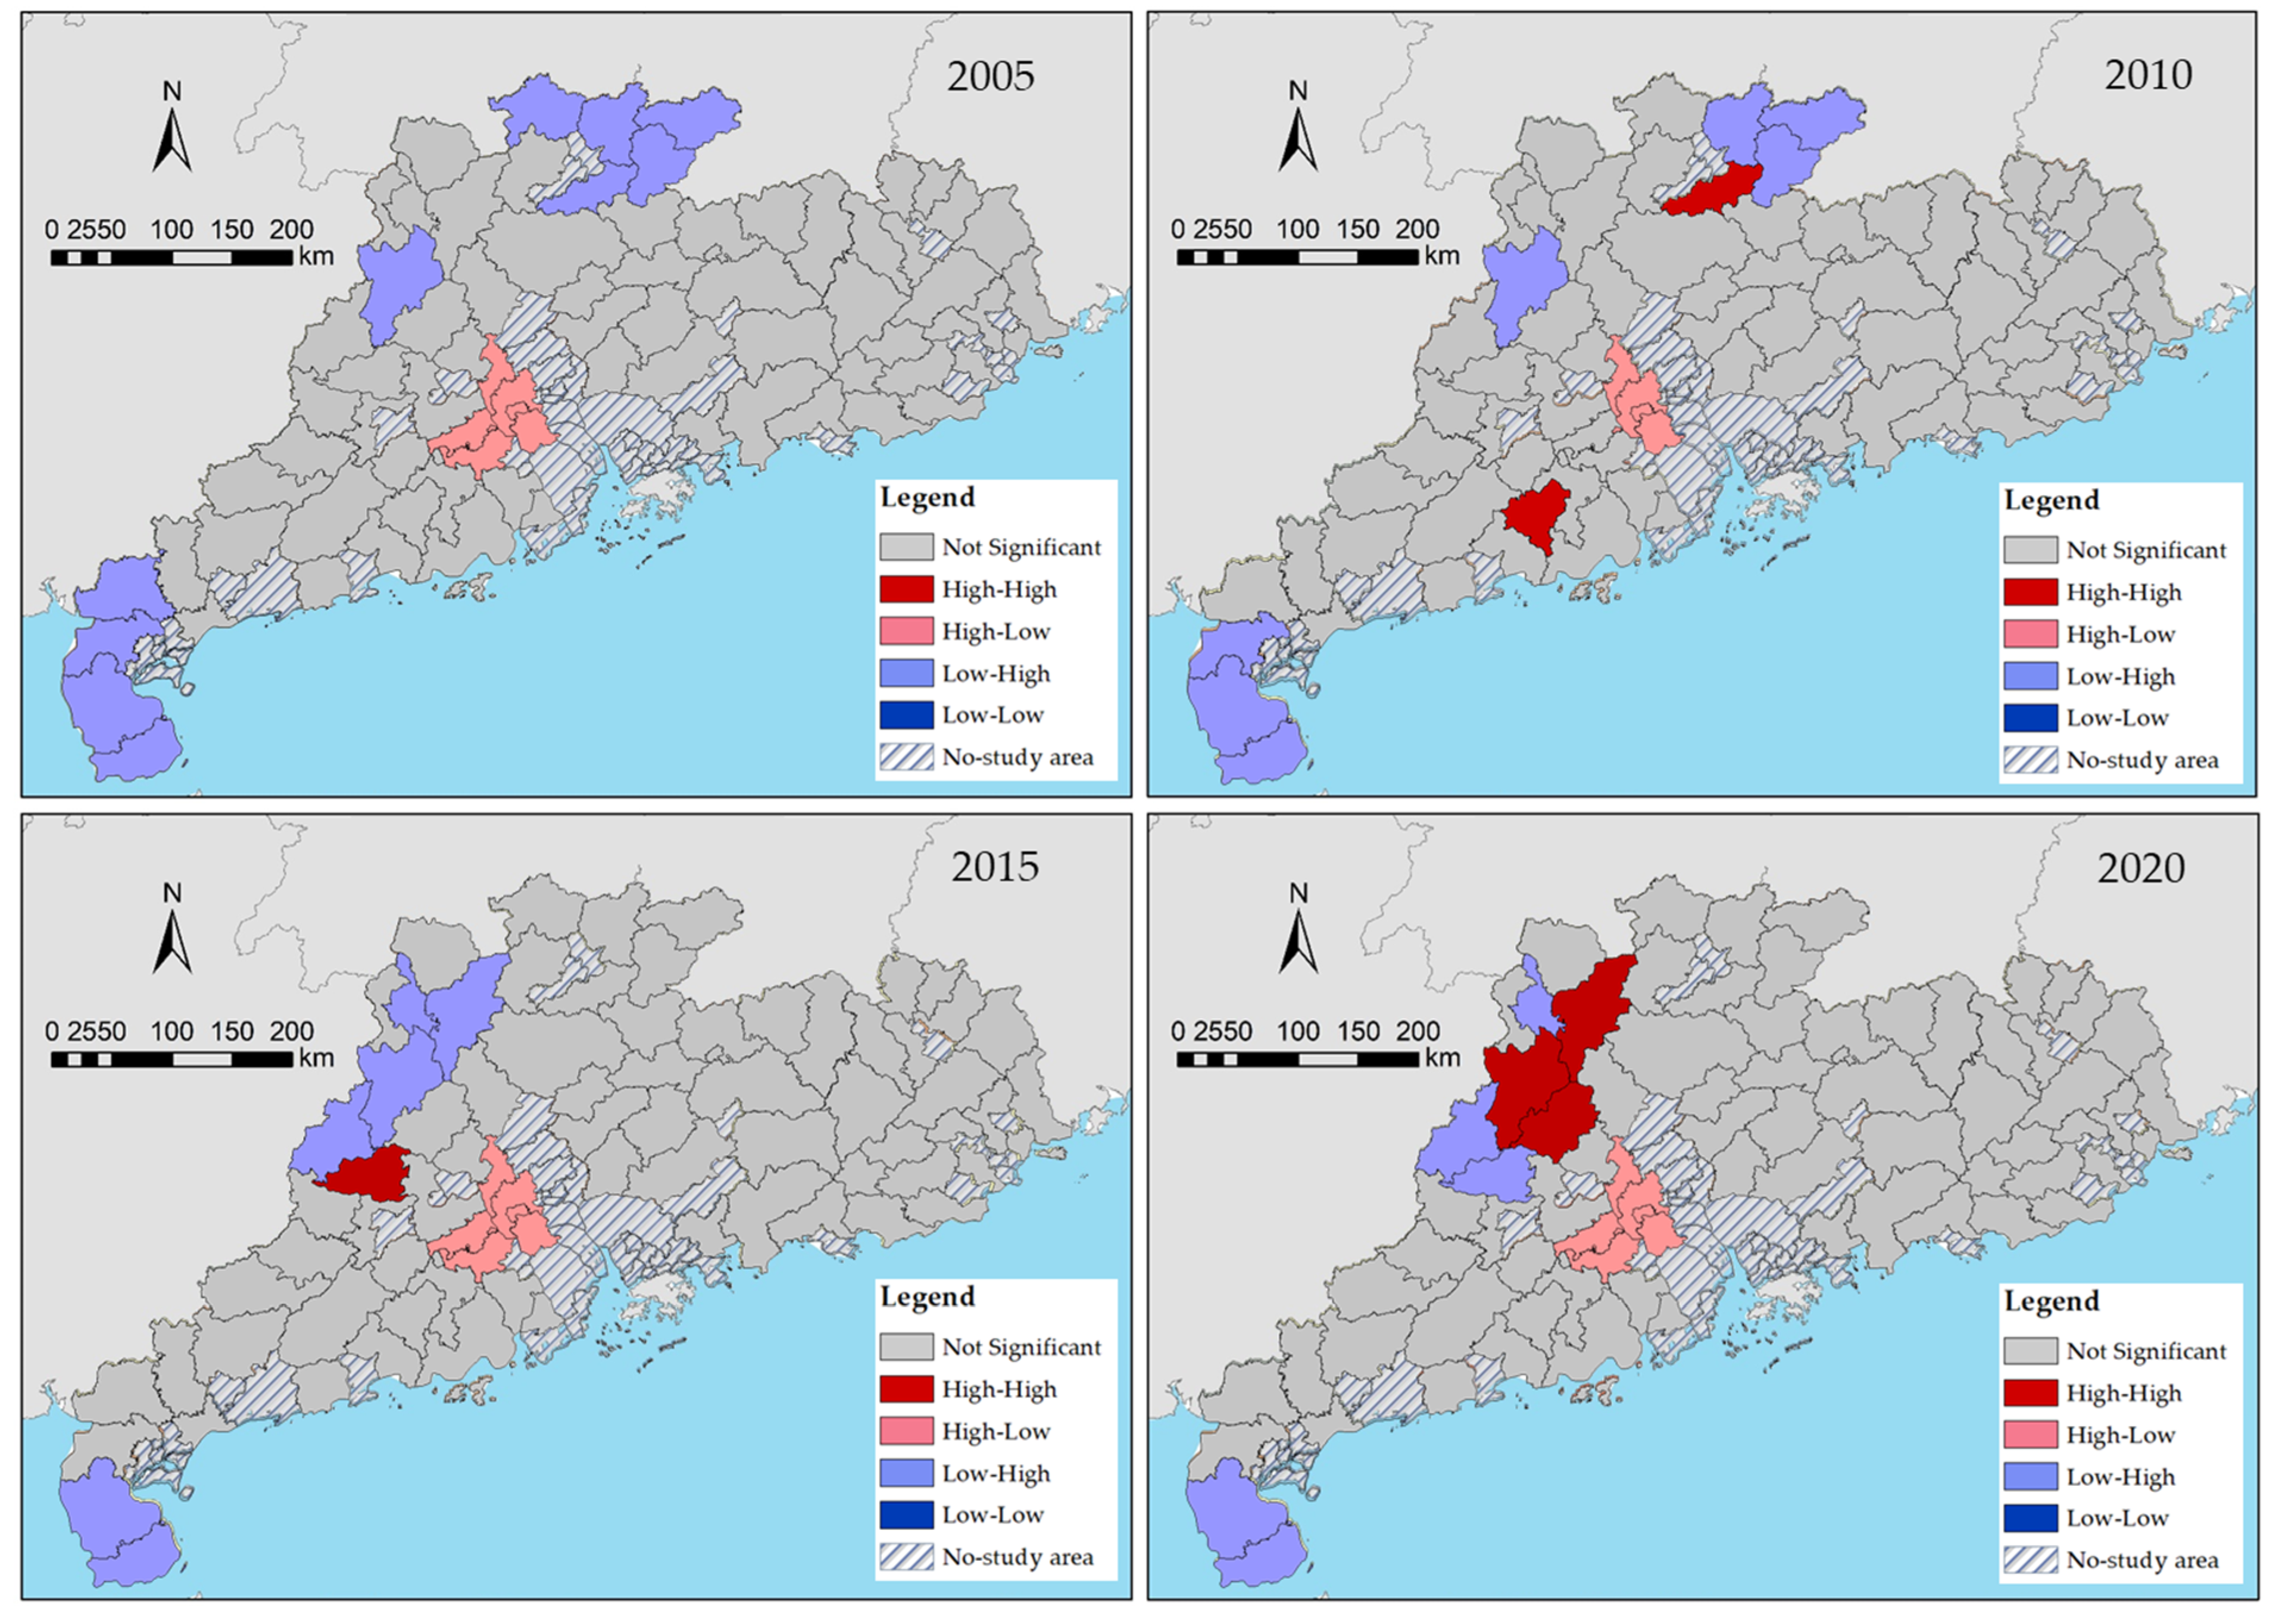
3.2.2. Spatial Aggregation of Transport Accessibility
3.3. Spatial Correlation between TA and the CRI
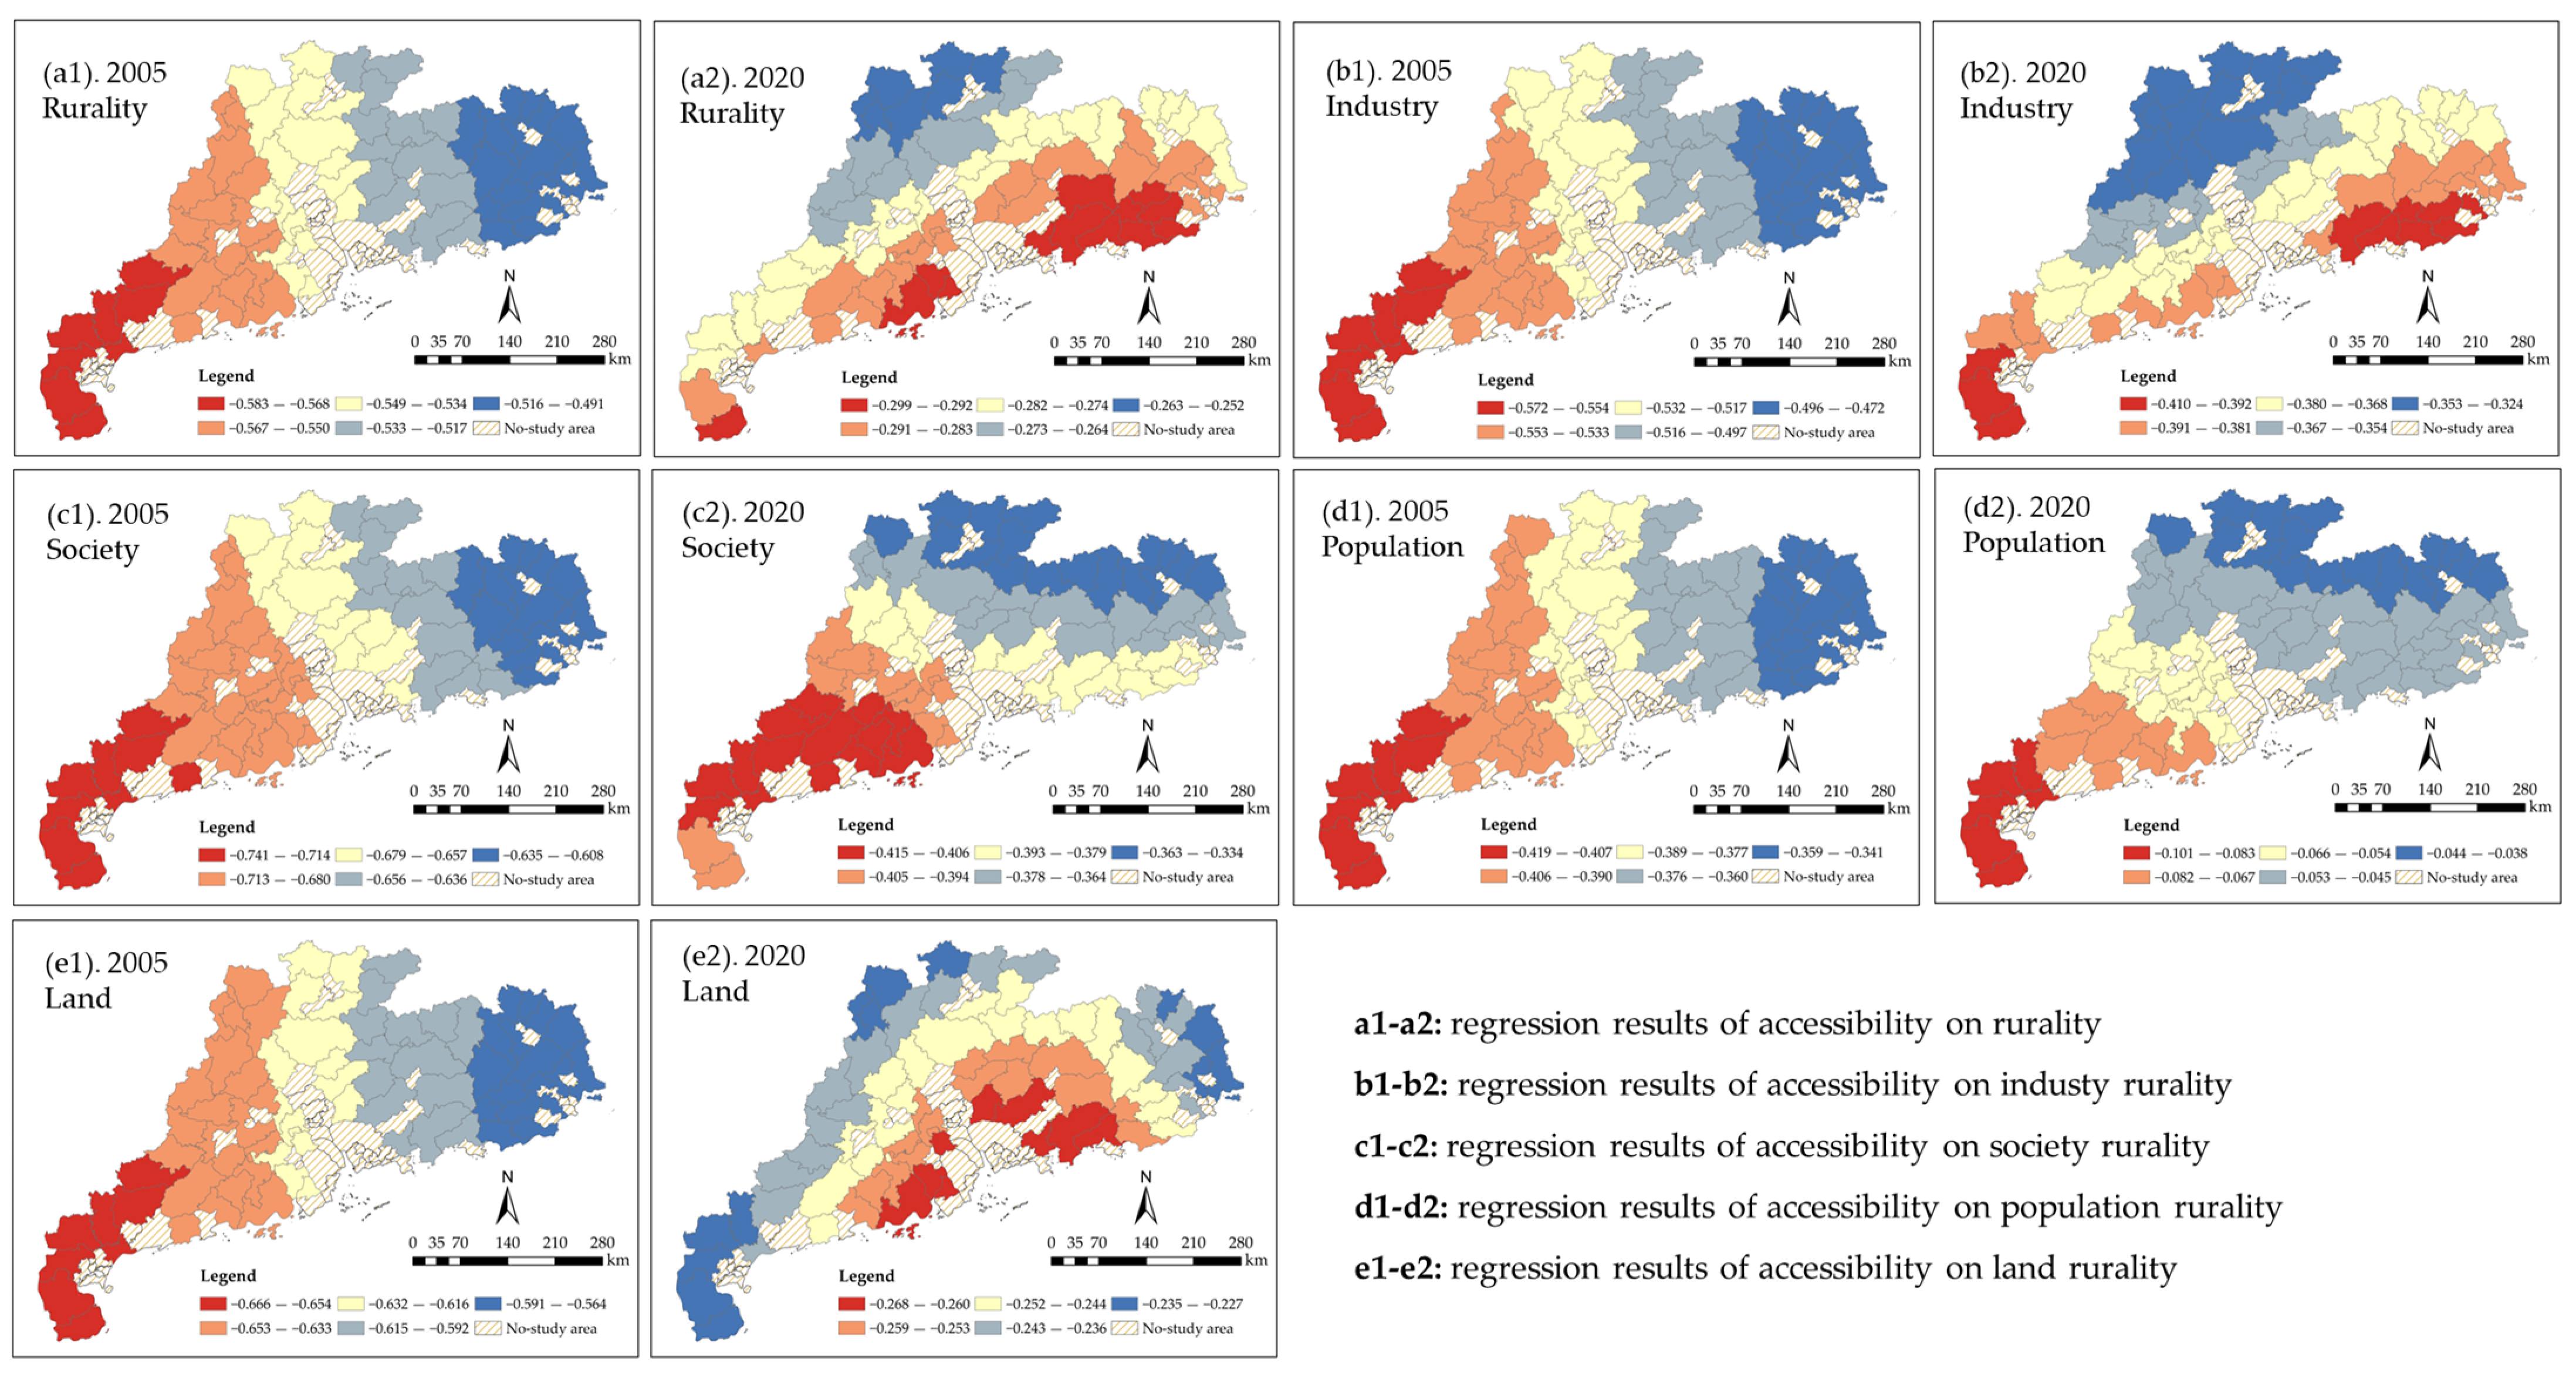
3.4. The Influence Effect of TA on the CRI
4. Discussion
4.1. External Evidence and Theoretical Thinking
4.2. Policy Suggestions for Sustainable Development
5. Conclusions
Author Contributions
Funding
Data Availability Statement
Conflicts of Interest
References
- Long, H.L.; Liu, S.Y.; Zou, J. Assessment of rural development types and their rurality in Eastern Coastal China. Acta Geogr. Sin. 2009, 64, 426–434. [Google Scholar] [CrossRef]
- Sun, Y.; Cheng, Y.; Zhang, P. Spatio-temporal dynamics of rurality in Northeast China. Geogr. Res. 2015, 34, 1864–1874. [Google Scholar]
- Li, H.; Zhang, X. A Review and Trend on Rurality. Hum. Geogr. 2015, 30, 16–20+142. [Google Scholar] [CrossRef]
- Li, Z.; Zhang, X.; Li, H.; Fan, L. Research on Rurality at Village Scale and Rural Development Model: A Case of Jintan City, Jiangsu Province. Sci. Geogr. Sin. 2017, 37, 1194–1202. [Google Scholar] [CrossRef]
- Zhang, W.; Zhang, Z.; Dong, J.; Zhang, H.; Gong, W. Toward rural-urban co-governance: An interpretation of the change of rural-urban relationship since the reform and opening up. Prog. Geogr. 2021, 40, 883–896. [Google Scholar] [CrossRef]
- Chen, C.; LeGates, R.; Zhao, M.; Fang, C. The changing rural-urban divide in China’s megacities. Cities 2018, 81, 81–90. [Google Scholar] [CrossRef]
- Yao, W. Review of the influence of urban-rural differences at home and abroad. Int. J. Educ. Humanit. 2023, 11, 455–457. [Google Scholar] [CrossRef]
- Zhao, P.; Yu, Z.; Jia, Y. Cross-regional travel and regional system of rural China. Sci. Geogr. Sin. 2020, 40, 498–508. [Google Scholar] [CrossRef]
- Xu, Y.; Li, S.; Juan, Y.; Guo, H.; Lin, H. A kano–iS model for the sustainable renovation of living environments in rural settlements in China. Buildings 2022, 12, 1230. [Google Scholar] [CrossRef]
- Li, L.; Liu, D.; Ji, X. Review on Rural Transport Geography. J. Earth Sci. Environ. 2023, 45, 719–733. [Google Scholar]
- Zhu, M.; Wang, Z.; Cui, H.; Yang, Y.; Qie, P. Situation and hotspot analysis on rural transport infrastructure from the perspective of bibliometric analysis. J. Traffic Transp. Eng. (Engl. Ed.) 2023, 10, 1074–1098. [Google Scholar] [CrossRef]
- Wang, Z.; Sun, S. Transportation infrastructure and rural development in China. China Agric. Econ. Rev. 2016, 8, 516–525. [Google Scholar] [CrossRef]
- United Nations (UN). Transforming our World: The 2030 Agenda for Sustainable Development; UN: New York, NY, USA, 2015. [Google Scholar]
- Zhu, B.; Yin, X.; Zhang, X. Spatial Pattern and Accessibility of Rural Settlements—A Case Study on Sheyang County in Jiangsu Province. Sci. Geogr. Sin. 2015, 35, 1560–1567. [Google Scholar] [CrossRef]
- Filani, M.O. Transport and rural development in Nigeria. J. Transp. Geogr. 1993, 1, 248–254. [Google Scholar] [CrossRef]
- Sieber, N. Appropriate transport and rural development in Makete district, Tanzania. J. Transp. Geogr. 1998, 6, 69–73. [Google Scholar] [CrossRef]
- Li, S.; Yang, R.; Long, H. The theoretical evolution of global rural development and its enlightenment to rural modernization in China. Acta Geogr. Sin. 2024, 79, 854–872. [Google Scholar] [CrossRef]
- Xiao, L.; Yu, Z.; Ye, H.; Zhang, G.; Guo, Q. The research of coupling rural development and economy cluster in Fujian province. Acta Geogr. Sin. 2015, 70, 615–624. [Google Scholar] [CrossRef]
- Woods, M. Performing rurality and practising rural geography. Prog. Hum. Geogr. 2010, 34, 835–846. [Google Scholar] [CrossRef]
- Zhang, X. On discrimination of rural definitions. Acta Geogr. Sin. 1998, 53, 365–371. [Google Scholar]
- Blunden, J.R.; Pryce, W.T.R.; Dreyer, P. The Classification of Rural Areas in the European Context: An Exploration of a Typology Using Neural Network Applications. Reg. Stud. 1998, 32, 149–160. [Google Scholar] [CrossRef]
- Cloke, P.J. Changing patterns of urbanisation in rural areas of England and Wales, 1961–1971. Reg. Stud. 1978, 12, 603–617. [Google Scholar] [CrossRef] [PubMed]
- Shucksmith, M.; Brown, D.L. Routledge International Handbook of Rural Studies; Routledge: London, UK, 2016. [Google Scholar] [CrossRef]
- Cloke, P.; Edwards, G. Rurality in England and Wales 1981: A replication of the 1971 index. Reg. Stud. 1986, 20, 289–306. [Google Scholar] [CrossRef]
- Woods, M. Rural Geography: Processes, Responses and Experiences in Rural Restructuring. Rural. Geogr. Process. Responses Exp. Rural. Restruct. 2005, 7, 494–496. [Google Scholar] [CrossRef]
- Halfacree, K.H. Locality and social representation: Space, discourse and alternative definitions of the rural. J. Rural. Stud. 1993, 9, 23–37. [Google Scholar] [CrossRef]
- Waldorf, B.S. A Continuous Multi-dimensional Measure of Rurality: Moving Beyond Threshold Measures. In Proceedings of Annual Meeting of American Agricultural Economic Association; American Agricultural Economics Association: Long Island, CA, USA, 2006; pp. 1–28. [Google Scholar]
- Harrington, V.; O’Donoghue, D. Rurality in England and Wales 1991: A Replication and Extension of the 1981 Rurality Index. Sociol. Rural. 2002, 38, 178–203. [Google Scholar] [CrossRef]
- Hidle, K.; Cruickshank, J.; Mari Nesje, L. Market, commodity, resource, and strength: Logics of Norwegian rurality. Nor. Geogr. Tidsskr. Nor. J. Geogr. 2007, 60, 189–198. [Google Scholar] [CrossRef]
- Johansen, P.H.; Nielsen, N.C. Bridging between the regional degree and the community approaches to rurality—A suggestion for a definition of rurality for everyday use. Land Use Policy 2012, 29, 781–788. [Google Scholar] [CrossRef]
- Li, Y.R.; Long, H.L.; Liu, Y.S. Spatio-temporal pattern of China’s rural development: A rurality index perspective. J. Rural. Stud. 2015, 38, 12–26. [Google Scholar] [CrossRef]
- Wang, Y.F.; Cheng, L.L.; Zheng, Y. Rural Effectiveness Evaluation: A New Way of Assessing Village Development Status. Sustainability 2022, 14, 9059. [Google Scholar] [CrossRef]
- Li, D.Z.; Wu, H.; Huang, G.Y.; Feng, H.B.; Ding, J.Y. Spatiotemporal Evolution of Provincial Rural Infrastructure Development Level in China. J. Infrastruct. Syst. 2023, 29, 05023005. [Google Scholar] [CrossRef]
- Hu, H.Q.; Ma, Y.; Wu, S.J. Fuzzy comprehensive evaluation on high-quality development of China’s rural economy based on entropy weight. J. Intell. Fuzzy Syst. 2020, 38, 7531–7539. [Google Scholar] [CrossRef]
- Li, X. Research on the Development Level of Rural E-Commerce in China Based on Analytic Hierarchy and Systematic Clustering Method. Sustainability 2022, 14, 8816. [Google Scholar] [CrossRef]
- Mei, Y.; Miao, J.; Lu, Y. Digital Villages Construction Accelerates High-Quality Economic Development in Rural China through Promoting Digital Entrepreneurship. Sustainability 2022, 14, 14224. [Google Scholar] [CrossRef]
- Shi, J.W.; Yang, X.Y. Sustainable Development Levels and Influence Factors in Rural China Based on Rural Revitalization Strategy. Sustainability 2022, 14, 8908. [Google Scholar] [CrossRef]
- Shcherbak, V.; Ganushchak-Yefimenko, L.; Nifatova, O.; Fastovets, N.O.; Plysenko, G.; Lutay, L.; Tkachuk, V.; Ptashchenko, O.V. Use of key indicators to monitor sustainable development of rural areas. Glob. J. Environ. Sci. Manag. 2020, 6, 175–190. [Google Scholar] [CrossRef]
- Ma, L.; Li, T.; Li, T.; Long, D.; Chen, Y. Spatial Distribution of Rurality and Types of Rural Development in Farming-Pastoral Ecotone in Northern China. Econ. Geogr. 2015, 35, 126–133. [Google Scholar] [CrossRef]
- Yang, R.; Liu, Y.; Long, H.; Zhang, Y. Research progress and prospect of rural transformation and reconstruction in China: Paradigms and main content. Prog. Geogr. 2015, 34, 475–486. [Google Scholar]
- Cheng, M.Y.; Li, L.N.; Zhou, Y. Exploring the urban-rural development differences and influencing factors in the Huang-Huai-Hai Plain of China. J. Geogr. Sci. 2020, 30, 1603–1616. [Google Scholar] [CrossRef]
- Huang, B.-W.; Yang, Y.-C. Evaluation Indicators and Development Strategies of Agricultural Revitalization for Rural Rejuvenation. J. Rev. Glob. Econ. 2018, 7, 269–279. [Google Scholar] [CrossRef]
- Li, T.; Long, H. Study on the Spatio-temporal Pattern of Rural Transformation Development in Shandong province. Geogr. Res. 2014, 33, 490–500. [Google Scholar] [CrossRef]
- Han, D.; Qiao, J.; Ma, Y. Spatio-temporal Differentiation and Evolution of Rurality under the Background of Rapid Industrialization: A CaseStudy of Gongyi city, Henan province. Geogr. Res. 2017, 36, 2405–2418. [Google Scholar]
- Wei, K.; Wang, W.; Fahad, S. Spatial and temporal characteristics of rural livability and its influencing factors: Implications for the development of rural revitalization strategy. Environ. Sci. Pollut. Res. Int. 2023, 30, 49162–49179. [Google Scholar] [CrossRef]
- Dong, Y.; Guo, Y.; Li, Z.; Lin, S. Spatio-temporal differentiation and driving mechanism of rurality in the Yangtze River Economic Belt. J. Nat. Resour. 2022, 37, 378–395. [Google Scholar] [CrossRef]
- Zelaschi, C.; Monteiro, R.; Pinho, R. Critical Assessment of Intensity Measures for Seismic Response of Italian RC Bridge Portfolios. J. Earthq. Eng. 2017, 23, 980–1000. [Google Scholar] [CrossRef]
- Forcellini, D. Seismic resilience of bridges isolated with traditional and geotechnical seismic isolation (GSI). Bull. Earthq. Eng. 2023, 21, 3521–3535. [Google Scholar] [CrossRef]
- Zhao, P.; Hu, H.; Yu, Z. Rural Travel Behavior and Areal System in China. Hum. Geogr. 2020, 35, 1–8+138. [Google Scholar] [CrossRef]
- Choi, M.; Schuster, A.M.; Schoenberg, N.E. Solutions to the Challenge of Meeting Rural Transportation Needs: Middle-Aged and Older Adults’ Perspectives. J. Gerontol. Soc. Work 2019, 62, 415–431. [Google Scholar] [CrossRef]
- Woods, M. Advocating rurality? The repositioning of rural local government. J. Rural. Stud. 1998, 14, 13–26. [Google Scholar] [CrossRef]
- Cloke, P. The Countryside: Development, Conservation and an Increasingly Marketable Commodity; Pergamon Press: London, UK, 1992. [Google Scholar]
- Qin, X.; Wu, H.; Shan, T. Rural infrastructure and poverty in China. PLoS ONE 2022, 17, e0266528. [Google Scholar] [CrossRef]
- Li, P.; Chen, W.; Sun, W. Spatial differentiation and influencing factors of rural territorial multifunctions in developed regions: A case study of Jiangsu Province. Acta Geogr. Sin. 2014, 69, 797–807. [Google Scholar] [CrossRef]
- Panagiotopoulos, G.; Kaliampakos, D. Accessibility and Spatial Inequalities in Greece. Appl. Spat. Anal. Policy 2018, 12, 567–586. [Google Scholar] [CrossRef]
- Caschili, S.; De Montis, A.; Trogu, D. Accessibility and rurality indicators for regional development. Comput. Environ. Urban Syst. 2015, 49, 98–114. [Google Scholar] [CrossRef]
- Vaishar, A.; Šťastná, M. Accessibility of Services in Rural Areas: Southern Moravia Case Study. Sustainability 2021, 13, 9103. [Google Scholar] [CrossRef]
- Neumeier, S. Accessibility to Services in Rural Areas. Disp Plan. Rev. 2016, 52, 32–49. [Google Scholar] [CrossRef]
- Yao, Q.; An, N.; Gu, G.; Yang, E.; Yang, H.; Li, C.; Yan, K. Research Progress on Features and Characteristics of Rural Settlements: Literature Distribution, Key Issues, and Development Trends. Buildings 2023, 13, 2457. [Google Scholar] [CrossRef]
- Kaiser, N.; Barstow, C.K. Rural Transportation Infrastructure in Low- and Middle-Income Countries: A Review of Impacts, Implications, and Interventions. Sustainability 2022, 14, 2149. [Google Scholar] [CrossRef]
- Lu, H.Y.; Zhao, P.J.; Hu, H.Y.; Zeng, L.G.; Wu, K.S.; Lv, D. Transport infrastructure and urban-rural income disparity: A municipal-level analysis in China. J. Transp. Geogr. 2022, 99, 103292. [Google Scholar] [CrossRef]
- Zhang, H.; Wu, D. The Impact of Transport Infrastructure on Rural Industrial Integration: Spatial Spillover Effects and Spatio-Temporal Heterogeneity. Land 2022, 11, 1116. [Google Scholar] [CrossRef]
- Sasmal, R.; Sasmal, J. Public expenditure, economic growth and poverty alleviation. Int. J. Soc. Econ. 2016, 43, 604–618. [Google Scholar] [CrossRef]
- Chotia, V.; Rao, N.V.M. Investigating the interlinkages between infrastructure development, poverty and rural–urban income inequality. Stud. Econ. Financ. 2017, 34, 466–484. [Google Scholar] [CrossRef]
- Bureau, G.S. Guangdong Statistical Yearbook; China Statistics Press: Beijing, China, 2020. [Google Scholar]
- Bureau, G.S. Guangdong Statistical Yearbook (Township); China Statistical Press: Beijing, China, 2020. [Google Scholar]
- Du, Y.; Zhao, Z.; Liu, S.; Li, Z. The Impact of Agricultural Labor Migration on the Urban–Rural Dual Economic Structure: The Case of Liaoning Province, China. Land 2023, 12, 622. [Google Scholar] [CrossRef]
- Chen, K.; Long, H.; Liao, L.; Tu, S.; Li, T. Land use transitions and urban-rural integrated development: Theoretical framework and China’s evidence. Land Use Policy 2020, 92, 104465. [Google Scholar] [CrossRef]
- Zheng, Y.; Tan, J.; Huang, Y.; Wang, Z. The Governance Path of Urban–Rural Integration in Changing Urban–Rural Relationships in the Metropolitan Area: A Case Study of Wuhan, China. Land 2022, 11, 1334. [Google Scholar] [CrossRef]
- Sánchez, L.; Pacheco, E. Rural Population Trends in Mexico: Demographic and Labor Changes; Springer: Amsterdam, The Netherlands, 2012. [Google Scholar]
- Wang, H.; Zhu, Y.; Huang, W.; Yin, J.; Niu, J. Spatio-Temporal Evolution and Driving Mechanisms of Rural Residentials from the Perspective of the Human-Land Relationship: A Case Study from Luoyang, China. Land 2022, 11, 1216. [Google Scholar] [CrossRef]
- Wang, G.; Wang, M.; Wang, J.; Yang, C. Spatio-Temporal Characteristics of Rural Economic Development in Eastern Coastal China. Sustainability 2015, 7, 1542–1557. [Google Scholar] [CrossRef]
- Ma, S.J.; Jing, Z.M. Per Capita Disposable Income of Rural Resident in China. Technol. Econ. 2018, 37, 131–137. [Google Scholar] [CrossRef]
- Nie, X.; Shi, P.; Zhang, X.; Rui, l.; Zhu, Y.; Wei, W. Research on Rurality Evaluation and the Driving Mechanism in Arid Regions of Northwest China: A Case Study of Wuwei City in Gansu Province. Sci. Geogr. Sin. 2017, 37, 585–594. [Google Scholar] [CrossRef]
- Peng, L.; Liu, S.Q.; Sun, L. Spatial temporal changes of rurality driven by urbanization and industrialization: A case study of the Three Gorges Reservoir Area in Chongqing, China. Habitat. Int. 2016, 51, 124–132. [Google Scholar] [CrossRef]
- Liu, X. General Description of Spatial Accessibility. Urban Transp. China 2007, 5, 36–43. [Google Scholar] [CrossRef]
- Hansen, W.G. How Accessibility Shapes Land Use. J. Am. Inst. Plan. 1959, 25, 73–76. [Google Scholar] [CrossRef]
- Geurs, K.T.; van Wee, B. Accessibility evaluation of land-use and transport strategies: Review and research directions. J. Transp. Geogr. 2004, 12, 127–140. [Google Scholar] [CrossRef]
- Gutiérrez, J.; Condeço-Melhorado, A.; Martín, J.C. Using accessibility indicators and GIS to assess spatial spillovers of transport infrastructure investment. J. Transp. Geogr. 2010, 18, 141–152. [Google Scholar] [CrossRef]
- Zhang, P.; Li, W.; Zhao, K.; Zhao, S. Spatial pattern and driving mechanism of urban–rural income gap in Gansu province of China. Land 2021, 10, 1002. [Google Scholar] [CrossRef]
- Anselin, L. The Moran scatterplot as an ESDA tool to assess local instability in spatial association. In Spatial Analytical Perspectives on GIS, 1st ed.; Fischer, M., Scholten, H.J., Unwin, D., Eds.; Taylor & Francis: London, UK, 1996; Volume 8, pp. 111–126. [Google Scholar]
- Zhao, K.; Qi, M.; Yan, X.; Li, L.; Huang, X. Dynamic Impact of Urban Built Environment on Land Surface Temperature Considering Spatio-Temporal Heterogeneity: A Perspective of Local Climate Zone. Land 2023, 12, 2148. [Google Scholar] [CrossRef]
- Zhang, S.; Zhao, K.; Ji, S.; Guo, Y.; Wu, F.; Liu, J.; Xie, F. Evolution Characteristics, Eco-Environmental Response and Influencing Factors of Production-Living-Ecological Space in the Qinghai–Tibet Plateau. Land 2022, 11, 1020. [Google Scholar] [CrossRef]
- JTGB01-2020; Technical Standards of Highway Engineering. Ministry of Transport of the People’s Republic of China (MOT): Beijing, China, 2020.
- Long, H.L.; Ma, L.; Zhang, Y.N.; Qu, L.L. Multifunctional rural development in China: Pattern, process and mechanism. Habitat. Int. 2022, 121, 102530. [Google Scholar] [CrossRef]
- Yang, W.; Li, W.; Wang, L. How should rural development be chosen? The mechanism narration of rural regional function: A case study of Gansu Province, China. Heliyon 2023, 9, e20485. [Google Scholar] [CrossRef]
- van Berkel, D.B.; Verburg, P.H. Sensitising rural policy: Assessing spatial variation in rural development options for Europe. Land Use Policy 2011, 28, 447–459. [Google Scholar] [CrossRef]
- Zhang, X.; Wu, H.; Li, Z.; Li, X. Spatial–Temporal Evolution Characteristics and Driving Factors of Rural Development in Northeast China. Land 2023, 12, 1407. [Google Scholar] [CrossRef]
- Ahmed, S.; Eklund, E. Rural Accessibility, Rural Development, and Natural Disasters in Bangladesh. J. Dev. Soc. 2019, 35, 391–411. [Google Scholar] [CrossRef]
- Hine, J.S.M.; Torbaghan, M.E.; Burrow, M.; Usman, K. Evidence of the Impact of Rural Road Investment on Poverty Reduction and Economic Development; Institute of Development Studies: Brigton, UK, 2019. [Google Scholar]
- Shafieezadeh, A.; Ramanathan, K.; Padgett, J.E.; DesRoches, R. Fractional order intensity measures for probabilistic seismic demand modeling applied to highway bridges. Earthq. Eng. Struct. Dyn. 2012, 41, 391–409. [Google Scholar] [CrossRef]
- Afukaar, F.; Damsere-Derry, J.; Peters, K.; Starkey, P. Rural Transport Services Indicators: Using a new mixed-methods methodology to inform policy in Ghana. Transp. Res. Interdiscip. Perspect. 2019, 3, 100074. [Google Scholar] [CrossRef]
- Bassey, S.; Eteng, S.; Ewah, E.F. Assessment of Rural Transportation in Abi Local Government Area, Cross River State, Nigeria. Glob. Sustain. Res. 2022, 1, 30–41. [Google Scholar] [CrossRef]
- Kamaludin, A.S.; Qibthiyyah, R.M. Village Road Quality and Accessibility on Transforming Rural Development. AGRARIS J. Agribus. Rural. Dev. Res. 2022, 8, 160–180. [Google Scholar] [CrossRef]
- Li, W.W.; Zhang, P.; Zhao, K.X.; Chen, H.; Zhao, S.D. The Evolution Model of and Factors Influencing Digital Villages: Evidence from Guangxi, China. Agriculture 2023, 13, 659. [Google Scholar] [CrossRef]
- Aderamo, A.J.; Magaji, S.A. Rural Transportation and the Distribution of Public Facilities in Nigeria: A Case of Edu Local Government Area of Kwara State. J. Hum. Ecol. 2010, 29, 171–179. [Google Scholar] [CrossRef]


| Type | Indicator | Calculation | Direction |
|---|---|---|---|
| population | Rural population change rate | (End stage rural population—initial rural population)/initial rural population | Positive |
| The proportion of employees in the primary industry | Number in primary industry labor force/total number in rural labor force | Positive | |
| land | Change rate of planting area | (End stage planting area—initial planting area)/initial planting area | Positive |
| Per capita planting area | Planting area at the end of the year/total rural population | Positive | |
| society | Income level of rural population | Per capita disposable income in rural areas | Negative |
| industry | The proportion of primary industry | Primary industry output value/total output value | Positive |
| Labor productivity in the primary industry | Output value of primary industry/number in labor force in primary industry | Negative | |
| Agricultural land productivity | Total agricultural output value/agricultural planting area at the end of the year | Negative | |
| Per capita crop production | Total output of planting industry/total rural population | Positive |
| Year | First-Class Roads | Second-Class Roads | Third-Class Roads | Fourth-Class Roads | Railway | ||
|---|---|---|---|---|---|---|---|
| Ordinary Railway | Intercity Railway | High-Speed Railway | |||||
| 2005 | 90 | 60 | 50 | 30 | 70 | \ | \ |
| 2010 | 100 | 80 | 60 | 30 | 90 | 160 | 200 |
| 2015 | 100 | 80 | 60 | 40 | 120 | 200 | 300 |
| 2020 | 120 | 90 | 70 | 40 | 160 | 200 | 350 |
Disclaimer/Publisher’s Note: The statements, opinions and data contained in all publications are solely those of the individual author(s) and contributor(s) and not of MDPI and/or the editor(s). MDPI and/or the editor(s) disclaim responsibility for any injury to people or property resulting from any ideas, methods, instructions or products referred to in the content. |
© 2024 by the authors. Licensee MDPI, Basel, Switzerland. This article is an open access article distributed under the terms and conditions of the Creative Commons Attribution (CC BY) license (https://creativecommons.org/licenses/by/4.0/).
Share and Cite
Zhang, S.; Ma, W.; Wu, F.; Zhao, K. Unveiling the Impact of Transportation Infrastructure Construction on Rurality: A Case Study from Guangdong, China. Buildings 2024, 14, 2288. https://doi.org/10.3390/buildings14082288
Zhang S, Ma W, Wu F, Zhao K. Unveiling the Impact of Transportation Infrastructure Construction on Rurality: A Case Study from Guangdong, China. Buildings. 2024; 14(8):2288. https://doi.org/10.3390/buildings14082288
Chicago/Turabian StyleZhang, Shuaibing, Wei Ma, Fengqi Wu, and Kaixu Zhao. 2024. "Unveiling the Impact of Transportation Infrastructure Construction on Rurality: A Case Study from Guangdong, China" Buildings 14, no. 8: 2288. https://doi.org/10.3390/buildings14082288
APA StyleZhang, S., Ma, W., Wu, F., & Zhao, K. (2024). Unveiling the Impact of Transportation Infrastructure Construction on Rurality: A Case Study from Guangdong, China. Buildings, 14(8), 2288. https://doi.org/10.3390/buildings14082288