Abstract
Manufactured sand (MS), due to its wide availability and cost-effectiveness, is used as an alternative aggregate for quartz sand (QS) in ultra-high-performance concrete (UHPC) to prepare ultra-high-performance manufactured sand concrete (UHPMC). This study aims to assess the bond behavior of 600 MPa-grade, high-strength, hot-rolled ribbed bars (HRB 600) in UHPMC. Thirty specimens were designed for the pull-out tests, taking into account several feature parameters, including MS replacement ratio (0%, 50%, 100%), water–binder ratio (0.17, 0.19, 0.21), steel fiber content (0%, 1%, 2%), and anchorage length (2d, 3d, 4d, 5d). The effects of the feature parameters on the failure mode, bond stress–slip curves, bond strength, bond-slip mechanism, and constitutive model were analyzed and illustrated. The results reveal that the pull-out specimen of UHPMC exhibits three distinct failure modes: rebar pull-out failure, UHPMC splitting failure, and splitting-pull-out failure. The bond strength increases from 46.57 MPa to 56.92 MPa when the steel fiber content increases from 0% to 2%. Additionally, a decrease in anchoring length is beneficial for improving the bond strength; as the anchoring length increases from 2d to 5d, the bonding strength decreases by 35.84%. The bond strength increases with an increase in the MS replacement ratio. As for the water–binder ratio, the bond strength presents the highest value when the water–binder ratio is 0.17. In addition, a new bond-slip constitutive model applicable to UHPMC and HRB 600 rebar, considering the MS replacement ratio, the water–binder ratio, etc., is proposed, which presents favorable prediction accuracy.
1. Introduction
Ultra-high-performance concrete (UHPC) belongs to novel cement-based material, which is formed by combining cement, silica fume (SF), quartz sand (QS), quartz powder (QP), steel fiber, water reducer, etc., and exhibits remarkable strength, resilience, durability, and a wide range of potential applications. The most common kind of traditional UHPC aggregates are QS. However, the excessive extraction of QS has led to an increasingly widening supply–demand gap, aggravating problems that include longer building schedules and rising transportation costs [1,2,3]. Therefore, new UHPC aggregates that meet both mechanical performances and environmental protection standards are significant for the practical promotion of UHPC.
Manufactured sand (MS) refers to the aggregate obtained by crushing and screening rocks through making machines and other ancillary equipment. MS is a perfect replacement material for UHPC aggregates because it comes from various sources and performs well economically. Kay et al. [4] successfully prepared UHPMC with excellent performance and proposed mixed design suggestions, indicating that the preparation of UHPMC using MS is entirely feasible. The influence of MS on UHPC was studied by Zhang et al. [5]. The angularity of MS improved the porosity of the aggregate, increased the permeability, and reduced the shear strength. Donza et al. [6] demonstrated the compressive strength of UHPC and found that MS can improve the compressive strength. Sobuz et al. [7] found that UHPMC with good fluidity and a compressive strength of 130–160 MPa can be prepared by using MS. Shen et al. [8] found that MS can be used to prepare UHPC with a higher strength than river sand. Kumar et al. [9] used MS instead of QS to study the bending characteristics of UHPMC beams. Studies have shown that adding more stone powder will cause the beams’ flexural strength to decrease. The particle shape of MS lowered the bonding force of reinforcement concrete. Zhao et al. [10] analyzed the effect of MS content on UHPMC. The findings showed that the flexural strength and compressive strength initially increased and subsequently decreased with increasing MS concentration. Feng et al. [11] simulated the impact process of UHPMC. Research has shown that the compressive strength of UHPMC is similar to that of UHPC, and it has excellent impact resistance. Jiao et al. [12] prepared UHPMC by partially replacing QS with MS and conducted tensile tests on small-scale specimens. The results demonstrated that the MS replacement ratio significantly affected the UHPMC’s stress–strain response. Wei et al. [13] studied the seismic performance of UHPC. The experiment proved the applicability of UHPC in seismic regions. In addition, Pang et al. [14] studied the superduct water-based epoxy concrete composite repair material that, together with UHPC, can be used for structural repair.
Furthermore, despite possessing excellent properties individually, most UHPC structures generally need reinforced bars to achieve more effective performance. Research has been carried out by pertinent academics to comprehend the bonding performance of traditional UHPC rebar. Marchand et al. [15] investigated the bond performance of UHPC-HRB500 rebar. The findings demonstrated that the binding strength rose as the diameter grew and that the results were unaffected by either static or cyclic loading. According to Khaksefidi et al. [16], the binding strength between rebar and UHPC is more than five times stronger than that of NSC. Alkaysi et al. [17] revealed that the bond strength in 7 days could reach approximately 75% of that in 28 days. Han et al. [18] studied the different bonding slip-failure modes of UHPC-HRB400 rebar. They found that the anchorage length of the steel bars must be more than 4 days when they yield and break. Liang et al. [19] investigated bonding performance with HRB 600 rebar. The results showed that the bond strength was mainly determined by the steel fiber content. The effect of the rebar diameter and anchoring length on the bond capacity of HRB400, HRB500, and HRB 600 rebar with UHPC was examined by Hu et al. [20]. According to their findings, the bonding strength of UHPC rebar ranges from 48 to 73 MPa, or approximately six to ten times that of regular concrete. The whole bond–slip curve between UHPC and rebar demonstrated a strong energy dissipation capacity and high toughness. The impact of the rebar diameter on the strength of the bond of GFRP bars-UHPC was examined by Luo et al. [21]. The bond strength improved from 8 to 18 mm as the rebar diameter grew, but it dropped from 18 to 25 mm. Sun et al. [22] studied the bonding performance of sea sand coral concrete with FRP rebar in marine environments, providing valuable data on how different environmental conditions affect the performance of sea sand coral concrete.
From the above analysis, it can be observed that scholars have studied the bonding performance between traditional UHPC and rebar from multiple perspectives, mainly focusing on the rebar diameter, anchorage length, steel fiber content and type, protective layer thickness, etc. However, the bonding performance between UHPMC, using MS as an aggregate, and rebar has yet to be clearly revealed. The effects of the MS replacement ratio, water–binder ratio (w/b), steel fiber content, and anchorage length on bond behavior between UHPMC and rebars need to be demonstrated. In addition, HRB 600 is a brand-new, hot-rolled ribbed rebar with extraordinary flexibility and ultra-high-strength. Comprehensively using the advantages of UHPMC and high-strength rebar in material properties, the self-weight of the structure can be reduced. Research on the bonding performance between HRB 600 and UHPMC is crucial to resolving the fundamental issue with their collaborative force mechanism and advancing the use of two materials in engineering construction.
In this study, the central pull-out test was adopted to investigate the bonding-slip distribution between HRB 600 rebar and UHPMC under various influencing factors. The feature parameters include different MS replacement ratios, w/b, steel fiber content, and anchorage lengths. The bond-slip mechanism between UHPC and HRB 600 was explored. Based on the obtained experimental results, a corresponding constitutive model for bonding-slip behavior between HRB 600 rebar and UHPMC is established by considering variables such as MS replacement ratios, w/b, etc.
2. Materials and Methods
2.1. Material Properties
2.1.1. Ingredients for UHPMC
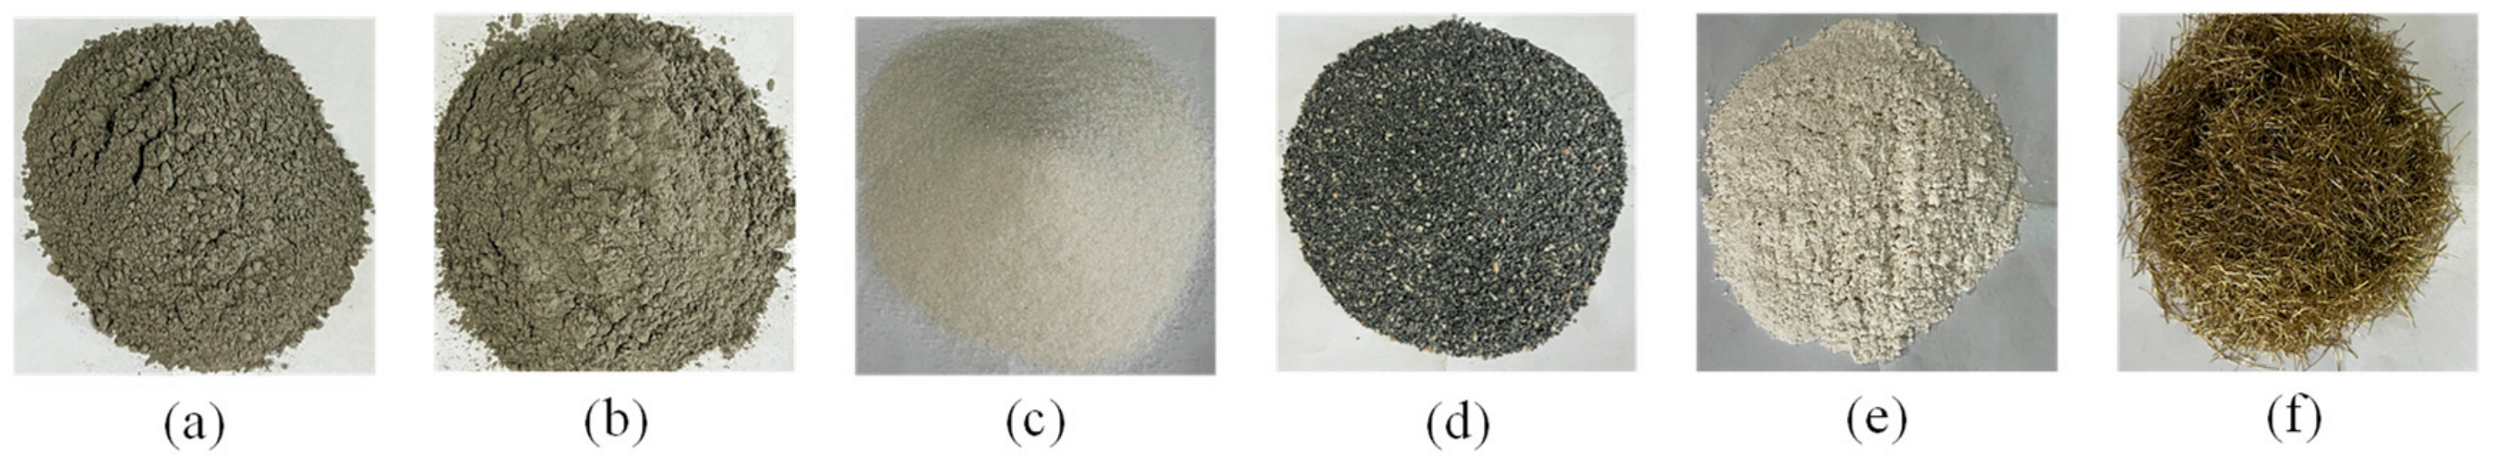
UHPMC is prepared from P·O 52.5 cement, SF, QS, MS, QP, and steel fiber. The apparent morphology of these raw materials is shown in Figure 1. The chemical compositions of cement, SF, QS, MS, and QP are listed in Table 1, and the physical properties of MS and QS are illustrated in Table 2. Crushing value is used as the strength index of MS according to JGJ 52-2006 [23]. The lower the crushing value is, the higher the crushing strength is of the aggregate. Copper-plated steel fiber was adopted. A high-performance polycarboxylic acid water-reducing additive was utilized.

Figure 1.
UHPMC ingredients: (a) cement; (b) SF; (c) QS; (d) MS; (e) QP; (f) steel fibers.

Table 1.
Chemical composition of raw materials in UHPMC (%).
Table 2.
Physical properties of QS and MS.
2.1.2. HRB 600 High-Strength Rebar
In the pull-out test, HRB 600 rebar with a diameter of 16 mm was utilized. Table 3 displays the mechanical properties that were measured.
Table 3.
Mechanical properties of HRB 600 rebar.
2.2. Specimen Details and Mixture Proportions
2.2.1. Specimen Details
Pull-out tests mainly consider four influence parameters. There are a total of 10 groups in the experiment. Each group has 3 cubic specimens (150 mm). The test variables are listed in Table 4. Figure 2 shows the diagram of the pull-out specimen.
Table 4.
Detailed test variables.

Figure 2.
Dimension of the pull-out specimen between UHPMC and HRB 600 rebar.
2.2.2. Mixture Proportion and Mixing Process
UHPMC was designed with fourteen mixed ratio groups, which takes into account the MS replacement ratio (0%, 50%, 100%), w/b (0.17, 0.19, 0.21), and steel fiber content (0%, 1%, 2%), as outlined in Table 5. The concrete mixture needs to be thoroughly and uniformly mixed to guarantee optimal performance. The drying components, such as cement, SF, QP and aggregate, shall be poured into the mixer and stirred for three minutes. Mix the water reducer and water reducer evenly, gradually adding half of the total mixture within 2 min and adding the remaining mixture during the next 2 min of stirring. Finally, slowly disperse the steel fibers and stir for 10 min until the fibers are evenly distributed. According to GB/T 50080-2016 [24] and GB/T 2419-2005 [25], the UHPMC’s workability was assessed by the measurement of the slump and flowability of freshly poured concrete. All specimens had been dried in a typical curing chamber for twenty-eight days.
Table 5.
Mix ratio of UHPMC (kg/m3).
2.3. Test Setup
Utilizing a 1000 kN testing apparatus, the central pull-out test was performed. The test setup is shown in Figure 3. Through the displacement controlling mode, the load was applied. Loading was set to 1.0 mm/min. The slip between the rebar and UHPMC was measured through two displacement meters at both the loading and free ends. When the free-end slip of the rebar reached 15 mm or the specimen was damaged, the corresponding test was terminated.
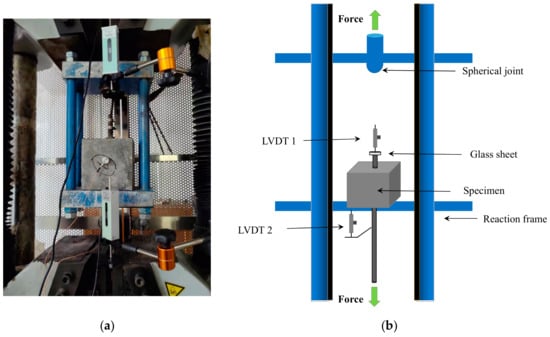
Figure 3.
Pull-out test setup: (a) photograph and (b) schematic.
BC is the real anchoring length of the member’s reinforcement, as shown in Figure 4. During the experiment, the rebar material of section AB did not deform during the loading process, so the data measured at point A are considered as the data at point B. Similarly, point D is used instead of point C, but due to the long CD segment and high stress, the deformation of the reinforcement has a significant impact on the slip at the loading end, so it cannot be ignored.
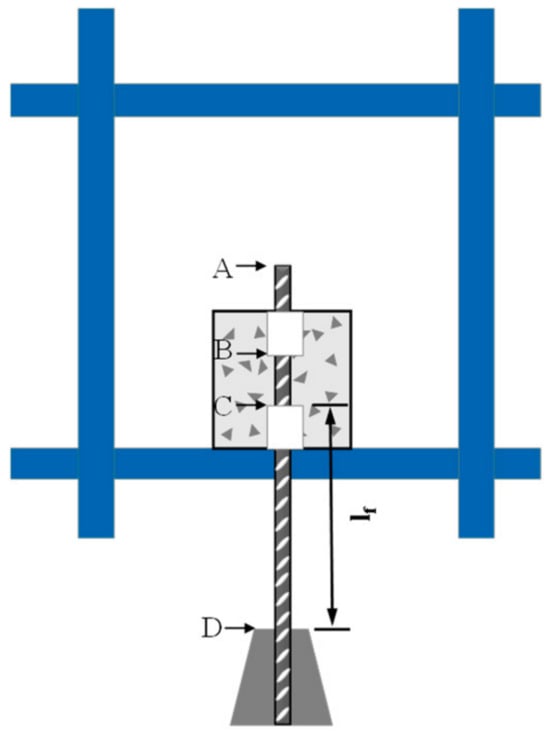
Figure 4.
Measurement diagram: A is the free end endpoint; B and C is the end of the PVC pipe near the center of the concrete; D is the fixed point of the loading end fixture.
The deformation of the CD segment is obtained by Equation (1):
where Sf is the deformation of the CD segment, mm; P is the external load, N; lf is the length of the CD segment, mm; Es is the elastic modulus of rebar, GPa; and As is the rebar cross-sectional area, mm2.
The actual slip of the rebar at the loading end is obtained as follows:
where s is the actual slip, mm; Sl is the load-end slip, mm; and Sd is the deformation of the loading device, mm.
One can determine the average bond strength τ in the following way:
where τ is the average bond strength, MPa; F is the ultimate load, N; d is the rebar diameter, mm; and l is the anchorage length, mm.
3. Results and Discussion
3.1. Workability and Compressive Strength of UHPMC
The compressive strength of UHPMC was tested according to GB/T 31387-2015 [26]. A universal testing machine (UTM) with a range of 2000 kN was used. The results for the workability and compressive strength of UHPMC are illustrated in Figure 5.
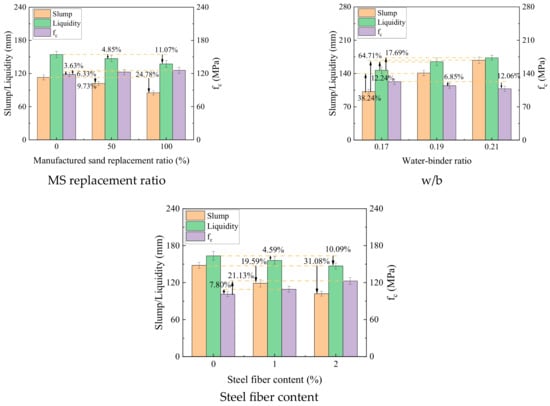
Figure 5.
Workability and compressive strength of UHPMC with different factors.
The results show that the slump and liquidity steadily decline as the MS replacement ratio rises. The reason can be attributed to the multiple edges on the surface of MS, which is not as smooth as QS. Stone powder will lower the amount of free water in MS and have a negative effect on the working performance. Furthermore, there is a significant association between compressive strength and the MS replacement ratio. The slump and liquidity increase with an increase in w/b. When the w/b rises from 0.17 to 0.19, the enhancement impact of UHPMC workability becomes more pronounced. The compressive strength exhibits a negative association with increasing w/b. As the amount of steel fiber in concrete grows, it becomes less workable over time. Because steel fibers are difficult to evenly disperse in concrete, free water cannot wrap well, and the liquidity of concrete is limited. The steel fiber content and compressive strength have a favorable correlation. This is so that the formation of fractures may be efficiently suppressed by the steel fibers.
3.2. Failure Modes
Under the variable factors of the pull-out test, three types of failure modes were observed between HRB 600 rebar and UHPMC, as shown in Figure 6 and Table 6. It is clear that the steel fiber content has the most influence on the failure mode. An alteration of 1% in the steel fiber content results in an entirely different failure mode.
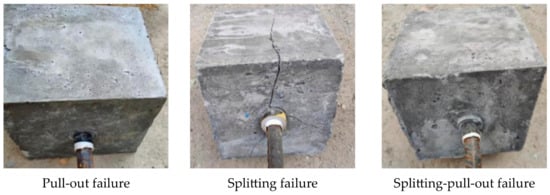
Figure 6.
Observed failure modes of UHPMC specimens.
Table 6.
Experimental results of UHMPC under pull-out test.
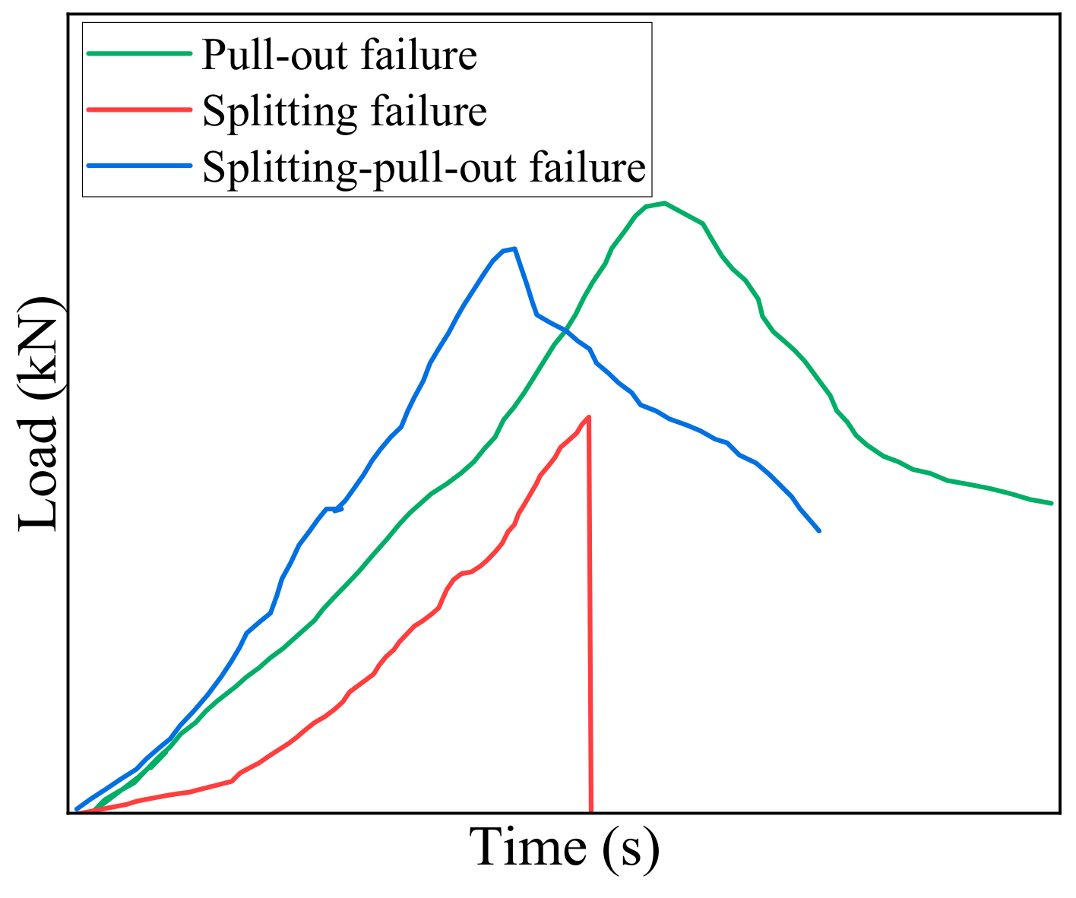
Figure 7 displays the load–time curves for the three different failure modes. Specimens with a 2% steel fiber content are more likely to experience pull-out failure. The concrete surface remains intact without visible cracks. This is because a higher steel fiber content can fully exert its crack resistance ability. Pull-out failure is ductile failure. The splitting failure occurs in the specimen with 0% steel fiber content. Several cracks appearing on the specimen split the concrete into several parts. This is because, without steel fibers, small cracks inside the specimen cannot be suppressed and eventually develop into continuous large cracks. Splitting failure is brittle failure. A total of 1% steel fiber in the sample results in splitting-pull-out failure. This failure mode is between ductile failure and brittle failure.
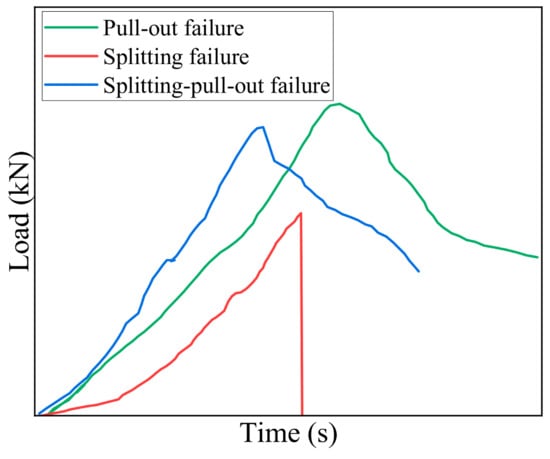
Figure 7.
Typical load versus time curves under different failure modes.
3.3. Effect of Feature Parameters
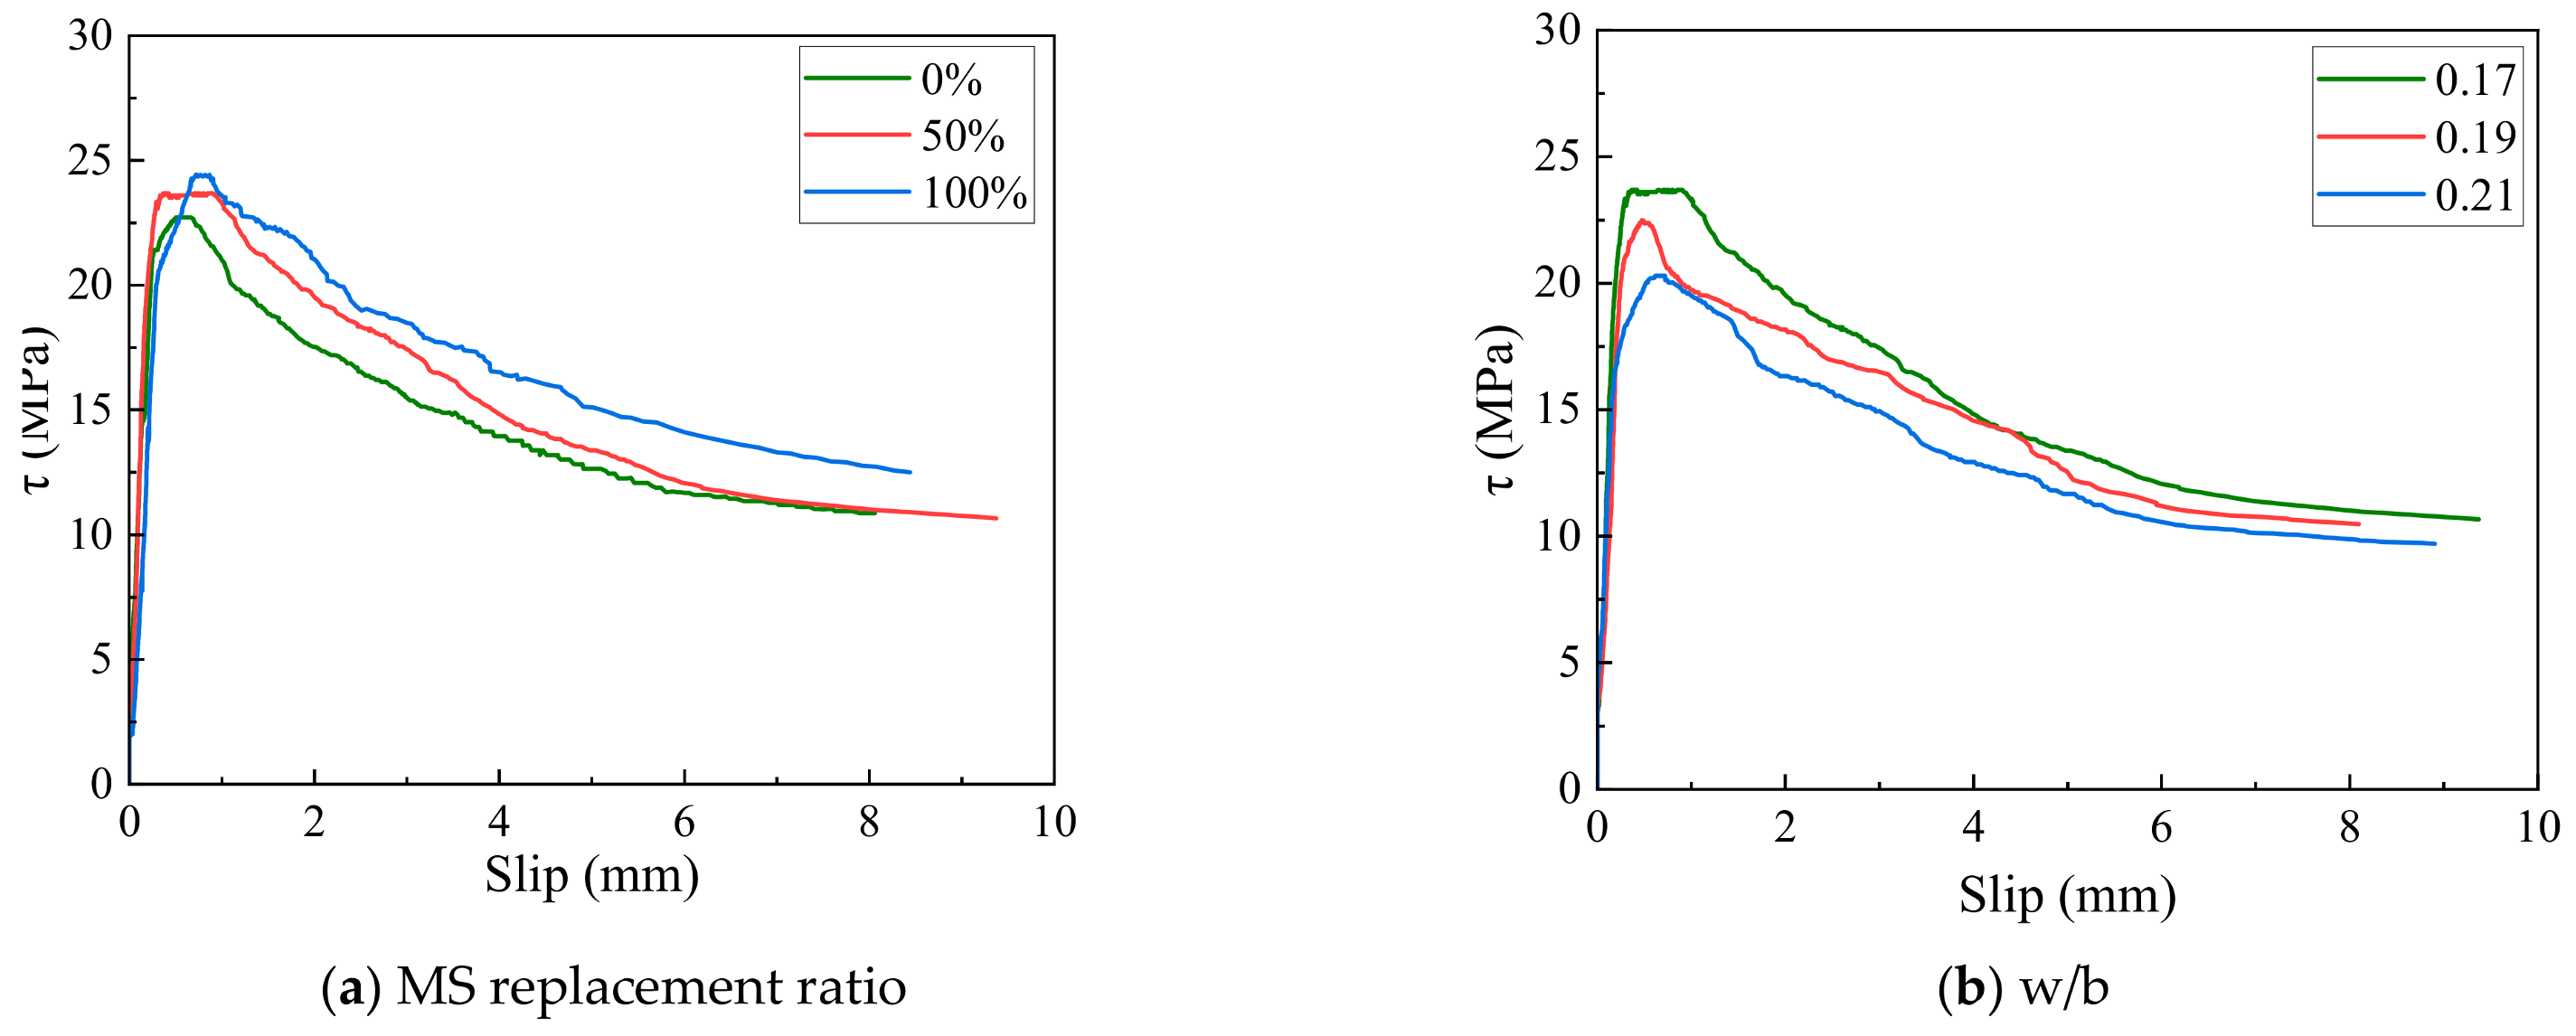
Table 6 lists the average bond strength and peak slip for each group. The average bond stress versus slip curves for each group of specimens (τ-s) are shown in Figure 8.
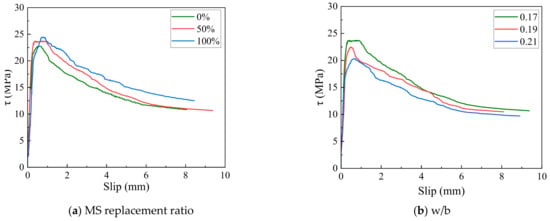
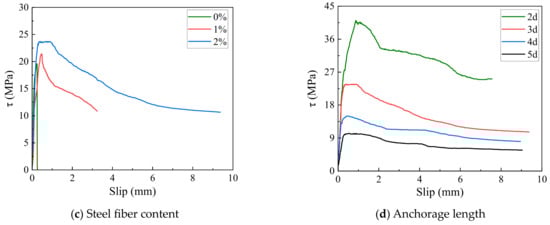
Figure 8.
Average bond stress versus slip curves under various factors.
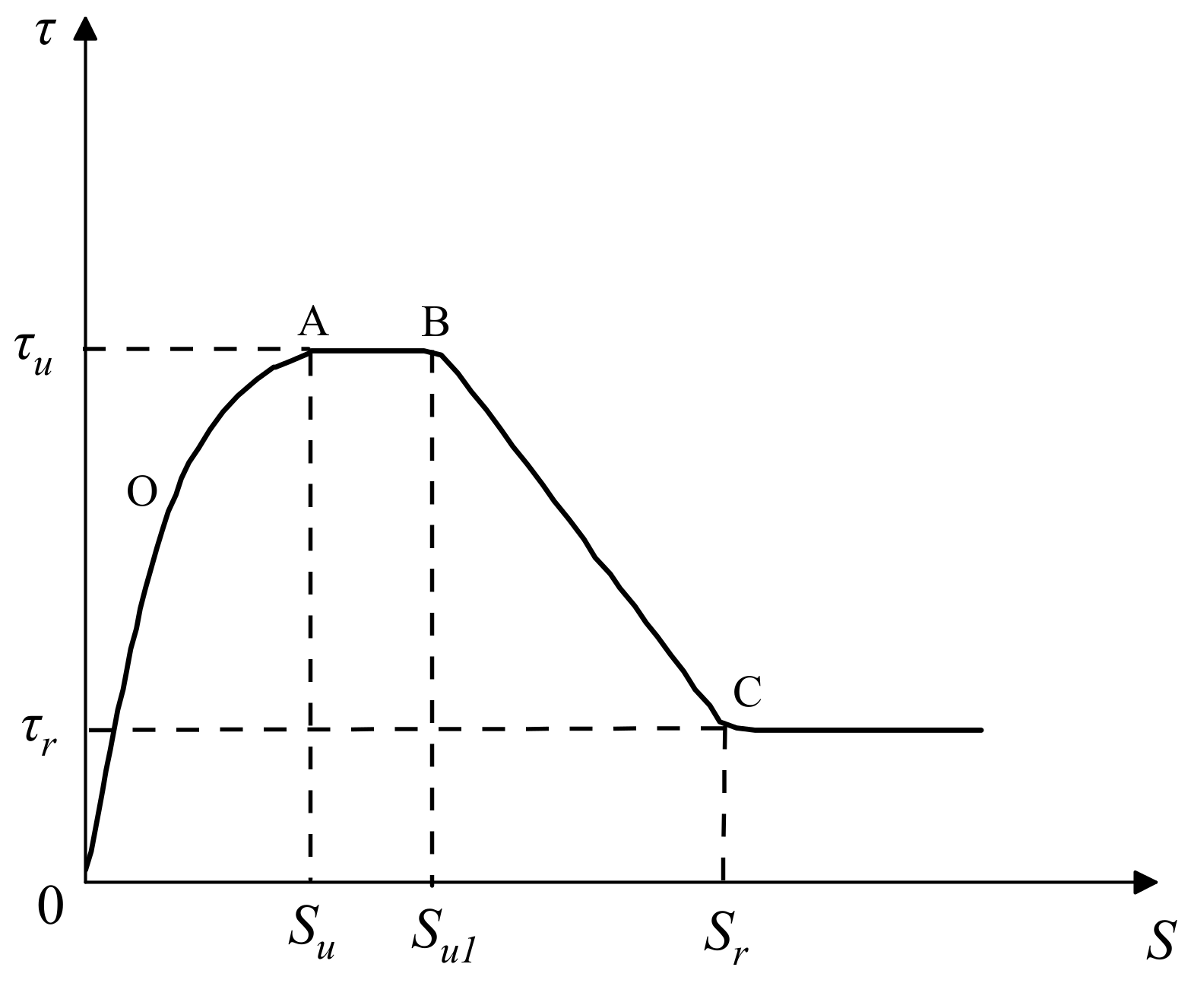
According to Equation (3), the load–slip curve obtained from the experiment is converted into a bond–slip curve. It can be observed that the bond–slip curve initially shows a non-linear upward trend, maintains after reaching its peak intensity, then rapidly decreases, and finally presents a horizontal straight line. Typical bond–slip curves are summarized according to the curve characteristics. It can be divided into four feature points (inflection points), namely elastic point (point O), peak point 1 (point A), peak point 2 (point B), and residual point (point C), as shown in Figure 9. According to the feature points, the characteristic curve is divided into four stages: elastic bond stage, peak stage, falling stage, and residual stage. The elastic bond strength, peak bond strength, and residual bond strength correspond to the elastic point, peak point 1, and residual point, respectively.

Figure 9.
τ–s constitutive model.
3.3.1. Effect of MS Replacement Ratio
The general bond–slip curve form is largely insensitive to changes in the MS replacement ratio, as Figure 8a illustrates. As the MS replacement rate rises, so does the average adhesive strength. The adhesive strength rose by 2.20% as the MS replacement rate went from 0% to 100%. The bond strength can reflect the change in mechanical behavior in the process of rebar pull-out. Through the analysis of bond strength, the influence law of the MS replacement ratio is studied, as shown in Figure 10.

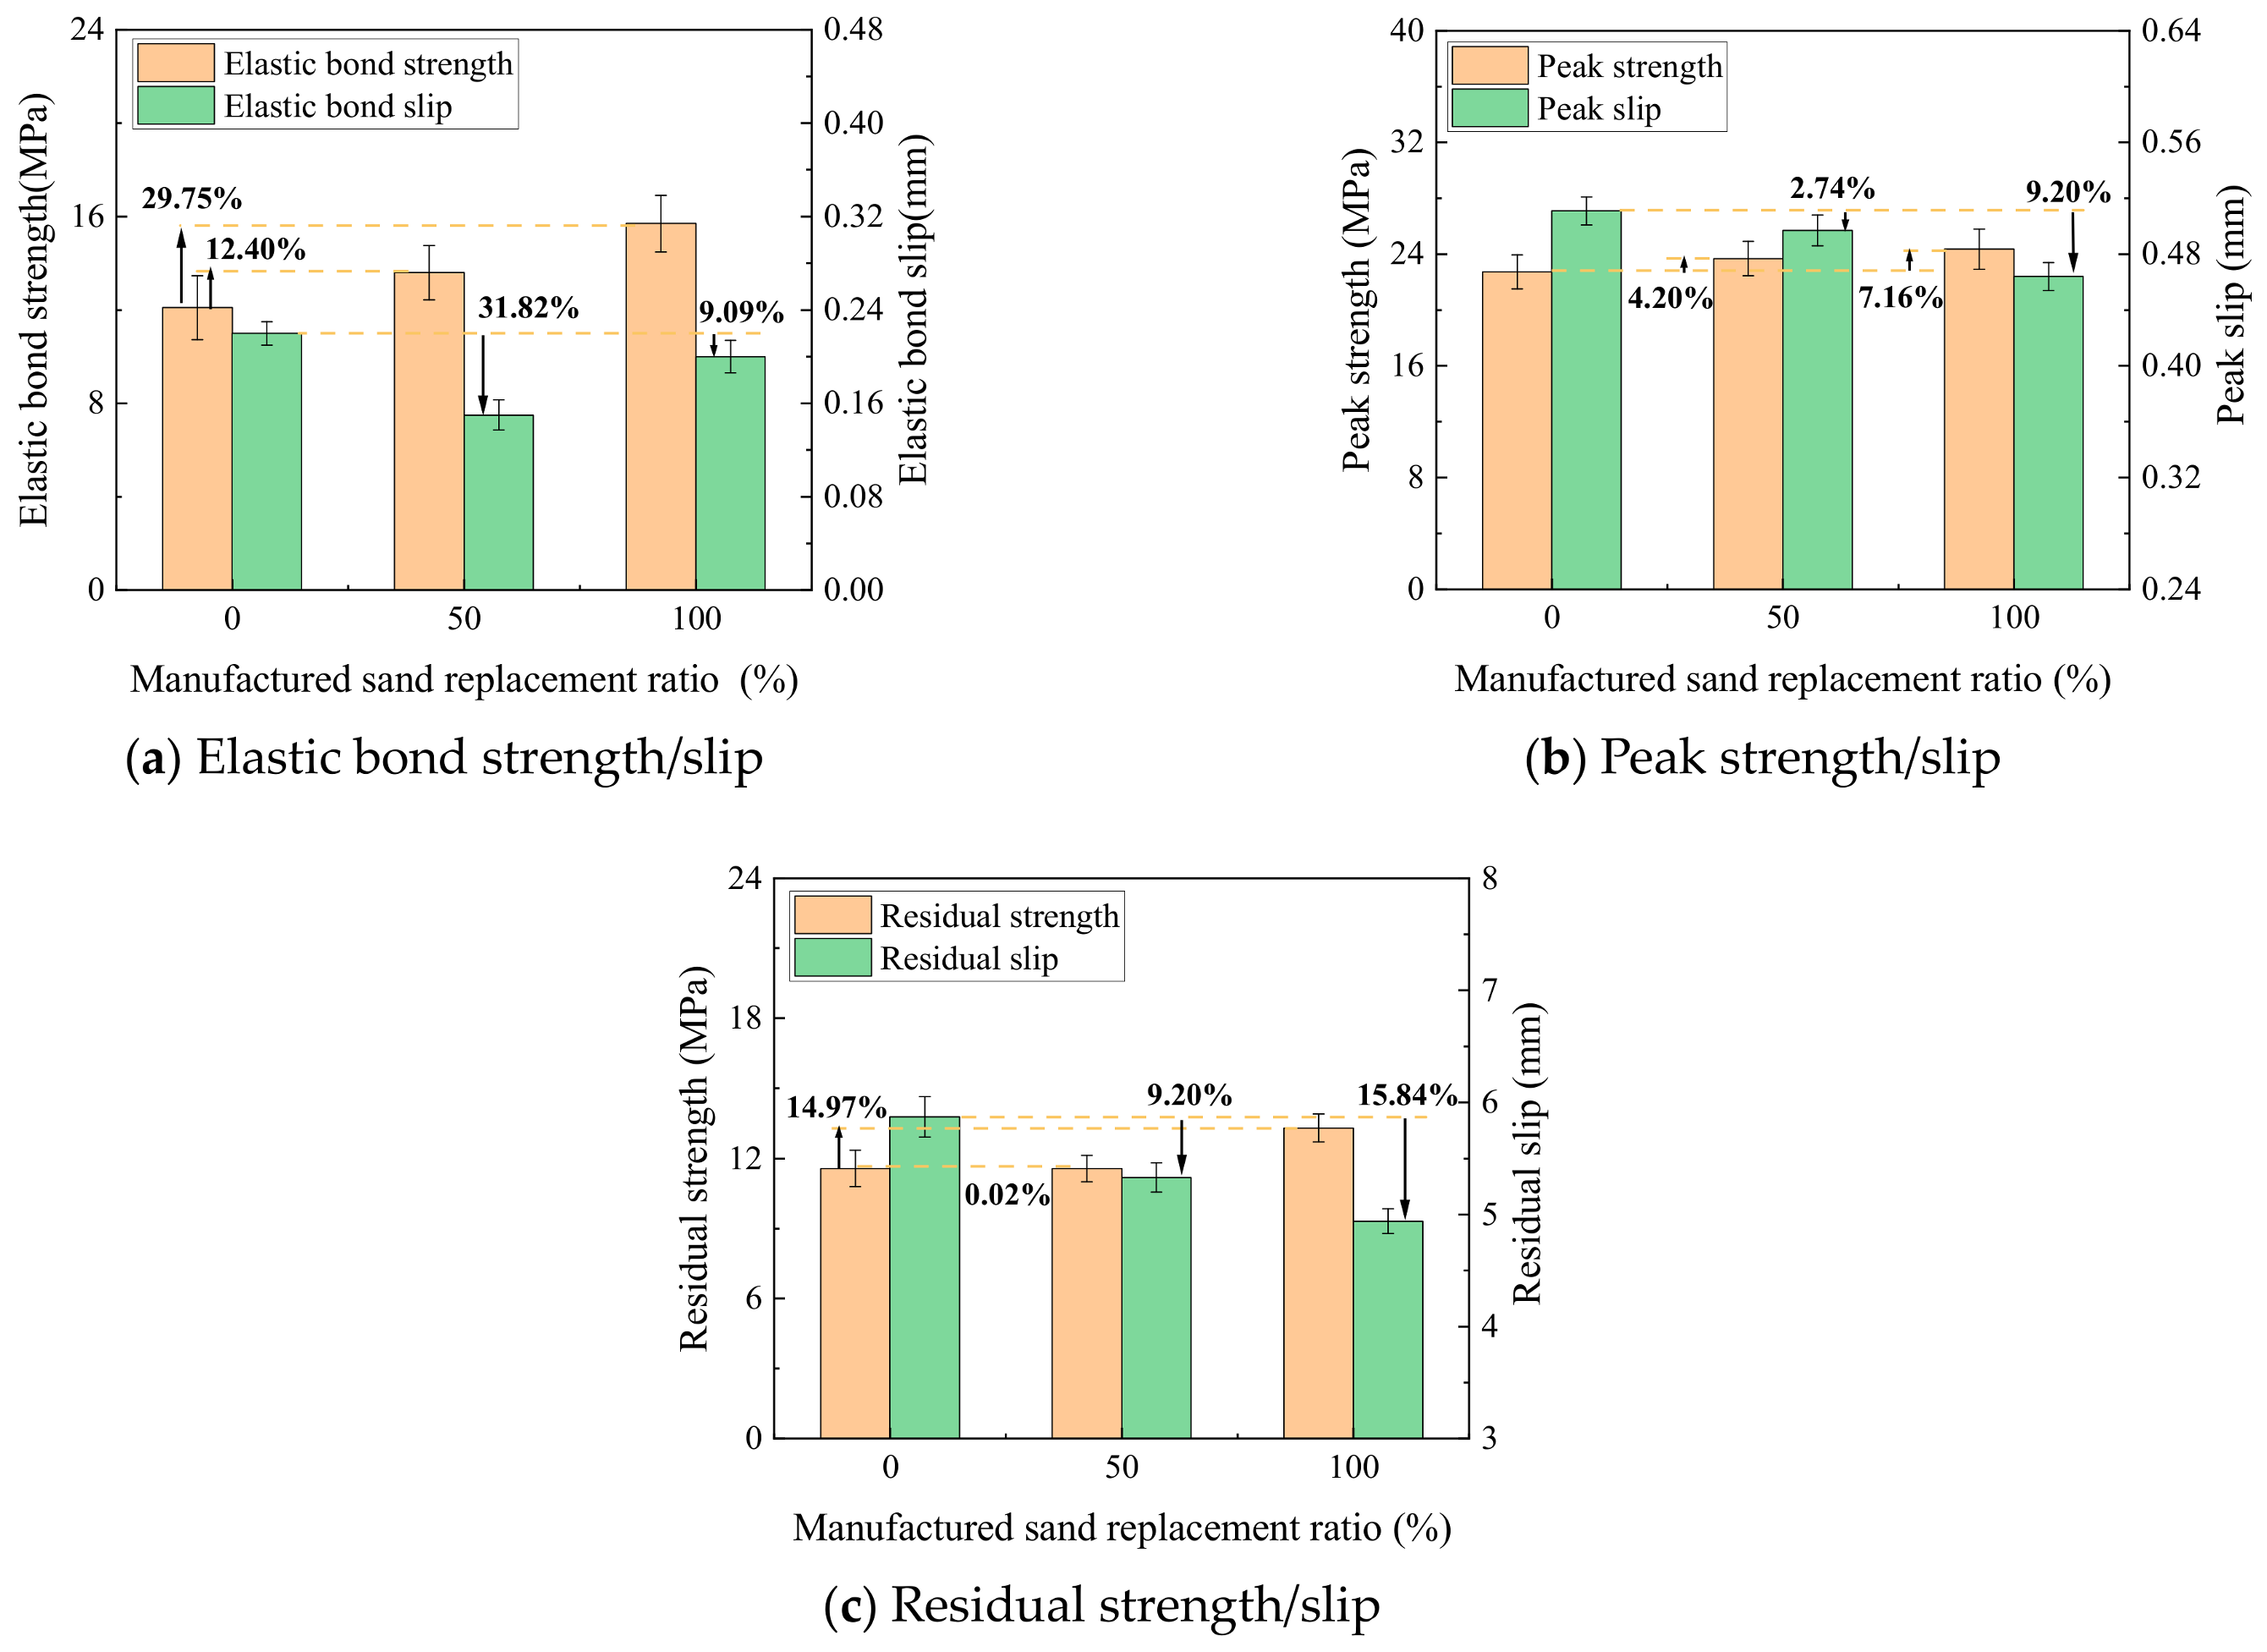
Figure 10.
Effect of MS replacement ratio on bonding strength.
The elastic bonding strength rises as the MS replacement ratio rises. Nevertheless, there is no discernible pattern to the upward slip, which dramatically decreases before increasing. The elastic bond strength rises by 12.40% when the MS replacement ratio rises from 0% to 50%, which has a noteworthy effect.
The peak strength improves when the ratio at which MS is replaced increases. The explanation is that, while the micro-aggregate filling action of stone powder improves its strength, the filling of MS increases the wedging force between aggregates. The peak slip gradually reduces when the ratio at which MS is replaced rises. It demonstrates that there is less slippage and that the concrete in contact with the rebar is more firmly engaged.
As the MS replacement ratio grew, so did the residual strength. It is demonstrated that the internal structure of the concrete will be enhanced in the pull-out test’s latter phase when a modest amount of MS is added, but the improvement impact is not substantial when the amount exceeds a specific threshold. The amount of rebar slip reduces from the descending section to the final stage, expediting the process of reaching the failure stage. As for the effect of the MS replacement ratio on residual slip, it exhibits a downward trend. In summary, adding MS to UHPC increases the density and enhances its peak, rise, and residual strengths of bond behavior between UHPC and HRB 600 rebar.
3.3.2. Effect of w/b
The average bonding strength progressively rises when the w/b falls, as Figure 8b illustrates. An increase in the w/b from 0.17 to 0.19 results in a 5.11% drop in the binding strength.
Figure 11 illustrates how the w/b affects the bonding strength. When it increases from 0.17 to 0.19, the result is a 12.50% decrease in the elastic bond strength and an 8.5% increase in slip. The w/b increased with a progressive decline in both the peak and residual strength. The w/b has a stronger effect on the peak strength decrease when it is between 0.19 and 0.21. And, there is a considerable impact on the residual strength when the ratio is between 0.17 and 0.19. The peak slip and residual slip increase accordingly.
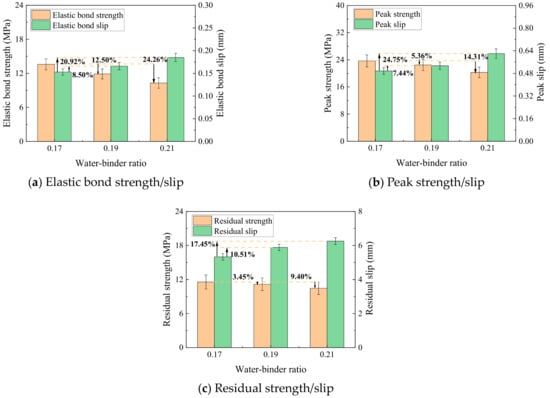
Figure 11.
Effect of w/b on bonding strength.
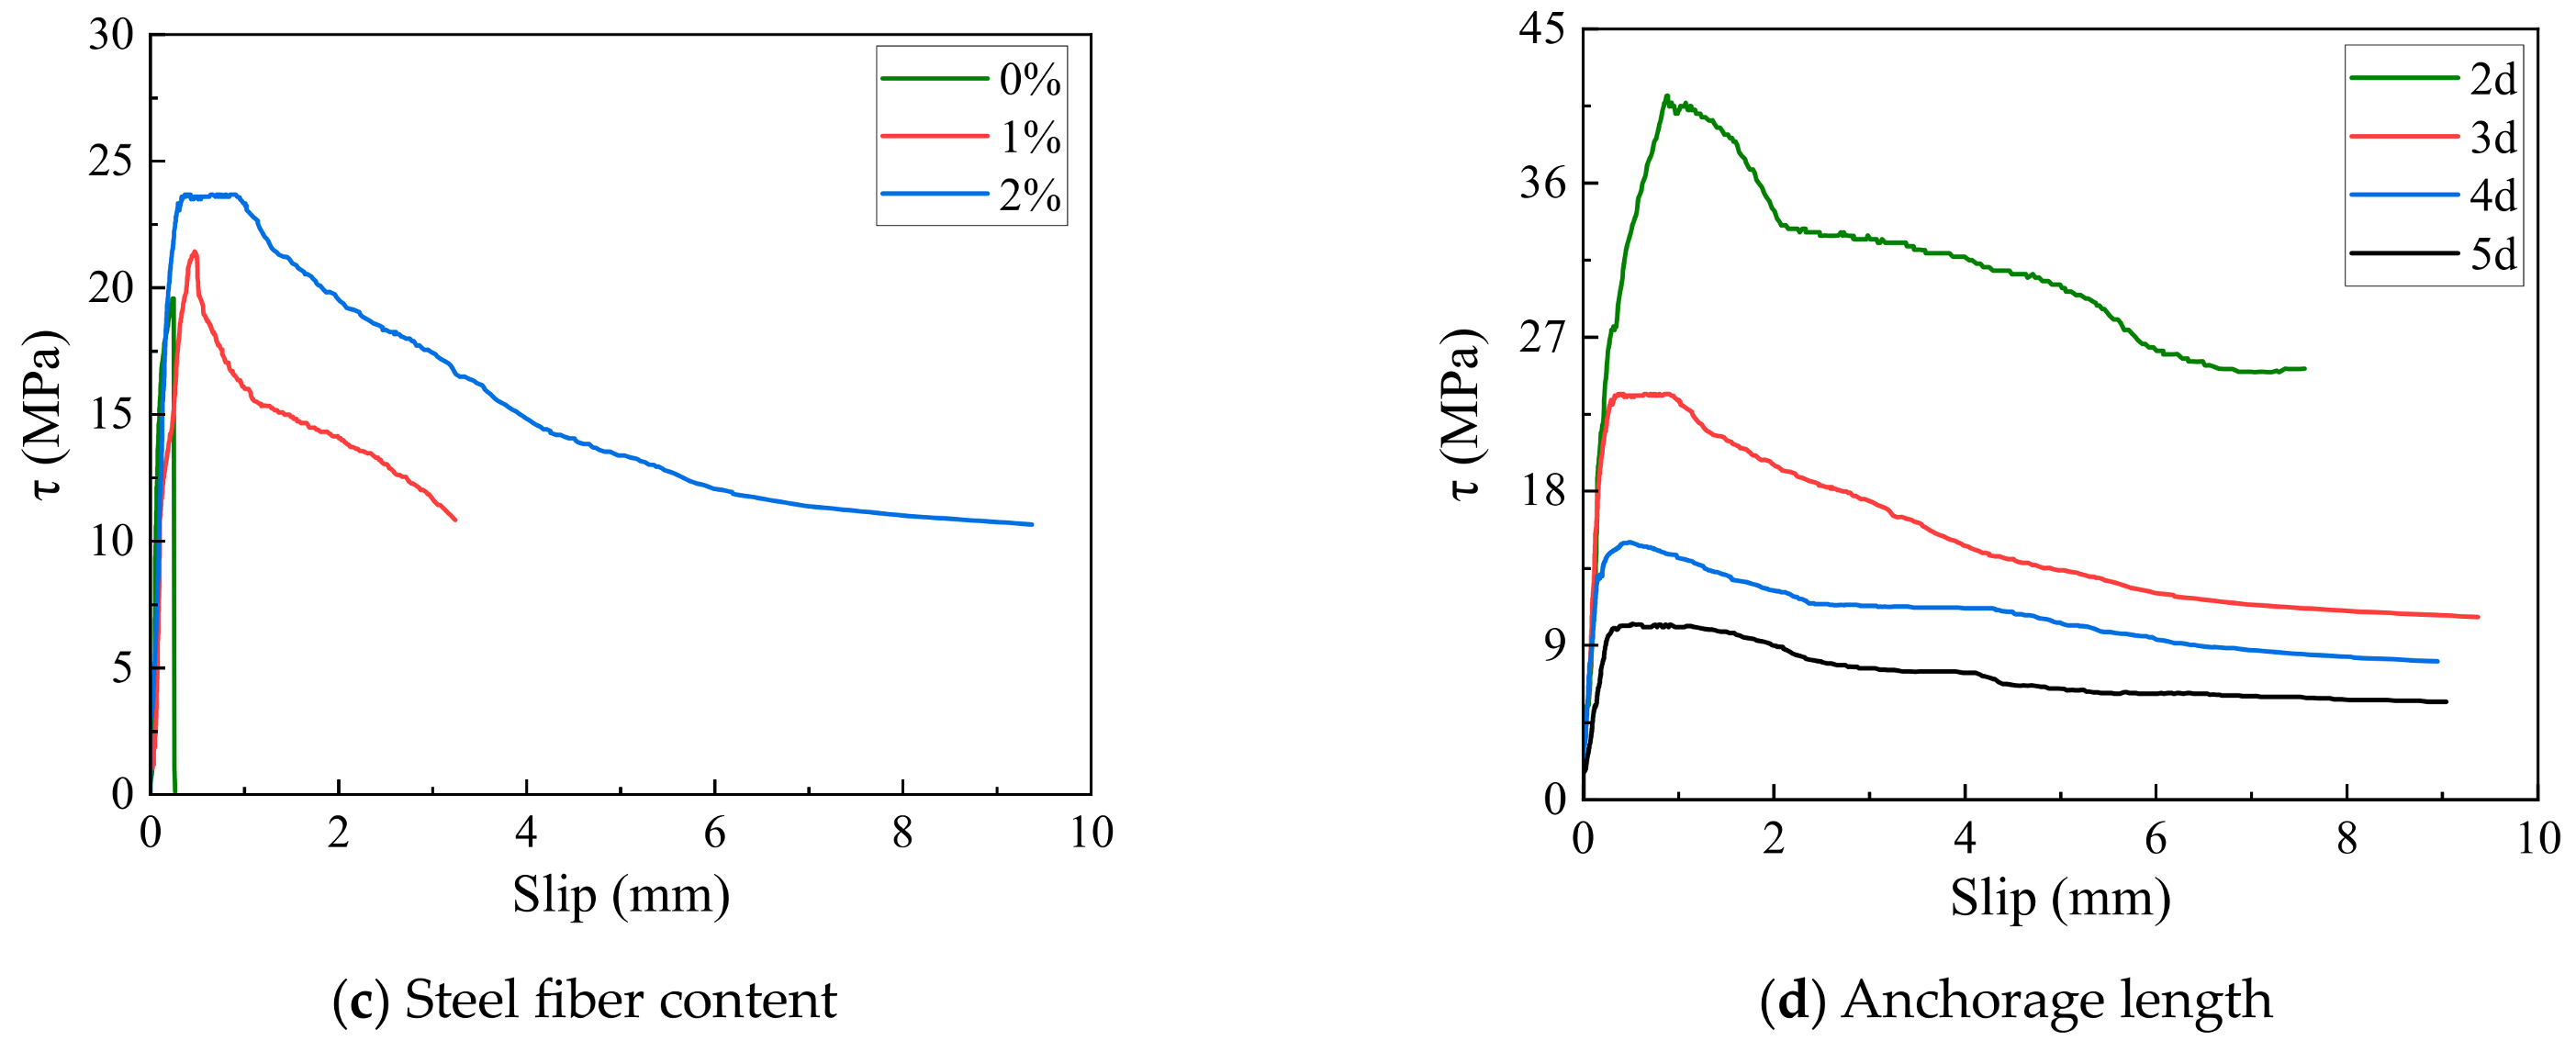
3.3.3. Effect of Steel Fiber Content
As shown in Figure 8c, the overall form of the curve is significantly influenced by the steel fiber content. When the steel fiber percentage is 2%, the curve features comparatively complete descending and residual parts. The bond–slip curve exhibits a rapid decline following the peak load and no residual portions when the steel fiber concentration is 1%. When the steel fiber content is 0%, the specimen is brittle failure after reaching the peak load, the bond strength immediately drops to 0, and the slippage stops. This is because, without the resistance of the steel fiber, the small cracks inside the specimen cannot be suppressed and develop into coherent large cracks. The toughness and crack resistance of the concrete is poor. This is unable to fully support the rebar’s bonding performance. Therefore, residual strength and residual slip do not reflect their mechanical behavior.
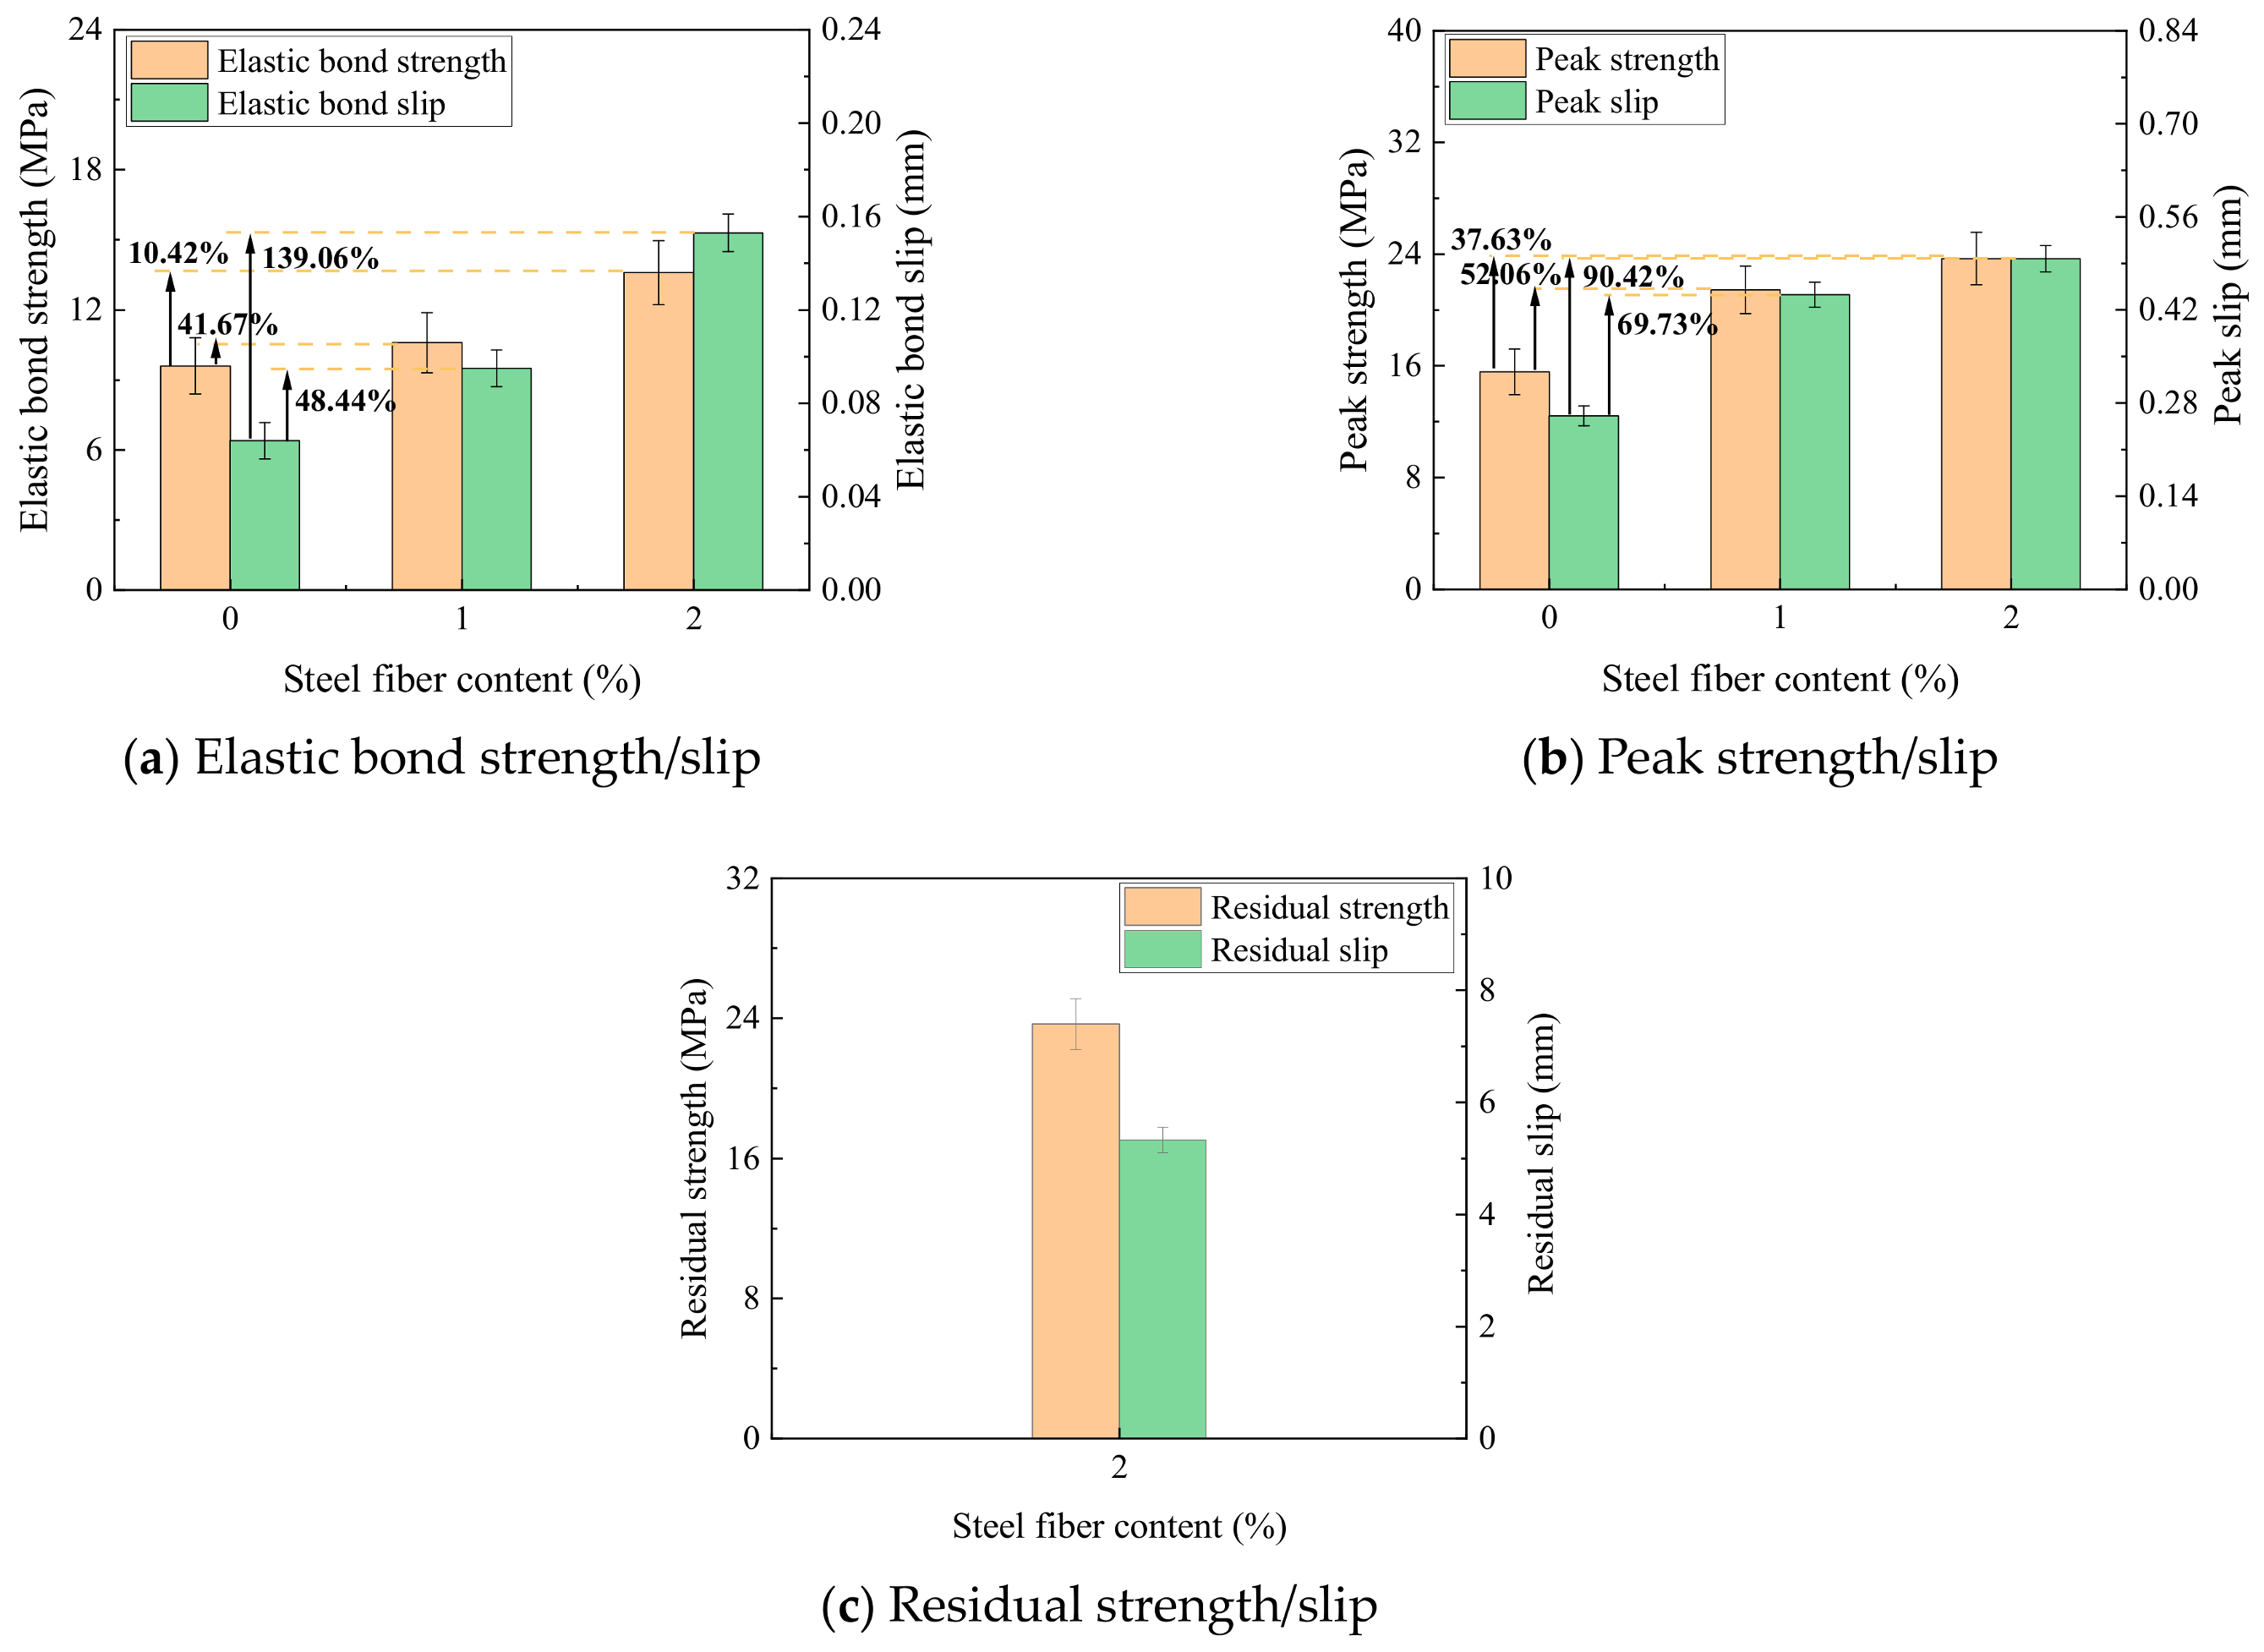
The impact of the steel fiber composition on the elastic strength and elastic slip is shown in Figure 12a. The elastic bond strength improves by 10.42%, with a significant amplitude increase, as the content of steel fibers rises from 0% to 2%. This is because steel fibers can increase ductility and prevent internal cracks in the concrete from forming. Simultaneously, there is a notable rise in the upward slip, which intensifies when the dosage is raised from 1% to 2%, representing a 61.1% increase.
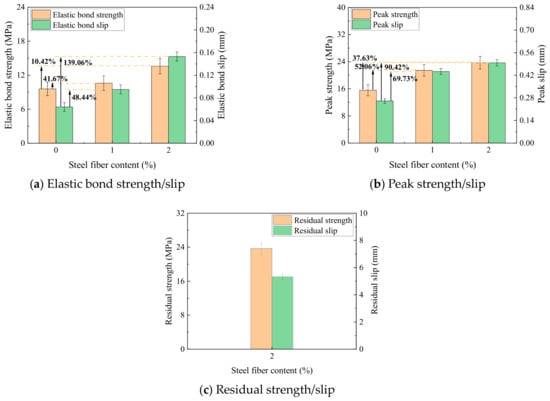
Figure 12.
Effect of steel fiber content on bonding strength.
The impact of the steel fiber composition on the peak strength and peak slip is shown in Figure 12b. The peak slip and peak strength have a positive relationship with the volume percentage of steel fibers. When the amount of steel fiber increases from 0% to 1%, the peak slip amplitude increases considerably. The maximum binding strength of the rebar during the pulling operation is known as the peak strength. The fact that a 1% increase in the volume percentage of steel fibers may boost the ultimate strength by almost 10% indicates how much the inclusion of steel fibers increases the ultimate strength.
The impact of the steel fiber composition on the residual strength and residual slip is shown in Figure 12c. When the steel fiber content is 0% and 1%, the residual strength and residual slip are meaningless and are unable to accurately depict the mechanical properties. In summary, an increase in the steel fiber content greatly improves the bond performance.
3.3.4. Effect of Anchorage Length
As shown in Figure 8d, the bond–slip curve is significantly affected by the anchorage length. The bond–slip curve steadily moves downward as the anchorage length rises. When the anchorage length increases from 2d to 5d, the bonding strength decreases by 74.07%.
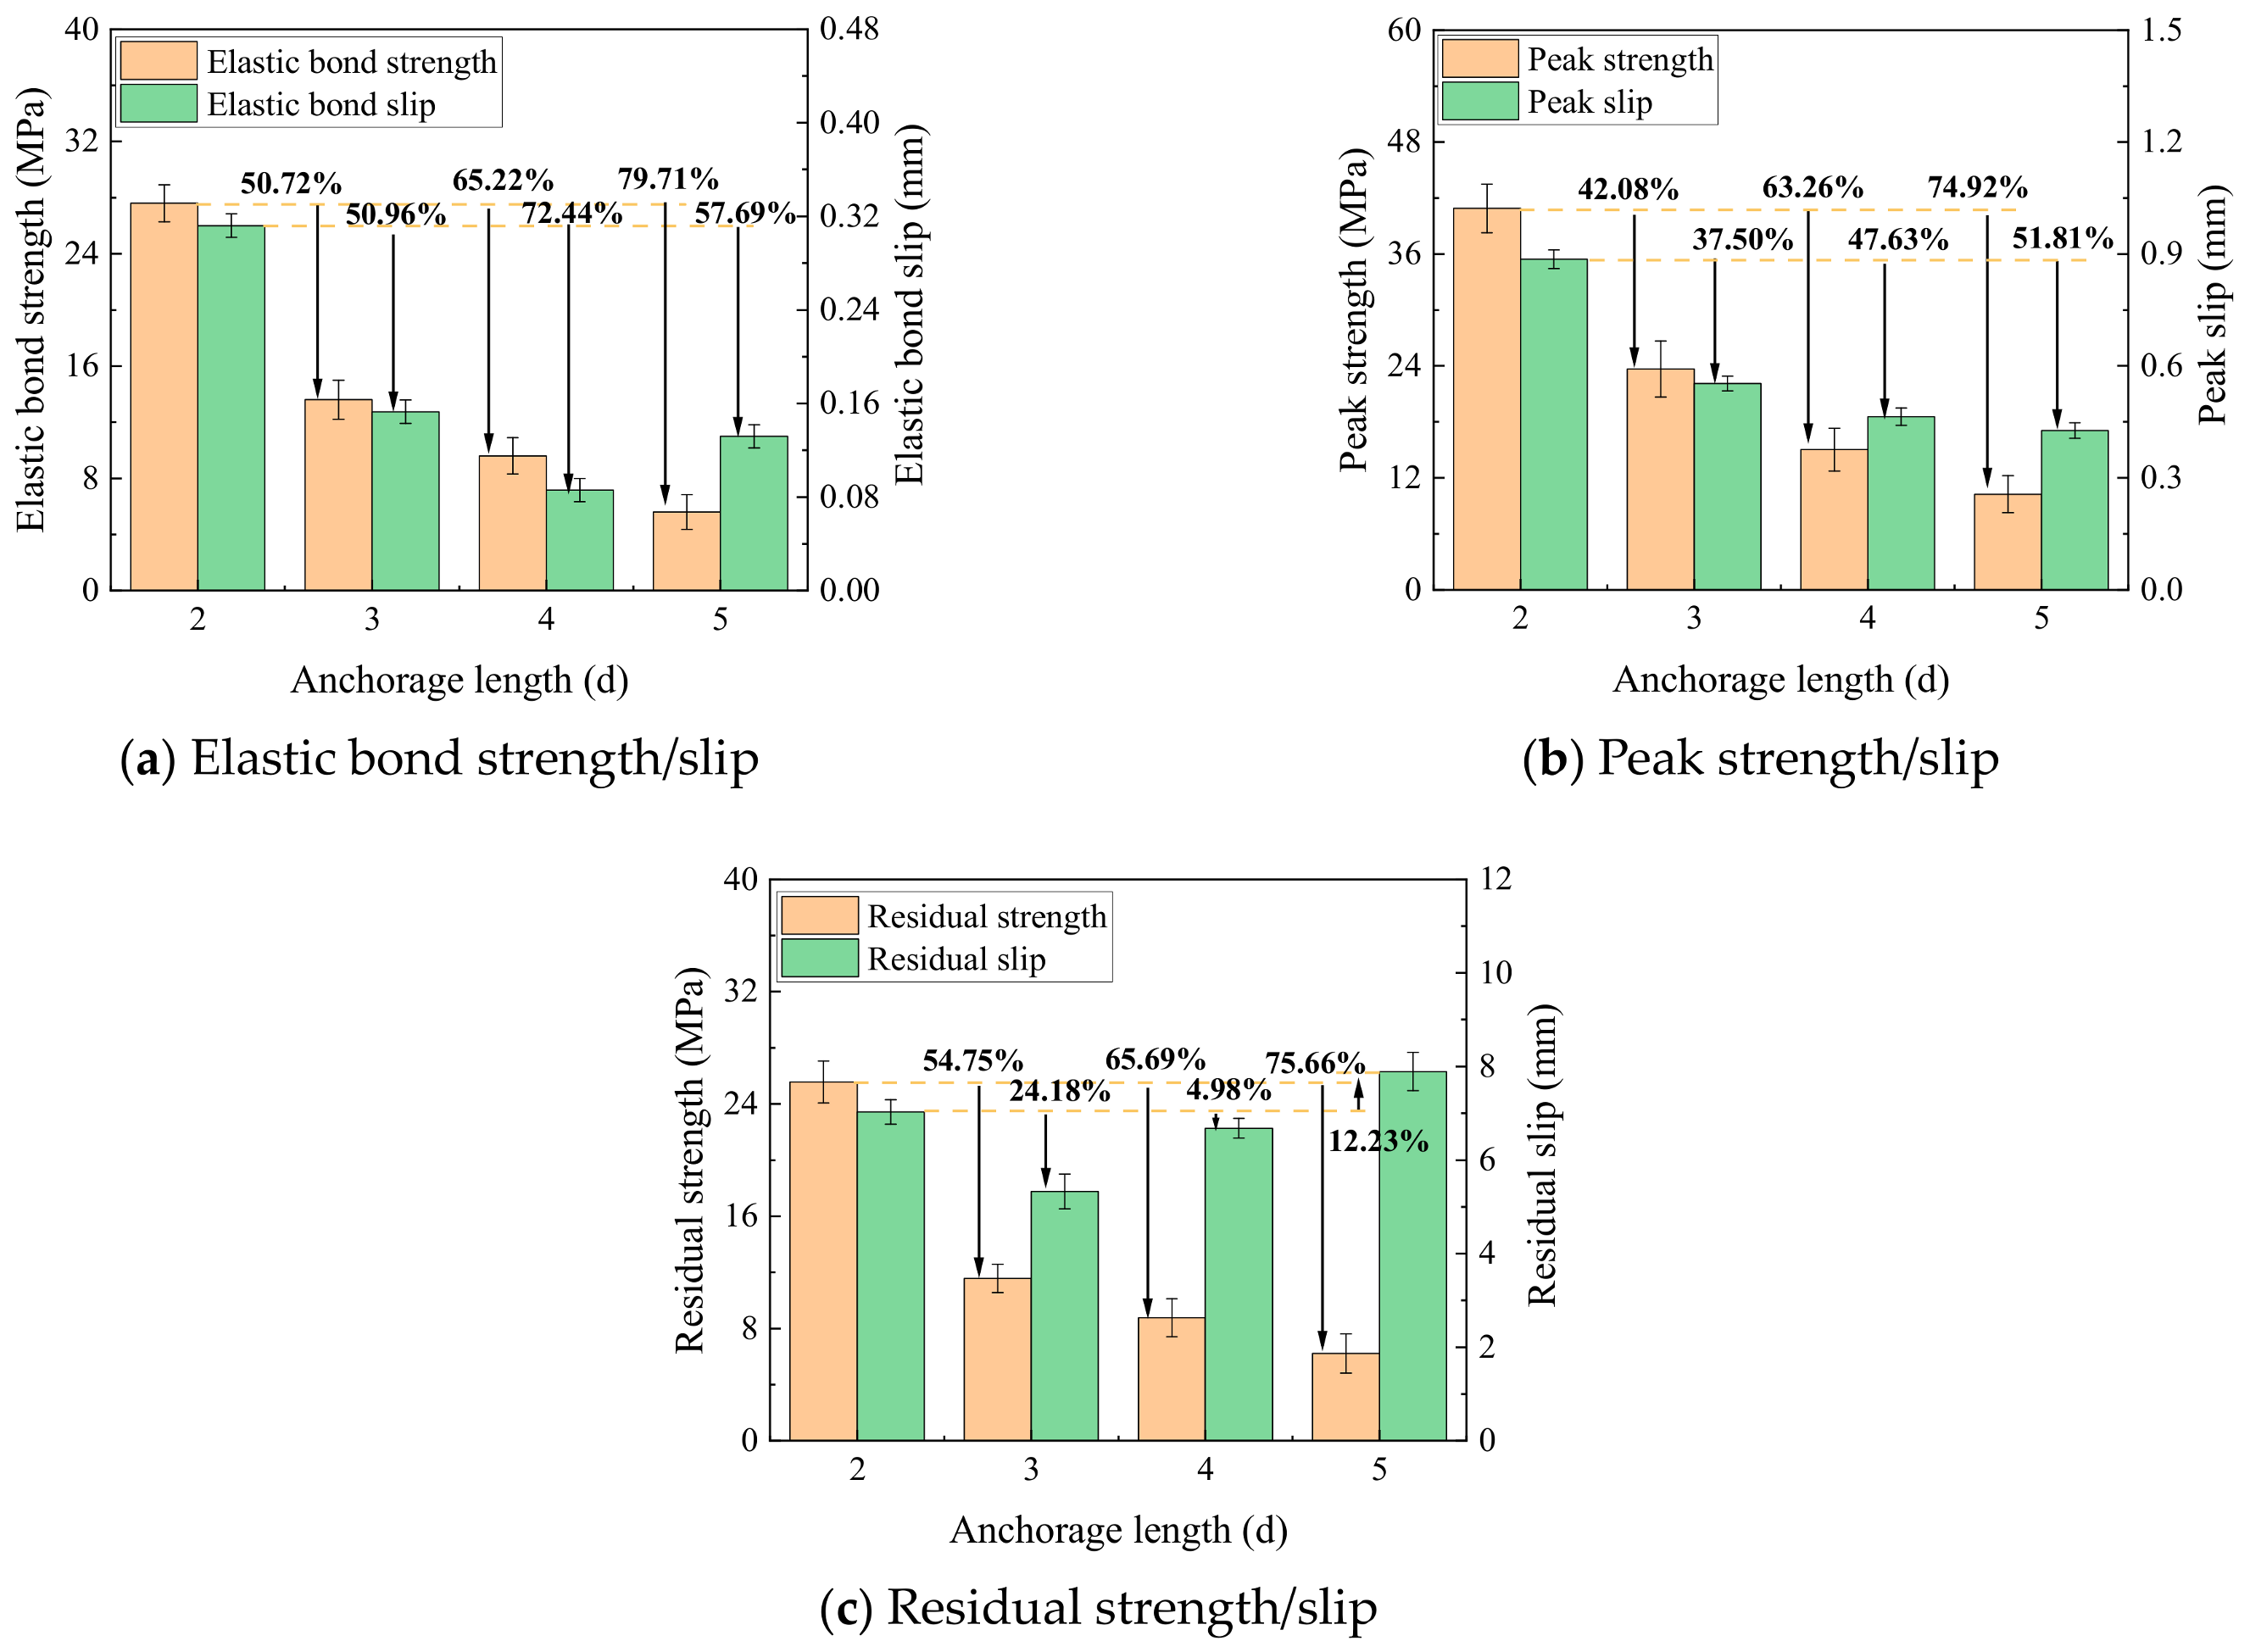
The influence of different bond lengths on the bond–slip eigenvalues is shown in Figure 13. The elastic bond strength progressively drops as the anchorage length increases; the most significant drop occurs from 2d to 3d, where it drops by 33.4%. With an increase in the anchorage length, the elastic bond slip initially drops and then increases; the regular pattern is insignificant.
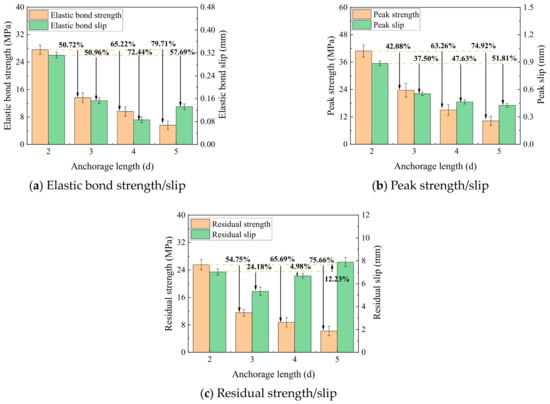
Figure 13.
Effect of anchorage length on bonding strength.
The peak strength has a declining tendency, with a noticeable shift from 2d to 3d. There is a negative connection found between the peak slip and the bond length because the mechanical biting force and friction resistance that prevent the rebar from sliding out under external loads increase with the extent of the anchoring length.
The anchorage length and residual strength have a negative correlation. The decline in each group from year to year is more consistent as the anchorage lengthens. The residual slip law is not essential.
3.4. Relationship between Compressive Strength and Bonding Strength
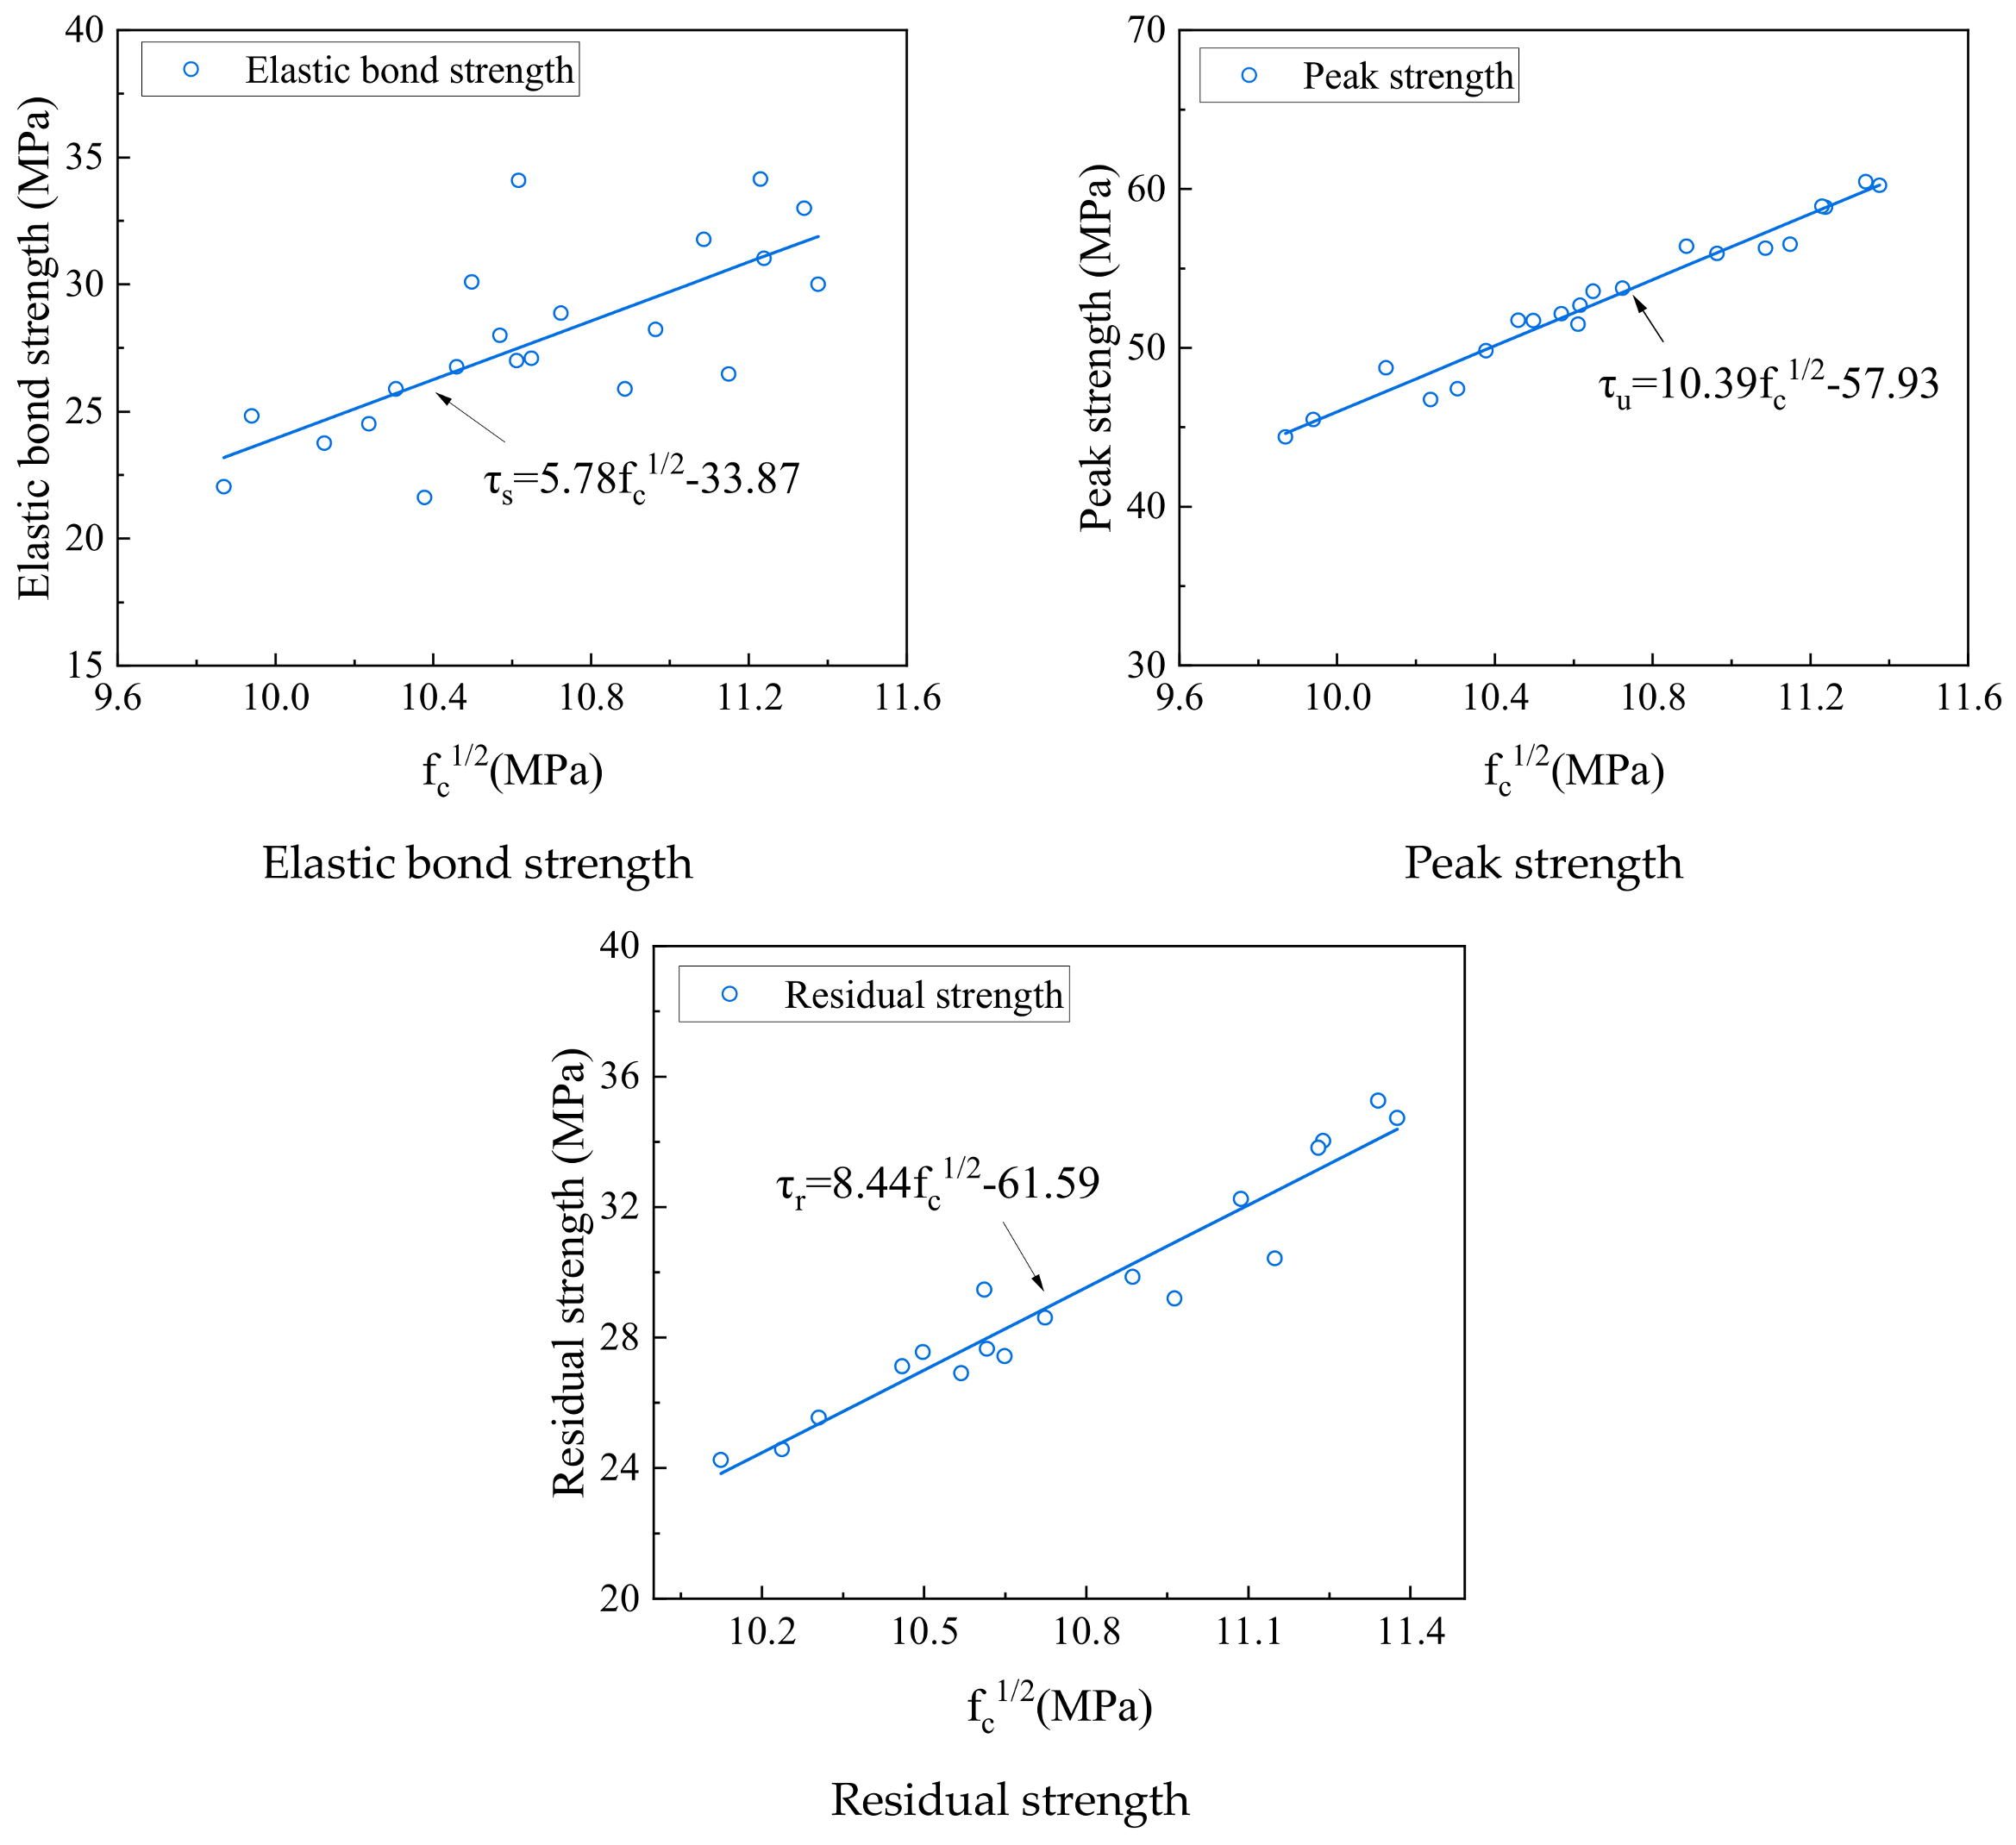
The experimental results indicate that the elastic bond strength, peak strength, and residual strength increase with an increase in the UHPMC compressive strength. This suggests that changes in the elastic bond strength, peak strength, and residual strength are regular and that the bonding strength is associated with the performance of UHPMC. There is a positive correlation between each strength and the compressive strength’s square root, and the fitting expressions are listed as follows:
where fc is the compressive strength (MPa), τs is the elastic bond strength (MPa), τu is the peak strength (MPa), and τr is the residual strength (MPa).
The schematic diagram of the regression relationship is shown in Figure 14.
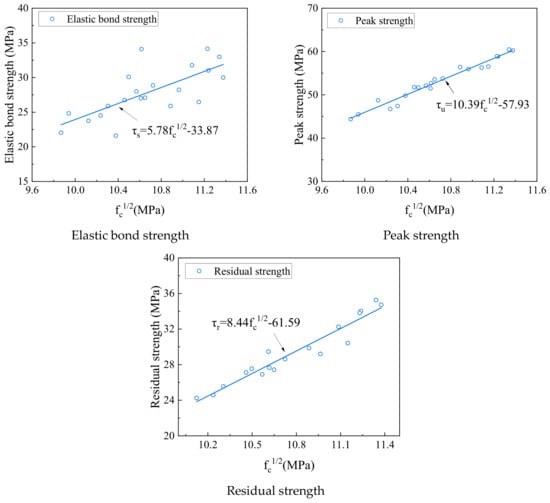
Figure 14.
Relationship between bonding strength and compressive strength.
As the research above shows, compressive strength and bonding strength are positively correlated. The concrete’s compressive strength and splitting strength are strongly correlated with the matrix density, material ratio, and aggregate strength, among other aspects. As a result, there is a tight relationship between changes in both parameters.
4. Analytical Model of Bond–Slip Behavior
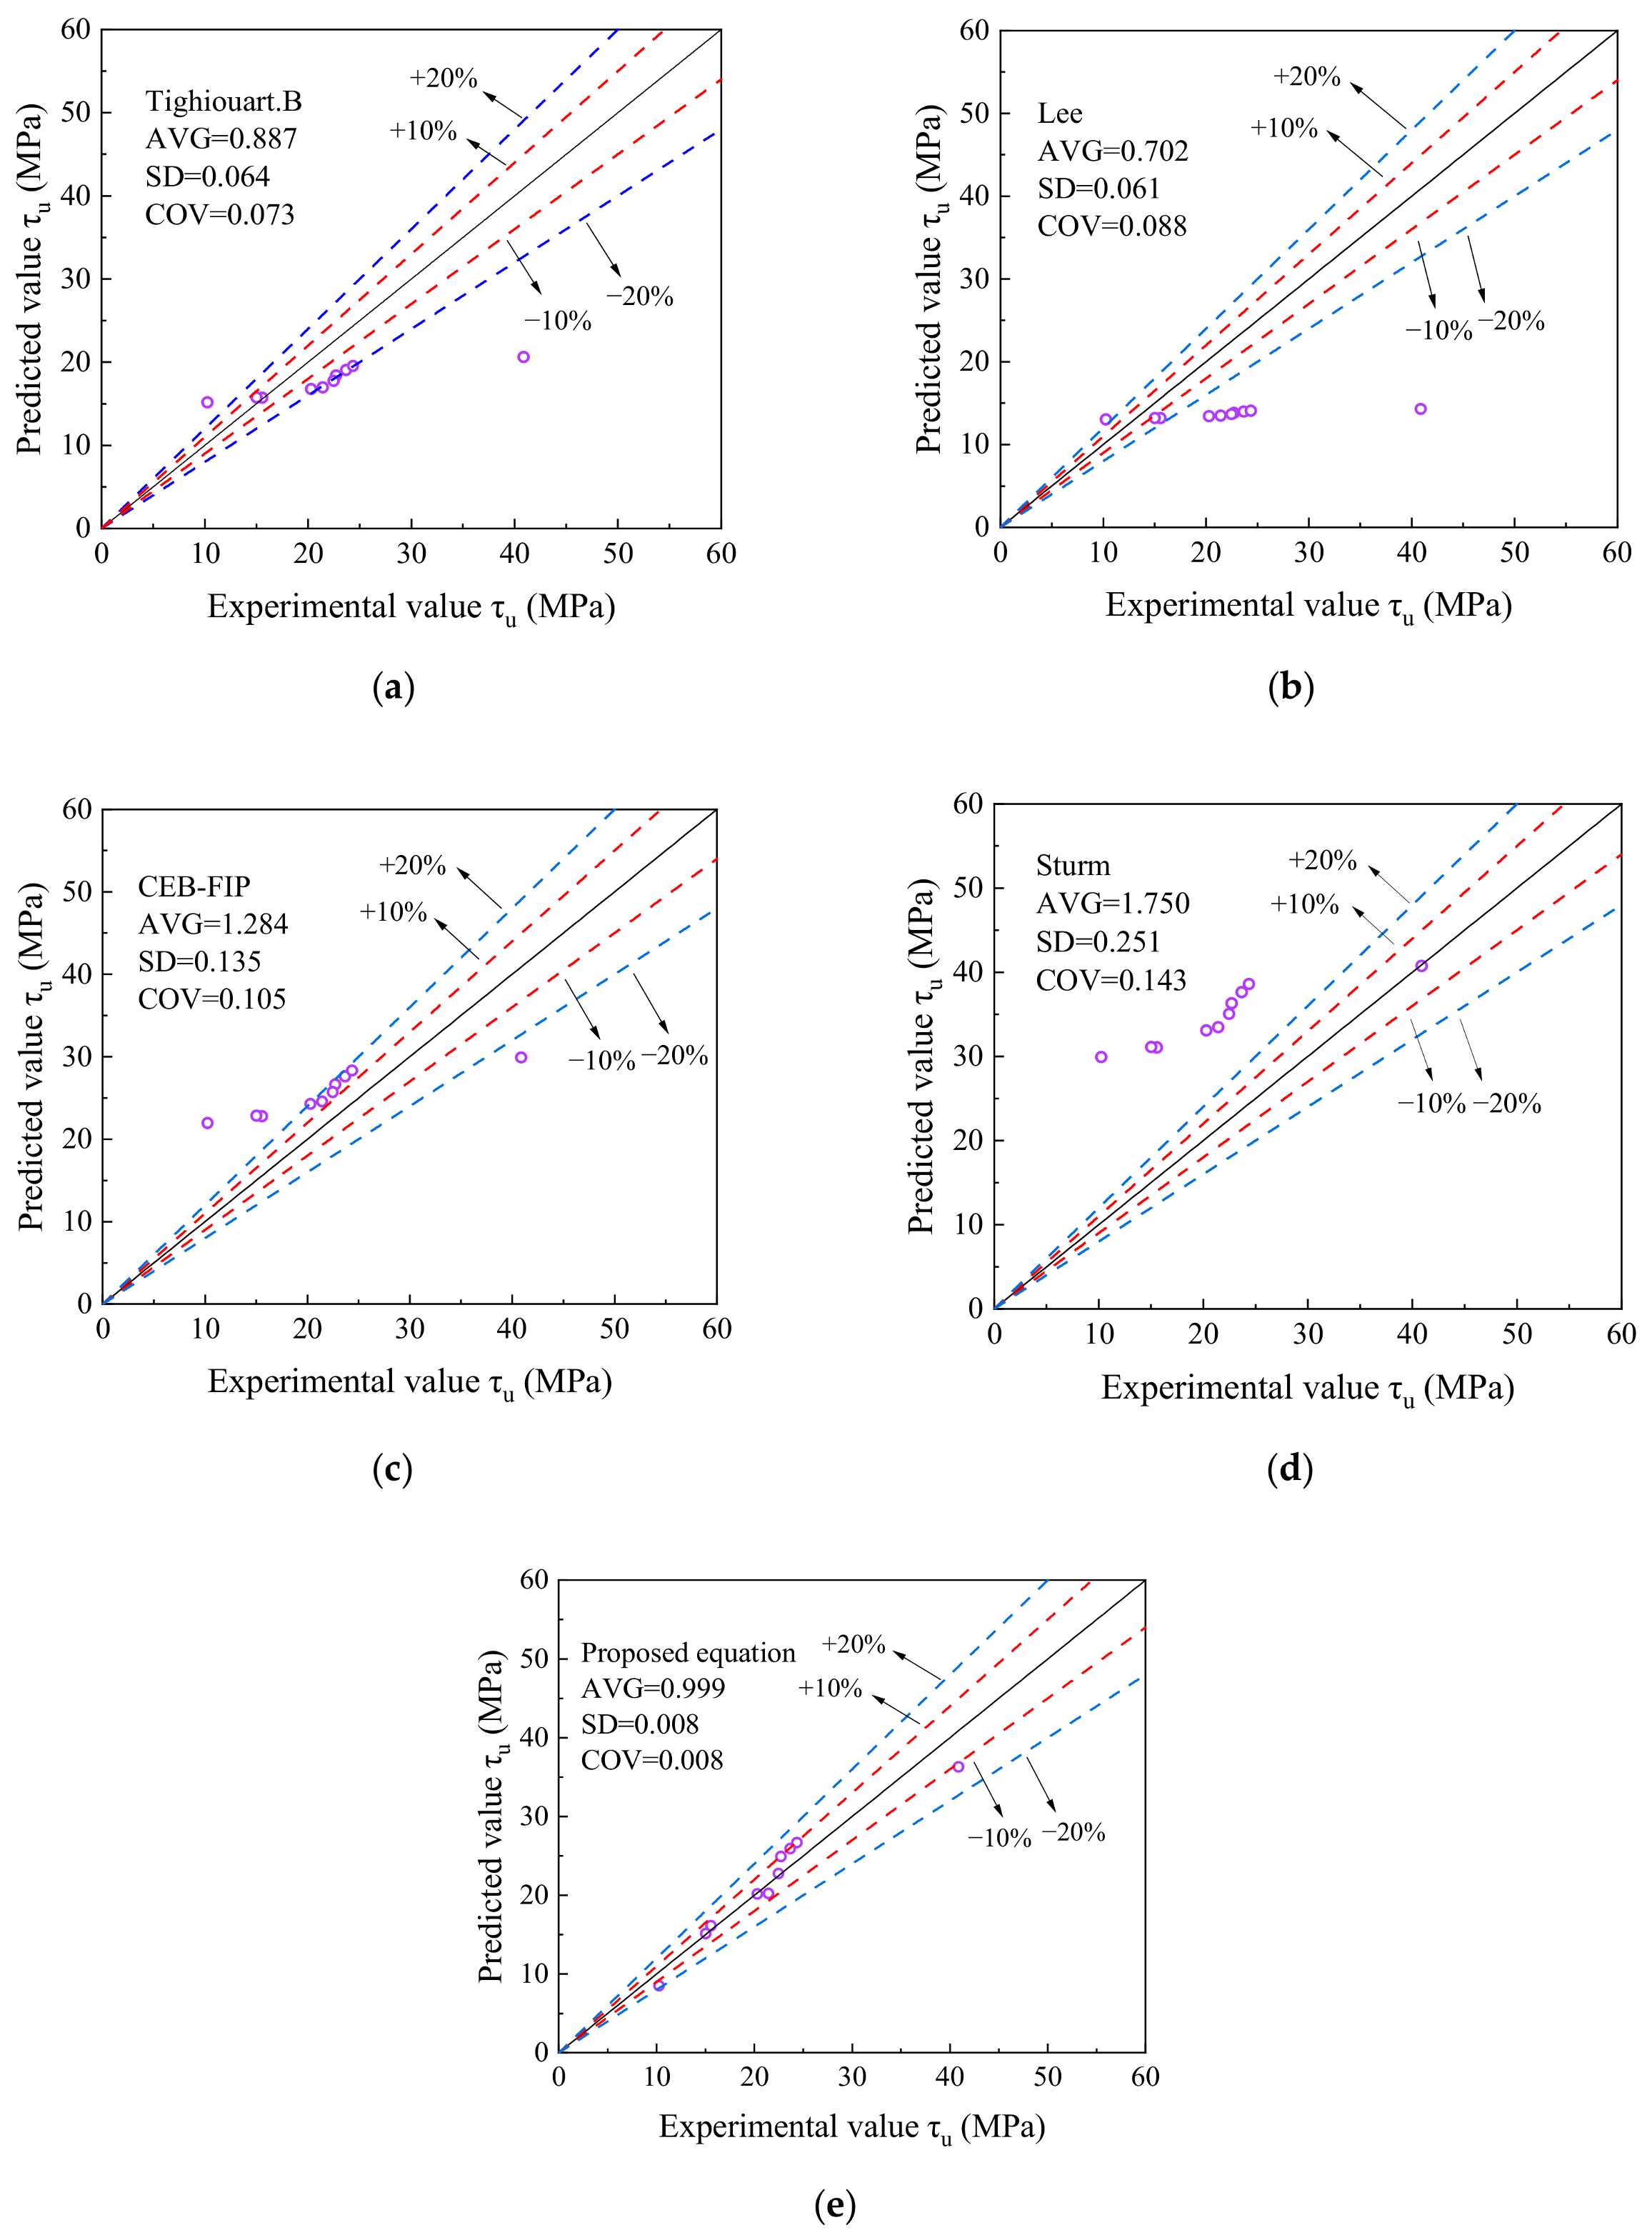
Less efforts on predictive models of the bond strength between UHPMC and HRB 600 high-strength rebar are available. Some researchers have developed empirical formulas for the bond strength between rebar or FRP bars and ordinary or high-strength concrete based on experiments. Typical bond strength prediction models between concrete and rebar from earlier studies are shown in Table 7. It is unclear if these models are reasonable for forecasting the bonding performance of HRB 600 rebar and UHPMC. Consequently, the experimental and predicted values of these expressions are compared in this investigation. Figure 15 displays the average value of the ratio of experimental values to anticipated values for each equation.
Table 7.
Bond strength equations in references.
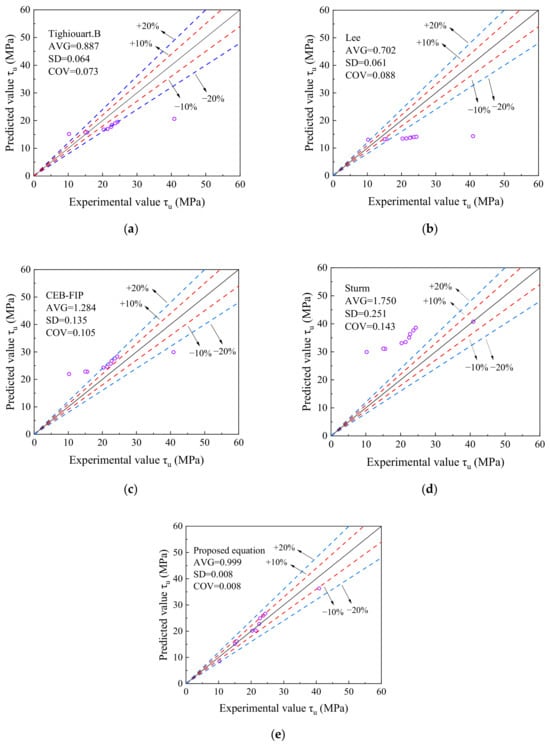
Figure 15.
Comparison of predicted and experimental bond strength: (a) Tighiouart.B model; (b) Lee model; (c) CEB-FIP model; (d) Sturm model; (e) Model given by this paper.
The bond strength between HRB 600 rebar and UHPMC and the projected values computed by the bond strength prediction model suggested by Lee [28] and Sturm [30] differ significantly, as Figure 15 illustrates. Furthermore, the bond strength model for the rebar implanted in UHPMC that CEB-FIP [29] suggested overestimated the actual binding strength. The predicted values and experimental results of the prediction model recommended by Tighiouart. B [27] are shown in Figure 15a. The standard deviation is 0.047.
The bond tests of regular concrete, strong concrete, and conventional UHPC with rebar serve as the foundation for the aforementioned calculations. However, MS is adopted to replace QS in traditional UHPC in this paper, and the internal structure of the concrete matrix is different due to various materials. MS particles have multiple edges and corners, which are prone to segregation and bleeding. The workability of MS concrete is somewhat impacted by the porosity, which rises as the amount of flaky particles increases. These formulas do not take into account the aggregate properties of MS and the variables used in this paper. Therefore, considering the effect of the MS replacement ratio (m), w/b (w), steel fiber content (λ), and anchorage length (l), the experimental data were subjected to regression analysis. Equation (7) was put forth as a prediction formula.
Meanwhile, the slip formula is shown in Equations (8) and (9).
where τu is the bond strength (MPa); fc is the compressive strength (MPa); m is the MS replacement ratio (%); w is the w/b; λ is the steel fiber content; l is the anchorage length (mm); d is the rebar diameter (mm); Su is the peak slip (mm); and Su1 is the maximum free-end slip corresponding to the horizontal segment, which is point B in Figure 9 (mm).
Figure 15e displays a comparison of this study’s experimental findings with the projected values. The predicted value matches the experimental data well. The coefficient of variation, standard deviation, and average ratio between the test and predicted values are 0.008, 0.008, and 0.999, respectively.
Considering the influencing factors, including concrete strength, MS replacement ratio (m), w/b (w), and anchorage length (l), regression analysis is conducted on 10 sets of test data. The following formulas are used to calculate the slip value and residual bond strength:
where τr is the residual bond stress (MPa); Sr is the residual slip (mm); fc is the compressive strength (MPa); m is the MS replacement ratio (%); w is the w/b; l is the anchorage length (d); and d is the rebar diameter (mm).
Table 8 lists the typical values in the τ–s curve derived from the test results.
Table 8.
Typical values in the test τ–s curve.
Figure 16 and Table 9 illustrate the fitting results. The average ratio of the estimated peak and residual bond strengths to the experimental values is 1.008 and 1.01, respectively, with coefficients of variation of 0.009 and 0.038. Overall, the calculated value matches the actual data well, as presented in Figure 16. The average ratio of the calculated peak slip and residual slip to the experimental values is 1.111 and 1.000, with coefficients of variation of 0.066 and 0.0009.
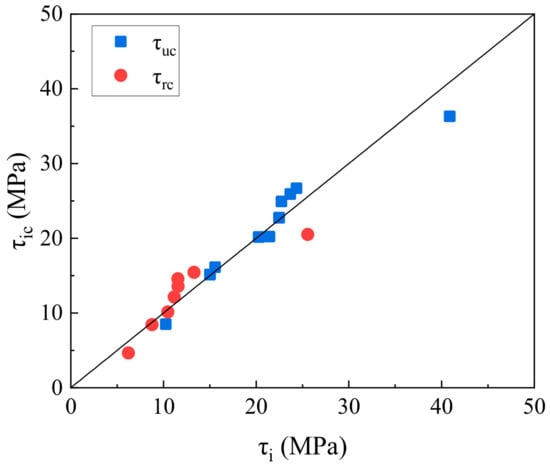
Figure 16.
Fitting results between calculated and experimental values.
Table 9.
Comparison of experimental values and calculated values of bond strength.
The average bond strength and slip within the anchorage length are typically assessed to build the relationship model of bond stress–slip, which makes application easier.
The specimens with 0% steel fiber content fail quickly after reaching the peak bonding stress between rebar and UHPMC specimens, and the full bonding curve is not measured. After decreasing to a particular value, the specimens with 1% steel fiber content abruptly end, and no residual stage is observed. The other specimens all present relatively complete τ–s curves. They can be simplified as a four-line model consisting of rising, horizontal, descending, and residual sections, as shown in Figure 9.
According to the results, the bond–slip relationship between HRB 600 rebar and UHPMC can be simplified as the constitutive model. The relationships of the four-line model are shown as follows:
Ascent stage:
Horizontal section:
Descent stage:
Residual segment:
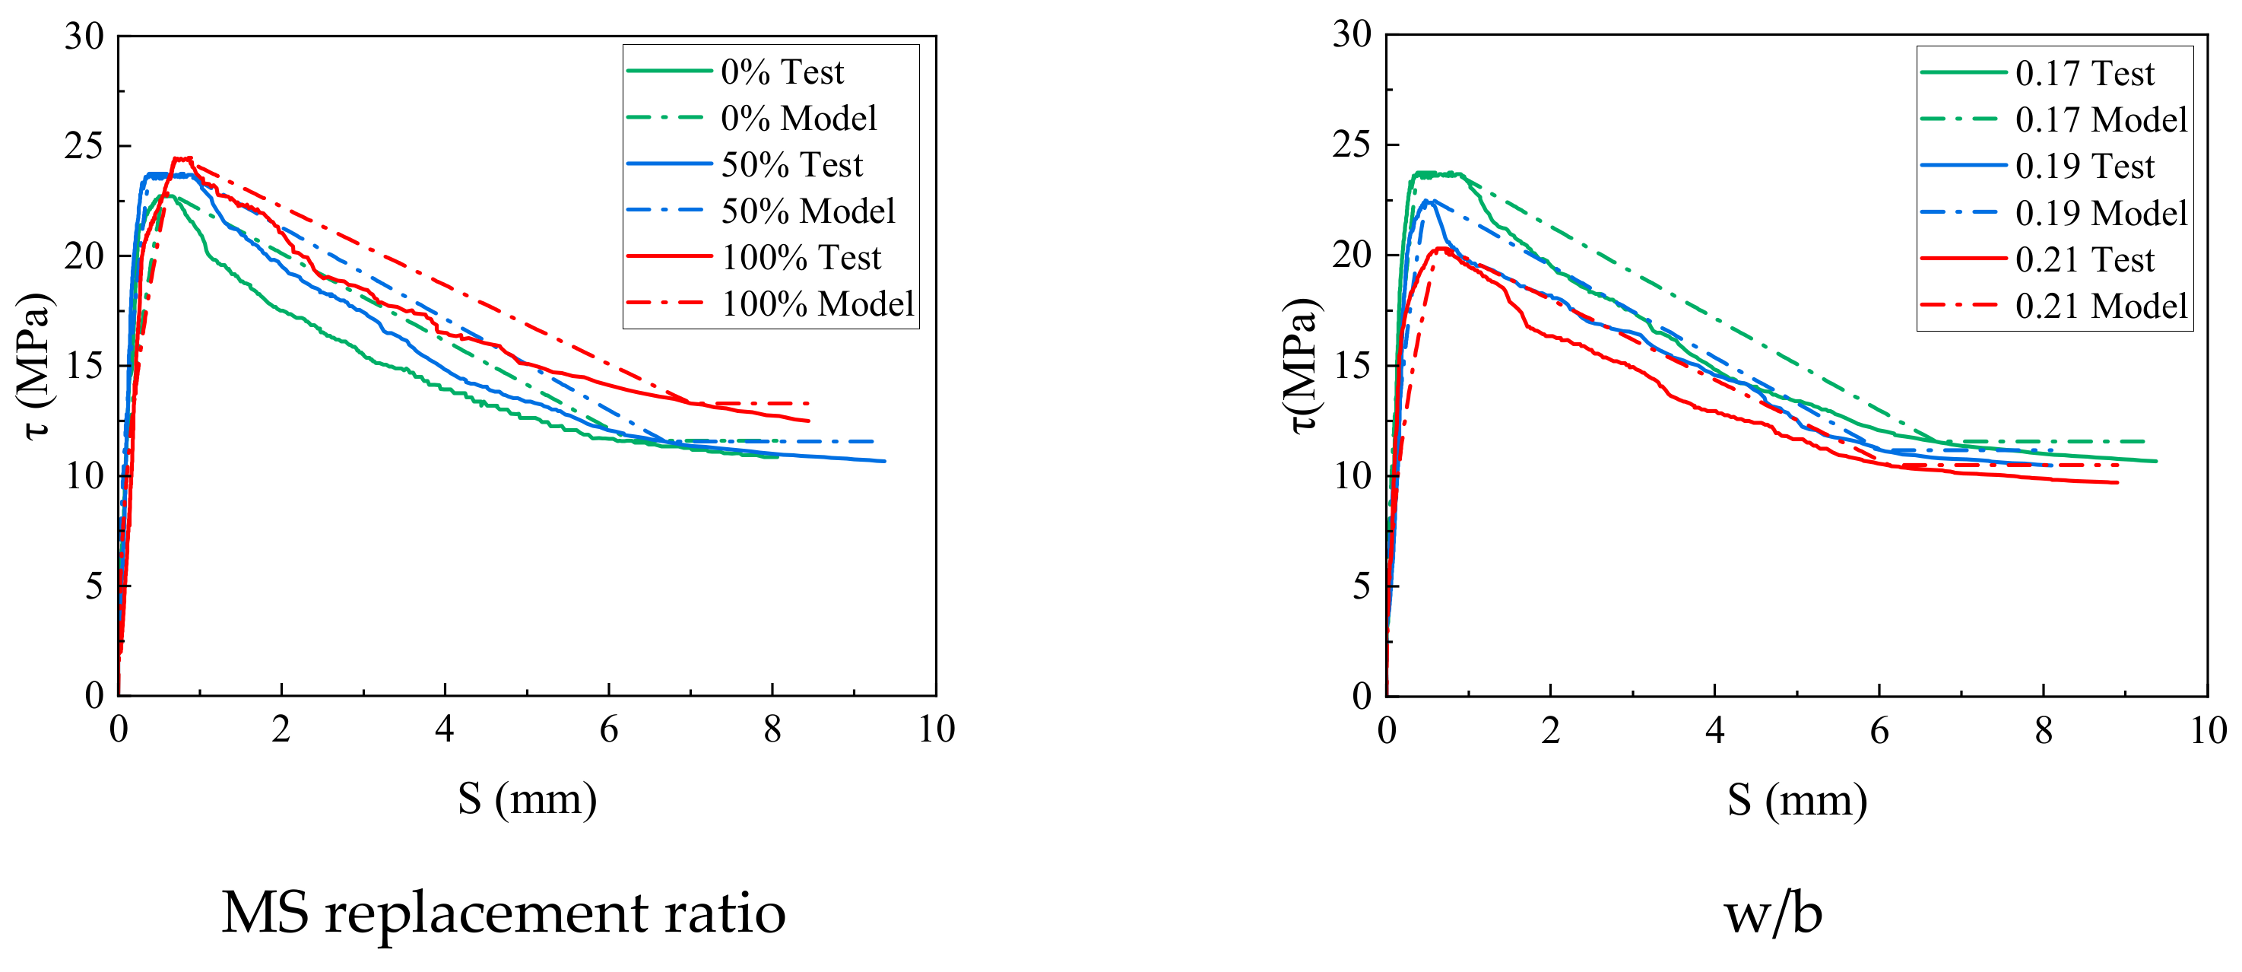
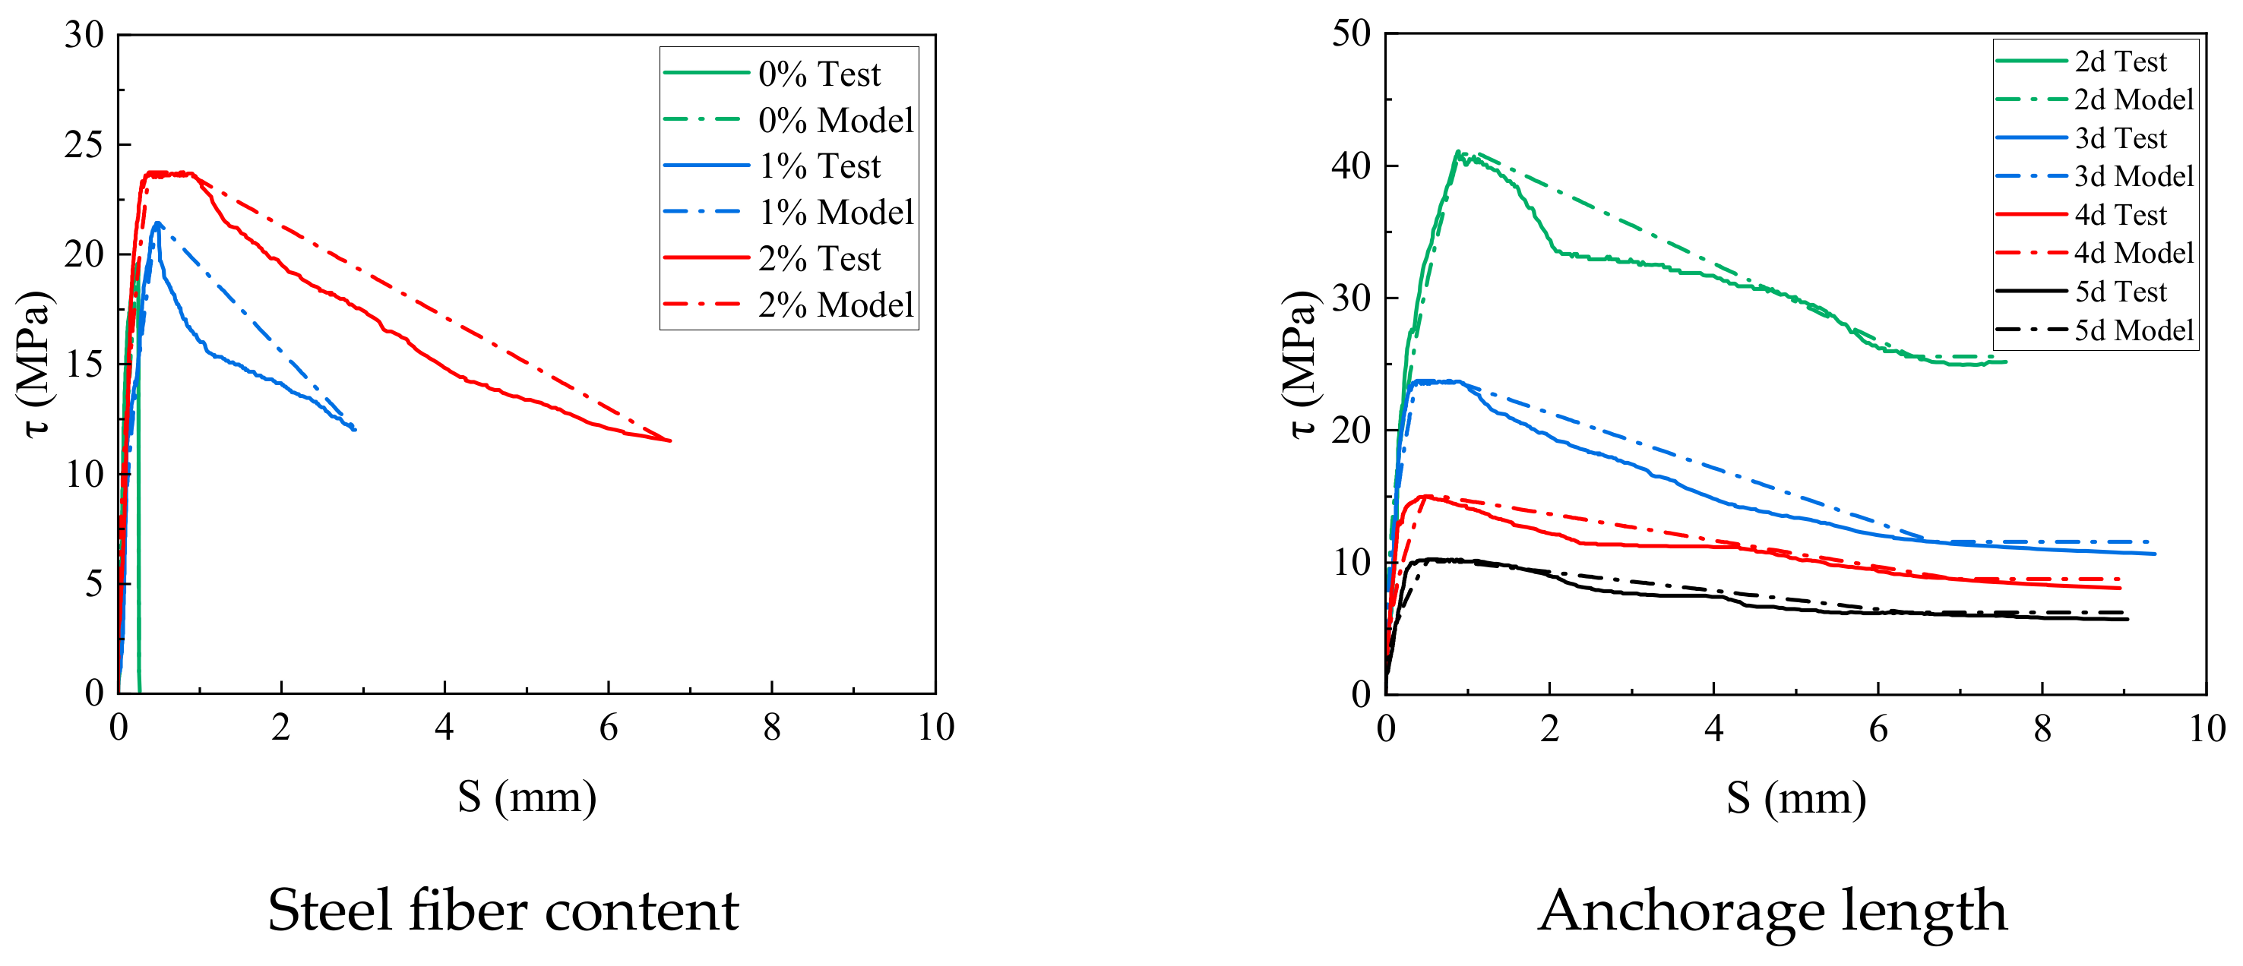
The characteristic parameter values of the bond curve are related to the MS replacement ratio, w/b, and anchoring length. α was taken to be 0.475. Table 10 shows the typical values in the fitting τ–s curve. The test results and the projected model are shown in Figure 17.
Table 10.
Typical values in the fitting τ–s curve.
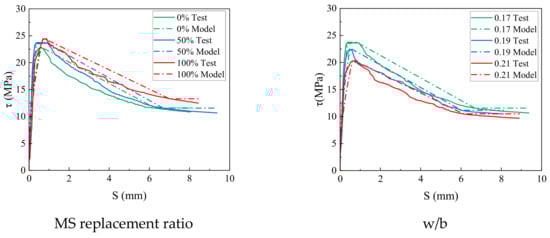
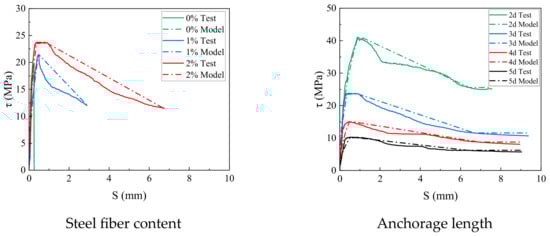
Figure 17.
Comparison of the model predictions with the tested bond–slip curves.
5. Conclusions
The effects of the MS replacement ratio, w/b, steel fiber content, and anchorage length on the bond characteristics of UHPMC and HRB 600 were examined by pull-out tests. The following were the primary findings reached:
- (1)
- There are three different failure modes for specimens: pull-out failure, splitting failure, and splitting-pull-out failure.
- (2)
- The bond strength increases with an increase in the MS replacement ratio. When the MS replacement ratio increased from 0% to 100%, the average bond strength increased by 2.20%.
- (3)
- The experimental group with a w/b of 0.17 exhibited a 5.11% increase in the average bond strength compared to the group with a w/b of 0.19 and a 4.62% increase compared to the group with a ratio of 0.21. Between a w/b of 0.17 and 0.21, the peak bond strength reduction was more pronounced, declining by 24.75%.
- (4)
- When the steel fiber content increased from 0% to 2%, the average bond strength growth rates were 56.73% and 80.41%, respectively. The bond stress–slip curves’ form is greatly influenced by the amount of steel fiber.
- (5)
- The average bond strength of the specimens with anchorage lengths of 3d, 4d, and 5d decreases by 44.94%, 53.77%, and 74.07% compared to the specimens with an anchorage length of 2d.
- (6)
- The bonding strength of concrete is positively correlated with its compressive strength. Depending on the different adhesive force, a typical pull-out failure curve was summarized, which can be divided into four stages.
- (7)
- Considering the impacts of the MS replacement ratio, w/b, steel fiber content, and anchorage length, the suggested formula aligns with the adhesive strength of UHPMC and HRB 600. Additionally, the proposed UHPMC and rebar bond–slip constitutive models can effectively anticipate the bond stress and slip relationship in this experiment as well as numerous prior experiments.
The results in this study can be used to better understand the bond–slip behavior between UHPMC and HRB 600 rebar. However, it is limited to understanding the bond–slip mechanism by only observing experimental phenomena and the bond–slip curve. Therefore, advanced detection techniques, including scanning electron microscopy (SEM), computed tomography (CT), ultrasound, digital image correlation (DIC), etc., should be employed to further validate the viewpoints of this paper.
Author Contributions
Conceptualization, Y.J.; Methodology, C.W., Y.J. and J.X.; Validation, J.X. and Y.C.; Formal analysis, C.W.; Investigation, C.W., J.X. and Y.C; Writing—original draft, C.W.; Writing—review & editing, Y.J.; Supervision, Y.J. All authors have read and agreed to the published version of the manuscript.
Funding
The authors would like to acknowledge the financial support from the National Natural Science Foundation of China (No. 52178266), Key Research and Development Program of Gansu-Industrial Projects (No. 22ZD11GA300), and Science and Technology Program from Department of Transportation of Gansu (No. MXKY-02).
Data Availability Statement
Data are contained within the article.
Conflicts of Interest
Author Jian Xing is employed by the company BCEG Advanced Construction Materials Technology Co., Ltd. The remaining authors declare that the research was conducted in the absence of any commercial or financial relationships that could be construed as a potential conflict of interest.
References
- Rao, S.K.; Sravana, P.; Rao, T.C. Investigating the effect of M-sand on abrasion resistance of Roller Compacted Concrete containing GGBS. Constr. Build. Mater. 2016, 122, 191–201. [Google Scholar] [CrossRef]
- Rathore, A.; Kushwaha, P.K.; Gangwar, M. A review on use of manufactured sand in concrete production. Int. J. Adv. Res. Dev. 2018, 3, 97–100. [Google Scholar]
- Meng, Q.; Jing, X.; Wang, H.; Guo, X.; Song, J.; Du, J. Flexural fatigue properties of concrete based on different replacement percentage of natural sand with manufactured sand. J. Build. Eng. 2024, 87, 108987. [Google Scholar] [CrossRef]
- Wille, K.; Boisvert-Cotulio, C. Material efficiency in the design of ultra-high performance concrete. Constr. Build. Mater. 2015, 86, 33–43. [Google Scholar] [CrossRef]
- Zhang, H.; Ji, T.; Zeng, X.; Yang, Z.; Lin, X.; Liang, Y. Mechanical behavior of ultra-high performance concrete (UHPC) using recycled fine aggregate cured under different conditions and the mechanism based on integrated microstructural parameters. Constr. Build. Mater. 2018, 192, 489–507. [Google Scholar] [CrossRef]
- Donza, H.; Cabrera, O.; Irassar, E.F. High-strength concrete with different fine aggregate. Cem. Concr. Res. 2002, 32, 1755–1761. [Google Scholar] [CrossRef]
- Sobuz, H.R.; Visintin, P.; Ali, M.S.M.; Singh, M.; Griffith, M.C.; Sheikh, A.H. Manufacturing ultra-high performance concrete utilising conventional materials and production methods. Constr. Build. Mater. 2016, 111, 251–261. [Google Scholar] [CrossRef]
- Shen, W.; Liu, Y.; Cao, L.; Huo, X.; Yang, Z.; Zhou, C.; He, P.; Lu, Z. Mixing design and microstructure of ultra high strength concrete with manufactured sand. Constr. Build. Mater. 2017, 143, 312–321. [Google Scholar] [CrossRef]
- Kumar, P.S.; Mannan, M.A.; Kurian, V.J.; Achuytha, H. Investigation on the flexural behaviour of high-performance reinforced concrete beams using sandstone aggregates. Build. Environ. 2007, 42, 2622–2629. [Google Scholar] [CrossRef]
- Zhao, X.T.; Yang, D.Y.; Zhu, C.X.; Yang, J.; Liu, M. Study on ultra high performance concrete mixed with mechanism sand. Concrete 2020, 9, 152–154+160. (In Chinese) [Google Scholar]
- Feng, T.T.; Jiang, J.Y.; Liu, Z.Y.; Yue, C.J.; Wang, F.J.; Wu, Y.R.; Chu, H.Y. Impact Compression Mechanical Properties of Ultra-High Performance Concrete with Manufactured Sand. J. Chin. Ceram. Soc. 2020, 48, 1177–1187. (In Chinese) [Google Scholar]
- Jiao, Y.B.; Chen, Y.J.; Yang, H.; Wang, C. Experimental characterization on fracture behavior of UHPMC under small-scale sample tensile testing: Acoustic emission monitoring and digital image correlation. Theor. Appl. Fract. Mech. 2024, 130, 104342. [Google Scholar] [CrossRef]
- Wei, J.; Ying, H.; Yang, Y.; Zhang, W.; Yuan, H.; Zhou, J. Seismic performance of concrete-filled steel tubular composite columns with ultra high performance concrete plates. Eng. Struct. 2023, 278, 115500. [Google Scholar] [CrossRef]
- Pang, B.; Jin, Z.; Zhang, Y.; Xu, L.; Li, M.; Wang, C.; Zhang, Y.; Yang, Y.; Zhao, P.; Bi, J.; et al. Ultraductile waterborne epoxy-concrete composite repair material: Epoxy-fiber synergistic effect on flexural and tensile performance. Cem. Concr. Compos. 2022, 129, 104463. [Google Scholar] [CrossRef]
- Marchand, P.; Baby, F.; Khadour, A.; Battesti, T.; Rivillon, P.; Quiertant, M.; Nguyen, H.-H.; Généreux, G.; Deveaud, J.-P.; Simon, A. Bond behaviour of reinforcing bars in UHPFRC. Mater. Struct. 2015, 49, 1979–1995. [Google Scholar] [CrossRef]
- Khaksefidi, S.; Ghalehnovi, M.; Brito, J. Bond behaviour of high-strength steel rebars in normal (NSC) and ultra-high performance concrete (UHPC). J. Build. Eng. 2021, 33, 101592. [Google Scholar] [CrossRef]
- Alkaysi, M.; El-Tawil, S. Factors affecting bond development between Ultra High Performance Concrete (UHPC) and steel bar reinforcement. Constr. Build. Mater. 2017, 144, 412–422. [Google Scholar] [CrossRef]
- Han, F.Y.; Liu, J.Z.; Liu, J.P.; Ma, B.; Sha, J.F.; Wang, X.L. Study on Anchorage Behavior of Steel Bar in Ultra-high Performance Concrete. Mater. Rep. 2019, 33, 244–248. (In Chinese) [Google Scholar]
- Liang, R.; Huang, Y. Experimental study on bond performance between high strength steel rebar and ultra-high performance concrete. J. Build. Struct. 2022, 43, 294–302. (In Chinese) [Google Scholar]
- Hu, A.X.; Liang, X.W.; Shi, Q.X. Bond characteristics between high strength bars and ultra-high performance concrete. J. Xi’an Univ. Archit. Technol. Nat. Sci. Ed. 2021, 53, 534–544. (In Chinese) [Google Scholar]
- Luo, Y.; Liao, P.; Pan, R.; Zou, J.; Zhou, X. Effect of bar diameter on bond performance of helically ribbed GFRP bar to UHPC. J. Build. Eng. 2024, 91, 109577. [Google Scholar] [CrossRef]
- Sun, L.; Wang, C.; Zhang, C.; Yang, Z.; Li, C.; Qiao, P. Experimental investigation on the bond performance of sea sand coral concrete with FRP bar reinforcement for marine environments. Adv. Struct. Eng. 2023, 26, 533–546. [Google Scholar] [CrossRef]
- JGJ 52-2006; Standard for Quality and Inspection Methods of Sand and Gravel for Ordinary Concrete. China Architecture & Building Press: Beijing, China, 2006. (In Chinese)
- GB/T 50080-2016; Standard for Test Method of Performance on Ordinary Fresh Concrete. China Architecture & Building Press: Beijing, China, 2016. (In Chinese)
- GB/T 2419-2005; Test Method for Fluidity of Cement Mortar. China Architecture & Building Press: Beijing, China, 2005. (In Chinese)
- GB/T 31387-2015; Reactive Powder Concrete. China Architecture & Building Press: Beijing, China, 2015. (In Chinese)
- Tighiouart, B.; Benmokrane, B.; Gao, D. Investigation of bond in concrete member with fibre reinforced polymer (FRP) bars. Constr. Build. Mater. 1998, 12, 453–462. [Google Scholar] [CrossRef]
- Lee, J.-Y.; Kim, T.-Y.; Kim, T.-J.; Yi, C.-K.; Park, J.-S.; You, Y.-C.; Park, Y.-H. Interfacial bond strength ofglass fiber reinforced polymer bars in high-strength concrete. Compos. Part B Eng. 2008, 39, 258–270. [Google Scholar] [CrossRef]
- CEB-FIP. Fib Model Code for Concrete Structures 2010; John Wiley & Sons: Lausanne, Switzerland, 2013. [Google Scholar]
- Sturm, A.B.; Visintin, P. Local bond slip behavior of steel reinforcing bars embedded in ultra high performance fibre reinforced concrete. Struct. Concr. 2019, 20, 108–122. [Google Scholar] [CrossRef]


Disclaimer/Publisher’s Note: The statements, opinions and data contained in all publications are solely those of the individual author(s) and contributor(s) and not of MDPI and/or the editor(s). MDPI and/or the editor(s) disclaim responsibility for any injury to people or property resulting from any ideas, methods, instructions or products referred to in the content. |
© 2024 by the authors. Licensee MDPI, Basel, Switzerland. This article is an open access article distributed under the terms and conditions of the Creative Commons Attribution (CC BY) license (https://creativecommons.org/licenses/by/4.0/).