Abstract
As a unique geological hazard in a high-geo-stress environment, rockburst happens with strong suddenness, randomness, and destructiveness, but the mechanism of its occurrence in a deep-buried tunnel in a high-geo-stress environment needs further study. Based on the analyses of the stress field of the rockburst section of Ping’an Tunnel, which is over-long and deep-buried, the occurrence mechanism of rockburst is figured out. Furtherly, the intensity and location of rockburst are predicted by using the rockburst criterion. Results show that there exists large compressive stress at the side wall of the tunnel, which is the main cause of rockburst. Under a high-geo-stress condition, due to the existence of unfavorable factors like structural planes, high intensity rockburst is likely to happen in the middle of the tunnel face after the sudden release of original rock stress. Arranging stress-releasing holes in the rockburst section can effectively reduce the possibility of rockburst by releasing the original rock stress in advance. The research results can deepen the understanding of the mechanism of rockburst in a high-geo-stress environment and provide scientific basis for the prevention and control of rockburst in similar engineering projects.
1. Introduction
Rockburst is an unstable rock failure and one of the most hazardous problems in deep mines and civil tunnels. A rockburst is a sudden failure of rock in the form of a rapid ejection of failed rocks, accompanied by the release of a large amount of energy [1]. The complex distribution of the geo-stress field and the strong geological tectonic movement have caused the inevitable encounters of frequent rockbursts during the construction of underground engineering [2,3,4].
As a unique geological disaster in a high-geo-stress environment, the rockburst occurrence mechanism, prediction, and prevention and control measures have always been hot issues in the field of geotechnical engineering [5]. To effectively prevent and control rockburst and reduce the damage to the projects, in the construction of tunnel engineering, the actual environment should be fully considered. Additionally, appropriate mechanical parameters should be selected to analyze the stress characteristics of rockburst. Furtherly, reasonable prevention and control measures should be taken [6,7]. A lot of in-depth research on the mechanism of rockburst has been carried out. Since the 1960s, W.D. Ortlepp has tracked hundreds of rockbursts occurring in gold mines of South Africa and elaborated the rockburst source mechanism and failure mechanism, pointing out that strain rockbursts were characterized by the occurrence in stress concentration areas, mine earthquakes occurred after rockburst, and the rockburst source was possibly not exactly the same as the failure source [8,9]. Bagde et al. [10] evaluated the stability of burst-prone rocks during the mining by conducting uniaxial dynamic cyclic loading and unloading tests [11]. Feng et al. [11] made comprehensive use of positive functions of the microseism monitoring technology and the acoustic emission technology and focused on the study on the generation mechanism of tunnel rockburst, the monitoring and early warning, and the dynamic support in the later period, etc. They revealed the generation mechanisms and microseism evolution laws of different types of rockburst and proposed the dynamic prevention and control techniques for different types of rockburst [12]. According to the different mechanisms of rockburst, academician Qian Qihu divided rockburst into fracture-slip-type and strain-type rockburst and analyzed the mechanism and characteristics of the two types of rockburst [13]. Amin et al. [14] performed a numerical simulation on the rockburst near the joint plane of a deep tunnel, and the results showed that the joint plane near the tunnel would cause stress concentration and decrease the stiffness of the surrounding rock, thereby inducing the occurrence of rockburst [15]. Considering the influence of static load and dynamic disturbance on rockburst, Li et al. [16] used a combined dynamic and static loading method to investigate the failure characteristics of strain-type rockburst in the surrounding rock during the excavation of a deep-buried tunnel [17]. Lin et al. [18] carried out loading and unloading tests on the physical model of rockburst under different stress gradient conditions. With the help of a scanning electron microscope, he analyzed the meso-morphological characteristics of the failure surface of the rock specimen and studied the effect of rockburst with different stress gradients on the internal meso-level structure of the surrounding rock [19]. Gong et al. [15] developed a distance discriminant analysis model for rockburst occurrence and intensity classification prediction based on the distance discriminant analysis theory. They proposed the method for predicting the rockburst occurrence and intensity based on the failure status of laboratory rock tests [20].
Due to the complex factors and conditions that cause rockbursts, and their sudden, random, and destructive nature, understanding the mechanical mechanisms and patterns of rockburst occurrence is crucial for accurate prediction and forecasting. Feng described the characteristics of rockbursts during the construction of the Erlangshan Tunnel, noting that rockburst sounds occur both at the tunnel face and within the rock mass. He stated that mild rockbursts produce crisp sounds, while severe rockbursts produce dull sounds [21]. Li et al. [22] used physical model tests of tunnel rockbursts to explain the signs of rockbursts in high-stress areas, such as brittle failure of surrounding rock, particle ejection, fragment spalling, and crack propagation [22]. Ma and Tang employed microseismic monitoring technology as a rockburst monitoring and early warning method. By comparing on-site observations with microseismic monitoring results, they studied the rockburst mechanisms and proposed corresponding prediction methods [23]. Chen Xuwen and colleagues, during the construction of the Micangshan Tunnel rockburst section, analyzed the overall stability of hard rock tunnels and the characteristics of rockbursts. They proposed rapid construction techniques based on flexible support, rockburst prediction, loosening zone testing, and flexible mesh testing [24].
In summary, although scholars have extensively studied rockburst mechanisms, prevention, and construction treatments, there is a significant lack of research on the characteristics and stress variation patterns of rockbursts at construction sites. Understanding these factors is crucial for studying rockburst mechanisms, prediction, and prevention. Therefore, this paper focuses on the Ping’an Tunnel of the Chenglan Railway, a long and deep-buried tunnel prone to high-stress rockbursts. Using field measurements, numerical analysis, and laboratory experiments, we studied the stress characteristics of the rockburst-prone sections of the Ping’an Tunnel. The findings provide scientific evidence for the construction of similar long and deep-buried tunnels, enhance understanding of the stress field in rockburst-prone sections under high-stress conditions, and offer important references for related engineering projects.
Since the occurrence factors and conditions of rockburst are very complicated with strong suddenness, randomness, and destructiveness, it is necessary to understand the mechanism and developing law of rockburst for the accurate prediction and forecasting of the occurrence of rockburst. The Ping’an over-long deep-buried tunnel of the Cheng-Lan railway is taken as the engineering background, and its high-geo-stress rockburst-prone section is taken as the research focus by using the on-site measurement, numerical analysis, and laboratory experiments to study the stress characteristics of rockburst. The research results can not only provide a scientific basis for the construction of similar over-long and deep-buried tunnels, but also deepen the understanding of the stress field of the rockburst section under high geo-stress and have important reference significance for the construction of related projects.
2. Project Overview
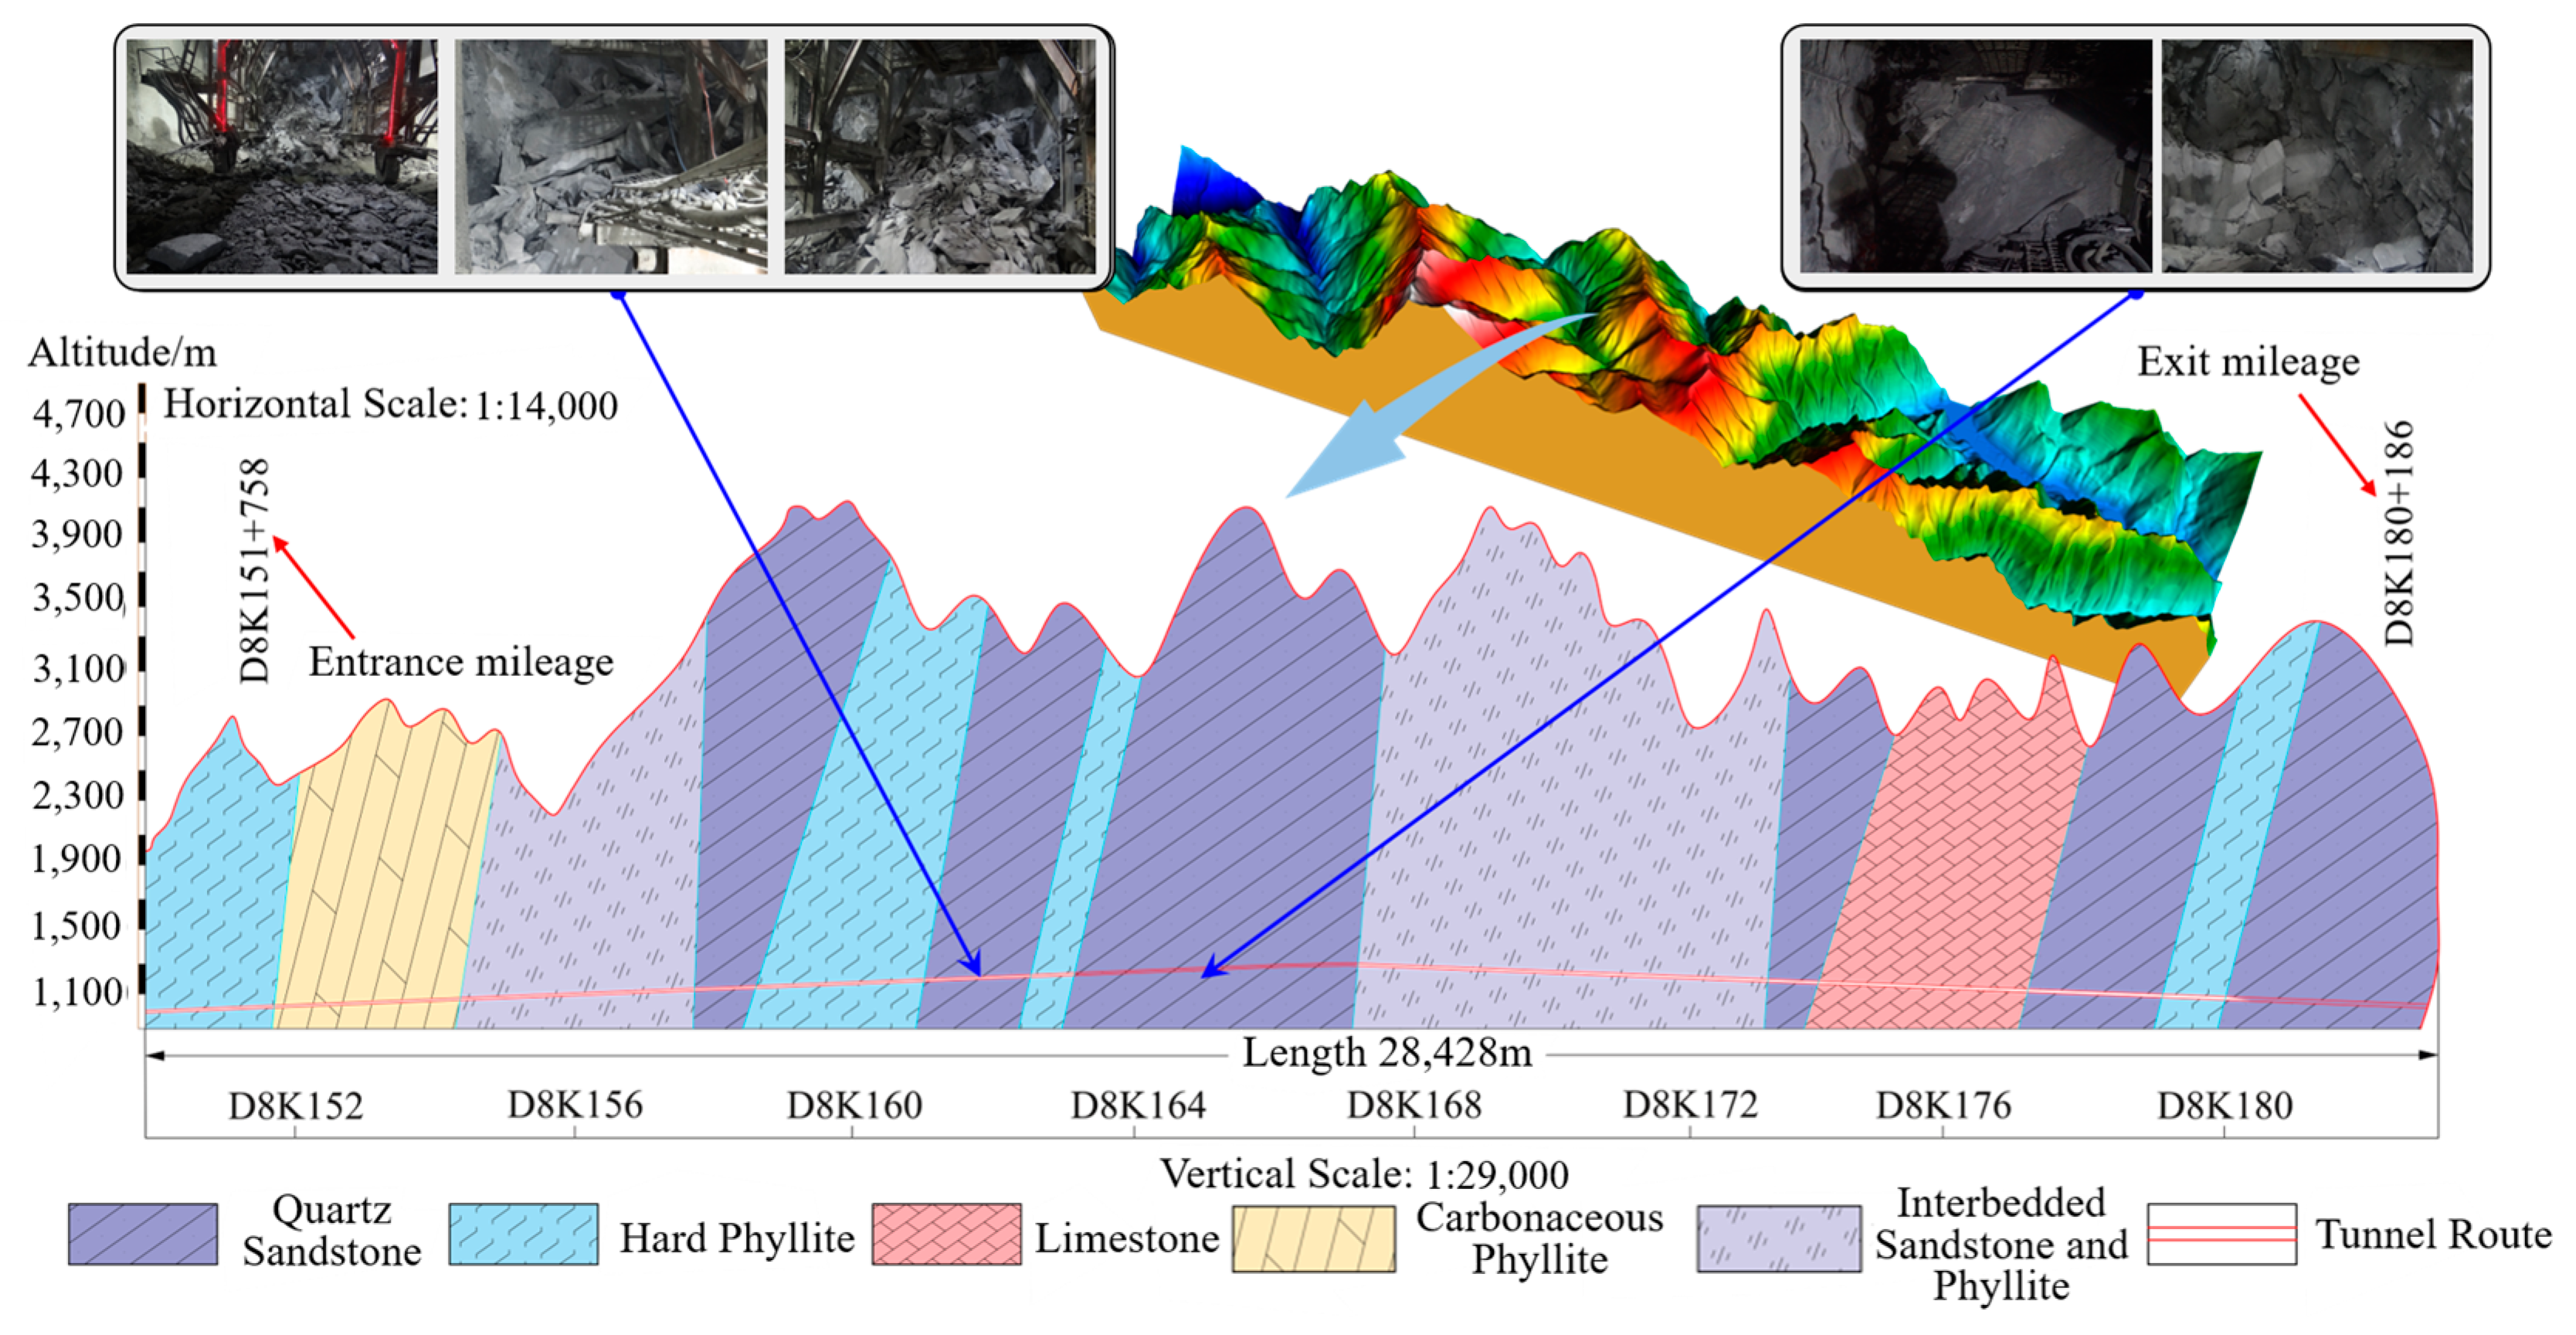
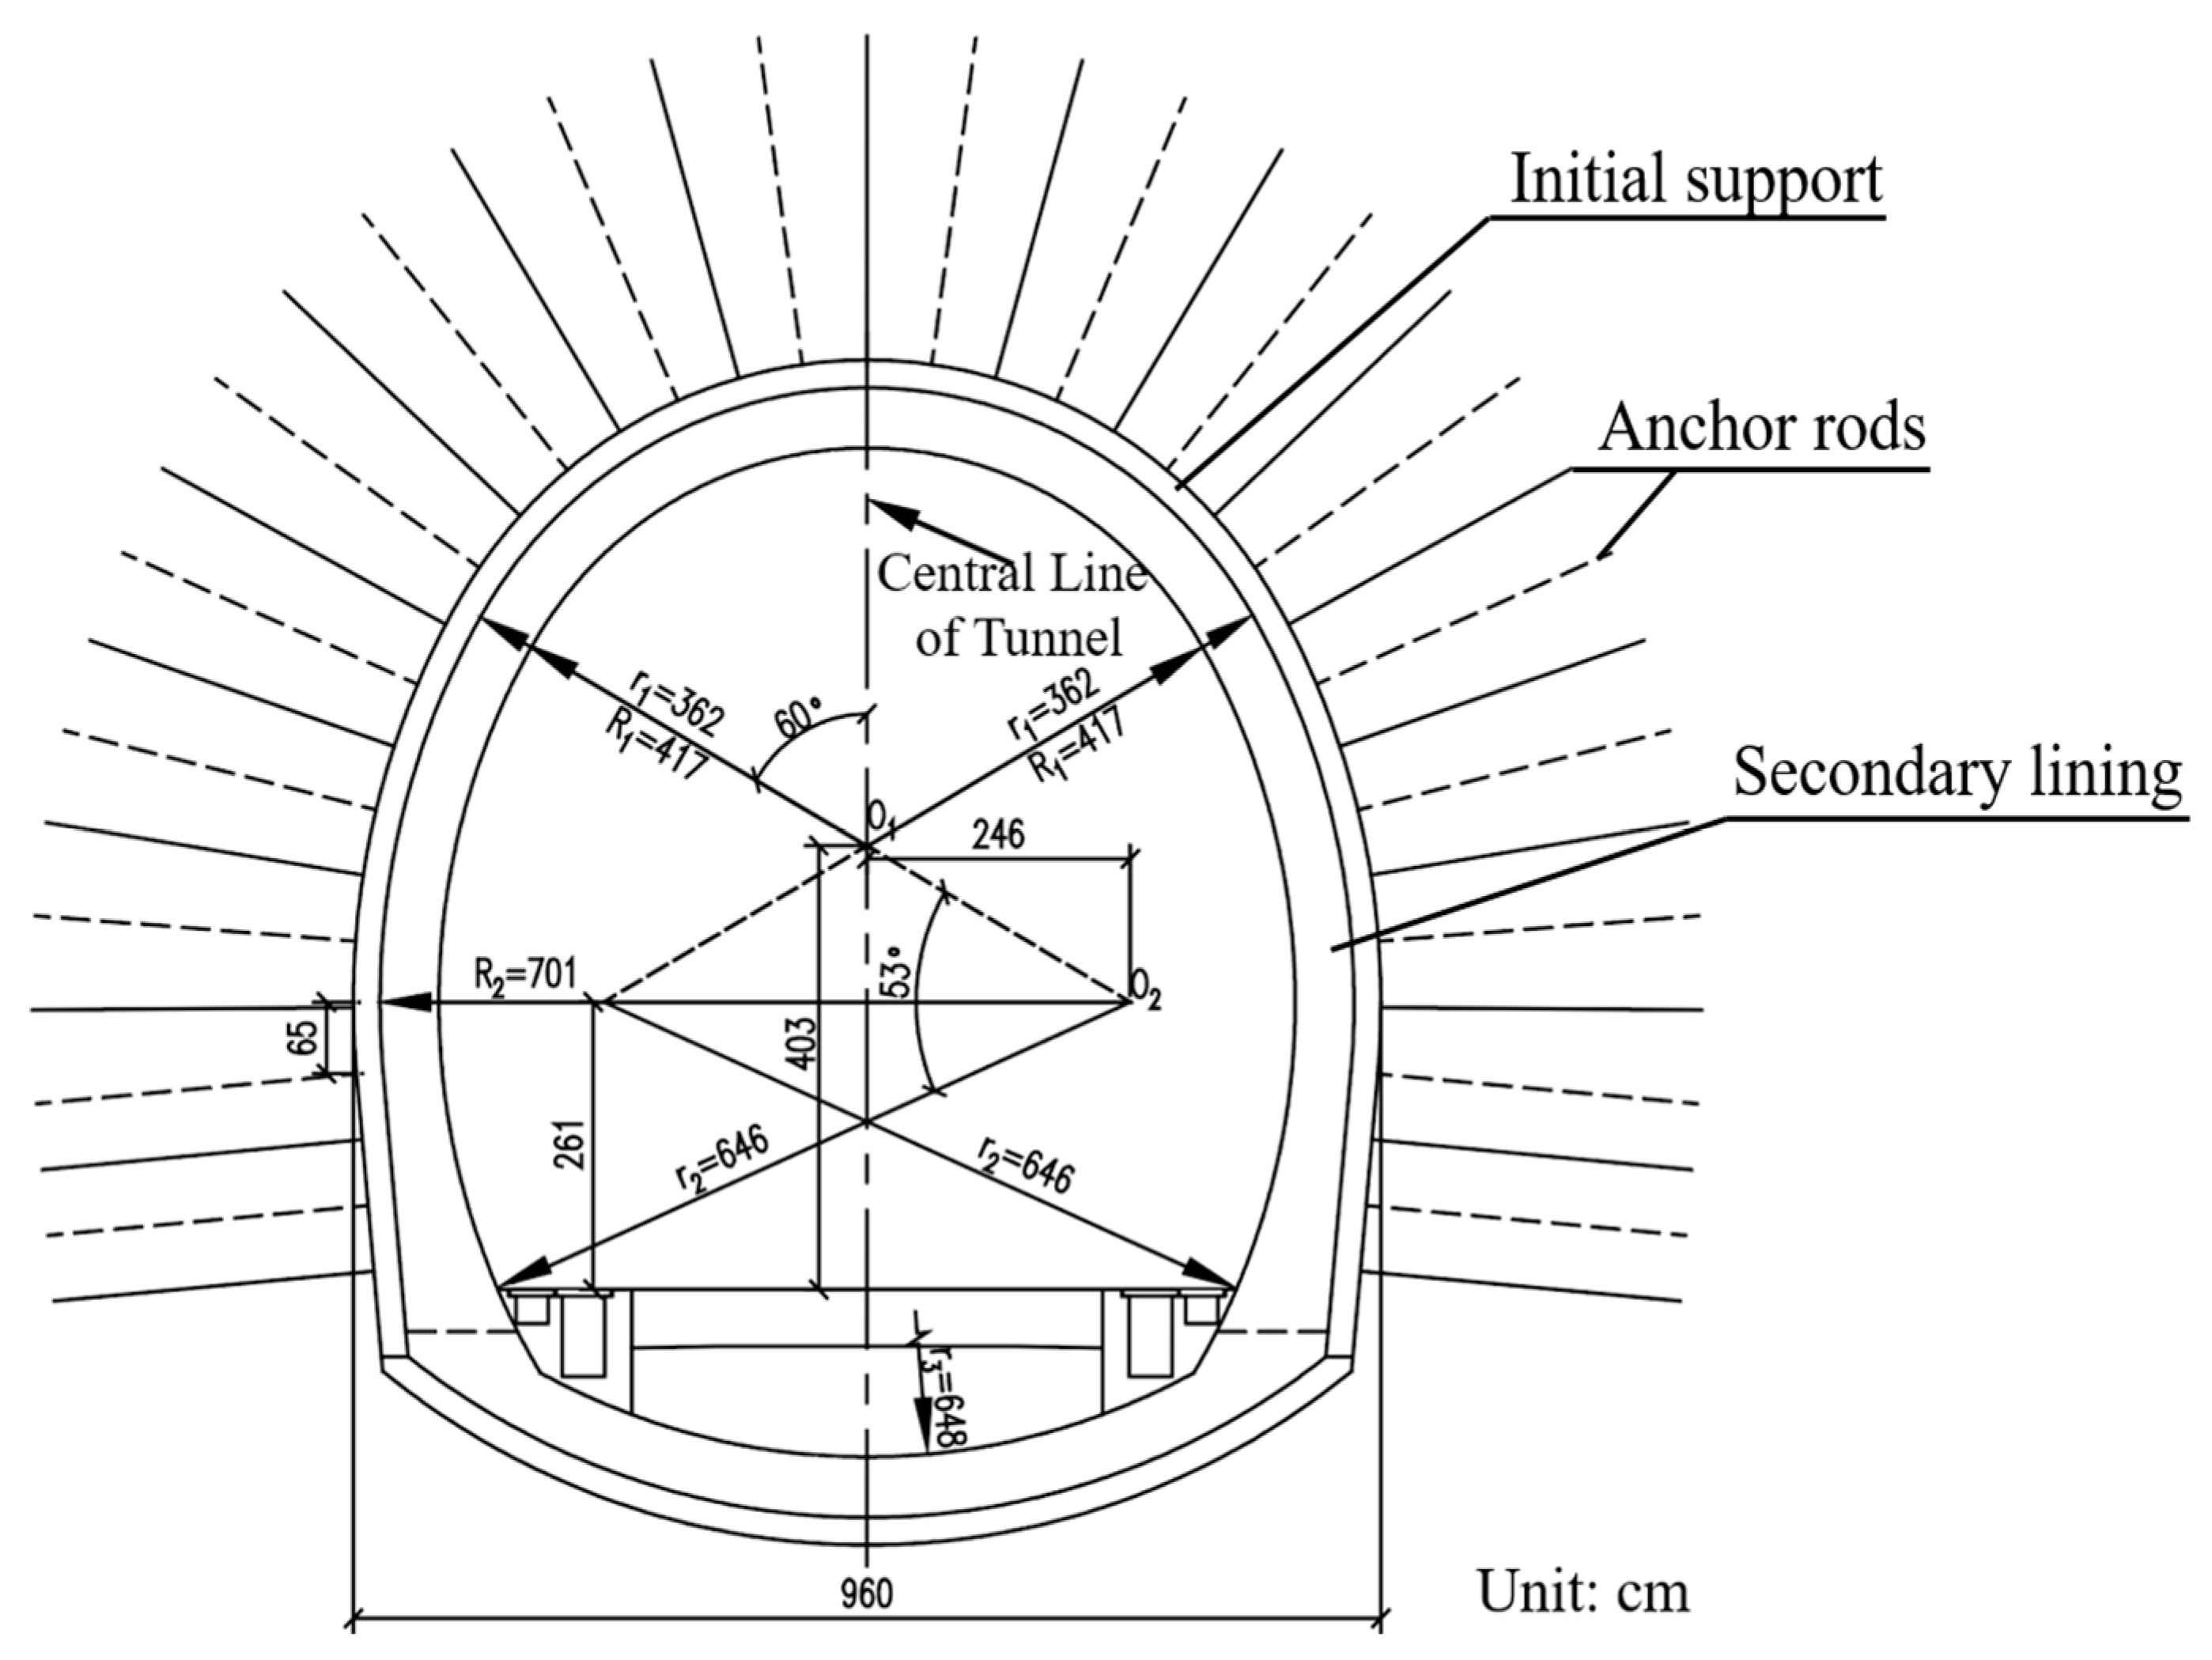
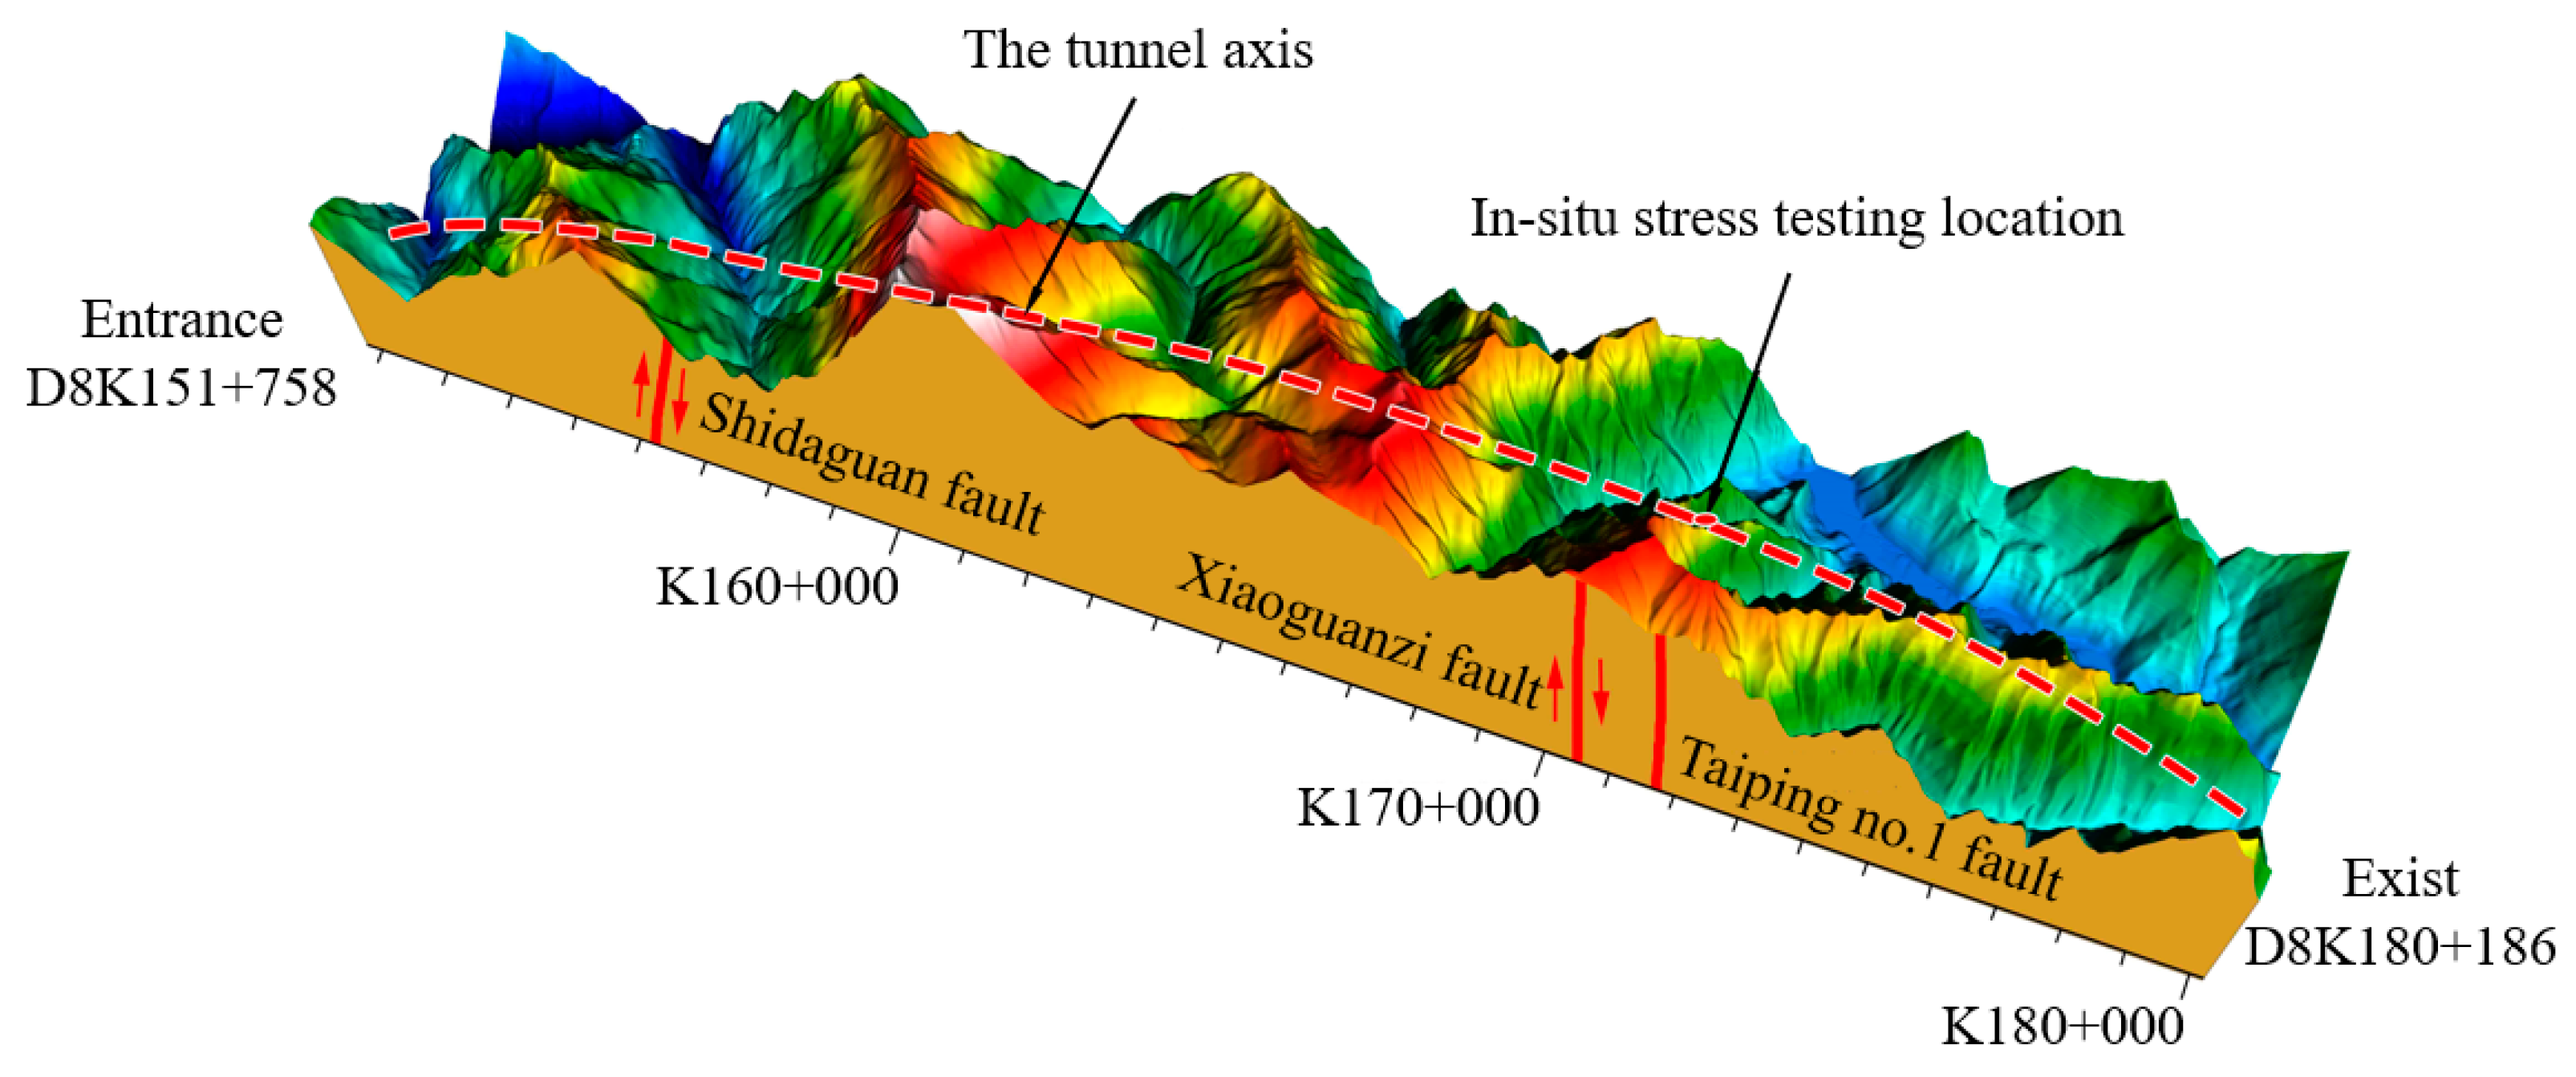
The Chengdu–Lanzhou Railway starts from Chengdu, passing through Maoxian, Songpan, and Jiuzhaigou counties, and ultimately reaches Lanzhou. The entire route ascends from the Chengdu Plain at an altitude of 500 m to the eastern edge of the Qinghai–Tibet Plateau at an altitude of 3400 m. Ping’an Tunnel is the most crucial control project of the Chengdu–Lanzhou Railway. It is located between Taohuazhaigou and Taipinggou in Maoxian, Aba Tibetan and Qiang Autonomous Prefecture, Sichuan Province. The tunnel is 28,428 m long, with a vertical elevation difference of 2900 m from start to finish. The Ping’an Tunnel site has developed geological structures, and the geological conditions are extremely complex. The longitudinal geological section of the tunnel is shown in Figure 1. The tectonic stress in the tunnel site is relatively high, and the surrounding rock of the tunnel has good integrity and high strength, making it prone to stress concentration. Influenced by intense and complex tectonic movements, high ground stress, and excavation disturbances, encountering high-intensity rockbursts during the excavation process in deeply buried hard rock sections poses a serious threat and challenge to tunnel construction and personnel safety. The construction of the tunnel is organized according to the principles of the New Austrian Method, using smooth blasting and anchor-spray initial support with wet spray technology. The tunnel excavation section and design dimensions are shown in Figure 2. The on-site support parameters and construction process for the Ping’an Tunnel are as follows: First, 3.0 m long Φ25 mm system bolts are installed into the surrounding rock at 1.0 × 1.0 m intervals. Next, I16 steel arches are erected. Finally, C25 concrete is sprayed to a thickness of 8.0 cm. Once the initial support is complete and the surrounding rock is stabilized, a 1.0 m thick layer of C30 reinforced concrete is applied as the secondary lining of the tunnel.
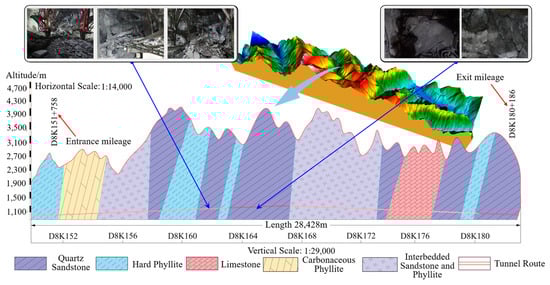
Figure 1.
Geological longitudinal section of Ping’an Tunnel.
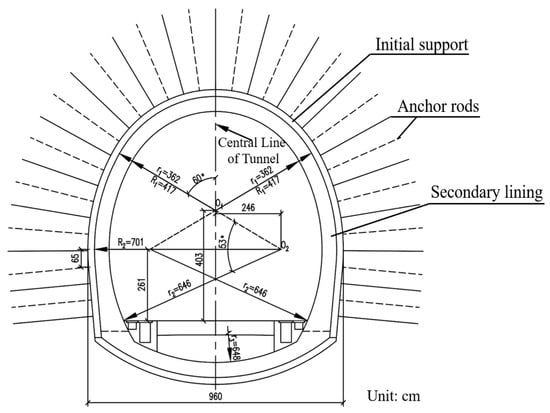
Figure 2.
Excavation profile of Ping’an Tunnel.
3. Rockburst Characteristics of Ping’an Tunnel
To better understand the occurrence of rockburst in Ping’an Tunnel and to figure out the characteristics of the rockburst section of the over-long deep-buried tunnel of the Cheng-Lan railway, the time, geological conditions, and rockburst grades of the rockburst at the site of the Ping’an railway are summarized. The occurrence of rockburst in Ping’an Tunnel is shown in Table 1.

Table 1.
Statistics of rockburst on the left and right lines of Pingan tunnel.
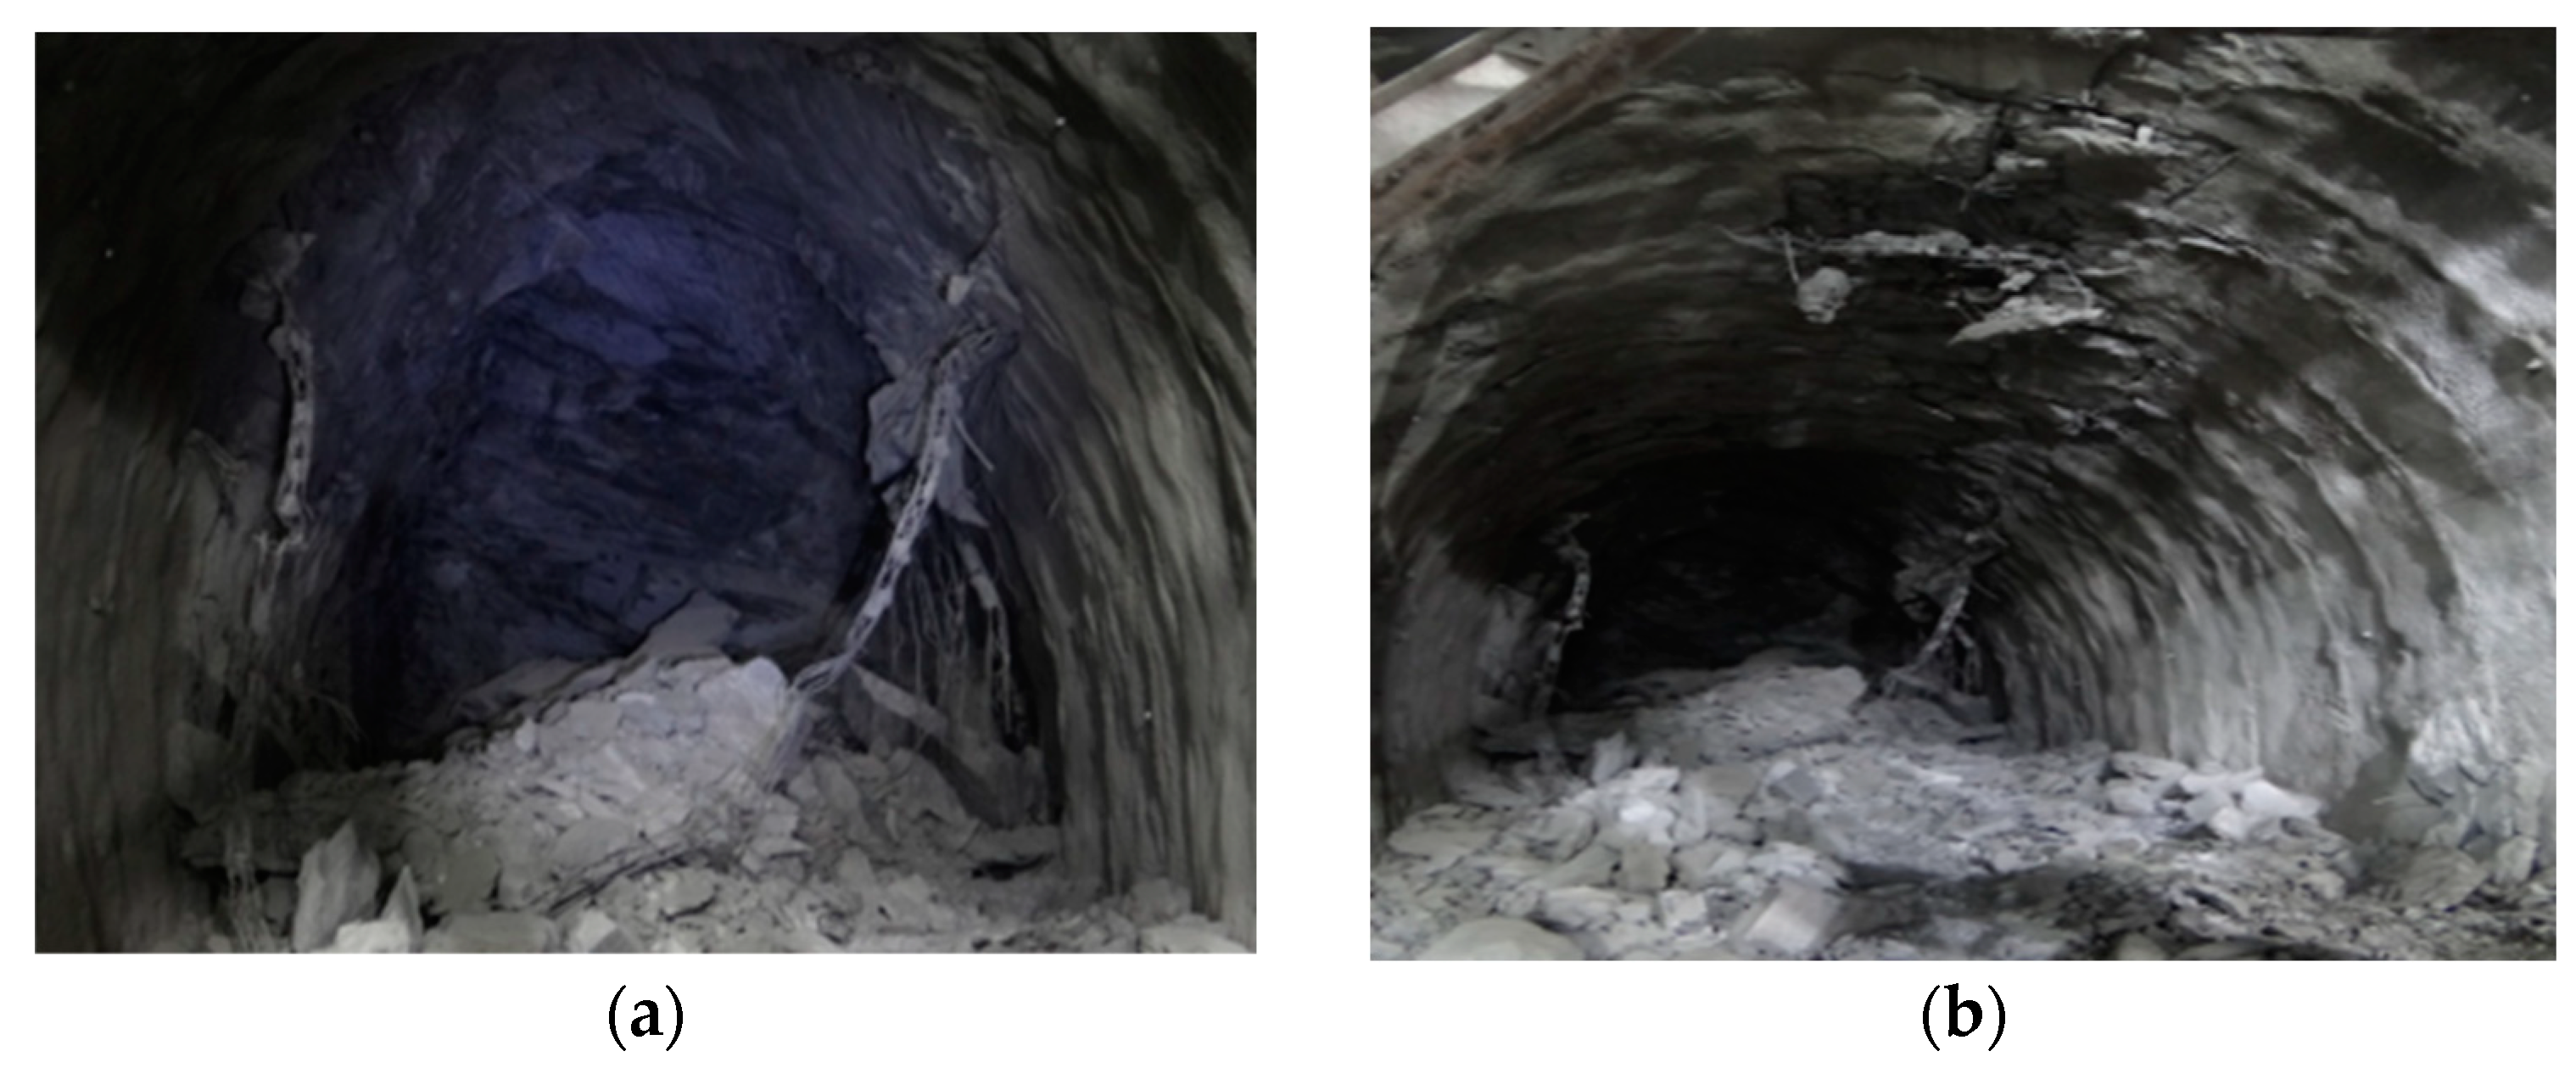
A strong rockburst occurred after excavation at D8K160+990 on the left line of Ping’an Tunnel. The rockburst sounded like a detonator with a crisp crackling. The rock mass on the face of the tunnel was peeled off. The long and short axes of the blast hole were about 3.2 m and 2.1 m with the maximum depth and block diameter of about 1.2 m and 1.3 m. The lithology at D8K171+938 on the left line of the tunnel was sandstone. After excavation at the upper right of the line, a strong rockburst occurred. The sound of rockburst was like a detonator-like clear cracking sound. The blast hole had an irregular shape with the long and short axis of about 2.9 m and 2.2 m. The maximum depth was about 0.9 m with the rockburst volume of about 8 m3, and the maximum block diameter was about 0.8 m, as shown in Figure 3.
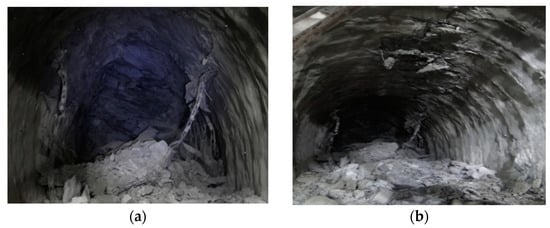
Figure 3.
Left line of Ping’an Tunnel strong rockburst outbreak site: (a) Strong rockburst (D8K160+990). (b) Strong rockburst (D8K171+938).
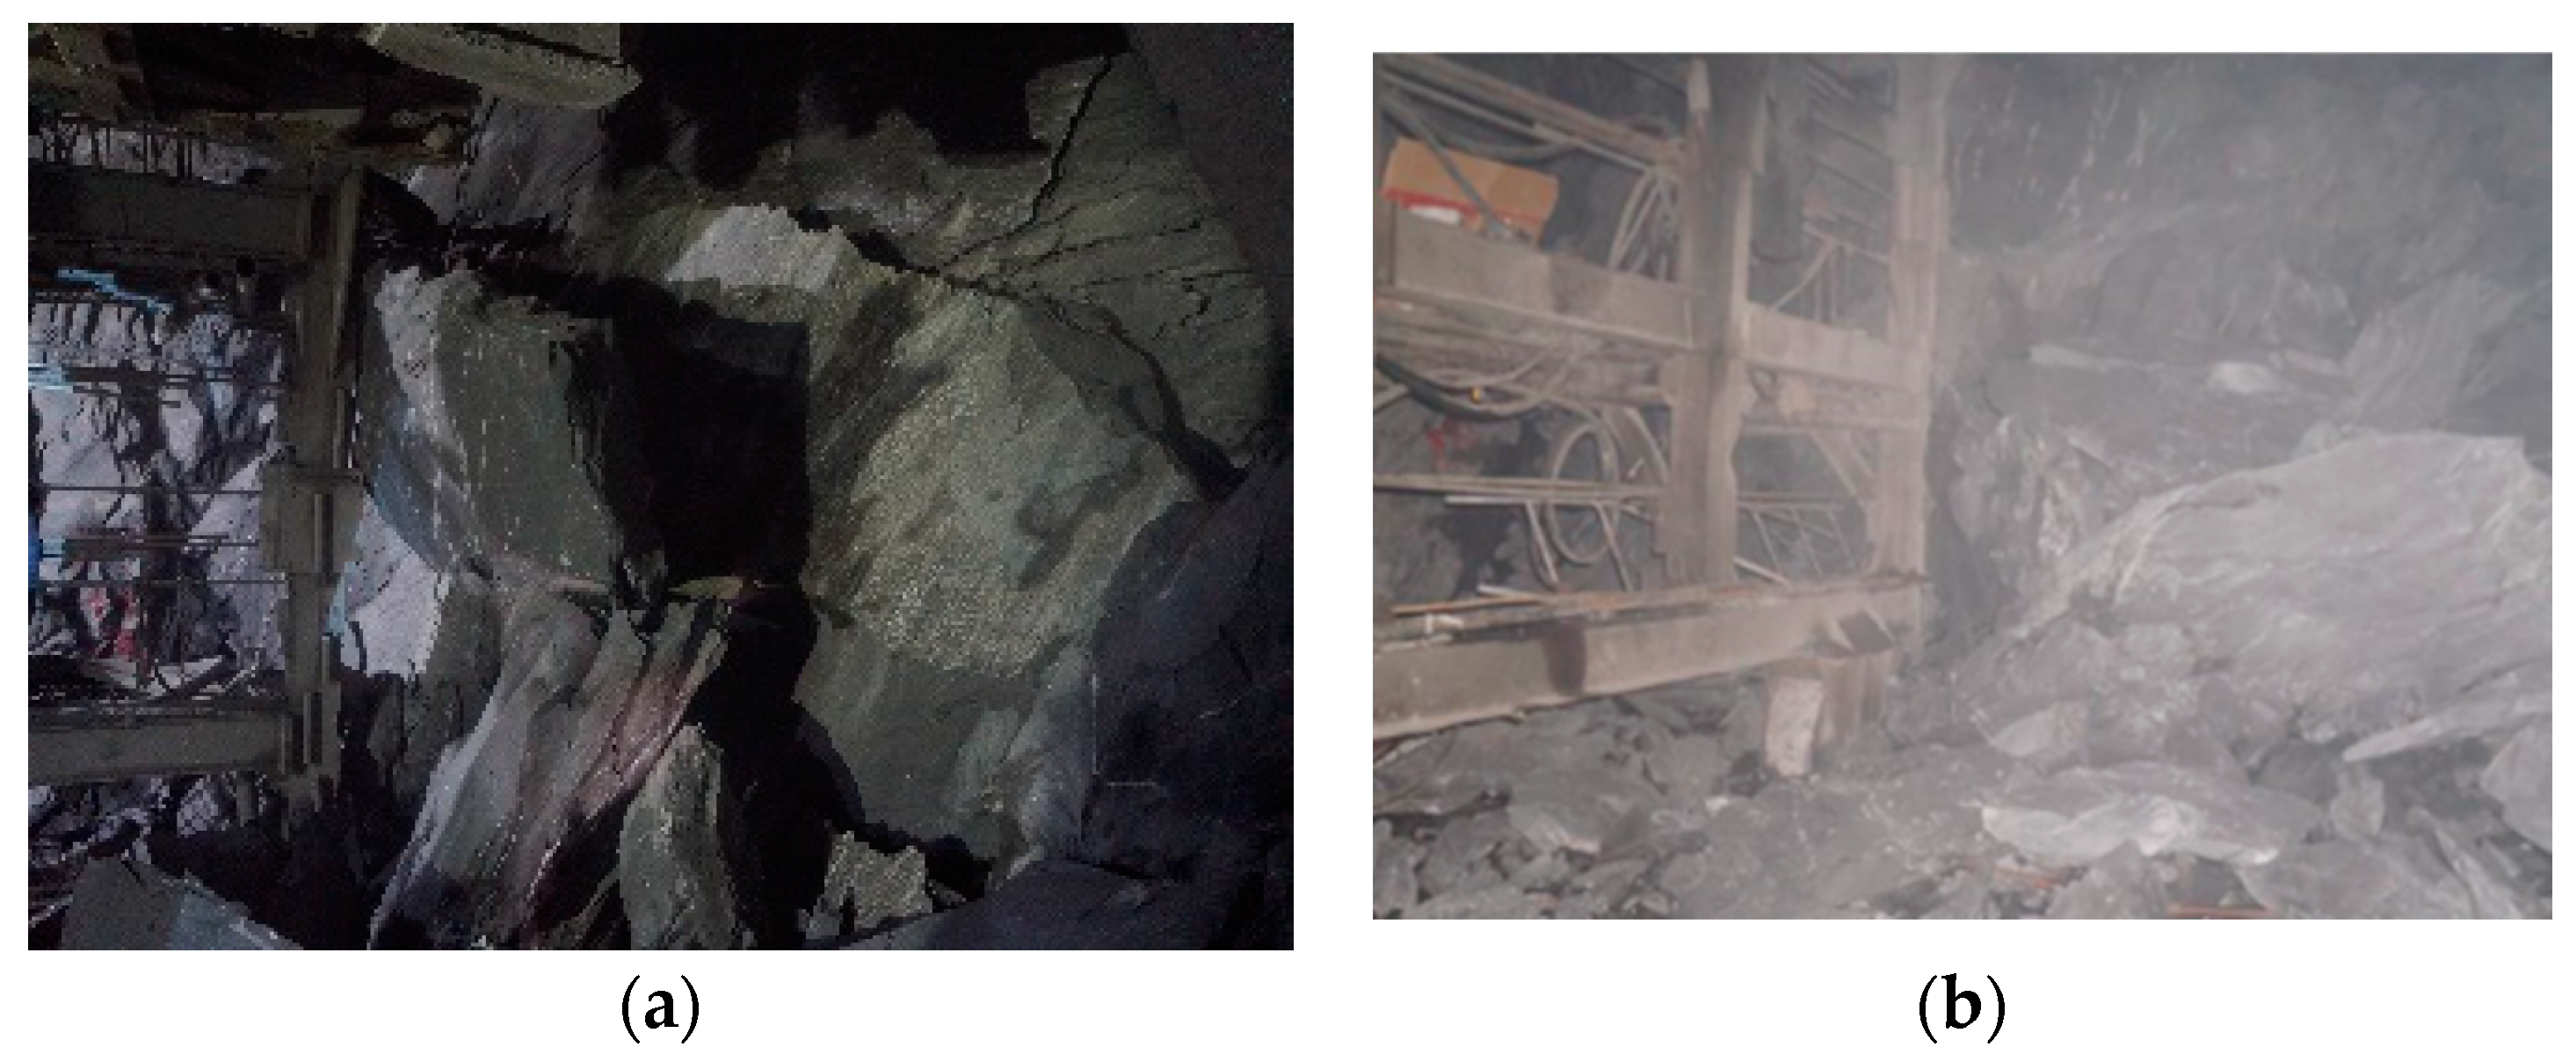
The damage caused by rockburst on the right line of Ping’an Tunnel was more serious than that on the left line. The projectile rock mass in the strong rockburst section of the right line reached 50 m3 with the projectile distance up to 30 m. The strong rockburst caused damage to the initial support structure of the right line. The arch was seriously distorted and severely collapsed locally. A middle rock pillar was formed 50 m before the right line penetrated. Due to stress concentration and energy accumulation, a strong rockburst occurred, as shown in Figure 4.
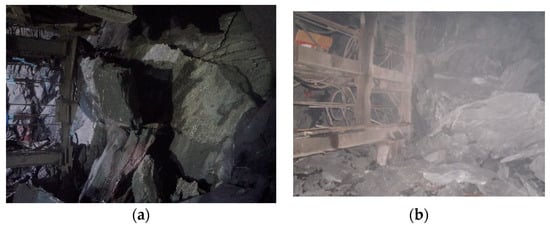
Figure 4.
Right line of Ping’an Tunnel strong rockburst outbreak site: (a) Strong rockburst (YD8K171+805). (b) Strong rockburst (YD8K171+946).
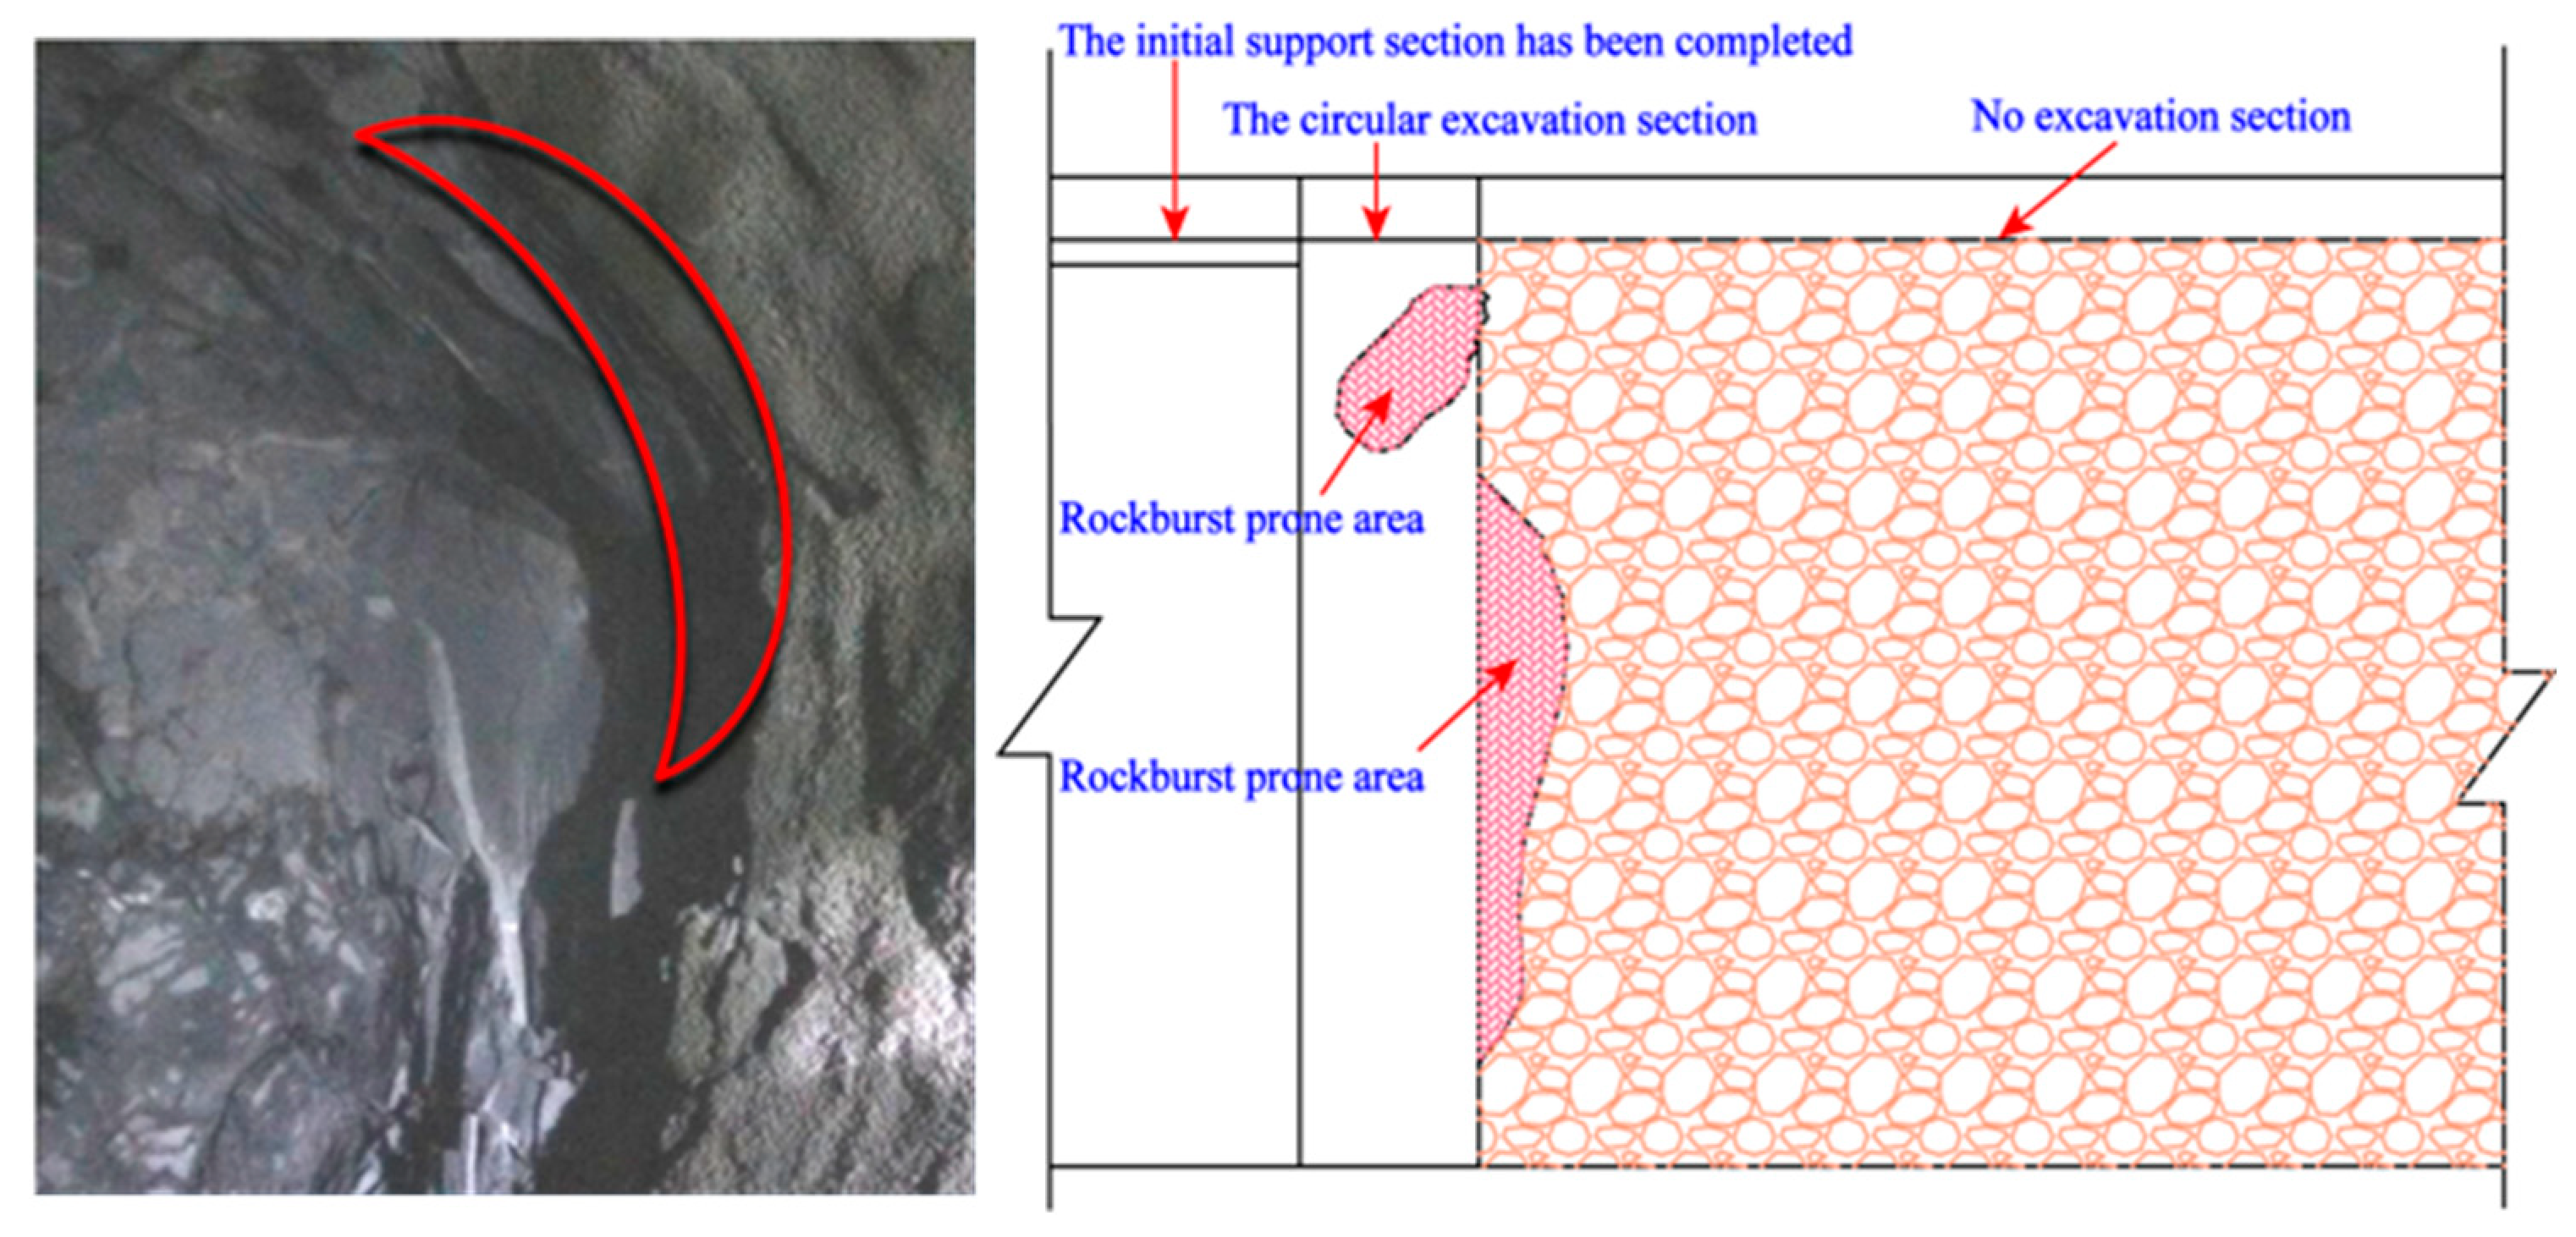
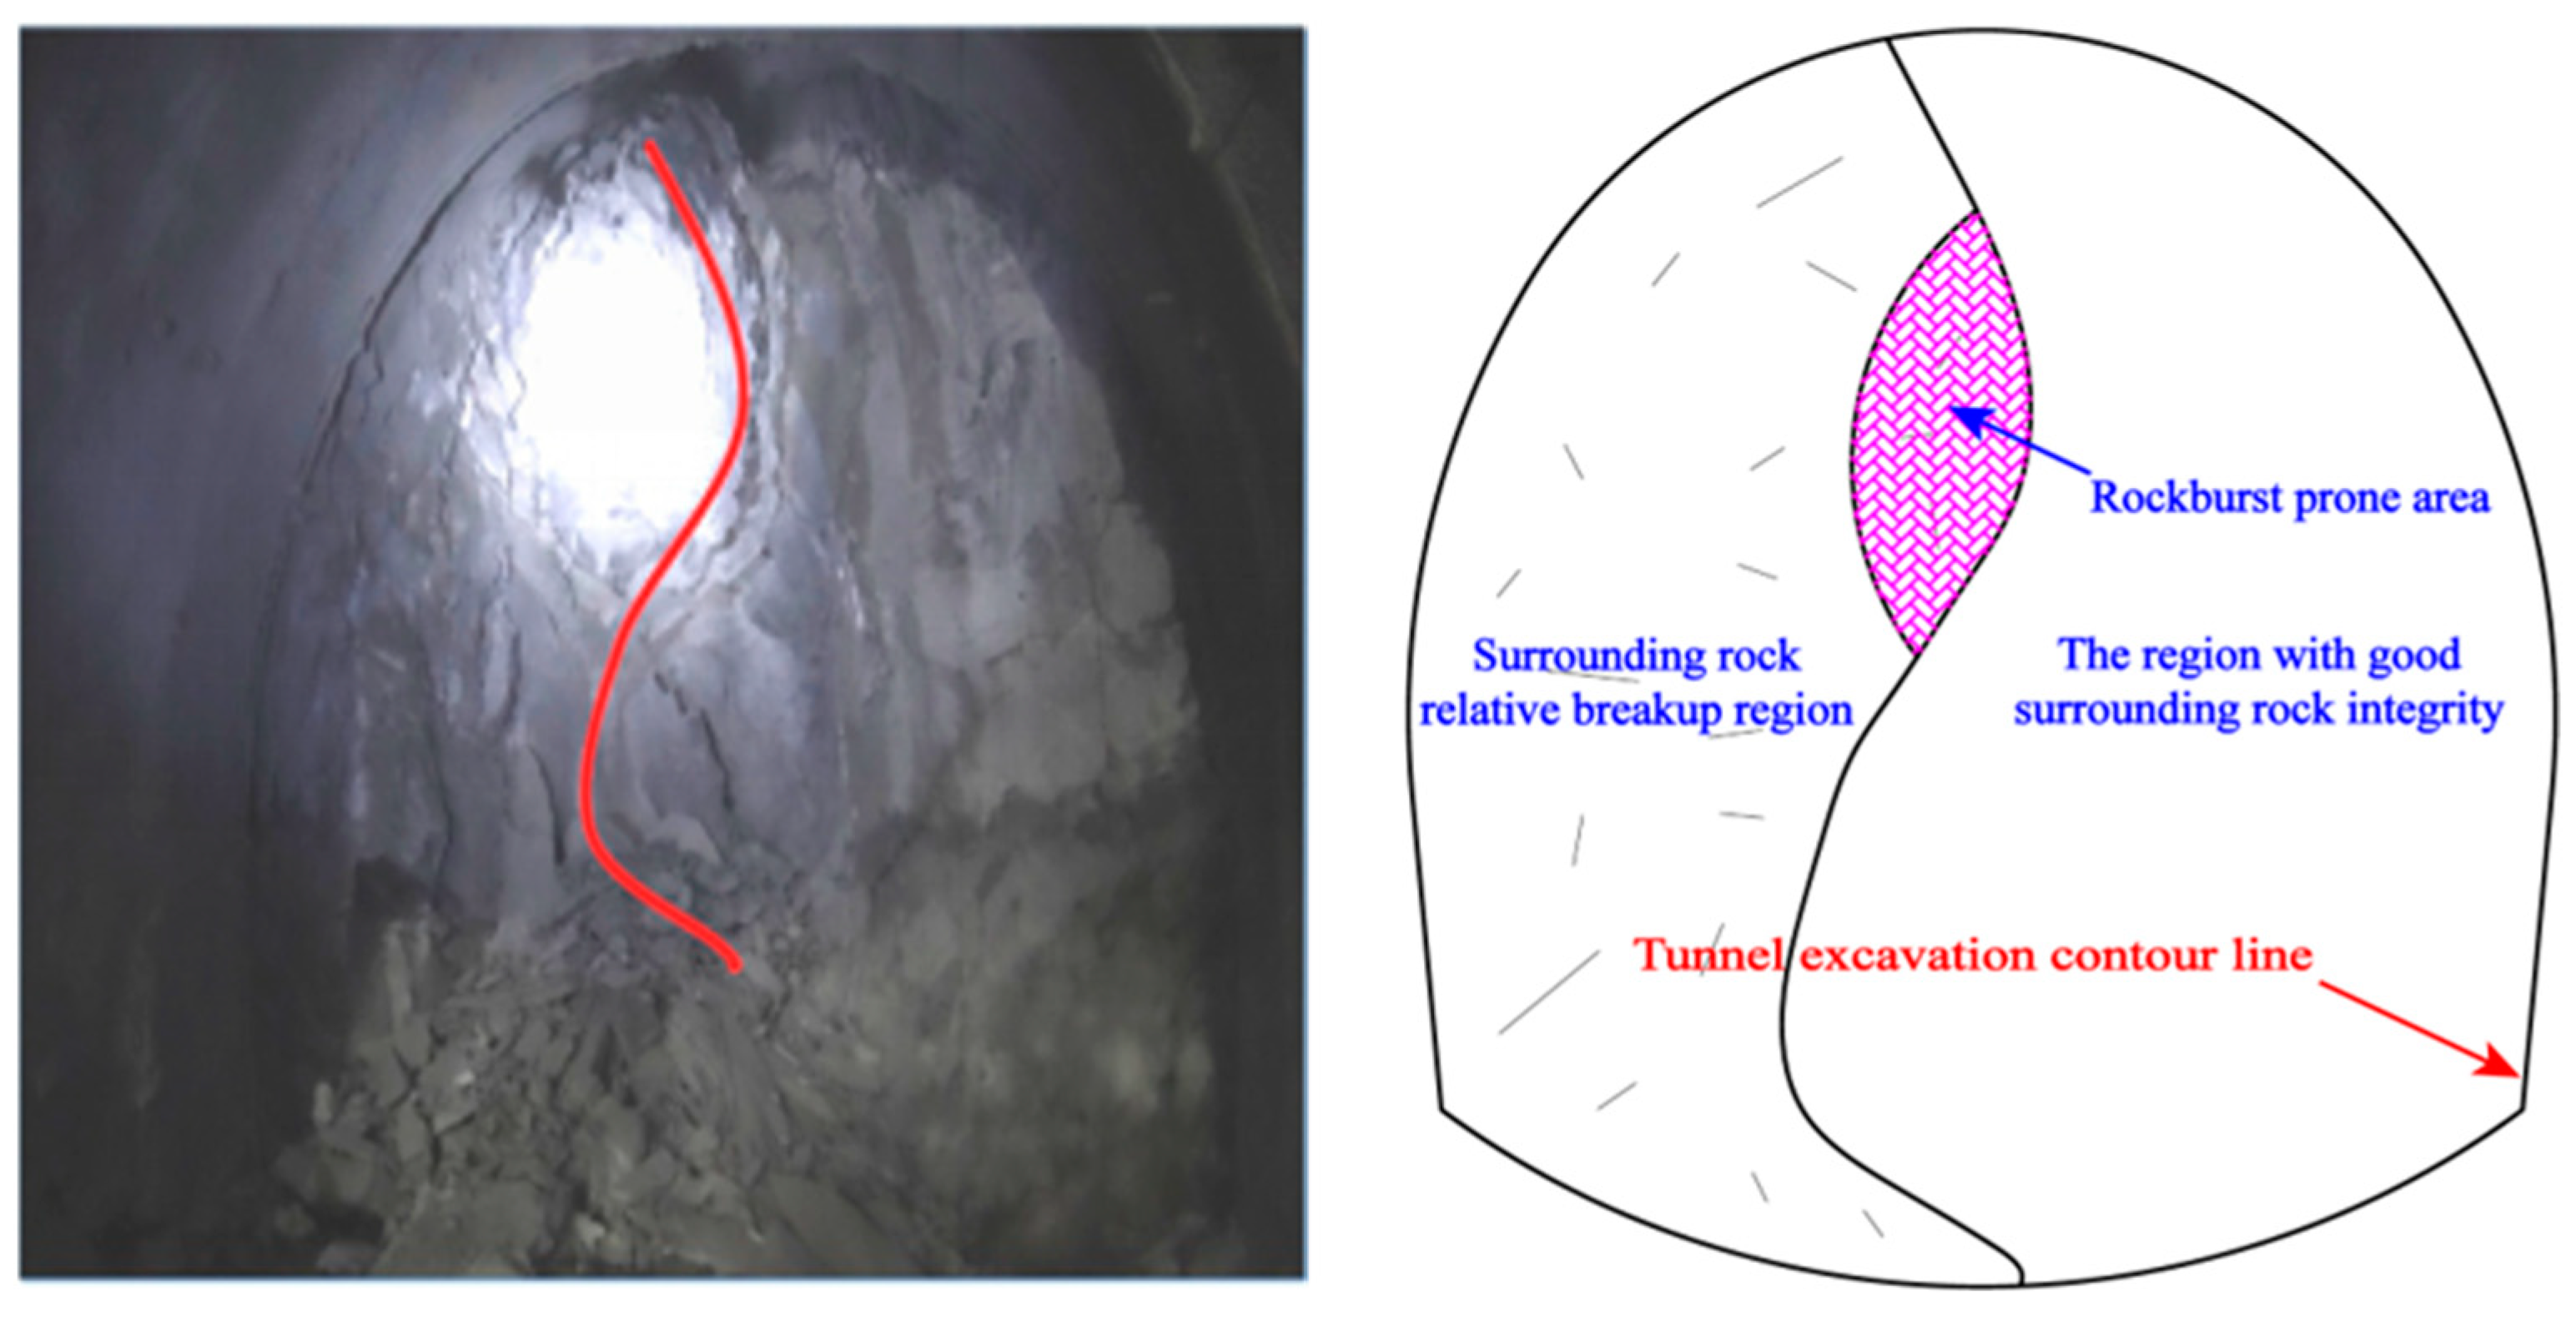
From the perspective of the occurrence time, 80% of rockburst in Ping’an Tunnel occurred within 3 h after tunnel excavation, which was the immediate type of rockburst. However, the rockburst could still be heard within 1 to 2 months after the completion of the tunnel support, indicating that there also existed the time-lag-type rockburst in some sections of Ping’an Tunnel. From the perspective of the geological conditions of rockburst, they were all sections of hard surrounding rock under high geo-stress. For sections with hard structural surfaces, even sporadic hard structural surfaces can induce high-intensity rockburst. It was discovered through on-site investigations. The hard structural surface plays a crucial role in controlling the boundary of the blast crater. From the point of view of the occurrence location, when there was no obvious crack, the rockburst was likely to occur on both sides of the excavation section to be circulated and the excavation support section of the face. When the surrounding rock of the face was the irregularly inverted “U” or “S” type, rockbursts were likely to occur in curved depressions. When one side of the surrounding rock was relatively broken while the other side of the surrounding rock was integrally complete, it was easy to produce rockburst at the crossline position, as shown in Figure 5, Figure 6 and Figure 7.
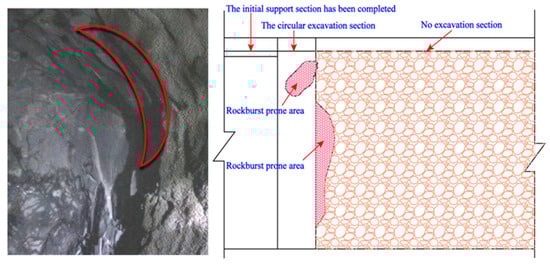
Figure 5.
On-site and schematic diagram of vulnerable rockburst location in intact surrounding rock.
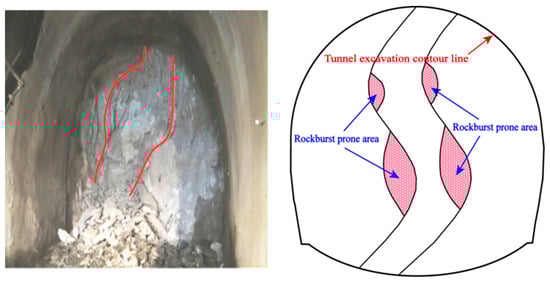
Figure 6.
On-site and schematic diagram of vulnerable “U”- and “S”-type rockburst location.
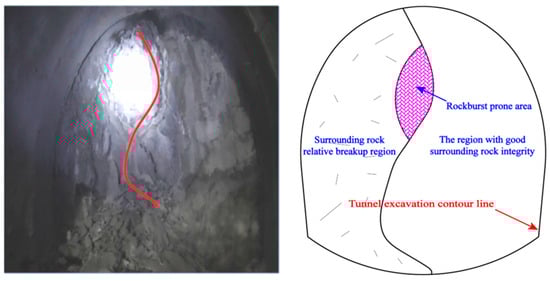
Figure 7.
On-site and schematic diagram of vulnerable rockburst location at boundary of broken surrounding rock.
4. Model Establishment of Rockburst Sections in Ping’an Tunnel
For over-long deep-buried tunnels that pass through geologically complex and high-geo-stress areas, the occurrence of rockburst will seriously affect the safety and construction period of the project [25,26]. Therefore, for the over-long deep-buried tunnels with complex geology such as Ping’an Tunnel, scientific construction plans are of great significance to the prevention and construction of rockburst. In order to understand the extent of rockburst in Ping’an Tunnel, figure out the mechanical characteristics of the high-geo-stress surrounding rock under the construction plan of the rockburst section, and analyze the possible rockburst during tunnel construction, we employed the nonlinear static general analysis step in Abaqus to conduct a three-dimensional elastoplastic finite element simulation analysis.
4.1. In Situ Stress Test during Construction
During the construction period, the in situ stress was tested by the stress-releasing method. The measuring point was located at D8K171+760 downstream of the right line. This is shown in Figure 8.

Figure 8.
In situ stress testing location.
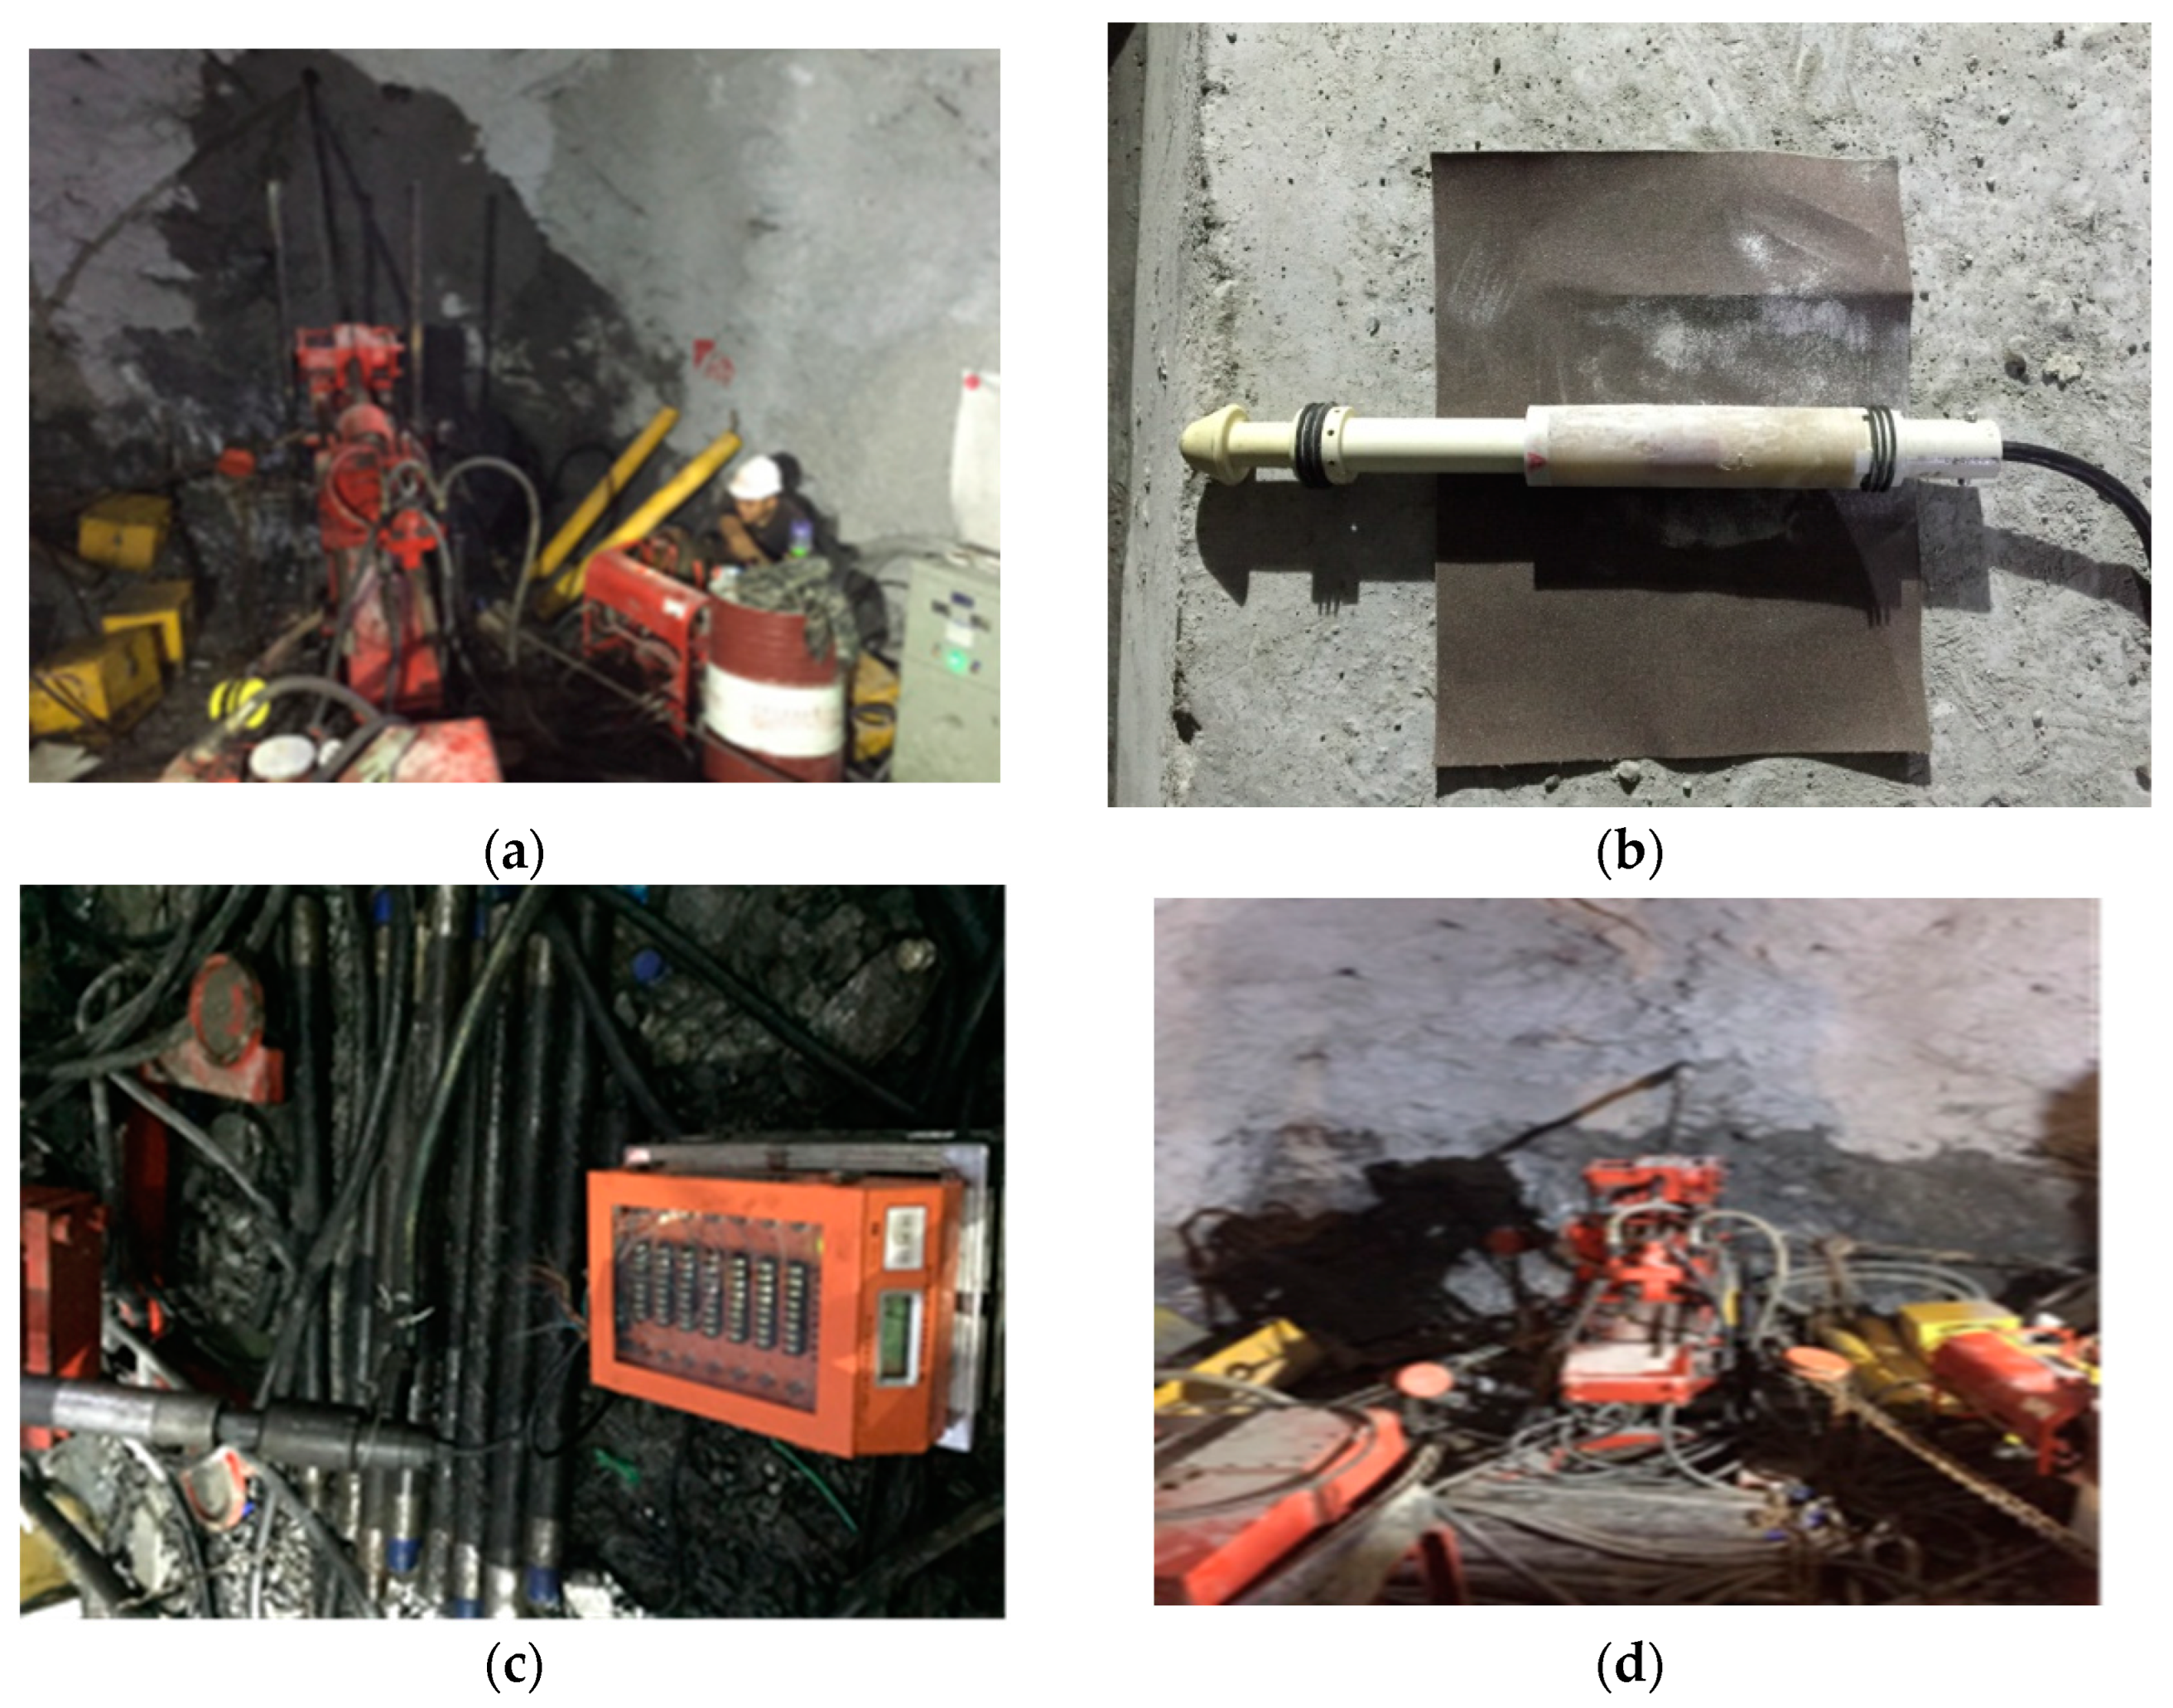
The surrounding rock in this section was mainly hard and intact sandstone without obvious cracks. To accurately obtain the in situ stress and avoid the mutual influence of tunnel construction and in situ stress testing, a 4 m × 4 m × 3 m chamber was excavated at D8K171+760 as a test site. The hole was drilled on the inner wall of the chamber, as shown in Figure 9. To measure the stress, a 130 mm diameter stress test hole was drilled. When it reached a certain depth, a 36 mm diameter measurement hole with a depth of about 36 mm was drilled in the center of the large hole. And then the measuring probe was installed in the measurement hole. The probe head related to the measuring instrument outside the hole, and the initial value was measured. After that, a 130 mm drill bit was used to drill concentrically to excavate the stress-releasing groove. During the drilling process, the wire passed through the center of the drill pipe and was led out at the joint head to connect with the measuring instrument. The changes during the releasing process were monitored. With the deepening of the releasing groove, the core was gradually isolated from the external stress field, and the core elastically recovered. Simultaneously, the measured value of the instrument changed. The drilling did not stop until the instrument reading no longer changed. Finally, the core was taken out. The test results are shown in Table 2.
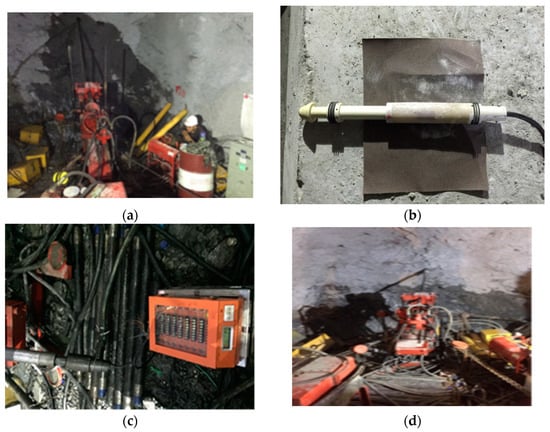
Figure 9.
In situ stress test: (a) drill stress test holes; (b) probe to test stress; (c) data collection; (d) excavation stress relief trough.
Table 2.
Results of in situ stress test.
4.2. Establishment of Three-Dimensional Model
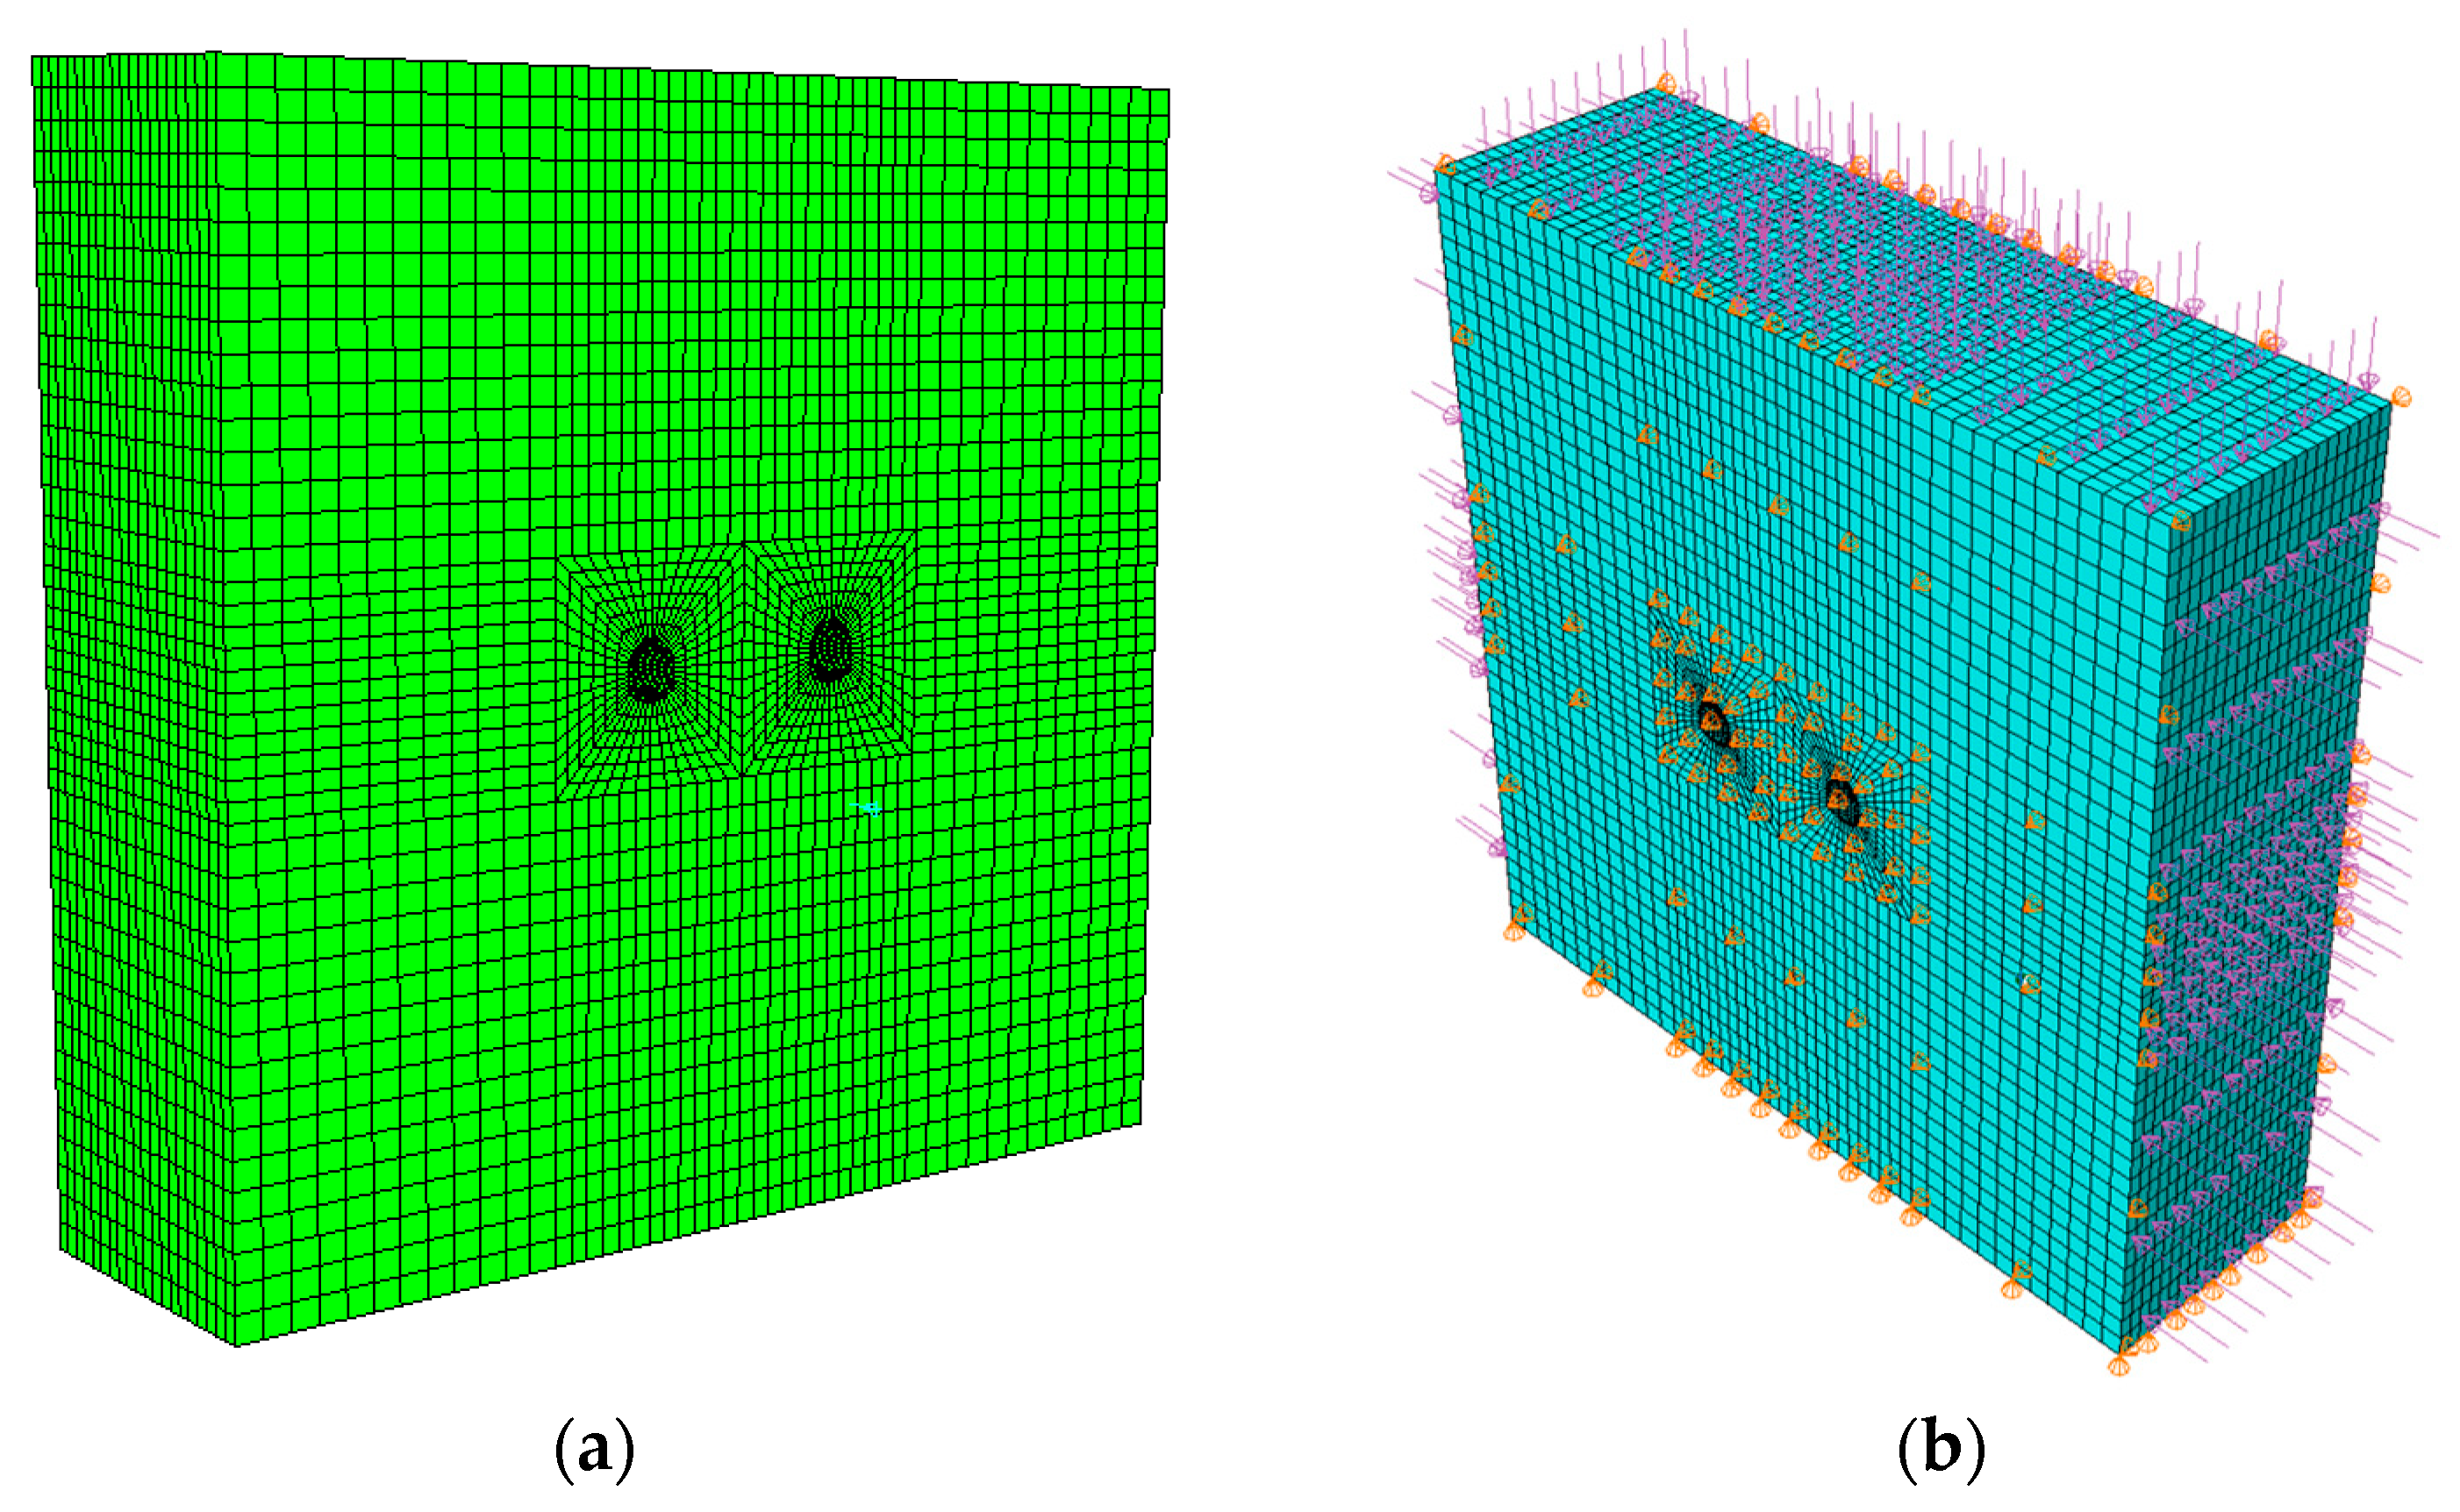
Based on D8K171+760 of Ping’an Tunnel, a related model was established. Considering the boundary effect, the two sides and upper and lower positions of the tunnel in the model were set to be five times the tunnel diameter from the model boundary. The three-dimensional calculation model size was 200 × 60 × 200 m. The surrounding rock was simulated by hexahedral elements, and the numerical calculation model was divided into 74,620 elements, as shown in Figure 10a [4]. According to the in situ stress obtained by the test, the boundary conditions of the model were applied. It is worth noting that because the buried depth of the excavation section at the simulated location reached 1250 m, to truly reflect the buried depth, a top load of about 30 MPa was applied to the top of the model. For the boundary conditions of the model, to consider the influence of tectonic stress on tunnel excavation, lateral pressure was applied on the boundary surface of the model in the x direction. The translational degrees of freedom in the y and z directions of the model were, respectively, constrained in corresponding directions, as shown in Figure 10b. The material properties of the surrounding rock were considered as the ideal elastoplastic behavior of the Mohr–Coulomb yield criterion.
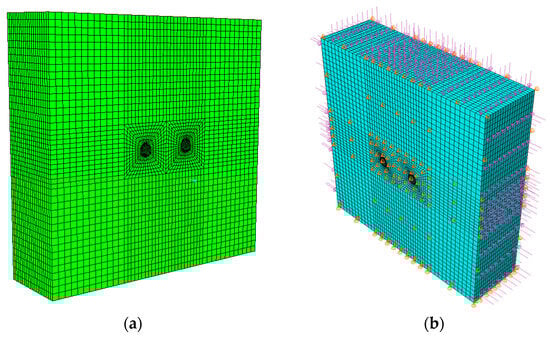
Figure 10.
Establishment of model: (a) grid cells of model; (b) model boundary conditions and loads.
Based on the geological survey data of the Ping’an Tunnel and considering the complexity of in situ stress, repeated tests were conducted on the model to accurately reflect the in situ stress in the rockburst section of the Ping’an Tunnel. The boundary conditions and applied loads were adjusted and corrected as follows: First, based on the in situ stress test results in Table 2 of Section 4.1, the load values applied to the top and sides of the model were determined. Then, by adjusting the load values applied to the top and sides of the numerical model, the in situ stress in the surrounding rock was made to match the measured in situ stress. Finally, the initial stress field suitable for the tunnel site was established, as shown in Figure 11a.
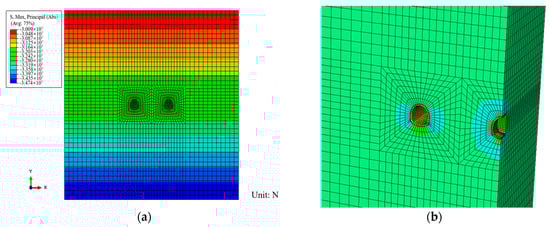
Figure 11.
Initial geo-stress field and process of excavation and support: (a) initial geo-stress field; (b) process of excavation and support.
According to the engineering survey data and construction design data of Ping’an Tunnel, the physical and mechanical parameters of the surrounding rock and supporting structure of the tunnel in the rockburst section were comprehensively determined. The simulation parameters of the initial support and lining of the tunnel were converted using the principle of the equivalent stiffness method, as shown in Table 3.
Table 3.
Model parameters.
Ping’an Tunnel adopted the construction plan of sub-repair (double-hole single-line). The left line was first excavated, and the right side was later excavated. At the research location, the excavation step was 2 m on site, and the lateral distance between left and right tunnels was 30 m. The left-line tunnel was excavated 60 m ahead of the right-line tunnel. The simulation process followed the excavation sequence and the excavation step distance of the site, and the excavation simulation was carried out under the selected reasonable support conditions, as shown in Figure 11b.
5. Stress Analysis of Rockburst Section of Ping’an Tunnel
According to the strength theory of rockburst, whether a rockburst occurs or not has a lot to do with the stress of the surrounding rock [27]. After excavation, the surrounding rock has a stress concentration, and some rock masses reach their ultimate strength, and the brittle rock may burst [28]. Therefore, the study of rockburst is inseparable from the in-depth analysis of the stress and strain state and bearing capacity of the surrounding rock. To explore the mechanism of rockburst in deep-buried tunnels under high in situ stress, the secondary stress field of surrounding rock in the rockburst section of the Ping’an over-long deep-buried tunnel was analyzed, and then the classical stress rockburst criterion was used to predict the occurrence of rockburst to study the stress characteristics and engineering effects of the rockburst section of Ping’an Tunnel in the Cheng-Lan railway.
5.1. Stress Field Analysis of Rockburst Section in Ping’an Tunnel’s Left Line
According to the design and on-site support conditions, the excavation simulation was carried out, and the calculation result of the left tunnel is shown in Figure 12.
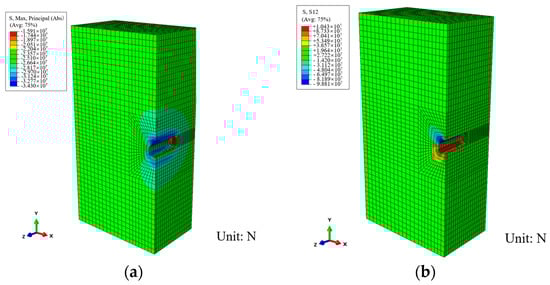
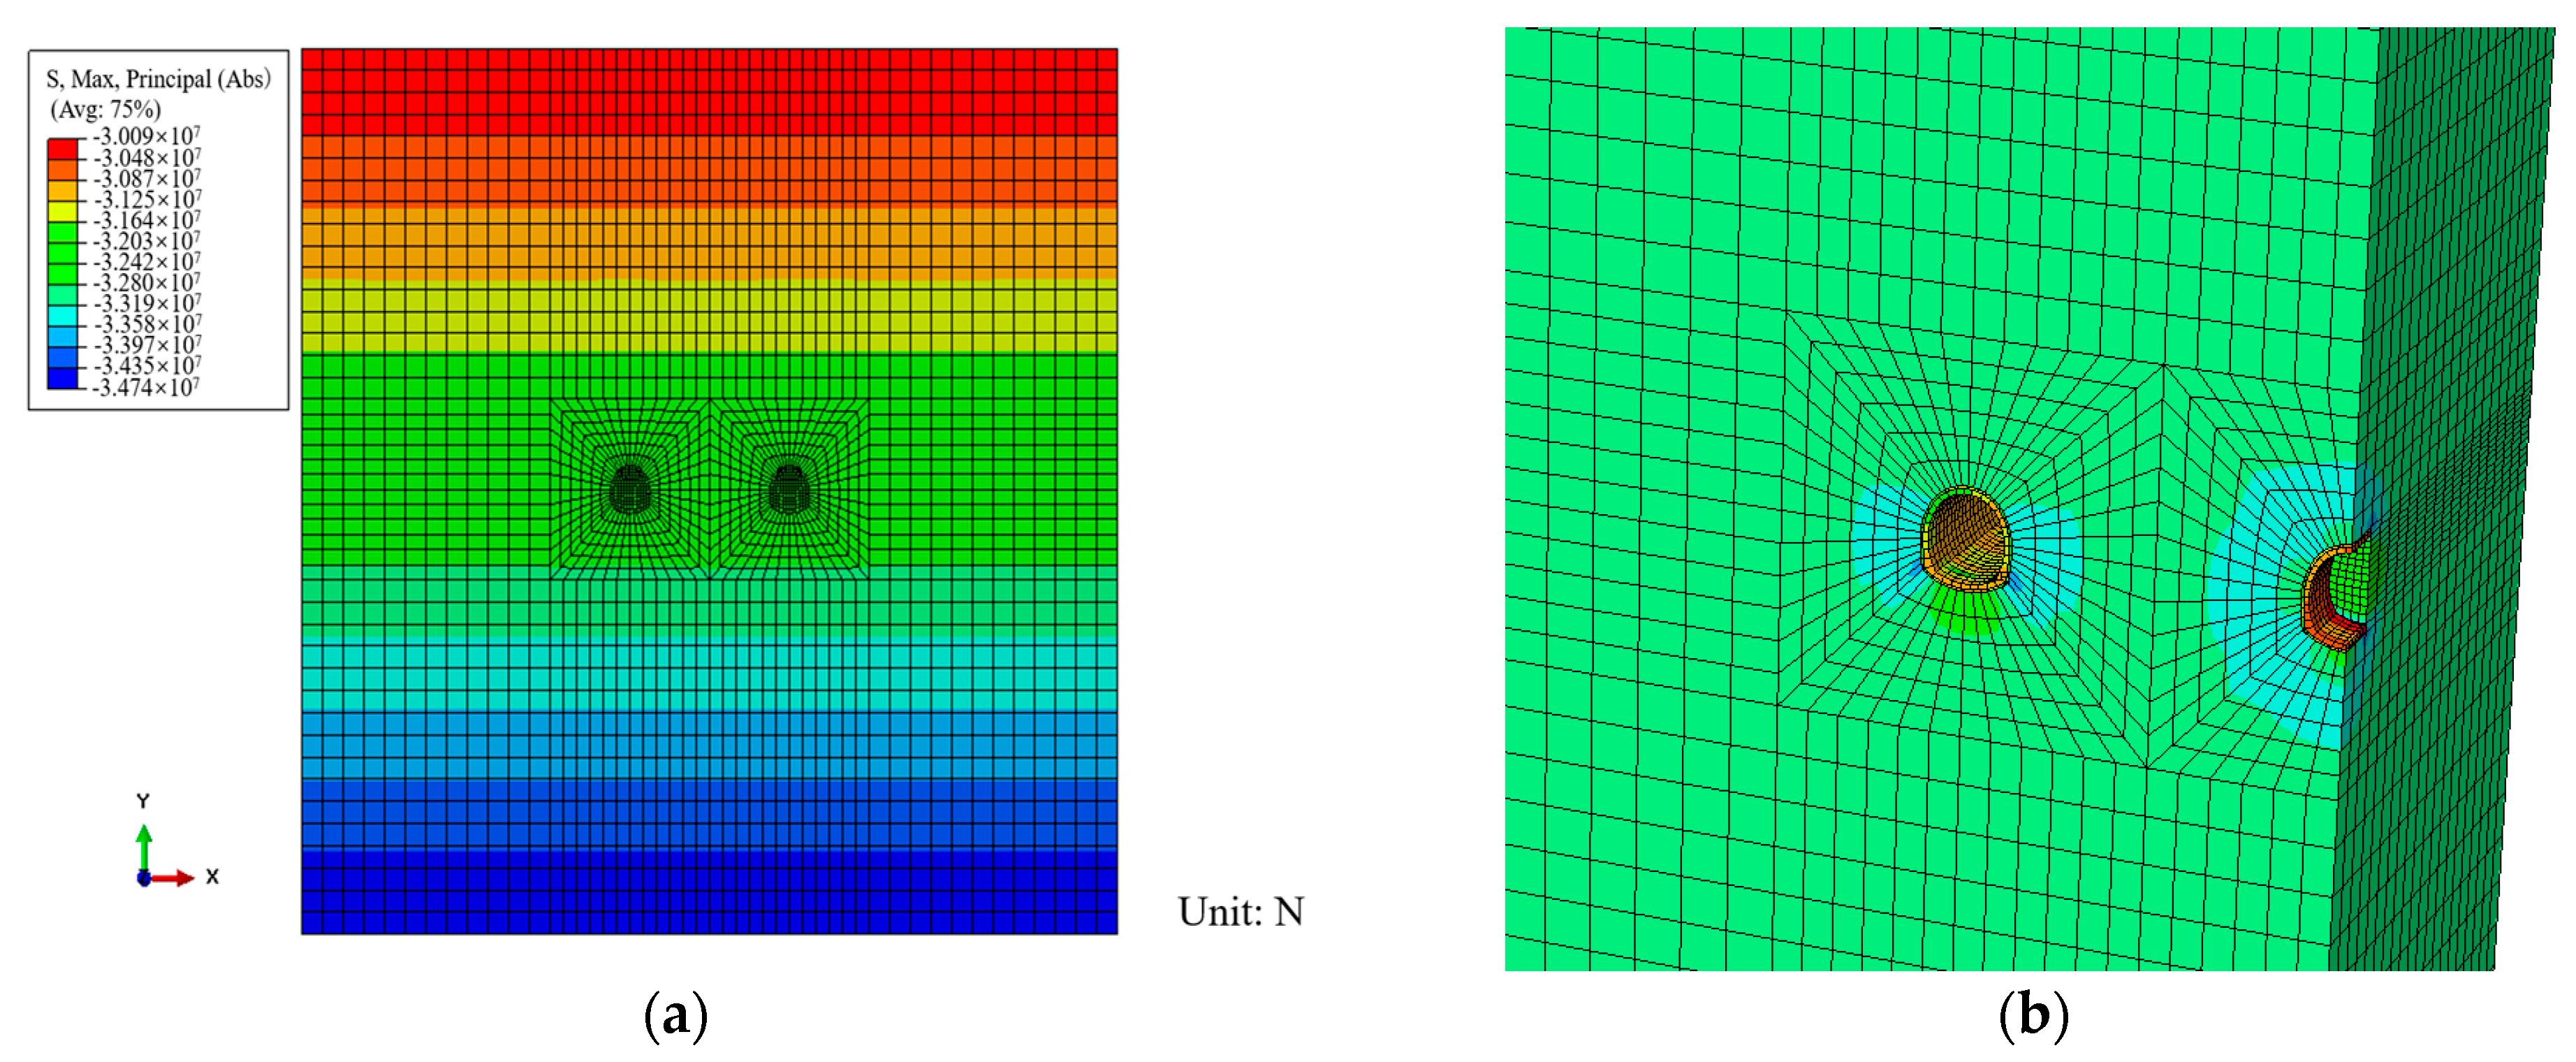
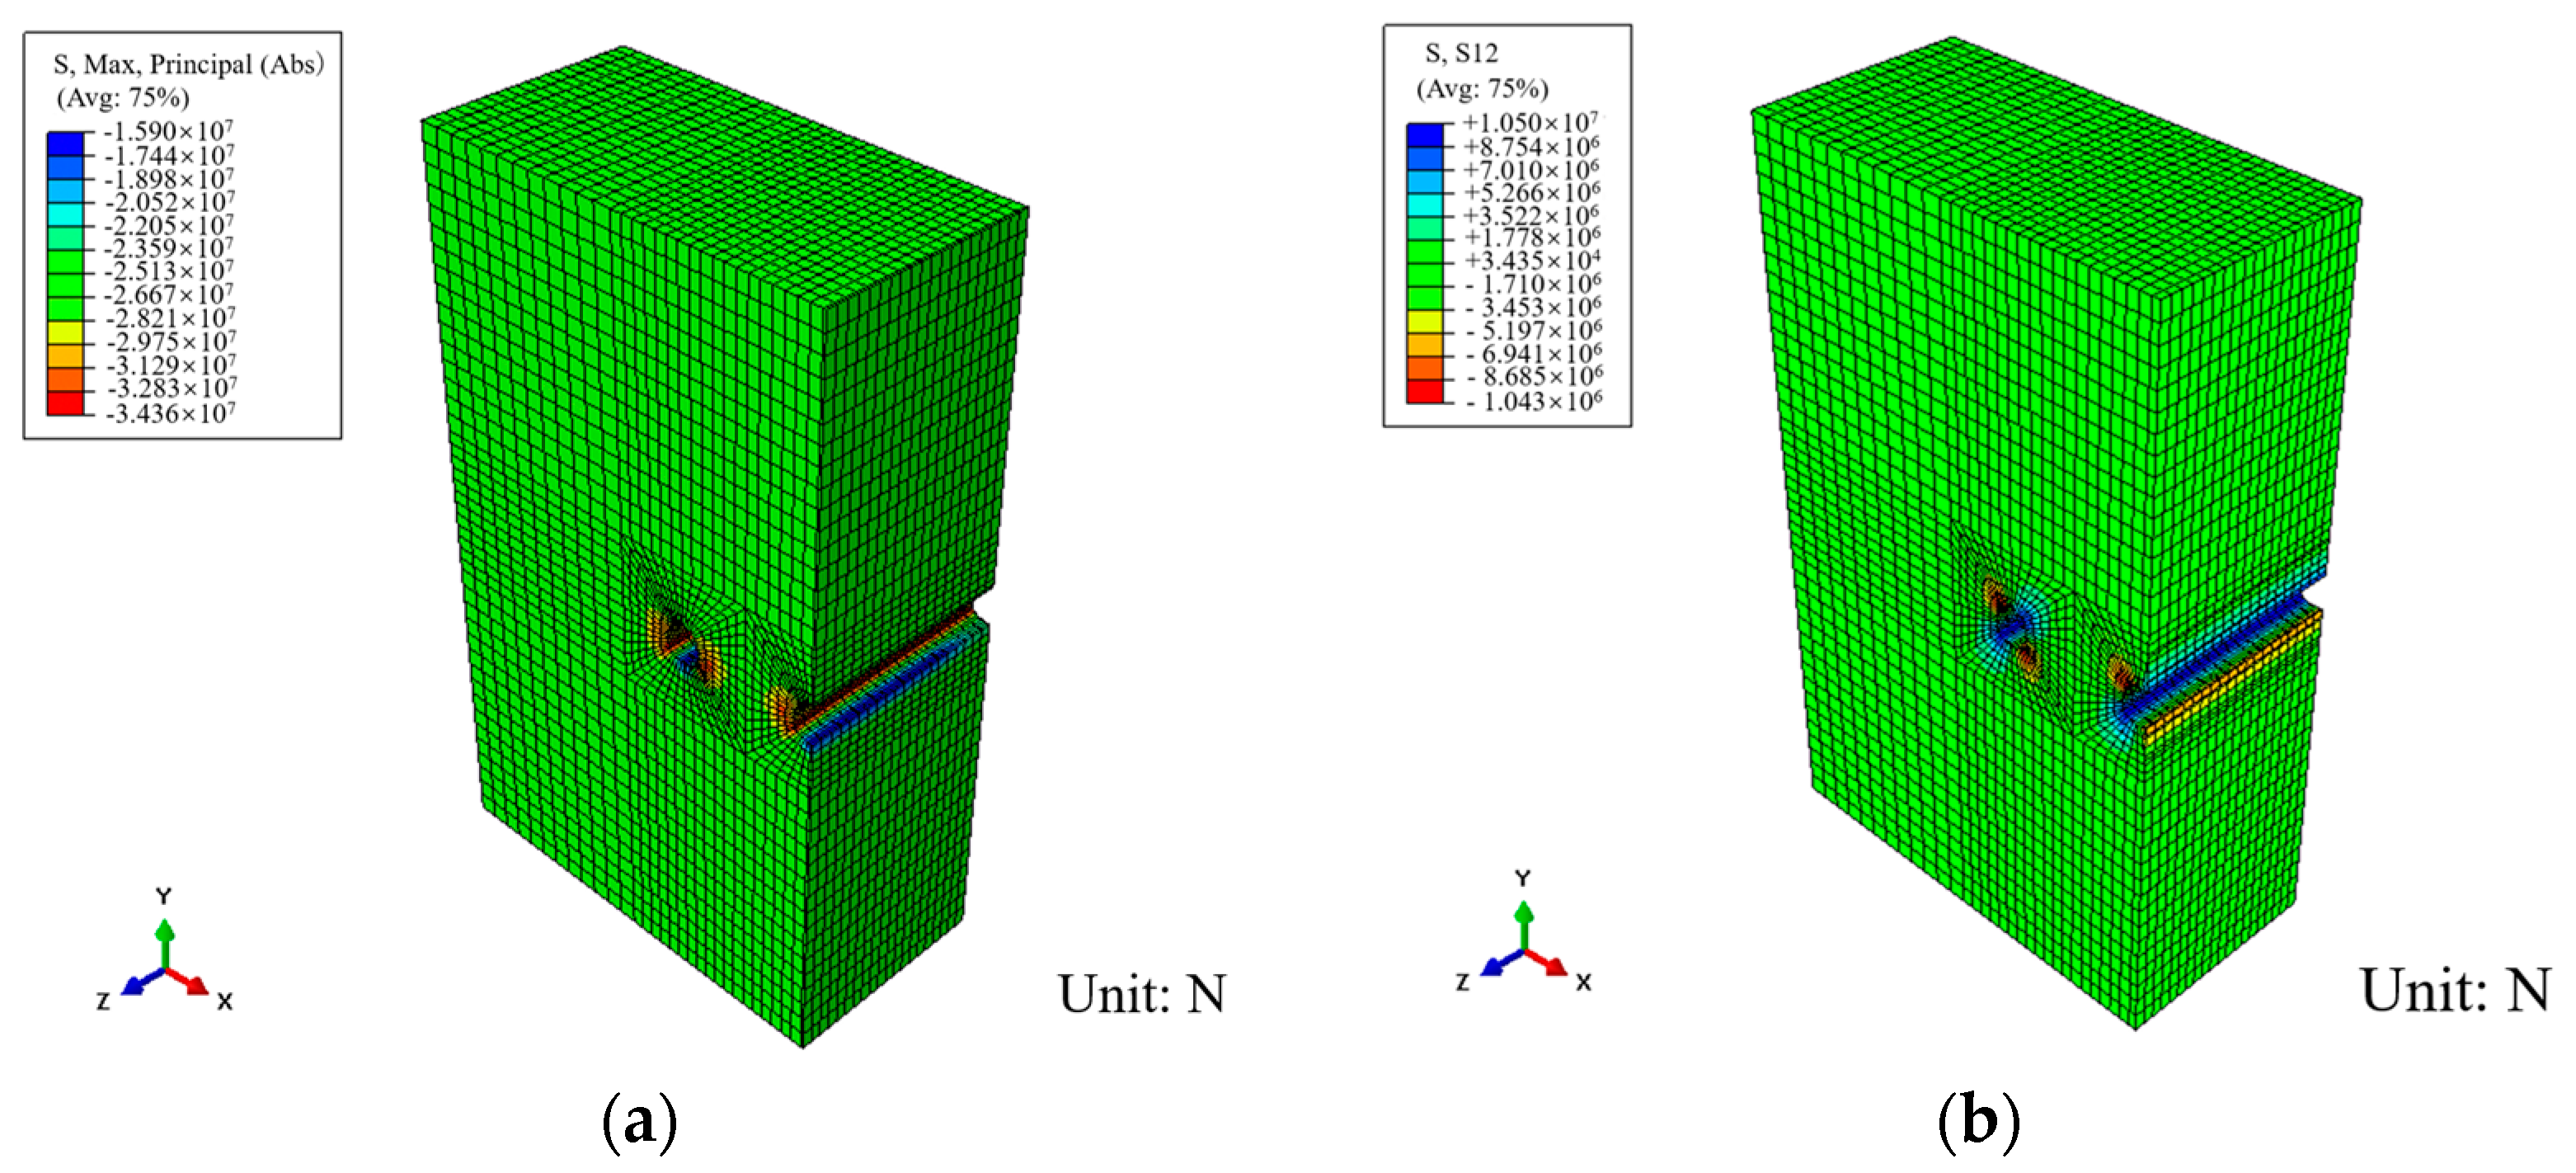
Figure 12.
Stress contour of left tunnel: (a) Results of maximum principal stress. (b) Results of shear stress.
It can be seen from Figure 12 that during the excavation process, the full tunnel section is compressed, and the maximum principal stress appears at the side wall. The shear stress is mainly distributed at the side wall and the arch waist. To study the stress distribution of the rockburst section of the tunnel during the excavation process, monitoring points were set in the model result file to track the stress parameters in the model, to obtain the change path of different stresses in the model calculation process, which is useful for analyzing the stress at different locations of the tunnel during the excavation process. Therefore, in this calculation, monitoring points were arranged in various locations of the tunnel to study the stress changes and the final stress state of different locations during the excavation process. After solving the model, we arranged monitoring points in each part of the tunnel to study the stress changes in different parts and the final stress state during excavation. This is shown in Figure 13.
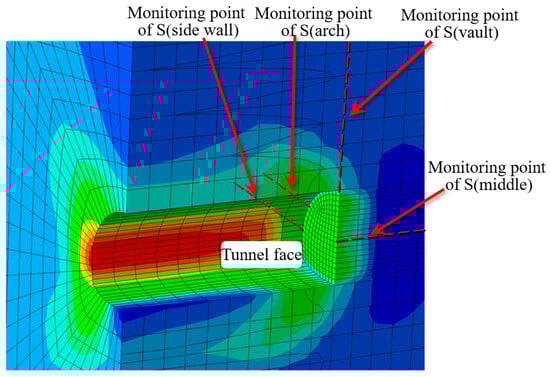
Figure 13.
The relationship of S (side wall) > S (arch) > S (vault) > S (middle).
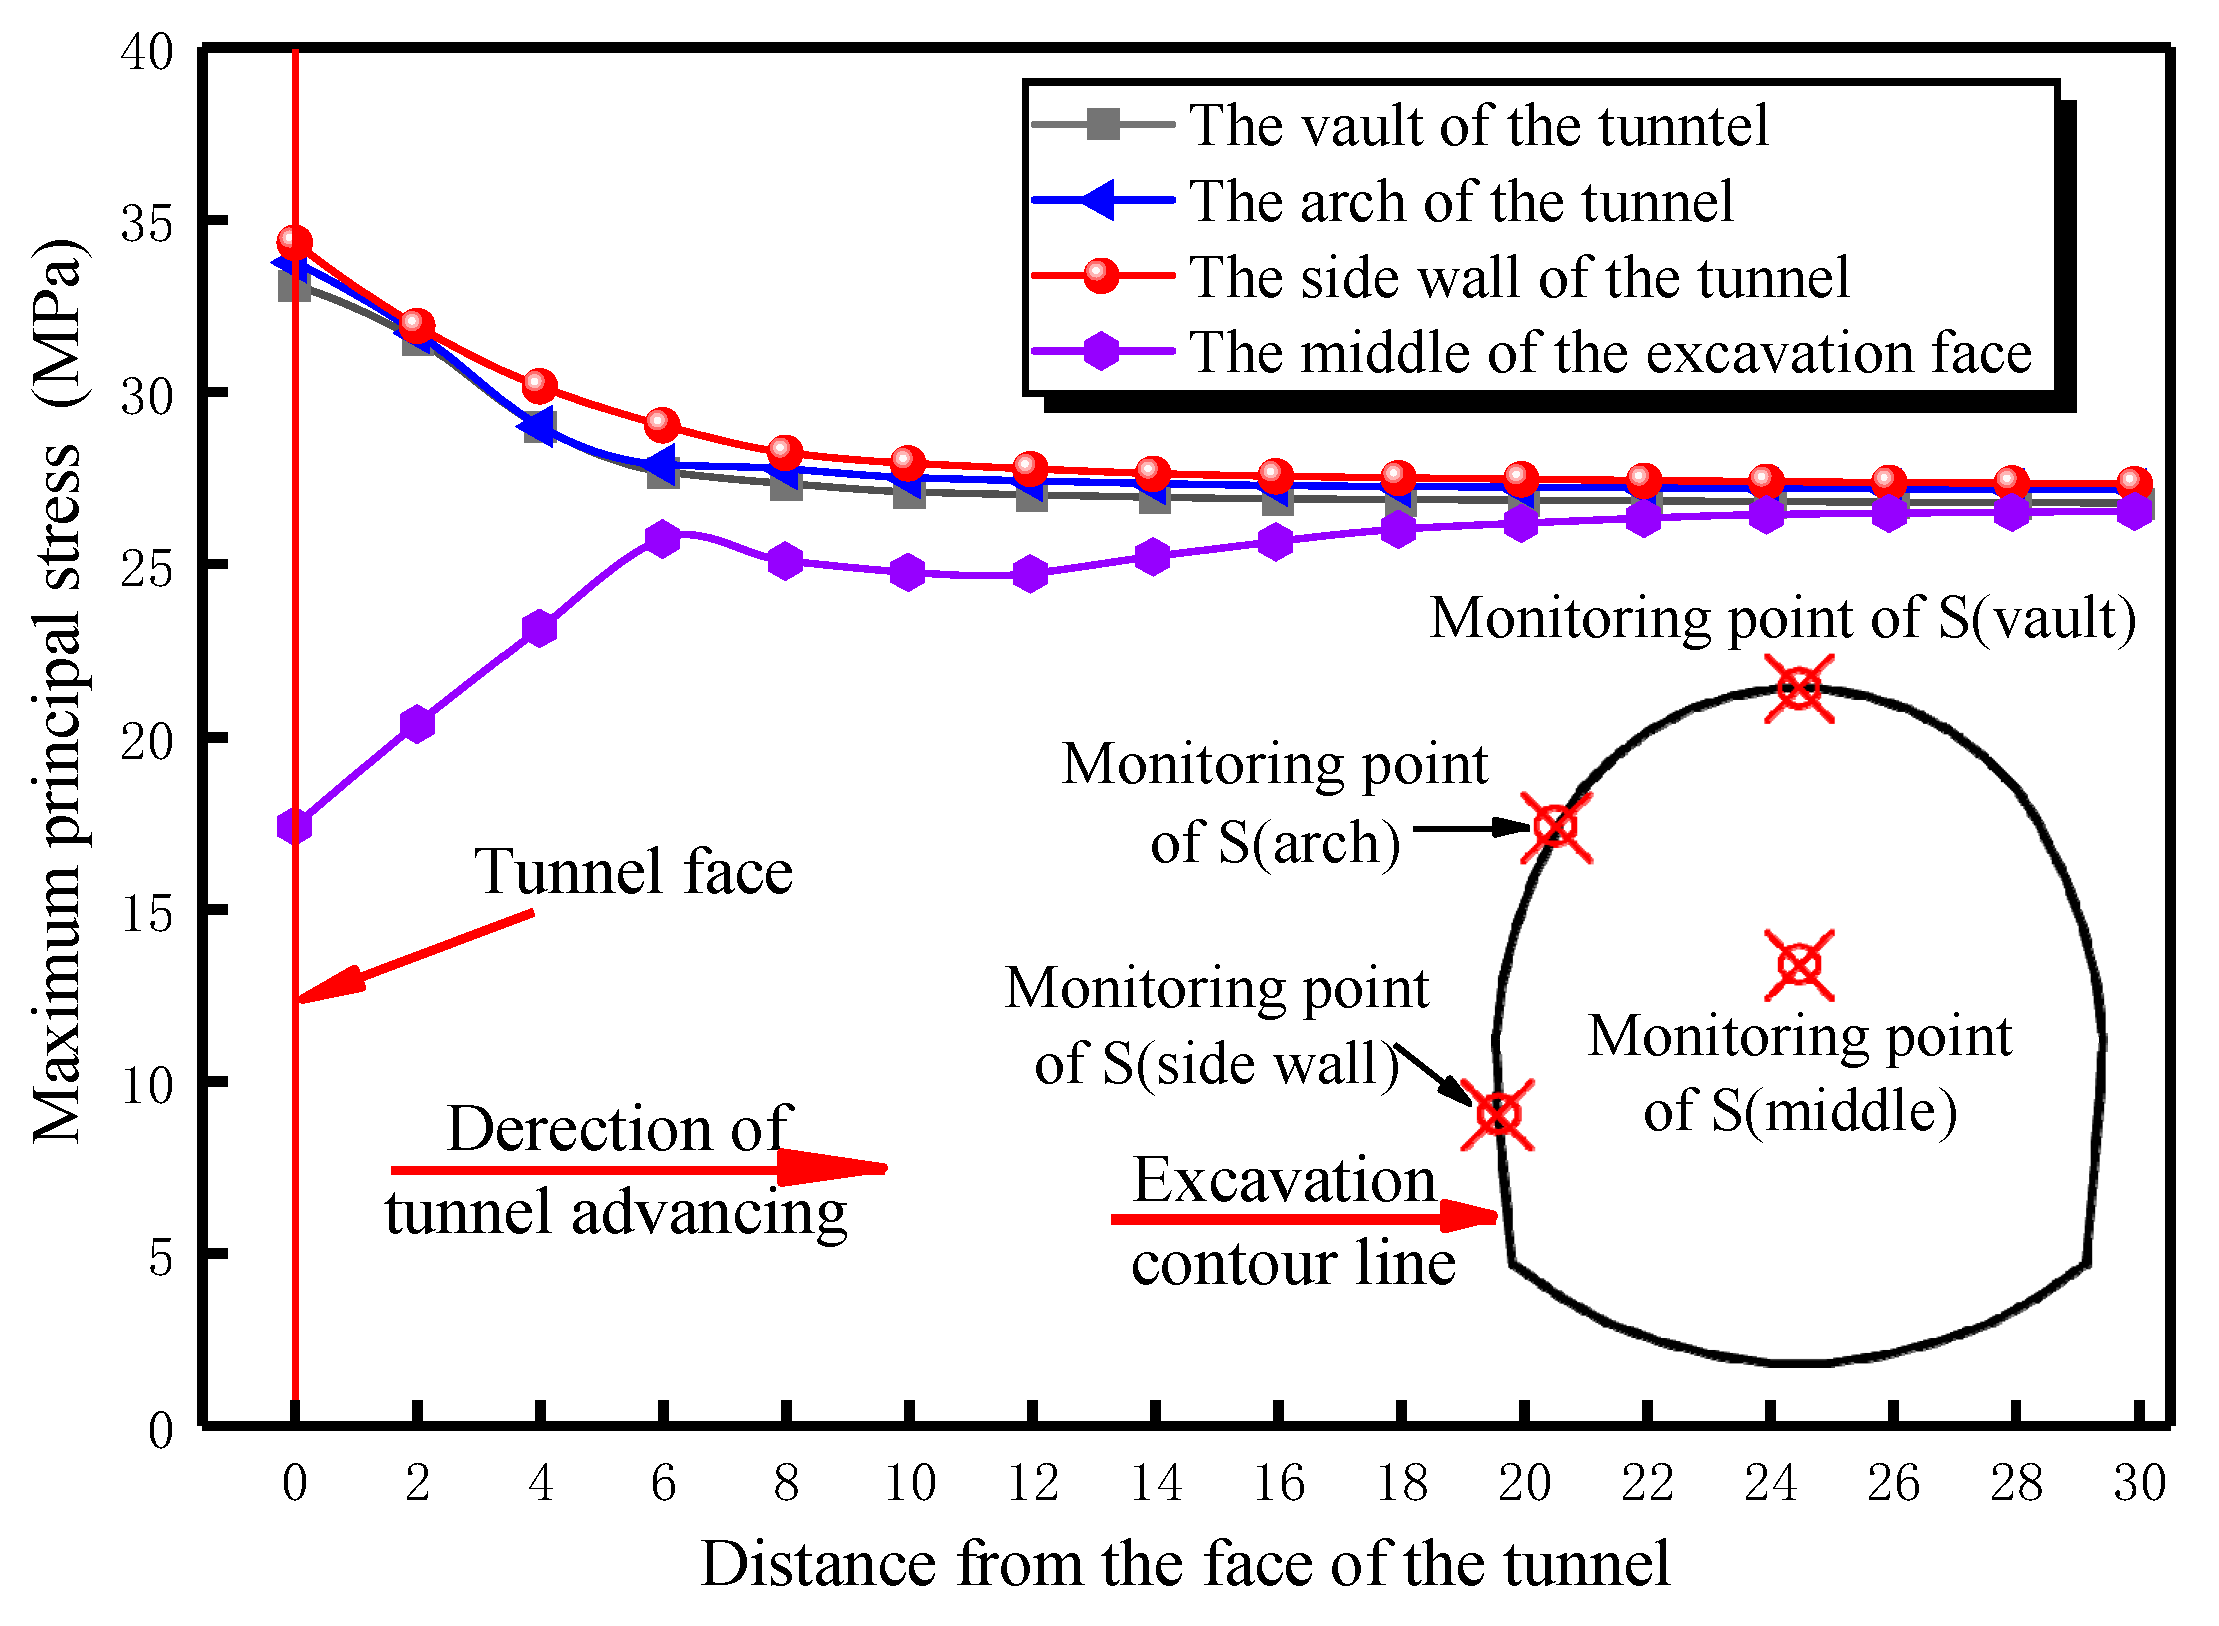
To analyze the stress changes at different locations of the tunnel during the tunnel excavation process, the maximum principal stress change curve of each monitoring location of the left tunnel of the tunnel during the excavation process is drawn, as shown in Figure 14.
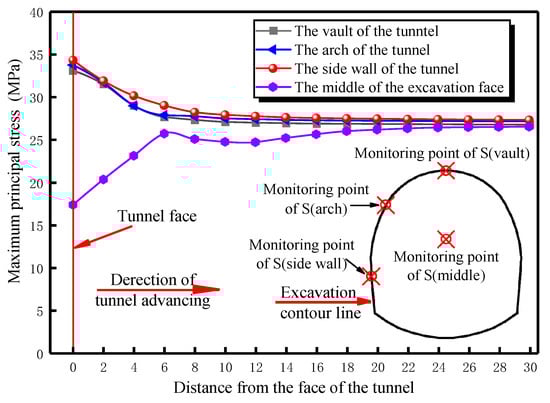
Figure 14.
Curve of maximum principal stress variation in sections of left tunnel.
It can be seen from Figure 14 that the relationship of stress at each location is S (side wall) > S (arch) >S (vault) > S (middle). The principal stresses of the vault, arch waist, and side wall positions decrease with the increase in distance from the excavation face. The maximum principal stress values are all at the tunnel face, and their values are 32.63 MPa for the vault and 32.76 MPa for the arch waist. The maximum principal stress on the side wall is the largest with the value of 34.89 MPa, indicating that the rockburst is likely to occur at the side wall during the excavation process. The side wall is under greater compressive stress, which is the main cause of rockburst. Corresponding measures should be taken to prevent and control rockburst during the tunnel construction process. The principal stress in the middle of the tunnel face is the smallest at the excavation face, with the minimum value of 17.34 MPa.
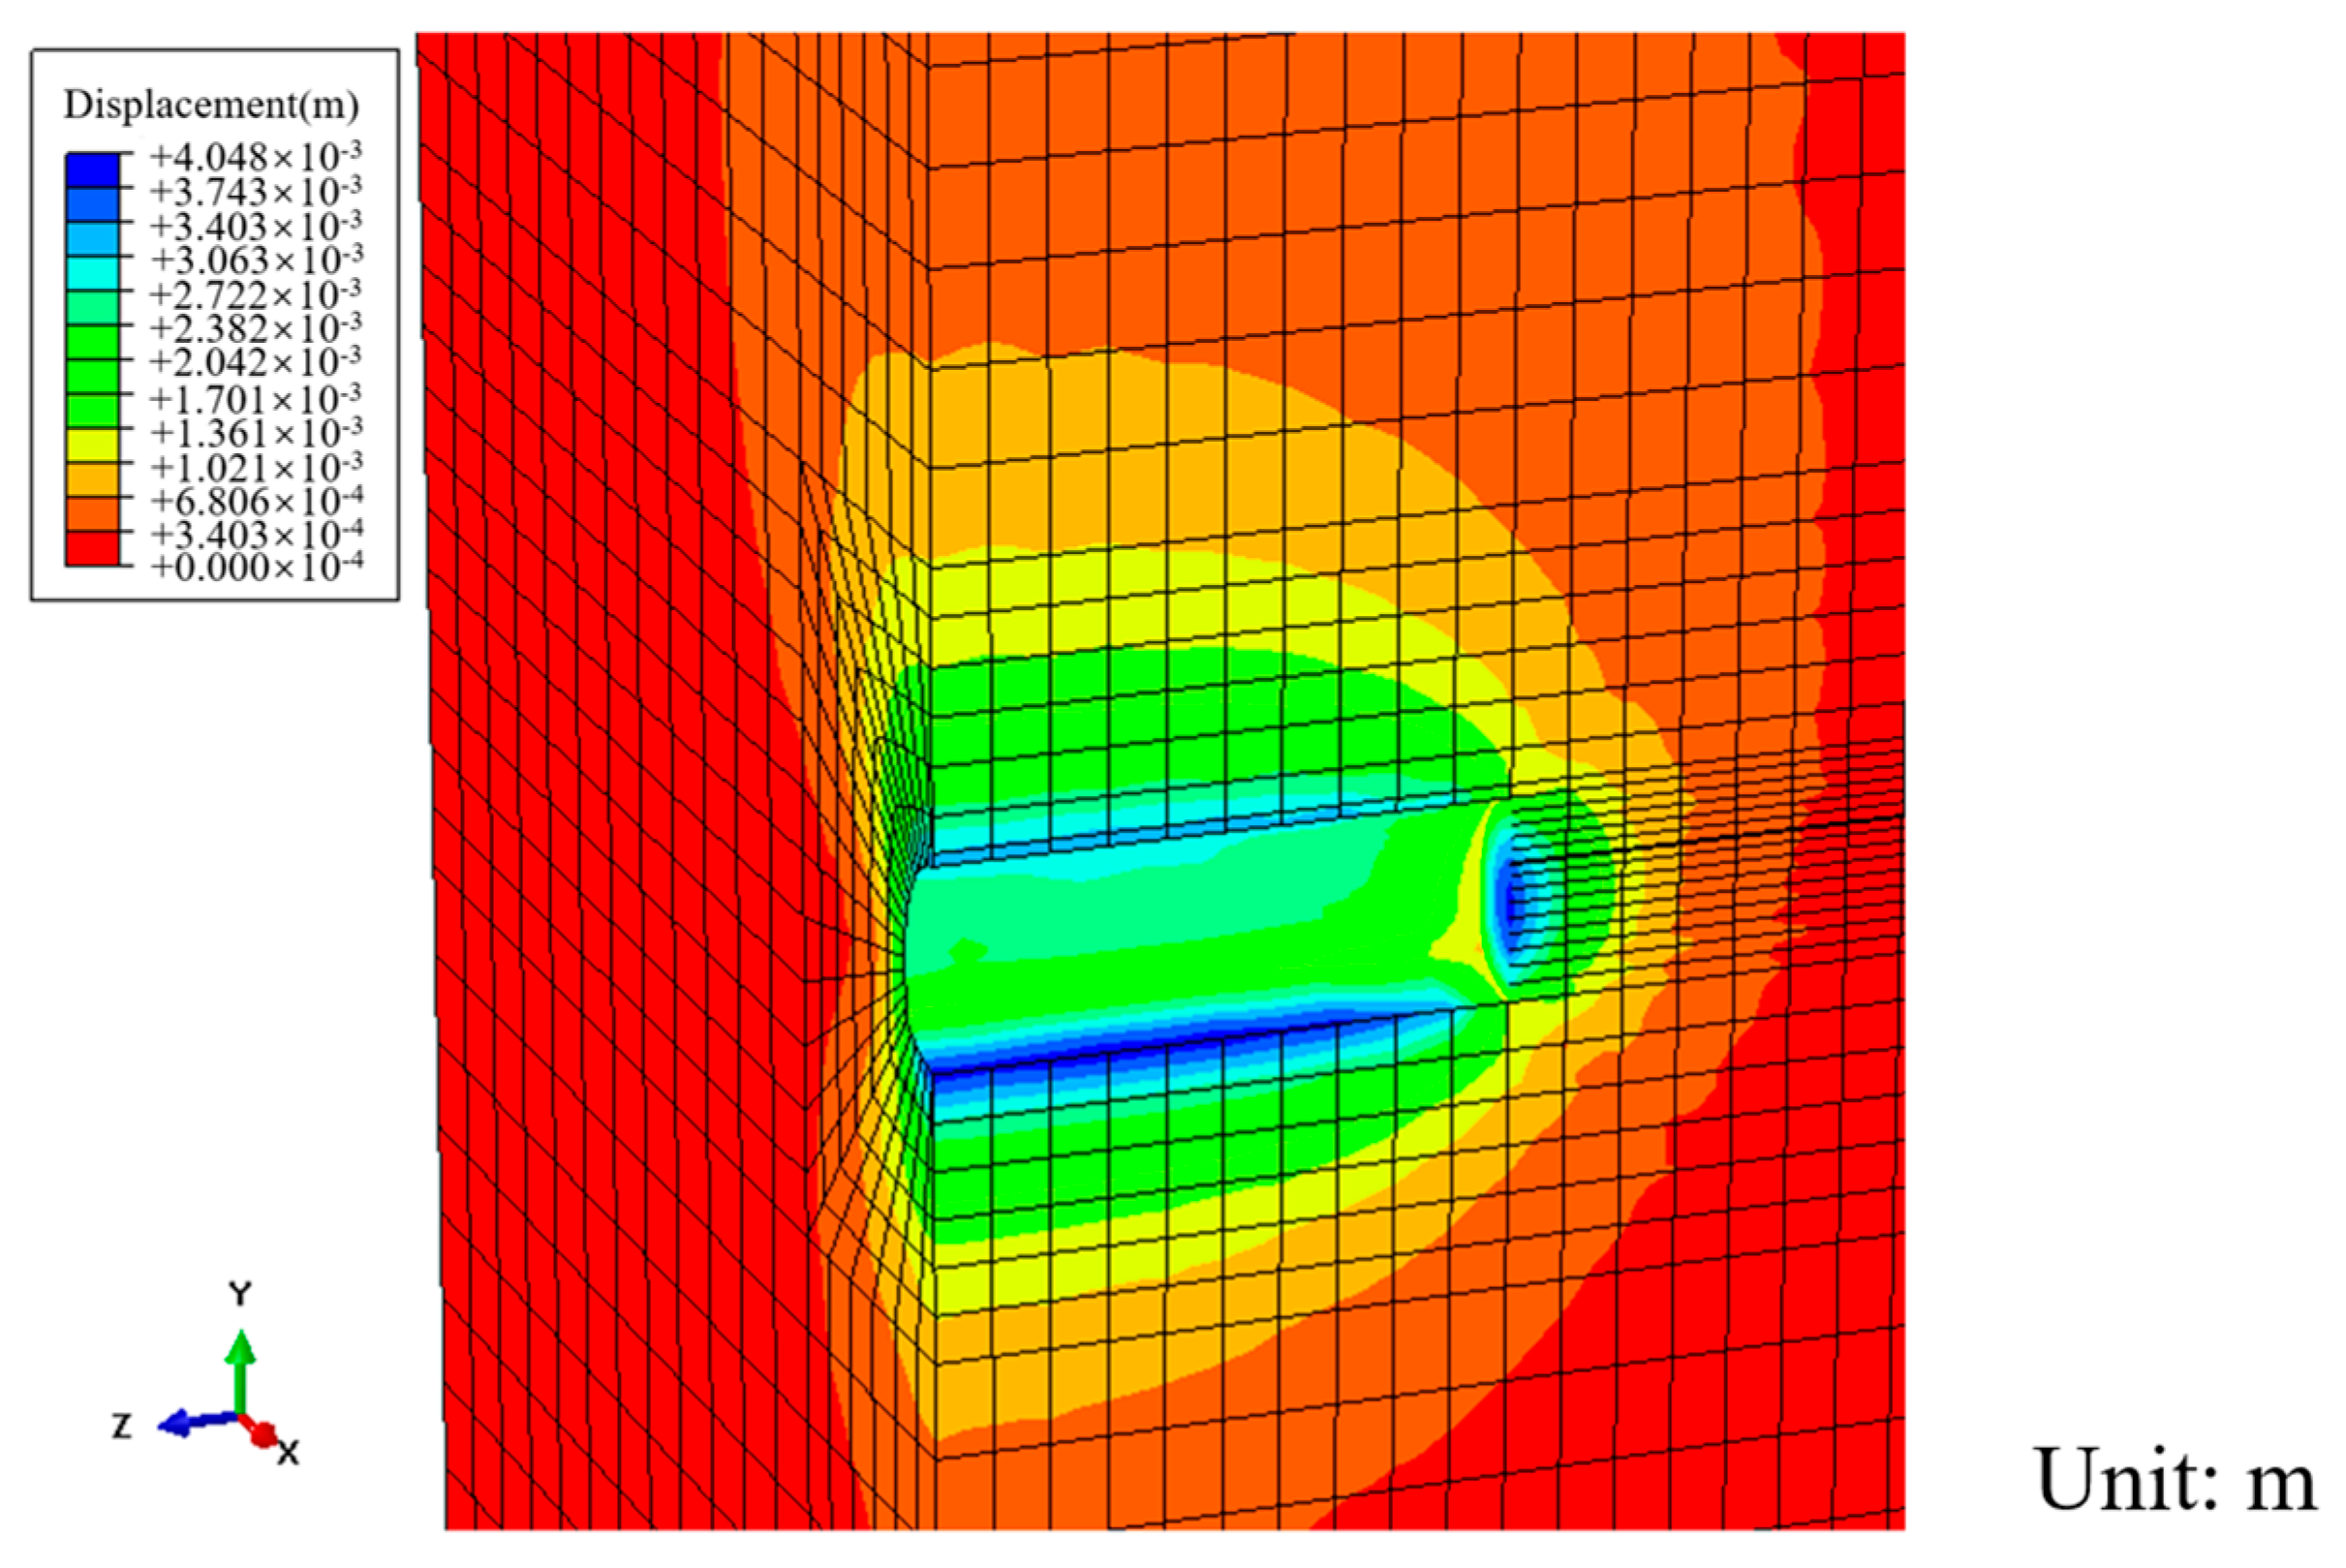
The displacement of the tunnel during the excavation process is shown in Figure 15. Combining the analysis of stress changes and the displacement at different positions of the tunnel during the tunnel excavation process, it is found that compared with the vault, arch waist, side wall, and other positions, the middle of the tunnel face is where the largest displacement occurs, indicating that large stress release has occurred due to the absence of support at the middle of the tunnel face. In the actual excavation process, under high-geo-stress conditions, if the stress of surrounding rock is very high, and in addition of the inevitable existence of unfavorable factors such as the structural surface at the excavation face, the original rock stress in the middle of the tunnel face will be released suddenly and cause a high-intensity rockburst. At this time, holes should be arranged in the rockburst section to release the high in situ stress in advance, thereby reducing the possibility of rockburst during the next cycle of excavation, which is one type of the prevention and control method of rockburst.
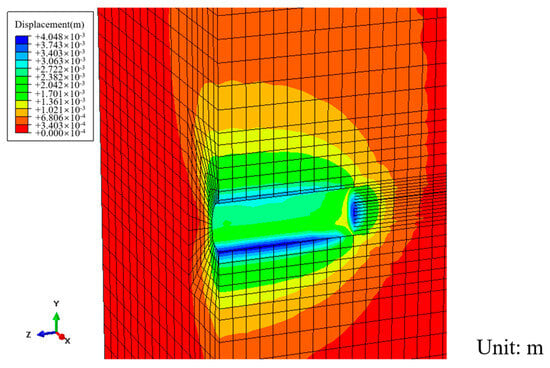
Figure 15.
Displacement contour of tunnel.
5.2. Stress Field Analysis of Rockburst Section in Ping’an Tunnel’s Right Line
Based on the design and on-site support conditions, the excavation simulation of the right line was carried out. The calculation result of the right tunnel is shown in Figure 16.

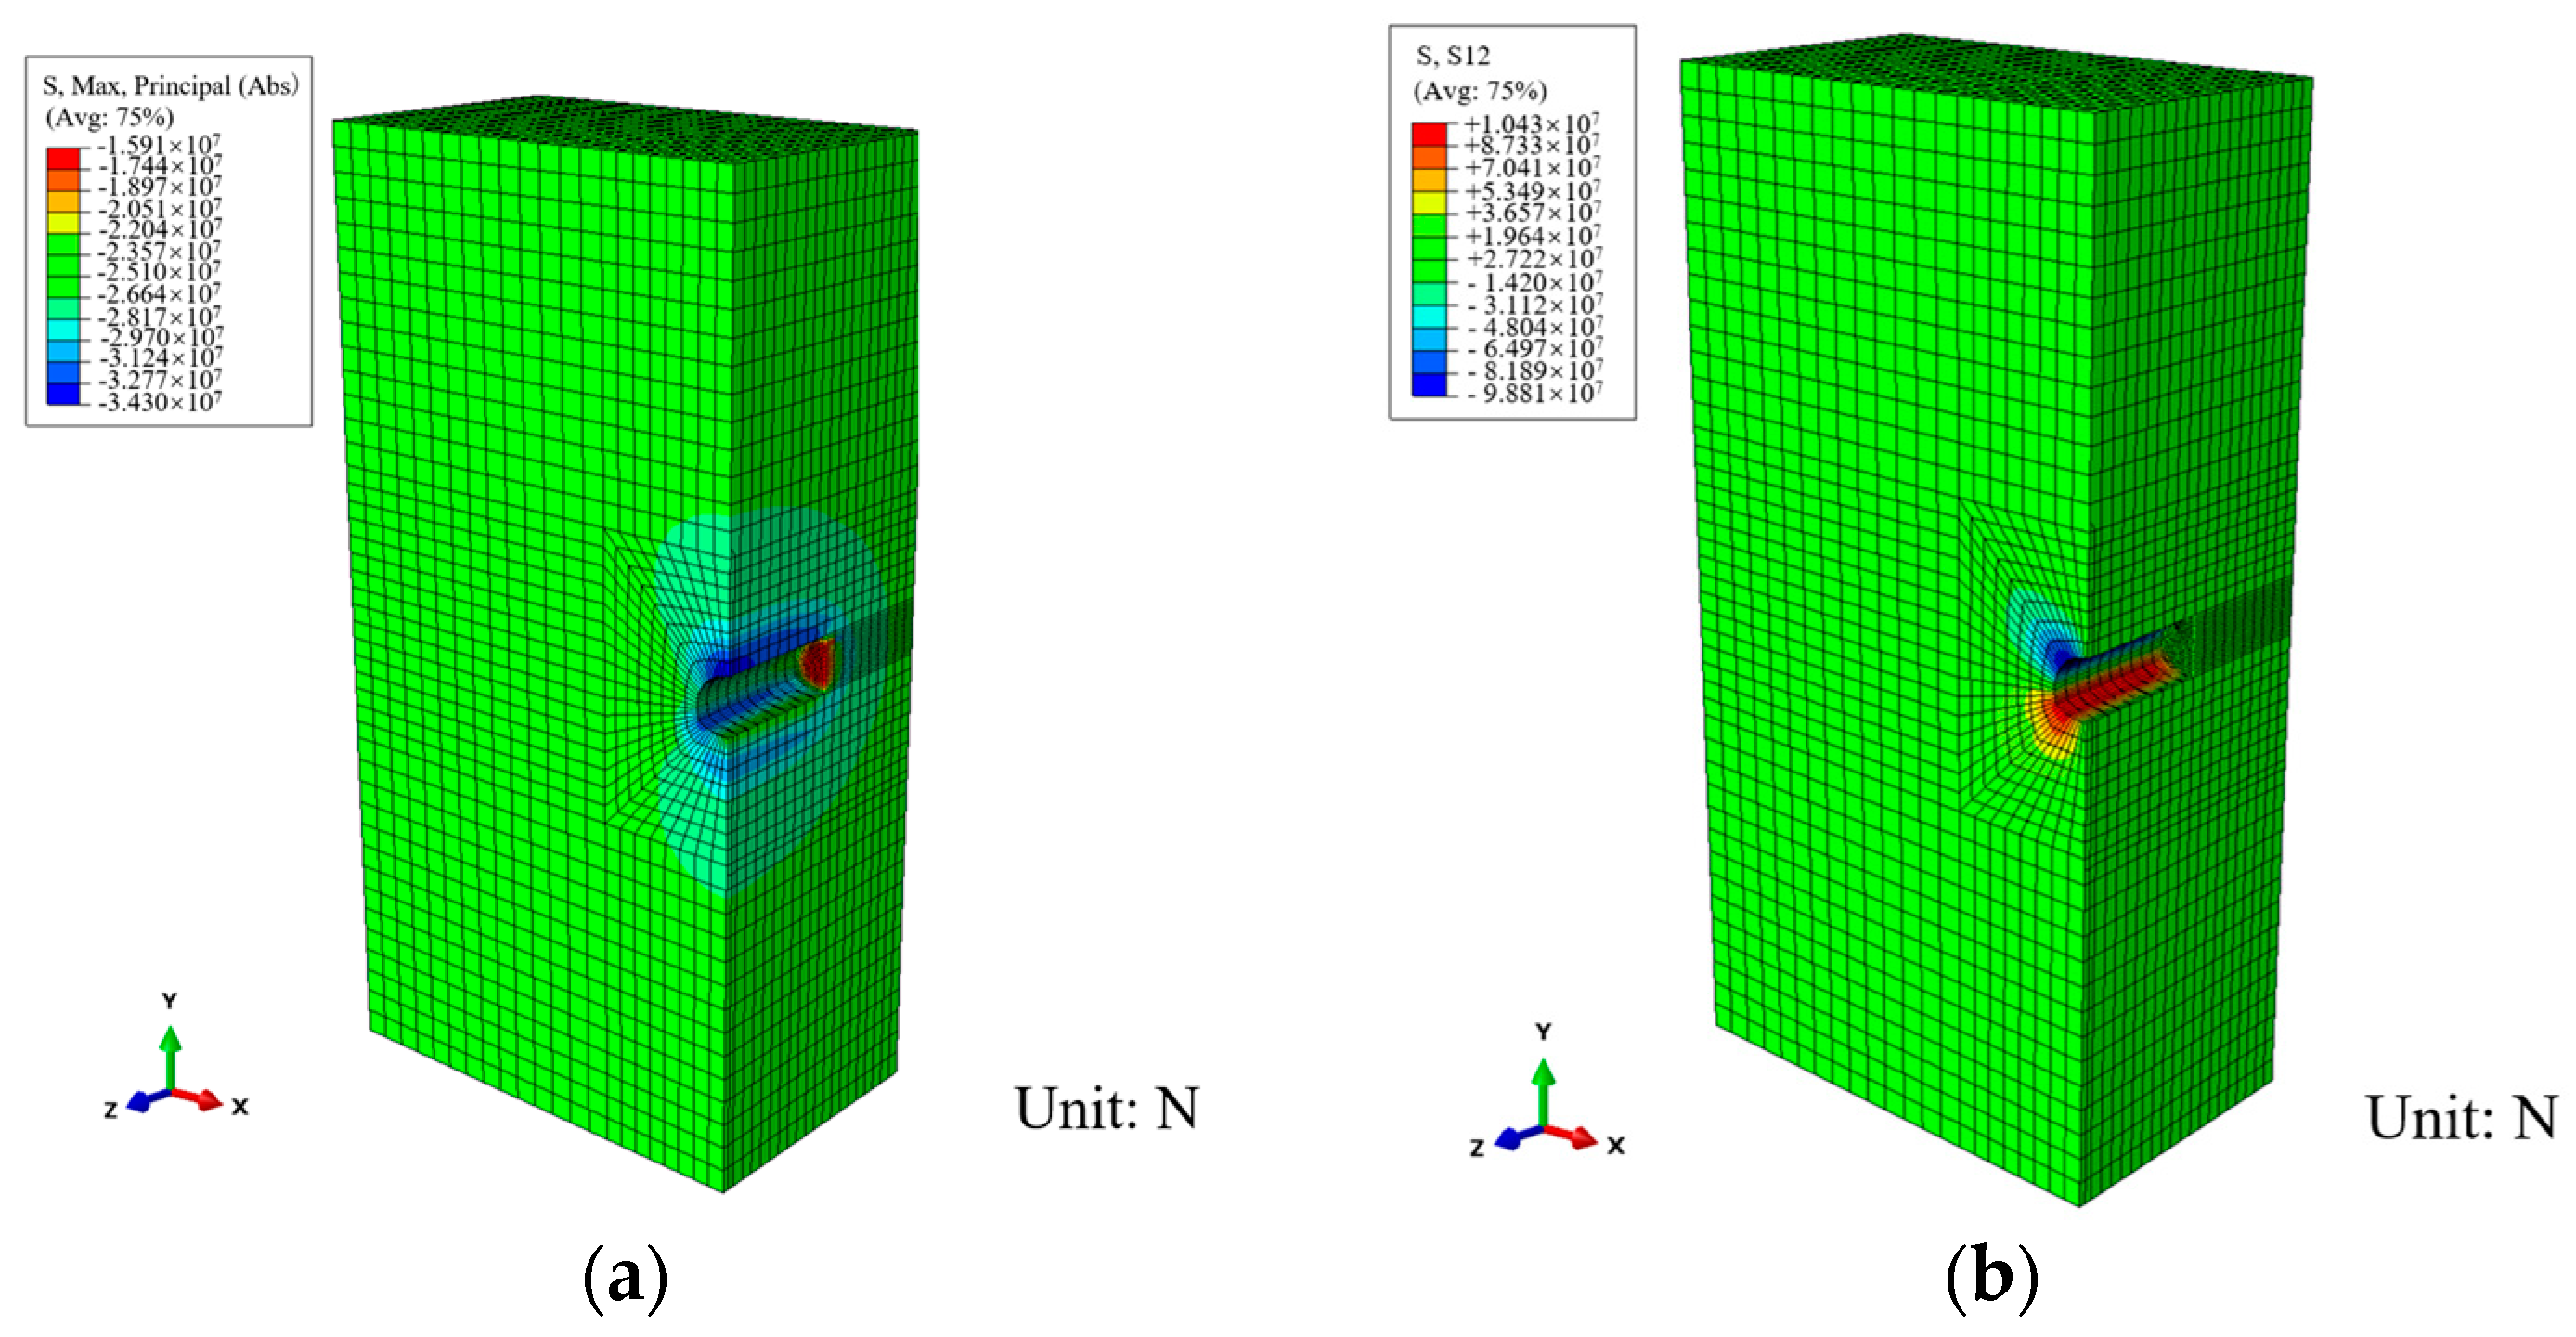
Figure 16.
Stress contour of right tunnel: (a) Results of maximum principal stress. (b) Results of shear stress.
It can be seen from Figure 16 that during the excavation process, the full section of the tunnel excavation section is compressed, and the maximum principal stress appears at the side wall. The shear stress is mainly distributed at the side wall and the arch waist. To study the stress distribution of the right tunnel in the rockburst section during the excavation process, monitoring points were set in the model result file to track the stress parameters in the model, and the change path of different stress during the model calculation process was obtained. Like the left tunnel, in this calculation, monitoring points were arranged in various positions of the tunnel to study the stress changes and the final stress state of different positions during the excavation process, as shown in Figure 17.
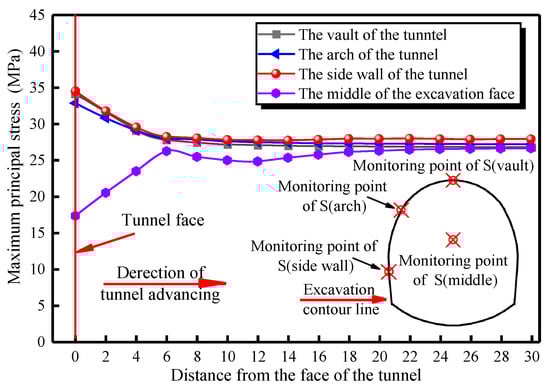
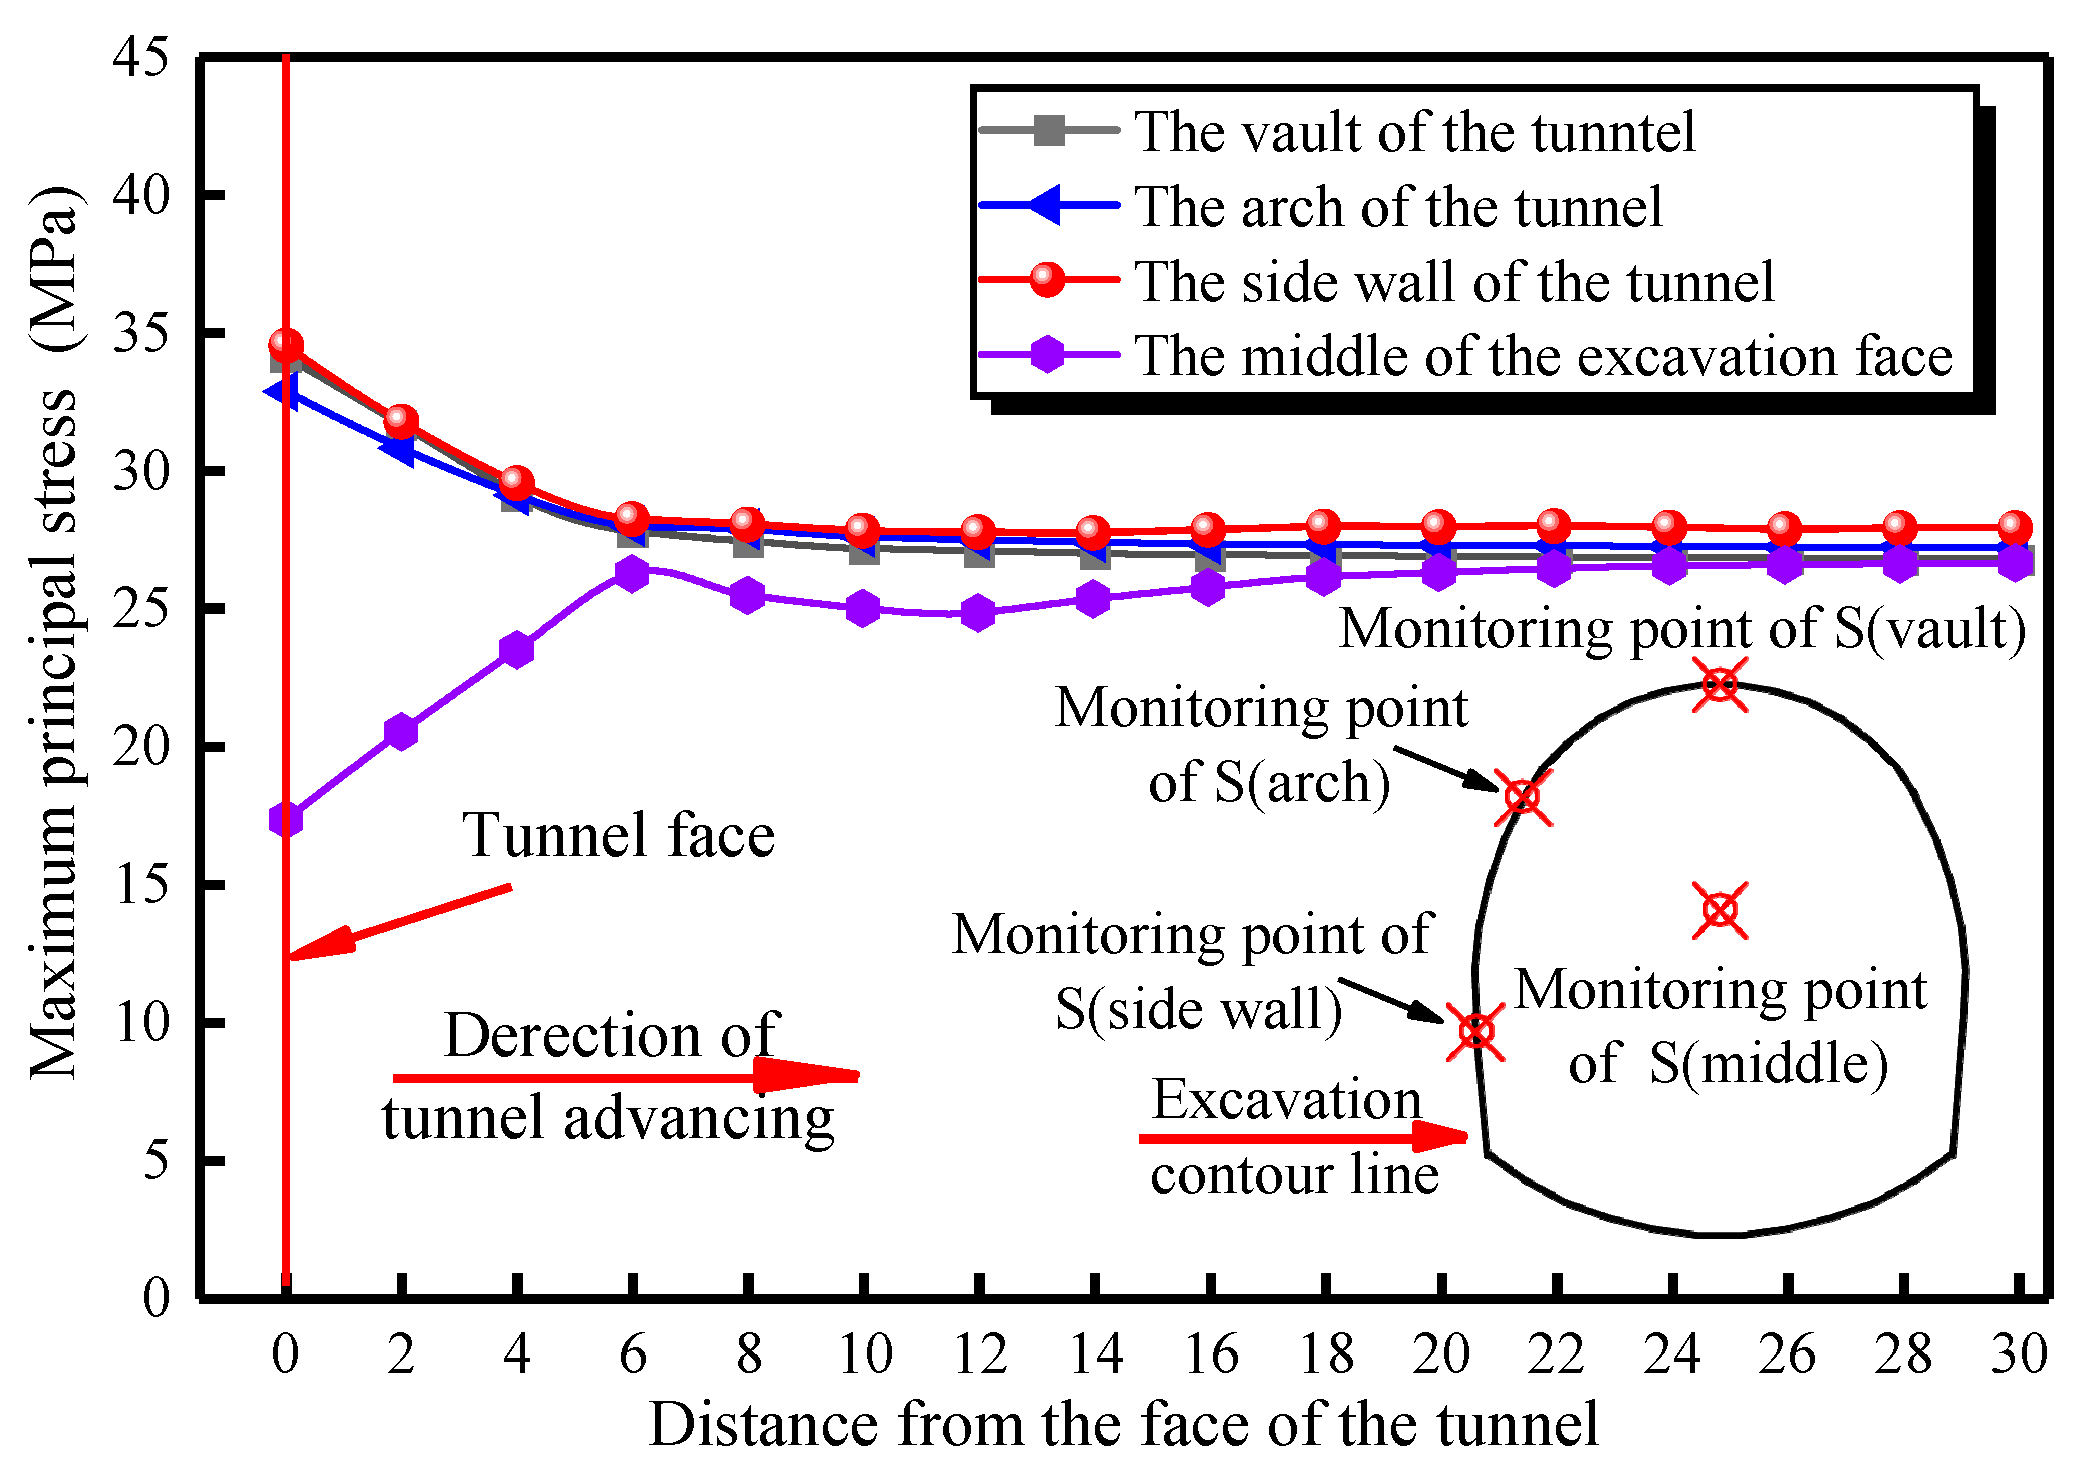
Figure 17.
Curve of maximum principal stress variation in sections of right tunnel.
Figure 17 shows that stress levels at different positions follow the order side wall > arch > vault > middle. As the distance from the excavation face increases, the principal stresses at the vault, arch, and side wall decrease. The maximum principal stress values occur at the excavation surface, with 34.11 MPa at the vault, 32.86 MPa at the arch, and the highest at the side wall with 34.52 MPa. The lowest principal stress is in the middle of the excavation face, at 17.28 MPa. The maximum principal stress values at the vault, arch, side wall, and middle of the right tunnel face are similar to those on the left side, indicating minimal impact from the left-side excavation. However, the cave excavation has an effect. Structural planes are crucial in controlling rockburst occurrences, making surrounding rock more prone to failure and acting as external triggers. Different positions and forms of structural planes cause variations in rockburst location and intensity. High stress concentration, identified as an internal factor, is key in rockburst occurrences. Tunnel excavation under high in situ stress leads to excessive stress concentration in the surrounding rock, causing internal stress to exceed the rock’s strength significantly. The level of stress concentration determines the rockburst intensity.
6. Rockburst Conditions of Different Positions in Ping’an Tunnel
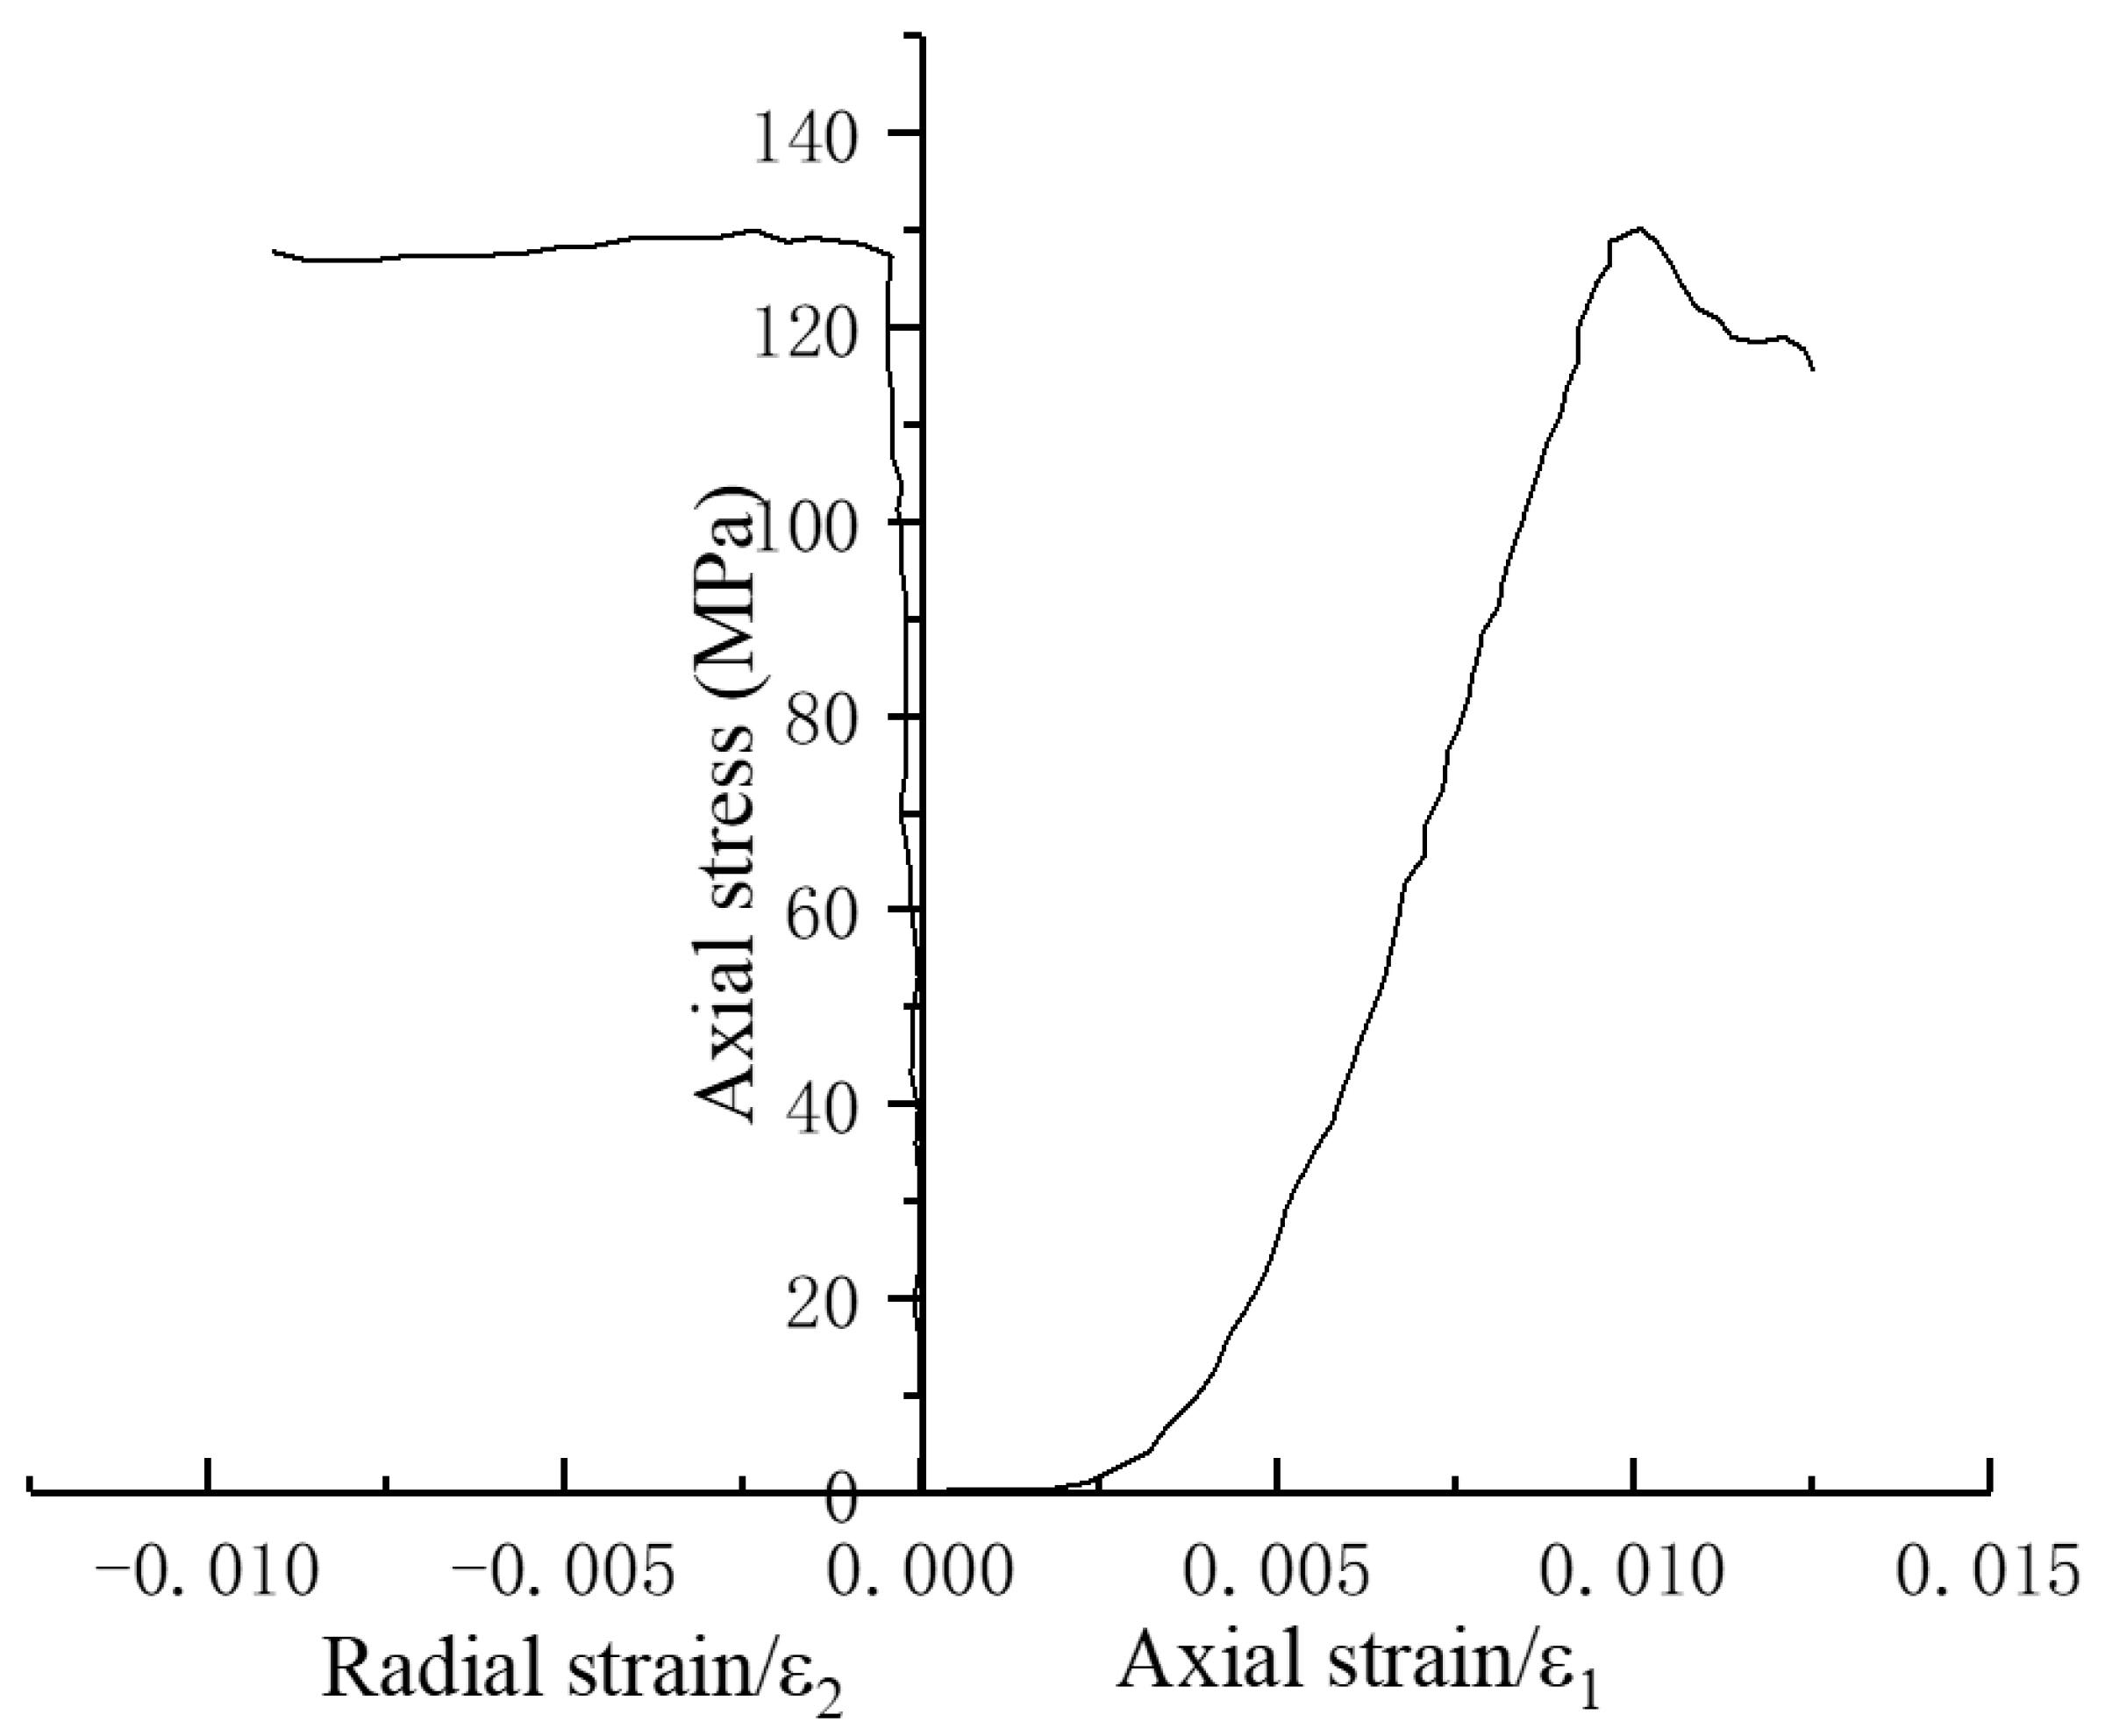
The surrounding rock in the rockburst section was sampled and processed into standard test pieces with a diameter of 50 mm and a height of 100 mm, as shown in Figure 18a. To study the impact of rockburst on the Ping’an Tunnel, uniaxial compressive strength tests were conducted on the specimens at a loading rate of 0.5 MPa/s, as shown in Figure 18b. The test results are displayed in Figure 19 and Table 4. To predict rockburst conditions at different tunnel locations, several representative criteria were selected, including the Lu Sen criterion, the Tao Zhenyu criterion, the Wang Yuanhan criterion, the Wang Lansheng criterion, the Guan Baoshu criterion, and the stress criteria recommended by the “TB10003 Railway Tunnel Design Code” and the “Interim Provisions for the Design of Rockburst Tunnels on the Sichuan-Tibet Railway.” Based on on-site rockburst occurrences during construction and the rockburst grading descriptions in the “TB10003 Railway Tunnel Design Code” for high-stress tunnels, on-site rockburst levels were determined. The comparison of rockburst prediction results using different criteria with on-site rockburst occurrences is shown in Table 5. This comparison demonstrates that for the Ping’an Tunnel, using stress criteria to determine rockburst levels is accurate. Therefore, the ratio of rock strength to stress was used as the rockburst determination indicator, and rockburst predictions were conducted accordingly:
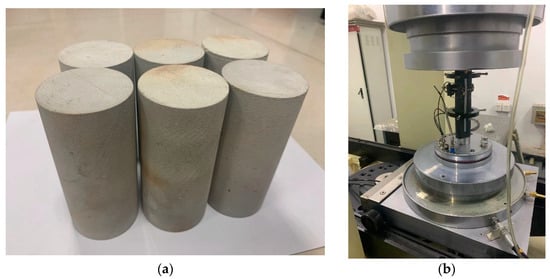
Figure 18.
Uniaxial compression tests: (a) Rock specimen of uniaxial compression test. (b) Uniaxial compression test instrument.
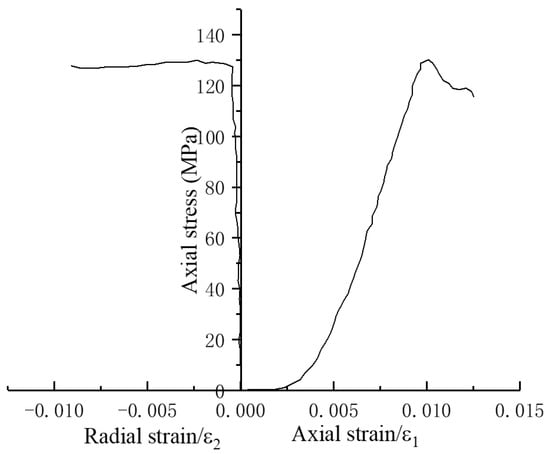
Figure 19.
Stress–strain curves of uniaxial compression tests.
Table 4.
Physical parameters of rock sample.
Table 5.
Rockburst at different positions in the tunnel.
In the formula, when the value of is between 4.0 and 7.0, it is a slight rockburst; when the value of is between 2.0 and 4.0, it is a medium rockburst; when the value of is between 1.0 and 2.0, it is a strong rockburst; when the value of is below 1.0, it is an extremely strong rockburst.
From Table 5, the rockburst situation at the vault, arch waist, and side wall judged by the stress criterion and the on-site situation are basically the same. However, there is a significant discrepancy between the predicted and actual rockburst conditions at the tunnel face center. This discrepancy arises because, during the simulation, no support was applied to the tunnel face, leading to substantial stress release and a consequent reduction in calculated stress at the tunnel face center. Additionally, the presence of structural planes and other adverse factors during tunnel excavation affects the location and intensity of rockbursts. Site surveys revealed rigid structural planes that induce rockbursts at the middle of the left and right tunnel lines, directly causing the observed discrepancies between the predicted and actual rockburst conditions at the tunnel face center.
In the tunnel excavation process, under the condition of high geo-stress, if the stress of the surrounding rock is high, and due to the inevitable existence of unfavorable factors such as the structural surface at the excavation surface, sudden release of the original rock stress and a high-intensity rockburst are likely to occur in the middle of the excavation face. Therefore, in the process of tunnel excavation, stress relief holes should be arranged in the rockburst section to release part of the in situ rock stress before excavation, to reduce the possibility of rockburst during the next cycle of excavation.
7. Conclusions
With the Ping’an over-long deep-buried tunnel of the Cheng-Lan railway taken as the engineering background, on-site measurement, numerical analysis, and laboratory experiments are used to study the stress characteristics and engineering effects of the high-geo-stress rockburst-prone section. The main conclusions obtained are as follows:
(1) For the studied high-geo-stress rockburst section, the relationship between the stress at each position of the tunnel is S (side wall) > S (arch) > S (vault) > S (middle). The stress at the vault, arch waist, and side wall positions varies with distance. The maximum stress is at the side wall of the left tunnel, with the maximum stress of 34.89 MPa. The stress at the middle of the tunnel face is the minimum with the value of 17.28 MPa.
(2) Under the condition of high geo-stress, due to the unfavorable factors such as the structural surface at the excavation face, the in situ stress of the rock at the middle of the tunnel face will be released suddenly and a high-intensity rockburst will be triggered. Therefore, in the process of tunnel excavation, stress relief holes should be arranged in the rockburst section to release part of the original rock stress before excavation, to reduce the possibility of rockburst during the next cycle of excavation, which can effectively control the occurrence of rockburst. In our upcoming research, we will conduct field experiments and numerical analyses to further study the impact of stress relief holes and other control measures on rockburst.
(3) Based on the occurrence location, rockbursts are more likely to happen at the tunnel face in the upcoming excavation section and on both sides of the excavated support section when there are no significant fractures. The side walls are the most prone to rockbursts during excavation, as they experience high compressive stress, which is the primary cause of rockbursts. Appropriate measures should be taken to prevent and control rockbursts at the side walls, reducing their intensity and mitigating their impact. In our future research, we will explore the effect of construction measures on rockburst intensity. By optimizing the excavation cycle length and reducing the excavation cross-section, we aim to control and reduce stress concentration, thereby better controlling rockbursts and ensuring safe and rapid construction in rockburst-prone sections.
Author Contributions
Conceptualization, S.Z. and C.L.; methodology, B.T.; software, C.L. and J.C.; validation, C.Y. and C.L.; formal analysis, C.L.; writing—original draft preparation, S.Z. and C.L.; writing—review and editing, H.L. and C.L.; project administration, B.T., C.L., and J.C. All authors have read and agreed to the published version of the manuscript.
Funding
This study received support from Power China Chengdu Engineering Corporation Limited of the Science and Technology project (Grant No. P60424 and Grant No. PB2313).
Data Availability Statement
The data that support the findings of this study are available from the corresponding author upon reasonable request.
Conflicts of Interest
Authors Chun Luo, Shishu Zhang, Bihua Tang, Jun Chen and Chonglin Yin were employed by the company Power China Chengdu Engineering Corporation Limited Co., Ltd. The remaining authors declare that the research was conducted in the absence of any commercial or financial relationships that could be construed as a potential conflict of interest.
References
- Manouchehrian, A.; Ming, C. Numerical modeling of rockburst near fault zones in deep tunnels. Tunn. Undergr. Space Technol. 2018, 80, 164–180. [Google Scholar] [CrossRef]
- Feng, X.T.; Xu, H.; Qiu, S.L.; Li, S.J.; Yang, C.X.; Guo, H.S.; Cheng, Y.; Gao, Y.H. In situ observation of rock spalling in the deep tunnels of the China Jinping underground laboratory (2400 m depth). Rock Mech. Rock Eng. 2018, 51, 1193–1213. [Google Scholar] [CrossRef]
- Liang, W.; Sari, A.; Zhao, G.; Mckinnon, S.D.; Wu, H. Short-term rockburst risk prediction using ensemble learning methods. Nat. Hazards 2020, 5, 104. [Google Scholar] [CrossRef]
- Zucca, M.; Valente, M. On the limitations of decoupled approach for the seismic behaviour evaluation of shallow multi-propped underground structures embedded in granular soils. Eng. Struct. 2020, 211, 110497. [Google Scholar] [CrossRef]
- Ak, A.; Bas, B. Review of published rockburst events and their contributing factors—ScienceDirect. Eng. Geol. 2018, 246, 361–373. [Google Scholar]
- Kaiser, P.K.; Ming, C. Design of rock support system under rockburst condition. J. Rock Mech. Geotech. Eng. 2012, 12, 215–227. [Google Scholar] [CrossRef]
- Cai, M. Principles of rock support in burst-prone ground. Tunn. Undergr. Space Technol. Inc. Trenchless Technol. Res. 2013, 36, 46–56. [Google Scholar] [CrossRef]
- Ortlepp, W.D.; Stacey, T.R. Rockburst mechanisms in tunnels and shafts. Tunn. Undergr. Space Technol. 1994, 9, 59–65. [Google Scholar] [CrossRef]
- Qian, Q.H. Definition, mechanism, classification and quantitative forecast model for rockburst and pressure bump. Rock Soil Mech. 2014, 35, 1–6. [Google Scholar]
- Bagde, M.N.; Karekal, S. Fatigue properties of intact sandstone in pre and post-failure and its implication to vibratory rock cutting. ISRM India J. - Half Yrly. Tech. J. Indian Natl. Group ISRM 2015, 12, 19–25. [Google Scholar]
- Feng, X.T.; Xiao, Y.X.; Feng, G.L.; Yao, Z.B.; Chen, B.R.; Yang, C.X.; Su, G.S. Study on the development process of rockbursts. Chin. J. Rock Mech. Eng. 2019, 38, 649–673. [Google Scholar]
- Afraei, S.; Shahriar, K.; Madani, S.H. Developing intelligent classification models for rock burst prediction after recognizing significant predictor variables, section 1: Literature review and data preprocessing procedure. Tunn. Undergr. Space Technol. 2019, 83, 324–353. [Google Scholar] [CrossRef]
- Gong, F.Q.; Dai, J.H.; Wang, M.Y.; Huang, S.L.; Xu, L. “Strength & stress” coupling criterion its grading standard for high geostress. J. Eng. Geol. 2022, 30, 1893–1913. [Google Scholar]
- Manouchehrian, A.; Cai, M. Analysis of rockburst in tunnels subjected to static and dynamic loads. J. Rock Mech. Geotech. Eng. 2017, 48, 69–75. [Google Scholar] [CrossRef]
- Gong, F.Q.; Li, X.B. Application of distance discriminant analysis method to classification of engineering quality of rock masses. Yanshilixue Yu Gongcheng Xuebao/Chin. J. Rock Mech. Eng. 2007, 26, 190–194. [Google Scholar]
- Li, X.; Gong, F.; Wang, S.; Li, D.; Feng, F. Coupled static-dynamic loading mechanical mechanism and dynamic criterion of rockburst in deep hard rock mines. Chin. J. Rock Mech. Eng. 2019, 42, 46–53. [Google Scholar]
- He, M.; Miao, J.; Li, D.; Wang, H.C.; Chen, R.N. Rock burst in deep granite sample process experimental study. J. Rock Mech. Eng. 2007, 26, 865–876. [Google Scholar]
- Lin, M.Q.; Zhang, D.J.; Pan, D.; Xiao-Shan, N.I.; Ben-Jun, X.I.; Yang, D.D. Research on rock burst evolution and micromechanics analysis of phosphate fragments from rock burst. Ind. Miner. Process. 2017, 15, 59–66. [Google Scholar]
- Feng, T.; Xie, X.B.; Wang, W.X.; Pan, C.L. Brittleness of rocks and brittleness indexes for describing rockburst proneness. Min. Metall. Eng. 2000, 20, 18–19. [Google Scholar]
- Li, M.; Song, Y.; Lv, W.; Wang, Z.; Fang, D. Study on micro-mechanism of rockburst tendency of underground engineering rock mass. China Saf. Sci. J. 2017, 27, 89–94. [Google Scholar]
- Feng, J. Rockburst Characteristics and prevention of Erlang Mountain Tunnel. West-China Explor. Eng. 2005, 17, 110. [Google Scholar]
- Li, T.; Zhong, Y.; Pan, H.; Chen, G. Failure Characteristics Analysis on Physical Model of Rockburst in High In-situ Stress Tunnel. Mod. Tunn. Technol. 2016, 53, 185. [Google Scholar]
- Ma, T.H.; Tang, C.A.; Tang, L.X.; Zhang, W.D.; Wang, L. Mechanism of rockburst forcasting based on micro-seismic monitoring technology. Chin. J. Rock Mech. Eng. 2016, 35, 473. [Google Scholar]
- Chen, X.W.; Huang, L.; Zou, Y.L. Rapid construction technology of flexible support for rockburst tunnel. Tunn. Constr. 2018, 38, 1212. [Google Scholar]
- Yang, J.; Chai, J.; Zhang, D.; Zhang, Y.X. Study on ductile fracture mechanism of coal rock mass based on cohesive crack model. Chin. J. Rock Mech. Eng. 2021, 40, 3014–3023. [Google Scholar]
- Xie, H.P.; Pari, W.G. Fractal characteristics and mechanism of rockburst. Chin. J. Rock Mech. Eng. 1993, 12, 28–37. [Google Scholar]
- Chen, B.; Feng, X.; Ming, H.; Zhou, H.; Xiao, Y. Evolution law and mechanism of rockburst in deep tunnel: Time delayed rockburst. Yanshilixue Yu Gongcheng Xuebao/Chin. J. Rock Mech. Eng. 2012, 31, 561–569. [Google Scholar]
- Liu, G.F.; Li, S.F.; Feng, G.L. Volume of rockbursts based on seismic information classification and identification method research. Chin. J. Rock Mech. 2024, 23, 1–15. [Google Scholar] [CrossRef]


Disclaimer/Publisher’s Note: The statements, opinions and data contained in all publications are solely those of the individual author(s) and contributor(s) and not of MDPI and/or the editor(s). MDPI and/or the editor(s) disclaim responsibility for any injury to people or property resulting from any ideas, methods, instructions or products referred to in the content. |
© 2024 by the authors. Licensee MDPI, Basel, Switzerland. This article is an open access article distributed under the terms and conditions of the Creative Commons Attribution (CC BY) license (https://creativecommons.org/licenses/by/4.0/).