Article

Detection of Components in Korean Apartment Complexes Using Instance Segmentation

1
Department of Architecture, Graduate School, Seoul National University of Science and Technology, Seoul 01811, Republic of Korea
2
Department of Architectural Engineering, Hyupsung University, Hwaseong 18330, Republic of Korea
3
School of Architecture, Seoul National University of Science and Technology, Seoul 01811, Republic of Korea
*
Authors to whom correspondence should be addressed.
Buildings 2024, 14(8), 2306; https://doi.org/10.3390/buildings14082306
Submission received: 19 June 2024 / Revised: 22 July 2024 / Accepted: 22 July 2024 / Published: 25 July 2024
(This article belongs to the Special Issue Advanced Technologies for Urban and Architectural Design)

Abstract

:
Since the 2000s, the demand for enhancing the quality of life of Korean apartment complexes has led to the development of units with diverse outdoor spaces. Analyzing these complexes requires detailed layout data, which are challenging to obtain from construction drawings. This study addresses this issue using the Roboflow map API to collect data based on apartment complex addresses. The dataset, categorized into seven classes, trained a YOLOv8s-seg segmentation model, which was evaluated by precision, recall, and mAP values per class. Detection performance was generally high, although vehicle roads and welfare facilities posed challenges. Segmenting complexes, analyzing main building layouts, and classifying based on period, household count, and regional shape are potential applications. This study is significant because it secured a dataset of layout drawings through maps, a challenging feat given the difficulty in obtaining actual completion blueprints of apartment complexes. However, discrepancies existed between the mapped layouts and the actual blueprints, which caused certain errors; this represents a limitation of the study. Nevertheless, the apartment complex layout analysis model derived from this study is expected to be useful for various future research projects. We anticipate that further studies will be able to conduct architectural planning research on apartment complexes based on an improved analysis model.

1. Introduction

Living arrangements in South Korea can be broadly classified into single-family housing, multi-unit housing (including apartments, row houses, and multi-family houses), non-residential buildings with residential units, and officetels. Apartments were introduced as a representative housing type in Korea to address the housing shortage due to the increasing population and urban density in the Seoul metropolitan area. Since the late 1990s, apartment designs—previously focused on quantitative supply aimed at achieving the most efficient layout of complexes—have shifted focus to qualitative supply owing to rising living standards. Consequently, the demand for luxury apartments and differentiated apartment designs has increased.
The evolution of apartment complexes in South Korea reflects significant changes in residential culture, driven by economic and policy shifts over the decades. In the 1970s, the development of high-rise and large-scale apartment complexes began with the Yeouido pilot apartment project. The 1980s saw planned urban residential development and the introduction of the Land Development Promotion Act [1]. The 1990s witnessed high-density and high-rise apartment construction, driven by new town policies [2]. In the 2000s, apartment branding was introduced, along with a price cap system to regulate the real estate market. By the 2010s, with the housing supply rate exceeding 100%, and the majority of the population residing in apartments, there was a focused effort to stabilize the housing market and revitalize old downtown areas and aging residential zones through the Urban Regeneration New Deal policy [3]. These changes reflect the evolution of South Korea’s residential culture, illustrating how apartment design and functionality have adapted to economic and social contexts.
Apartment complexes are designed with the main buildings placed within the site, forming the skeleton of the complex. Consequently, boundaries between residential and outdoor spaces are formed, marking the facilities and outdoor spaces within and outside dedicated spaces for the residents. An apartment complex typically includes main buildings, where resident families can live, as well as auxiliary and welfare facilities for the convenience of residents. Other spaces within the complex include rest and exercise areas between buildings, walkways connecting buildings and entrances, children’s playgrounds, and green spaces such as outdoor lawns [4].
An apartment complex is an assembly of habitable main buildings and outdoor spaces. Outdoor spaces and facilities within the apartment complex are freely accessible to the residents. The routes from the entrances of the complex to individual units are comfortably managed, offering convenience and safe spaces for movement. In the initial designs of multi-unit housing complexes, outdoor spaces were primarily utilized as above-ground parking lots without consideration for the pleasant use of outdoor spaces. However, with the increasing demand for better use of outdoor spaces, the design of specialized outdoor spaces is considered to be as important as the design of individual housing units. In particular, planners have made efforts to increase the brand value of apartments through specialized outdoor plans such as large central plazas that are used as rest and leisure spaces for residents and are also used as landmarks. The specialized design of outdoor spaces has, in turn, led to an increase in living costs [5,6].
Analyzing multi-family housing complexes is essential to understanding their elemental interactions and requires a comprehensive planning approach. However, the design of these complexes has traditionally relied on the designers’ experience and conditions, leading to a passive and time-consuming process. Moreover, there is insufficient objective information on multi-family housing trends and limited resources for analyzing and utilizing extensive data, restricting the analysis to a simple classification. Therefore, the introduction of artificial intelligence (AI) technology is necessary to reflect the changes in multi-family housing and modern trends in major data analysis and objective planning. This could further improve residents’ living environments and reduce unnecessary time and costs involved in complex planning.
According to the 2024 report on AI by the Royal Institute of British Architects (RIBA), a survey of over 500 RIBA members showed that 41% are already using AI technology, with 43% reporting that AI has enhanced the efficiency of the design process. The question is no longer “whether to use AI” but “how to use AI” in the architectural field [7].
Based on this background, as shown in Figure 1, this study analyzes apartment complexes using a deep learning approach. This deep-learning-based approach automatically learns hierarchical features from raw data and adjusts these features to reduce the time spent on the data collection and analysis of apartment complexes. Furthermore, by analyzing the components within an apartment complex, this study establishes a foundation for deriving optimal layout solutions, thereby increasing residential satisfaction, and enhancing the design performance of builders.

2. Related Work

2.1. Apartment Complex Plan

An apartment complex incorporates artificial planning into the physical environment to improve human habitation, living standards, and the natural environment within a region, while harmonizing spatial structure, the needs of the residents, and social perceptions. It involves designing and integrating environmental elements like street networks, green spaces, residential buildings, community facilities, parking lots, distances between buildings, privacy, noise, and views. The complex, housing, and users are considered interrelated components of the residential area. Thus, the planning takes into account the land and population size, income, living standards, and the natural environment and functional division of the region, applying density, volume, form, function, and patterns to create a balanced environment [5,6].
Complex planning is preliminary to individual building plans, wherein the targets are clearly defined, and the goals and contents of the plan are detailed and specified. Complex planning includes creating frameworks for architecture, civil engineering, and landscaping based on the standards set by preceding steps such as urban planning (which sets the planning goals for the complex) [8].
The spatial composition of an apartment complex is divided into residential buildings, welfare facilities, circulation plans, and outdoor spaces. Planning for welfare facilities involves selecting the size and location of shopping centers and kindergartens while considering the accessibility, recognizability, and efficiency of the arrangement. Circulation plans are divided into pedestrian and vehicle circulation plans. Pedestrian pathways are linked to the outdoor space plan and should ensure comfort and safety, whereas vehicle pathways should consider connectivity with the main roads outside the complex, functional efficiency, and effective access to each main building and parking lot. Outdoor spaces, such as plazas, yards, and pedestrian areas, should promote community within the complex [8].

2.2. Image Segmentation

Convolutional neural networks (CNNs) are a type of deep neural network and are most commonly used for image analysis [9]. Before the advent of deep learning, object detection involved multiple stages, including outline detection and feature extraction. CNNs consistently outperform traditional classification algorithms and have been used for object detection, classification, and segmentation.
Object detection identifies objects within an image and determines their location and size. The objects are indicated by labels that include a bounding box for each object and the predicted class inside the object [10]. Subsequently, the algorithm compares images with existing object templates to detect objects within the image and ascertain their locations [11].
Image segmentation, an extension of image classification, is a computer vision technology that is used to classify information within an image. Image segmentation can also be used to comprehend the image contents at the pixel level. It performs a variety of tasks, from individual object detection to assigning individual labels to different areas within the image, thereby marking the boundaries of objects with contours to locate and identify the objects. Image segmentation in machine learning involves separating the data into individual groups. In deep learning, image segmentation involves creating a segment map that links every pixel of the image with a label or category; this is similar to the way in which autonomous vehicles identify vehicles, pedestrians, traffic signs, and other road elements. Segmentation is a core machine learning technique that enables data to be divided into groups with similar features, improving the accuracy, efficiency, and performance of AI models. Segmentation types, principles, and models have evolved from object detection to semantic segmentation to instance segmentation.
Image segmentation divides an image into multiple segments to simplify its representation for detailed analysis; it is also used to locate objects within the image. Semantic segmentation classifies objects belonging to the same class at the pixel level. It distinguishes between different classes but does not consider the individuality of multiple objects within the same class [12]. Semantic segmentation has numerous applications, including in the medical field.
Instance segmentation combines object detection and semantic segmentation to classify objects by creating boundary boxes with classifications and masks for the objects. A common approach to instance segmentation involves object detection followed by segmenting the objects within the bounding box, or, alternatively, image segmentation followed by instance separation through object detection, combining various network structures [13].
Models implementing image segmentation have evolved from deep learning-based technologies with fully convolutional networks [14] into various technologies such as U-Net [15], DeepLab [16], PSPNet [17], SegNet [18], Mask R-CNN [19], and You only look once (YOLO).
Mask R-CNN, which is based on the Faster R-CNN object detection model, is a widely used model that implements both image segmentation and object detection [20]. For example, it was developed for segmentation and achieved high-level object detection and bounding box prediction [19] on the COCO dataset [21].
YOLO is a fast, accurate, and stable object detection model that is being continuously improved. YOLO was primarily designed to detect and locate objects within images. YOLOv8, which was released recently, aims to improve results through changes in the structure and architecture of previous YOLO versions. YOLOv8 is a fast, accurate, and user-friendly model for a wide range of object detection, image segmentation, and classification tasks.
Numerous studies have compared the performances of Mask R-CNN and YOLO. For instance, in segmentation, YOLO outperforms Mask R-CNN in terms of accuracy and speed [22,23]. Moreover, other deep learning algorithms, like YOLOv5, YOLOv7, and YOLOv8, are effective in detecting and masking objects [24].
In this study, the YOLO model was employed for image segmentation owing to its high processing speed and accuracy, which are particularly advantageous for real-time image processing compared to other segmentation techniques. Furthermore, the YOLO model effectively recognizes and classifies complex architectural layouts, making it exceptionally suitable for architectural image analysis.

2.3. Trends in Architecture Using Deep Learning

Understanding the layout and design of architectural spaces necessitates the thorough analysis of graphical representations like floor plans; CNNs excel at this task due to their adeptness at evaluating two-dimensional imagery. This proficiency makes them ideal for studies aiming to transform floor plans or visibility graphs into multidimensional spatial grids. A pioneering study in this field, ArchiGAN, utilized deep learning to innovate in the design of apartment layouts. This model, trained with data from Boston’s apartment layouts, is capable of automatically designing the overall building structure, the arrangement of individual units, the organization of spaces within those units, and the placement of furniture, all of which reflect the unique conditions of the site. The core of ArchiGAN is built on the principles of generative adversarial networks (GANs), integrating a discriminator that differentiates real layouts from simulated ones, and a generator that crafts credible plans capable of fooling the discriminator. This reciprocal training uncovers hidden patterns within architectural design data [25]. Furthermore, a separate investigation developed a deep-learning-driven algorithm capable of recognizing floor plans and converting extensive blueprint data into graph-based diagrams, from which the algorithm autonomously deduced spatial arrangements. This groundbreaking approach enabled the creation of a model capable of suggesting architectural space relationships, which is invaluable during a project’s planning phase [26].
Previous research has indicated that instance segmentation is the most suitable method for detecting objects within an image. Therefore, developing an object segmentation model is essential for deriving the spatial components of apartment complexes. Similarly, in the field of architecture, deep learning has begun to be applied in various ways, although research has predominantly focused on analyzing floor plans for individual units. In this study, the performances of the YOLOv5, YOLOv7, and YOLOv8 models under identical experimental conditions were compared. The best-performing model was then used, as an example, for the segmentation of Korean apartment complexes. The results were then evaluated.
YOLOv8 is particularly suitable for use in the architectural field because it maintains high performance with high-resolution images. This model efficiently processes large-scale architectural data and accurately identifies complex architectural elements. Therefore, it effectively handles various scenarios that may arise during the architectural design and planning processes, significantly enhancing project time efficiency and accuracy.

3. Materials and Methods

3.1. Apartment Complex Dataset

3.1.1. Scope of Apartment Complexes

In Korea, apartment complexes with at least 100 households are required to publicly disclose their management fees, according to public housing management laws. Accordingly, the apartment complex data for this study were obtained from the Public Housing Management Information System (K-apt). The data contain information on each apartment complex, including the address, year of completion, number of households, number of buildings, and number of floors [27]. Therefore, this study selected apartment complexes among the over 18,000 multi-unit housing complexes nationwide, limiting the scope to apartment complexes with at least 300 households, which are legally required to have facilities such as senior citizen centers, playgrounds, daycare centers, and community facilities.

3.1.2. Composition of Apartment Complexes

An apartment complex is divided into residential buildings and welfare facilities, circulation plans, and outdoor spaces, according to the complex plan. Residential buildings involve placement within the site boundaries; welfare facilities include shopping centers, daycare centers, and senior citizen centers; circulation plans cover walkways, roads, and above and below-ground parking lots; and outdoor spaces are divided into playgrounds, exercise areas, rest areas, etc. [3].
Thus, apartment complexes comprise different spaces and facilities for convenience and cultural life and are planned with accessibility and comfort in mind. The composition of an apartment complex can be identified from a map at a level similar to the final drawings. Thus, the planning of residential buildings, welfare facilities, circulation, and outdoor spaces can be analyzed based on information provided by a map API. The map API includes various index treatments for enhanced visibility and improved accessibility. Therefore, in this study, the apartment complex layout data were obtained using a map API. The maps obtained, and the final drawings of the complexes, are largely similar, and obtaining the maps is easier than acquiring the final drawings.

3.2. Dataset and Preprocessing

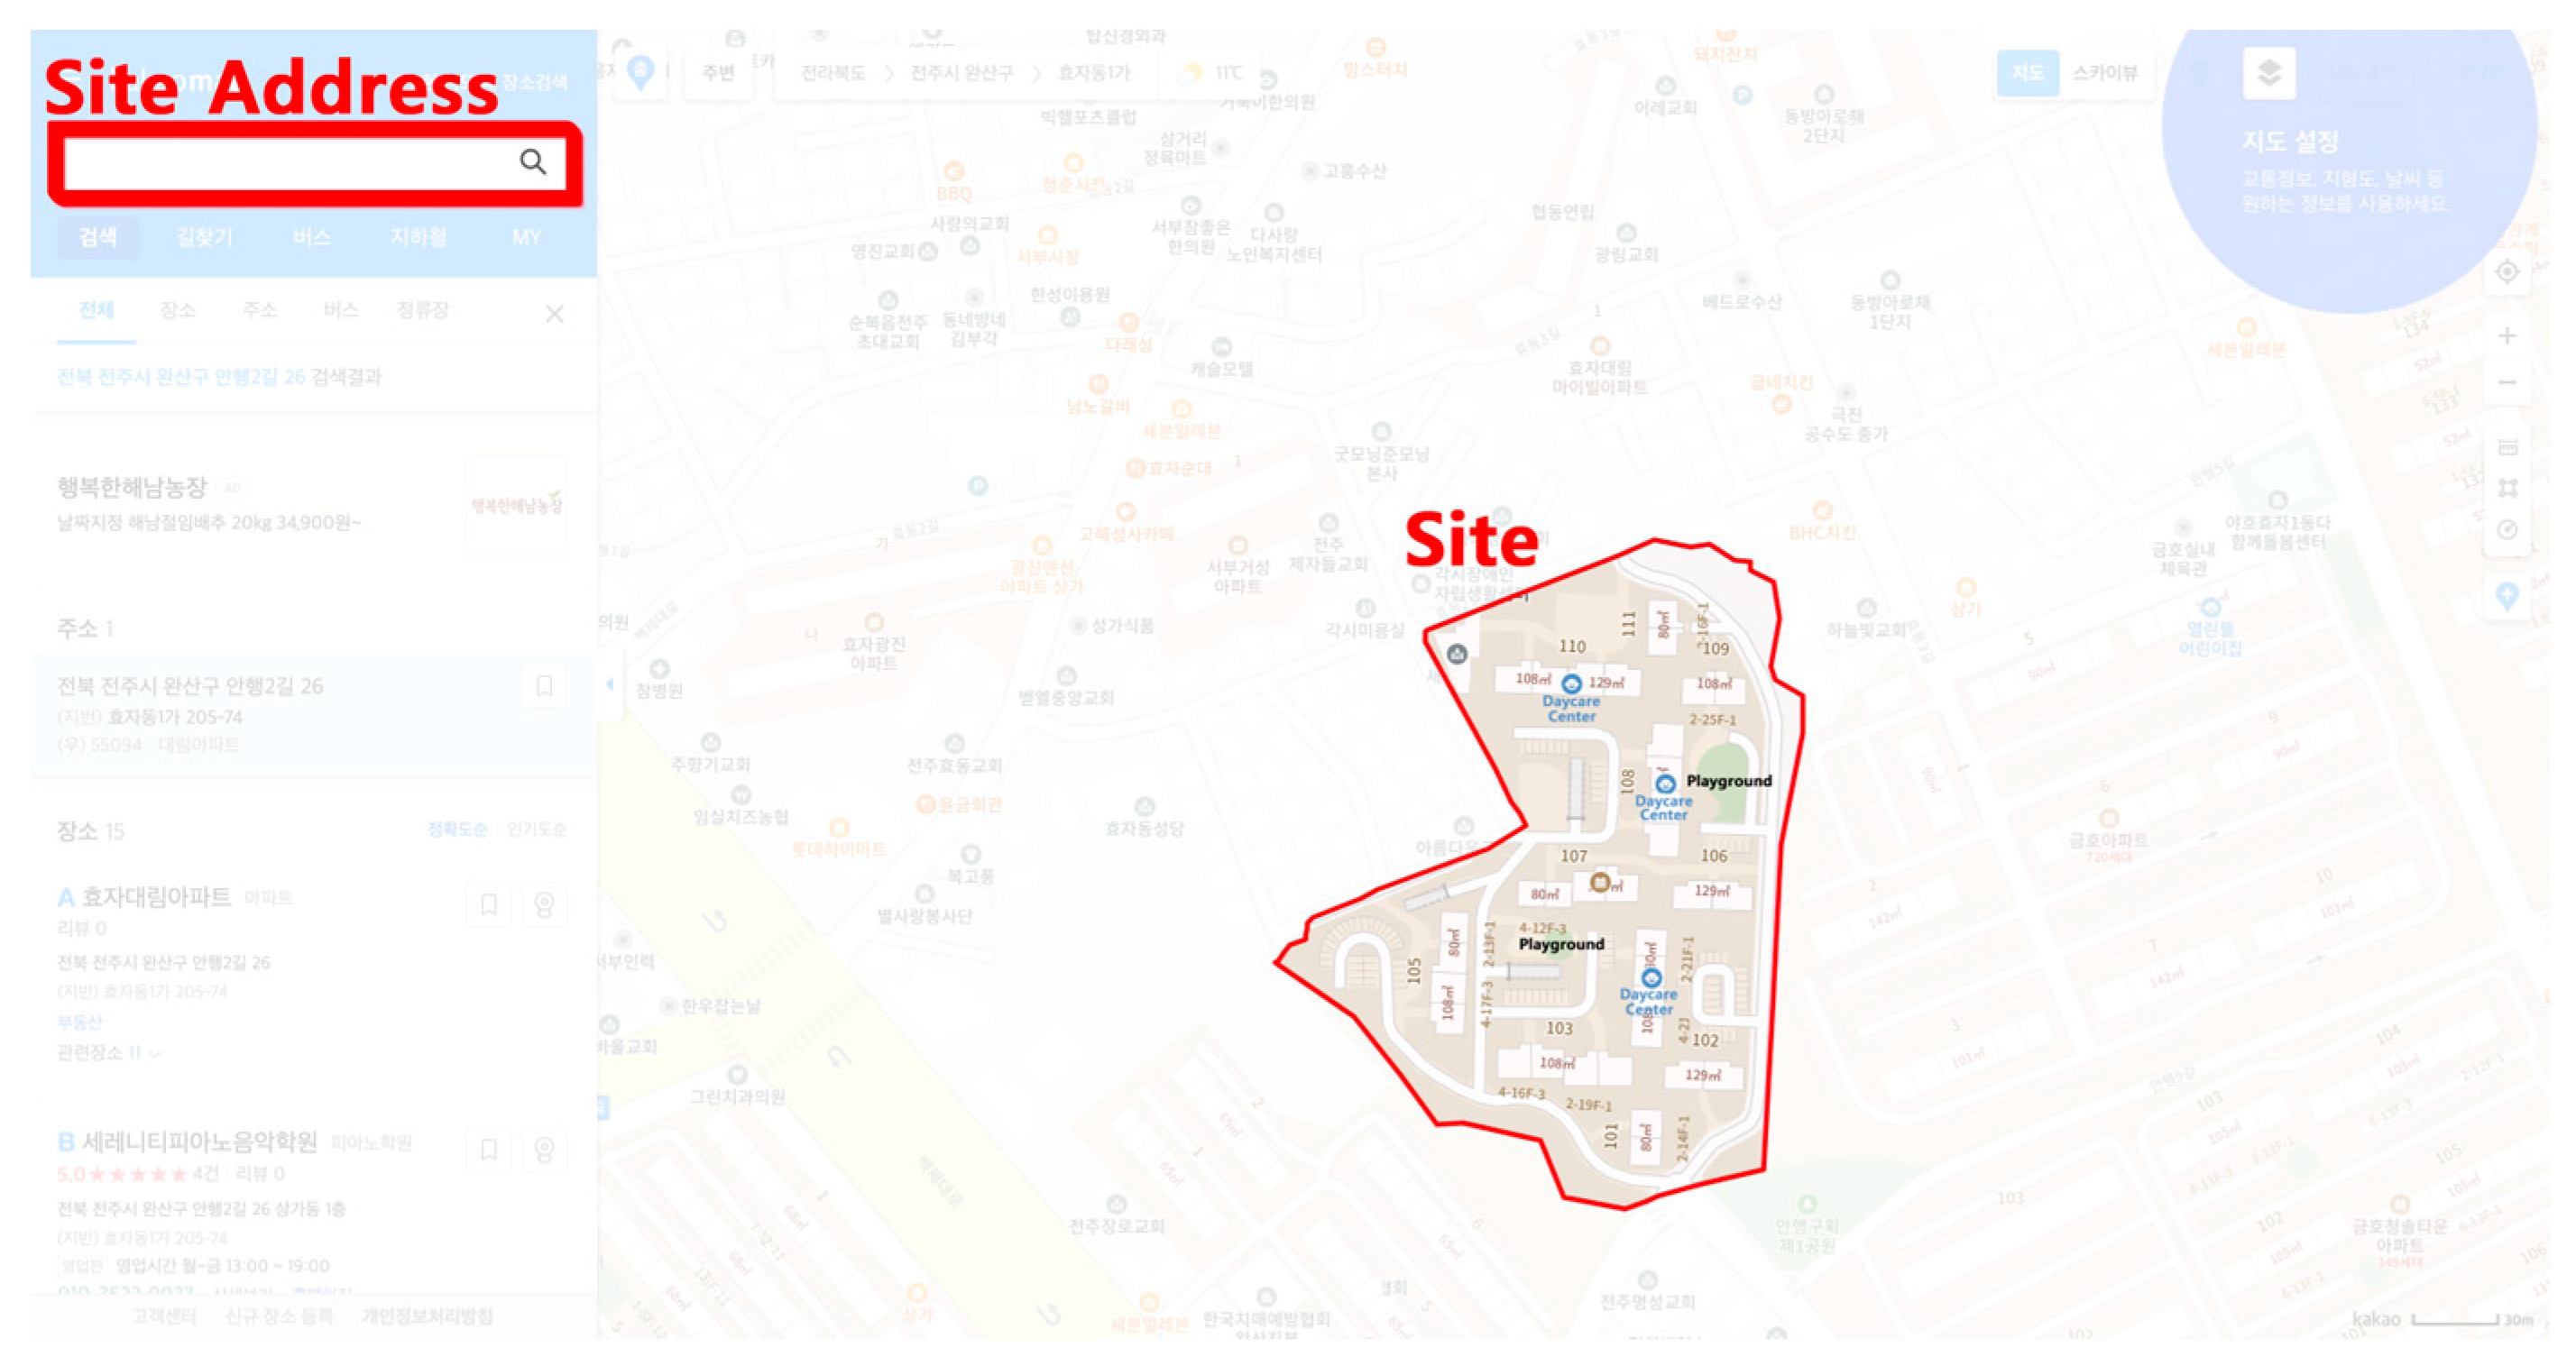
3.2.1. Image Acquisition

The apartment complex layouts were extracted using the KakaoMap (Kakao Corp., Jeju, Republic of Korea) [28] map API. KakaoMap is a map service commonly used in Korea and is similar to Google Maps (Google Inc., Mountain View, CA, USA) [29]. As shown in Figure 2, the map includes information on complex boundaries, main building placement, playgrounds, badminton courts, waterside spaces, roads, sidewalks, and parking lots. The addresses of complexes provided by the K-apt data were entered into KakaoMap; the complexes were saved as images to obtain map files for each complex. The layouts of apartment complexes were obtained by cropping the boundaries of the complexes to eliminate unnecessary information. The map service displays boundaries corresponding to each address in pink, based on national cadastral maps. However, these boundaries differed slightly from the actual site boundaries. Areas where the complex boundaries were not clearly defined were exception-handled, and the data were refined. The database used in this study was constructed in a previous study, and the details can be found in ref. [30].

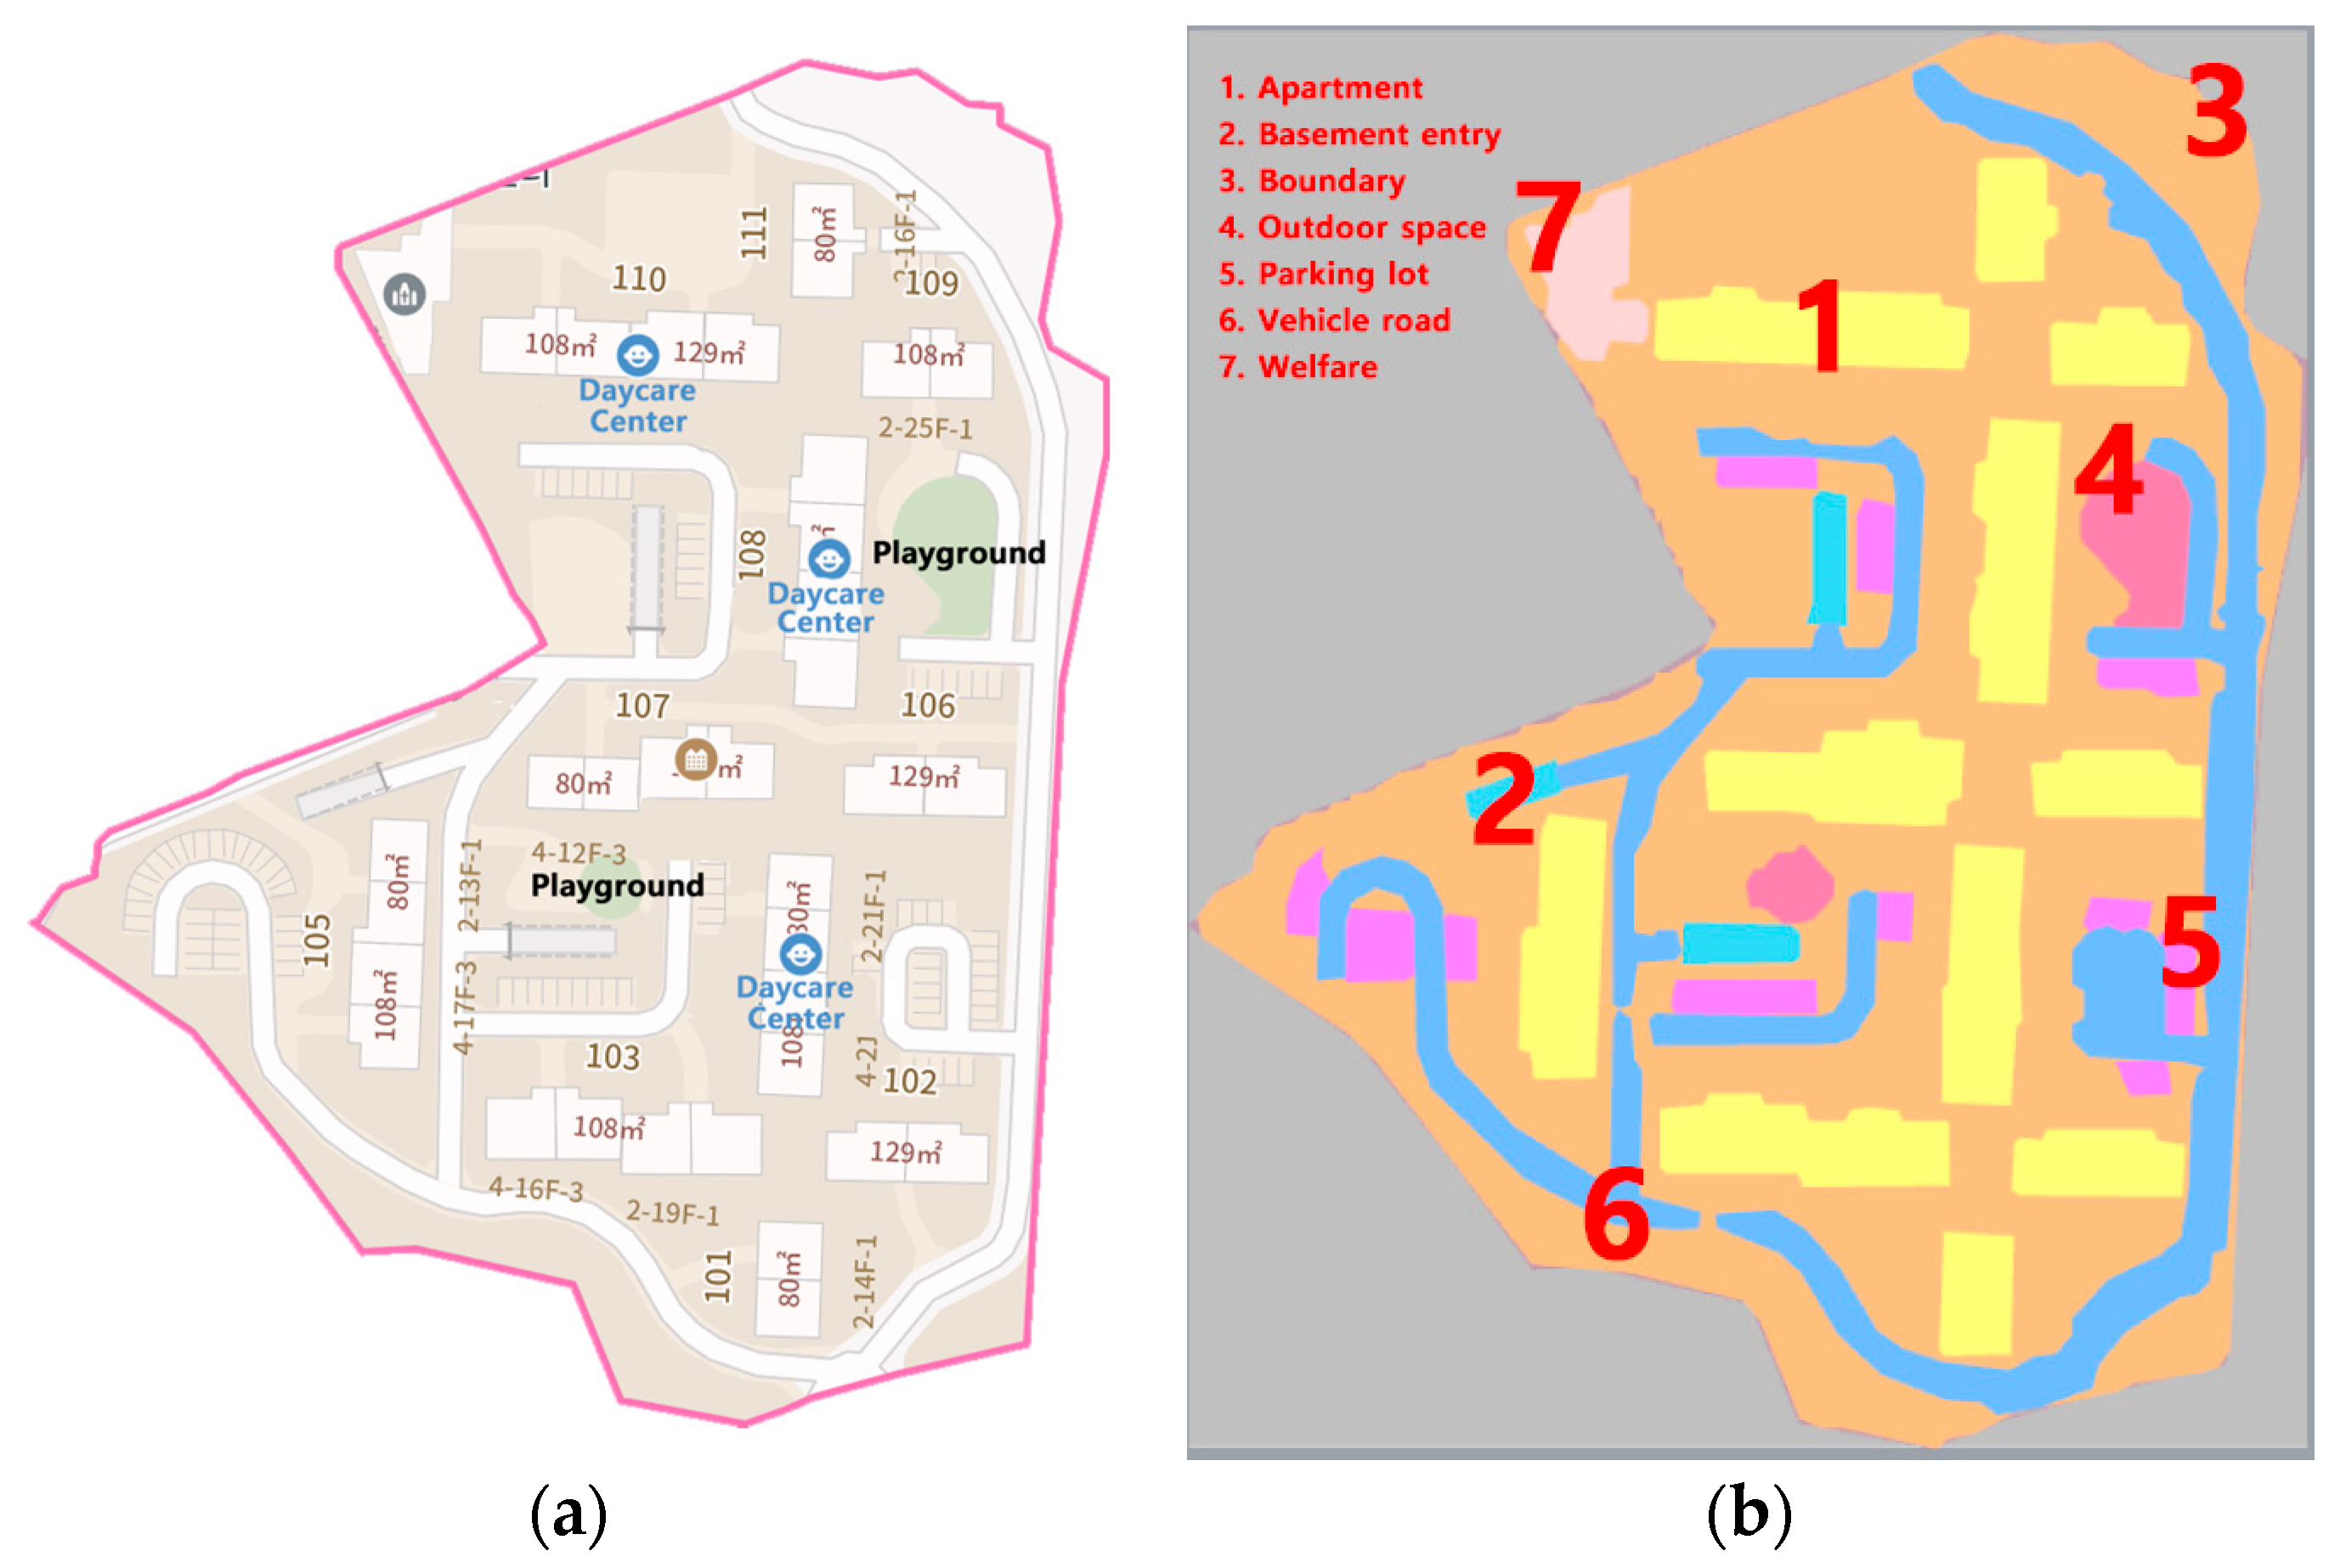
3.2.2. Data Annotation

A total of 1054 apartment complexes with clear and diverse outdoor spaces were selected to build the dataset. Original images were annotated using the Roboflow API (Roboflow, Des Moines, IA, USA) [31] for image segmentation (which is based on the YOLOv8 network model). As shown in Figure 3, the following seven classes were labeled: apartment, basement entry, boundary, outdoor space, parking lot, vehicle road, and welfare.
The components in the dataset were labeled as follows:
(a)
Label 1 represents the main buildings within the apartment complex, segmented to fit the shape;
(b)
Label 2 represents the basement parking entrance, connected to vehicle roads within the complex, and is indicated by hatching on the map;
(c)
Label 3 represents the complex boundary, which corresponds to the cadastral boundary displayed when the address is entered on the map;
(d)
Label 4 represents outdoor space, including playgrounds, badminton courts, exercise areas, and rest spaces;
(e)
Label 5 represents above-ground parking lots within the complex; these correspond to the series of rectangles on the map;
(f)
Label 6 represents vehicle pathways within the complex for vehicle circulation;
(g)
Label 7 represents welfare facilities such as daycare centers, kindergartens, senior centers, and shopping centers.

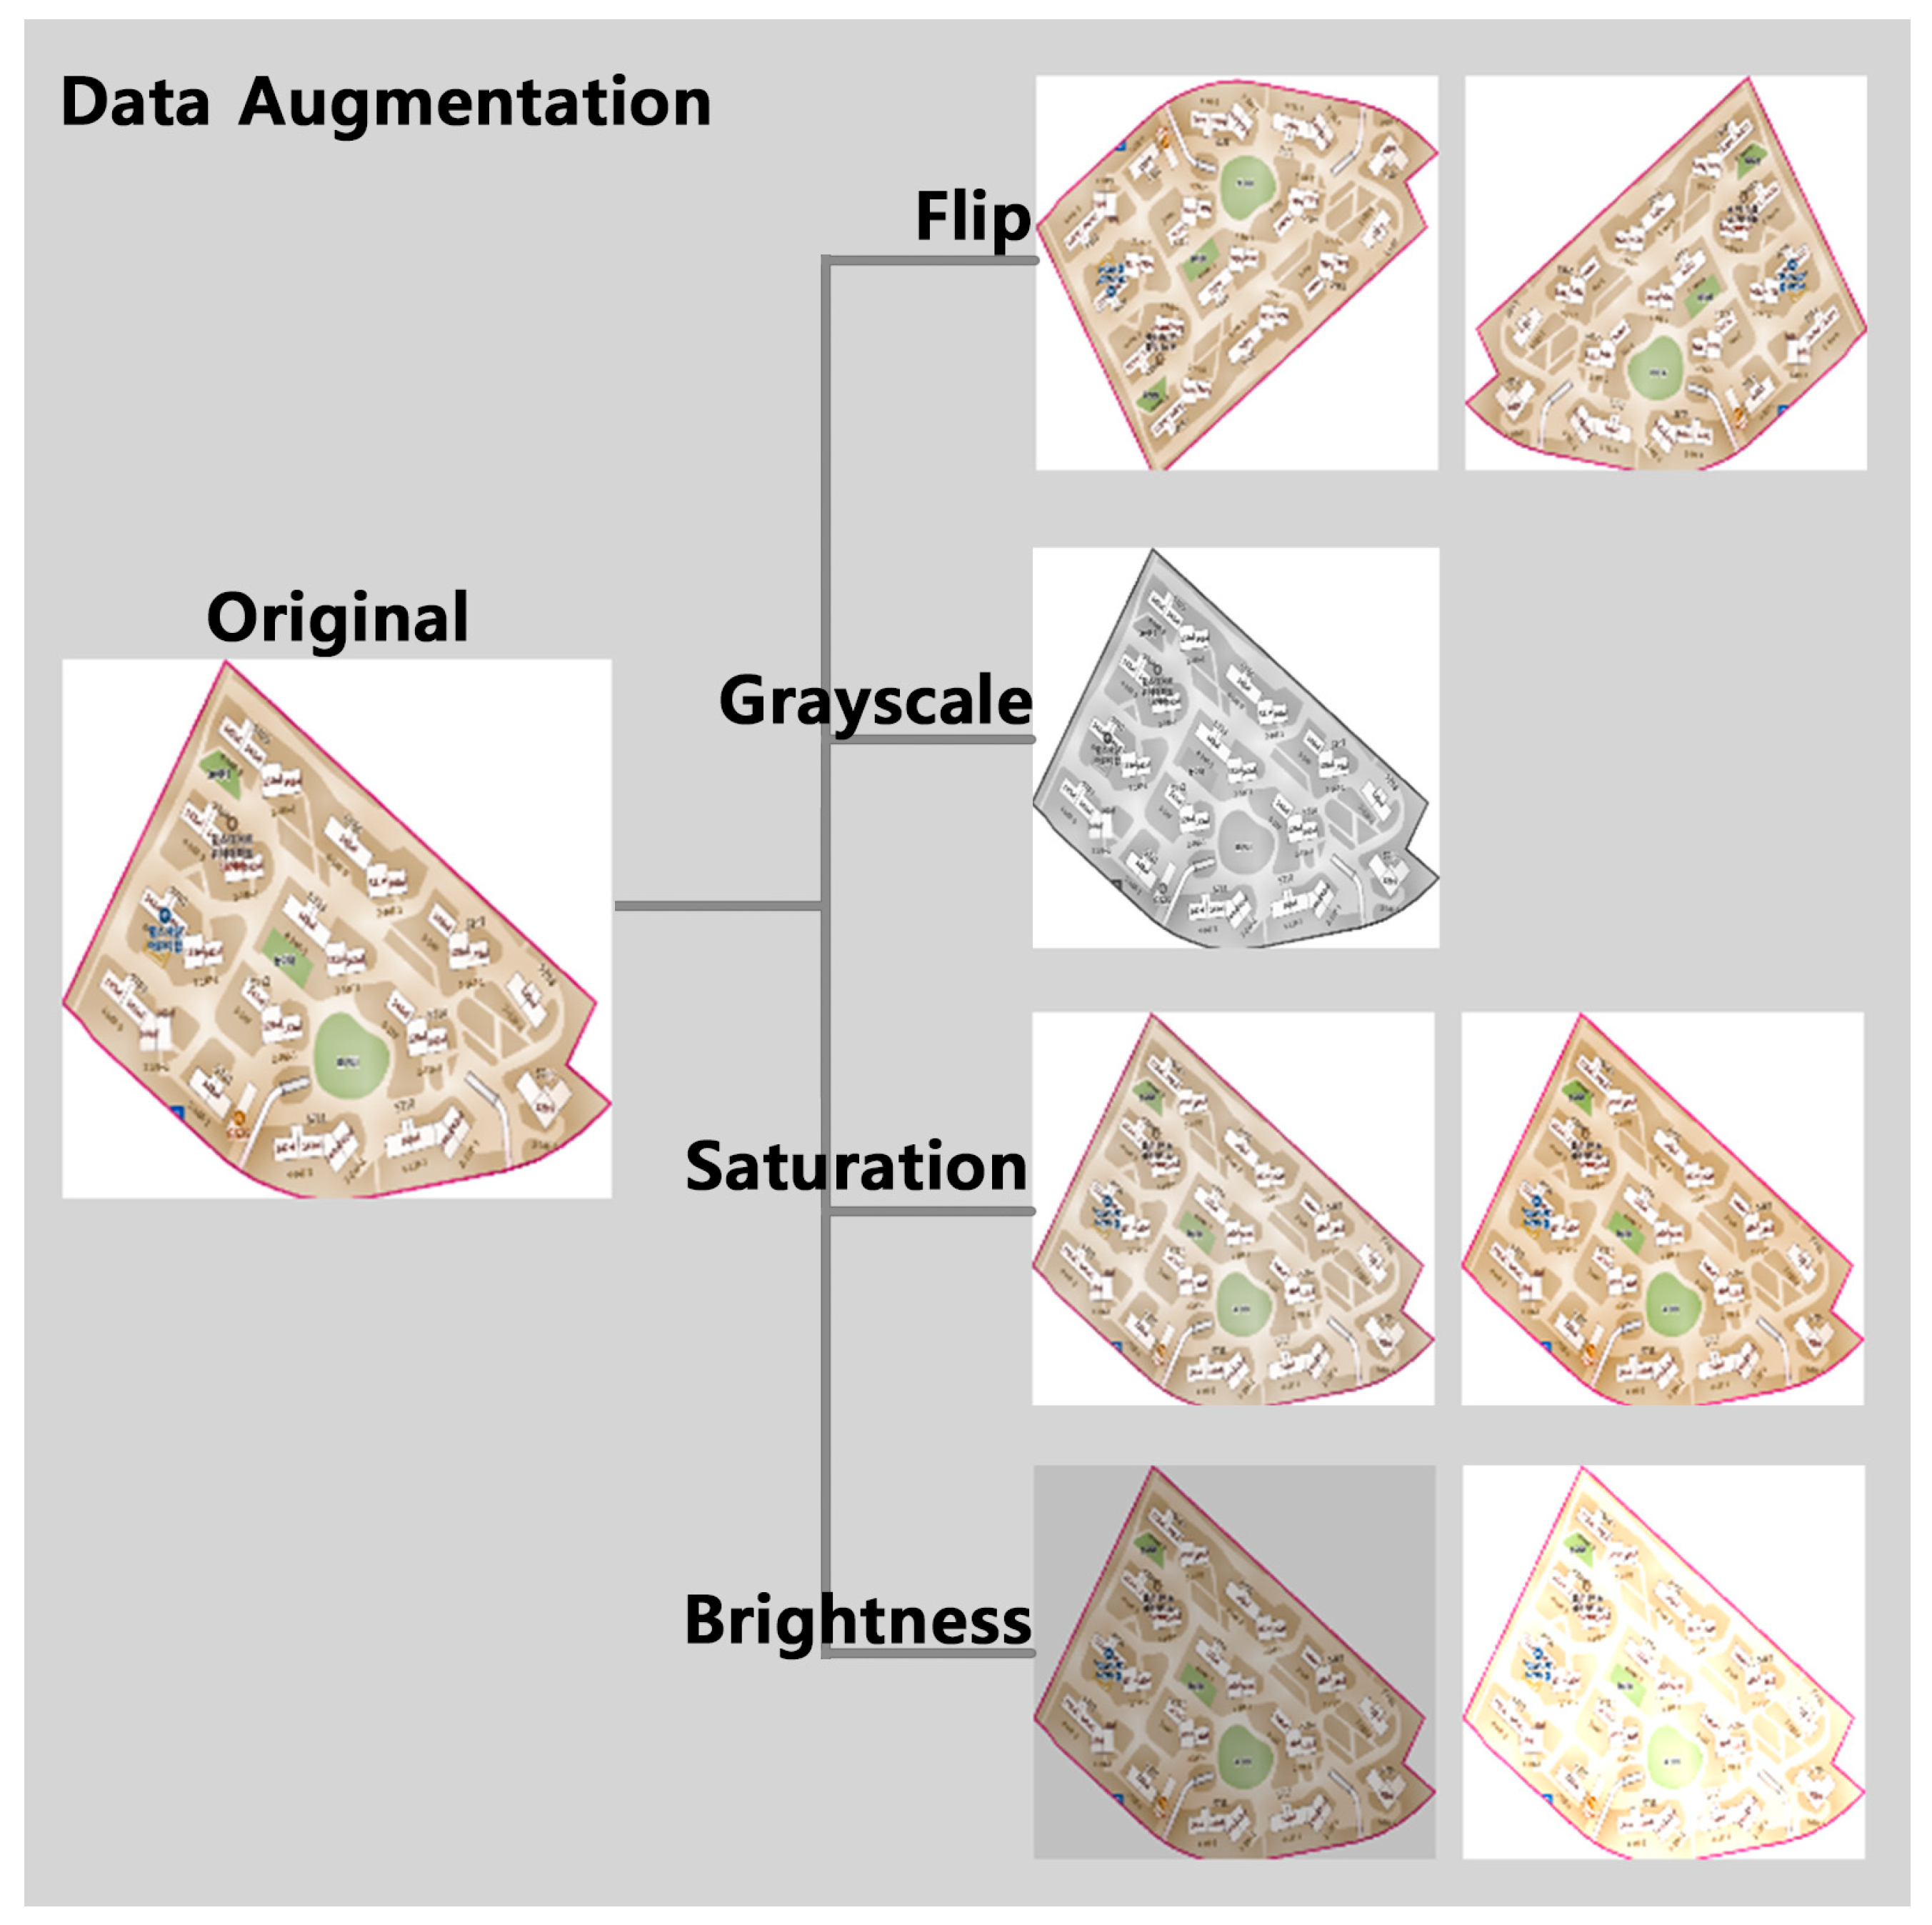
3.2.3. Data Augmentation

Data augmentation refers to techniques that increase the size of the dataset. Deep learning models tend to perform better as the size of the dataset increases, and data augmentation is an important strategy to expand the training dataset [32]. Data augmentation includes the generation of additional data via the rotation, tilting, flipping, and shifting of the original image. In particular, data augmentation through image transformation can enhance the ability of the model to generalize learning to new images [33].
In this study, all images were resized to 640 × 640 pixels, the required size for the pre-trained model. The resizing was performed using Python code, maintaining the original aspect ratio of the images to prevent distortion and ensure that the model accurately understands the shape and structure of the objects. This method prevents distortion and enables the model to accurately understand the shapes and structures of the objects. Resizing was automated via scripts to ensure consistent input sizes across all training data, which is critical to prevent overfitting and to enhance the model’s consistency and accuracy. This approach also ensures standardization of the data, which is crucial for optimizing the model’s performance. Utilizing images with lower resolutions than this pixel size could result in the insufficient capture of details and information loss, potentially degrading the model’s performance and reliability.
Data augmentation was employed to enhance the model’s learning performance and generalization ability. This technique introduces variability without altering the intrinsic properties of the objects within the images, thereby assisting the model in better recognizing the structures and features of objects. Specifically, the dataset’s diversity was enriched by applying horizontal or vertical flips to the images, enabling the model to recognize objects regardless of their orientation. Additionally, approximately 25% of the images were converted to grayscale to facilitate efficient object recognition, particularly in scenarios where color information is less critical. Adjusting the saturation and brightness by ±25% further ensures that the model can accurately identify objects under varying lighting conditions. These operations are illustrated in Figure 4 and summarized in Table 1.
Data augmentation techniques enhanced the model’s generalization capabilities. By applying transformations such as rotations, tilting, flipping, and shifting to the images, diversity within the data was increased, aiding the model in accurately learning and predicting new images. Data augmentation is particularly essential when considering the complexity and variety of architectural images, as it ensures consistency and accuracy in the model’s performance.

3.3. Research Methods

3.3.1. Comparison with YOLO Segmentation Models
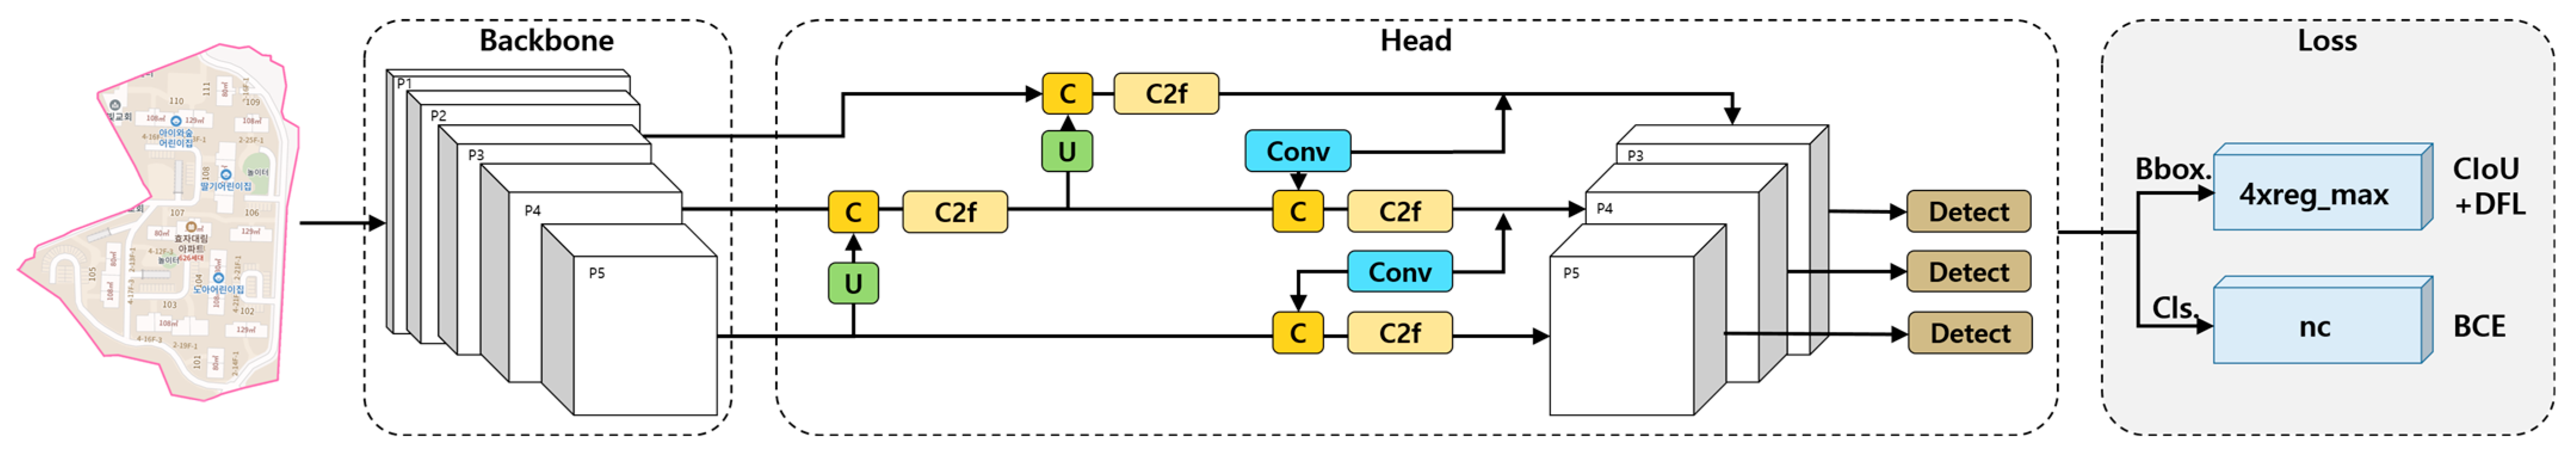
YOLO is usually composed of a head and a backbone, which is the basic structure of an object detector. The backbone extracts the feature map of the image, and the head finds the location of the objects based on these results, thereby enabling classification. This is a significant advantage of the structure [34].
In this study, YOLO models were used to analyze apartment complexes through instance segmentation, and the performances of YOLOv5, YOLOv7, and YOLOv8 were compared. According to performance benchmark data that considered the number of parameters and inference speed, YOLOv8 was generally superior in terms of accuracy and speed (Figure 5) [35]. YOLOv5, YOLOv7, and YOLOv8 instance segmentation models in this study were implemented based on the constructed dataset, and each model was trained under identical experimental conditions.
The results of the comparison between different YOLO models are shown in Table 2. YOLOv5 is a lightweight model with fewer parameters and a shorter inference time that allows for quick analysis. However, its overall metrics, such as precision, recall, and mean average precision (mAP), are lower. Although YOLOv7 has a shorter inference time than YOLOv8 and similar overall metrics, the higher number of parameters in YOLOv7 can affect the learning process and could lead to divergence instead of convergence. YOLOv8, despite the relatively long inference time, has fewer parameters and exhibits superior overall performance metrics. During the planning and execution phases of this study, the latest version available was YOLOv8, which incorporated the most advanced technology and had been verified for stability. While newer versions such as YOLOv9 and YOLOv10 have since been released, YOLOv8 was utilized for this study.
This study compared the performances of the YOLOv5, YOLOv7, and YOLOv8 models. Performance evaluations demonstrated that YOLOv8 was superior in terms of accuracy and processing speed. This model provides faster recognition capabilities and higher accuracy, especially with high-resolution architectural images, making it the most suitable choice for this study.

3.3.2. YOLOv8 Model

The main feature of YOLOv8 is extensibility. YOLOv8 is designed as a framework that supports all previous versions of YOLO, making it easier to switch between different versions and compare their performance. YOLOv8 includes a new backbone network, a new anchor-free detection head, and a new loss function. It runs efficiently on various hardware platforms, from CPUs to GPUs, and the performance is faster and more accurate than those of previous versions [36,37].
The YOLOv8 segmentation model was pre-trained on the COCO dataset; these weights serve as the starting point for all custom dataset training. The head of YOLOv8 consists of multiple convolutional layers, followed by a series of fully connected layers. YOLOv8 uses an anchor-free model with a decoupled head to independently perform objectness, classification, and regression tasks. This design enables each branch to focus on its task and improves the overall accuracy of the model. The structure of the YOLOv8 network used in this study is shown in Figure 6.
YOLOv8 uses the complete intersection over union loss [38] and distribution focal loss (DFL) [39] for bounding box loss and binary cross-entropy for classification loss. Bounding box loss measures the error in predicted box coordinates and dimensions compared to the ground truth. Segmentation loss assesses the dissimilarity between predicted and ground-truth masks. Classification loss quantifies the error in predicted class probabilities. DFL, a recent addition, addresses class imbalance by giving more importance to less frequent classes. The overall loss is usually a weighted sum of these individual losses.

4. Model Training and Evaluation

4.1. Model Training and Validation

Herein, apartment complexes in Korea with at least 300 households were selected, and the dataset comprising the layouts of these complexes was obtained using a map API. The layout data were labeled using the Roboflow API annotation tool for the following seven classes of apartment complex components: main buildings, underground parking entrances, complex boundaries, outdoor spaces, above-ground parking lots, vehicle roads, and welfare facilities. Typically, labeling involves manually inspecting the outlines of each object in an image, a process known for its time-consuming nature. However, this study streamlined the process using the Roboflow labeling tool to save time. By employing Roboflow’s Smart polygon tool, researchers could simply drag and drop to select objects within images and automatically detect their outlines for labeling. This approach enabled three researchers to complete dataset labeling within a mere 10 days, capitalizing on the tool’s ease of use for precise segmentation and efficient labeling. YOLOv8s-seg, a small-sized segmentation model with over 11 million parameters, was used in this study. The training and validation images were randomly selected in each dataset. The images were split into three sets: 3690 images for training, 211 images for validation, and 115 images for final testing.
The model was trained on Google Colab Pro (Google LLC, Mountain View, CA, USA), which offers a T4 GPU, the Python programming language, and ample RAM resources. Hyperparameters, such as the learning rate, batch size, and epochs, were fine-tuned based on the model’s performance during training and validation. For the YOLOv8 model and an image size of 640 × 640 pixels, the optimal learning rate, batch size, and number of epochs were 0.01, 16, and 100, respectively. These values were determined through trial and error for an optimal balance between accuracy and training efficiency.
Upon completion of training, the custom-trained weights were saved in the training path. These weights were adjusted during optimization to minimize the disparity between predicted outputs and actual outputs in the training data. The final weight values were used for predictions on the selected set of test images. The prediction involved classifying and rating the apartment complex components in the given images using the trained model.
The general trend of the loss plot was a consistent decrease, suggesting that the training model learned and improved its performance over time. Figure 7 shows the validation loss values plotted against the number of epochs. Validation loss, which measures the model performance on a validation dataset, is an indicator of generalization to unseen data. The validation loss plays a crucial role in tuning hyperparameters such as the learning rate, epochs, and batch size, and helps to prevent overfitting (training loss decreases, but validation loss increases) and underfitting (both training loss and validation loss are high). During validation, the segmentation loss and DFL loss first decreased and then increased after a certain number of epochs. In general, a trend wherein the loss first decreases and then increases after a certain interval indicates overfitting. However, the mAP50 and mAP50-95 values also increased after a certain number of epochs. Hence, this was not considered typical overfitting [40]. The factors influencing these results were then analyzed based on the evaluation metrics of the model.

4.2. Evaluation

4.2.1. Evaluation Matrix

Several common metrics for object detection and image segmentation, including precision (P), recall (R), and mAP, were used to evaluate the trained models on test data [24,41]. The mAP—map50 in particular—was used as the main evaluation metric. The mAP was derived from the intersection over union (IoU), or Jackard index, which represents the average of the precision values at various recall levels for a specific IoU threshold. The IoU measures the similarity between two regions and is defined as the ratio of intersection to union of the two regions. It is a dimensionless value, representing a proportion. Precision and recall values are pivotal metrics for evaluating classification model performance, as they are both dimensionless values that indicate the proportion of correct identifications. Precision indicates the fraction of correctly identified objects within the apartment complex and thus quantifies the accuracy of the apartment complex component detection algorithm. Recall represents the fraction of objects within the apartment complex that the algorithm has successfully detected. The IoU, precision, and recall are calculated as follows:
I o U A , B = | A B | | A B |
P r e c i s i o n P = T P T P + F P
R e c a l l R = T P T P + F N
In these equations, TP stands for true positive and refers to the number of positive cases correctly detected as positive. FP stands for false positive and is the number of negative cases incorrectly identified as positive. FN stands for false negative and refers to the number of positive cases incorrectly classified as negative. TN stands for true negative and is the number of negative instances accurately predicted as negative.
In general, the average precision (AP), as shown in Equation (4), for an individual class is ascertained by sorting the model’s predictions according to their confidence scores and subsequently calculating the area under the precision–recall curve. This process also yields a dimensionless value that measures the model’s accuracy at different thresholds of detection confidence, as follows:
A P = k = 0 n 1 R e c a l l k R e c a l l k + 1 × P r e c i s i o n s k
The mAP serves as a metric that measures the precision and recall of object localization and segmentation. It assesses the accuracy across various levels of IoU thresholds and evaluates the alignment of predicted bounding boxes or segmentation masks with the ground-truth annotations, as follows:
m A P = 1 N i = 1 N A P i
Herein, N represents the number of classes or categories, and APi denotes the AP for class i. IoU is the most widely used metric for assessing bounding box regression. The IoU for the bounding boxes and masks is calculated as follows:
B o x I o U = | B P r B G T | | B P r B G T |
M a s k I o U = | M P r M G T | | M P r M G T |
In Equation (7), Pr and GT denote the prediction and ground truth, respectively. mAP50 denotes the AP when the IoU threshold is set to 0.5. At this threshold, a detection is considered a true positive if the IoU between the predicted and ground-truth masks is greater than or equal to 0.5.
The evaluation metrics used in this study included IoU, precision, recall, and mean average precision (mAP). These metrics are crucial for assessing how accurately the model identifies and classifies components of the apartment complexes. IoU measures how well the predicted bounding boxes align with the actual boundaries, while precision and recall indicate the model’s ability to correctly identify actual objects. These metrics ensure the reliability of the results and objectively assess the model’s performance.

4.2.2. Testing Results

In this study, models based on the YOLOv8s-seg model were trained to analyze components of the apartment complex. The trained model displayed a form similar to overfitting from a certain epoch onward. To understand this behavior, the evaluation results for each class were compared. The model evaluation was divided into assessments for boxes and masks. The precision, recall, mAP at a threshold of 0.5, and mAP in the threshold range of 0.5 to 0.95 for each variable were examined, and the evaluation results for each class were obtained.
The evaluation results, listed in Table 3, indicate that the overall performance across all classes is high. Apart from the classes of vehicle roads and welfare facilities, the model exhibited high performance in detecting and segmenting objects. The precision and recall values for the classes from main buildings to above-ground parking lots were all greater than 0.8; however, for vehicle roads, the precision values were close to 0.6 and recall values were close to 0.5. For welfare facilities, the precision and recall values were close to 0.7 and 0.6, respectively. The mAP values for the class’s vehicle roads and welfare facilities were lower than those of other classes. This implies that the model trained in this study has low performance in detecting objects in two classes, which could degrade the overall performance of the model and might have led to an increase in validation loss after a certain number of epochs. We then analyzed the cause of the increase in validation loss by testing the model for predictions on images that were not included in the training set.

5. Results and Discussion

In this study, a model based on YOLOv8s-seg was trained to analyze apartment complex components, and the model’s performance was evaluated. The results indicated that the detection performance for vehicle roads and welfare facilities was lower. The reasons for this lower performance were analyzed using images that were not included in the dataset.
Figure 8 shows the prediction results of the model, wherein the predicted values for each class are marked along with the shaded images. The main buildings, underground parking entrances, complex boundaries, outdoor spaces, and above-ground parking lots in all three apartment complex examples were predicted with over 90% accuracy. However, vehicle roads were predicted only partially in two complexes. The prediction of vehicle roads in the third complex was better owing to their simplicity; nonetheless, the values were relatively low despite accurate location predictions. Welfare facilities were predicted with relatively high values of approximately 80%. However, the shapes of the welfare facilities differ from those of the main buildings, and the shapes within a single complex are not consistent owing to the diverse nature of welfare facilities in apartment complexes. Moreover, the welfare facilities were located at the complex boundary and were placed adjacent to vehicle roads for user convenience, which led to lower detection rates in this model.
To optimize the performance of this model, several strategies can be implemented, including hard example mining, class weight adjustment, and ensemble methods. Hard example mining focuses on intensive training with examples prone to frequent errors, particularly within classes, such as vehicle roads and welfare facilities, that exhibit lower performance. This method aims to enhance the model’s ability to accurately handle challenging instances. Class weight adjustment involves assigning higher weights to specific classes within the loss function during model training. This approach effectively mitigates issues stemming from imbalanced class distributions in the dataset, ensuring more equitable learning across all classes. Ensemble methods offer another avenue by combining predictions from multiple models to yield more robust outcomes. By integrating the strengths of diverse models, this technique enhances overall performance and fosters greater predictive accuracy and reliability.

6. Conclusions

6.1. Summary

In this study, we collected layout data from Korean apartment complexes using a map API and created a model capable of analyzing apartment complex components based on the YOLOv8s-seg model. The results of the evaluation of the model showed that the overall segmentation performance of the model was relatively high at above 0.8 for both the box and mask. The detection performance was generally high except for vehicle roads and welfare facilities. This is likely because, although the information provided by the map API can help to identify the apartment complex components, it is insufficient for the detection of distinct boundaries and features for complex classes such as vehicle roads and welfare facilities. An optimal algorithm that improves the detection performance for imbalanced classes, such as vehicle roads, by increasing the weights for undetected classes, is necessary to overcome the limitations of the model proposed in this study.
Current research that applies deep learning to architecture is limited to simple elements such as floor plans. In contrast, this study represents the first attempt to analyze Korean apartment complexes, which contain complex elements, using deep learning. Big data on apartment complexes can facilitate the construction of efficient circulation systems within the complexes, enhance the utilization of outdoor spaces, and ensure the appropriate locations of main buildings. The model developed in this study for analyzing the layouts of Korean apartment complexes can serve as a basis for research using big data on apartment complexes. Through this, the analysis model presented herein will enable the examination of spatial components in apartment complex types that reflect the demands of residents. Furthermore, for newly constructed apartment complexes, it is envisioned that a foundation for a program capable of automatically recommending the placement of main buildings and outdoor spaces that align with site conditions at the architectural planning stage can be established. Employing a method that utilizes deep learning for architectural planning analysis is expected to secure temporal efficiency and ensure objectivity in the analysis approach. Future research should examine the architectural planning of apartment complexes. Such studies can include segmenting Korean apartment complexes to distinguish their components, analyzing the layout of main buildings, and classifying the complexes based on different periods, the number of households, and regional land shapes. The results of such studies can contribute significantly to the discourse on urban planning and socio-cultural dynamics in Korea.

6.2. Limitations

This study acquired a dataset of layout drawings through maps, a significant achievement considering the challenges in obtaining the actual completion blueprints of apartment complexes. However, a limitation of this study lies in the discrepancies between the mapped layouts and the actual blueprints, which can introduce errors in the analysis. Moreover, the use of a specific map API may pose challenges in classification when different input data sources, such as Google Maps, are considered. Nevertheless, this methodology enables architectural planning analysis, thereby adding substantial value to the research. Furthermore, future studies could enhance classification models for various types of complexes by comparing alternative deep learning or classification methods beyond the YOLOv8s-cls model, utilizing the dataset utilized in this study as a foundation.

Author Contributions

Conceptualization, S.-B.Y. and S.-E.H.; methodology, S.-B.Y.; software, S.-B.Y.; validation, S.-E.H.; formal analysis, S.-B.Y. and B.S.K.; investigation, S.-B.Y. and S.-E.H.; resources, S.-B.Y.; data curation, S.-B.Y.; writing—original draft preparation, S.-B.Y. and S.-E.H.; writing—review and editing, S.-B.Y. and S.-E.H.; visualization, S.-B.Y.; supervision, S.-E.H. and B.S.K.; project administration, S.-E.H. and B.S.K.; funding acquisition, B.S.K. All authors have read and agreed to the published version of the manuscript.

Funding

This study was supported by the Research Program funded by SeoulTech (Seoul National University of Science and Technology).

Data Availability Statement

The original contributions presented in the study are included in the article, further inquiries can be directed to the corresponding author.

Conflicts of Interest

The authors declare no conflict of interest.

References

  1. Kang, B.S.; Kang, I.H.; Park, G.J.; Park, I.S.; Park, C.S.; Baek, H.S.; Lee, G.I. History of Korean Apartment Housing Planning; Land and Housing Research Institute: Seoul, Republic of Korea, 1999. [Google Scholar]
  2. Kang, B.S.; Kang, I.H.; Park, G.J.; Park, I.S. Housing Design; Land and Housing Research Institute: Seoul, Republic of Korea, 2010. [Google Scholar]
  3. Byun, N.; Choi, J. A typology of Korean housing units: In search of spatial configuration. J. Asian Archit. Build. Eng. 2016, 15, 41–48. [Google Scholar] [CrossRef]
  4. Park, T.D. A Study on the Composition of Outdoor Spaces for Community Formation within Apartment Complexes. Master’s Thesis, Seoul National University of Science and Technology, Seoul, Republic of Korea, 2006. [Google Scholar]
  5. Ryu, S.-M.; Hyun, C.-Y. Analysis of spatial structure for outdoor space according to the changes of pedestrian environment in the apartment complex by period. KIEAE J. 2023, 23, 77–83. [Google Scholar] [CrossRef]
  6. Song, H.M.; Kang, B.S.; Yoon, S.B.; Hwang, S.E. An analysis of resident satisfaction based on types of external spaces in apartment. KIEAE J. 2023, 23, 23–32. [Google Scholar] [CrossRef]
  7. Royal Institute of British Architects (RIBA). RIBA AI Report 2024; Royal Institute of British Architects (RIBA): London, UK, 2023. [Google Scholar]
  8. Jang, S.C.; Kim, C.Y. A Study on the Characteristics of Planning and Design of External Environment in Apartment House. Urban Des. 2022, 21, 5–18. [Google Scholar]
  9. Seo, H.; Raut, A.D.; Chen, C.; Zhang, C. Multi-label classification and automatic damage detection of masonry heritage building through CNN analysis of infrared thermal imaging. Remote Sens. 2023, 15, 2517. [Google Scholar] [CrossRef]
  10. Liu, L.; Ouyang, W.; Wang, X.; Fieguth, P.; Chen, J.; Liu, X.; Pietikäinen, M. Deep learning for generic object detection: A survey. arXiv 2018, arXiv:1809.02165. [Google Scholar] [CrossRef]
  11. Redmon, J.; Divvala, S.; Girshick, R.; Farhadi, A. You only look once: Unified, real-time object detection. arXiv 2015, arXiv:1506.02640. [Google Scholar] [CrossRef]
  12. Liu, X.; Deng, Z.; Yang, Y. Recent progress in semantic image segmentation. Artif. Intell. Rev. 2019, 52, 1089–1106. [Google Scholar] [CrossRef]
  13. Salvador, A.; Bellver, M.; Campos, V.; Baradad, M.; Marques, F.; Torres, J.; Giro-i-Nieto, X. Recurrent neural networks for semantic instance segmentation. arXiv 2017, arXiv:1712.00617. [Google Scholar] [CrossRef]
  14. Long, J.; Shelhamer, E.; Darrell, T. Fully convolutional networks for semantic segmentation. In Proceedings of the 2015 IEEE Conference on Computer Vision and Pattern Recognition (CVPR), Boston, MA, USA, 7–12 June 2015; pp. 3431–3440. [Google Scholar] [CrossRef]
  15. Ronneberger, O.; Fischer, P.; Brox, T. U-Net: Convolutional networks for biomedical image segmentation. In Proceedings of the Medical Image Computing and Computer-Assisted Intervention—MICCAI 2015, Munich, Germany, 5–9 October 2015; Navab, N., Hornegger, J., Wells, W.M., Frangi, A.F., Eds.; Springer International Publishing: Cham, Switzerland; pp. 234–241. [Google Scholar] [CrossRef]
  16. Chen, L.-C.; Papandreou, G.; Kokkinos, I.; Murphy, K.; Yuille, A.L. DeepLab: Semantic image segmentation with deep convolutional nets, atrous convolution, and fully connected CRFs. IEEE Trans. Pattern Anal. Mach. Intell. 2018, 40, 834–848. [Google Scholar] [CrossRef] [PubMed]
  17. Zhao, H.; Shi, J.; Qi, X.; Wang, X.; Jia, J. Pyramid scene parsing network. In Proceedings of the 2017 IEEE Conference on Computer Vision and Pattern Recognition (CVPR), Honolulu, HI, USA, 21–26 July 2017; pp. 6230–6239. [Google Scholar] [CrossRef]
  18. Badrinarayanan, V.; Kendall, A.; Cipolla, R. SegNet: A deep convolutional encoder-decoder architecture for image segmentation. IEEE Trans. Pattern Anal. Mach. Intell. 2017, 39, 2481–2495. [Google Scholar] [CrossRef] [PubMed]
  19. He, K.; Gkioxari, G.; Dollar, P.; Girshick, R. Mask R-CNN. In Proceedings of the 2017 IEEE International Conference on Computer Vision (ICCV), Venice, Italy, 22–29 October 2017; pp. 2980–2988. [Google Scholar] [CrossRef]
  20. Ren, S.; He, K.; Girshick, R.; Sun, J. Faster R-CNN: Towards real-time object detection with region proposal networks. IEEE Trans. Pattern Anal. Mach. Intell. 2017, 39, 1137–1149. [Google Scholar] [CrossRef]
  21. COCO. Common Objects in Context. 2019. Available online: https://cocodataset.org/#home (accessed on 8 January 2020).
  22. Sapkota, R.; Ahmed, D.; Karkee, M. Comparing YOLOv8 and Mask RCNN for object segmentation in complex orchard environments. Qeios 2023. [Google Scholar] [CrossRef]
  23. Ameli, Z.; Nesheli, S.J.; Landis, E.N. Deep learning-based steel bridge corrosion segmentation and condition rating using Mask RCNN and YOLOv8. Infrastructures 2023, 9, 3. [Google Scholar] [CrossRef]
  24. Dumitriu, A.; Tatui, F.; Miron, F.; Ionescu, R.T.; Timofte, R. Rip current segmentation: A novel benchmark and YOLOv8 baseline results. In Proceedings of the 2023 IEEE/CVF Conference on Computer Vision and Pattern Recognition Workshops (CVPRW), Vancouver, BC, Canada, 17–24 June 2023; pp. 1261–1271. [Google Scholar] [CrossRef]
  25. Ahn, E.S. Deep Learning Based Spatial Analysis Method for Korean Apartment Unit Plans. Doctoral Thesis, Seoul National University, Seoul, Republic of Korea, 2021. [Google Scholar]
  26. Choo, S.Y.; Seo, J.H.; Park, H.J.; Ku, H.M.; Lee, J.K.; Kim, K.T.; Park, S.H.; Kim, J.S.; Song, J.Y.; Lee, S.H.; et al. AI-Based Architectural Design Automation Technology Development; Korea Agency for Infrastructure Technology Advancement: Seoul, Republic of Korea, 2020. [Google Scholar]
  27. K-apt. Available online: http://www.k-apt.go.kr/cmmn/main.do (accessed on 23 October 2023).
  28. Kakaomap. Available online: https://map.kakao.com/ (accessed on 23 October 2023).
  29. Google Maps. Available online: https://www.google.com/maps/?hl=ko (accessed on 23 October 2023).
  30. Yoon, S.-B.; Hwang, S.-E.; Kang, B.S.; Lee, J.H. An analysis of South Korean apartment complex types by period using deep learning. Buildings 2024, 14, 776. [Google Scholar] [CrossRef]
  31. Roboflow. Available online: https://roboflow.com/ (accessed on 20 December 2023).
  32. Shorten, C.; Khoshgoftaar, T.M. A survey on image data augmentation for deep learning. J. Big Data 2019, 6, 60. [Google Scholar] [CrossRef]
  33. Wang, S.; Yang, Y.; Wu, Z.; Qian, Y.; Yu, K. Data augmentation using deep generative models for embedding based speaker recognition. IEEE/ACM Trans. Audio Speech Lang. Process. 2020, 28, 2598–2609. [Google Scholar] [CrossRef]
  34. Myung, H.-J.; Song, J.-W. Deep learning-based poultry object detection algorithm. J. Digit. Content Soc. 2022, 23, 1323–1330. [Google Scholar] [CrossRef]
  35. Ultralytics. YOLOv8. Available online: https://docs.ultralytics.com/ko/models/yolov8/#overview (accessed on 21 December 2023).
  36. Ultralytics. Available online: https://github.com/ultralytics/ultralytics (accessed on 21 December 2023).
  37. Harkal, S. Image Classification with YOLOv8, Medium. Available online: https://sidharkal.medium.com/image-classification-with-yolov8-40a14fe8e4bc (accessed on 21 December 2023).
  38. Zheng, Z.; Wang, P.; Liu, W.; Li, J.; Ye, R.; Ren, D. Distance-IoU Loss: Faster and better learning for bounding box regression. In Proceedings of the AAAI Conference on Artificial Intelligence, New York, NY, USA, 7 February 2020; Volume 34, pp. 12993–13000. [Google Scholar] [CrossRef]
  39. Li, X.; Wang, W.; Wu, L.; Chen, S.; Hu, X.; Li, J.; Tang, J.; Yang, J. Generalized focal loss: Learning qualified and distributed bounding boxes for dense object detection. Adv. Neural Inf. Process. Syst. 2020, 33, 21002–21012. [Google Scholar]
  40. Increase in val/seg_loss and val/dfl_loss (Segmentation), Issue #2136, Ultralytics/Ultralytics, GitHub. Available online: https://github.com/ultralytics/ultralytics/issues/2136 (accessed on 21 December 2023).
  41. Padilla, R.; Netto, S.L.; Da Silva, E.A.B. A survey on performance metrics for object-detection algorithms. In Proceedings of the 2020 International Conference on Systems, Signals and Image Processing (IWSSIP), Niterói, Brazil, 1–3 July 2020; pp. 237–242. [Google Scholar] [CrossRef]
Figure 1. Workflow of the proposed methodology.
Buildings 14 02306 g001
Figure 2. Example of address input and output in the map API.
Buildings 14 02306 g002
Figure 3. Apartment complex dataset obtained using maps: (a) example of map source data; and (b) example of map image labeling according to class distribution.
Buildings 14 02306 g003
Figure 4. An example of data augmentation.
Buildings 14 02306 g004
Figure 5. Performance benchmark of the YOLO model [3].
Buildings 14 02306 g005
Figure 6. YOLOv8 architecture.
Buildings 14 02306 g006
Figure 7. Various performance metrics as a function of the number of epochs for the YOLOv8 model (X-axis: Epochs, Y-axis: Corresponding to Label after ‘/’ in Legend).
Buildings 14 02306 g007
Figure 8. Example prediction results of the apartment complex component analysis model: (a) source data of apartment complexes not used in training; (b) prediction results without labeling; and (c) prediction results including labeling and prediction accuracy.
Buildings 14 02306 g008
Table 1. Operations implemented on the dataset.
Techniques UsedValue
FlippingHorizontal, vertical
Grayscale25% of images
SaturationBetween −25% and +25%
BrightnessBetween −25% and +25%
Table 2. Comparison of performance of different YOLO models for apartment complex analysis.
No.ModelParameters (Millions)GFLOPsInference Time (ms)PrecisionRecall[email protected]mAP
@0.5:0.95
1YOLOv57.426.011.90.8170.7720.7830.534
2YOLOv737.9142.731.00.8310.7920.8030.573
3YOLOv811.842.517.10.8250.8140.8320.623
Image size: 640 × 640; learning: 0.01; momentum: 0.937; decay: 0.0005; batch: 8; epoch: 10
Table 3. Object instance segmentation performance of YOLOv8s-seg model on the testing dataset (precision, recall, [email protected], and [email protected]:0.95).
No.ClassBoxMask
PrecisionRecall[email protected]mAP@
0.5:0.95
PrecisionRecall[email protected]mAP@
0.5:0.95
1Apartment0.9470.9500.9640.9300.9520.9550.9700.886
2Basement entry0.8440.9170.8790.7220.8400.9140.8760.637
3Boundary0.9840.9810.9800.9680.9610.9580.9420.713
4Outdoor space0.9140.8670.8950.8360.9170.8700.9040.780
5Parking lot0.8330.8670.8460.6670.8340.8680.8490.589
6Vehicle road0.6460.5470.5530.3910.6340.5360.5260.297
7Welfare0.7510.6600.7440.6010.7570.6660.7500.530
All0.8450.8270.8370.7310.8420.8240.8310.633
Image size: 640 × 640; learning: 0.01; momentum: 0.937; decay: 0.0005; batch: 16, epoch: 100
Disclaimer/Publisher’s Note: The statements, opinions and data contained in all publications are solely those of the individual author(s) and contributor(s) and not of MDPI and/or the editor(s). MDPI and/or the editor(s) disclaim responsibility for any injury to people or property resulting from any ideas, methods, instructions or products referred to in the content.

