Abstract
The ground motion in the near-fault region of an earthquake is characterized by exceptional energy levels, powerful velocity impulses, substantial spatial variability, and notable permanent displacement. These unique attributes can dramatically escalate structural damage. Steel truss arch bridges, being critical components of transportation networks, are particularly vulnerable to these phenomena due to their extensive stiffness spans. Such factors are difficult to accurately simulate. In this study, real near-fault ground motions that incorporate spatial variability effects and pulse effects are used to excite the long-span arch bridge, thereby striving to realistically reproduce the structural damage sustained by the bridge under the simultaneous influence of near-fault spatial variability and pulse effects. This study adopts an arch bridge with a span closely approximating the spacing between stations (200 m) of the SMART seismic array as a case study. The near-fault ground motions, characterized by spatial variability and captured by the array, are selected as seismic samples, while the far-field ground motions recorded by the same array serve as a comparative reference. The seismic excitations are then input into the bridge case study, following the spatial correspondence of the stations, using a large-scale finite element program to obtain the structural response. Upon analyzing the seismic response of crucial positions on the bridge, it became evident that the arch foot of the bridge is more susceptible to the spatial variability in near-fault ground motion, whereas the vault experiences a greater impact from the high-energy velocity pulse. Specifically, under nonuniform seismic conditions, the internal force at the base of the bridge arch increased significantly, averaging a rise of 18.69% compared to uniform excitation conditions. Conversely, the displacement and internal force response at the top of the arch exhibited more modest increases of 6.48% and 10.33%, respectively. Under nonuniform excitation, the vault’s response to near-fault earthquakes increased by an average of 20.35% com-pared to far-field earthquakes, while the arch foot’s response rose by 11.55%. In contrast, under uniform excitation, the vault’s response to near-fault earthquakes was notably higher, increasing by 25.04%, while the arch foot’s response showed a minor increase of only 2.28%. The study has revealed significant differences in the sensitivity of different parts of long-span arch bridges to near-fault earthquake characteristics. This finding is of great importance for understanding the behavior of long-span arch bridges under complex earthquake conditions. Specifically, the arch foot of the bridge is more sensitive to the spatial variability of near-fault ground motions, while the arch crown is more significantly affected by high-energy velocity pulses, providing new insights for bridge seismic design. Furthermore, the differences in response between the arch crown and arch foot under different earthquake excitations also reveal the complexity and diversity of bridge structural responses.
1. Introduction
Near-fault ground motion is a hazardous type of ground motion. Earthquakes have demonstrated that large structures in near-fault areas are at high risk of seismic damage [1,2], and erecting large structures in near-fault zones is mostly avoided to minimize the impact of faults [3]. Because of the expansion of transportation industries, major routes are being extended into remote areas. However, because of the need to connect these areas and limitations related to route selection, coupled with the imprecision of fault-location technology, large-scale transportation projects are at risk of being exposed to seismic shocks near faults [4,5]. The near-fault region of an earthquake is a concentrated area of seismic damage, where large civil engineering structures are likely to be affected by the energy pulses of near-fault ground motion, permanent displacement, and other factors, resulting in damage [6,7,8].
To ensure the seismic safety of these vital bridges, numerous probabilistic seismic demand analyses (PSDAs) have been proposed in recent times, exhibiting excellent performance in the seismic analysis of crucial infrastructure projects. Fractional Order Intensity Measures (FOIMs) represent a novel class of intensity measures specifically designed for PSDAs in earthquake engineering [9]. Unlike traditional intensity measures such as Peak Ground Acceleration (PGA), Peak Ground Velocity (PGV), or Spectral Acceleration (Sa) at specific periods, FOIMs take into account the fractional-order characteristics of ground motion signals. This means that the statistical properties and dynamic behavior of ground motions are influenced not only by integer-order derivatives, but also by fractional-order derivatives. Typically, FOIMs involve fractional integration or differentiation of ground motion signals to extract parameters that better capture the unique characteristics of seismic excitations. These parameters are then utilized as intensity measures to evaluate the structural response and damage under earthquake loading. When it comes to assessing the seismic vulnerability of critical bridge structures, FOIMs demonstrate superior performance. They can be seamlessly integrated with various advanced technologies to overcome the limitations inherent in traditional evaluation metrics. By considering the fractional-order nature of ground motions, FOIMs provide a more nuanced and accurate representation of seismic hazard [10], enabling engineers to design bridges that are better equipped to withstand earthquakes and minimize potential damage [11].
Transport arteries connect remote areas, but major transportation projects often require crossing large obstacles. The seismic performance assessment of transportation networks heavily relies on the critical bridge engineering components within them. The literature presents a thorough overview of case studies, experiments, and analytical and numerical investigations, as well as seismic design codes pertaining to fault-crossing bridges. It reveals that 38 major bridges sustained damage in fault-crossing zones during significant earthquakes, including the 1906 San Francisco, California earthquake, the 1999 Kocaeli (Izmit), Turkey earthquake, the 1999 Chi-Chi, Taiwan earthquake, the 1999 Duzce, Turkey earthquake, and the 2008 Wenchuan, China earthquake. Additionally, it identifies over 147 large bridges located in potential fault-crossing regions across the United States, China, France, Greece, and New Zealand [12]. With the proliferation of fault-crossing bridges, statistical analyses of their damage have been extensively studied by many scholars. Taking the bridges damaged by fault effects during the 1999 Chi-Chi earthquake as an illustrative example, some researchers have reconstructed their failure processes [13]. Numerical findings indicate that structural responses and collapse mechanisms were predominantly influenced by low-frequency ground motions, with the significant static offset across the fault being the primary cause of collapse for simply supported bridges. However, the scarcity of high-quality simulation cases for seismic damage assessment of such fault-crossing bridges, coupled with the multitude of influencing factors [5,14] and the inherent difficulties in earthquake simulation [15], poses significant challenges to the conduct of comprehensive seismic damage analyses for these structures.
Large-span steel truss arch bridges have become a popular choice due to their excellent spanning capability and economic performance, and they have been widely constructed in mountainous areas in recent years [16,17]. Near-fault ground motion is considered an extremely hazardous class of ground motions [18].
Near-fault ground motion encompasses numerous crucial characteristics, including high-energy velocity pulses, rapid pulses, significant spatial variability, permanent displacement, high energy levels, and nonuniform ground motion. High-energy velocity pulses are the hallmark of this seismic activity, unleashing immense forces within a brief timeframe. These swift pulses, when combined with the spatial variability stemming from the intricate geological conditions proximate to the fault, can lead to drastic alterations in ground motion over extremely short distances [19]. Permanent displacement, another pivotal feature, refers to the enduring deformation of the Earth’s surface induced by earthquakes. Given the inherent high stiffness of steel truss arch bridges, they are highly susceptible to structural damage under significant surface permanent deformation. The high-energy nature of near-fault ground motion rapidly inputs seismic energy into bridge structures, potentially causing damage to long-span structures.
The combined effects of these factors in near-fault ground motion pose potential seismic hazards to large-span steel truss arch bridges. Notably, the simultaneous occurrence of velocity pulses and spatial variability effects may lead to coupling, resulting in even more intricate damage mechanisms. Therefore, it is imperative to pay special attention to the seismic damage of steel truss arch bridges subjected to both pulse effects and spatial variability effects [20].
Several researchers have studied this problem. Bridge structures are affected by different catastrophic mechanisms due to high-energy velocity impulses and the relatively large spatial permanent displacements with near-fault ground motions [21]. The seismic responses of bridge structures to long-period impulses and permanent displacements are examined from the following three perspectives: theoretical, experimental, and engineering. From the theoretical side, the seismic responses of bridges are mostly calculated on the basis of numerical simulations, and some scholars have carried out detailed studies on the response patterns of fault locations [6], permanent ground displacements [22], impulse amplitudes, vertical ground motions, and other multi-parameters of simply supported/continuously rigid-frame bridge beams [23,24]. Numerical simulations of the entire process of damage to typical bridges caused by the Kocaeli earthquake [12] and the Chi-Chi earthquake [25,26,27] have been performed by scholars. These simulations analyzed the damage patterns and collapse mechanisms, and when compared to the actual earthquake damage, it was discovered that the permanent displacement in the near-fault region significantly increases the displacement demand of the seismic isolation system. This can result in the destruction of the bearings and lead to falling girder accidents. Xiang and other scholars investigated problems in the seismic performance of lead-core rubber bearings during near-fault ground motion [28]. They conducted a seismic table test on a two-span simply supported girder bridge and found that the bearings can effectively balance permanent displacement during near-fault earthquakes using their own deformation. This, in turn, reduces the displacement of the main girder and abutment, thereby decreasing the probability of the occurrence of the superstructure’s girder falling. Lin [29,30] studied the structural responses of steel-tube concrete continuous rigid bridges to seismic activity caused by backlash faults using seismic platform tests. The results indicate significant differences in the abutment force mode between the two sides of the bridge, with the main damage mode being the collapse of the concrete due to the steel plate yielding at the abutment. There are various strategies available to deal with damage to a main bridge in a near-fault region. Because of the complexity of the ground motion and the severity of damage in this region, many countries prefer an avoidance strategy. This involves avoiding the fault by a certain distance based on the estimated level of the possible earthquake [31]. However, because of technological limitations, some bridges must be built close to a fault [32]. In this context, the bridge’s vibration isolation technology or the structure’s nonlinear deformation is often used to coordinate the permanent displacement in the near-fault region. For instance, for the Rion-Antirion Bridge in Greece [33] and the Haiwen Bridge in China [34], numerous vibration isolation devices and a floating system were adopted during the design to reduce the impact of permanent displacement. For small- and medium-span bridges, the safety of the main girders is ensured by the use of blocks, cable ties, and other structures that prevent the girders from falling. A “multilevel protection, hierarchical damage” design approach is employed to minimize the impacts of the velocity impulse and permanent displacement of near-fault ground motion. For long-span bridges, there is a particular emphasis on utilizing health monitoring methods to assess the impact of factors such as fault zones on the arch ribs and to identify structural damage. Xiao et al.’s research addresses the challenges of sensor placement difficulties and structural damage identification in large-scale structures [35,36]. They optimized the process from the perspective of intelligent algorithms and achieved significant results [37].
In summary, ground motion in the vicinity of faults exhibits several critical features, including high-energy velocity pulses, spatial variability, and permanent displacement. Presently, the majority of research focuses on the impact of high-energy velocity pulses and spatial variability on small- to medium-span single/continuous girder bridges, for which exist clear cases of seismic damage. Seismic station tests and numerical simulations are also extensively used. However, research on large bridges, particularly large arch bridges, is relatively limited. Arch bridges with large spans are critical components of transportation networks. Damage to these bridges can lead to the interruption of transportation lines. Additionally, most arch bridges have large stiffness values, making them highly susceptible to damage caused by high-energy velocity pulses and permanent displacements in near-fault ground motions.
Previous studies have rarely considered both near-fault ground motion and nonuniform effects simultaneously, and most methods for accounting for spatial variability rely on time-interval analysis, which may lead to deviations from the actual seismic damage caused by nonuniform effects. In response to this, this paper utilizes near-fault ground motions containing both spatial variability and pulse effects, collected by seismic arrays, to excite a long-span steel truss arch bridge. This approach aims to accurately simulate the structural damage of the bridge under near-fault ground motion conditions.
In an effort to accurately simulate the impact of real near-fault ground motions on large-span arch bridges located in fault zones, this study employed near-fault ground motions collected by the SMART seismic array, characterized by significant spatial variability, as seismic excitations. Far-field ground motions recorded by the same array served as a comparative control. Using an arch bridge with a span (228 m) approximating the spacing between stations (200 m) within the array as a case study, this research conducted a detailed analysis of the seismic response at critical locations on the bridge. The study quantitatively revealed the impacts of spatial variability and near-fault velocity pulses on the structural performance of long-span steel truss arch bridges.
This paper examines the effects of both spatial variability and velocity pulses on steel truss arch bridges, contributing to a deeper understanding of their impact on the structural performance of long-span steel truss arch bridges. It provides valuable reference information for bridge engineers and seismic designers. Furthermore, the method used in this paper, which accounts for spatial variability and pulse effects in near-fault regions, can more accurately simulate the impact of real near-fault ground motions on long-span arch bridges located in fault zones. This provides important data support for assessing and improving the seismic performance of such bridges. In summary, this research not only fills the gap in the study of large bridges, especially long-span arch bridges, under near-fault ground motions, but also provides important scientific evidence for enhancing the seismic performance of such bridges and ensuring the stable operation of transportation networks.
This paper is divided into five sections. The first section is the Introduction, which primarily highlights the unique characteristics of near-fault ground motions and their potential to inflict more severe seismic damage on steel truss arch bridges. The second section, Seismic Samples, details the near-fault and non-near-fault ground motion samples used in this study, all sourced from the SMART seismic array. Specifically, the 1986 Hualien earthquake and the offshore Hualien earthquake are selected as representative near-fault and non-near-fault samples, respectively. The third section, Bridge Case Study, introduces the bridge case utilized in this research. Given that the spacing between stations within the inner circle of the SMART seismic array is 200 m, the selected arch bridge case has a main span of 228 m, closely approximating this distance. This section also outlines the process of establishing the finite element model and the selection of element and material constitutive relationships. The fourth section, Bridge Structural Damage under Nonuniform Excitation, investigates the impact of near-fault ground motions on arch bridge damage when considering spatial variability. By exciting the arch bridge case with near-fault and non-near-fault ground motions collected by the SMART seismic array, this section quantitatively demonstrates the increased damage to the bridge structure under near-fault ground motions when spatial variability is taken into account. Finally, the fifth section, Bridge Structural Damage under Uniform Excitation, analyzes the effects of near-fault effects and spatial variability on the seismic damage of steel truss arch bridges without considering spatial variability effects. By inputting near-fault and non-near-fault ground motions into the structure separately, this section separately identifies the contributions of near-fault effects and spatial variability effects to the seismic damage of steel truss arch bridges.
2. Sample of Near-Fault Ground Motion
Near-fault ground motions are a type of ground motion with high seismic energy and rapid waveform changes. Based on the analysis of multiple typical near-fault ground motions, it is observed that the pulse energy of near-fault ground motions is concentrated within a relatively short time window compared to the overall earthquake duration [38], resulting in significant variations in instantaneous power spectra and being notably influenced by rupture velocity, focal depth, and station location [39]. Moreover, more complex near-fault ground motions may contain multiple velocity pulses, where the period of these pulses is not only related to their amplitude but also to the fault type [1]. The high-energy velocity pulses of these motions can cause damage to large structures that experience significant shocks within a short period of time. The drastic changes in the ground motion waveforms during propagation can cause uneven excitation of each pivot point of a large structure, resulting in a significant internal force response by the structure. This study used the classical Baker identification method to identify the near-fault ground motion based on the local focusing characteristics of wavelets, which can efficiently identify high-energy velocity pulses. Velocity pulses extracted using the wavelet technique are more complete, and their duration and amplitude can be adjusted effectively.
This study aimed to realistically reconstruct the seismic response of a large-span steel truss arch bridge under near-fault ground motions. To achieve this, the study selected ground motion records from the SMART array located in Taiwan, which has been in operation since 1980. The seismic array is high-density and comprises a central station and 36 arrays evenly distributed in concentric circles with radii of 2000 m, 1000 m, and 200 m (as shown in Figure 1). All stations are located under the same site conditions and record with the same type of recording instruments. This is important for the study of strong earthquakes in a small area.

Figure 1.
Location of SMART array stations.
The PEER seismic database includes five earthquake records from this array. Among them, the Hualien earthquake, recorded on 30 July 1986, displayed typical near-fault ground motion. For comparison, the 7.3-magnitude earthquake that occurred off Hualien on 14 November 1986 was selected. The SMART array is not located in the near-fault region of the earthquake, so the record is of non-near-fault ground motion. Table 1 lists the ground motions and samples of the seismic records.

Table 1.
Ground motion samples.
To further analyze seismic inputs, this paper proceeds to present the seismic acceleration response spectra under damping ratios of 0.05 and 0.03 (Figure 2, Figure 3, Figure 4 and Figure 5 and Table 2). Based on these acceleration response spectra, the Effective Peak Acceleration (EPA) is calculated using the formula outlined in Equation (1).

Figure 2.
Acceleration response spectrum of near-fault ground motion under 0.05 damping ratio.

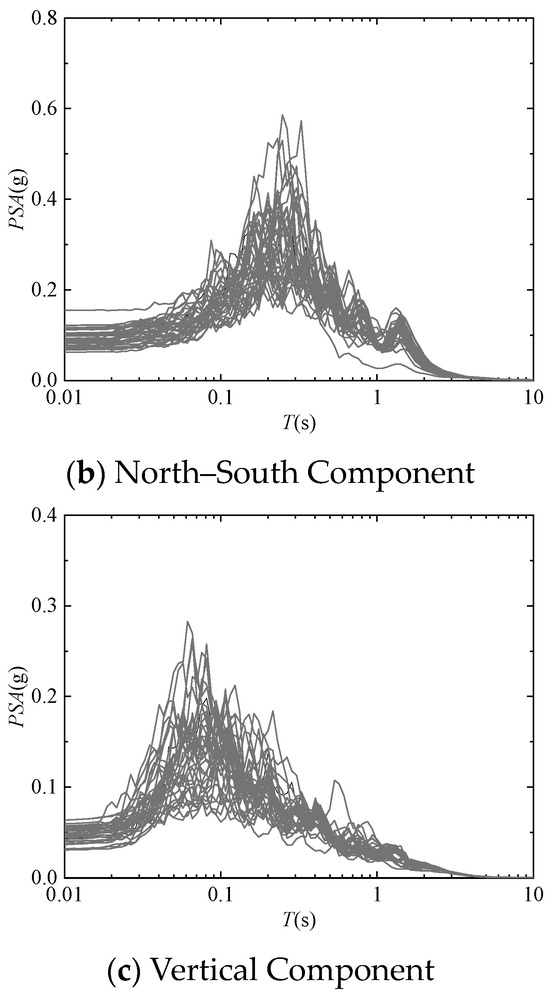
Figure 3.
Acceleration response spectrum of non-near-fault ground motion under 0.05 damping ratio.

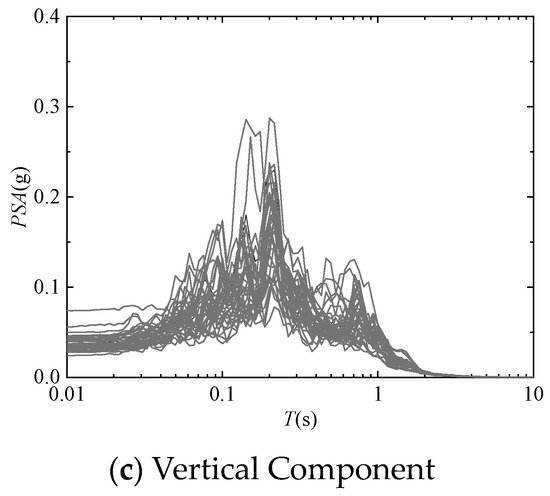
Figure 4.
Acceleration response spectrum of near-fault ground motion under 0.03 damping ratio.
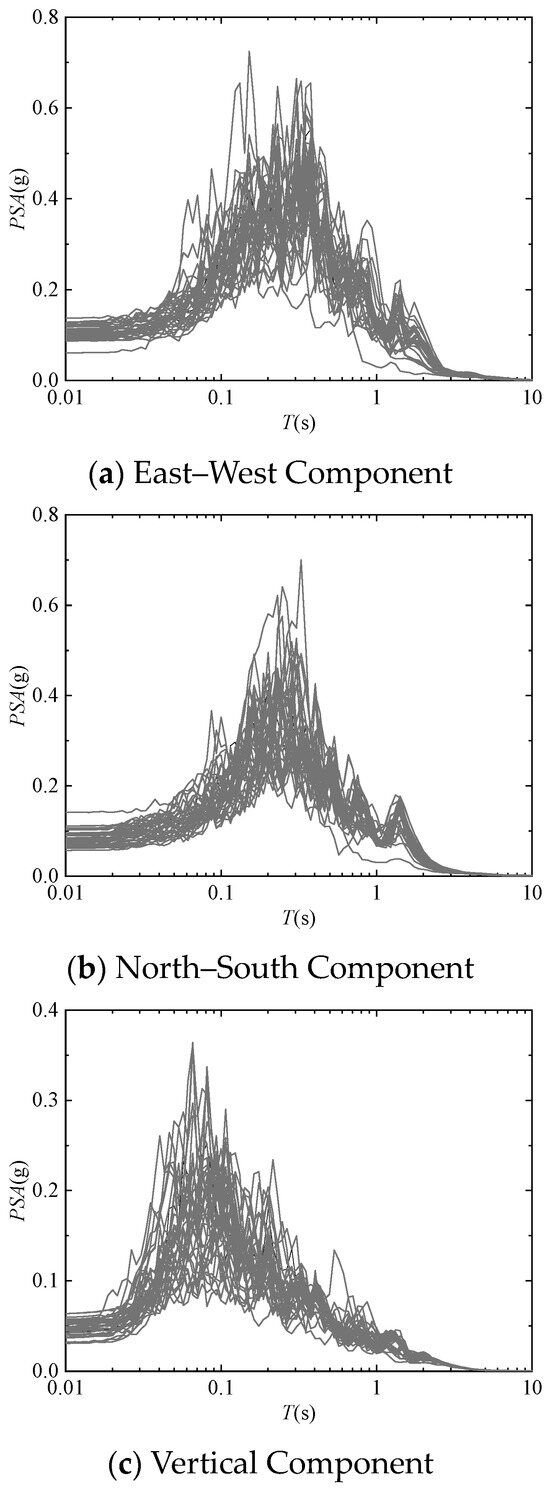
Figure 5.
Acceleration response spectrum of non-near-fault ground motion under 0.03 damping ratio.
Table 2.
Seismic sample response spectrum information.
In this context, Sa is taken as the average value of the seismic acceleration response spectra over the period range of 0.1 to 0.5 s. Additionally, the earthquake duration is computed as the period during which the amplitude of the seismic acceleration time history exceeds 10% of its maximum value.
Upon scrutinizing the provided response spectrum data, it becomes apparent that near-fault ground motions generate significantly higher peak acceleration responses compared to non-near-fault motions. This trend is particularly pronounced in the east–west direction, where the smaller angle between the velocity pulse and the directional axis results in a larger acceleration response spectrum component, averaging an increase of 18.61%. Furthermore, the periods corresponding to the peak acceleration responses of near-fault motions tend to be longer, often exceeding 0.5 s, due to the presence of high-energy velocity pulses. Regarding earthquake duration, there is little difference between near-fault and non-near-fault motions, both generally lasting longer than 15 s. This ensures an ample duration of high-amplitude time history to adequately excite structures.
In conclusion, both near-fault and non-near-fault ground motions possess considerable amplitudes and destructive potential. When considering the spatial variability captured by seismic arrays, it can be confidently stated that these represent the most adverse seismic conditions that large-span steel truss arch bridges are likely to encounter. Therefore, it is crucial to incorporate these extreme conditions into the design and analysis of such structures to ensure their safety and resilience against seismic hazards.
During the 1986 Hualien earthquake, three groups of ground motions were observed that did not exhibit clear near-fault ground motion characteristics. Upon examination of the velocity timescales for the three groups of ground motions (Figure 6, Figure 7 and Figure 8), it is evident that all three groups exhibited distinct velocity pulses. However, the energy of the primary pulses is not concentrated enough to meet the identification criterion for near-fault ground motions due to the presence of numerous velocity pulses in the timescales. For these three groups of ground motions, if they are classified as non-near-fault ground motions, there may be a significant increase in the structural damage due to multiple velocity pulses. If they are classified as near-fault ground motions, there is a possibility that the structural response will be small due to the insufficient concentration of the velocity pulse energy. Therefore, ground motions 3648, 3659, and 3661 were omitted from this study.
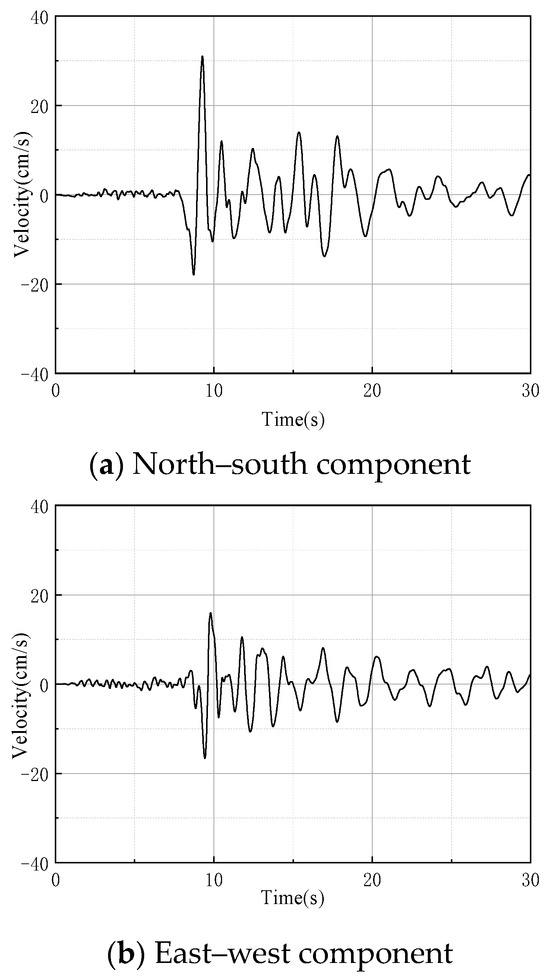
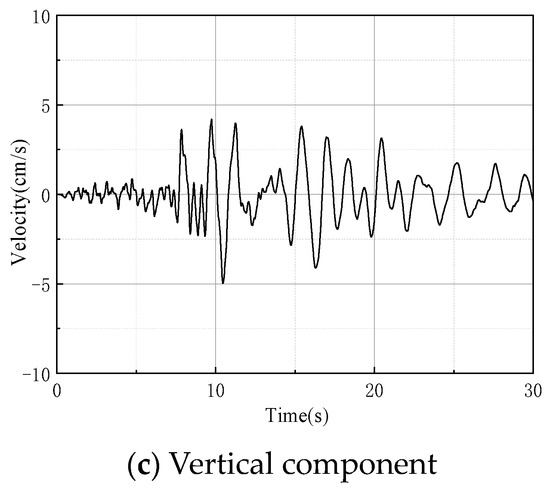
Figure 6.
The velocity time history of the 3648 earthquake.
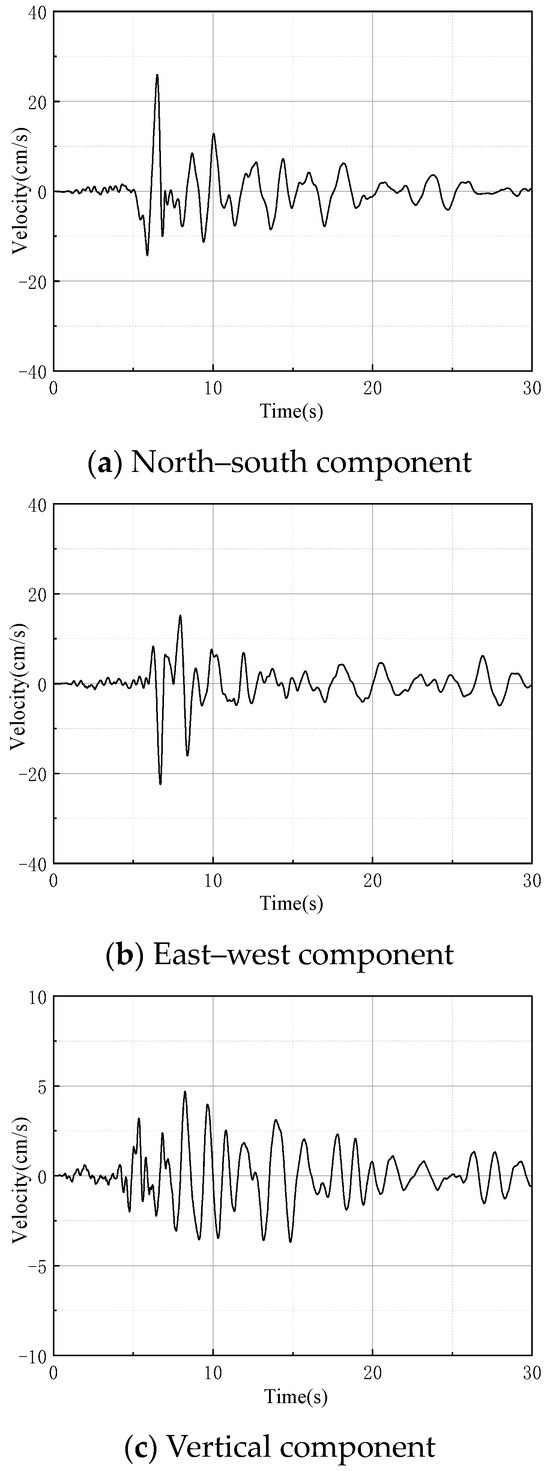
Figure 7.
The velocity time history of the 3659 earthquake.
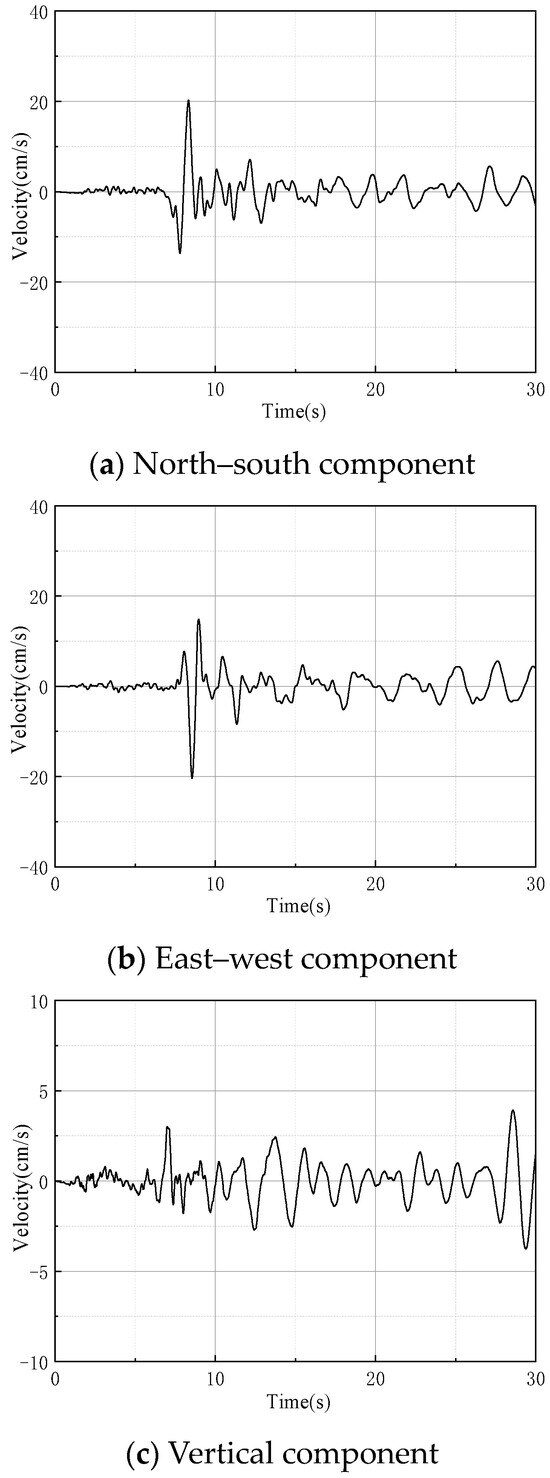
Figure 8.
The velocity time history of the 3661 earthquake.
3. Bridge Design and Finite Element Model
The inner circle radius of the SMART array is 200 m. Therefore, in this case, the span of the bridge should be as close to 200 m as possible to minimize the error caused by the difference between the bridge span and the spacing between measuring points when conducting nonuniform excitations. A half-through steel truss arch bridge with a main span of 228 m was chosen for this study. The bridge span is arranged as 75 + 228 + 228 + 75 m, and the width of the bridge is 39 m. The main structure’s shape is shown in Figure 9. The bridge’s main arch rib is of the catenary type with an arch axis coefficient of 1.55 and a rise span ratio of 1/4.5. The arch rib is composed of a steel truss with a chord diameter of 90 cm with a thickness of 2 cm and a web diameter of 36 cm with a thickness of 1.2 cm. The entire bridge is equipped with six lateral braces, of which four are K-shaped and two are I-shaped. The lateral braces are made of steel pipes with a diameter of 50 cm and a thickness of 2 cm. The web member has a diameter of 1.2 cm and is made of Q345 steel. The hangers consist of 109 pieces of 7 mm diameter 1670 MPa high-strength steel strands. The cross-beam is made of a C50 concrete multi-chamber hollow box girder with a height of 3 m. The bridge deck is a T-shaped structure with a height of 50 cm and paved with 15 cm thick asphaltic concrete. The foundation of the bridge was constructed using C40 concrete, with the following dimensions: 4.5 m in height, 14.2 m in width, and 55.6 m in length. The bridge is situated over a Class I canal and is designed to withstand Class I motorway loads. Because of its crucial role in the traffic network, the bridge is fortified to withstand an intensity of 7 degrees (0.15 g) and has a characteristic period of 0.45 s. The site is classified as Class II.
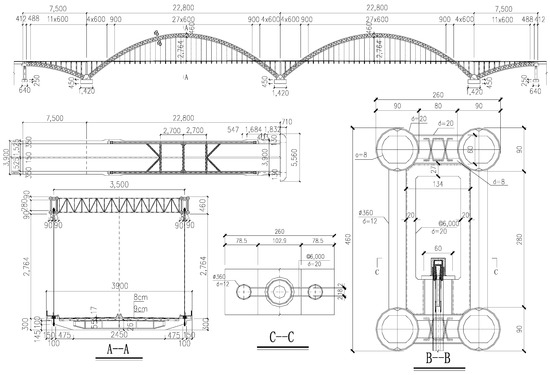
Figure 9.
Bridge design drawings.
The constitutive relation is the foundation for finite element analysis, and its selection directly affects the accuracy of the calculations, especially for seismic time-history analysis. Given the extensive finite element analysis required for this thesis, the efficiency of the finite element calculations is paramount. Consequently, certain simplifications and assumptions were made in structuring the models for these calculations. Firstly, the processing errors in steel structures and the influence of initial stresses within the steel were neglected. Incorporating these factors would significantly diminish the computational efficiency of the finite element analysis, potentially even leading to non-convergence. Thus, their impact was disregarded to ensure efficient processing. Secondly, the uncertainties inherent in materials were ignored. During production and processing, materials like steel and concrete inherently possess a degree of variability, leading to uncertainties in their mechanical properties. This thesis overlooks such uncertainties to enhance the efficiency of the finite element calculations. Thirdly, simplifications were made to the boundary conditions and loading scenarios. In real-world engineering applications, constraints and loads can be exceedingly complex and subject to uncertainties. To maintain computational efficiency, these aspects were simplified. For instance, complex load distributions were reduced to either concentrated or uniformly distributed loads. In summary, these assumptions and simplifications collectively facilitate the efficient execution of finite element calculations. As the focus of this paper lies in contrasting the effects of near-fault pulses and spatial variability on long-span arch bridges, these assumptions and simplifications are deemed acceptable within the scope of the study.
Under strong earthquakes, structures may enter the plastic phase, and the reciprocating action of seismic forces can cause low-cycle fatigue in the members, making the choice of constitutive relation particularly important. Since this paper’s model requires a large number of seismic time-history analyses, to keep the computational load within an acceptable range, a linearly hardening model was chosen as the constitutive model for Q345 steel. The stress–strain relationship is shown in Equation (2).
In this equation, εs represents steel strain, fs represents steel stress, εy and εsu are the yield strain and fracture strain of the steel, respectively, and Es and Ey are the elastic modulus and post-yield elastic modulus, respectively. The elastic modulus before yield is taken as 206 GPa, the yield strength is taken as 345 MPa, the elastic modulus after yield is taken as 1% of the pre-yield modulus, and the ultimate tensile strain is conservatively taken as 0.01.
Concrete is a mixture composed of multiple materials. When stressed, complex interactions occur between its components, and its stress–strain relationship is also very complex. Although there are various models describing the constitutive relationship of concrete, most of them are too complex and involve too many parameters, making them unsuitable for extensive time-history analysis. In this paper, the widely used and simple Hognestad model is selected. This model has a parabolic rising segment and a linear falling segment.
This project uses C50 and C40 concrete, with peak stresses f0 of 50 MPa and 40 MPa, respectively. The peak strain ε0 for both is taken as 0.0014, and the maximum compressive strain εu is taken as 0.0033.
For the structural modeling in this work, the large finite element program ANSYS was used, as indicated in the design drawings. To simplify the model, which was necessary because of the large number of finite element calculations required, the beam element was used to simulate various components, including the upper and lower chords of the arch rib, web members, transverse connections, cross-braces, columns on the arch, suspender beams, and longitudinal beams of the bridge deck. The cable member simulated the hanger, and the slab member represented the deck (Table 3). The main arch foot constraint is articulated, limiting movement in three directions and rotation in the vertical direction. The side arches are sliding connections, limiting movement and vertical rotation in the vertical and cross-bridge directions. In seismic analysis, only the dead load effects on the bridge are considered, as the influence of live loads such as personnel and vehicles is minimal. For the sake of computational efficiency, the impact of live loads is neglected.
Table 3.
Detailed parameters of the element.
Table 3.
Detailed parameters of the element.
| Component | Type of Elements | Number of Elements | D (cm) | T (cm) | Schematic Diagram |
|---|---|---|---|---|---|
| Arch rib | BEAM189 | 2250 | 90 | 2 | 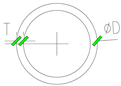 |
| Web member | BEAM189 | 1660 | 36 | 1.2 | |
| Arch transverse connection | BEAM189 | 830 | 60 | 2 | |
| Lateral braces | BEAM189 | 1696 | 50 | 2 | |
| Columns | BEAM189 | 80 | 230 | 115 | |
| Suspender | LINK180 | 112 | 3.70 | 1.85 | |
| Cross beam | BEAM189 | 1020 | / | / | Figure 10a |
| Longitudinal beam | BEAM189 | 941 | / | / | Figure 10b |
| Bridge deck | SHELL181 | 1212 | / | / | / |
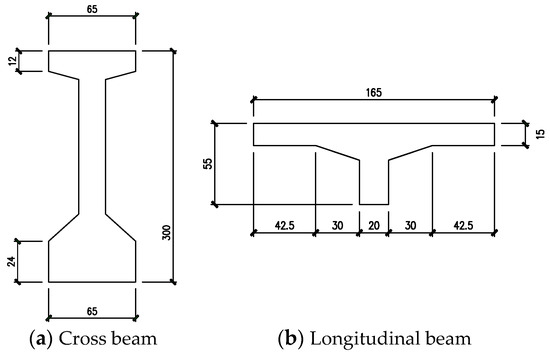
Figure 10.
Cross-section drawings.
Geometric nonlinearity caused by factors such as large strain, large deflection, and large rotation is considered in the model. In this paper, the LINK180, SHELL181, and BEAM189 elements are selected, all of which are capable of effectively simulating geometric nonlinearities such as large strains, large deflections, and large rotations. In this simulation, the sparse matrix solver was selected, and the direct integration method was employed. Furthermore, the large deformation option was enabled during the ANSYS solution process.
Figure 11 shows the overall model of the bridge. Table 4 displays the material parameters, and the modal damping ratio was set to 0.045. To analyze the dynamic performance of the bridge, we used the subspace iteration method in the finite element program to determine the first six modes of the bridge’s structure. These modes are presented in Table 5 and Figure 12.

Figure 11.
Finite element model of bridge.
Table 4.
Material parameter table.
Table 5.
Vibration modes of bridge.
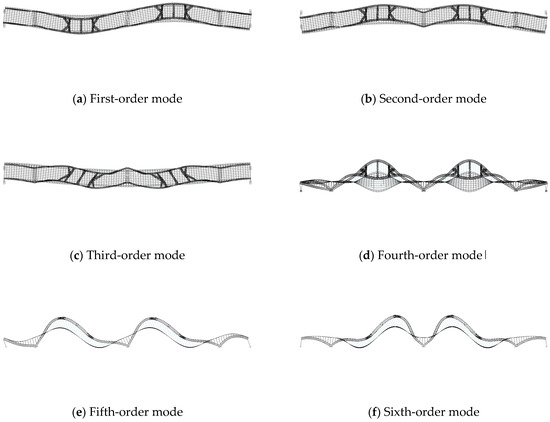
Figure 12.
Bridge natural vibration modes.
4. Bridge Response under Nonuniform Excitation Conditions
To reconstruct the seismic field, this study assumed that the bridge is located within the smart array. The seismic station was built on a harder geological formation and has a single site condition within the array. The recording instruments are all digital tape-recording strong seismometers, ensuring consistency in earthquake recordings within a small area. Since the array’s construction, numerous earthquakes have been recorded in the near-fault region, providing valuable data for studying near-fault ground motion in a small area. This project focused on the study of the near-fault effects and impacts of nonuniform effects on bridge structures. Therefore, the Baker method was employed to identify near-fault ground motions [40]. The Baker method stands as a classic and highly effective approach. Firstly, it is a well-established and widely acknowledged technique specifically designed to identify near-fault ground motions, particularly those characterized by high-energy velocity pulses. These pulses, which are emblematic of near-fault earthquakes, can exert a profound influence on the response of structures, notably bridges. By utilizing the Baker method, this study aims to precisely capture these velocity pulses and their consequential impacts within the analysis. Secondly, the Baker method capitalizes on the localized focusing properties of wavelet transforms, enabling it to efficiently discern high-energy velocity pulses within seismic records. This capability is paramount in near-fault regions, where ground motions are intricate and highly nonlinear in nature. By leveraging wavelet analysis, the method adeptly navigates the complexities of near-fault seismicity, ensuring accurate pulse identification [41].
Figure 13 illustrates that the east–west and north–south ground motion components were vector-converted to the transverse and longitudinal directions of the bridge, respectively, and then input into the structure. The vertical component of the earthquake was input in the z-direction of the bridge’s structure. The near-fault and non-near-fault ground motions were each excited 13 times, as listed in Table 6. Because station C00 is situated in the center of the array, its ground motion was always input into pier 3 at the center of the bridge. The left (no. 2) and right (no. 4) piers were alternately input according to their corresponding positions. It is important to note that piers 1 and 5 of the side arch are in close proximity to piers 2 and 4, so the influence of the nonuniform effect was not considered here. Therefore, the input ground motions for piers 2 and 4 were used, respectively. No data from station I09 in the PEER database were available, and the observation may be incomplete due to equipment issues. However, on the basis of the above description, 3648 (M08), 3659 (O10), and 3661 (O12) were omitted, and there was no corresponding stimulus in this section. Therefore, it was not possible to simulate the I04–C00–I09 group’s excitation. The bridge’s span is 228 m, which is close to the radius of the innermost station. Therefore, the most uniform excitation groups were 1–5 and 14–18, whereas groups 6–10 and 19–23 were excited by the stations in the middle circle. The radius of the central circle was 1000 m, which is much larger than the span of the bridge. This can be seen as an exaggeration of the nonuniform effect. Similarly, the outermost circle’s ground motions were used in groups 11–13 and 24–26, which was also an exaggeration of the nonuniform effect. Because of the length of this study, we only provide the seismic time-history response of the key locations of the first group, as shown in Figure 14, Figure 15, Figure 16, Figure 17, Figure 18 and Figure 19. Additionally, we list the maximum seismic responses of groups 1 and 14 in Table 7.
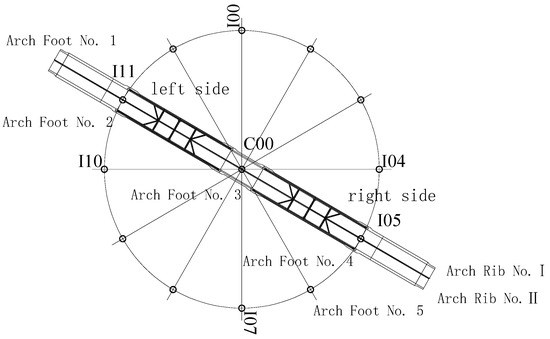
Figure 13.
Schematic diagram of the relative position between the measuring station and the bridge.
Table 6.
The excitation method of ground motion.
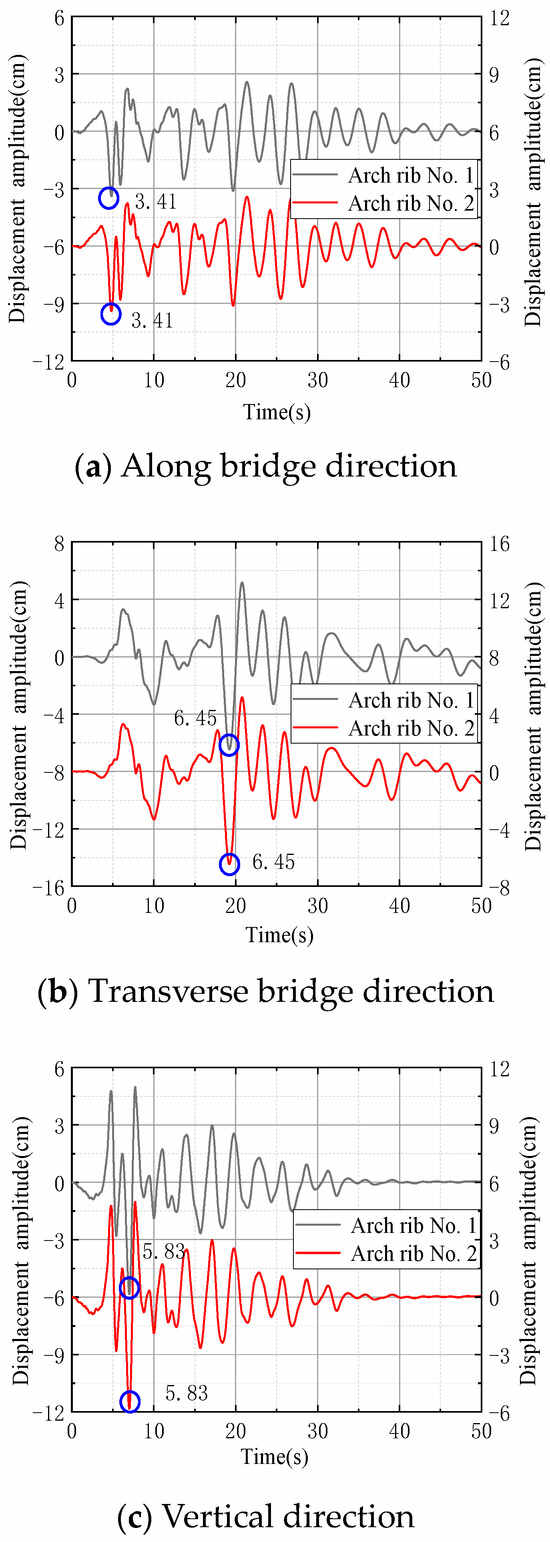
Figure 14.
Displacement of the left arch of the bridge under the action of the first group of ground motion.


Figure 15.
The displacement of the right arch of the bridge under the action of the first group of ground motion.
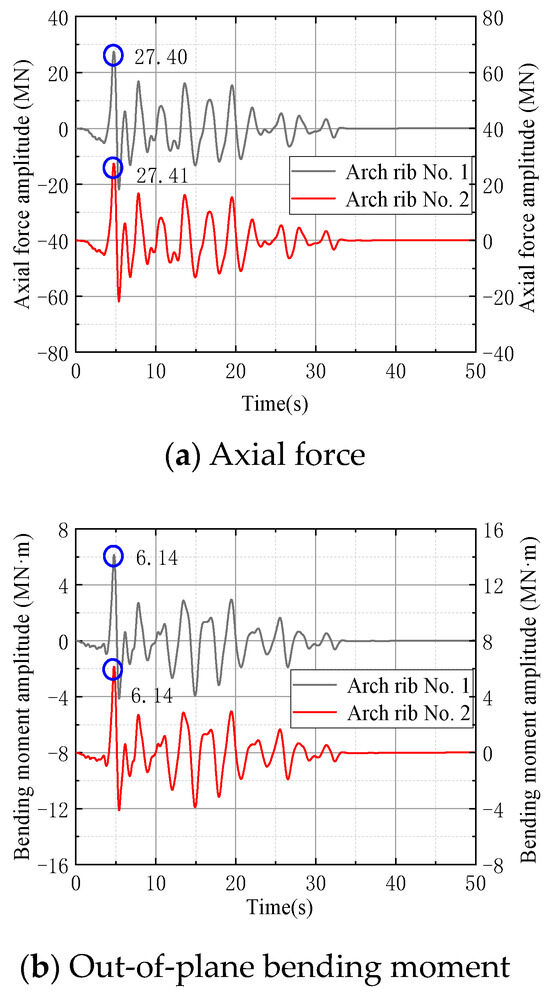
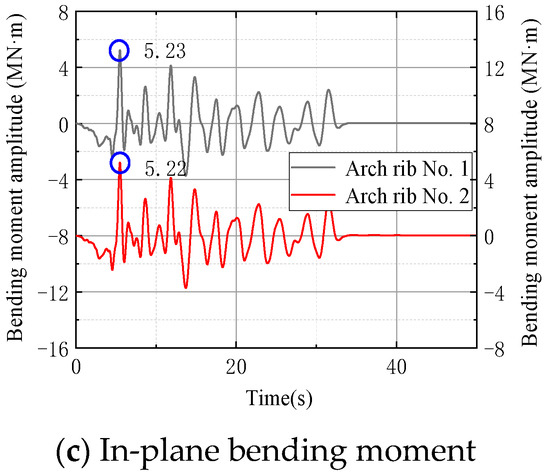
Figure 16.
Internal force at the arch foot of bridge No. 2 under the action of the first group of ground motion.

Figure 17.
Internal force at the left side of the arch foot of bridge No. 3 under the action of the first group of ground motion.
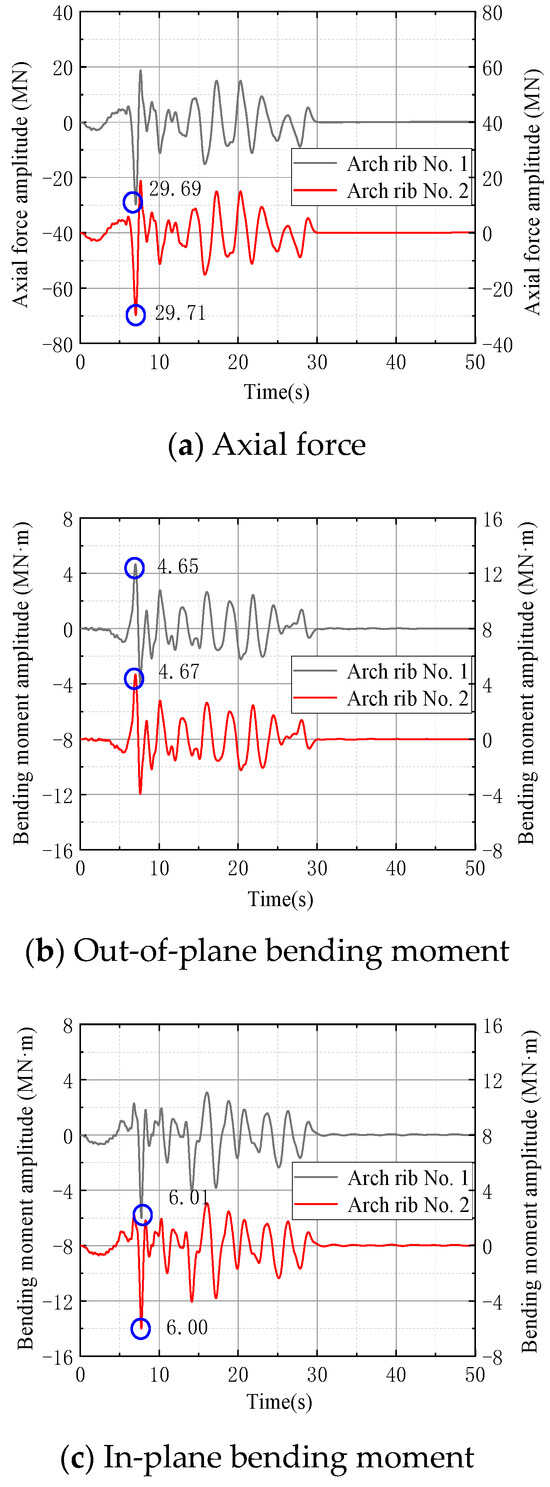
Figure 18.
Internal force at the right side of the arch foot of bridge No. 3 under the action of the first group of ground motion.

Figure 19.
Internal force at the arch foot of bridge No. 4 under the action of the first group of ground motion.
Table 7.
Seismic response of key displacement of bridges under the action of the first group of ground motion.
The seismic response analysis revealed that the primary disparity between the impact of near-fault and non-near-fault ground motions on bridges is in the vault. The vault displacement of near-fault ground motion is, on average, 19.39% higher than that of non-near-fault ground motion, and the displacement along the bridge direction is 31.42% higher than that of non-near-fault ground motion. Regarding internal forces, the in-plane bending moment of the arch crown increased by 56.02%, the out-of-plane bending moment increased by 36.44%, and the axial force increased by 14.69%. The foot of the arch is relatively small, resulting in a 2.18% increase in the in-plane bending moment, a 0.63% increase in the out-of-plane bending moment, and a 10.22% increase in the internal force. The seismic intensities of the two groups of ground motions were comparable. The first group had an average PGA of 0.1095 g, whereas the second group had an average PGA of 0.1050 g, resulting in a difference of only 4.11%. The primary cause of the difference in seismic responses was the velocity impulse in the near-fault ground motion, which significantly affected the transverse direction of the bridge. The bridge had less transverse stiffness, resulting in a greater seismic response when subjected to a velocity pulse in the transverse direction. The angle between the direction of the pulse and the direction along the bridge can be small, resulting in a significant increase in the displacement along the bridge and the in-plane bending moment of the arch crown. Upon analysis of the response time history of the first group of key positions, it is evident that the peak values of the internal force and displacement response of most positions of the bridge coincide highly in time with the pulse of the ground motion input. The pulse appeared at the 9th second, and most of the seismic responses of the arch foot and vault also reached their maximum or local maximum at this time. This suggests that the seismic response of the bridge under near-fault ground motion was significantly affected by the velocity pulse. In conclusion, the analysis reveals that the primary variation in the responses between the near-fault and non-near-fault ground motions for the bridge under nonuniform excitation occurred in the vault. This difference is primarily due to the velocity pulse present in the near-fault ground motion.
It is widely recognized that damping plays a crucial role in structural damage. Previous calculations were performed with the assumption of a damping ratio of 0.045, whereas the typical damping ratio for steel structures lies between 0.03 and 0.05. To gain further insights into the influence of damping, additional calculations were undertaken specifically for the first set of ground motions, assuming a damping ratio of 0.035. These results have been incorporated into Table 8 for a comprehensive analysis.
Table 8.
Seismic response of key displacement of bridges under the action of the first group of ground motion under 0.035 damping ratio.
Upon observation, it can be noted that altering the damping ratio does not have a particularly pronounced impact on the seismic response of the steel truss arch bridge discussed in this context. The seismic response at critical nodes exhibits differences within 6% compared to the previous conditions. On average, a damping ratio of 0.035 results in a more intense structural seismic response compared to a damping ratio of 0.045, with an average increase of 1.589% in displacement and 1.39% in internal forces.
It is possible that the increase in seismic damage due to the pulse effect and spatial variability overshadows the changes in structural damage caused by variations in damping ratio. In light of this, the subsequent seismic damage analysis in this paper continues to assume a structural damping ratio of 0.045.
Table 9 and Figure 20 show the seismic response peaks of key positions of the bridge under near-fault and non-near-fault ground motions. The purpose is to quantitatively analyze the difference in seismic responses between the two types of ground motion under nonuniform excitation.
Table 9.
Seismic responses of key nodes of the bridge under various earthquake excitations with non-uniform input.

Figure 20.
Comparison diagram of seismic responses of key nodes of the bridge under various earthquake excitations with non-uniform input.
The data in the table demonstrates that in the case of nonuniform excitation, the seismic response to near-fault ground motion significantly surpasses that of non-near-fault ground motion. Specifically, there is an increase of 11.76% in the maximum displacement response of the arch crown, 28.93% in the internal force, and 11.55% in the internal force of the arch foot. The analysis of the first group maintains its conclusion that the arch is the most impacted part due to near-fault ground motion.
Examining the differences among various groups reveals a distinct directionality in near-fault ground motions. When the near-fault velocity pulse aligns closely with the transverse direction of the bridge, the displacement response of the arch vault becomes more pronounced. Specifically, the measurement points in Groups 1 to 5 are relatively close to each other, and the destructiveness of the ground motions is largely consistent. The differences among these groups, calculated based on the average PGA, are within 5%. However, the displacement response of Group 2 is notably higher than the other groups, with a 12.72% increase in transverse bridge displacement and an 8.72% increase in longitudinal bridge displacement compared to the others. This significant response in Group 2 is attributed to the directional alignment, where the velocity pulse in the ground motion is almost perpendicular to the transverse direction of the bridge, forming an angle of only 13 degrees. Similarly, this phenomenon is observed in Groups 6 to 10, but the maximum displacement occurs in Group 6 due to a specific event (M02-C00-M08). The maximum displacement in this group is significantly higher than the average, with a 15.50% increase in transverse bridge displacement and a 9.42% increase in longitudinal bridge displacement compared to the other groups.
Further analysis of the seismic responses of various groups reveals that an increase in near-fault spatial effects can significantly increase structural damage to bridges. Observing the seismic responses of each group reveals significant variations in the bridge structure’s response when considering each circle of the seismic array as the seismic input. The inner ring exhibits the smallest seismic response, followed by the middle ring, and the outer ring displays the largest response. Notably, the main difference lies in the internal forces of the arch foot, while the displacement and internal force of the arch crown do not vary significantly. At the vault position, the inner ring group’s displacement is 2.42% and 3.74% lower than the middle and outer ring groups, respectively. Similarly, its internal force is 7.18% and 4.19% lower than the middle and outer ring groups. The seismic responses of the arch itself exhibit minimal variation, with an overall fluctuation of only 5%. However, the position of the arch foot is more crucial, with the middle ring group experiencing an average increase of 12.67% compared to the inner ring group, and the outer ring group showing a 6.84% increase over the middle ring group.
The measuring points in each circle of the integrated seismic array are positioned such that the distance between points in the inner circle is the shortest. The inner circle has a radius of 200 m, while the middle and outer circles have radii of 1000 m and 2000 m, respectively. The vibration states of points within the inner circle are relatively uniform, and the recorded earthquake’s inconsistency effect is less significant compared to the middle and outer circles. The seismic response highlights that the nonuniform effect of an earthquake primarily impacts the internal force response of the arch foot in steel truss arch bridges. Due to the ground motion differences caused by this nonuniform effect, the coordination of the arch ring becomes essential, leading to a certain concentration of stress at the arch foot.
5. Bridge Response under Uniform Excitation
To determine the increase in the seismic response caused by the nonuniform effect, the seismic response of the bridge under uniform excitation is analyzed in this section. The seismic response under nonuniform excitation in the previous section is then compared to determine the increase in the seismic response caused by the spatial variability of each group of ground motions. Table 10 and Figure 21 list the seismic responses at key locations based on the seismic samples and input angles presented in the previous section. The seismic input bridge model was used to obtain the bridge response without considering the nonuniform effect.
Table 10.
Seismic responses of key nodes of the bridge under various earthquake excitations with uniform input.

Figure 21.
Comparison diagram of seismic responses of key nodes of the bridge under various earthquake excitations with uniform input.
Observing the seismic response of key bridge positions under uniform excitation reveals a significant increase in the seismic response of the bridge structure under near-fault ground motion compared to far-field earthquakes. This increase is particularly notable in the displacement and internal force of the arch vault. Specifically, the arch vault’s displacement increases by an average of 13.95% under near-fault ground motion compared to far-field motion. Additionally, the internal force of the arch crown jumps by 36.13%, while the increase in the internal force of the arch foot is relatively small, at only 2.28%. This indicates that under uniform excitation conditions, the velocity pulse still has a significant effect on the arch top.
This heightened response can be attributed to the high-energy velocity pulses present in near-fault ground motions, which have the potential to excite higher-order vibration modes in structures, subsequently leading to increased displacements and internal forces. In the case of arch bridges, the arch vault, being a lightweight and flexible component, is particularly vulnerable to these velocity pulses. Furthermore, under the impact of these high-energy pulses, the arch vault may exhibit nonlinear behavior, contributing to additional increases in displacement and internal forces. Similar phenomena have been observed in seismic analyses conducted by Mohseni et al. [42] on ultra-long arch bridges spanning 400 m. Their findings indicate that compared to non-near-fault ground motions, typical near-fault velocity pulses can amplify the displacement response of the arch vault by over 30%. Additionally, Wan et al. [43], in their study on the seismic response of valley-spanning bridges subjected to near-fault acceleration pulse ground motions, discovered that acceleration pulse ground motions have a more pronounced impact on the seismic response of critical locations such as the arch vault within the bridge–ground system. Special attention should be paid to the acceleration pulse effects of ground motions, as bridge structures are more susceptible to damage under such conditions.
Upon comparing the bridge’s seismic response under uniform and nonuniform earthquake actions, a notable increase in the internal force of the arch foot is observed under nonuniform action, averaging 18.69% more than under uniform action. However, the displacement and internal force responses at the arch crown only slightly increase by 6.48% and 10.33%, respectively.
When comparing the structural responses under the combined effects of near-fault ground motion and spatial variability with those under only near-fault effects, significant differences are observed mainly at the arch foot, while the differences at the arch top are relatively small. Specifically, due to the pulse effect in both scenarios being influenced by near-fault ground motion, the difference in structural responses at the arch top is only 7.718%. However, without the influence of spatial variability, the response at the arch foot is 24.34% smaller than when affected by both near-fault effects and spatial variability simultaneously.
In summary, it can be found that both spatial variation effect and velocity pulse in near-fault ground motion have significant impacts on this type of arch bridge, and there may be a certain superposition effect between the two. Further analysis shows that the seismic response of the arch foot of this type of arch bridge is greatly affected by the spatial variation of the earthquake, while the arch top is greatly affected by the velocity pulse in the near-fault ground motion. As the main supporting structure, the arch foot needs to coordinate with the movement of the earth. As the primary supporting structure, the arch foot must coordinate with ground movements, and the relative displacement caused by the spatial variability of earthquakes generates excessive internal forces at the arch foot. In contrast, due to its lower stiffness, the arch crown is more prone to exciting higher-order vibration modes within the structure under the influence of pulses, resulting in significant displacements and internal force responses.
Given these reasons, when constructing arch bridges in near-fault regions, the impacts of near-fault velocity pulses and spatial variability effects must be thoroughly considered. To address spatial variability effects, it is crucial to ensure that the arch ribs possess sufficient deformation capacity to balance the relative displacements induced by spatial variability. Regarding velocity pulses, the arch ribs, particularly the arch crown section, must possess adequate stiffness, especially in the transverse direction of the bridge, to control the transverse displacement of the arch crown under the action of velocity pulses.
6. Conclusions
The velocity pulse of seismic motion in near-fault areas is remarkably pronounced and exhibits significant spatial variability, leading to an amplified seismic response in long-span bridges within these regions. Given this, it is imperative to accurately estimate the increased damage caused by near-fault effects and spatial variability. To this end, this paper utilizes seismic data collected by the SMART array from both near-fault and non-near-fault locations. Taking a 228 m long steel truss arch bridge as a case study, and based on the distance between measurement points, a large-scale finite element program is employed to conduct seismic time-history analysis. The focus is on examining the impact of near-fault effects and spatial variability on critical components such as the arch crown and arch foot.
The findings reveal that both near-fault ground motion and spatial variability significantly impact bridge seismic responses. Under nonuniform excitation, the average maximum displacement response of the vault increased by 11.76% for the near-fault ground motion group compared to the far-field seismic group. Furthermore, there was an average increase of 28.93% in internal forces, with the internal force at the arch foot rising by 11%. When comparing nonuniform to uniform seismic action, the internal force at the bridge’s arch foot escalated significantly, averaging an 18.69% increase. The displacement and internal force responses at the arch crown witnessed smaller hikes of 6.48% and 10.33%, respectively.
The increased seismic damage caused by near-fault effects and spatial variability effects manifests differently in various parts of an arch bridge. Upon observing the specific impulse effects and spatial variability, it becomes evident that the arch foot of this bridge type is more susceptible to spatial variability in near-fault ground motion, while the vault is more influenced by the high-energy velocity impulse. Near-fault seismic ground motion possesses evident directionality. When the near-fault velocity pulse aligns closely with the bridge’s transverse axis, the displacement response at the arch crown becomes significantly pronounced.
Research on the seismic damage of long-span steel truss arch bridges caused by spatially variable ground motions in near-fault regions can be applied in several ways: (1) Seismic design optimization: This guides the seismic design of long-span bridges in near-fault regions, especially focusing on reinforcement measures for arch tops and arch feet. (2) Risk assessment and management: This provides a scientific basis for seismic risk assessment of bridges in near-fault regions, aiding in the formulation of effective risk management strategies and emergency response plans. (3) Suggestions for code revision: Based on the research findings, recommendations can be made to relevant authorities for revising seismic design codes to better reflect the characteristics of near-fault ground motions and their impact on bridge structures.
Despite reaching a series of important conclusions, this study still has certain limitations, primarily due to the relatively small sample size of ground motion data used and the insufficient intensity of near-fault effects and spatial variation effects. To address these issues, future research can incorporate data from more high-precision seismic arrays in near-fault regions and analyze near-fault ground motions with more pronounced spatial variability. Additionally, the structural samples involved can be further expanded by utilizing more structural cases for seismic analysis, thereby deriving more generalizable conclusions.
Author Contributions
Conceptualization, Z.L.; methodology, Z.L.; software, Z.L.; validation, X.M.; formal analysis, J.L.; data curation, Z.L.; writing—original draft preparation, Z.L.; writing—review and editing, Z.L. and X.M.; supervision, Z.L.; project administration, Z.L.; funding acquisition, Z.L. All authors have read and agreed to the published version of the manuscript.
Funding
This research was funded by National Natural Science Foundation of China (NSFC) grant number 52208461 and Experimental study and seismic design theory of prefabricated urban pipeline corridor projects under the action of near-fault strong earthquakes grant number 011009.
Data Availability Statement
Data is contained within the article.
Conflicts of Interest
The authors declare no conflict of interest.
References
- Chen, X.; Wang, D. Multi-pulse characteristics of near-fault ground motions. Soil Dyn. Earthq. Eng. 2020, 137, 106275. [Google Scholar] [CrossRef]
- Zheng, S.; Shi, X.; Jia, H.; Zhao, C.-H.; Qu, H.-L.; Shi, X.-L. Seismic response analysis of long-span and asymmetrical suspension bridges subjected to near-fault ground motion. Eng. Fail. Anal. 2020, 115, 104615. [Google Scholar] [CrossRef]
- Jin, S.; Wang, D.; Jiang, D. Seismic fragility analysis of containment structure subjected to near fault ground motions. Prog. Nucl. Energy 2023, 161, 104734. [Google Scholar] [CrossRef]
- Jia, H.; Wu, W.; Xu, L.; Zhou, Y.; Zheng, S.; Zhao, C. Numerical simulation and damaged analysis of a simply-supported beam bridge crossing potential active fault. Eng. Struct. 2024, 301, 117283. [Google Scholar] [CrossRef]
- Yang, S.; Mavroeidis, G.P.; Ucak, A. Analysis of bridge structures crossing strike-slip fault rupture zones: A simple method for generating across-fault seismic ground motions. Earthq. Eng. Struct. Dyn. 2020, 49, 1281–1307. [Google Scholar] [CrossRef]
- Zhang, F.; Li, S.; Wang, J.; Zhang, J. Effects of fault rupture on seismic responses of fault-crossing simply-supported highway bridges. Eng. Struct. 2020, 206, 110104. [Google Scholar] [CrossRef]
- Liu, Z.; Li, X.; Zhang, Z. Quantitative identification of near-fault ground motions based on ensemble empirical mode decomposition. KSCE J. Civ. Eng. 2020, 24, 922–930. [Google Scholar] [CrossRef]
- Nguyen, V.B.; Huh, J.; Meisuh, B.K.; Kim, J.; Park, I.-J. Seismic response of container crane under near-field and far-field ground motions. Appl. Sci. 2021, 11, 1740. [Google Scholar] [CrossRef]
- Shafieezadeh, A.; Ramanathan, K.; Padgett, J.E.; DesRoches, R. Fractional order intensity measures for probabilistic seismic demand modeling applied to highway bridges. Earthq. Eng. Struct. Dyn. 2012, 41, 391–409. [Google Scholar] [CrossRef]
- Zelaschi, C.; Monteiro, R.; Pinho, R. Critical assessment of intensity measures for seismic response of Italian RC bridge portfolios. J. Earthq. Eng. 2019, 23, 980–1000. [Google Scholar] [CrossRef]
- Forcellini, D. Seismic resilience of bridges isolated with traditional and geotechnical seismic isolation (GSI). Bull. Earthq. Eng. 2023, 21, 3521–3535. [Google Scholar] [CrossRef]
- Yang, S.; Mavroeidis, G.P. Bridges crossing fault rupture zones: A review. Soil Dyn. Earthq. Eng. 2018, 113, 545–571. [Google Scholar] [CrossRef]
- Lin, Y.; Zong, Z.; Lin, J.; Li, Y.; Chen, Y. Across-fault ground motions and their effects on some bridges in the 1999 Chi-Chi earthquake. Adv. Bridg. Eng. 2021, 2, 8. [Google Scholar] [CrossRef]
- Dong, Z.; Sun, Z.; Wu, S.; Tong, F.; Wang, D. Influence of soil liquefaction effect on seismic failure mechanism of river-crossing simply-supported girder bridges subjected to near-fault ground motions. Engi. Fail. Anal. 2023, 154, 107664. [Google Scholar] [CrossRef]
- Luo, Q.; Dai, F.; Liu, Y.; Chen, X. Simulating the near-field pulse-like ground motions of the Imperial Valley, California, earthquake. Soil Dyn. Earthq. Eng. 2020, 138, 106347. [Google Scholar] [CrossRef]
- Tochaei, E.N.; Taylor, T.; Ansari, F. Effects of near-field ground motions and soil-structure interaction on dynamic response of a cable-stayed bridge. Soil Dyn. Earthq. Eng. 2020, 133, 106115. [Google Scholar] [CrossRef]
- Yi, J.; Zhou, J.; Ye, X. Seismic control of cable-stayed bridge using negative stiffness device and fluid viscous damper under near-field ground motions. J. Earthq. Eng. 2022, 26, 2642–2659. [Google Scholar] [CrossRef]
- Baig, M.A.; Islam, N.; Ansari, I.; Umair, M. Vulnerability assessment of steel box-girder bridge under near-field and far-field earthquakes. Innov. Infrastruct. Solut. 2023, 8, 19. [Google Scholar] [CrossRef]
- İlker, K.; Hakkı, İ.B.; Muhammed, G. Near-fault ground motion characteristics and its effects on a collapsed reinforced concrete structure in Hatay during the February 6, 2023 Mw7.8 Kahramanmaraş earthquake. Eng. Struct. 2024, 298, 117067. [Google Scholar] [CrossRef]
- Liu, Z.; Zhang, S. Influence of strong spatially varying near fault ground motion on steel box arch bridge. Bull. Earthq. Eng. 2021, 19, 5439–5469. [Google Scholar] [CrossRef]
- Somerville, P.G. Characterizing near fault ground motion for the design and evaluation of bridges. In Proceedings of the 3rd National Seismic Conference and Workshop on Bridges and Highways, Portland, OR, USA, 28 April–1 May 2002; Volume 28, pp. 137–148. [Google Scholar]
- Zhang, F.; Li, S.; Zhao, T.; Wang, J. Seismic cable restrainer design method to control the large-displacement response for multi-span simply supported bridges crossing fault rupture zones. Soil Dyn. Earthq. Eng. 2021, 149, 106881. [Google Scholar] [CrossRef]
- Lin, Y.; Zong, Z.; Bi, K.; Hao, H.; Lin, J.; Chen, Y. Numerical study of the seismic performance and damage mitigation of steel–concrete composite rigid-frame bridge subjected to across-fault ground motions. Bull. Earthq. Eng. 2020, 18, 6687–6714. [Google Scholar] [CrossRef]
- Lin, Y.; Zong, Z.; Bi, K.; Hao, H.; Lin, J.; Chen, Y. Experimental and numerical studies of the seismic behavior of a steel-concrete composite rigid-frame bridge subjected to the surface rupture at a thrust fault. Eng. Struct. 2020, 205, 110105. [Google Scholar] [CrossRef]
- Kawashima, K. Damage of bridges resulting from fault rupture in the 1999 Kocaeli and Duzce, Turkey earthquakes and the 1999 Chi-Chi, Taiwan earthquake. Struct. Eng. Earthq. Eng. 2002, 19, 179s–197s. [Google Scholar] [CrossRef]
- Zhong, J.; Jiang, L.; Pang, Y.; Yuan, W. Near-fault seismic risk assessment of simply supported bridges. Earthq. Spectra 2020, 36, 1645–1669. [Google Scholar] [CrossRef]
- Saiidi, M.S.; Vosooghi, A.; Choi, H.; Somerville, P. Shake table studies and analysis of a two-span RC bridge model subjected to a fault rupture. J. Br. Eng. 2014, 19, A4014003. [Google Scholar] [CrossRef]
- Xiang, N.; Yang, H.; Li, J. Performance of an isolated simply supported bridge crossing fault rupture: Shake table test. Earthq. Struct. 2019, 16, 665–677. [Google Scholar] [CrossRef]
- Lin, Y.; Lin, J.; Chen, Y.; Zong, Z.; Tang, G.; He, X. A new hybrid input strategy to reproduce across-fault ground motions on multi-shaking tables. J. Test. Eval. 2021, 49, 691–712. [Google Scholar] [CrossRef]
- Lin, Y.; Bi, K.; Zong, Z.; Hao, H.; Lin, J.; Chen, Y. Seismic performance of steel-concrete composite rigid-frame bridge: Shake table test and numerical simulation. J. Br. Eng. 2020, 25, 04020032. [Google Scholar] [CrossRef]
- He, X.; Xu, C.; Xu, X.; Yang, Y. Advances on the avoidance zone and buffer zone of active faults. Nat. Hazard. Res. 2022, 2, 62–74. [Google Scholar] [CrossRef]
- Goel, R.K.; Chopra, A.K. Analysis of ordinary bridges crossing fault-rupture zones. In Proceedings of the 14th World Conference on Earthquake Engineering, Rep. No. UCB/EERC-2008, Beijing, China, 12–17 October 2008; Volume 1. [Google Scholar]
- Parcharidis, I.; Foumelis, M.; Kourkouli, P.; Wegmuller, U. Persistent Scatterers InSAR to detect ground deformation over Rio-Antirio area (Western Greece) for the period 1992–2000. J. Appl. Geophys. 2009, 68, 348–355. [Google Scholar] [CrossRef]
- Wu, J.; Xia, Y.; Sun, P.; Yu, D.; Sun, L. Puqian Bridge: A Long-Span Cable-Stayed Bridge in a Meizoseismal Area. Struct. Eng. Int. 2023, 33, 64–67. [Google Scholar] [CrossRef]
- Xiao, F.; Hulsey, J.L.; Chen, G.S.; Xiang, Y. Optimal static strain sensor placement for truss bridges. Int. J. Distrib. Sens. Netw. 2017, 13, 1550147717707929. [Google Scholar] [CrossRef]
- Xiao, F.; Hulsey, J.L.; Balasubramanian, R. Fiber optic health monitoring and tempera-ture behavior of bridge in cold region. Struct. Control Health Monit. 2017, 24, e2020. [Google Scholar] [CrossRef]
- Xiao, F.; Sun, H.; Mao, Y.; Chen, G.S. Damage identification of large-scale space truss structures based on stiffness separation method. Structures 2023, 53, 109–118. [Google Scholar] [CrossRef]
- Scala, A.; Festa, G.; Del Gaudio, S. Relation between near-fault ground motion impulsive signals and source parameters. J. Geophys. Res. Solid Earth 2018, 123, 7707–7721. [Google Scholar] [CrossRef]
- Zengin, E.; Abrahamson, N.A. A procedure for matching the near-fault ground motions based on spectral accelerations and instantaneous power. Earthq. Spectra 2021, 37, 2545–2561. [Google Scholar] [CrossRef]
- Shahi, S.K.; Baker, J.W. An efficient algorithm to identify strong-velocity pulses in multicomponent ground motions. Bull. Seismol. Soc. Am. 2014, 104, 2456–2466. [Google Scholar] [CrossRef]
- Shahi, S.K. A Probabilistic Framework to Include the Effects of Near-Fault Directivity in Seismic Hazard Assessment; Stanford University: Stanford, CA, USA, 2013. [Google Scholar]
- Mohseni, I.; Lashkariani, H.A.; Kang, J.; Kang, T.H.-K. Dynamic response evaluation of long-span reinforced arch bridges subjected to near-and far-field ground motions. Appl. Sci. 2018, 8, 1243. [Google Scholar] [CrossRef]
- Wan, H.-P.; Su, L.; Frangopol, D.M.; Chang, Z.; Ren, W.-X.; Ling, X. Seismic response of a bridge crossing a canyon to near-fault acceleration-pulse ground motions. J. Br. Eng. 2021, 26, 05021006. [Google Scholar] [CrossRef]
Disclaimer/Publisher’s Note: The statements, opinions and data contained in all publications are solely those of the individual author(s) and contributor(s) and not of MDPI and/or the editor(s). MDPI and/or the editor(s) disclaim responsibility for any injury to people or property resulting from any ideas, methods, instructions or products referred to in the content. |
© 2024 by the authors. Licensee MDPI, Basel, Switzerland. This article is an open access article distributed under the terms and conditions of the Creative Commons Attribution (CC BY) license (https://creativecommons.org/licenses/by/4.0/).